
#altcoins
altcoins
273.2M views
1.1M Discussing
Hot
Latest

·
--
#ETH
📊 ETHEREUM 📈📉🤔
Is ETH Getting Ready for a Comeback?
Ethereum has been under serious pressure lately, and honestly, the market isn't looking very comfortable for ETH holders right now.
But here's something interesting: ETH is trading around an important historical support zone between $1,500 and $1,800.
So, are we getting close to a potential recovery, or is there still more downside ahead?
Here's what I'm watching:
🔹 $1,700 – An important short-term support area. If buyers manage to defend it, we could see a relief bounce.
🔹 $1,830 – The first resistance level I'm watching. Breaking above it could give bulls some confidence.
🔹 $1,900 – A bigger level to reclaim. A strong move above this area could be an early sign that momentum is changing.
My personal take:
I'm not counting Ethereum out just because the market is struggling.
ETH still has a strong ecosystem, and I'm more interested in seeing how buyers react around these support levels than trying to predict the exact bottom.
Of course, a support zone doesn't guarantee a reversal. We need confirmation.
Sometimes the best move is simply to wait and let the market show its direction.
What's your opinion? Is ETH preparing for a comeback, or are we going lower before the next bull run? 👀
#Ethereum #ETH #CryptoMarket #BinanceSquare #Altcoins
#Write2Earrn
#ETH
📊 ETHEREUM 📈📉🤔
Is ETH Getting Ready for a Comeback?
Ethereum has been under serious pressure lately, and honestly, the market isn't looking very comfortable for ETH holders right now.
But here's something interesting: ETH is trading around an important historical support zone between $1,500 and $1,800.
So, are we getting close to a potential recovery, or is there still more downside ahead?
Here's what I'm watching:
🔹 $1,700 – An important short-term support area. If buyers manage to defend it, we could see a relief bounce.
🔹 $1,830 – The first resistance level I'm watching. Breaking above it could give bulls some confidence.
🔹 $1,900 – A bigger level to reclaim. A strong move above this area could be an early sign that momentum is changing.
My personal take:
I'm not counting Ethereum out just because the market is struggling.
ETH still has a strong ecosystem, and I'm more interested in seeing how buyers react around these support levels than trying to predict the exact bottom.
Of course, a support zone doesn't guarantee a reversal. We need confirmation.
Sometimes the best move is simply to wait and let the market show its direction.
What's your opinion? Is ETH preparing for a comeback, or are we going lower before the next bull run? 👀
#Ethereum #ETH #CryptoMarket #BinanceSquare #Altcoins
#Write2Earrn
📊 ETHEREUM 📈📉🤔
Is ETH Getting Ready for a Comeback?
Ethereum has been under serious pressure lately, and honestly, the market isn't looking very comfortable for ETH holders right now.
But here's something interesting: ETH is trading around an important historical support zone between $1,500 and $1,800.
So, are we getting close to a potential recovery, or is there still more downside ahead?
Here's what I'm watching:
🔹 $1,700 – An important short-term support area. If buyers manage to defend it, we could see a relief bounce.
🔹 $1,830 – The first resistance level I'm watching. Breaking above it could give bulls some confidence.
🔹 $1,900 – A bigger level to reclaim. A strong move above this area could be an early sign that momentum is changing.
My personal take:
I'm not counting Ethereum out just because the market is struggling.
ETH still has a strong ecosystem, and I'm more interested in seeing how buyers react around these support levels than trying to predict the exact bottom.
Of course, a support zone doesn't guarantee a reversal. We need confirmation.
Sometimes the best move is simply to wait and let the market show its direction.
What's your opinion? Is ETH preparing for a comeback, or are we going lower before the next bull run? 👀
#Ethereum #ETH #CryptoMarket #BinanceSquare #Altcoins
#Write2Earrn

1
1
753

ICP JUST HIT A NEW ALL-TIME LOW!
$ICP touched $1.87 this morning.
The whole network is now worth about $1 BILLION.
This is the same week weekly DEX volume on ICP jumped 109%.
The builders are busy. The chart is brutal!
#altcoins
ICP JUST HIT A NEW ALL-TIME LOW!
$ICP touched $1.87 this morning.
The whole network is now worth about $1 BILLION.
This is the same week weekly DEX volume on ICP jumped 109%.
The builders are busy. The chart is brutal!
#altcoins
$ICP touched $1.87 this morning.
The whole network is now worth about $1 BILLION.
This is the same week weekly DEX volume on ICP jumped 109%.
The builders are busy. The chart is brutal!
#altcoins

ỉa ko chùi đít mà dùng xịt:
Tý nó kéo lên X1000 lần rồi đốt bớt tổng cung xuống còn 1-2 triệu token lại bú tý kkkkk 😭
3
9
4.8k

·
--
Some altcoins could have an interesting recovery ahead.
My price targets:
$AVAX — $10–14
$UNI — $7–10
$SUI — $1.00–1.40
$HBAR — $0.075–0.10
A strong market recovery could change the picture.
Which coin has the strongest potential?
#altcoins #cryptouniverseofficial
Some altcoins could have an interesting recovery ahead.
My price targets:
$AVAX — $10–14
$UNI — $7–10
$SUI — $1.00–1.40
$HBAR — $0.075–0.10
A strong market recovery could change the picture.
Which coin has the strongest potential?
#altcoins #cryptouniverseofficial
My price targets:
$AVAX — $10–14
$UNI — $7–10
$SUI — $1.00–1.40
$HBAR — $0.075–0.10
A strong market recovery could change the picture.
Which coin has the strongest potential?
#altcoins #cryptouniverseofficial

1
2.4k

·
--
🚨 $LUNC BIG MOVE SOON? 👀🔥
Terra Classic is still standing despite the massive challenges it has faced. The community remains active, burns continue, and many holders are still waiting for the next big breakout. 🚀
📉 Low prices
🔥 Ongoing burns
💪 Strong community
👀 Potential for a surprise move if market momentum returns
Could this quiet period be the calm before a big move?
$LUNC holders, are you still holding? 🌙
#LUNC #TerraClassic #Crypto #Altcoins
{spot}(LUNCUSDT)
🚨 $LUNC BIG MOVE SOON? 👀🔥
Terra Classic is still standing despite the massive challenges it has faced. The community remains active, burns continue, and many holders are still waiting for the next big breakout. 🚀
📉 Low prices
🔥 Ongoing burns
💪 Strong community
👀 Potential for a surprise move if market momentum returns
Could this quiet period be the calm before a big move?
$LUNC holders, are you still holding? 🌙
#LUNC #TerraClassic #Crypto #Altcoins
Terra Classic is still standing despite the massive challenges it has faced. The community remains active, burns continue, and many holders are still waiting for the next big breakout. 🚀
📉 Low prices
🔥 Ongoing burns
💪 Strong community
👀 Potential for a surprise move if market momentum returns
Could this quiet period be the calm before a big move?
$LUNC holders, are you still holding? 🌙
#LUNC #TerraClassic #Crypto #Altcoins

4
886

·
--
Bullish
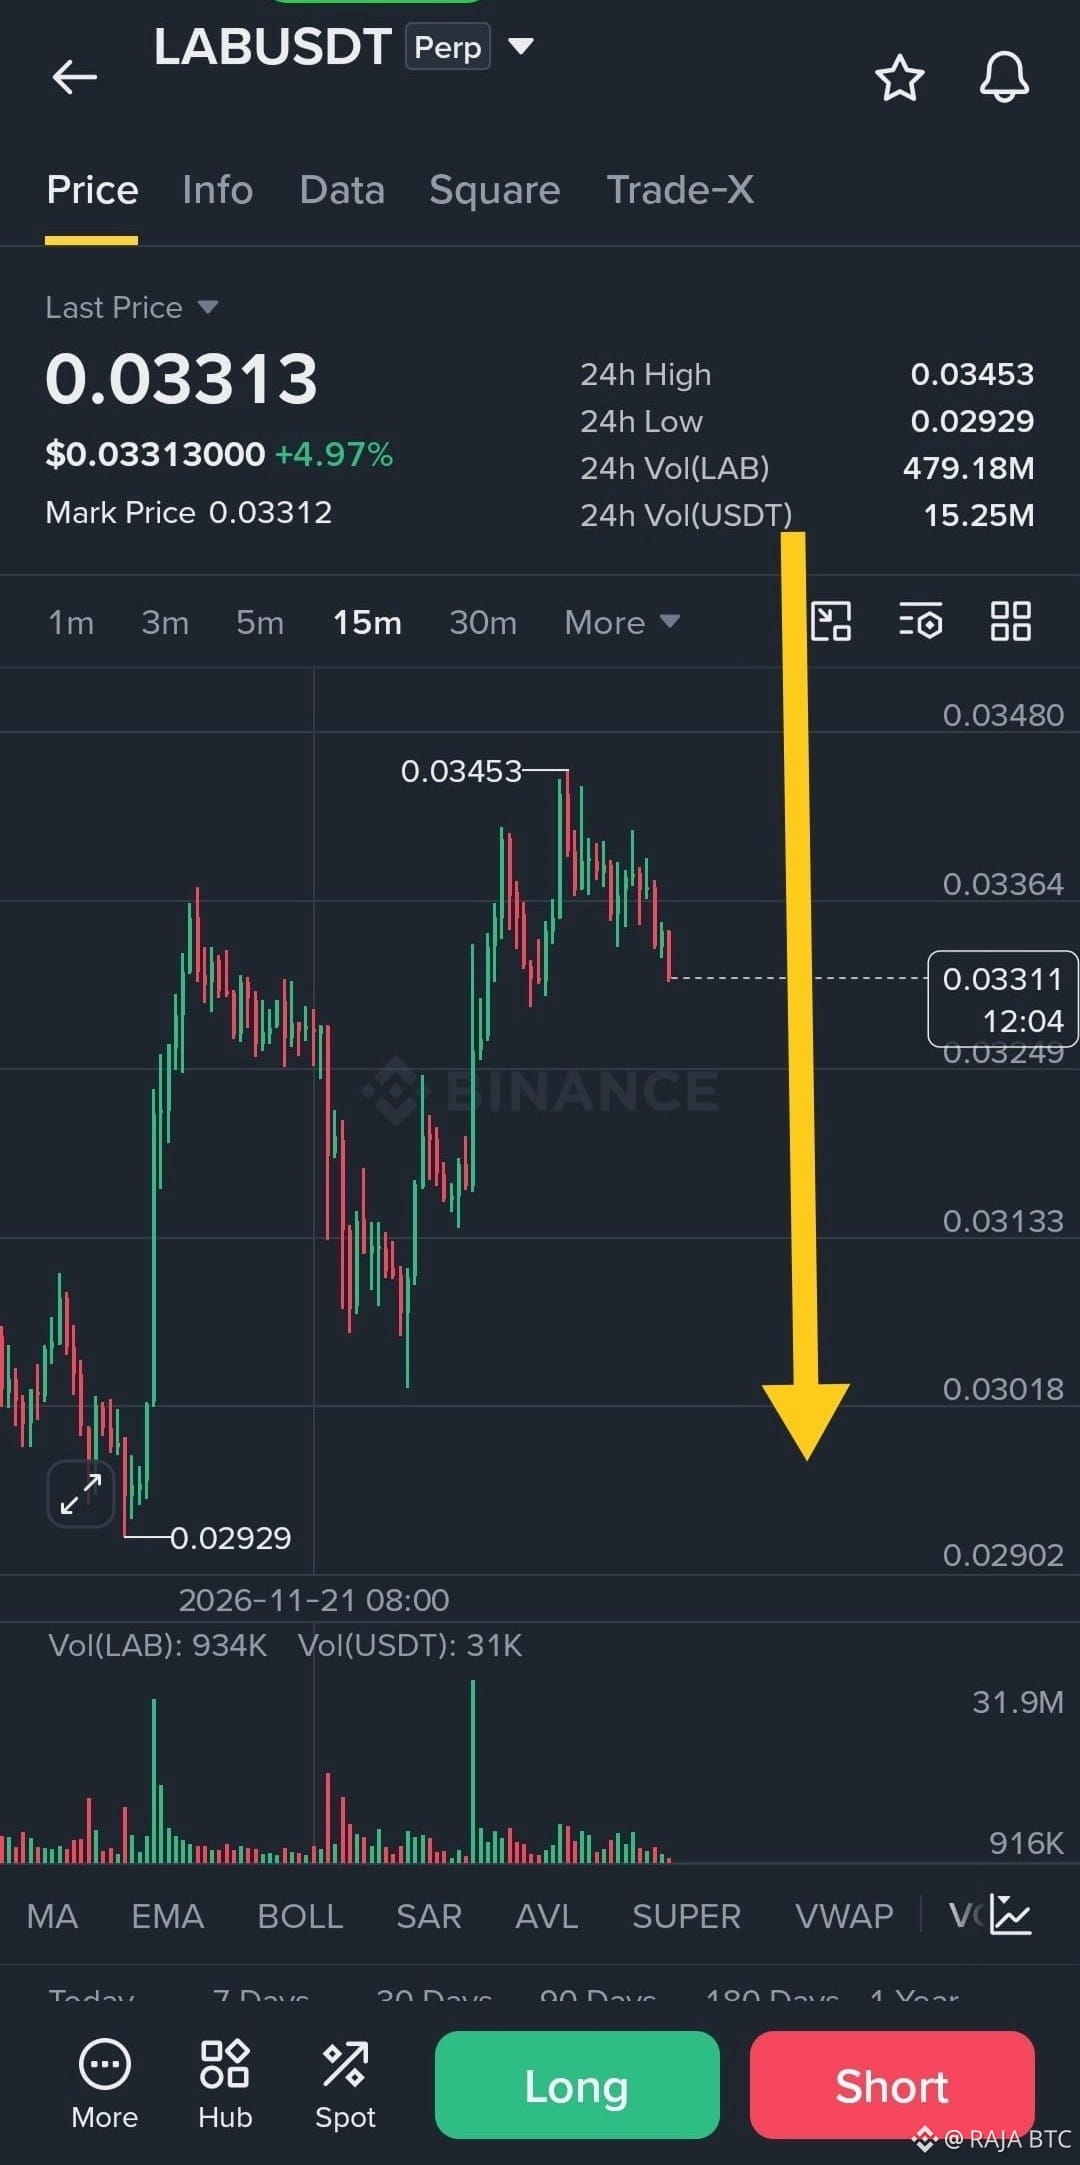
⚡ $LAB
{future}(LABUSDT)
— ONE LAST CALL? 🚀
After 2 years away, I'm back in the crypto game!
I've shared 2,500+ signals and returned with a fresh month of market analysis, targets and trade updates.
🎯 My next LAB watch: $30
But here's the real question…
Should I keep sharing my trading setups for free, or focus on my own portfolio?
If you're following the journey, show some support! ❤️
#LAB #cryptosignals #altcoins #BinanceSquare #RajaBTC @Raja_001
⚡ $LAB
— ONE LAST CALL? 🚀
After 2 years away, I'm back in the crypto game!
I've shared 2,500+ signals and returned with a fresh month of market analysis, targets and trade updates.
🎯 My next LAB watch: $30
But here's the real question…
Should I keep sharing my trading setups for free, or focus on my own portfolio?
If you're following the journey, show some support! ❤️
#LAB #cryptosignals #altcoins #BinanceSquare #RajaBTC @RAJA BTC
— ONE LAST CALL? 🚀
After 2 years away, I'm back in the crypto game!
I've shared 2,500+ signals and returned with a fresh month of market analysis, targets and trade updates.
🎯 My next LAB watch: $30
But here's the real question…
Should I keep sharing my trading setups for free, or focus on my own portfolio?
If you're following the journey, show some support! ❤️
#LAB #cryptosignals #altcoins #BinanceSquare #RajaBTC @RAJA BTC
fa27327:
After tell us what we do
7
4
3.2k
Everyone is talking about $HYPE dropping. Nobody is asking the right question.
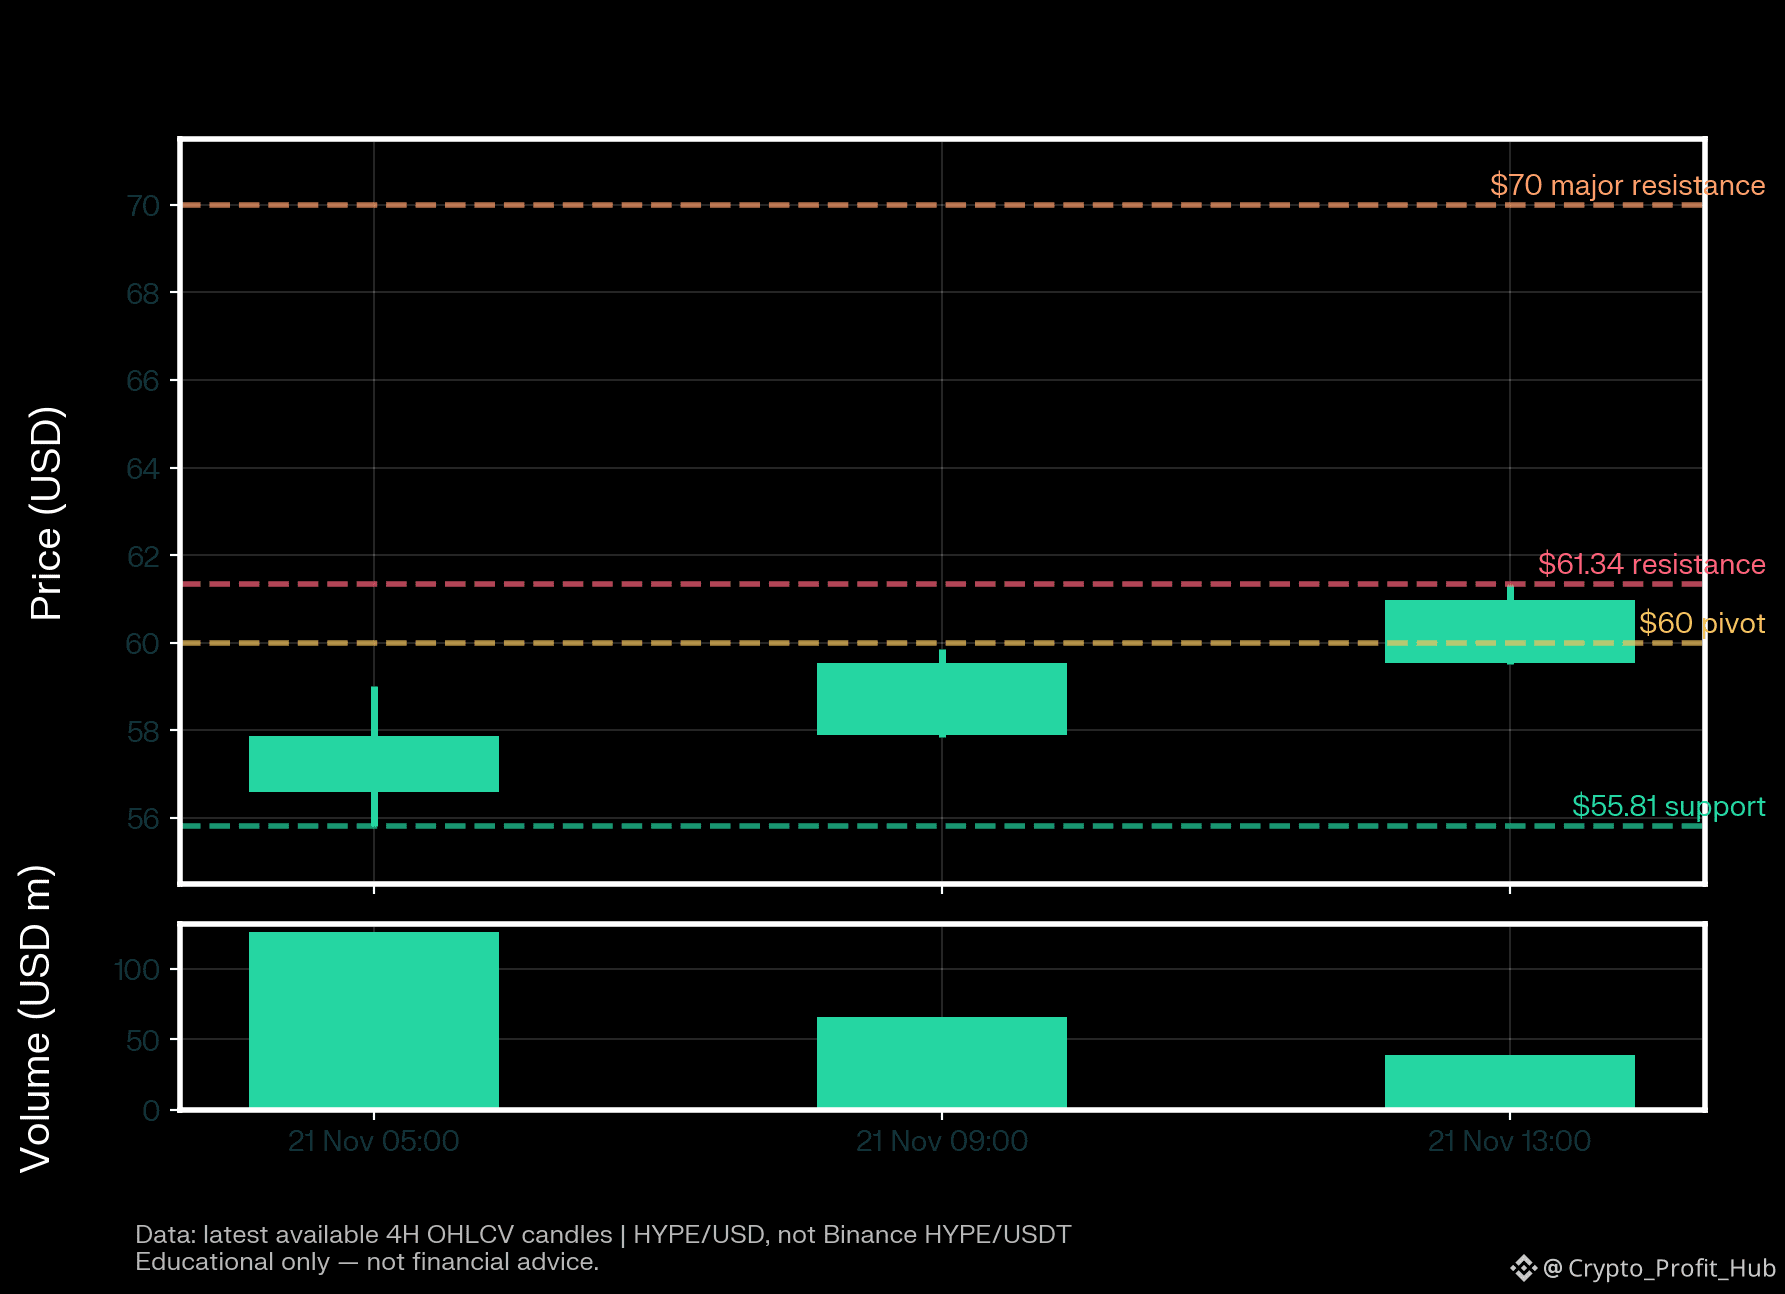
HYPE is one of the biggest losers among large-cap altcoins today. Price is near $58 after a double-digit drop in 24 hours.[1][2]
My simple take:
$56–$57 support — buyers need to defend this zone
$60–$62 resistance — price must reclaim this area
$70 — a move above this could bring strength back
I am not calling this a “buy the dip” yet. First, I want to see HYPE hold above $60–$62. If $56 breaks, more downside is possible.[1]
What would you do—buy now or wait? Drop your level in the comments 👇
$HYPE #Hyperliquid #CryptoMarket #altcoins
Not financial advice. DYOR.
{future}(HYPEUSDT)
Everyone is talking about $HYPE dropping. Nobody is asking the right question.
HYPE is one of the biggest losers among large-cap altcoins today. Price is near $58 after a double-digit drop in 24 hours.[1][2]
My simple take:
$56–$57 support — buyers need to defend this zone
$60–$62 resistance — price must reclaim this area
$70 — a move above this could bring strength back
I am not calling this a “buy the dip” yet. First, I want to see HYPE hold above $60–$62. If $56 breaks, more downside is possible.[1]
What would you do—buy now or wait? Drop your level in the comments 👇
$HYPE #Hyperliquid #CryptoMarket #altcoins
Not financial advice. DYOR.
HYPE is one of the biggest losers among large-cap altcoins today. Price is near $58 after a double-digit drop in 24 hours.[1][2]
My simple take:
$56–$57 support — buyers need to defend this zone
$60–$62 resistance — price must reclaim this area
$70 — a move above this could bring strength back
I am not calling this a “buy the dip” yet. First, I want to see HYPE hold above $60–$62. If $56 breaks, more downside is possible.[1]
What would you do—buy now or wait? Drop your level in the comments 👇
$HYPE #Hyperliquid #CryptoMarket #altcoins
Not financial advice. DYOR.
1
1.2k

·
--
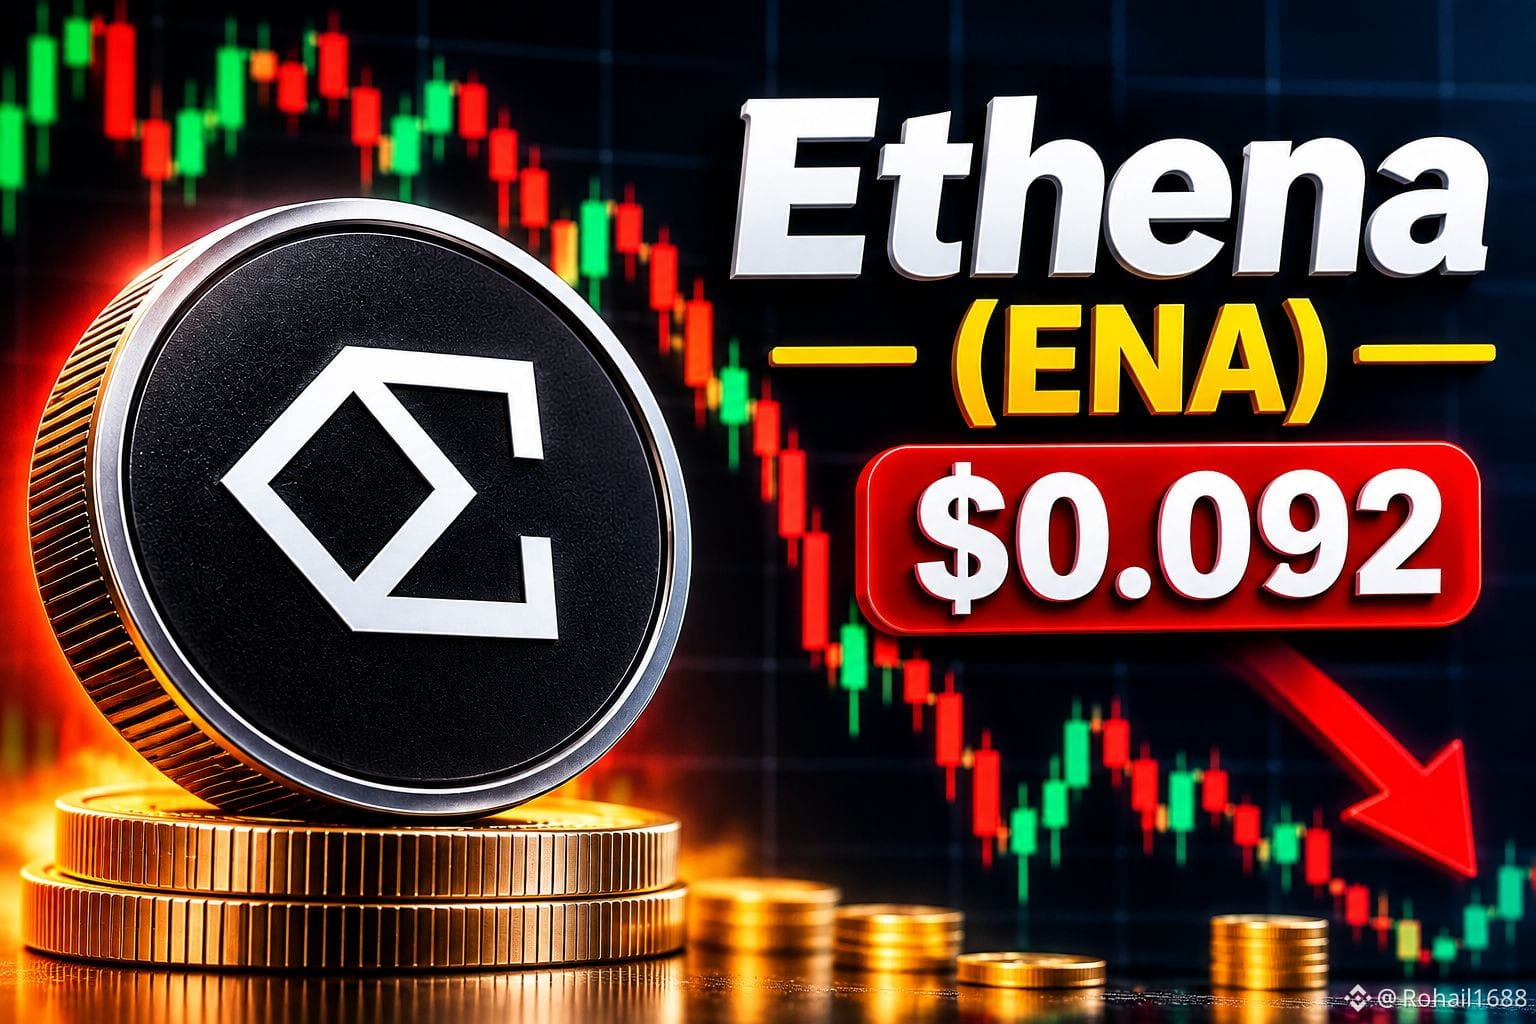
Today, Ethena $ENA is facing strong selling pressure. ENA is trading around $0.0925 down approximately 12% over the past 24 hours. Weakness across the broader crypto market is also contributing to the decline.
The $0.090 support zone is important for ENA. If the price holds above this level, a recovery attempt could develop. However, if this support breaks, further downside risk may increase. Moving back above $0.1200 could be a positive signal for a short-term recovery.
For now, market conditions remain challenging. Instead of making rushed decisions, investors should closely monitor price action and key support levels.#ENA #ethena #CryptoMarketMoves #Altcoins
{spot}(ENAUSDT)
Today, Ethena $ENA is facing strong selling pressure. ENA is trading around $0.0925 down approximately 12% over the past 24 hours. Weakness across the broader crypto market is also contributing to the decline.
The $0.090 support zone is important for ENA. If the price holds above this level, a recovery attempt could develop. However, if this support breaks, further downside risk may increase. Moving back above $0.1200 could be a positive signal for a short-term recovery.
For now, market conditions remain challenging. Instead of making rushed decisions, investors should closely monitor price action and key support levels.#ENA #ethena #CryptoMarketMoves #Altcoins
The $0.090 support zone is important for ENA. If the price holds above this level, a recovery attempt could develop. However, if this support breaks, further downside risk may increase. Moving back above $0.1200 could be a positive signal for a short-term recovery.
For now, market conditions remain challenging. Instead of making rushed decisions, investors should closely monitor price action and key support levels.#ENA #ethena #CryptoMarketMoves #Altcoins
Raja_-786:
Not today, It's dumping continuously from 0.29 to onward without taking breath. Now Today its make another lower @ 0.0899. That's why i called it "shit coin"
Because:
No use case= Dumped
Token Unlock events 2 times in each month= Again big dumped
Remaining days= Dumped with Bitcoin.
2
1
1.7k

Article
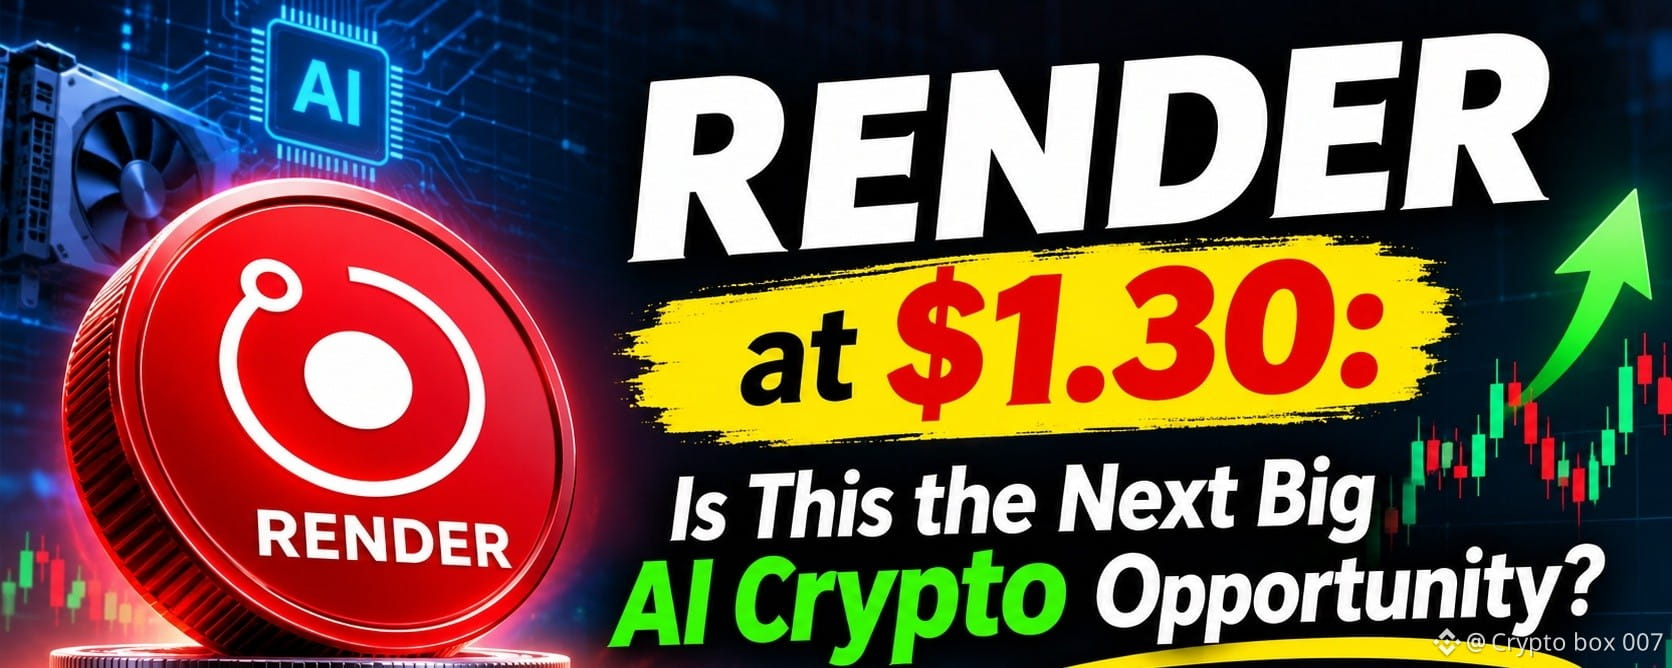
The AI and DePIN Gem That Deserves Your Attention: RENDERRENDER at $1.30: Is This a Hidden Opportunity in the AI and DePIN Sector?
Render (RENDER) is currently trading around $1.30, following a significant decline from its previous highs. While the broader chart still reflects a long-term bearish trend, the current price zone deserves attention from investors looking for potential opportunities in the AI and decentralized computing sectors.
Could RENDER be preparing for a long-term recovery?
Let's take a closer look.
1. What Makes Render Network Interesting?
Render Network is a decentralized GPU computing network that connects GPU providers with users who need computing power.
Its applications include:
AI and machine learning workloads
3D rendering and animation
Digital content creation
GPU-intensive computing
As demand for AI infrastructure and GPU computing continues to attract attention, decentralized computing networks could become an interesting part of this growing industry.
Render is not simply another speculative AI token. It has an actual network designed to facilitate GPU computing services.
2. Tokenomics: Burn and Mint Equilibrium
One of Render's interesting features is its Burn and Mint Equilibrium (BME) model.
Under this model:
Users burn RENDER tokens to pay for network services.
New tokens are issued as rewards for network participants.
The balance between network usage, token burning and emissions plays an important role in the token's economics.
This means that increasing network activity could potentially create more demand for RENDER.
However, actual token value will depend on whether network demand grows enough relative to new token emissions.
3. Technical Analysis: Is RENDER Near a Bottom?
At the time of the chart shared, RENDER was trading around $1.303.
The weekly chart shows a prolonged decline from the $10–$11 region, followed by an extended consolidation around the $1–$2 range.
Important price levels to watch:
Support Zones
$1.15–$1.20: Immediate support
$1.00–$1.10: Major support zone
Resistance Zones
$1.40–$1.50: First resistance
$1.80–$2.00: Major resistance
$2.40–$2.60: Next potential resistance
A weekly close above $1.50, followed by a successful move above $1.80–$2.00, could strengthen the bullish recovery scenario.
On the other hand, losing the $1.15 support area could expose the price to further downside.
These are technical observation zones, not guaranteed price levels.
4. Why Investors Are Watching RENDER
There are several reasons why RENDER deserves attention:
Exposure to the decentralized GPU computing sector.
Potential applications in AI, 3D rendering and digital production.
A token-burning mechanism linked to network usage.
An established network with measurable activity.
Potential to benefit if demand for decentralized computing expands.
Nevertheless, strong technology does not automatically translate into higher token prices. Adoption, competition, token emissions and broader market conditions remain important factors.
5. My Strategy at the Current Price
At approximately $1.30, I believe RENDER deserves attention, but I would avoid investing the entire amount at once.
A gradual accumulation strategy may offer better risk management for long-term investors.
I would closely monitor:
The $1.15–$1.20 support zone.
A possible breakout above $1.50.
Increasing trading volume.
Higher highs and higher lows on the weekly chart.
Confirmation is more important than trying to catch the exact bottom.
Final Thoughts
RENDER combines two interesting narratives: AI infrastructure and decentralized physical infrastructure (DePIN).
Its long-term potential depends on real network adoption and growing demand for GPU computing.
At around $1.30, it may be worth keeping on the watchlist. However, the weekly trend has not yet confirmed a bullish reversal.
The opportunity could be interesting, but patience and risk management are essential.
What do you think?
Is RENDER preparing for a major recovery, or could there be another leg down before the next bull market?
#render r #RenderNetwork #altcoins #DePIN #Crypto #Altcoins
The AI and DePIN Gem That Deserves Your Attention: RENDER
RENDER at $1.30: Is This a Hidden Opportunity in the AI and DePIN Sector?
Render (RENDER) is currently trading around $1.30, following a significant decline from its previous highs. While the broader chart still reflects a long-term bearish trend, the current price zone deserves attention from investors looking for potential opportunities in the AI and decentralized computing sectors.
Could RENDER be preparing for a long-term recovery?
Let's take a closer look.
1. What Makes Render Network Interesting?
Render Network is a decentralized GPU computing network that connects GPU providers with users who need computing power.
Its applications include:
AI and machine learning workloads
3D rendering and animation
Digital content creation
GPU-intensive computing
As demand for AI infrastructure and GPU computing continues to attract attention, decentralized computing networks could become an interesting part of this growing industry.
Render is not simply another speculative AI token. It has an actual network designed to facilitate GPU computing services.
2. Tokenomics: Burn and Mint Equilibrium
One of Render's interesting features is its Burn and Mint Equilibrium (BME) model.
Under this model:
Users burn RENDER tokens to pay for network services.
New tokens are issued as rewards for network participants.
The balance between network usage, token burning and emissions plays an important role in the token's economics.
This means that increasing network activity could potentially create more demand for RENDER.
However, actual token value will depend on whether network demand grows enough relative to new token emissions.
3. Technical Analysis: Is RENDER Near a Bottom?
At the time of the chart shared, RENDER was trading around $1.303.
The weekly chart shows a prolonged decline from the $10–$11 region, followed by an extended consolidation around the $1–$2 range.
Important price levels to watch:
Support Zones
$1.15–$1.20: Immediate support
$1.00–$1.10: Major support zone
Resistance Zones
$1.40–$1.50: First resistance
$1.80–$2.00: Major resistance
$2.40–$2.60: Next potential resistance
A weekly close above $1.50, followed by a successful move above $1.80–$2.00, could strengthen the bullish recovery scenario.
On the other hand, losing the $1.15 support area could expose the price to further downside.
These are technical observation zones, not guaranteed price levels.
4. Why Investors Are Watching RENDER
There are several reasons why RENDER deserves attention:
Exposure to the decentralized GPU computing sector.
Potential applications in AI, 3D rendering and digital production.
A token-burning mechanism linked to network usage.
An established network with measurable activity.
Potential to benefit if demand for decentralized computing expands.
Nevertheless, strong technology does not automatically translate into higher token prices. Adoption, competition, token emissions and broader market conditions remain important factors.
5. My Strategy at the Current Price
At approximately $1.30, I believe RENDER deserves attention, but I would avoid investing the entire amount at once.
A gradual accumulation strategy may offer better risk management for long-term investors.
I would closely monitor:
The $1.15–$1.20 support zone.
A possible breakout above $1.50.
Increasing trading volume.
Higher highs and higher lows on the weekly chart.
Confirmation is more important than trying to catch the exact bottom.
Final Thoughts
RENDER combines two interesting narratives: AI infrastructure and decentralized physical infrastructure (DePIN).
Its long-term potential depends on real network adoption and growing demand for GPU computing.
At around $1.30, it may be worth keeping on the watchlist. However, the weekly trend has not yet confirmed a bullish reversal.
The opportunity could be interesting, but patience and risk management are essential.
What do you think?
Is RENDER preparing for a major recovery, or could there be another leg down before the next bull market?
#render r #RenderNetwork #altcoins #DePIN #Crypto #Altcoins
Render (RENDER) is currently trading around $1.30, following a significant decline from its previous highs. While the broader chart still reflects a long-term bearish trend, the current price zone deserves attention from investors looking for potential opportunities in the AI and decentralized computing sectors.
Could RENDER be preparing for a long-term recovery?
Let's take a closer look.
1. What Makes Render Network Interesting?
Render Network is a decentralized GPU computing network that connects GPU providers with users who need computing power.
Its applications include:
AI and machine learning workloads
3D rendering and animation
Digital content creation
GPU-intensive computing
As demand for AI infrastructure and GPU computing continues to attract attention, decentralized computing networks could become an interesting part of this growing industry.
Render is not simply another speculative AI token. It has an actual network designed to facilitate GPU computing services.
2. Tokenomics: Burn and Mint Equilibrium
One of Render's interesting features is its Burn and Mint Equilibrium (BME) model.
Under this model:
Users burn RENDER tokens to pay for network services.
New tokens are issued as rewards for network participants.
The balance between network usage, token burning and emissions plays an important role in the token's economics.
This means that increasing network activity could potentially create more demand for RENDER.
However, actual token value will depend on whether network demand grows enough relative to new token emissions.
3. Technical Analysis: Is RENDER Near a Bottom?
At the time of the chart shared, RENDER was trading around $1.303.
The weekly chart shows a prolonged decline from the $10–$11 region, followed by an extended consolidation around the $1–$2 range.
Important price levels to watch:
Support Zones
$1.15–$1.20: Immediate support
$1.00–$1.10: Major support zone
Resistance Zones
$1.40–$1.50: First resistance
$1.80–$2.00: Major resistance
$2.40–$2.60: Next potential resistance
A weekly close above $1.50, followed by a successful move above $1.80–$2.00, could strengthen the bullish recovery scenario.
On the other hand, losing the $1.15 support area could expose the price to further downside.
These are technical observation zones, not guaranteed price levels.
4. Why Investors Are Watching RENDER
There are several reasons why RENDER deserves attention:
Exposure to the decentralized GPU computing sector.
Potential applications in AI, 3D rendering and digital production.
A token-burning mechanism linked to network usage.
An established network with measurable activity.
Potential to benefit if demand for decentralized computing expands.
Nevertheless, strong technology does not automatically translate into higher token prices. Adoption, competition, token emissions and broader market conditions remain important factors.
5. My Strategy at the Current Price
At approximately $1.30, I believe RENDER deserves attention, but I would avoid investing the entire amount at once.
A gradual accumulation strategy may offer better risk management for long-term investors.
I would closely monitor:
The $1.15–$1.20 support zone.
A possible breakout above $1.50.
Increasing trading volume.
Higher highs and higher lows on the weekly chart.
Confirmation is more important than trying to catch the exact bottom.
Final Thoughts
RENDER combines two interesting narratives: AI infrastructure and decentralized physical infrastructure (DePIN).
Its long-term potential depends on real network adoption and growing demand for GPU computing.
At around $1.30, it may be worth keeping on the watchlist. However, the weekly trend has not yet confirmed a bullish reversal.
The opportunity could be interesting, but patience and risk management are essential.
What do you think?
Is RENDER preparing for a major recovery, or could there be another leg down before the next bull market?
#render r #RenderNetwork #altcoins #DePIN #Crypto #Altcoins
2
404

·
--
🚨 $zec: heavy flush just hit, whales eyeing the $700 floor!
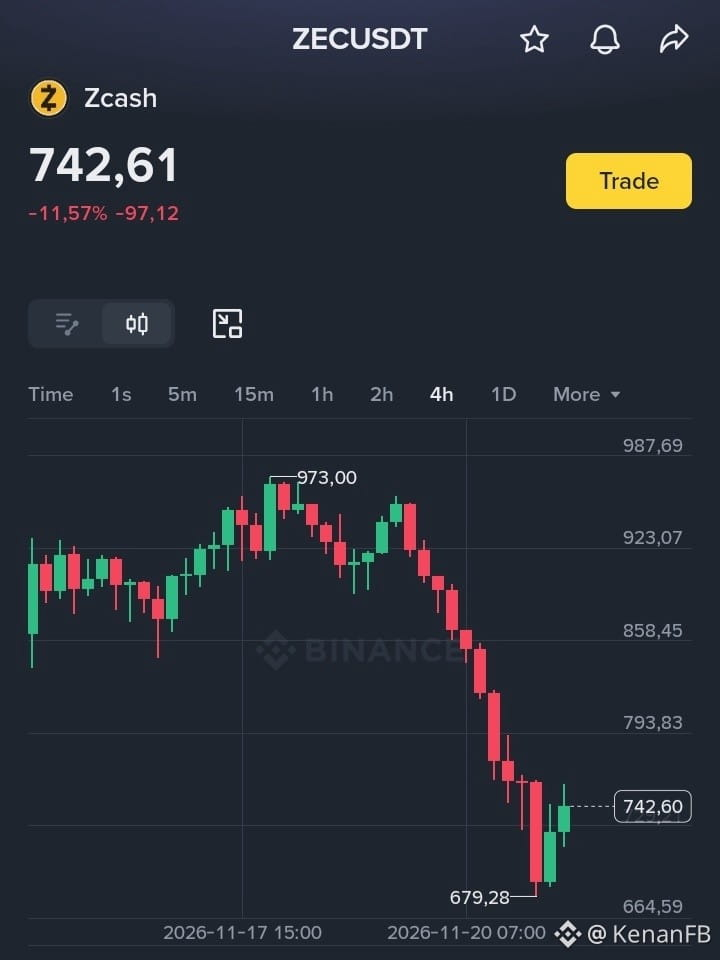
quick market scan on $zec right now. after a brutal dump over the last 24 hours, price action is starting to curl up around $739.20.
bears completely nuked the $800 zone, triggering massive liquidations across the board. order book is heavy on the ask side near $785, which is our immediate resistance to flip. however, look at the 1h structure: selling pressure is exhausting fast above the major psychological support at $700.
smart money and privacy coin whales are quietly bidding this bloodbath. rsi is deeply oversold, screaming for a sharp relief bounce if $700 holds the line. if bulls lose $700, next stop is $650. reclaim $785, and we squeeze straight back toward $830+.
if you're betting on this oversold bounce or shorting the breakdown, you can check the trading pair below to position yourself.
backed by hours of chart scanning. if this alpha makes you green, hitting the tip button supports the grind.
are you catching this bounce or waiting for $700 to break? let me know below! 👇
$ZEC
{future}(ZECUSDT)
#zec #zcash #crypto #altcoins
*disclaimer: market commentary based on current live data. not financial advice. always dyor.*
🚨 $zec: heavy flush just hit, whales eyeing the $700 floor!
quick market scan on $zec right now. after a brutal dump over the last 24 hours, price action is starting to curl up around $739.20.
bears completely nuked the $800 zone, triggering massive liquidations across the board. order book is heavy on the ask side near $785, which is our immediate resistance to flip. however, look at the 1h structure: selling pressure is exhausting fast above the major psychological support at $700.
smart money and privacy coin whales are quietly bidding this bloodbath. rsi is deeply oversold, screaming for a sharp relief bounce if $700 holds the line. if bulls lose $700, next stop is $650. reclaim $785, and we squeeze straight back toward $830+.
if you're betting on this oversold bounce or shorting the breakdown, you can check the trading pair below to position yourself.
backed by hours of chart scanning. if this alpha makes you green, hitting the tip button supports the grind.
are you catching this bounce or waiting for $700 to break? let me know below! 👇
$ZEC
#zec #zcash #crypto #altcoins
*disclaimer: market commentary based on current live data. not financial advice. always dyor.*
quick market scan on $zec right now. after a brutal dump over the last 24 hours, price action is starting to curl up around $739.20.
bears completely nuked the $800 zone, triggering massive liquidations across the board. order book is heavy on the ask side near $785, which is our immediate resistance to flip. however, look at the 1h structure: selling pressure is exhausting fast above the major psychological support at $700.
smart money and privacy coin whales are quietly bidding this bloodbath. rsi is deeply oversold, screaming for a sharp relief bounce if $700 holds the line. if bulls lose $700, next stop is $650. reclaim $785, and we squeeze straight back toward $830+.
if you're betting on this oversold bounce or shorting the breakdown, you can check the trading pair below to position yourself.
backed by hours of chart scanning. if this alpha makes you green, hitting the tip button supports the grind.
are you catching this bounce or waiting for $700 to break? let me know below! 👇
$ZEC
#zec #zcash #crypto #altcoins
*disclaimer: market commentary based on current live data. not financial advice. always dyor.*
1
737

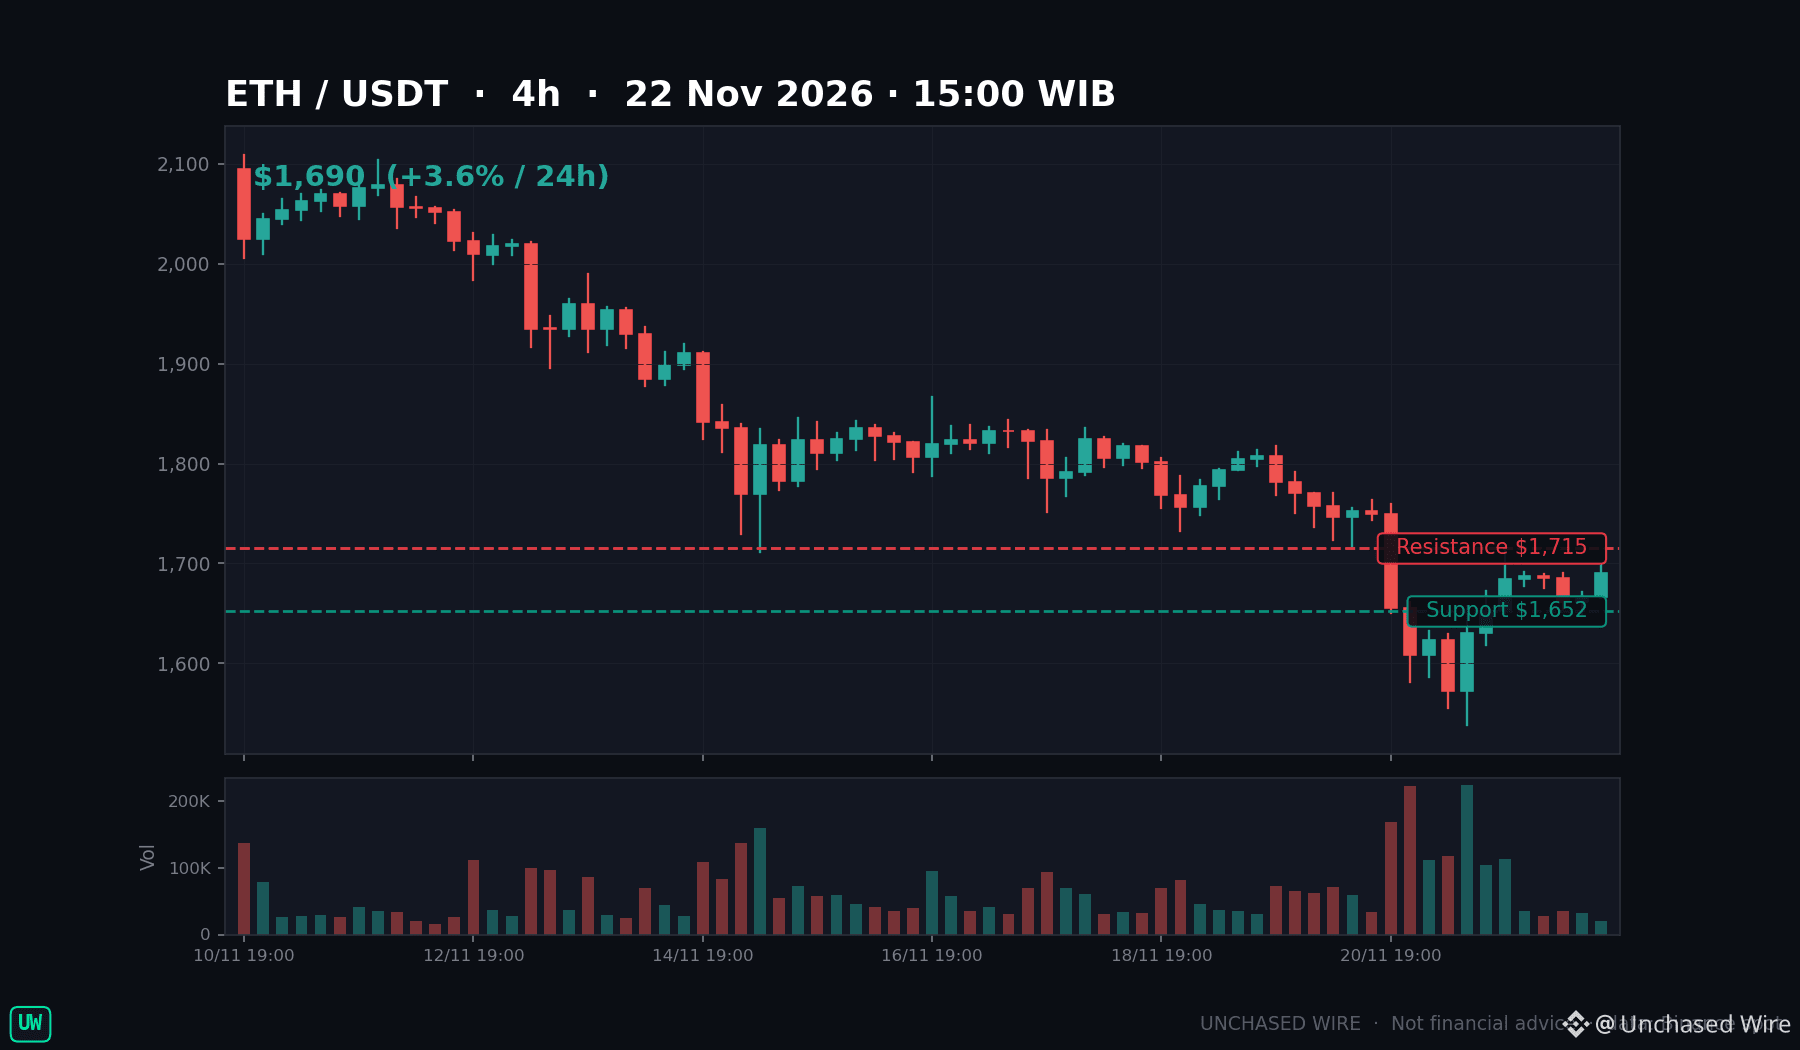
ETH tagged $1,548.68 on Saturday, its lowest since June 26, then bounced above $1,650. I'm watching if the bounce is a bottom or a pause.
Arthur Hayes just named ETH at $2,800, one of his 'Four Horsemen' before the AI bubble ends. The awkward part: he sold $15.2 million of ETH in October and closed his book. A $2,800 call from a man who just sold is a headline, not a position.
The ladder is steep. First ceiling $1,715, then the $1,733–$1,758 band, home of the 7-day average. Clear it and $1,885 opens; the 200-day waits at $2,125. Below, $1,644 is the pivot, lose it on a daily close and $1,539 is back in play.
But here's what matters most: ETH is down 8.6% on the week and 30.8% on the month, RSI at 25.9, and ETH ETFs bled $398.9 million in a week. Oversold can stay oversold while it heals.
If the bounce is short covering, what gives it away first, a failed retest of $1,715, or volume drying up above $1,700?
DYOR — not financial advice.
$ETH #Ethereum #Altcoins #ETF
ETH tagged $1,548.68 on Saturday, its lowest since June 26, then bounced above $1,650. I'm watching if the bounce is a bottom or a pause.
Arthur Hayes just named ETH at $2,800, one of his 'Four Horsemen' before the AI bubble ends. The awkward part: he sold $15.2 million of ETH in October and closed his book. A $2,800 call from a man who just sold is a headline, not a position.
The ladder is steep. First ceiling $1,715, then the $1,733–$1,758 band, home of the 7-day average. Clear it and $1,885 opens; the 200-day waits at $2,125. Below, $1,644 is the pivot, lose it on a daily close and $1,539 is back in play.
But here's what matters most: ETH is down 8.6% on the week and 30.8% on the month, RSI at 25.9, and ETH ETFs bled $398.9 million in a week. Oversold can stay oversold while it heals.
If the bounce is short covering, what gives it away first, a failed retest of $1,715, or volume drying up above $1,700?
DYOR — not financial advice.
$ETH #Ethereum #Altcoins #ETF
Arthur Hayes just named ETH at $2,800, one of his 'Four Horsemen' before the AI bubble ends. The awkward part: he sold $15.2 million of ETH in October and closed his book. A $2,800 call from a man who just sold is a headline, not a position.
The ladder is steep. First ceiling $1,715, then the $1,733–$1,758 band, home of the 7-day average. Clear it and $1,885 opens; the 200-day waits at $2,125. Below, $1,644 is the pivot, lose it on a daily close and $1,539 is back in play.
But here's what matters most: ETH is down 8.6% on the week and 30.8% on the month, RSI at 25.9, and ETH ETFs bled $398.9 million in a week. Oversold can stay oversold while it heals.
If the bounce is short covering, what gives it away first, a failed retest of $1,715, or volume drying up above $1,700?
DYOR — not financial advice.
$ETH #Ethereum #Altcoins #ETF
115

·
--
Bearish
🚨 $SOL: Is the Next Move a Breakdown or a Liquidity Trap? 📉
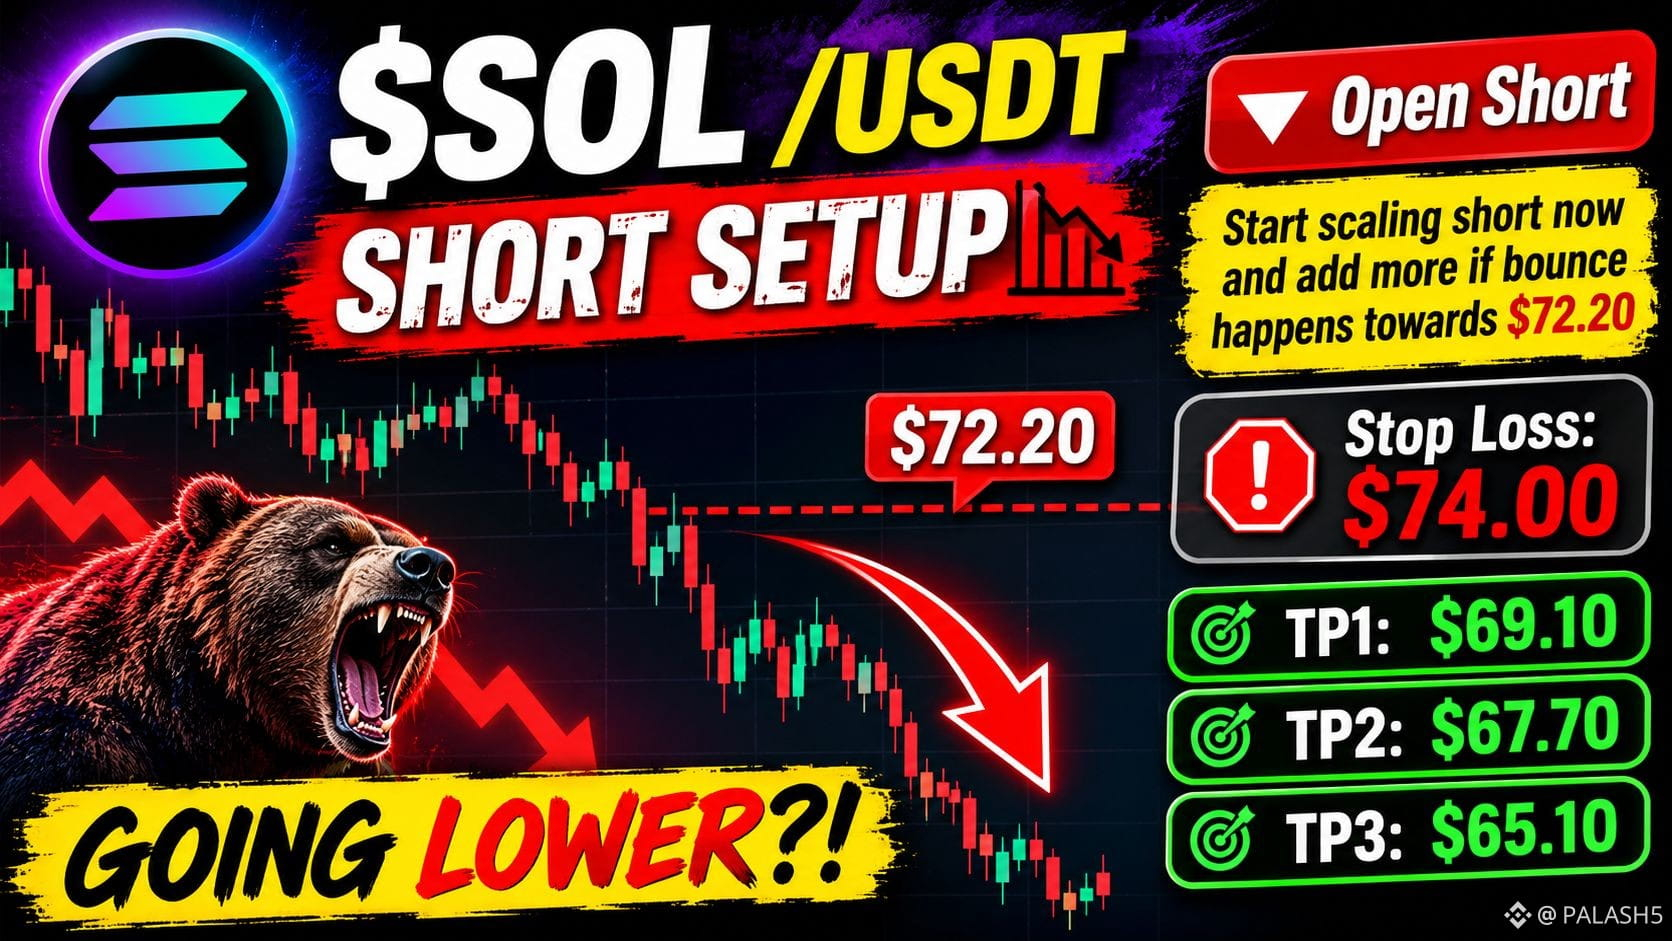
I'm watching SOL closely because the key battle is around the $72.20 resistance zone.
My strategy is to build a SHORT position gradually rather than chase the price. If SOL bounces toward $72.20 and shows rejection, sellers could regain control and push price toward lower liquidity zones.
🔴 SHORT ENTRY: Current market price
➕ Add more on a bounce toward $72.20
🛑 Stop Loss: $74.00
🎯 TP1: $69.10
🎯 TP2: $67.70
🎯 TP3: $65.10
My key question: Will sellers defend the $72.20 zone, or will buyers break above it and trigger a short squeeze?
I want to see confirmation before getting too aggressive. Risk management matters more than catching every move.
💬 What do you think? Are you bearish on SOL, or expecting a bullish recovery? Let's discuss!
#SOL #CryptoTrading #Altcoins
$SOL
{future}(SOLUSDT)
🚨 $SOL : Is the Next Move a Breakdown or a Liquidity Trap? 📉
I'm watching SOL closely because the key battle is around the $72.20 resistance zone.
My strategy is to build a SHORT position gradually rather than chase the price. If SOL bounces toward $72.20 and shows rejection, sellers could regain control and push price toward lower liquidity zones.
🔴 SHORT ENTRY: Current market price
➕ Add more on a bounce toward $72.20
🛑 Stop Loss: $74.00
🎯 TP1: $69.10
🎯 TP2: $67.70
🎯 TP3: $65.10
My key question: Will sellers defend the $72.20 zone, or will buyers break above it and trigger a short squeeze?
I want to see confirmation before getting too aggressive. Risk management matters more than catching every move.
💬 What do you think? Are you bearish on SOL, or expecting a bullish recovery? Let's discuss!
#SOL #CryptoTrading #Altcoins
$SOL
I'm watching SOL closely because the key battle is around the $72.20 resistance zone.
My strategy is to build a SHORT position gradually rather than chase the price. If SOL bounces toward $72.20 and shows rejection, sellers could regain control and push price toward lower liquidity zones.
🔴 SHORT ENTRY: Current market price
➕ Add more on a bounce toward $72.20
🛑 Stop Loss: $74.00
🎯 TP1: $69.10
🎯 TP2: $67.70
🎯 TP3: $65.10
My key question: Will sellers defend the $72.20 zone, or will buyers break above it and trigger a short squeeze?
I want to see confirmation before getting too aggressive. Risk management matters more than catching every move.
💬 What do you think? Are you bearish on SOL, or expecting a bullish recovery? Let's discuss!
#SOL #CryptoTrading #Altcoins
$SOL
Trong_Hatachi:
The $72.20 zone looks like the key test; I'd wait to see how SOL reacts there. Follow me back for more crypto discussion!
2
2
3.2k

·
--
Bearish
✴️ $DEXE
⚜️ IS THIS THE CALM BEFORE A BIG COMEBACK? 👀
😲 $DEXE is still on the radar, but one important question remains…
Are buyers preparing for a recovery, or is the market hiding another surprise?
🔥 Here are 3 signals worth watching:
🐂 Buying Pressure: Are buyers stepping in with stronger volume?
📈 Trend Reversal: Can DEXE start making higher highs and higher lows?
⚡ Market Confirmation: Will Bitcoin's direction support a possible recovery?
💡 Remember: A green candle doesn't always mean a real trend reversal.
{spot}(DEXEUSDT)
I'm watching DEXE closely, but patience and confirmation matter more than excitement.
What do you think? Is DEXE preparing for a comeback or facing more downside? 👇
#DEXE #CryptoMarket #Altcoins #BinanceSquare
Not financial advice. Always do your own research.
✴️ $DEXE
⚜️ IS THIS THE CALM BEFORE A BIG COMEBACK? 👀
😲 $DEXE is still on the radar, but one important question remains…
Are buyers preparing for a recovery, or is the market hiding another surprise?
🔥 Here are 3 signals worth watching:
🐂 Buying Pressure: Are buyers stepping in with stronger volume?
📈 Trend Reversal: Can DEXE start making higher highs and higher lows?
⚡ Market Confirmation: Will Bitcoin's direction support a possible recovery?
💡 Remember: A green candle doesn't always mean a real trend reversal.
I'm watching DEXE closely, but patience and confirmation matter more than excitement.
What do you think? Is DEXE preparing for a comeback or facing more downside? 👇
#DEXE #CryptoMarket #Altcoins #BinanceSquare
Not financial advice. Always do your own research.
⚜️ IS THIS THE CALM BEFORE A BIG COMEBACK? 👀
😲 $DEXE is still on the radar, but one important question remains…
Are buyers preparing for a recovery, or is the market hiding another surprise?
🔥 Here are 3 signals worth watching:
🐂 Buying Pressure: Are buyers stepping in with stronger volume?
📈 Trend Reversal: Can DEXE start making higher highs and higher lows?
⚡ Market Confirmation: Will Bitcoin's direction support a possible recovery?
💡 Remember: A green candle doesn't always mean a real trend reversal.
I'm watching DEXE closely, but patience and confirmation matter more than excitement.
What do you think? Is DEXE preparing for a comeback or facing more downside? 👇
#DEXE #CryptoMarket #Altcoins #BinanceSquare
Not financial advice. Always do your own research.

ILyKit:
Thank you kindly and the same on your side. Take good care 💪👍
6
8
2.6k

·
--
Bearish
🚨 IDOLUSDT SHORT SETUP – WATCH FOR A REVERSAL! 📉
IDOL is showing strong bullish momentum, currently trading around $0.02934 (+26.95%), but price is approaching an important resistance zone. I'm watching $0.0307–$0.0319 for a possible rejection before considering a short entry. Entry: $0.0305–$0.0318 after bearish confirmation. Stop Loss: $0.0328. TP1: $0.0270 | TP2: $0.0240 | TP3: $0.0225. The previous spike near $0.0455 shows that volatility is high, so don't rush into a short while buyers remain strong. Wait for rejection or a bearish candle confirmation around resistance. If price breaks and holds above $0.032, this short setup becomes invalid. ⚠️ Manage your risk and DYOR. Not financial advice. #ShortSetup up #CryptoTrading. ng #Binance #Altcoins
{future}(IDOLUSDT)
🚨 IDOLUSDT SHORT SETUP – WATCH FOR A REVERSAL! 📉
IDOL is showing strong bullish momentum, currently trading around $0.02934 (+26.95%), but price is approaching an important resistance zone. I'm watching $0.0307–$0.0319 for a possible rejection before considering a short entry. Entry: $0.0305–$0.0318 after bearish confirmation. Stop Loss: $0.0328. TP1: $0.0270 | TP2: $0.0240 | TP3: $0.0225. The previous spike near $0.0455 shows that volatility is high, so don't rush into a short while buyers remain strong. Wait for rejection or a bearish candle confirmation around resistance. If price breaks and holds above $0.032, this short setup becomes invalid. ⚠️ Manage your risk and DYOR. Not financial advice. #ShortSetup up #CryptoTrading. ng #Binance #Altcoins
IDOL is showing strong bullish momentum, currently trading around $0.02934 (+26.95%), but price is approaching an important resistance zone. I'm watching $0.0307–$0.0319 for a possible rejection before considering a short entry. Entry: $0.0305–$0.0318 after bearish confirmation. Stop Loss: $0.0328. TP1: $0.0270 | TP2: $0.0240 | TP3: $0.0225. The previous spike near $0.0455 shows that volatility is high, so don't rush into a short while buyers remain strong. Wait for rejection or a bearish candle confirmation around resistance. If price breaks and holds above $0.032, this short setup becomes invalid. ⚠️ Manage your risk and DYOR. Not financial advice. #ShortSetup up #CryptoTrading. ng #Binance #Altcoins
M-najebkhan:
put tight sl or get liquidated even if yor liq is 1💲
1
997

·
--
$NEAR just lost 11% to 14% in one day and is down about 42% in 30 days, even as NEAR Intents volume is still rising. The token and the network are telling opposite stories. 🚨
Price is around $2.76 to $2.91, about 86% below its all-time high. NEAR Intents' average daily volume edged up to about $134M in November from $129M in October, but protocol earnings slipped to about $1.8M over the last 30 days, from $2.2M. 👀
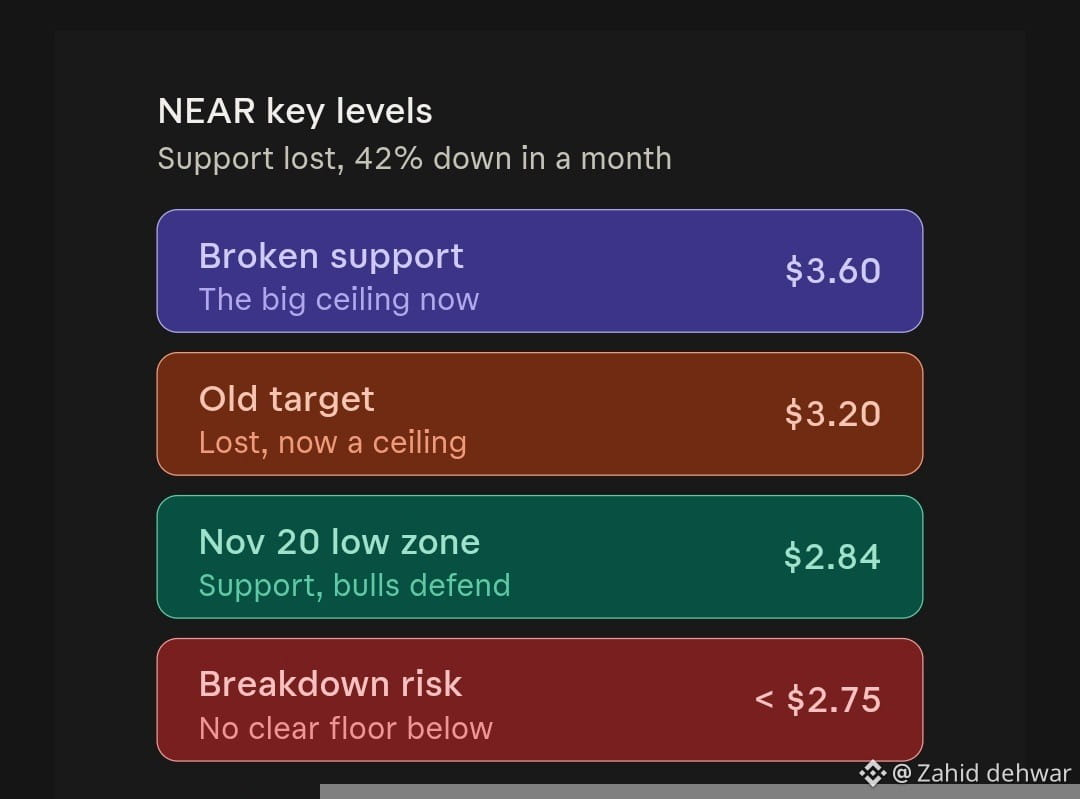
Levels I'm watching:
🟣 $3.60: broken support, the big ceiling now
🔴 $3.20: old target, lost, now a ceiling
🟢 $2.84: November 20 low zone, support, bulls must defend it
⚠️ Lose $2.75 and there's no clear floor below
The supply cut (a 36% lower issuance ceiling) is approved but rolls out slowly. The market clearly isn't paying for it yet.
My plan: no catching the knife. I want a daily close back above $3.20 before I get bullish, and I'm stepping aside if $2.75 breaks.
Capitulation or the start of a deeper fall? 👇
#Near #nearprotocol #crypto #cryptotrading #altcoins
@Wise_Analyze @News @ismeidy
{spot}(NEARUSDT)
$NEAR just lost 11% to 14% in one day and is down about 42% in 30 days, even as NEAR Intents volume is still rising. The token and the network are telling opposite stories. 🚨
Price is around $2.76 to $2.91, about 86% below its all-time high. NEAR Intents' average daily volume edged up to about $134M in November from $129M in October, but protocol earnings slipped to about $1.8M over the last 30 days, from $2.2M. 👀
Levels I'm watching:
🟣 $3.60: broken support, the big ceiling now
🔴 $3.20: old target, lost, now a ceiling
🟢 $2.84: November 20 low zone, support, bulls must defend it
⚠️ Lose $2.75 and there's no clear floor below
The supply cut (a 36% lower issuance ceiling) is approved but rolls out slowly. The market clearly isn't paying for it yet.
My plan: no catching the knife. I want a daily close back above $3.20 before I get bullish, and I'm stepping aside if $2.75 breaks.
Capitulation or the start of a deeper fall? 👇
#Near #nearprotocol #crypto #cryptotrading #altcoins
@Wise Analyze @BitEagle News @Ismeidy
Price is around $2.76 to $2.91, about 86% below its all-time high. NEAR Intents' average daily volume edged up to about $134M in November from $129M in October, but protocol earnings slipped to about $1.8M over the last 30 days, from $2.2M. 👀
Levels I'm watching:
🟣 $3.60: broken support, the big ceiling now
🔴 $3.20: old target, lost, now a ceiling
🟢 $2.84: November 20 low zone, support, bulls must defend it
⚠️ Lose $2.75 and there's no clear floor below
The supply cut (a 36% lower issuance ceiling) is approved but rolls out slowly. The market clearly isn't paying for it yet.
My plan: no catching the knife. I want a daily close back above $3.20 before I get bullish, and I'm stepping aside if $2.75 breaks.
Capitulation or the start of a deeper fall? 👇
#Near #nearprotocol #crypto #cryptotrading #altcoins
@Wise Analyze @BitEagle News @Ismeidy
1
677

·
--
$ETH Listen up guys, things are getting serious with ETH. That recent sluggishness is totally over—looks like a massive move is brewing.
Honestly feels like we're about to see a wild breakout. We either blast past previous highs or face a quick shakeout before the real pump.
Key levels to watch: immediate resistance is at $3,400. If we break and hold that, the next target is $3,700. For downside protection, keep your stop loss tight around $3,150.
Don't get left sleeping. Keep your eyes glued to the charts, manage your risk, and let's hear your predictions below!
#Ethereum #Altcoins
$ETH Listen up guys, things are getting serious with ETH. That recent sluggishness is totally over—looks like a massive move is brewing.
Honestly feels like we're about to see a wild breakout. We either blast past previous highs or face a quick shakeout before the real pump.
Key levels to watch: immediate resistance is at $3,400. If we break and hold that, the next target is $3,700. For downside protection, keep your stop loss tight around $3,150.
Don't get left sleeping. Keep your eyes glued to the charts, manage your risk, and let's hear your predictions below!
#Ethereum #Altcoins
Honestly feels like we're about to see a wild breakout. We either blast past previous highs or face a quick shakeout before the real pump.
Key levels to watch: immediate resistance is at $3,400. If we break and hold that, the next target is $3,700. For downside protection, keep your stop loss tight around $3,150.
Don't get left sleeping. Keep your eyes glued to the charts, manage your risk, and let's hear your predictions below!
#Ethereum #Altcoins
100

·
--
🚨🐋 $280.7 MILLION IN XRP JUST MOVED! 🐋🚨
An unknown entity just transferred a staggering amount of $XRP . 👀
Who’s behind the move? Exchange activity, institutional positioning, or something much bigger brewing? The crypto market is watching.
When hundreds of millions in XRP move, you pay attention. The next move could be worth watching. ⚡
KEEP YOUR EYES ON $XRP . 💎
#CryptoWhale #WhaleAlert #CryptoMarket #DigitalAssets #Altcoins
{future}(XRPUSDT)
🚨🐋 $280.7 MILLION IN XRP JUST MOVED! 🐋🚨
An unknown entity just transferred a staggering amount of $XRP . 👀
Who’s behind the move? Exchange activity, institutional positioning, or something much bigger brewing? The crypto market is watching.
When hundreds of millions in XRP move, you pay attention. The next move could be worth watching. ⚡
KEEP YOUR EYES ON $XRP . 💎
#CryptoWhale #WhaleAlert #CryptoMarket #DigitalAssets #Altcoins
An unknown entity just transferred a staggering amount of $XRP . 👀
Who’s behind the move? Exchange activity, institutional positioning, or something much bigger brewing? The crypto market is watching.
When hundreds of millions in XRP move, you pay attention. The next move could be worth watching. ⚡
KEEP YOUR EYES ON $XRP . 💎
#CryptoWhale #WhaleAlert #CryptoMarket #DigitalAssets #Altcoins
1
642

Article
$EVAA Defies Market Selloff With +471% Weekly Rally to $6.2476 — Next Push Above $6.66?🔥 $EVAA Defies Market Crash With +471% Weekly Surge to $6.2476 — Key Pullback Levels! 🚀
While the broader crypto market faces heavy selling pressure, EVAA Protocol ($EVAA) continues to show massive relative strength—climbing from its $1.0517 base up to a $6.6650 local high with $358.87M USDT in 24h futures volume!
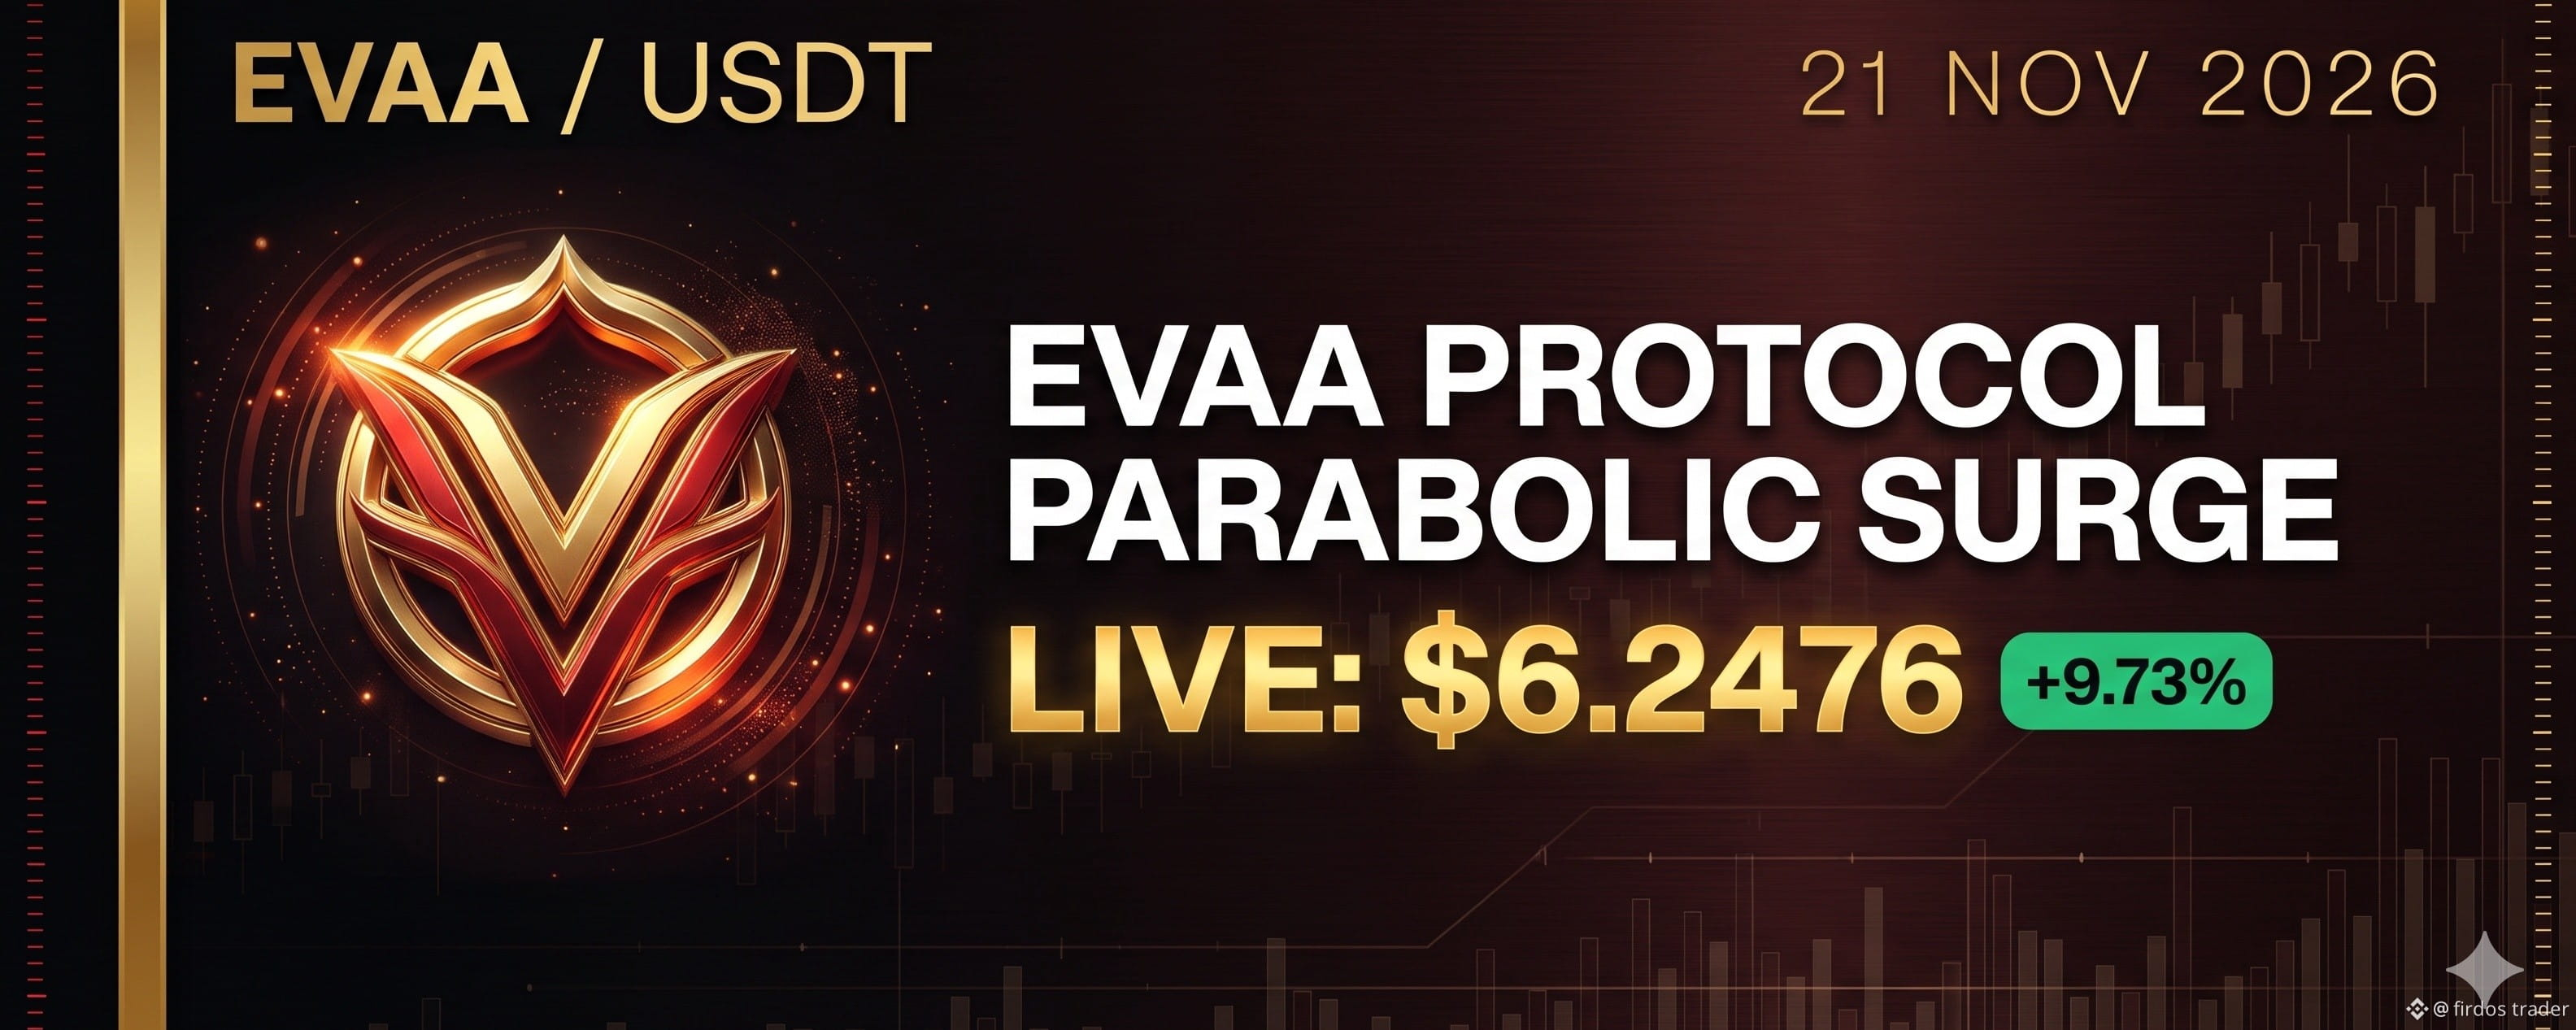
Live Price: $6.2476 (Mark Price: $6.2471 | +9.73%)
Trade Setup (Pullback Long):
• Entry Zone: $5.6500 – $5.9500 (1H Support retest zone, avoid chasing near $6.66 resistance)
• TP1: $6.6650 (Recent swing high)
• TP2: $7.2000
• Final Target: $7.8500+
• Stop Loss: $5.2500
Market Breakdown:
On the Daily chart, MACD (+0.5093) remains strongly bullish with +981% 30-day momentum. On the 1H chart, price is cooling off slightly below $6.6650 as short-term MACD (-0.0421) resets. Holding above the $5.65 – $5.95 demand zone keeps buyers in control for a clean breakout above $6.6650.
Parabolic movers carry sharp two-way volatility—wait patiently for dips into support and always manage risk with a strict Stop Loss.
Is $EVAA heading for $7.50+ next or due for a deeper pullback to $5.70? Share your view below 👇
---
Found this chart & setup useful?
Hit LIKE ❤️ to support the post and FOLLOW @firdostrader 🔔 for daily real-time crypto setups!
{future}(EVAAUSDT)
$EVAA #EVAAProtoco
#EVAAUSDT #altcoins
$EVAA Defies Market Selloff With +471% Weekly Rally to $6.2476 — Next Push Above $6.66?
🔥 $EVAA Defies Market Crash With +471% Weekly Surge to $6.2476 — Key Pullback Levels! 🚀
While the broader crypto market faces heavy selling pressure, EVAA Protocol ($EVAA ) continues to show massive relative strength—climbing from its $1.0517 base up to a $6.6650 local high with $358.87M USDT in 24h futures volume!
Live Price: $6.2476 (Mark Price: $6.2471 | +9.73%)
Trade Setup (Pullback Long):
• Entry Zone: $5.6500 – $5.9500 (1H Support retest zone, avoid chasing near $6.66 resistance)
• TP1: $6.6650 (Recent swing high)
• TP2: $7.2000
• Final Target: $7.8500+
• Stop Loss: $5.2500
Market Breakdown:
On the Daily chart, MACD (+0.5093) remains strongly bullish with +981% 30-day momentum. On the 1H chart, price is cooling off slightly below $6.6650 as short-term MACD (-0.0421) resets. Holding above the $5.65 – $5.95 demand zone keeps buyers in control for a clean breakout above $6.6650.
Parabolic movers carry sharp two-way volatility—wait patiently for dips into support and always manage risk with a strict Stop Loss.
Is $EVAA heading for $7.50+ next or due for a deeper pullback to $5.70? Share your view below 👇
---
Found this chart & setup useful?
Hit LIKE ❤️ to support the post and FOLLOW @firdostrader 🔔 for daily real-time crypto setups!
$EVAA #EVAAProtoco
#EVAAUSDT #altcoins
While the broader crypto market faces heavy selling pressure, EVAA Protocol ($EVAA ) continues to show massive relative strength—climbing from its $1.0517 base up to a $6.6650 local high with $358.87M USDT in 24h futures volume!
Live Price: $6.2476 (Mark Price: $6.2471 | +9.73%)
Trade Setup (Pullback Long):
• Entry Zone: $5.6500 – $5.9500 (1H Support retest zone, avoid chasing near $6.66 resistance)
• TP1: $6.6650 (Recent swing high)
• TP2: $7.2000
• Final Target: $7.8500+
• Stop Loss: $5.2500
Market Breakdown:
On the Daily chart, MACD (+0.5093) remains strongly bullish with +981% 30-day momentum. On the 1H chart, price is cooling off slightly below $6.6650 as short-term MACD (-0.0421) resets. Holding above the $5.65 – $5.95 demand zone keeps buyers in control for a clean breakout above $6.6650.
Parabolic movers carry sharp two-way volatility—wait patiently for dips into support and always manage risk with a strict Stop Loss.
Is $EVAA heading for $7.50+ next or due for a deeper pullback to $5.70? Share your view below 👇
---
Found this chart & setup useful?
Hit LIKE ❤️ to support the post and FOLLOW @firdostrader 🔔 for daily real-time crypto setups!
$EVAA #EVAAProtoco
#EVAAUSDT #altcoins
beatriz 1533:
creo que va a buscar la piscina de stop loss y liquidación para poder subir con fuerza. sobre todo si alguna ballena (institución financiera) le ve potencial. de ser así tendrías que hacer tu entrada en long dónde menciona el comentario y tratar de que la orden sea condicional y no limit orden
2
1
1.2k
$PIEVERSE just smashed its $3.60 ATH with a +38.6% surge to $4.27 as 87% of liquidations wiped out shorts. Trend is strongly bullish—don't blind short or chase tops, watch the breakout retest. 👀
Key Level
🟢 Bullish above $3.60
Trade Setup (Pullback Long)
🟢 Entry Zone: $3.65 – $3.85
🎯 Targets: $4.27 / $4.65 / $5.10
⛔ Stop Loss: $3.38
Use low leverage (3x–5x), wait for support retest, and always manage your risk.
Check live chart here 👉 $PIEVERSE
@firdostrader
#PIEVERSEUSDT #PIEVERSETrading #CryptoTrading. #Altcoins
{future}(PIEVERSEUSDT)
$PIEVERSE just smashed its $3.60 ATH with a +38.6% surge to $4.27 as 87% of liquidations wiped out shorts. Trend is strongly bullish—don't blind short or chase tops, watch the breakout retest. 👀
Key Level
🟢 Bullish above $3.60
Trade Setup (Pullback Long)
🟢 Entry Zone: $3.65 – $3.85
🎯 Targets: $4.27 / $4.65 / $5.10
⛔ Stop Loss: $3.38
Use low leverage (3x–5x), wait for support retest, and always manage your risk.
Check live chart here 👉 $PIEVERSE
@firdos trader
#PIEVERSEUSDT #PIEVERSETrading #CryptoTrading. #Altcoins
Key Level
🟢 Bullish above $3.60
Trade Setup (Pullback Long)
🟢 Entry Zone: $3.65 – $3.85
🎯 Targets: $4.27 / $4.65 / $5.10
⛔ Stop Loss: $3.38
Use low leverage (3x–5x), wait for support retest, and always manage your risk.
Check live chart here 👉 $PIEVERSE
@firdos trader
#PIEVERSEUSDT #PIEVERSETrading #CryptoTrading. #Altcoins
380

{alpha}(560x7c8217517ed4711fe2deccdfeffe8d906b9ae11f)
🚀 Is $BLESS Preparing for Another Big Move? Or Is a Deeper Correction Coming? 👀
$BLESS has attracted serious market attention after a powerful rally, but sellers are now putting pressure on the price.
📊 Latest Market Snapshot:
- Price: Around $0.01203
- 24H Change: -10.93%
- 24H High: $0.02185
- 24H Low: $0.01023
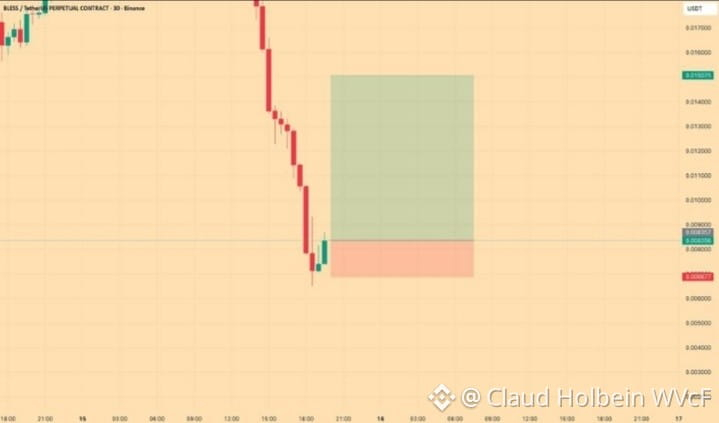
🟢 Key Support: $0.0102 – $0.0109
🔴 Resistance: $0.0133 – $0.0144
🐂 Bullish Scenario: A recovery above $0.0144 could open the door toward $0.0160 and $0.0190.
🐻 Bearish Scenario: Losing $0.0102 could trigger another wave of selling.
Despite the recent correction, BLESS remains an interesting token to watch. The next move could be important!
🔥 The big question: Is this a healthy pullback before another rally, or are sellers taking control?
Are you holding $BLESS or waiting for a better entry?
Share your prediction below! 👇
#BLESS #cryptouniverseofficial #BİNANCE #Altcoins
🚀 Is $BLESS Preparing for Another Big Move? Or Is a Deeper Correction Coming? 👀
$BLESS has attracted serious market attention after a powerful rally, but sellers are now putting pressure on the price.
📊 Latest Market Snapshot:
- Price: Around $0.01203
- 24H Change: -10.93%
- 24H High: $0.02185
- 24H Low: $0.01023
🟢 Key Support: $0.0102 – $0.0109
🔴 Resistance: $0.0133 – $0.0144
🐂 Bullish Scenario: A recovery above $0.0144 could open the door toward $0.0160 and $0.0190.
🐻 Bearish Scenario: Losing $0.0102 could trigger another wave of selling.
Despite the recent correction, BLESS remains an interesting token to watch. The next move could be important!
🔥 The big question: Is this a healthy pullback before another rally, or are sellers taking control?
Are you holding $BLESS or waiting for a better entry?
Share your prediction below! 👇
#BLESS #cryptouniverseofficial #BİNANCE #Altcoins
🚀 Is $BLESS Preparing for Another Big Move? Or Is a Deeper Correction Coming? 👀
$BLESS has attracted serious market attention after a powerful rally, but sellers are now putting pressure on the price.
📊 Latest Market Snapshot:
- Price: Around $0.01203
- 24H Change: -10.93%
- 24H High: $0.02185
- 24H Low: $0.01023
🟢 Key Support: $0.0102 – $0.0109
🔴 Resistance: $0.0133 – $0.0144
🐂 Bullish Scenario: A recovery above $0.0144 could open the door toward $0.0160 and $0.0190.
🐻 Bearish Scenario: Losing $0.0102 could trigger another wave of selling.
Despite the recent correction, BLESS remains an interesting token to watch. The next move could be important!
🔥 The big question: Is this a healthy pullback before another rally, or are sellers taking control?
Are you holding $BLESS or waiting for a better entry?
Share your prediction below! 👇
#BLESS #cryptouniverseofficial #BİNANCE #Altcoins

338

·
--
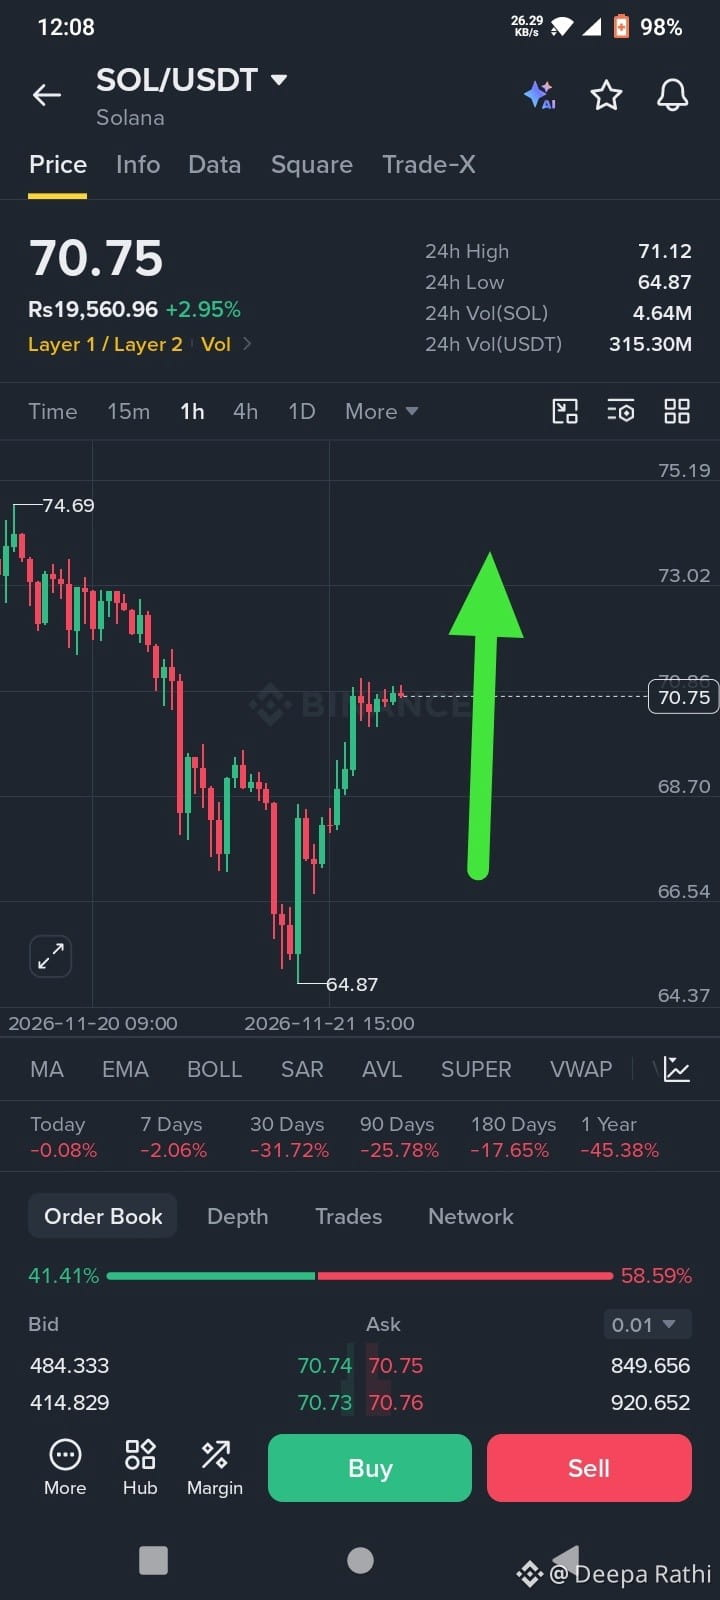
🚀 $SOL READY FOR ANOTHER BIG MOVE? 🔥
SOL is showing strong recovery after bouncing from $64.87 and climbing back toward $70.75.
Bulls are trying to regain control, but can SOL break above the $71.12 resistance? 👀
🎯 Next target: $73+
🐂 Bullish breakout or another rejection?
What do you think? $75 coming soon or another dip first?
👇 Drop your prediction!
#Solana #Crypto #Altcoins #BinanceSquare #Trading
🚀 $SOL READY FOR ANOTHER BIG MOVE? 🔥
SOL is showing strong recovery after bouncing from $64.87 and climbing back toward $70.75.
Bulls are trying to regain control, but can SOL break above the $71.12 resistance? 👀
🎯 Next target: $73+
🐂 Bullish breakout or another rejection?
What do you think? $75 coming soon or another dip first?
👇 Drop your prediction!
#Solana #Crypto #Altcoins #BinanceSquare #Trading
SOL is showing strong recovery after bouncing from $64.87 and climbing back toward $70.75.
Bulls are trying to regain control, but can SOL break above the $71.12 resistance? 👀
🎯 Next target: $73+
🐂 Bullish breakout or another rejection?
What do you think? $75 coming soon or another dip first?
👇 Drop your prediction!
#Solana #Crypto #Altcoins #BinanceSquare #Trading
Easypay link:
Bro first wait for 65
1
399
Log in to explore more content
Join global crypto users on Binance Square
⚡️ Get latest and useful information about crypto.
💬 Trusted by the world’s largest crypto exchange.
👍 Discover real insights from verified creators.
Email / Phone number
Trending Topics
1
#BTCReboundsAbove$60KAmidWhaleDipBuying
16,364 views
136 Discussing
2
#SolanaSets2027RoadmapToDoubleComputeCapacity
2,988 views
153 Discussing
3
#CaliforniaNvidiaProbeExaminesPotentialCriminalViolations
1,978 views
41 Discussing
4
#BlackRockLaunchesHKDollarDigitalLiquidityFund
4,508 views
159 Discussing
5
#NvidiaLoses$2.7TrillionInMonthAndAHalf
51,060 views
245 Discussing
6
#GlobalStocksFaceLongestLosingStreakSince2023
437,302 views
2,861 Discussing
7
#BlackRockIBITPostsRecord$541MSingleDayOutflow
67,293 views
157 Discussing
8
#AnthropicPlungesTowardIPOPriceonDay2
238,129 views
1,872 Discussing
9
#TwentyOneCapitalAdds172.25BTC
117,433 views
1,242 Discussing
10
#HKBillWouldExcludeTokenizedDepositsFromVirtualAssets
15,306 views
88 Discussing