
#beat
beat
8.3M views
37,395 Discussing
Hot
Latest

🦈 $BEAT SHORT POSITION UNLOCKS CLEAN LIQUIDITY SWEEP AS SELLERS DOMINATE ORDER FLOW 📉
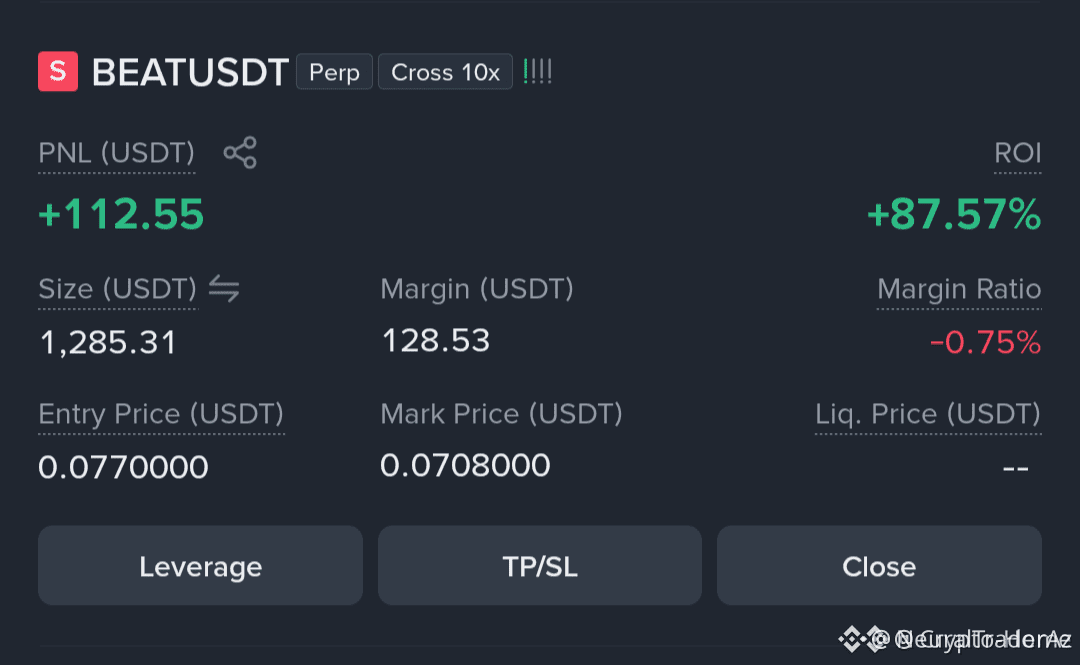
Entry: 0.077 ⚡
Institutional order flow on $BEAT showed clear distribution near resistance, allowing a precise short entry at 0.077 as sellers overwhelmed the order book. 📊 Momentum accelerated rapidly through the range lows, driving price down toward 0.07078 while resting liquidity got thoroughly cleaned out. 🌊
With the position currently deeply green and trailing stops managing risk, the focus shifts to whether structural support will hold or fracture completely. 💡 Are you locking in profits here or letting this institutional downward momentum run its course? 👇
⚠️ Not financial advice. Always manage your risk. 🛡️
🏷️ #BEAT #ShortSetup #SmartMoney #OrderFlow
🦈 💰
🦈 $BEAT SHORT POSITION UNLOCKS CLEAN LIQUIDITY SWEEP AS SELLERS DOMINATE ORDER FLOW 📉
Entry: 0.077 ⚡
Institutional order flow on $BEAT showed clear distribution near resistance, allowing a precise short entry at 0.077 as sellers overwhelmed the order book. 📊 Momentum accelerated rapidly through the range lows, driving price down toward 0.07078 while resting liquidity got thoroughly cleaned out. 🌊
With the position currently deeply green and trailing stops managing risk, the focus shifts to whether structural support will hold or fracture completely. 💡 Are you locking in profits here or letting this institutional downward momentum run its course? 👇
⚠️ Not financial advice. Always manage your risk. 🛡️
🏷️ #BEAT #ShortSetup #SmartMoney #OrderFlow
🦈 💰
Entry: 0.077 ⚡
Institutional order flow on $BEAT showed clear distribution near resistance, allowing a precise short entry at 0.077 as sellers overwhelmed the order book. 📊 Momentum accelerated rapidly through the range lows, driving price down toward 0.07078 while resting liquidity got thoroughly cleaned out. 🌊
With the position currently deeply green and trailing stops managing risk, the focus shifts to whether structural support will hold or fracture completely. 💡 Are you locking in profits here or letting this institutional downward momentum run its course? 👇
⚠️ Not financial advice. Always manage your risk. 🛡️
🏷️ #BEAT #ShortSetup #SmartMoney #OrderFlow
🦈 💰
9

·
--
🚨 $BEAT SHORT BREAKING DOWN AS SELLERS FLOOD THE ORDER BOOK WITH AGGRESSIVE VOLUME 📉
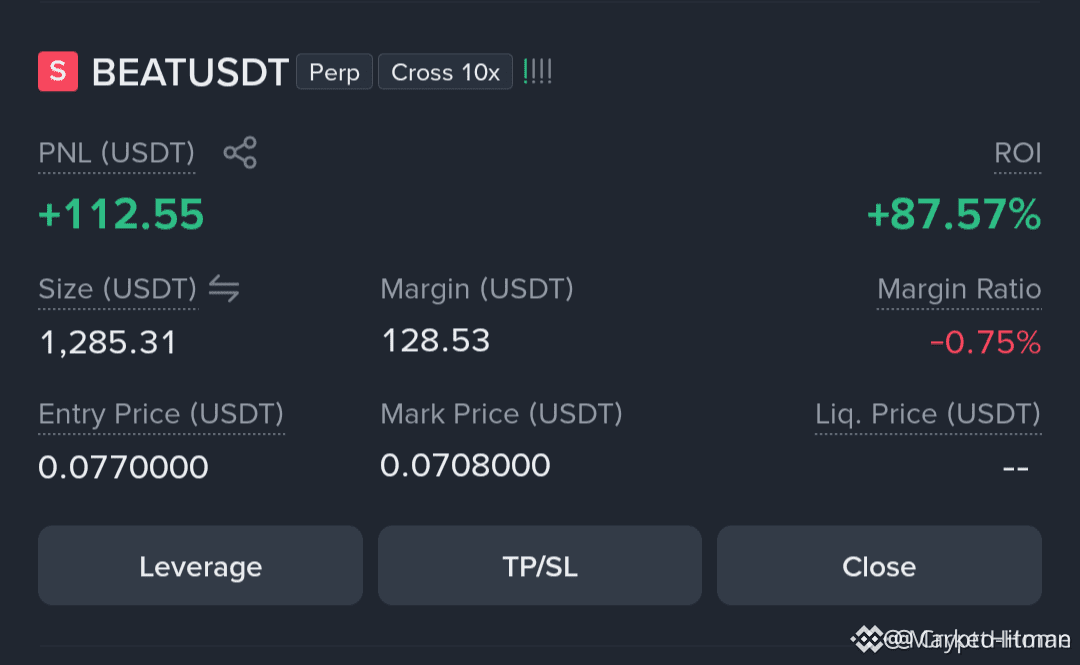
Entry: 0.077 ⚡
This quick scalp setup turned into an absolute momentum slide as bears seized total control of the order flow. ⚡ Dropping cleanly from the 0.077 resistance rejection, momentum indicators show accelerating downside pressure with zero buyer defense in sight. 📊
Instead of rushing out, I am letting the trade breathe and tracking how liquidity behaves near current lows. 🦈 Are you locking in these explosive gains right now or holding for a deeper flush? 👇
⚠️ Not financial advice. Always manage your risk. 🛡️
🏷️ #BEAT #ShortSetup #Momentum #Crypto
🔥 💎
🚨 $BEAT SHORT BREAKING DOWN AS SELLERS FLOOD THE ORDER BOOK WITH AGGRESSIVE VOLUME 📉
Entry: 0.077 ⚡
This quick scalp setup turned into an absolute momentum slide as bears seized total control of the order flow. ⚡ Dropping cleanly from the 0.077 resistance rejection, momentum indicators show accelerating downside pressure with zero buyer defense in sight. 📊
Instead of rushing out, I am letting the trade breathe and tracking how liquidity behaves near current lows. 🦈 Are you locking in these explosive gains right now or holding for a deeper flush? 👇
⚠️ Not financial advice. Always manage your risk. 🛡️
🏷️ #BEAT #ShortSetup #Momentum #Crypto
🔥 💎
Entry: 0.077 ⚡
This quick scalp setup turned into an absolute momentum slide as bears seized total control of the order flow. ⚡ Dropping cleanly from the 0.077 resistance rejection, momentum indicators show accelerating downside pressure with zero buyer defense in sight. 📊
Instead of rushing out, I am letting the trade breathe and tracking how liquidity behaves near current lows. 🦈 Are you locking in these explosive gains right now or holding for a deeper flush? 👇
⚠️ Not financial advice. Always manage your risk. 🛡️
🏷️ #BEAT #ShortSetup #Momentum #Crypto
🔥 💎
16
🦈 $BEAT , $MYX , AND $TRADOOR REVISITING CRITICAL INSTITUTIONAL DEMAND ZONES AGAIN! ⚡
Entry: 11 ⚡
Smart money is methodically revisiting historical demand zones across $BEAT at 11, $MYX at 17, and $TRADOOR at 10. These repeated retests often flush late retail longs while institutional algorithms quietly absorb resting liquidity before the next impulse phase. 🌊
Volume profiles across these key nodes indicate persistent structural interest rather than random distribution. When high-timeframe inflection points get defended multiple times, the subsequent expansion tends to be swift and aggressive. 📊
💡 Which of these retest zones do you expect to print the cleanest impulsive reversal first? 👇
⚠️ Not financial advice. Always manage your risk. 🛡️
🏷️ #BEAT #SmartMoney #Accumulation #Crypto
🦈 💰
🦈 $BEAT , $MYX , AND $TRADOOR REVISITING CRITICAL INSTITUTIONAL DEMAND ZONES AGAIN! ⚡
Entry: 11 ⚡
Smart money is methodically revisiting historical demand zones across $BEAT at 11, $MYX at 17, and $TRADOOR at 10. These repeated retests often flush late retail longs while institutional algorithms quietly absorb resting liquidity before the next impulse phase. 🌊
Volume profiles across these key nodes indicate persistent structural interest rather than random distribution. When high-timeframe inflection points get defended multiple times, the subsequent expansion tends to be swift and aggressive. 📊
💡 Which of these retest zones do you expect to print the cleanest impulsive reversal first? 👇
⚠️ Not financial advice. Always manage your risk. 🛡️
🏷️ #BEAT #SmartMoney #Accumulation #Crypto
🦈 💰
Entry: 11 ⚡
Smart money is methodically revisiting historical demand zones across $BEAT at 11, $MYX at 17, and $TRADOOR at 10. These repeated retests often flush late retail longs while institutional algorithms quietly absorb resting liquidity before the next impulse phase. 🌊
Volume profiles across these key nodes indicate persistent structural interest rather than random distribution. When high-timeframe inflection points get defended multiple times, the subsequent expansion tends to be swift and aggressive. 📊
💡 Which of these retest zones do you expect to print the cleanest impulsive reversal first? 👇
⚠️ Not financial advice. Always manage your risk. 🛡️
🏷️ #BEAT #SmartMoney #Accumulation #Crypto
🦈 💰
41

🚨 $BEAT , $MYX , AND $TRADOOR REVISIT FAMILIAR INFLECTION POINTS FOR A MAJOR SETUP 💥
Entry: 11 ⚡
Patience is the ultimate edge when the market brings legacy support zones back to the table. Seeing $BEAT back at 11 alongside $MYX at 17 and $TRADOOR at 10 tells me smart money is quietly testing old demand blocks. 📊
Volume behavior at these exact retests dictates whether buyers are ready to step in or if patience requires a bit more waiting. When historical levels see repeat bids, structural accumulation is usually brewing beneath the surface. ⚡
Which of these three assets are you watching closest for a definitive momentum reclaim today? 🤔
⚠️ Not financial advice. Always manage your risk. 🛡️
🏷️ #BEAT #MYX #TRADOOR #Accumulation #Crypto
🔥 💎
🚨 $BEAT , $MYX , AND $TRADOOR REVISIT FAMILIAR INFLECTION POINTS FOR A MAJOR SETUP 💥
Entry: 11 ⚡
Patience is the ultimate edge when the market brings legacy support zones back to the table. Seeing $BEAT back at 11 alongside $MYX at 17 and $TRADOOR at 10 tells me smart money is quietly testing old demand blocks. 📊
Volume behavior at these exact retests dictates whether buyers are ready to step in or if patience requires a bit more waiting. When historical levels see repeat bids, structural accumulation is usually brewing beneath the surface. ⚡
Which of these three assets are you watching closest for a definitive momentum reclaim today? 🤔
⚠️ Not financial advice. Always manage your risk. 🛡️
🏷️ #BEAT #MYX #TRADOOR #Accumulation #Crypto
🔥 💎
Entry: 11 ⚡
Patience is the ultimate edge when the market brings legacy support zones back to the table. Seeing $BEAT back at 11 alongside $MYX at 17 and $TRADOOR at 10 tells me smart money is quietly testing old demand blocks. 📊
Volume behavior at these exact retests dictates whether buyers are ready to step in or if patience requires a bit more waiting. When historical levels see repeat bids, structural accumulation is usually brewing beneath the surface. ⚡
Which of these three assets are you watching closest for a definitive momentum reclaim today? 🤔
⚠️ Not financial advice. Always manage your risk. 🛡️
🏷️ #BEAT #MYX #TRADOOR #Accumulation #Crypto
🔥 💎
48

·
--
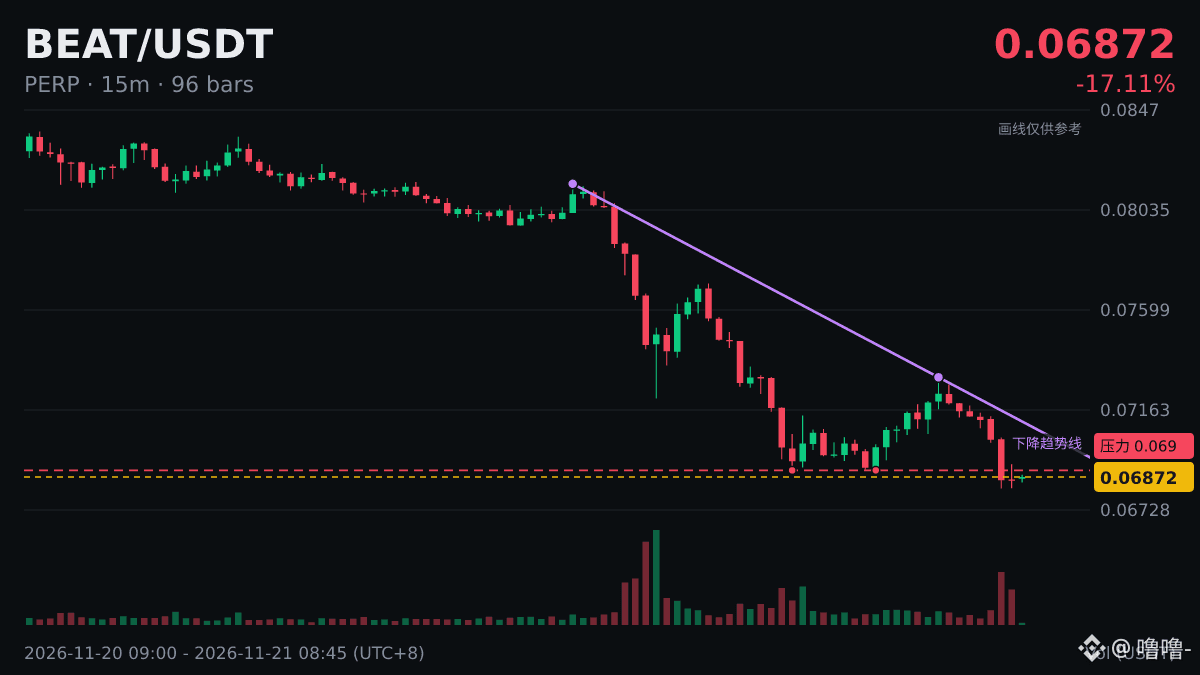
$BEAT hits a 7-day low of 0.06878, breaking below the previous low of 0.069.
The sell-off is here. Keep leverage low so you can stay calm as prices fall. How much further can the bears drive it down?
#BEAT
$BEAT hits a 7-day low of 0.06878, breaking below the previous low of 0.069.
The sell-off is here. Keep leverage low so you can stay calm as prices fall. How much further can the bears drive it down?
#BEAT
The sell-off is here. Keep leverage low so you can stay calm as prices fall. How much further can the bears drive it down?
#BEAT
8

·
--
🐳 Funds note:
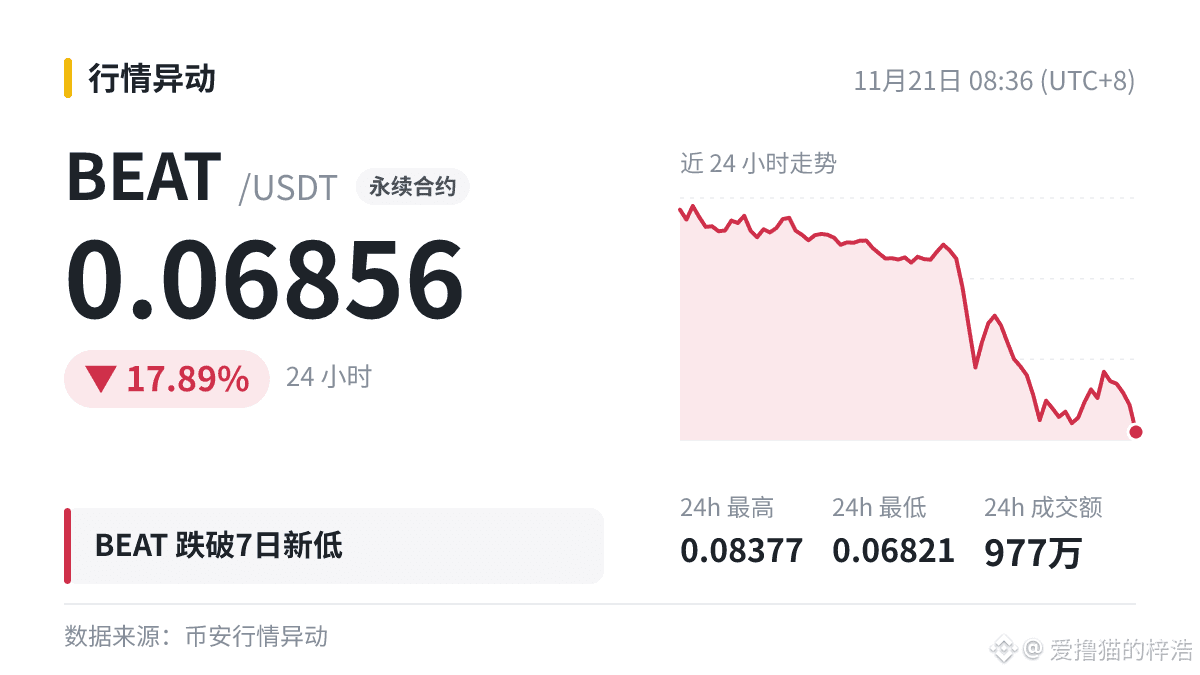
$BEAT 7 hit a new daily low at 0.06856, below the previous low of 0.069, down 17.89% in 24h.
There’s no meaningful buying support near the new low for now, and large orders are mostly pulling out. No rush to buy.
Which way do you think it’ll go? Share your thoughts in the comments.
#BEAT
This is not investment advice. Invest at your own risk.
🐳 Funds note:
$BEAT 7 hit a new daily low at 0.06856, below the previous low of 0.069, down 17.89% in 24h.
There’s no meaningful buying support near the new low for now, and large orders are mostly pulling out. No rush to buy.
Which way do you think it’ll go? Share your thoughts in the comments.
#BEAT
This is not investment advice. Invest at your own risk.
$BEAT 7 hit a new daily low at 0.06856, below the previous low of 0.069, down 17.89% in 24h.
There’s no meaningful buying support near the new low for now, and large orders are mostly pulling out. No rush to buy.
Which way do you think it’ll go? Share your thoughts in the comments.
#BEAT
This is not investment advice. Invest at your own risk.
42

·
--
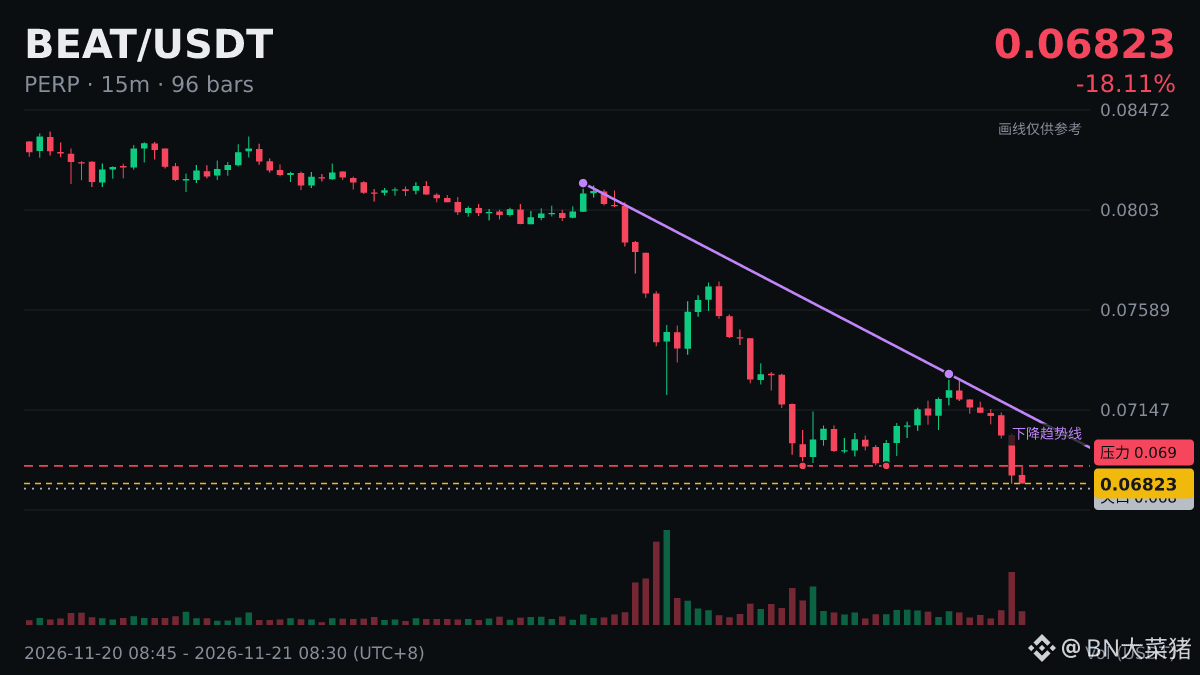
$BEAT broke below the 7-day low: current price 0.06834, previous low 0.069.
After the breakdown, watch two things:
Will the previous low of 0.069 turn from support into resistance (will a rebound fail to break above it)?
Was there a spike in volume during the breakdown? A low-volume break could just be a bear trap.
Do you think the market overreacted?
#BEAT
$BEAT broke below the 7-day low: current price 0.06834, previous low 0.069.
After the breakdown, watch two things:
Will the previous low of 0.069 turn from support into resistance (will a rebound fail to break above it)?
Was there a spike in volume during the breakdown? A low-volume break could just be a bear trap.
Do you think the market overreacted?
#BEAT
After the breakdown, watch two things:
Will the previous low of 0.069 turn from support into resistance (will a rebound fail to break above it)?
Was there a spike in volume during the breakdown? A low-volume break could just be a bear trap.
Do you think the market overreacted?
#BEAT
44

·
--
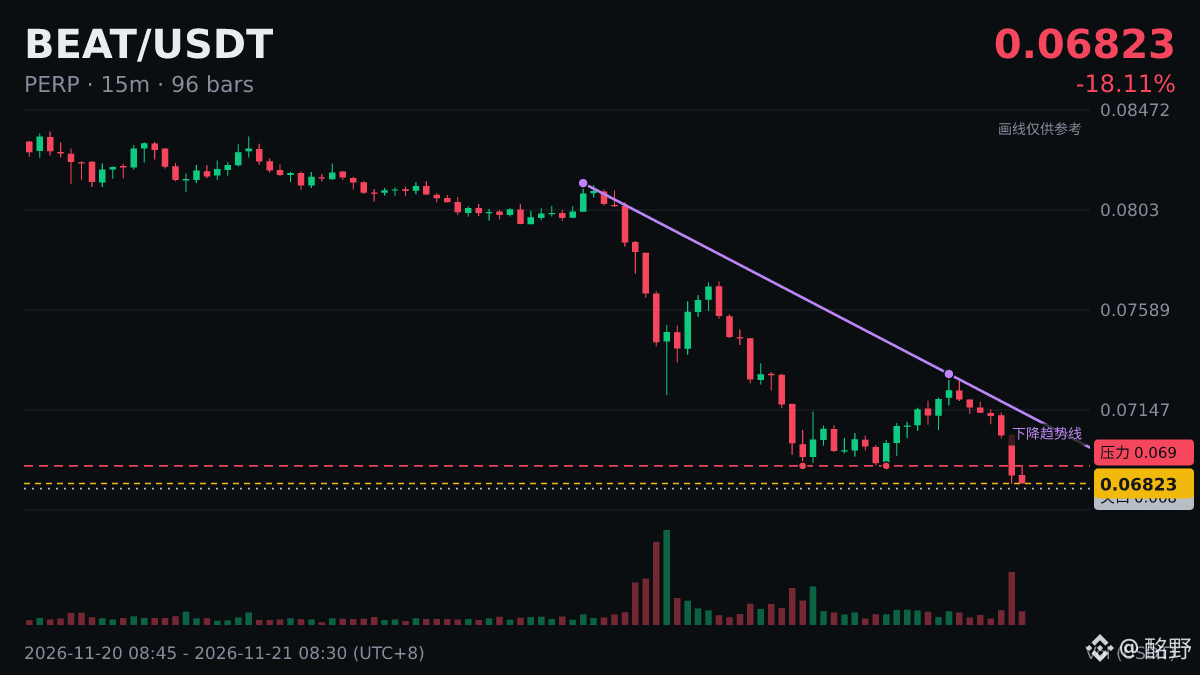
$BEAT hit a 7-day low of 0.06823 🫠
The previous low was 0.069: there's no stopping it now.
Me buying the dip: turns out I wasn't even near the bottom.
One bearish candle later, lunch went from an extra chicken leg to plain rice.
Like this post, and let's chat when the next market move comes.
#BEAT
$BEAT hit a 7-day low of 0.06823 🫠
The previous low was 0.069: there's no stopping it now.
Me buying the dip: turns out I wasn't even near the bottom.
One bearish candle later, lunch went from an extra chicken leg to plain rice.
Like this post, and let's chat when the next market move comes.
#BEAT
The previous low was 0.069: there's no stopping it now.
Me buying the dip: turns out I wasn't even near the bottom.
One bearish candle later, lunch went from an extra chicken leg to plain rice.
Like this post, and let's chat when the next market move comes.
#BEAT
52

·
--
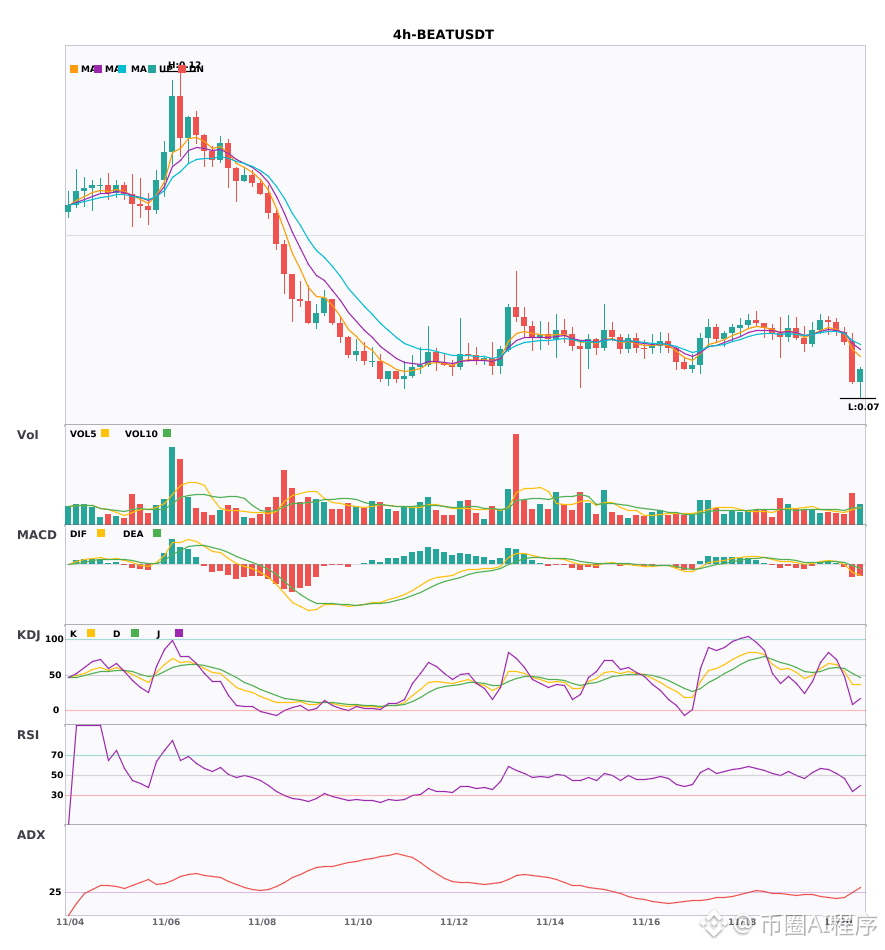
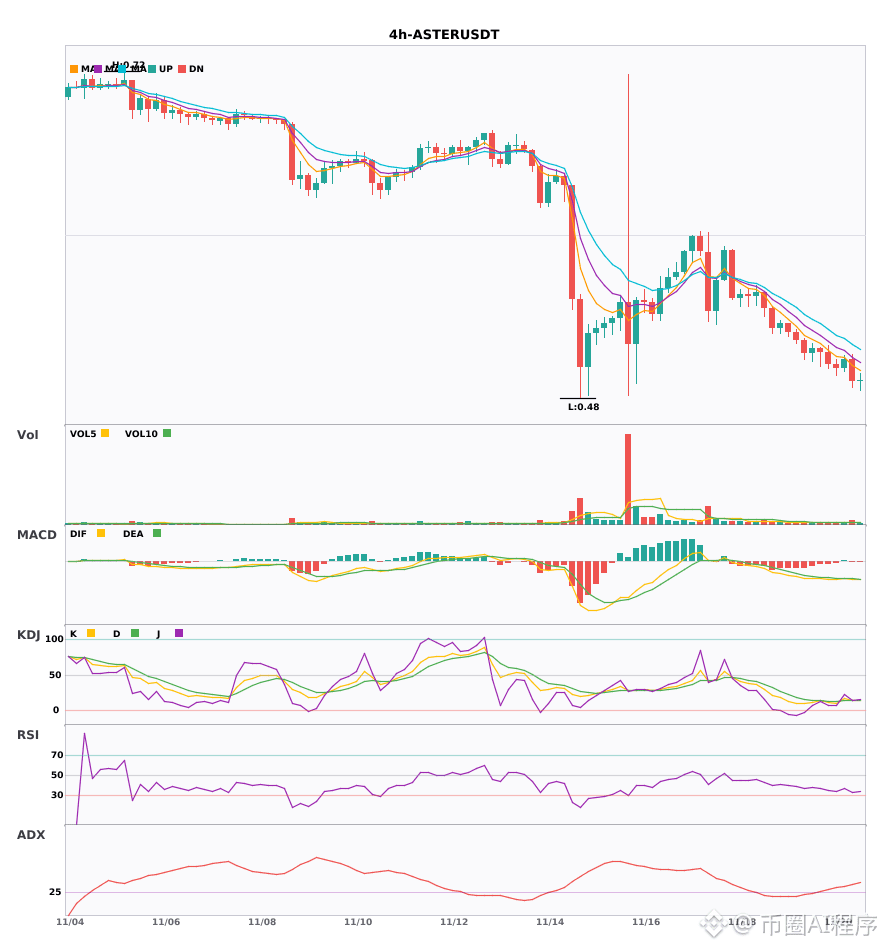
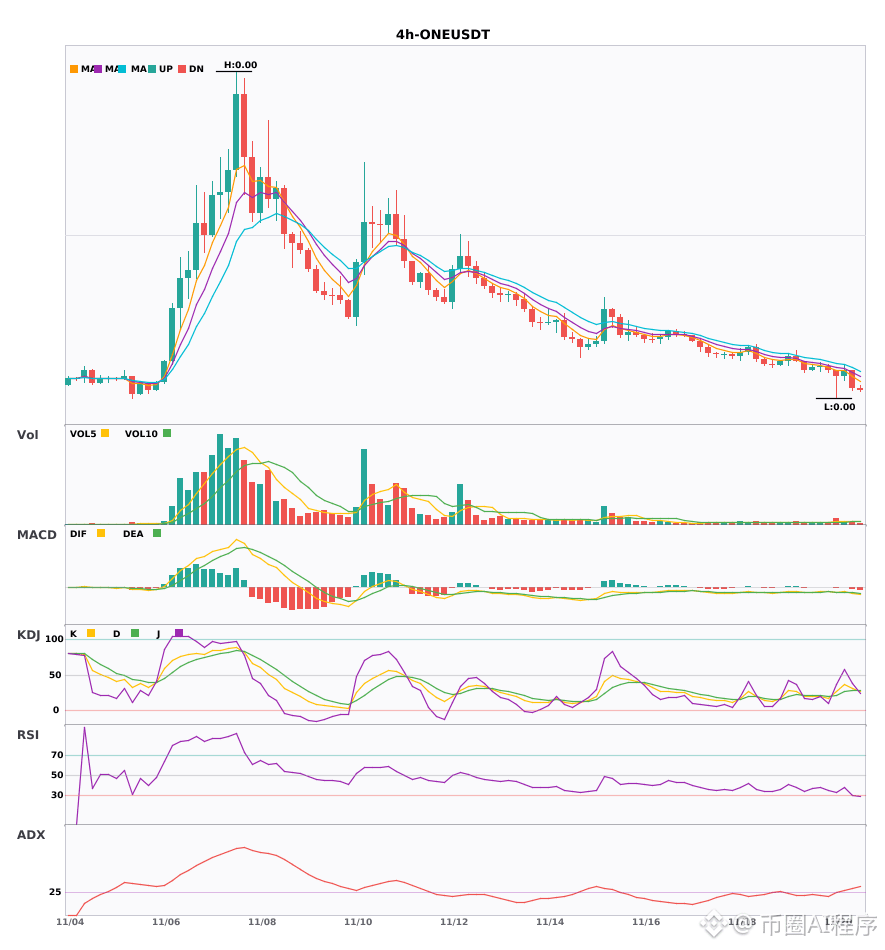
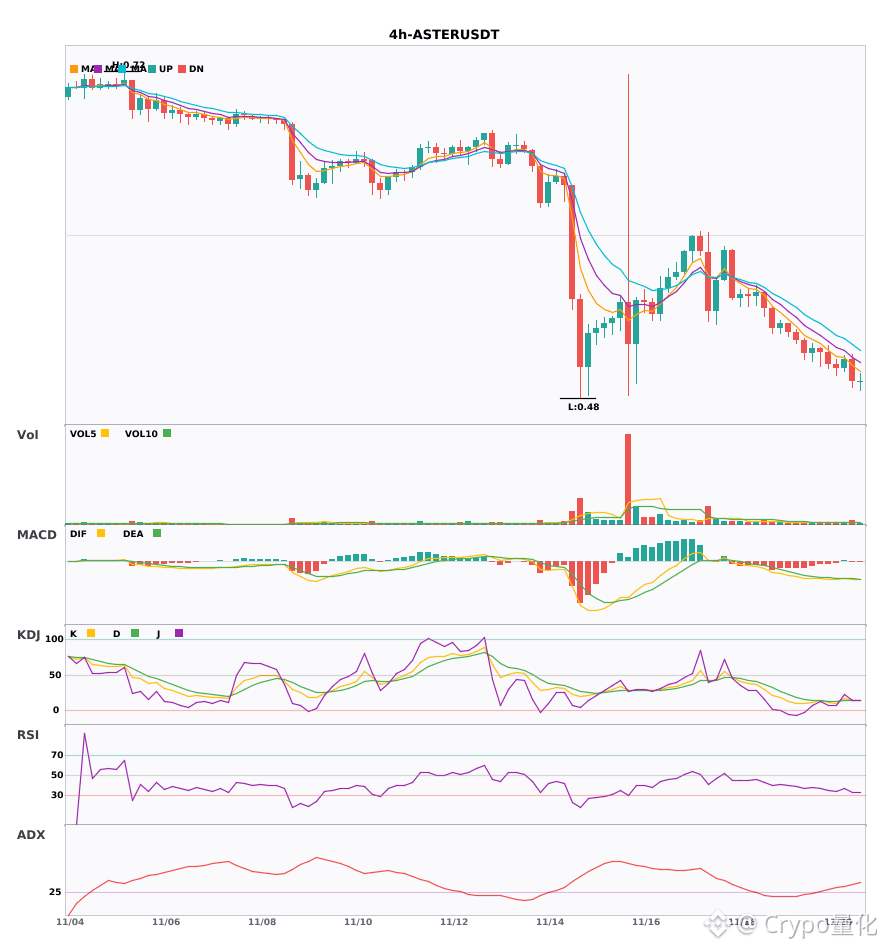
$BEAT $ASTER $ONE 4-hour bearish death cross, daily chart confirms downtrend 🔥
════════════════════
🟢 $BEAT 4-hour bearish signal
⚠️Technical analysis: 4-hour bearish + daily bearish confluence confirmed! MACD green bars continue to expand, momentum is strengthening, EMAs are in a bearish alignment and diverging downward, and volume has increased by about 2x—a bearish confluence sell signal.
════════════════════
🟢 $ASTER 4-hour bearish signal
⚠️Technical analysis: 4-hour bearish + daily bearish confluence confirmed! MACD death cross below zero, moving averages in a bearish alignment diverging downward, KDJ oversold, volume up 1.5x.
════════════════════
🟢 $ONE 4-hour bearish signal
⚠️Technical analysis: Daily bearish + 4-hour bearish confluence confirmed! After the 4-hour MACD death cross, bearish momentum accelerates; moving averages diverge downward in a bearish alignment, and KDJ is weak, with K not crossing above D. Bears have the advantage.
════════════════════
🔔 Follow for first-hand market updates 🔔
#多周期共振 #BEAT #ASTER #ONE
📌 When trading, pay attention to whether the candlestick pattern matches.
$BEAT $ASTER $ONE 4-hour bearish death cross, daily chart confirms downtrend 🔥
════════════════════
🟢 $BEAT 4-hour bearish signal
⚠️Technical analysis: 4-hour bearish + daily bearish confluence confirmed! MACD green bars continue to expand, momentum is strengthening, EMAs are in a bearish alignment and diverging downward, and volume has increased by about 2x—a bearish confluence sell signal.
════════════════════
🟢 $ASTER 4-hour bearish signal
⚠️Technical analysis: 4-hour bearish + daily bearish confluence confirmed! MACD death cross below zero, moving averages in a bearish alignment diverging downward, KDJ oversold, volume up 1.5x.
════════════════════
🟢 $ONE 4-hour bearish signal
⚠️Technical analysis: Daily bearish + 4-hour bearish confluence confirmed! After the 4-hour MACD death cross, bearish momentum accelerates; moving averages diverge downward in a bearish alignment, and KDJ is weak, with K not crossing above D. Bears have the advantage.
════════════════════
🔔 Follow for first-hand market updates 🔔
#多周期共振 #BEAT #ASTER #ONE
📌 When trading, pay attention to whether the candlestick pattern matches.
════════════════════
🟢 $BEAT 4-hour bearish signal
⚠️Technical analysis: 4-hour bearish + daily bearish confluence confirmed! MACD green bars continue to expand, momentum is strengthening, EMAs are in a bearish alignment and diverging downward, and volume has increased by about 2x—a bearish confluence sell signal.
════════════════════
🟢 $ASTER 4-hour bearish signal
⚠️Technical analysis: 4-hour bearish + daily bearish confluence confirmed! MACD death cross below zero, moving averages in a bearish alignment diverging downward, KDJ oversold, volume up 1.5x.
════════════════════
🟢 $ONE 4-hour bearish signal
⚠️Technical analysis: Daily bearish + 4-hour bearish confluence confirmed! After the 4-hour MACD death cross, bearish momentum accelerates; moving averages diverge downward in a bearish alignment, and KDJ is weak, with K not crossing above D. Bears have the advantage.
════════════════════
🔔 Follow for first-hand market updates 🔔
#多周期共振 #BEAT #ASTER #ONE
📌 When trading, pay attention to whether the candlestick pattern matches.
34

·
--
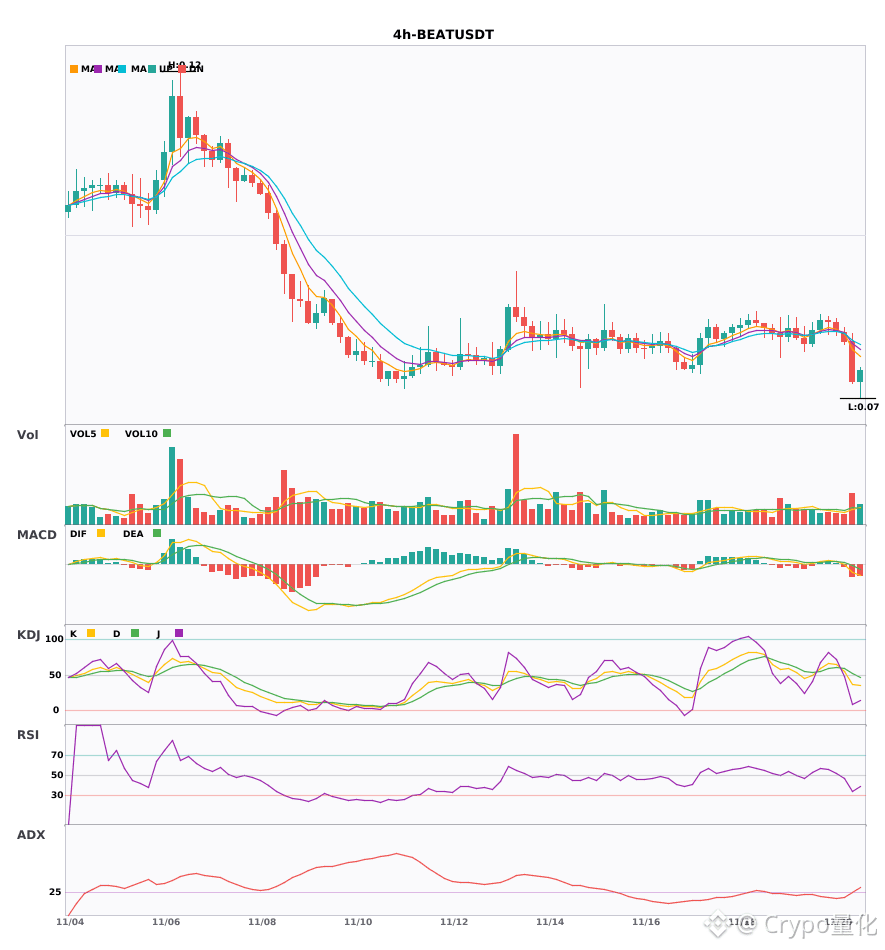
$BEAT / $ASTER 4-hour weakness; still under pressure in the short term 🔥
════════════════════
🟢 $BEAT 4-hour bearish signal
⚠️Technical analysis: ADX trend is just starting—can follow | MACD green bars continue to expand, indicating weakness | Moving averages have just formed a bearish alignment and are trending down | Volume up about 1.9x
════════════════════
🟢 $ASTER 4-hour bearish signal
⚠️Technical analysis: ADX(41) trend is very strong | MACD death cross below zero, bearish momentum accelerating | Moving averages in a bearish alignment, trending down | KDJ oversold (K=D=13.8)—watch for a rebound | Volume up 1.5x
════════════════════
🔔 Follow for first-hand market updates 🔔
#技术分析 #BEAT #ASTER
📌 When trading, pay attention to whether the candlestick pattern aligns
$BEAT / $ASTER 4-hour weakness; still under pressure in the short term 🔥
════════════════════
🟢 $BEAT 4-hour bearish signal
⚠️Technical analysis: ADX trend is just starting—can follow | MACD green bars continue to expand, indicating weakness | Moving averages have just formed a bearish alignment and are trending down | Volume up about 1.9x
════════════════════
🟢 $ASTER 4-hour bearish signal
⚠️Technical analysis: ADX(41) trend is very strong | MACD death cross below zero, bearish momentum accelerating | Moving averages in a bearish alignment, trending down | KDJ oversold (K=D=13.8)—watch for a rebound | Volume up 1.5x
════════════════════
🔔 Follow for first-hand market updates 🔔
#技术分析 #BEAT #ASTER
📌 When trading, pay attention to whether the candlestick pattern aligns
════════════════════
🟢 $BEAT 4-hour bearish signal
⚠️Technical analysis: ADX trend is just starting—can follow | MACD green bars continue to expand, indicating weakness | Moving averages have just formed a bearish alignment and are trending down | Volume up about 1.9x
════════════════════
🟢 $ASTER 4-hour bearish signal
⚠️Technical analysis: ADX(41) trend is very strong | MACD death cross below zero, bearish momentum accelerating | Moving averages in a bearish alignment, trending down | KDJ oversold (K=D=13.8)—watch for a rebound | Volume up 1.5x
════════════════════
🔔 Follow for first-hand market updates 🔔
#技术分析 #BEAT #ASTER
📌 When trading, pay attention to whether the candlestick pattern aligns
22

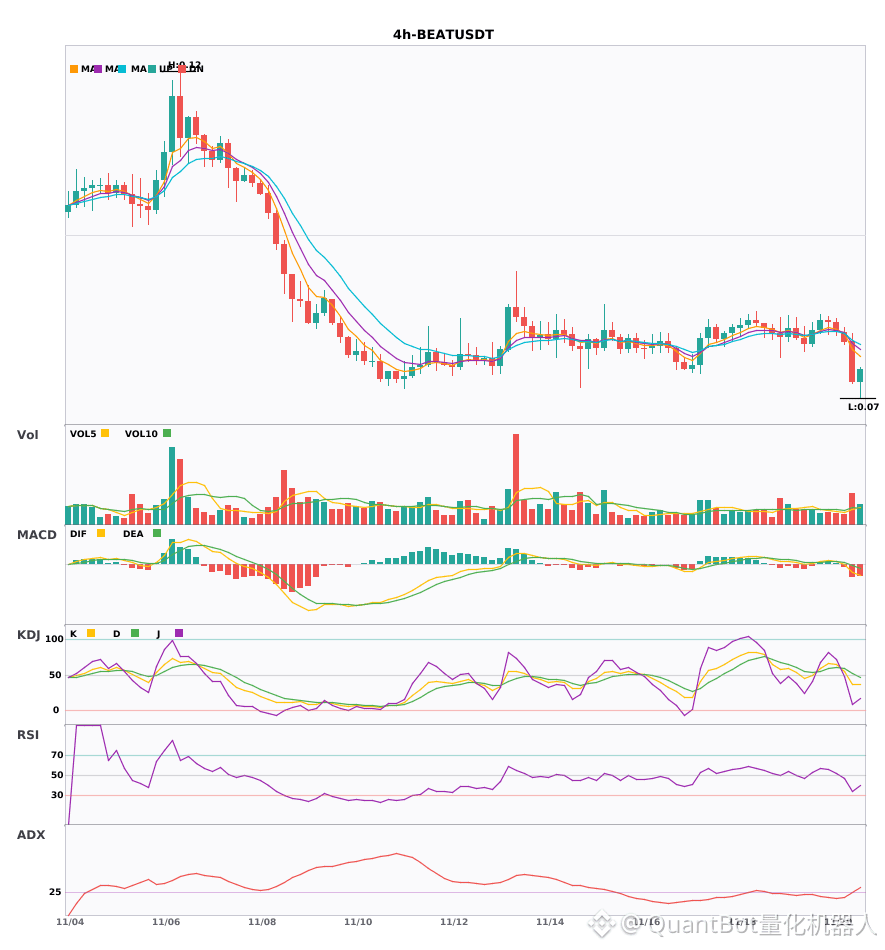
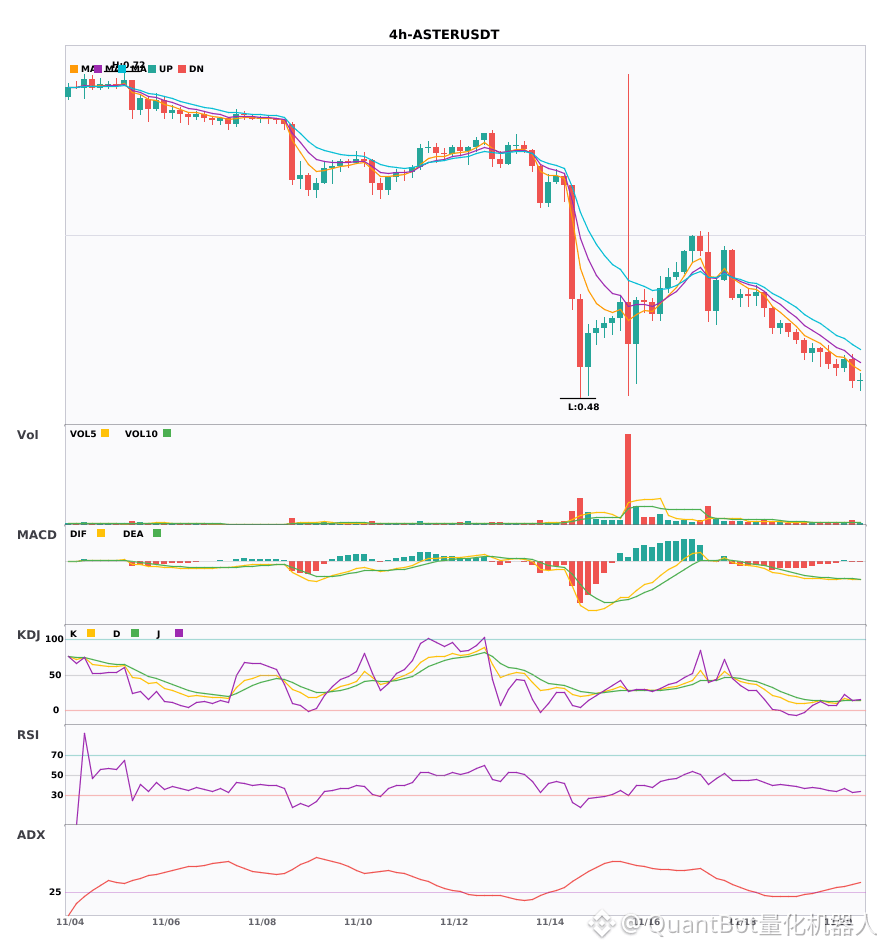
$BEAT/$ASTER 4H cyclical bearish structure, under short-term pressure
📉 $BEAT | 4-hour bearish signal
━━━━━━━━━━━━━━━━━━
Technical analysis: ADX(28) indicates the trend is taking shape; consider a moderate entry | MACD is bearish, with weak price action but strengthening momentum | EMA5<EMA8<EMA13 in bearish alignment | Trading volume up 1.9x
Price change: -7.1700%
📉 $ASTER | 4-hour bearish signal
━━━━━━━━━━━━━━━━━━
Technical analysis: ADX(41) indicates a strong trend; MACD bearish crossover below zero, with strengthening bearish momentum; EMA5<8<13 in bearish alignment; KDJ oversold (K/D=13.8), watch for a rebound; volume up 1.5x.
Price change: -3.1200%
━━━━━━━━━━━━━━━━━━
#技术分析 #BEAT #ASTER
📌 The above content is for reference only and does not constitute investment advice
$BEAT /$ASTER 4H cyclical bearish structure, under short-term pressure
📉 $BEAT | 4-hour bearish signal
━━━━━━━━━━━━━━━━━━
Technical analysis: ADX(28) indicates the trend is taking shape; consider a moderate entry | MACD is bearish, with weak price action but strengthening momentum | EMA5<EMA8<EMA13 in bearish alignment | Trading volume up 1.9x
Price change: -7.1700%
📉 $ASTER | 4-hour bearish signal
━━━━━━━━━━━━━━━━━━
Technical analysis: ADX(41) indicates a strong trend; MACD bearish crossover below zero, with strengthening bearish momentum; EMA5<8<13 in bearish alignment; KDJ oversold (K/D=13.8), watch for a rebound; volume up 1.5x.
Price change: -3.1200%
━━━━━━━━━━━━━━━━━━
#技术分析 #BEAT #ASTER
📌 The above content is for reference only and does not constitute investment advice
📉 $BEAT | 4-hour bearish signal
━━━━━━━━━━━━━━━━━━
Technical analysis: ADX(28) indicates the trend is taking shape; consider a moderate entry | MACD is bearish, with weak price action but strengthening momentum | EMA5<EMA8<EMA13 in bearish alignment | Trading volume up 1.9x
Price change: -7.1700%
📉 $ASTER | 4-hour bearish signal
━━━━━━━━━━━━━━━━━━
Technical analysis: ADX(41) indicates a strong trend; MACD bearish crossover below zero, with strengthening bearish momentum; EMA5<8<13 in bearish alignment; KDJ oversold (K/D=13.8), watch for a rebound; volume up 1.5x.
Price change: -3.1200%
━━━━━━━━━━━━━━━━━━
#技术分析 #BEAT #ASTER
📌 The above content is for reference only and does not constitute investment advice
14
·
--
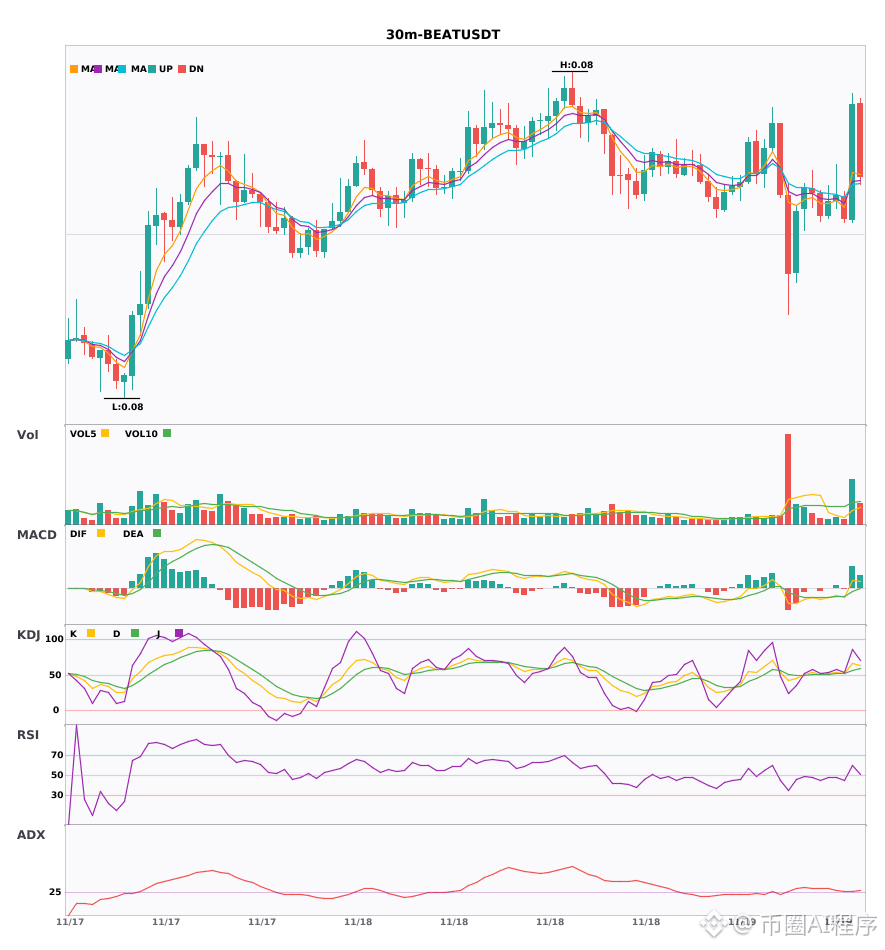
$BEAT 30-minute and 4-hour charts are both strengthening; a bullish signal has just formed 🔥
════════════════════
🔴 $BEAT 30-minute bullish signal
⚠️ Technical analysis: 4-hour bullish confluence confirmed! The 30-minute MACD golden cross is accompanied by rising volume, with the red bars continuing to expand. Moving averages are in bullish alignment and diverging upward. KDJ is strong, with K crossing above D but not yet overbought. Volume has increased 2.1 times, confirming a multi-timeframe bullish confluence.
════════════════════
🔔 Follow for the latest market movements 🔔
#多周期共振 #BEAT
📌 When trading, check whether the candlestick pattern confirms the setup.
$BEAT 30-minute and 4-hour charts are both strengthening; a bullish signal has just formed 🔥
════════════════════
🔴 $BEAT 30-minute bullish signal
⚠️ Technical analysis: 4-hour bullish confluence confirmed! The 30-minute MACD golden cross is accompanied by rising volume, with the red bars continuing to expand. Moving averages are in bullish alignment and diverging upward. KDJ is strong, with K crossing above D but not yet overbought. Volume has increased 2.1 times, confirming a multi-timeframe bullish confluence.
════════════════════
🔔 Follow for the latest market movements 🔔
#多周期共振 #BEAT
📌 When trading, check whether the candlestick pattern confirms the setup.
════════════════════
🔴 $BEAT 30-minute bullish signal
⚠️ Technical analysis: 4-hour bullish confluence confirmed! The 30-minute MACD golden cross is accompanied by rising volume, with the red bars continuing to expand. Moving averages are in bullish alignment and diverging upward. KDJ is strong, with K crossing above D but not yet overbought. Volume has increased 2.1 times, confirming a multi-timeframe bullish confluence.
════════════════════
🔔 Follow for the latest market movements 🔔
#多周期共振 #BEAT
📌 When trading, check whether the candlestick pattern confirms the setup.
12
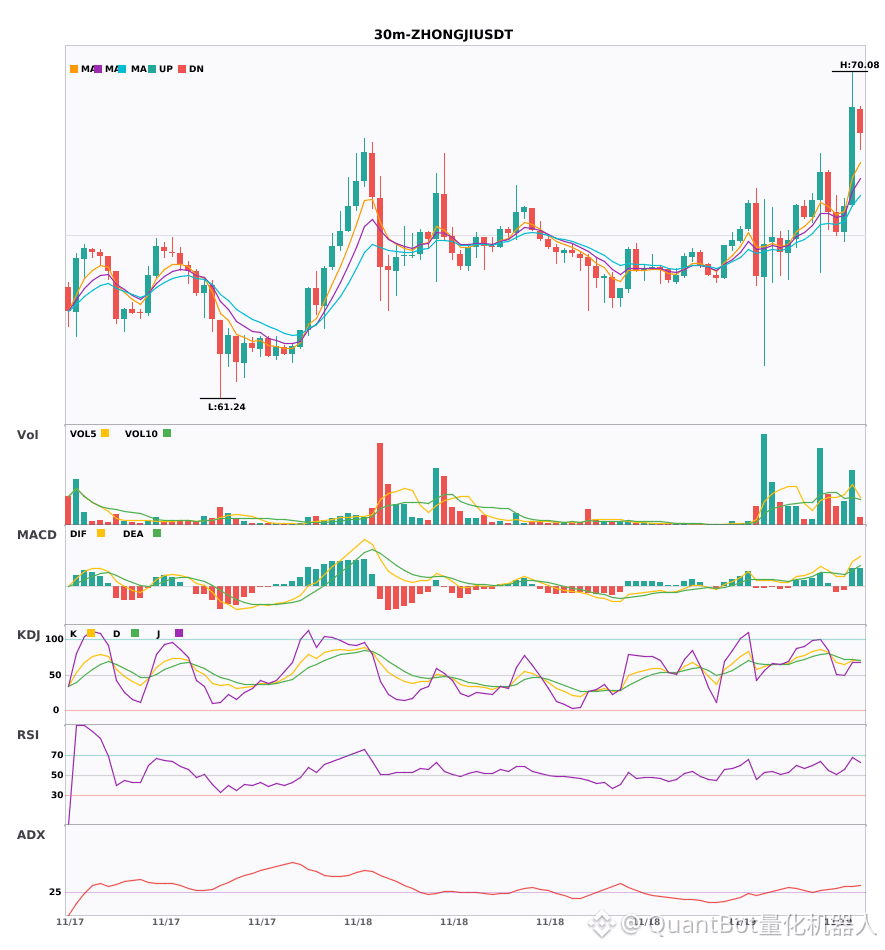
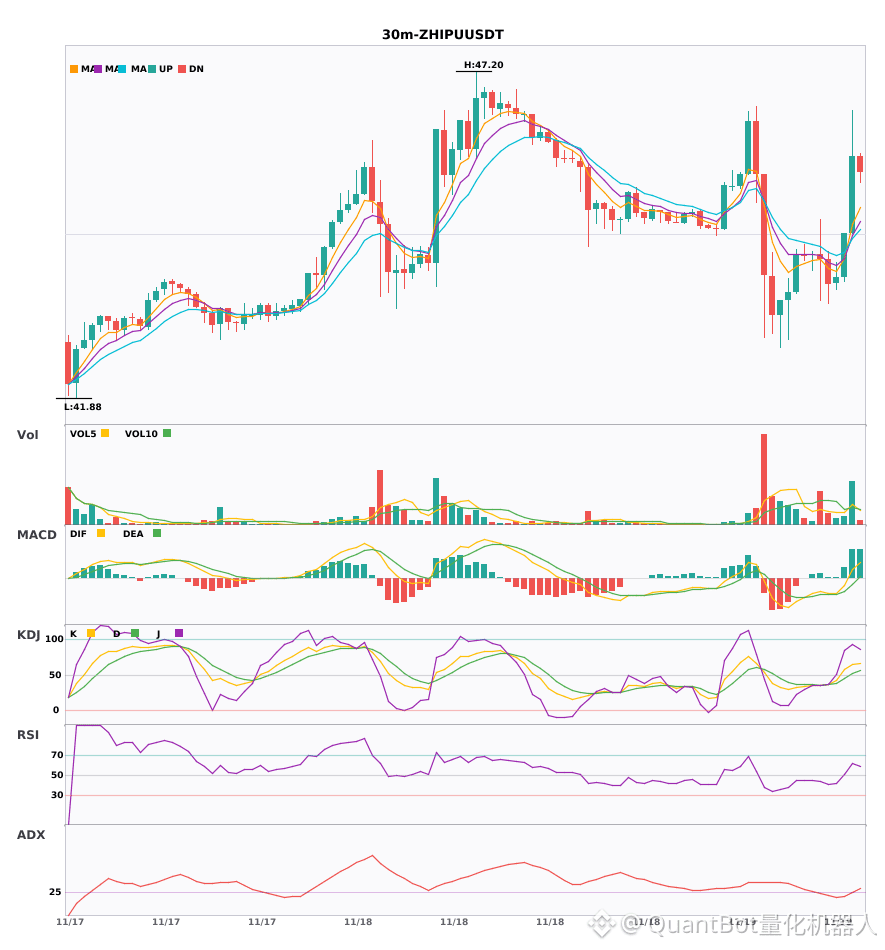
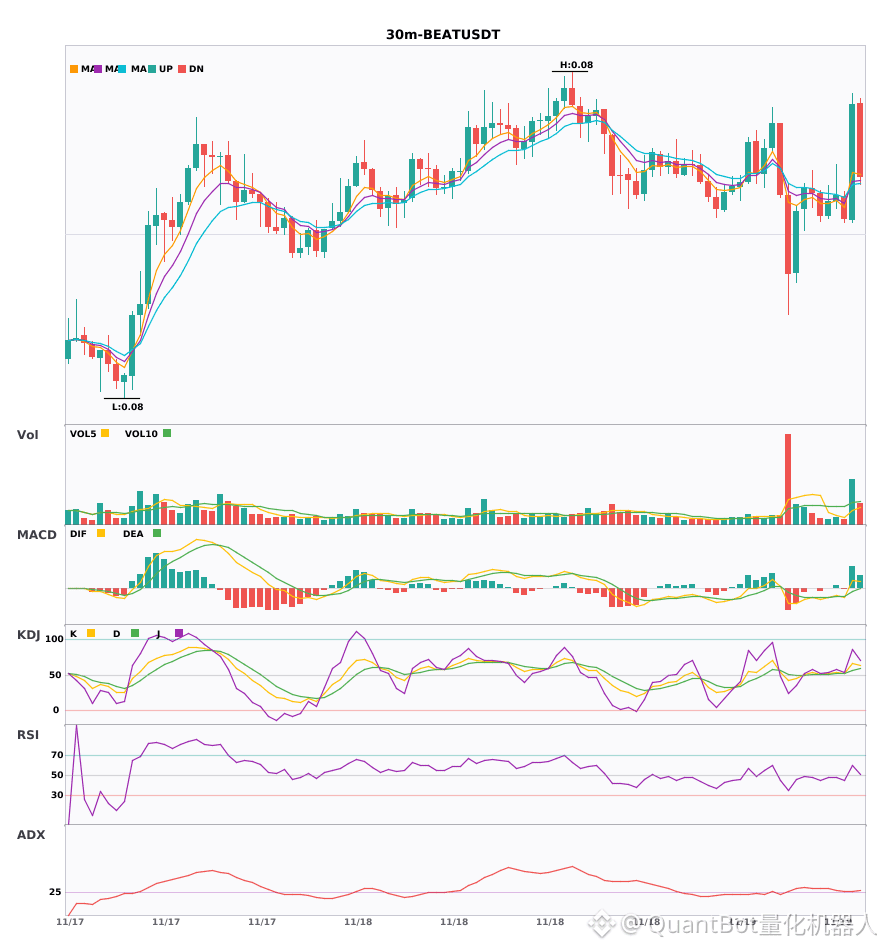
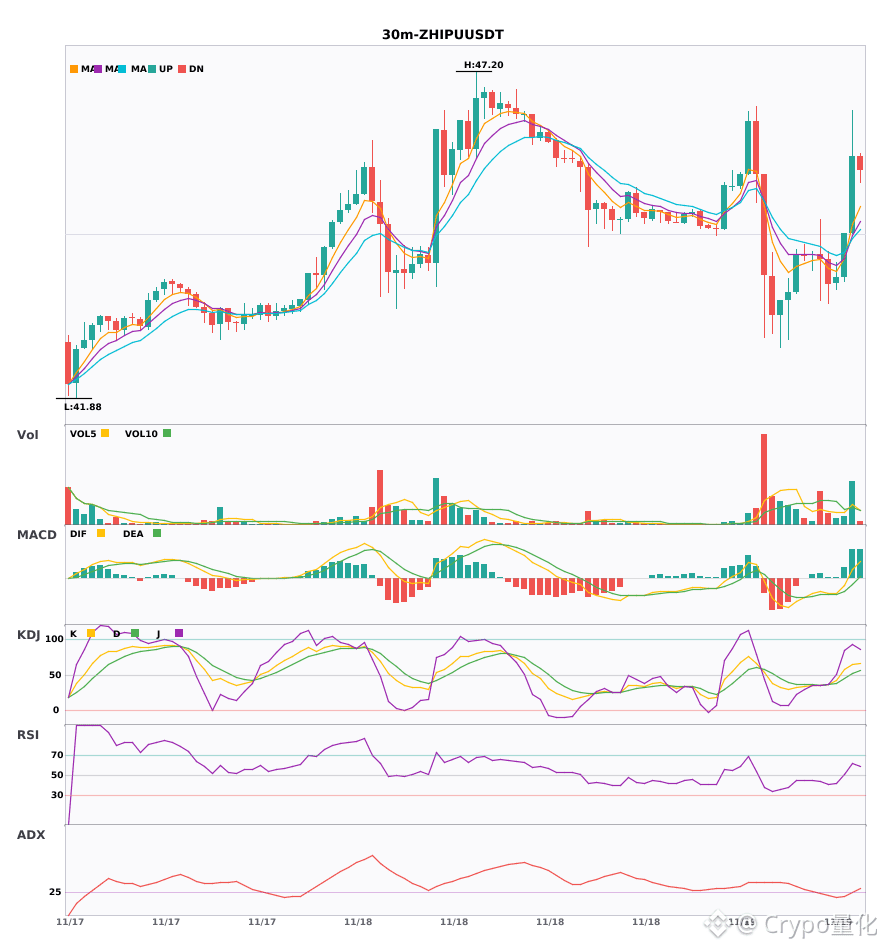
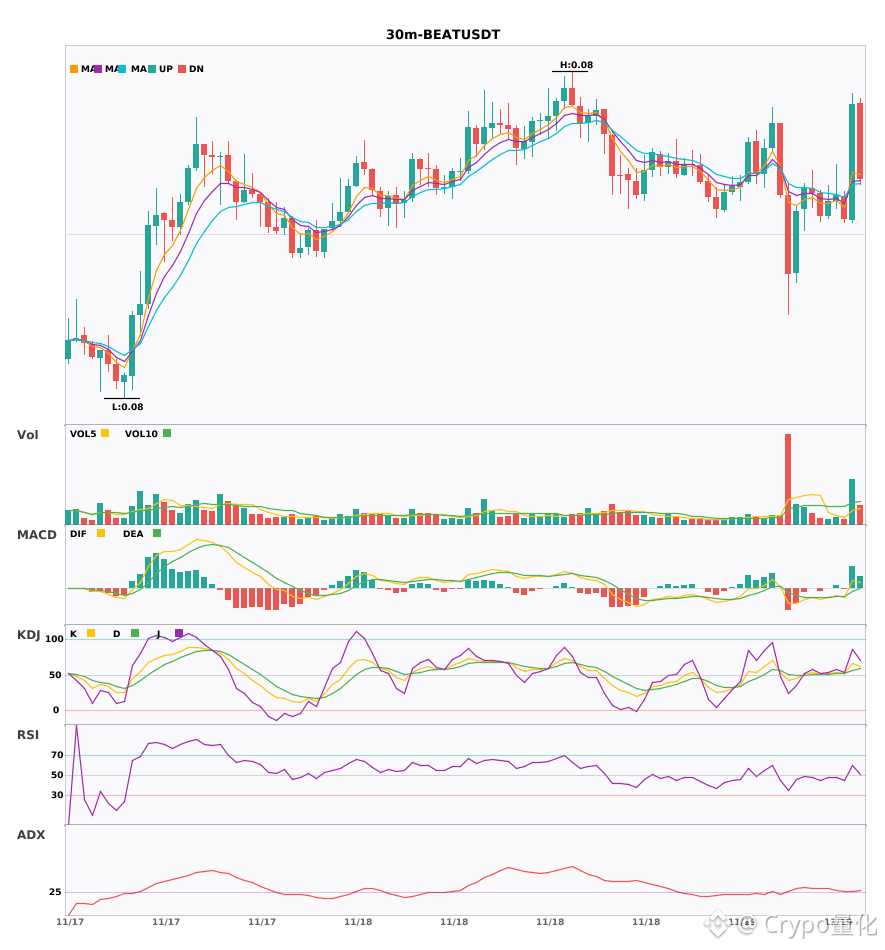
$ZHONGJI/$ZHIPU/$BEAT 30-minute technical resonance and momentum comparison
📈 $ZHONGJI | 30-minute bullish signal
━━━━━━━━━━━━━━━━━━
Technical analysis: ADX(35) indicates a strong trend; MACD golden cross above the zero line, with expanding momentum; EMA5>EMA8>EMA13 bullish alignment; KDJ running at high levels (K70.1/D71.1); volume increased 2.0x.
Price change: 3.9900%
📈 $ZHIPU | 30-minute bullish signal
━━━━━━━━━━━━━━━━━━
Technical analysis: ADX(27) indicates a developing trend, with conditions suitable for participation | MACD DIF crosses above the zero line, turning the signal bullish | EMA5 crosses above EMA8, indicating a short-term bullish outlook | KDJ in a strong range, with buyers in control (K:65.3 D:51.6) | Trading volume increased 2.5x
Price change: 2.8000%
📈 $BEAT | 30-minute bullish signal
━━━━━━━━━━━━━━━━━━
Technical analysis: ADX(27) indicates a developing trend; MACD golden cross above zero, releasing bullish momentum; EMA5 crosses above EMA8, turning bullish; KDJ is strong (K66.6/D57.0); volume increased 2.1x.
Price change: 3.9000%
━━━━━━━━━━━━━━━━━━
#技术分析 #ZHONGJI #ZHIPU #BEAT
📌 The above content is for reference only and does not constitute investment advice
$ZHONGJI /$ZHIPU /$BEAT 30-minute technical resonance and momentum comparison
📈 $ZHONGJI | 30-minute bullish signal
━━━━━━━━━━━━━━━━━━
Technical analysis: ADX(35) indicates a strong trend; MACD golden cross above the zero line, with expanding momentum; EMA5>EMA8>EMA13 bullish alignment; KDJ running at high levels (K70.1/D71.1); volume increased 2.0x.
Price change: 3.9900%
📈 $ZHIPU | 30-minute bullish signal
━━━━━━━━━━━━━━━━━━
Technical analysis: ADX(27) indicates a developing trend, with conditions suitable for participation | MACD DIF crosses above the zero line, turning the signal bullish | EMA5 crosses above EMA8, indicating a short-term bullish outlook | KDJ in a strong range, with buyers in control (K:65.3 D:51.6) | Trading volume increased 2.5x
Price change: 2.8000%
📈 $BEAT | 30-minute bullish signal
━━━━━━━━━━━━━━━━━━
Technical analysis: ADX(27) indicates a developing trend; MACD golden cross above zero, releasing bullish momentum; EMA5 crosses above EMA8, turning bullish; KDJ is strong (K66.6/D57.0); volume increased 2.1x.
Price change: 3.9000%
━━━━━━━━━━━━━━━━━━
#技术分析 #ZHONGJI #ZHIPU #BEAT
📌 The above content is for reference only and does not constitute investment advice
📈 $ZHONGJI | 30-minute bullish signal
━━━━━━━━━━━━━━━━━━
Technical analysis: ADX(35) indicates a strong trend; MACD golden cross above the zero line, with expanding momentum; EMA5>EMA8>EMA13 bullish alignment; KDJ running at high levels (K70.1/D71.1); volume increased 2.0x.
Price change: 3.9900%
📈 $ZHIPU | 30-minute bullish signal
━━━━━━━━━━━━━━━━━━
Technical analysis: ADX(27) indicates a developing trend, with conditions suitable for participation | MACD DIF crosses above the zero line, turning the signal bullish | EMA5 crosses above EMA8, indicating a short-term bullish outlook | KDJ in a strong range, with buyers in control (K:65.3 D:51.6) | Trading volume increased 2.5x
Price change: 2.8000%
📈 $BEAT | 30-minute bullish signal
━━━━━━━━━━━━━━━━━━
Technical analysis: ADX(27) indicates a developing trend; MACD golden cross above zero, releasing bullish momentum; EMA5 crosses above EMA8, turning bullish; KDJ is strong (K66.6/D57.0); volume increased 2.1x.
Price change: 3.9000%
━━━━━━━━━━━━━━━━━━
#技术分析 #ZHONGJI #ZHIPU #BEAT
📌 The above content is for reference only and does not constitute investment advice
61
·
--
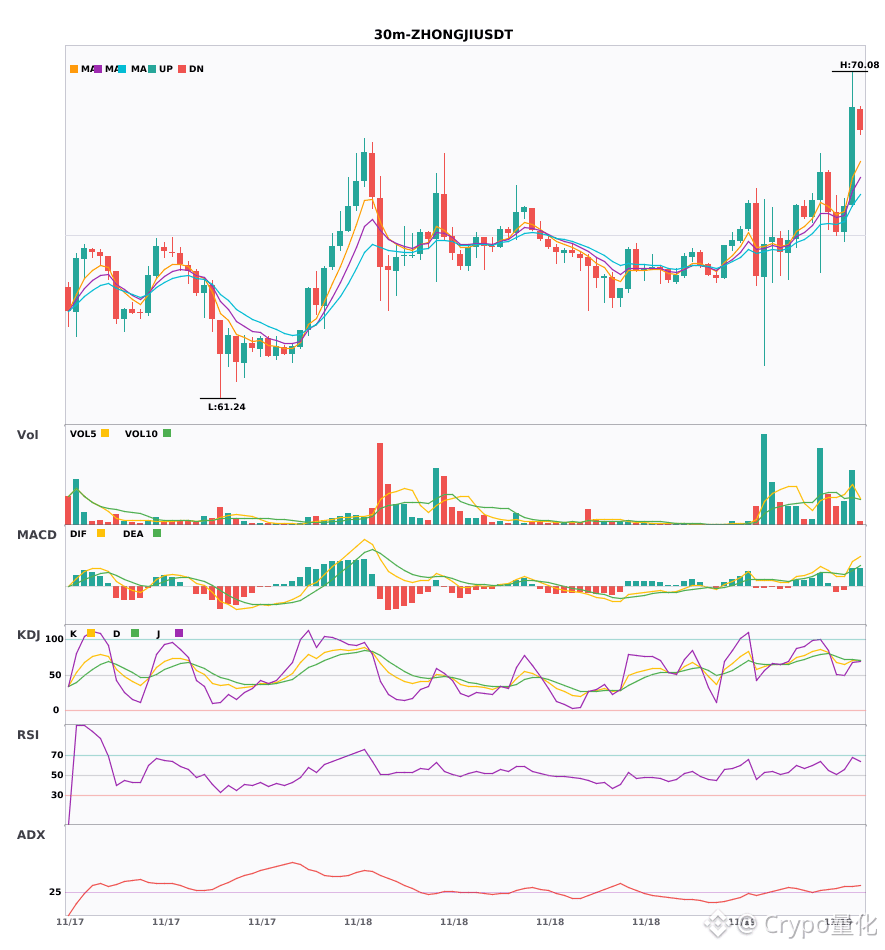
$ZHONGJI $ZHIPU $BEAT 30-minute resonance bullish🔥
════════════════════
🔴 $ZHONGJI 30-minute bullish signal
⚠️ Technical analysis: ADX at 35 indicates a very clear trend, MACD has a golden cross above the zero line with increased volume, and the red histogram is expanding. The moving averages are arranged in a bullish alignment and diverging upward, KDJ has K above D and is not yet overbought, volume has increased twofold, and bulls have the advantage.
════════════════════
🔴 $ZHIPU 30-minute bullish signal
⚠️ Technical analysis: ADX trend has just started and can be watched | MACD golden cross with increased volume breaking above the zero line | EMA5 crosses above EMA8, short-term bias is bullish | KDJ K crosses above D and is not overbought | volume increases by 2.5x
════════════════════
🔴 $BEAT 30-minute bullish signal
⚠️ Technical analysis: The trend has just formed and can be participated in, MACD golden cross above zero with increased volume, EMA5 crosses above EMA8, K crosses above D and is not overbought, volume increases by 2.1x.
════════════════════
🔔 Follow to get the latest market moves first-hand 🔔
#技术分析 #ZHONGJI #ZHIPU #BEAT
📌 When trading, pay attention to whether the candlestick pattern matches
$ZHONGJI $ZHIPU $BEAT 30-minute resonance bullish🔥
════════════════════
🔴 $ZHONGJI 30-minute bullish signal
⚠️ Technical analysis: ADX at 35 indicates a very clear trend, MACD has a golden cross above the zero line with increased volume, and the red histogram is expanding. The moving averages are arranged in a bullish alignment and diverging upward, KDJ has K above D and is not yet overbought, volume has increased twofold, and bulls have the advantage.
════════════════════
🔴 $ZHIPU 30-minute bullish signal
⚠️ Technical analysis: ADX trend has just started and can be watched | MACD golden cross with increased volume breaking above the zero line | EMA5 crosses above EMA8, short-term bias is bullish | KDJ K crosses above D and is not overbought | volume increases by 2.5x
════════════════════
🔴 $BEAT 30-minute bullish signal
⚠️ Technical analysis: The trend has just formed and can be participated in, MACD golden cross above zero with increased volume, EMA5 crosses above EMA8, K crosses above D and is not overbought, volume increases by 2.1x.
════════════════════
🔔 Follow to get the latest market moves first-hand 🔔
#技术分析 #ZHONGJI #ZHIPU #BEAT
📌 When trading, pay attention to whether the candlestick pattern matches
════════════════════
🔴 $ZHONGJI 30-minute bullish signal
⚠️ Technical analysis: ADX at 35 indicates a very clear trend, MACD has a golden cross above the zero line with increased volume, and the red histogram is expanding. The moving averages are arranged in a bullish alignment and diverging upward, KDJ has K above D and is not yet overbought, volume has increased twofold, and bulls have the advantage.
════════════════════
🔴 $ZHIPU 30-minute bullish signal
⚠️ Technical analysis: ADX trend has just started and can be watched | MACD golden cross with increased volume breaking above the zero line | EMA5 crosses above EMA8, short-term bias is bullish | KDJ K crosses above D and is not overbought | volume increases by 2.5x
════════════════════
🔴 $BEAT 30-minute bullish signal
⚠️ Technical analysis: The trend has just formed and can be participated in, MACD golden cross above zero with increased volume, EMA5 crosses above EMA8, K crosses above D and is not overbought, volume increases by 2.1x.
════════════════════
🔔 Follow to get the latest market moves first-hand 🔔
#技术分析 #ZHONGJI #ZHIPU #BEAT
📌 When trading, pay attention to whether the candlestick pattern matches
49

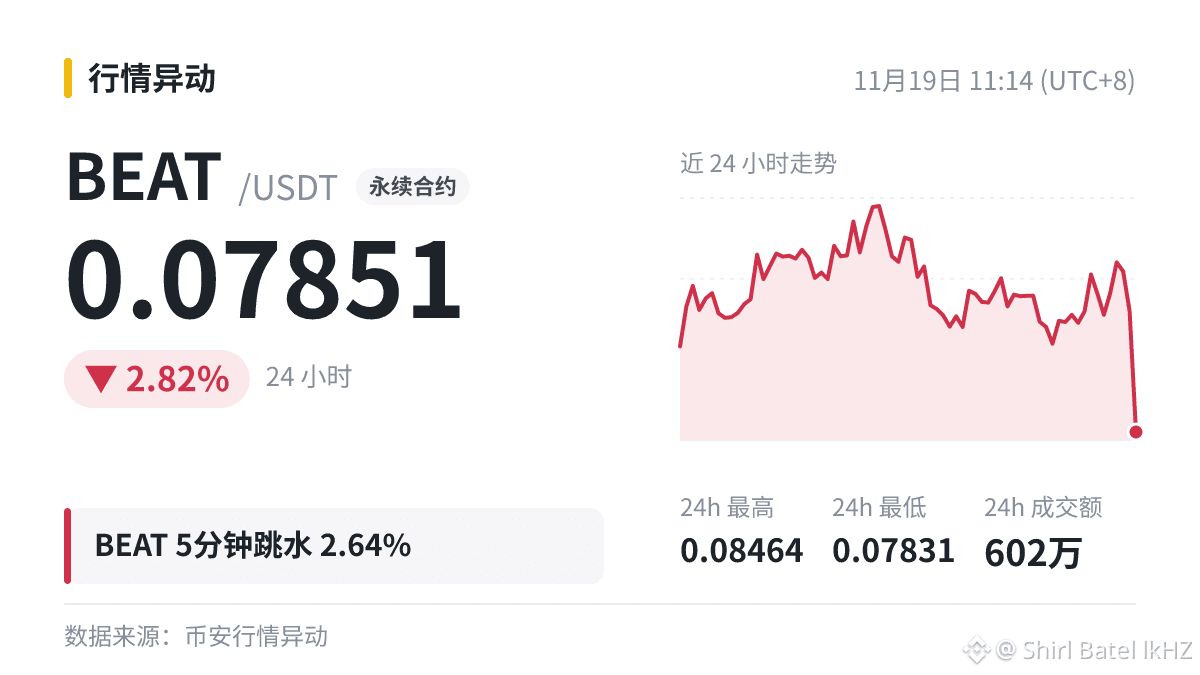
$BEAT 5 minutes -2.64%, current price 0.07851. If you're itching to buy the dip, first ask yourself three questions:
① The 24h low of 0.07831 is still below the current price. Are there signs of a bottom?
② This was a sudden plunge. If it drops another leg, can you handle it?
③ Have you prepared a stop-loss? How will you exit if you're wrong?
If you can't answer, maybe wait a little longer.
Risk takes time to unwind. Don't rush.
#BEAT
$BEAT 5 minutes -2.64%, current price 0.07851. If you're itching to buy the dip, first ask yourself three questions:
① The 24h low of 0.07831 is still below the current price. Are there signs of a bottom?
② This was a sudden plunge. If it drops another leg, can you handle it?
③ Have you prepared a stop-loss? How will you exit if you're wrong?
If you can't answer, maybe wait a little longer.
Risk takes time to unwind. Don't rush.
#BEAT
① The 24h low of 0.07831 is still below the current price. Are there signs of a bottom?
② This was a sudden plunge. If it drops another leg, can you handle it?
③ Have you prepared a stop-loss? How will you exit if you're wrong?
If you can't answer, maybe wait a little longer.
Risk takes time to unwind. Don't rush.
#BEAT
28
·
--
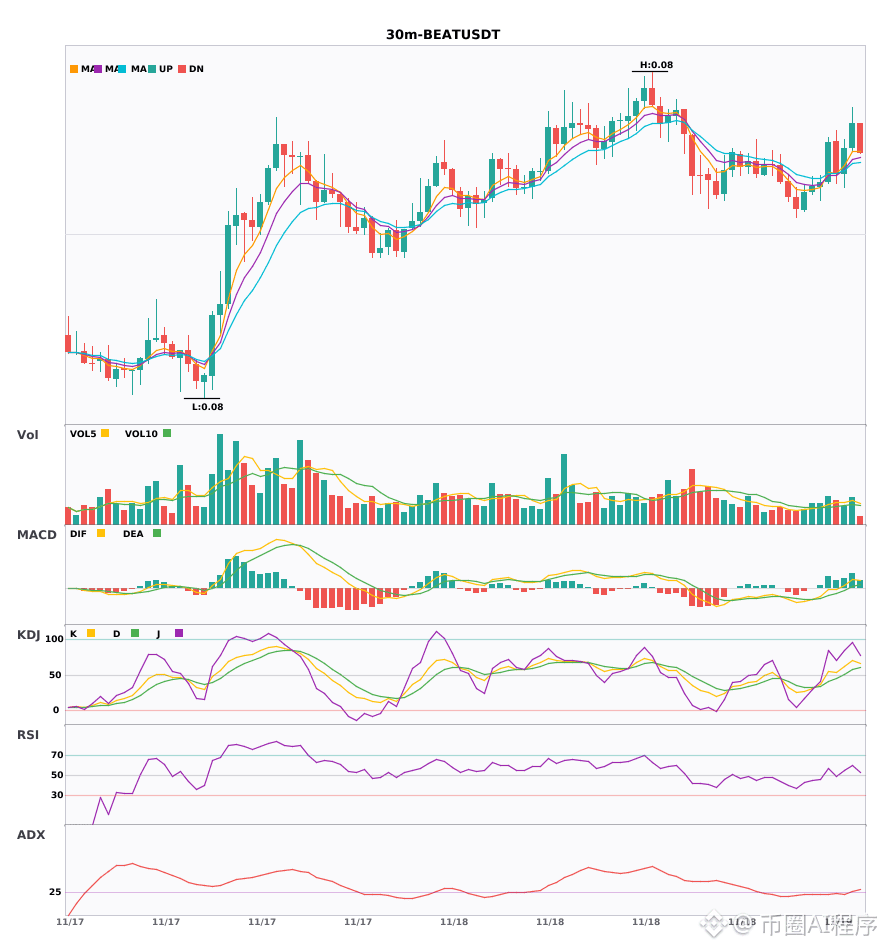
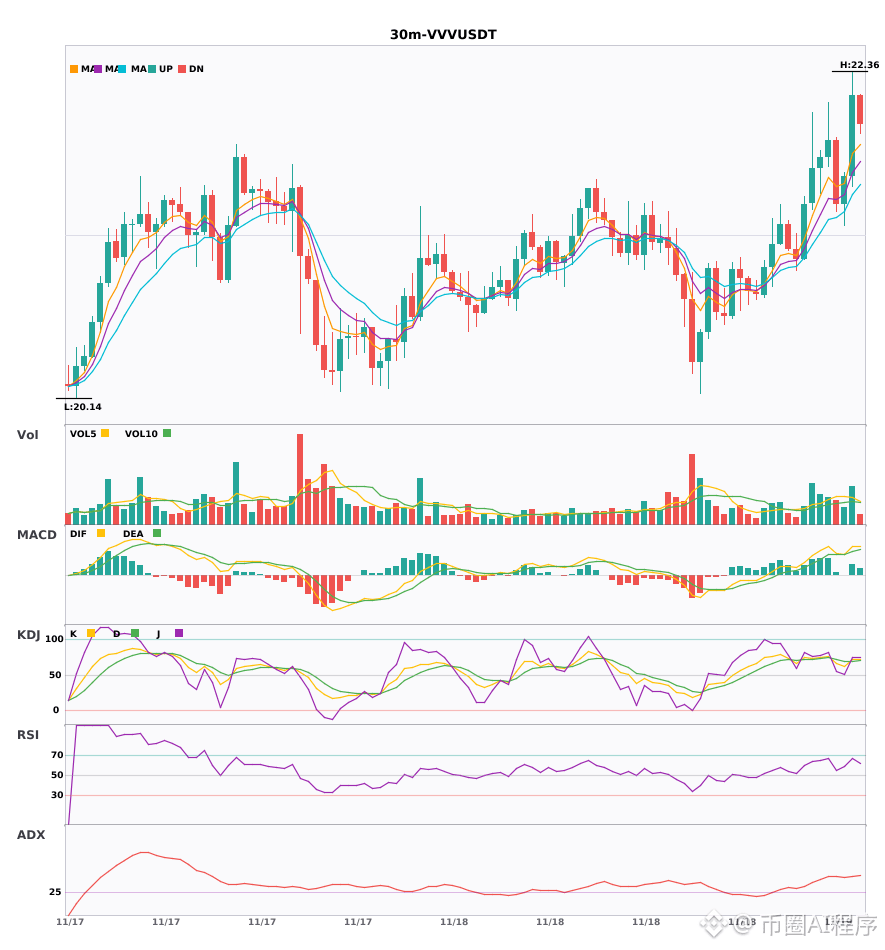
Two currencies have a 30-minute and 4-hour bullish resonance, with moving averages in a bullish alignment and expanding upward 🔥
════════════════════
🔴 $BEAT 30-minute bullish signal
⚠️Technical view: 4-hour bullish + 30-minute entry resonance. MACD golden cross with increasing volume and expanding red bars, DIF breaking above the zero line. Moving averages are in a bullish alignment and expanding upward. KDJ strong K line crosses above D without being overbought. Volume is normal.
════════════════════
🔴 $VVV 30-minute bullish signal
⚠️Technical view: 4-hour bullish resonance confirmed, 30-minute entry: after the MACD golden cross, volume increased, red bars continued to expand, moving averages are in a bullish alignment and expanding upward, KDJ golden cross and not overbought, volume increased by 1.6x, short-term bullish
════════════════════
🔔 Follow to get the latest market moves first hand 🔔
#多周期共振 #BEAT #VVV
📌 When trading, pay attention to whether the candlestick pattern is in line with expectations
Two currencies have a 30-minute and 4-hour bullish resonance, with moving averages in a bullish alignment and expanding upward 🔥
════════════════════
🔴 $BEAT 30-minute bullish signal
⚠️Technical view: 4-hour bullish + 30-minute entry resonance. MACD golden cross with increasing volume and expanding red bars, DIF breaking above the zero line. Moving averages are in a bullish alignment and expanding upward. KDJ strong K line crosses above D without being overbought. Volume is normal.
════════════════════
🔴 $VVV 30-minute bullish signal
⚠️Technical view: 4-hour bullish resonance confirmed, 30-minute entry: after the MACD golden cross, volume increased, red bars continued to expand, moving averages are in a bullish alignment and expanding upward, KDJ golden cross and not overbought, volume increased by 1.6x, short-term bullish
════════════════════
🔔 Follow to get the latest market moves first hand 🔔
#多周期共振 #BEAT #VVV
📌 When trading, pay attention to whether the candlestick pattern is in line with expectations
════════════════════
🔴 $BEAT 30-minute bullish signal
⚠️Technical view: 4-hour bullish + 30-minute entry resonance. MACD golden cross with increasing volume and expanding red bars, DIF breaking above the zero line. Moving averages are in a bullish alignment and expanding upward. KDJ strong K line crosses above D without being overbought. Volume is normal.
════════════════════
🔴 $VVV 30-minute bullish signal
⚠️Technical view: 4-hour bullish resonance confirmed, 30-minute entry: after the MACD golden cross, volume increased, red bars continued to expand, moving averages are in a bullish alignment and expanding upward, KDJ golden cross and not overbought, volume increased by 1.6x, short-term bullish
════════════════════
🔔 Follow to get the latest market moves first hand 🔔
#多周期共振 #BEAT #VVV
📌 When trading, pay attention to whether the candlestick pattern is in line with expectations
6

·
--
Bullish
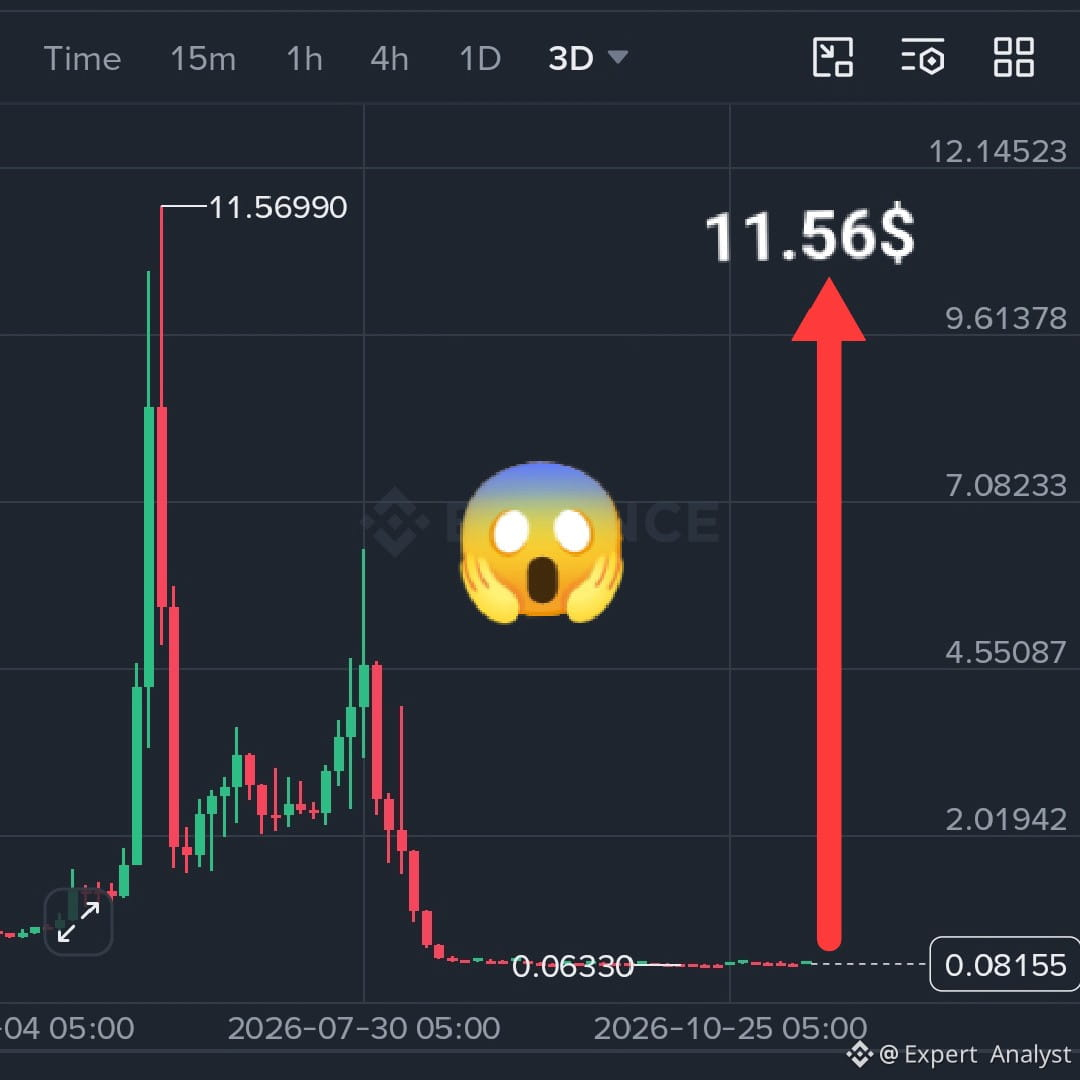
$BEAT — From $11.56 To Just $0.081! Is A Massive Comeback Loading? 🔥
Could $BEAT be preparing for another major move? 👀
📈 Historical Chart High: $11.5699
📍 Current Price: $0.08155
💎 Chart Low: $0.06330
🔥 LOOK AT THE DISCOUNT!
$BEAT is currently trading close to its historical chart low. From around $11.56 down to just $0.081 — that's a massive correction!
At these levels, the token is trading at a huge discount compared with its previous chart peak. This could be an interesting zone to watch for long-term accumulation, but confirmation and careful risk management are essential.
🎯 Speculative Comeback Target: $11.56 🚀
Imagine what a strong recovery could mean if momentum returns in a future bull cycle! A move back toward previous levels would require an extraordinary rally, so this target is highly speculative, not guaranteed.
💰 Keep BEAT on your watchlist. Could this be another hidden comeback opportunity? 🔥
{future}(BEATUSDT)
#BEAT #BinanceExplorers #Audiera #Crypto #BinanceSquare
$BEAT — From $11.56 To Just $0.081! Is A Massive Comeback Loading? 🔥
Could $BEAT be preparing for another major move? 👀
📈 Historical Chart High: $11.5699
📍 Current Price: $0.08155
💎 Chart Low: $0.06330
🔥 LOOK AT THE DISCOUNT!
$BEAT is currently trading close to its historical chart low. From around $11.56 down to just $0.081 — that's a massive correction!
At these levels, the token is trading at a huge discount compared with its previous chart peak. This could be an interesting zone to watch for long-term accumulation, but confirmation and careful risk management are essential.
🎯 Speculative Comeback Target: $11.56 🚀
Imagine what a strong recovery could mean if momentum returns in a future bull cycle! A move back toward previous levels would require an extraordinary rally, so this target is highly speculative, not guaranteed.
💰 Keep BEAT on your watchlist. Could this be another hidden comeback opportunity? 🔥
#BEAT #BinanceExplorers #Audiera #Crypto #BinanceSquare
Could $BEAT be preparing for another major move? 👀
📈 Historical Chart High: $11.5699
📍 Current Price: $0.08155
💎 Chart Low: $0.06330
🔥 LOOK AT THE DISCOUNT!
$BEAT is currently trading close to its historical chart low. From around $11.56 down to just $0.081 — that's a massive correction!
At these levels, the token is trading at a huge discount compared with its previous chart peak. This could be an interesting zone to watch for long-term accumulation, but confirmation and careful risk management are essential.
🎯 Speculative Comeback Target: $11.56 🚀
Imagine what a strong recovery could mean if momentum returns in a future bull cycle! A move back toward previous levels would require an extraordinary rally, so this target is highly speculative, not guaranteed.
💰 Keep BEAT on your watchlist. Could this be another hidden comeback opportunity? 🔥
#BEAT #BinanceExplorers #Audiera #Crypto #BinanceSquare
3
1.1k
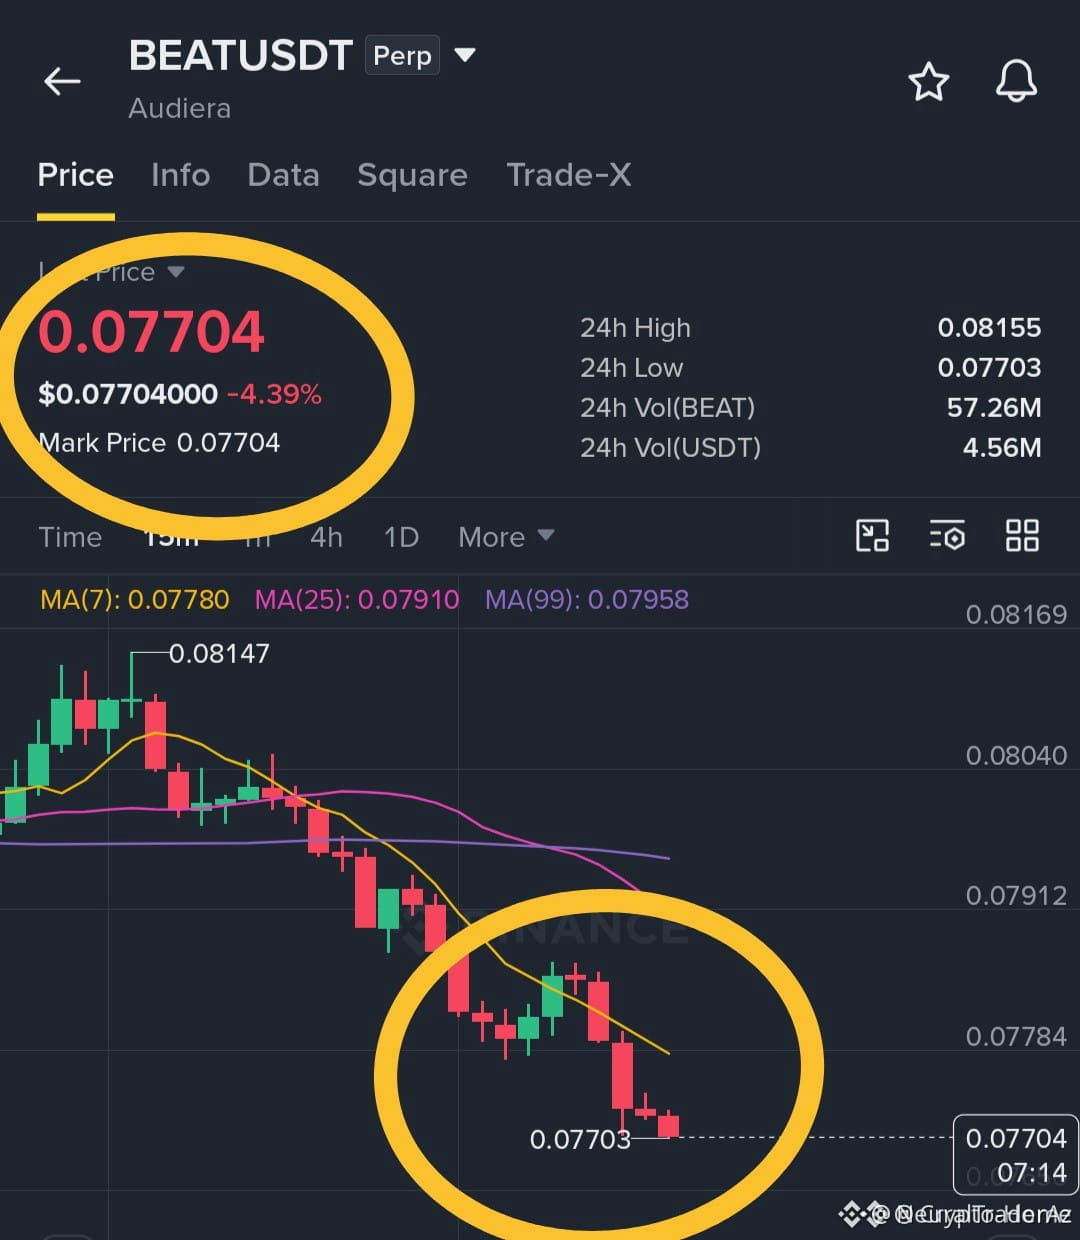
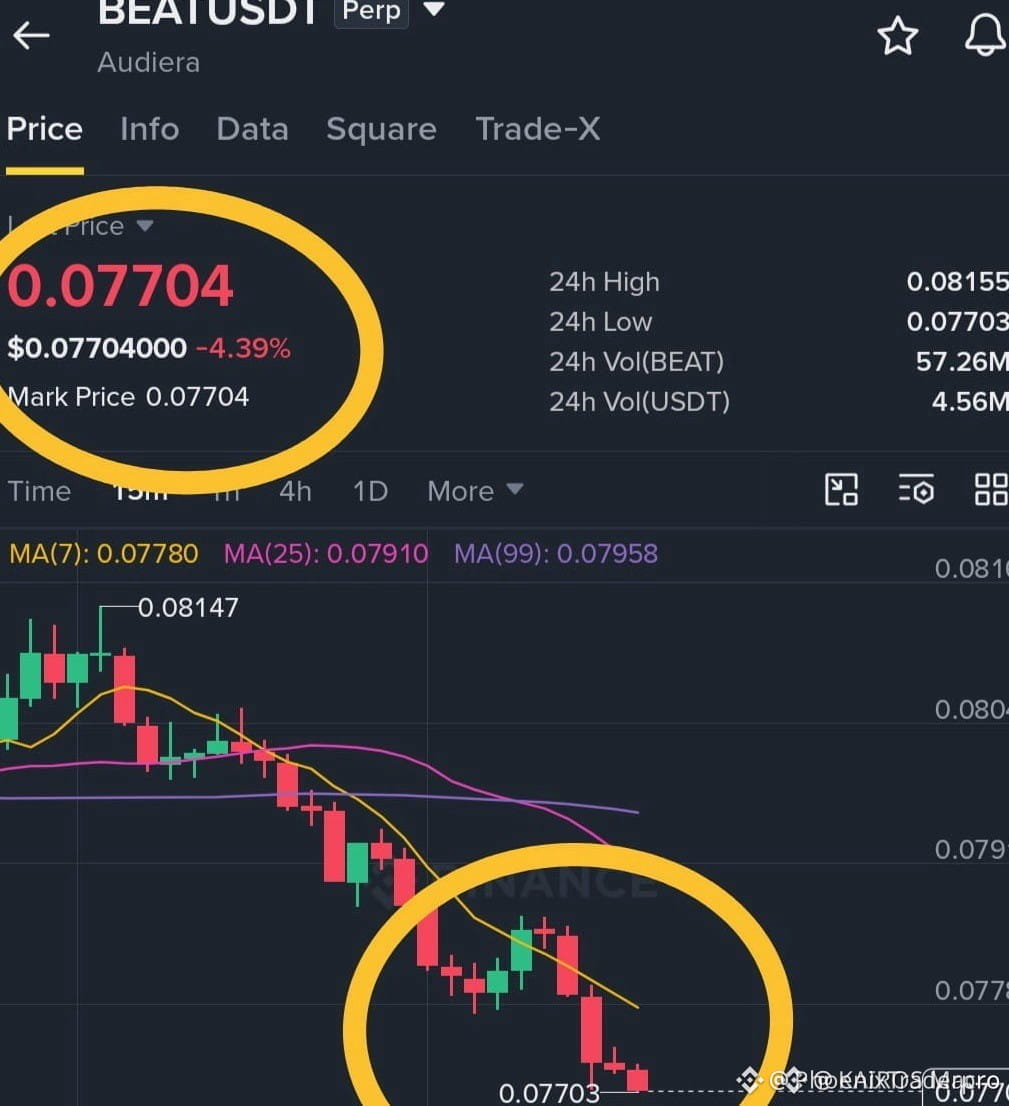
🚨 $BEAT LOSING KEY STRUCTURAL SUPPORT AS SMART MONEY PRESSURES THE DISTRIBUTION ZONE! 🐻
Entry: 0.07700 - 0.07750 ⚡
Target: 0.07520, 0.07340, 0.07100 🚀
Stop Loss: 0.07950 ⚠️
Institutional supply is actively defending the 0.07700 to 0.07750 threshold following a clean structural breakdown of the diagonal trendline. 📊 Sellers have seized control of the order flow, creating an aggressive imbalance that targets unprotected liquidity pools below. 🌊
The recent rejection confirms heavy distribution as momentum continues to tilt downward without meaningful buyer absorption. 💡 Are you positioning alongside this institutional markdown or waiting for a deeper retest? 🤔
⚠️ Not financial advice. Always manage your risk. 🛡️
🏷️ #BEAT #ShortSetup #OrderBlock #Crypto
🦈 📉
🚨 $BEAT LOSING KEY STRUCTURAL SUPPORT AS SMART MONEY PRESSURES THE DISTRIBUTION ZONE! 🐻
Entry: 0.07700 - 0.07750 ⚡
Target: 0.07520, 0.07340, 0.07100 🚀
Stop Loss: 0.07950 ⚠️
Institutional supply is actively defending the 0.07700 to 0.07750 threshold following a clean structural breakdown of the diagonal trendline. 📊 Sellers have seized control of the order flow, creating an aggressive imbalance that targets unprotected liquidity pools below. 🌊
The recent rejection confirms heavy distribution as momentum continues to tilt downward without meaningful buyer absorption. 💡 Are you positioning alongside this institutional markdown or waiting for a deeper retest? 🤔
⚠️ Not financial advice. Always manage your risk. 🛡️
🏷️ #BEAT #ShortSetup #OrderBlock #Crypto
🦈 📉
Entry: 0.07700 - 0.07750 ⚡
Target: 0.07520, 0.07340, 0.07100 🚀
Stop Loss: 0.07950 ⚠️
Institutional supply is actively defending the 0.07700 to 0.07750 threshold following a clean structural breakdown of the diagonal trendline. 📊 Sellers have seized control of the order flow, creating an aggressive imbalance that targets unprotected liquidity pools below. 🌊
The recent rejection confirms heavy distribution as momentum continues to tilt downward without meaningful buyer absorption. 💡 Are you positioning alongside this institutional markdown or waiting for a deeper retest? 🤔
⚠️ Not financial advice. Always manage your risk. 🛡️
🏷️ #BEAT #ShortSetup #OrderBlock #Crypto
🦈 📉
23

·
--
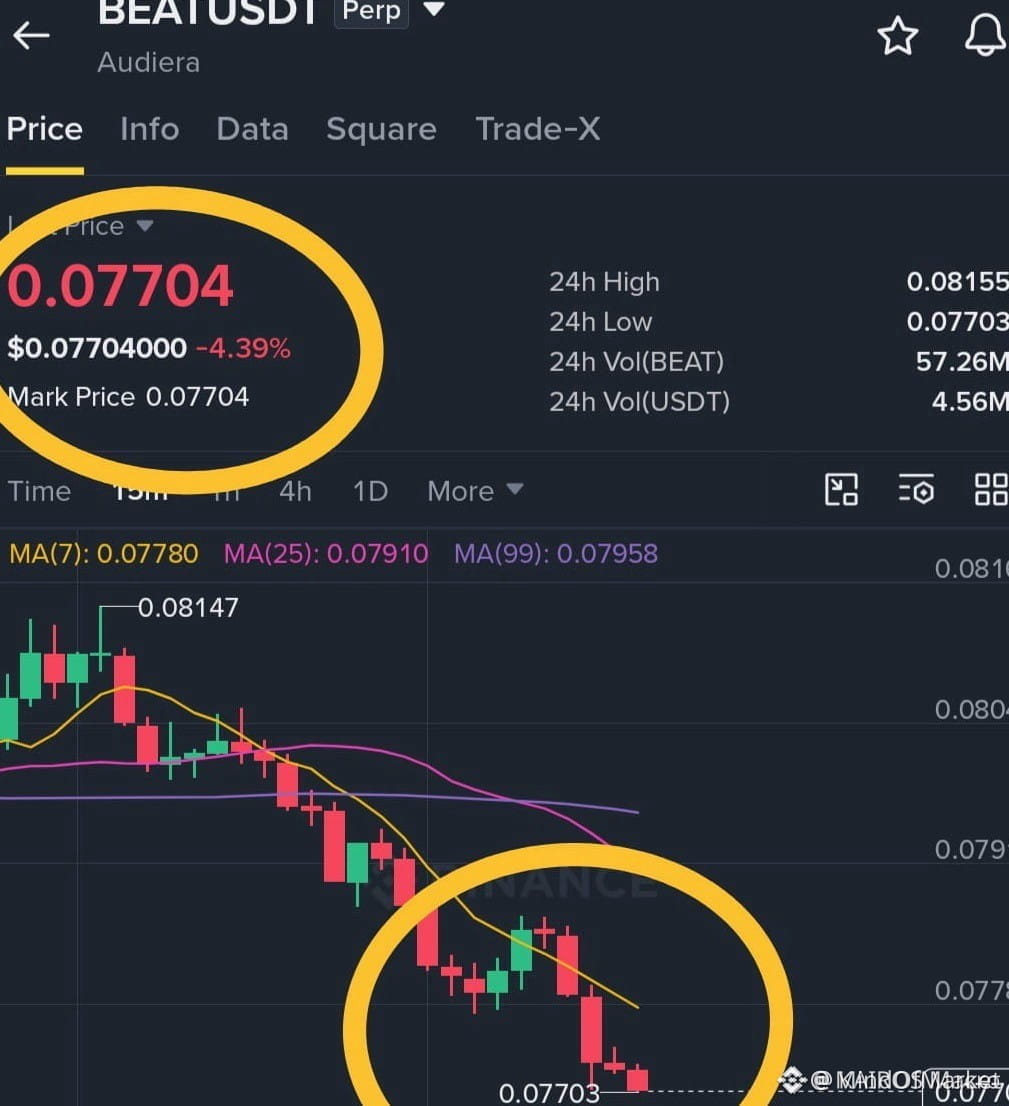
🚨 $BEAT STRUCTURAL TRENDLINE BREAKDOWN CONFIRMS A HEAVY SHORT SETUP! 📉
Entry: 0.07700 - 0.07750 ⚡
Target: 0.07520 - 0.07340 - 0.07100 🎯
Stop Loss: 0.07950 🛑
The recent breakdown of diagonal support on $BEAT signals a definitive shift in market structure as institutional supply overwhelms resting bids. 📊 Volume expansion across the rejection candles confirms that smart money distribution is fully active at these elevated levels. 📉
With sellers firmly in control and structural liquidity resting below previous swing lows, patience and discipline remain our primary edge. 💡 Are you looking to position on this distribution phase or waiting for a lower timeframe retest? 💬
⚠️ Not financial advice. Always manage your risk. 🛡️
🏷️ #BEAT #ShortSetup #MarketStructure #OrderFlow #Crypto
🐻 📉
🚨 $BEAT STRUCTURAL TRENDLINE BREAKDOWN CONFIRMS A HEAVY SHORT SETUP! 📉
Entry: 0.07700 - 0.07750 ⚡
Target: 0.07520 - 0.07340 - 0.07100 🎯
Stop Loss: 0.07950 🛑
The recent breakdown of diagonal support on $BEAT signals a definitive shift in market structure as institutional supply overwhelms resting bids. 📊 Volume expansion across the rejection candles confirms that smart money distribution is fully active at these elevated levels. 📉
With sellers firmly in control and structural liquidity resting below previous swing lows, patience and discipline remain our primary edge. 💡 Are you looking to position on this distribution phase or waiting for a lower timeframe retest? 💬
⚠️ Not financial advice. Always manage your risk. 🛡️
🏷️ #BEAT #ShortSetup #MarketStructure #OrderFlow #Crypto
🐻 📉
Entry: 0.07700 - 0.07750 ⚡
Target: 0.07520 - 0.07340 - 0.07100 🎯
Stop Loss: 0.07950 🛑
The recent breakdown of diagonal support on $BEAT signals a definitive shift in market structure as institutional supply overwhelms resting bids. 📊 Volume expansion across the rejection candles confirms that smart money distribution is fully active at these elevated levels. 📉
With sellers firmly in control and structural liquidity resting below previous swing lows, patience and discipline remain our primary edge. 💡 Are you looking to position on this distribution phase or waiting for a lower timeframe retest? 💬
⚠️ Not financial advice. Always manage your risk. 🛡️
🏷️ #BEAT #ShortSetup #MarketStructure #OrderFlow #Crypto
🐻 📉
14
🔴 $BEAT SHATTERS CRITICAL SUPPORT AS SELLERS SEIZE TOTAL CONTROL OF THE ORDER BOOK! 📉
Entry: 0.07700 - 0.07750 ⚡
Target: 0.07100 🚀
Stop Loss: 0.07950 ⚠️
The structural trendline has officially snapped, leaving a trail of heavy red candles and completely dismantling buyer confidence. Volume flooded in on the sell-side as momentum shifted decisively into the hands of aggressive bears. 📊
Patience and airtight risk management are non-negotiable when market structures break down this violently. ⚡ Are you looking to position short on this breakdown or sitting on the sidelines watching the action? 👇
⚠️ Not financial advice. Always manage your risk. 🛡️
🏷️ #BEAT #ShortSetup #Breakout #Crypto
🐻 🩸
🔴 $BEAT SHATTERS CRITICAL SUPPORT AS SELLERS SEIZE TOTAL CONTROL OF THE ORDER BOOK! 📉
Entry: 0.07700 - 0.07750 ⚡
Target: 0.07100 🚀
Stop Loss: 0.07950 ⚠️
The structural trendline has officially snapped, leaving a trail of heavy red candles and completely dismantling buyer confidence. Volume flooded in on the sell-side as momentum shifted decisively into the hands of aggressive bears. 📊
Patience and airtight risk management are non-negotiable when market structures break down this violently. ⚡ Are you looking to position short on this breakdown or sitting on the sidelines watching the action? 👇
⚠️ Not financial advice. Always manage your risk. 🛡️
🏷️ #BEAT #ShortSetup #Breakout #Crypto
🐻 🩸
Entry: 0.07700 - 0.07750 ⚡
Target: 0.07100 🚀
Stop Loss: 0.07950 ⚠️
The structural trendline has officially snapped, leaving a trail of heavy red candles and completely dismantling buyer confidence. Volume flooded in on the sell-side as momentum shifted decisively into the hands of aggressive bears. 📊
Patience and airtight risk management are non-negotiable when market structures break down this violently. ⚡ Are you looking to position short on this breakdown or sitting on the sidelines watching the action? 👇
⚠️ Not financial advice. Always manage your risk. 🛡️
🏷️ #BEAT #ShortSetup #Breakout #Crypto
🐻 🩸
31
Log in to explore more content
Join global crypto users on Binance Square
⚡️ Get latest and useful information about crypto.
💬 Trusted by the world’s largest crypto exchange.
👍 Discover real insights from verified creators.
Email / Phone number
Trending Topics
1
#CanBTCReboundAfterFallingBelow60K?
130,548 views
534 Discussing
2
#GlobalStocksFaceLongestLosingStreakSince2023
52,266 views
509 Discussing
3
#AnthropicPlungesTowardIPOPriceonDay2
17,921 views
209 Discussing
4
#BNBDropsBelow540USDTWith8.46%DailyDecline
0 views
0 Discussing
5
#MorganStanleyEndsAnthropicStockSupportAfterOneDay
0 views
0 Discussing
6
#CryptoBilisAttackerMoves25000ETHToTornadoCash
0 views
0 Discussing
7
#GaoTengBitcoinETFListsOnHKEX
38,257 views
391 Discussing
8
#TradFiForBeginners
1M views
5,836 Discussing
9
#NvidiaBoardReportedlySplitOverHuang’sReturn
401,728 views
2,583 Discussing
10
#TetherBurns8BillionUSDTInPast20Days
44,980 views
164 Discussing