
#inj
inj
5M views
21,898 Discussing
Hot
Latest

·
--
Verified
30D trade $INJ 359.2 USDT
🏦 $INJ : INJECTIVE'S TOKENIZED MORTGAGE VALUE CROSSES $1.5B!
Injective is gaining attention in the real-world asset (RWA) sector:
- November 19: Pentiv added $524.8 million in prime mortgage records to Injective.
- New milestone: Its on-chain mortgage registry surpassed $1.5 billion.
- Veyra upgrade: Governance proposal #717 passed with 99.51% support.
- Next step: The Veyra mainnet upgrade is scheduled for November 24, bringing new RWA and institutional infrastructure features.
Can Injective turn institutional interest into sustained network activity?
$INJ
{future}(INJUSDT)
.
.
.
.
#INJ #Injective #RWA板块涨势强劲
Not financial advice. DYOR.
🏦 $INJ : INJECTIVE'S TOKENIZED MORTGAGE VALUE CROSSES $1.5B!
Injective is gaining attention in the real-world asset (RWA) sector:
- November 19: Pentiv added $524.8 million in prime mortgage records to Injective.
- New milestone: Its on-chain mortgage registry surpassed $1.5 billion.
- Veyra upgrade: Governance proposal #717 passed with 99.51% support.
- Next step: The Veyra mainnet upgrade is scheduled for November 24, bringing new RWA and institutional infrastructure features.
Can Injective turn institutional interest into sustained network activity?
$INJ
.
.
.
.
#INJ #Injective #RWA板块涨势强劲
Not financial advice. DYOR.
Injective is gaining attention in the real-world asset (RWA) sector:
- November 19: Pentiv added $524.8 million in prime mortgage records to Injective.
- New milestone: Its on-chain mortgage registry surpassed $1.5 billion.
- Veyra upgrade: Governance proposal #717 passed with 99.51% support.
- Next step: The Veyra mainnet upgrade is scheduled for November 24, bringing new RWA and institutional infrastructure features.
Can Injective turn institutional interest into sustained network activity?
$INJ
.
.
.
.
#INJ #Injective #RWA板块涨势强劲
Not financial advice. DYOR.

181

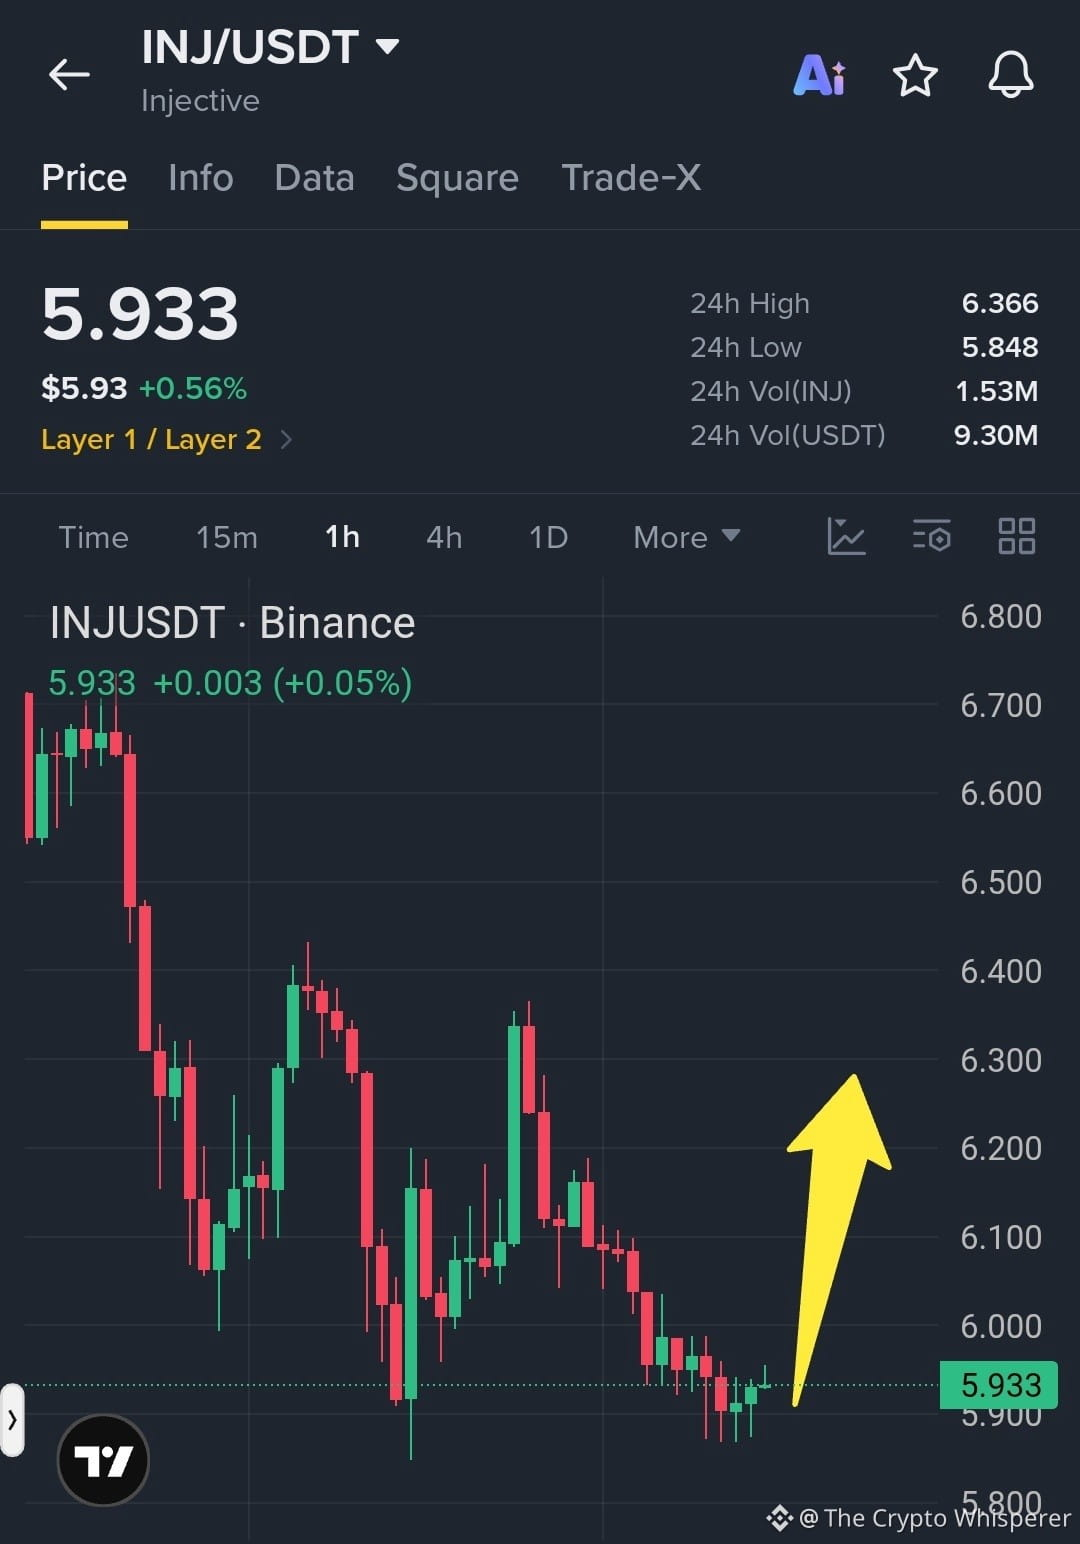
$INJ - LONG TRADE 📈💥
Entry Zone: $5.90 – $5.96
Stop Loss: $5.82
- TP1: $6.05
- TP2: $6.18
- TP3: $6.30
INJ is showing signs of a potential bullish recovery after testing the $5.90 support zone. Buyers are attempting to regain momentum. A breakout above $6.00 could open the door toward $6.18 and $6.30. Watch for confirmation before entering.
#INJ #CryptoSignals #Binance
{spot}(INJUSDT)
$INJ - LONG TRADE 📈💥
Entry Zone: $5.90 – $5.96
Stop Loss: $5.82
- TP1: $6.05
- TP2: $6.18
- TP3: $6.30
INJ is showing signs of a potential bullish recovery after testing the $5.90 support zone. Buyers are attempting to regain momentum. A breakout above $6.00 could open the door toward $6.18 and $6.30. Watch for confirmation before entering.
#INJ #CryptoSignals #Binance
Entry Zone: $5.90 – $5.96
Stop Loss: $5.82
- TP1: $6.05
- TP2: $6.18
- TP3: $6.30
INJ is showing signs of a potential bullish recovery after testing the $5.90 support zone. Buyers are attempting to regain momentum. A breakout above $6.00 could open the door toward $6.18 and $6.30. Watch for confirmation before entering.
#INJ #CryptoSignals #Binance
25

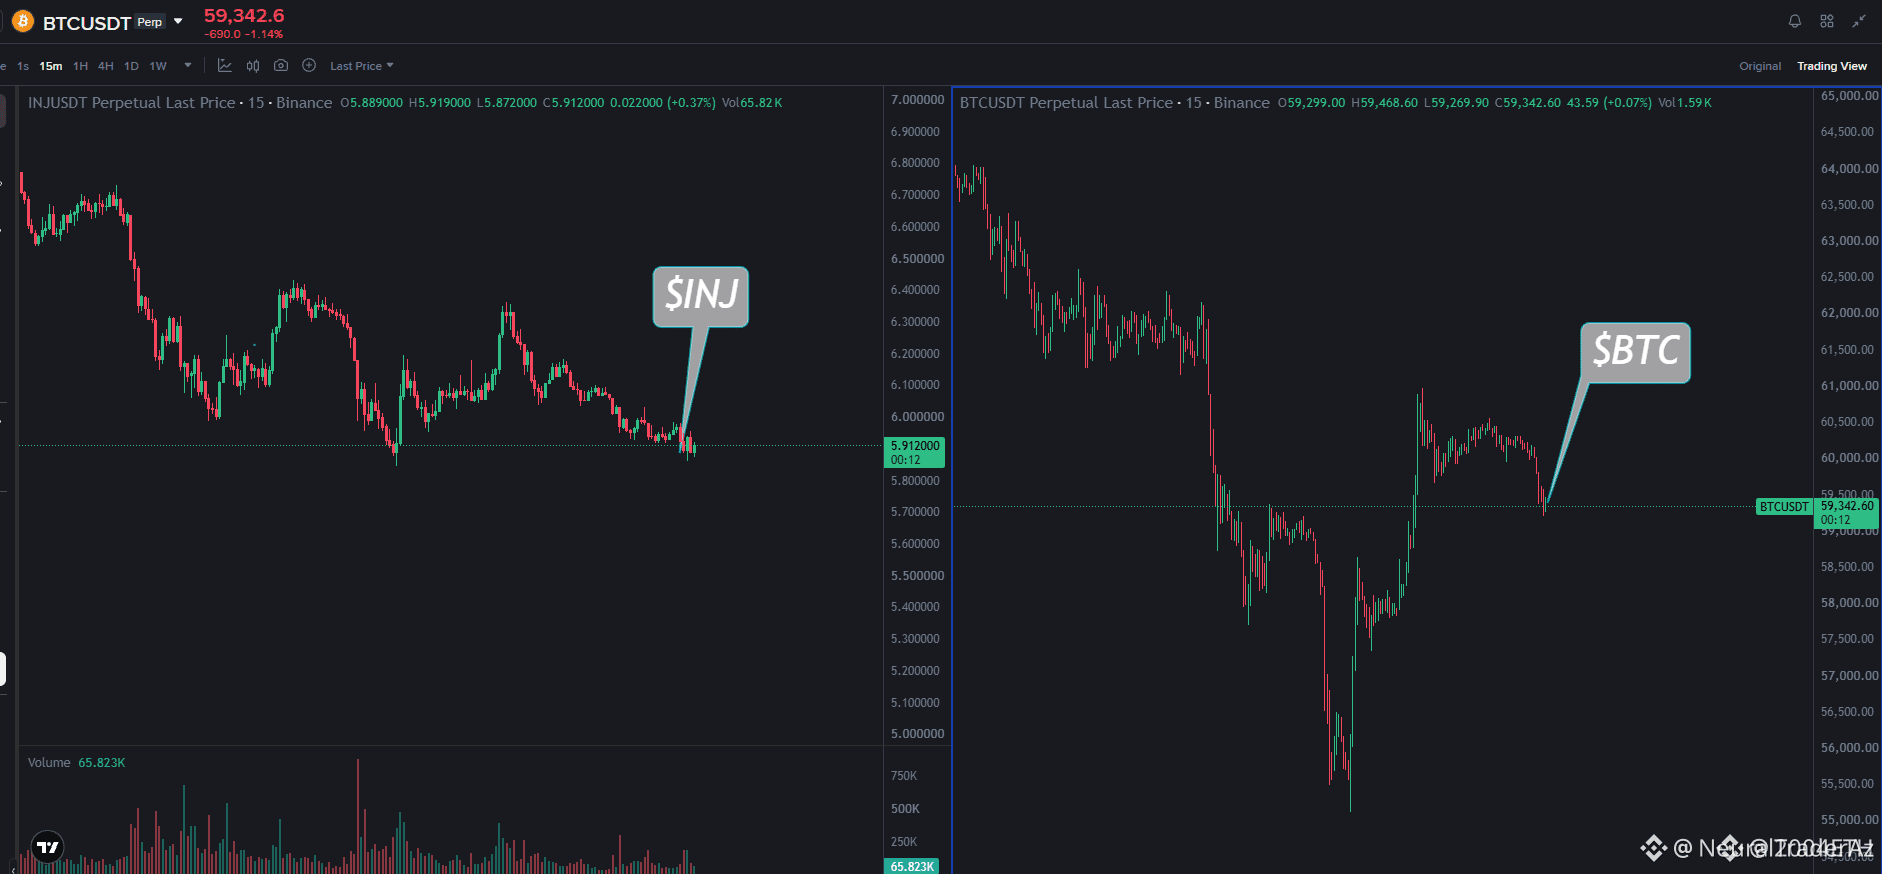
🚨 $INJ LOSES CRITICAL SUPPORT STRUCTURE AS INSTITUTIONAL DISTRIBUTION ACCELERATES 📉
Entry: 6.05 – 6.20 ⚡
Target: 4.90 🚀
Stop Loss: 7 ⚠️
The breakdown below the key seven dollar handle marked a definitive shift in market structure for $INJ . Smart money distribution remains heavy on lower timeframes, with successive rallies failing to reclaim prior highs and trapped liquidity fueling the downward momentum. 📊
Even if broader market sentiment stabilizes, this specific asset exhibits independent selling pressure that points toward further downside exhaustion. 🌊
Are you positioning for this continuation wave or waiting for a structural retest? 👇
⚠️ Not financial advice. Always manage your risk. 🛡️
🏷️ #INJ #ShortSetup #MarketStructure #Crypto
📉 🦈
🚨 $INJ LOSES CRITICAL SUPPORT STRUCTURE AS INSTITUTIONAL DISTRIBUTION ACCELERATES 📉
Entry: 6.05 – 6.20 ⚡
Target: 4.90 🚀
Stop Loss: 7 ⚠️
The breakdown below the key seven dollar handle marked a definitive shift in market structure for $INJ . Smart money distribution remains heavy on lower timeframes, with successive rallies failing to reclaim prior highs and trapped liquidity fueling the downward momentum. 📊
Even if broader market sentiment stabilizes, this specific asset exhibits independent selling pressure that points toward further downside exhaustion. 🌊
Are you positioning for this continuation wave or waiting for a structural retest? 👇
⚠️ Not financial advice. Always manage your risk. 🛡️
🏷️ #INJ #ShortSetup #MarketStructure #Crypto
📉 🦈
Entry: 6.05 – 6.20 ⚡
Target: 4.90 🚀
Stop Loss: 7 ⚠️
The breakdown below the key seven dollar handle marked a definitive shift in market structure for $INJ . Smart money distribution remains heavy on lower timeframes, with successive rallies failing to reclaim prior highs and trapped liquidity fueling the downward momentum. 📊
Even if broader market sentiment stabilizes, this specific asset exhibits independent selling pressure that points toward further downside exhaustion. 🌊
Are you positioning for this continuation wave or waiting for a structural retest? 👇
⚠️ Not financial advice. Always manage your risk. 🛡️
🏷️ #INJ #ShortSetup #MarketStructure #Crypto
📉 🦈

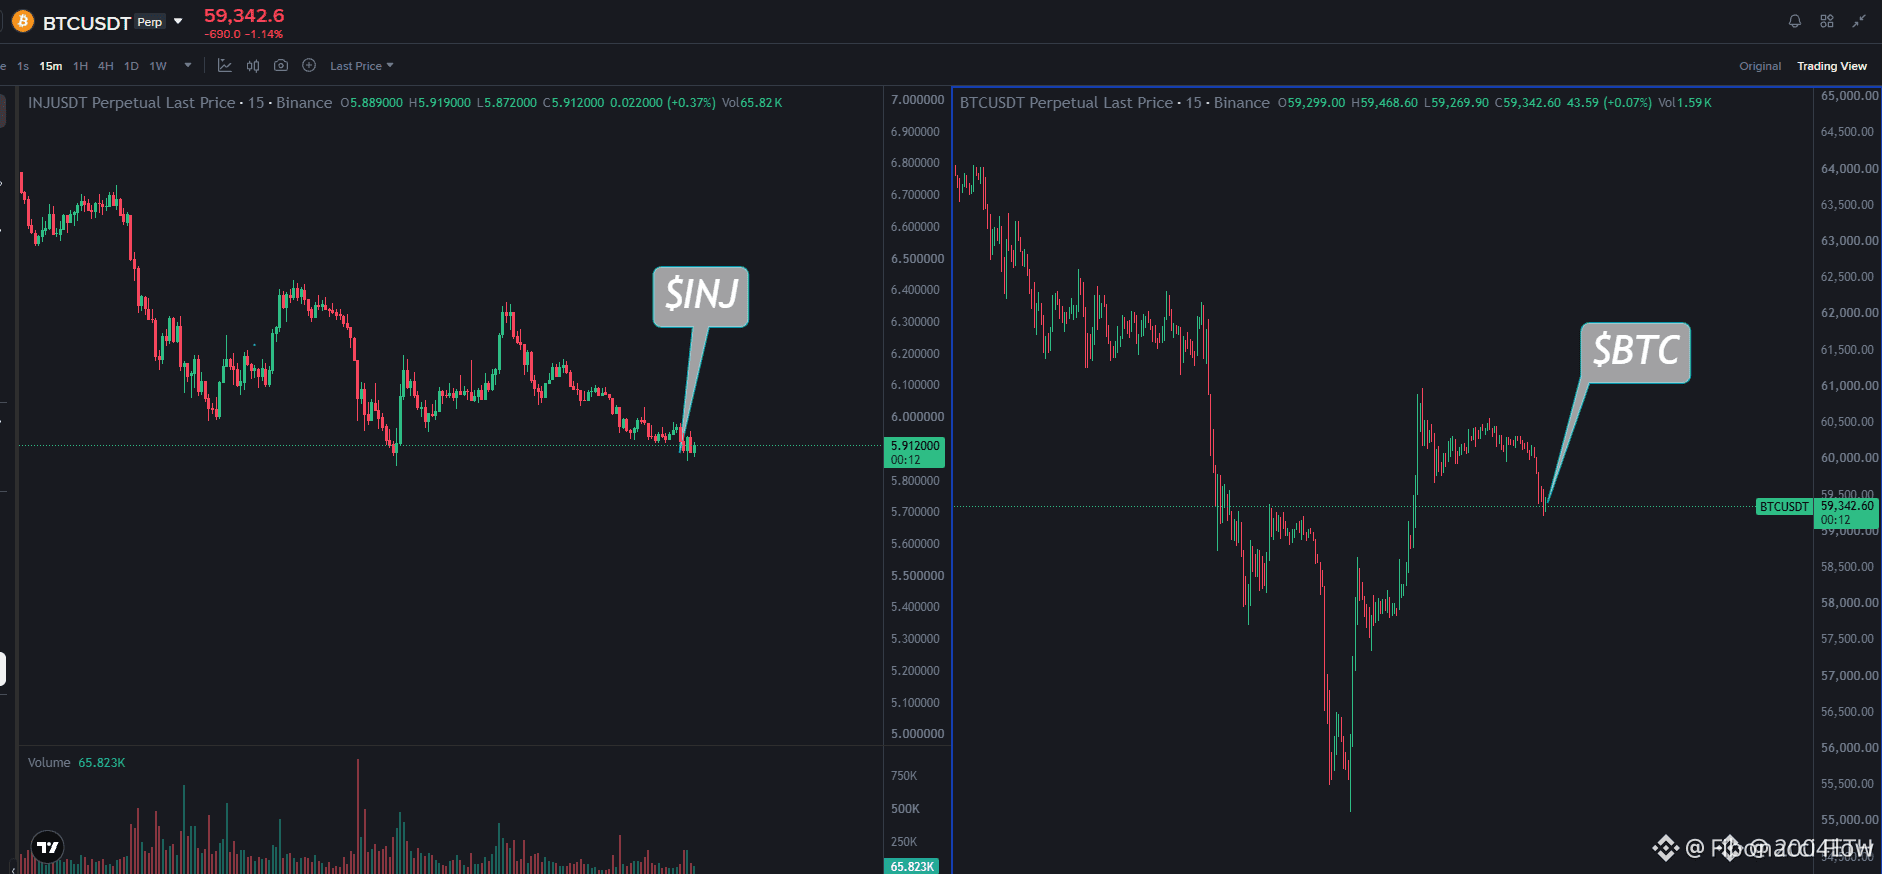
🔴 $INJ SHATTERS KEY SUPPORT AS SELLERS TAKE FIRM COMMAND OF ORDER FLOW 📉
Entry: 6.05 - 6.20 ⚡
Target: 5.60 🚀
Stop Loss: 7 ⚠️
The breakdown below the seven dollar handle stripped away the last remaining defense for $INJ . Every minor relief bounce is getting aggressively absorbed by sellers printing lower highs across every lower timeframe. 📊
Even if broader market momentum attempts a temporary recovery, this asset displays intense structural weakness and independent downside pressure. The path of least resistance points straight downward as liquidity thins out beneath current support. ⚡
💬 Are you looking to position short on this relief rally or waiting for deeper targets to print? 👇
⚠️ Not financial advice. Always manage your risk. 🛡️
🏷️ #INJ #ShortSetup #Bearish #Orderflow #Crypto
🩸 🔻
🔴 $INJ SHATTERS KEY SUPPORT AS SELLERS TAKE FIRM COMMAND OF ORDER FLOW 📉
Entry: 6.05 - 6.20 ⚡
Target: 5.60 🚀
Stop Loss: 7 ⚠️
The breakdown below the seven dollar handle stripped away the last remaining defense for $INJ . Every minor relief bounce is getting aggressively absorbed by sellers printing lower highs across every lower timeframe. 📊
Even if broader market momentum attempts a temporary recovery, this asset displays intense structural weakness and independent downside pressure. The path of least resistance points straight downward as liquidity thins out beneath current support. ⚡
💬 Are you looking to position short on this relief rally or waiting for deeper targets to print? 👇
⚠️ Not financial advice. Always manage your risk. 🛡️
🏷️ #INJ #ShortSetup #Bearish #Orderflow #Crypto
🩸 🔻
Entry: 6.05 - 6.20 ⚡
Target: 5.60 🚀
Stop Loss: 7 ⚠️
The breakdown below the seven dollar handle stripped away the last remaining defense for $INJ . Every minor relief bounce is getting aggressively absorbed by sellers printing lower highs across every lower timeframe. 📊
Even if broader market momentum attempts a temporary recovery, this asset displays intense structural weakness and independent downside pressure. The path of least resistance points straight downward as liquidity thins out beneath current support. ⚡
💬 Are you looking to position short on this relief rally or waiting for deeper targets to print? 👇
⚠️ Not financial advice. Always manage your risk. 🛡️
🏷️ #INJ #ShortSetup #Bearish #Orderflow #Crypto
🩸 🔻
16

·
--
Red days clarify market intent faster than chasing green candles.
$INJ is down -3.01% at $5.889 as volume cools off.
Current checklist:
- Stabilization: Defending the observed 5.848 range low.
- Invalidation: Breaking below 5.848 signals continued downward drift.
Are you watching for buyers to defend 5.848, or does a drop below it confirm that sellers remain in control?
Tap $INJ for the live chart. #INJ #BinanceSquare
Red days clarify market intent faster than chasing green candles.
$INJ is down -3.01% at $5.889 as volume cools off.
Current checklist:
- Stabilization: Defending the observed 5.848 range low.
- Invalidation: Breaking below 5.848 signals continued downward drift.
Are you watching for buyers to defend 5.848, or does a drop below it confirm that sellers remain in control?
Tap $INJ for the live chart. #INJ #BinanceSquare
$INJ is down -3.01% at $5.889 as volume cools off.
Current checklist:
- Stabilization: Defending the observed 5.848 range low.
- Invalidation: Breaking below 5.848 signals continued downward drift.
Are you watching for buyers to defend 5.848, or does a drop below it confirm that sellers remain in control?
Tap $INJ for the live chart. #INJ #BinanceSquare
28

·
--
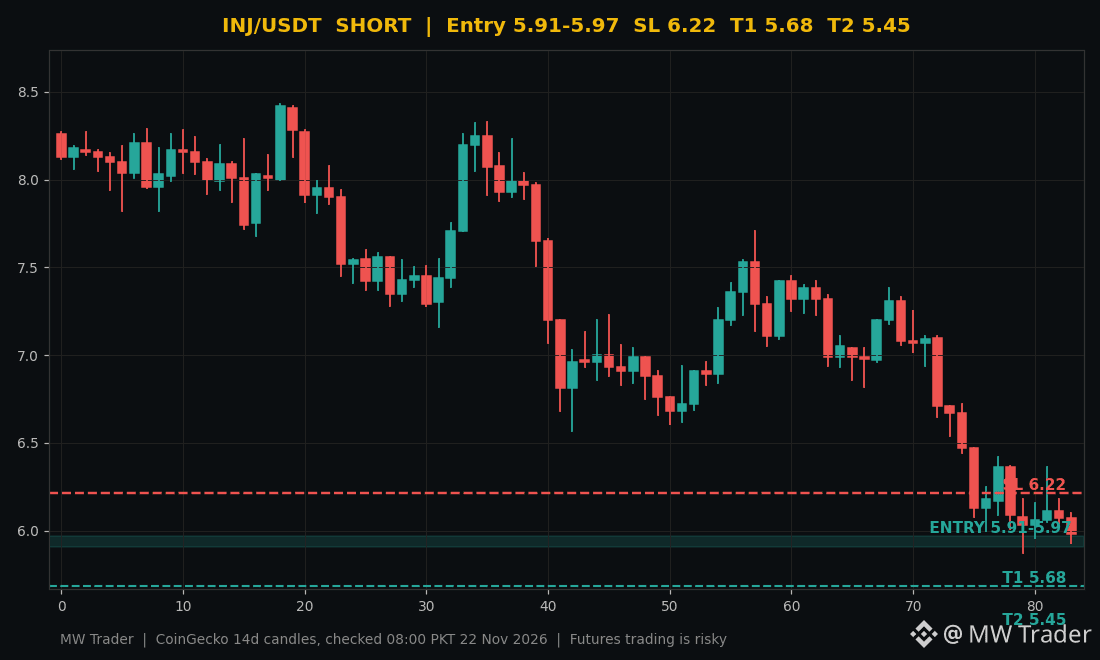
$INJ #INJ 📉 Injective is down 6.12 percent, the weakest of the majors today, and shorts are in control.
Injective is trading at $5.91, down 5.89 percent in 24 hours, while Bitcoin is up 1.52 percent, so INJ is falling against a rising market. The Binance INJUSDT perpetual carries about $24.7 million of open interest, funding at minus 0.0113 percent per 8 hours, which means shorts pay longs, and 53 percent of accounts are short. Open interest rose 3.1 percent while the price fell, which tells me new shorts are opening, not old longs giving up. My plan is a short from the entry zone with the stop above the recent range, because a bounce back into the entry is the short zone, not a reason to chase lower.
Entry: 5.91 to 5.97
Stop loss: 6.22
Target 1: 5.68
Target 2: 5.45
Does INJ break $5.45 next, or does it squeeze back above $6.22 first? 🤔
Chart: CoinGecko 14 day candles with entry, stop and targets marked.
Futures trading is risky, trade small and manage risk. ⚠️
Follow for more trades.
#Injective #Crypto #FuturesTrading #TradingSignals
$INJ #INJ 📉 Injective is down 6.12 percent, the weakest of the majors today, and shorts are in control.
Injective is trading at $5.91, down 5.89 percent in 24 hours, while Bitcoin is up 1.52 percent, so INJ is falling against a rising market. The Binance INJUSDT perpetual carries about $24.7 million of open interest, funding at minus 0.0113 percent per 8 hours, which means shorts pay longs, and 53 percent of accounts are short. Open interest rose 3.1 percent while the price fell, which tells me new shorts are opening, not old longs giving up. My plan is a short from the entry zone with the stop above the recent range, because a bounce back into the entry is the short zone, not a reason to chase lower.
Entry: 5.91 to 5.97
Stop loss: 6.22
Target 1: 5.68
Target 2: 5.45
Does INJ break $5.45 next, or does it squeeze back above $6.22 first? 🤔
Chart: CoinGecko 14 day candles with entry, stop and targets marked.
Futures trading is risky, trade small and manage risk. ⚠️
Follow for more trades.
#Injective #Crypto #FuturesTrading #TradingSignals
Injective is trading at $5.91, down 5.89 percent in 24 hours, while Bitcoin is up 1.52 percent, so INJ is falling against a rising market. The Binance INJUSDT perpetual carries about $24.7 million of open interest, funding at minus 0.0113 percent per 8 hours, which means shorts pay longs, and 53 percent of accounts are short. Open interest rose 3.1 percent while the price fell, which tells me new shorts are opening, not old longs giving up. My plan is a short from the entry zone with the stop above the recent range, because a bounce back into the entry is the short zone, not a reason to chase lower.
Entry: 5.91 to 5.97
Stop loss: 6.22
Target 1: 5.68
Target 2: 5.45
Does INJ break $5.45 next, or does it squeeze back above $6.22 first? 🤔
Chart: CoinGecko 14 day candles with entry, stop and targets marked.
Futures trading is risky, trade small and manage risk. ⚠️
Follow for more trades.
#Injective #Crypto #FuturesTrading #TradingSignals
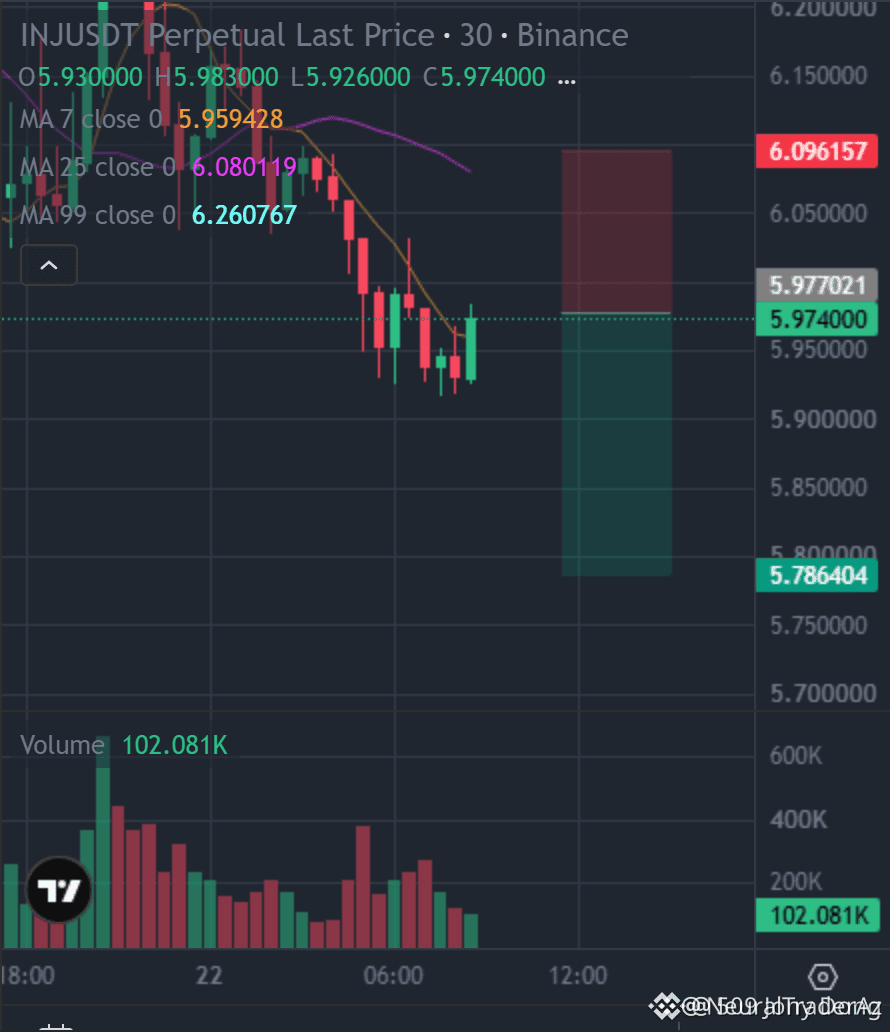
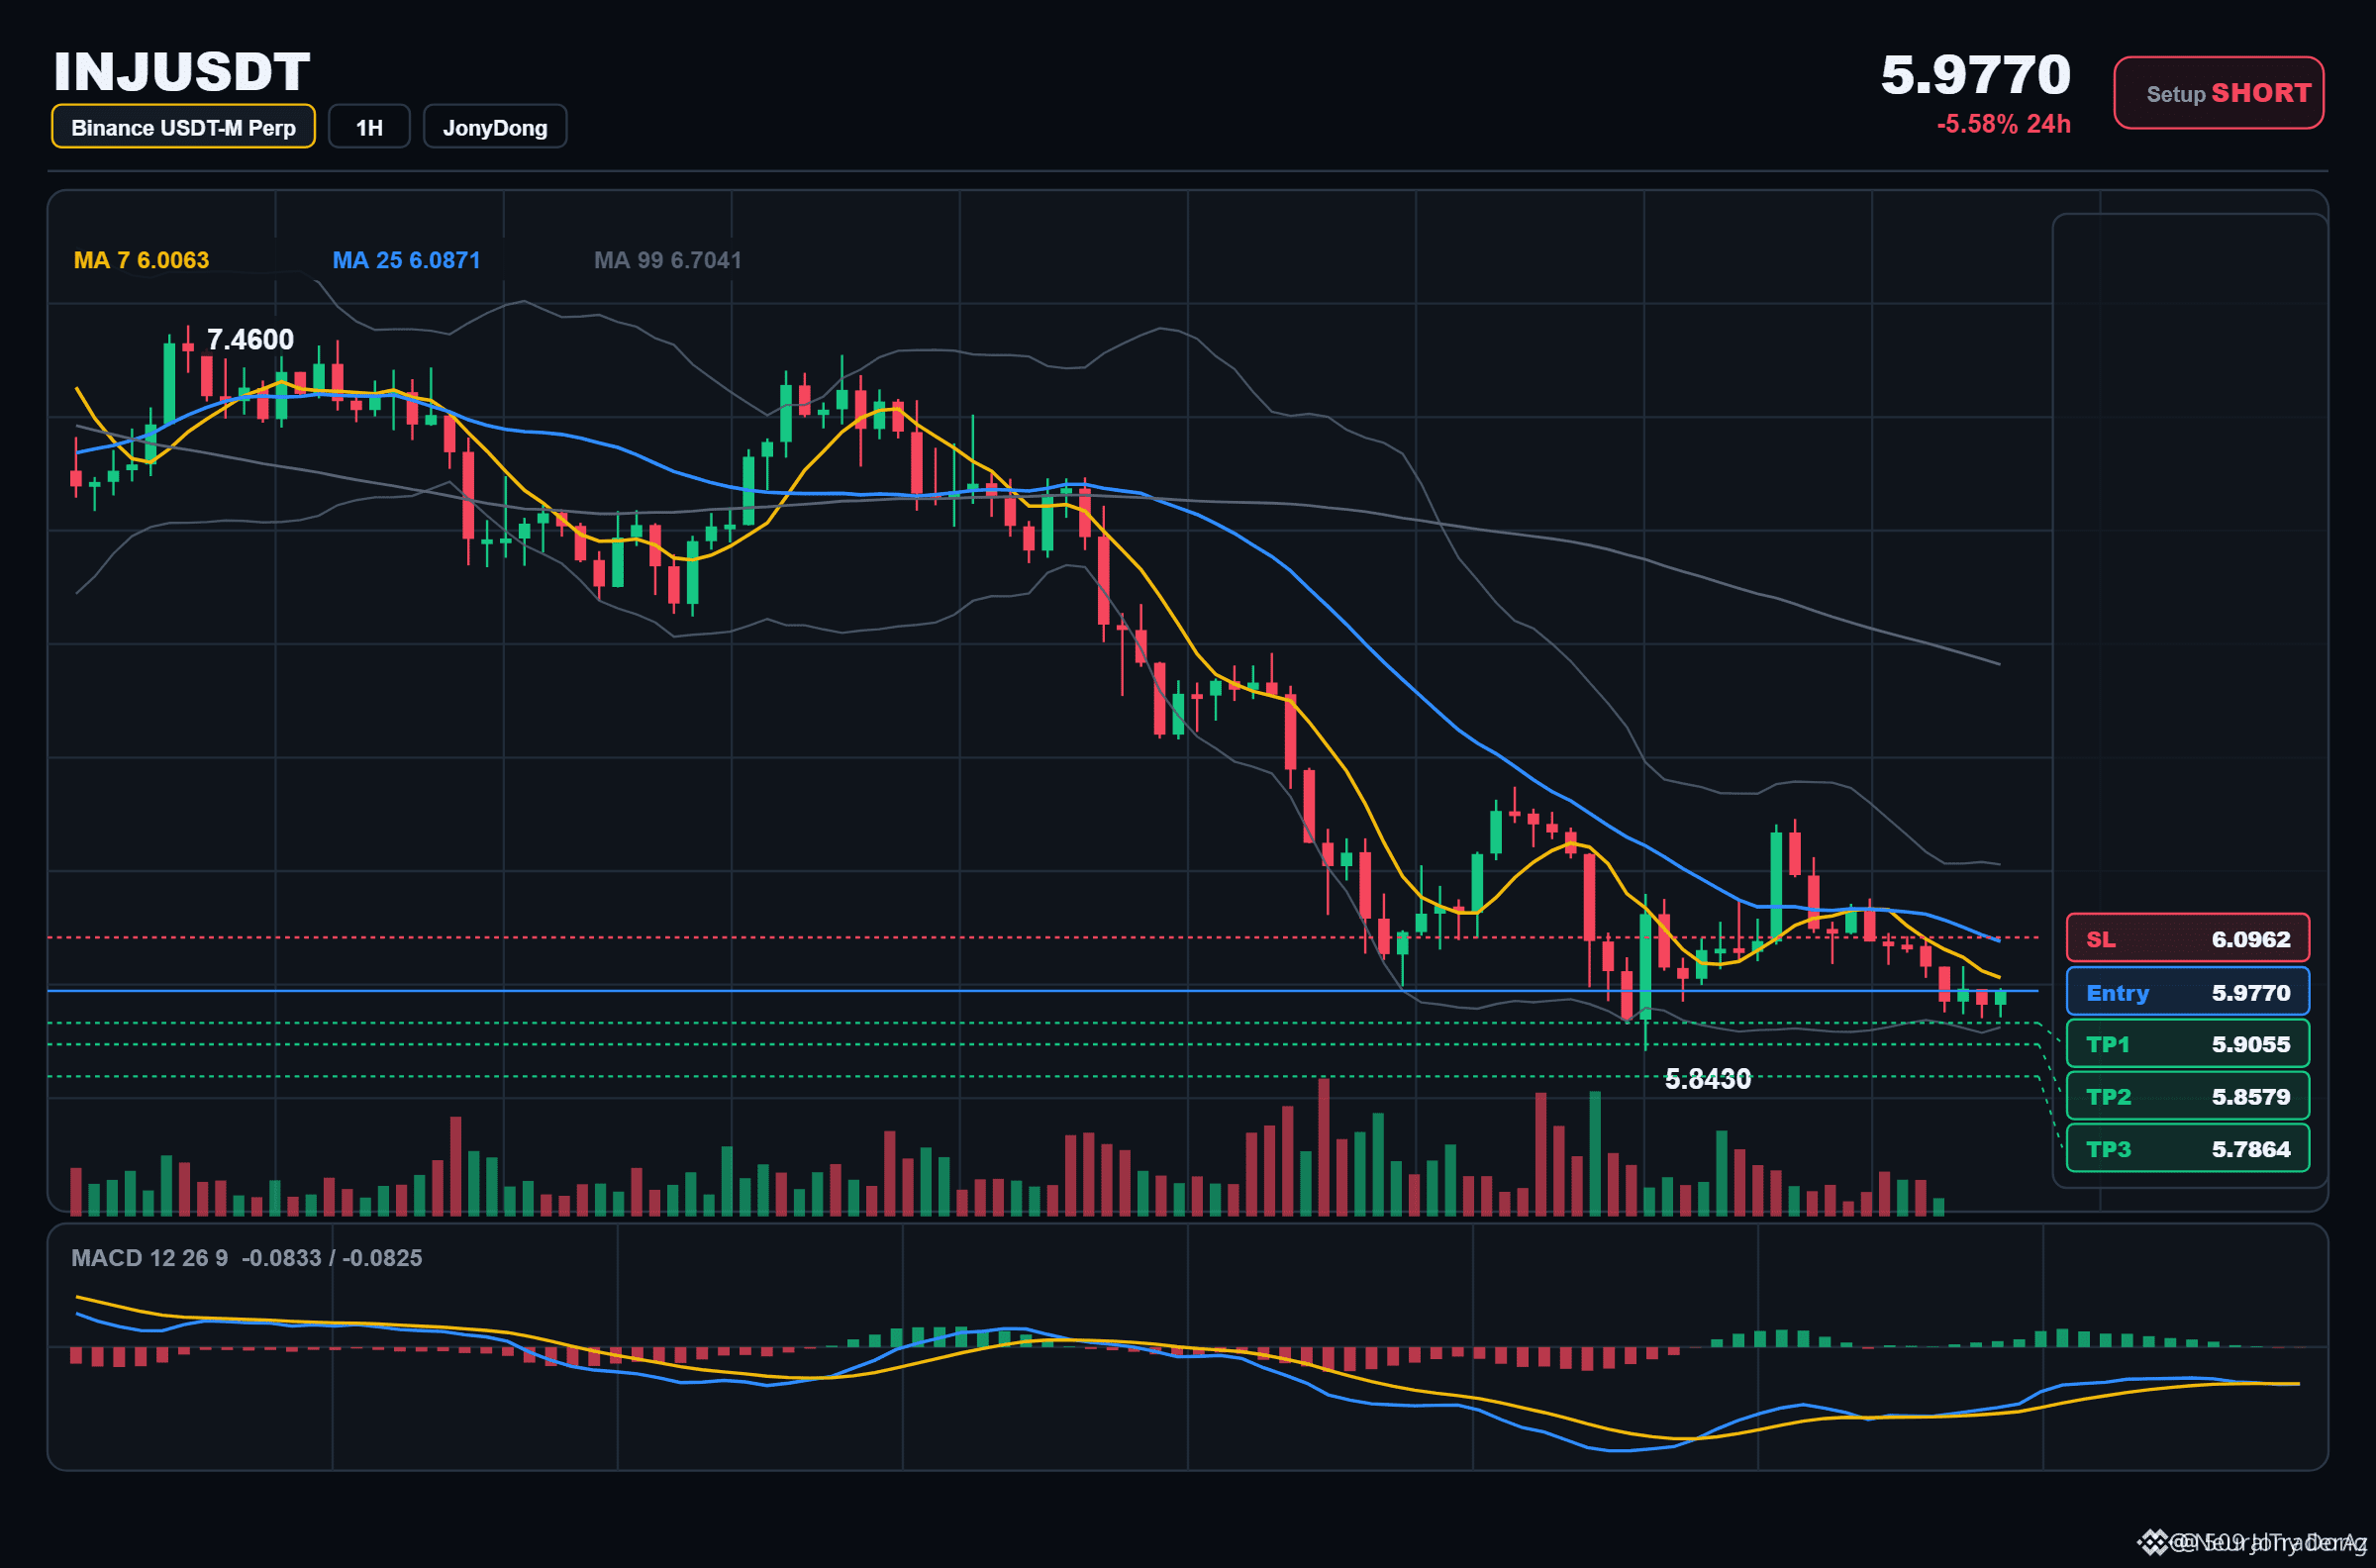
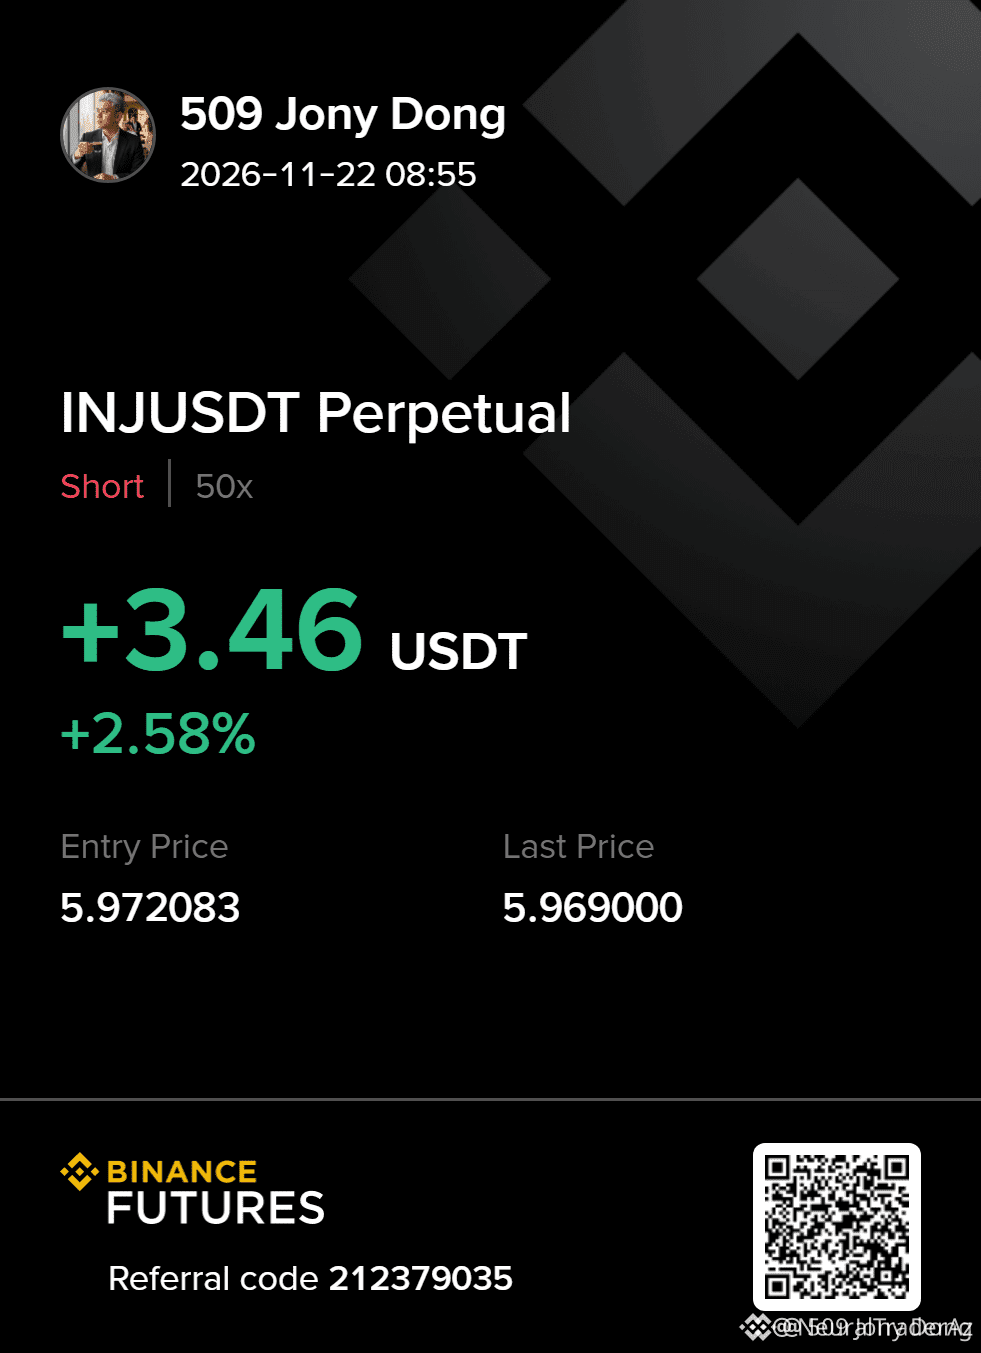
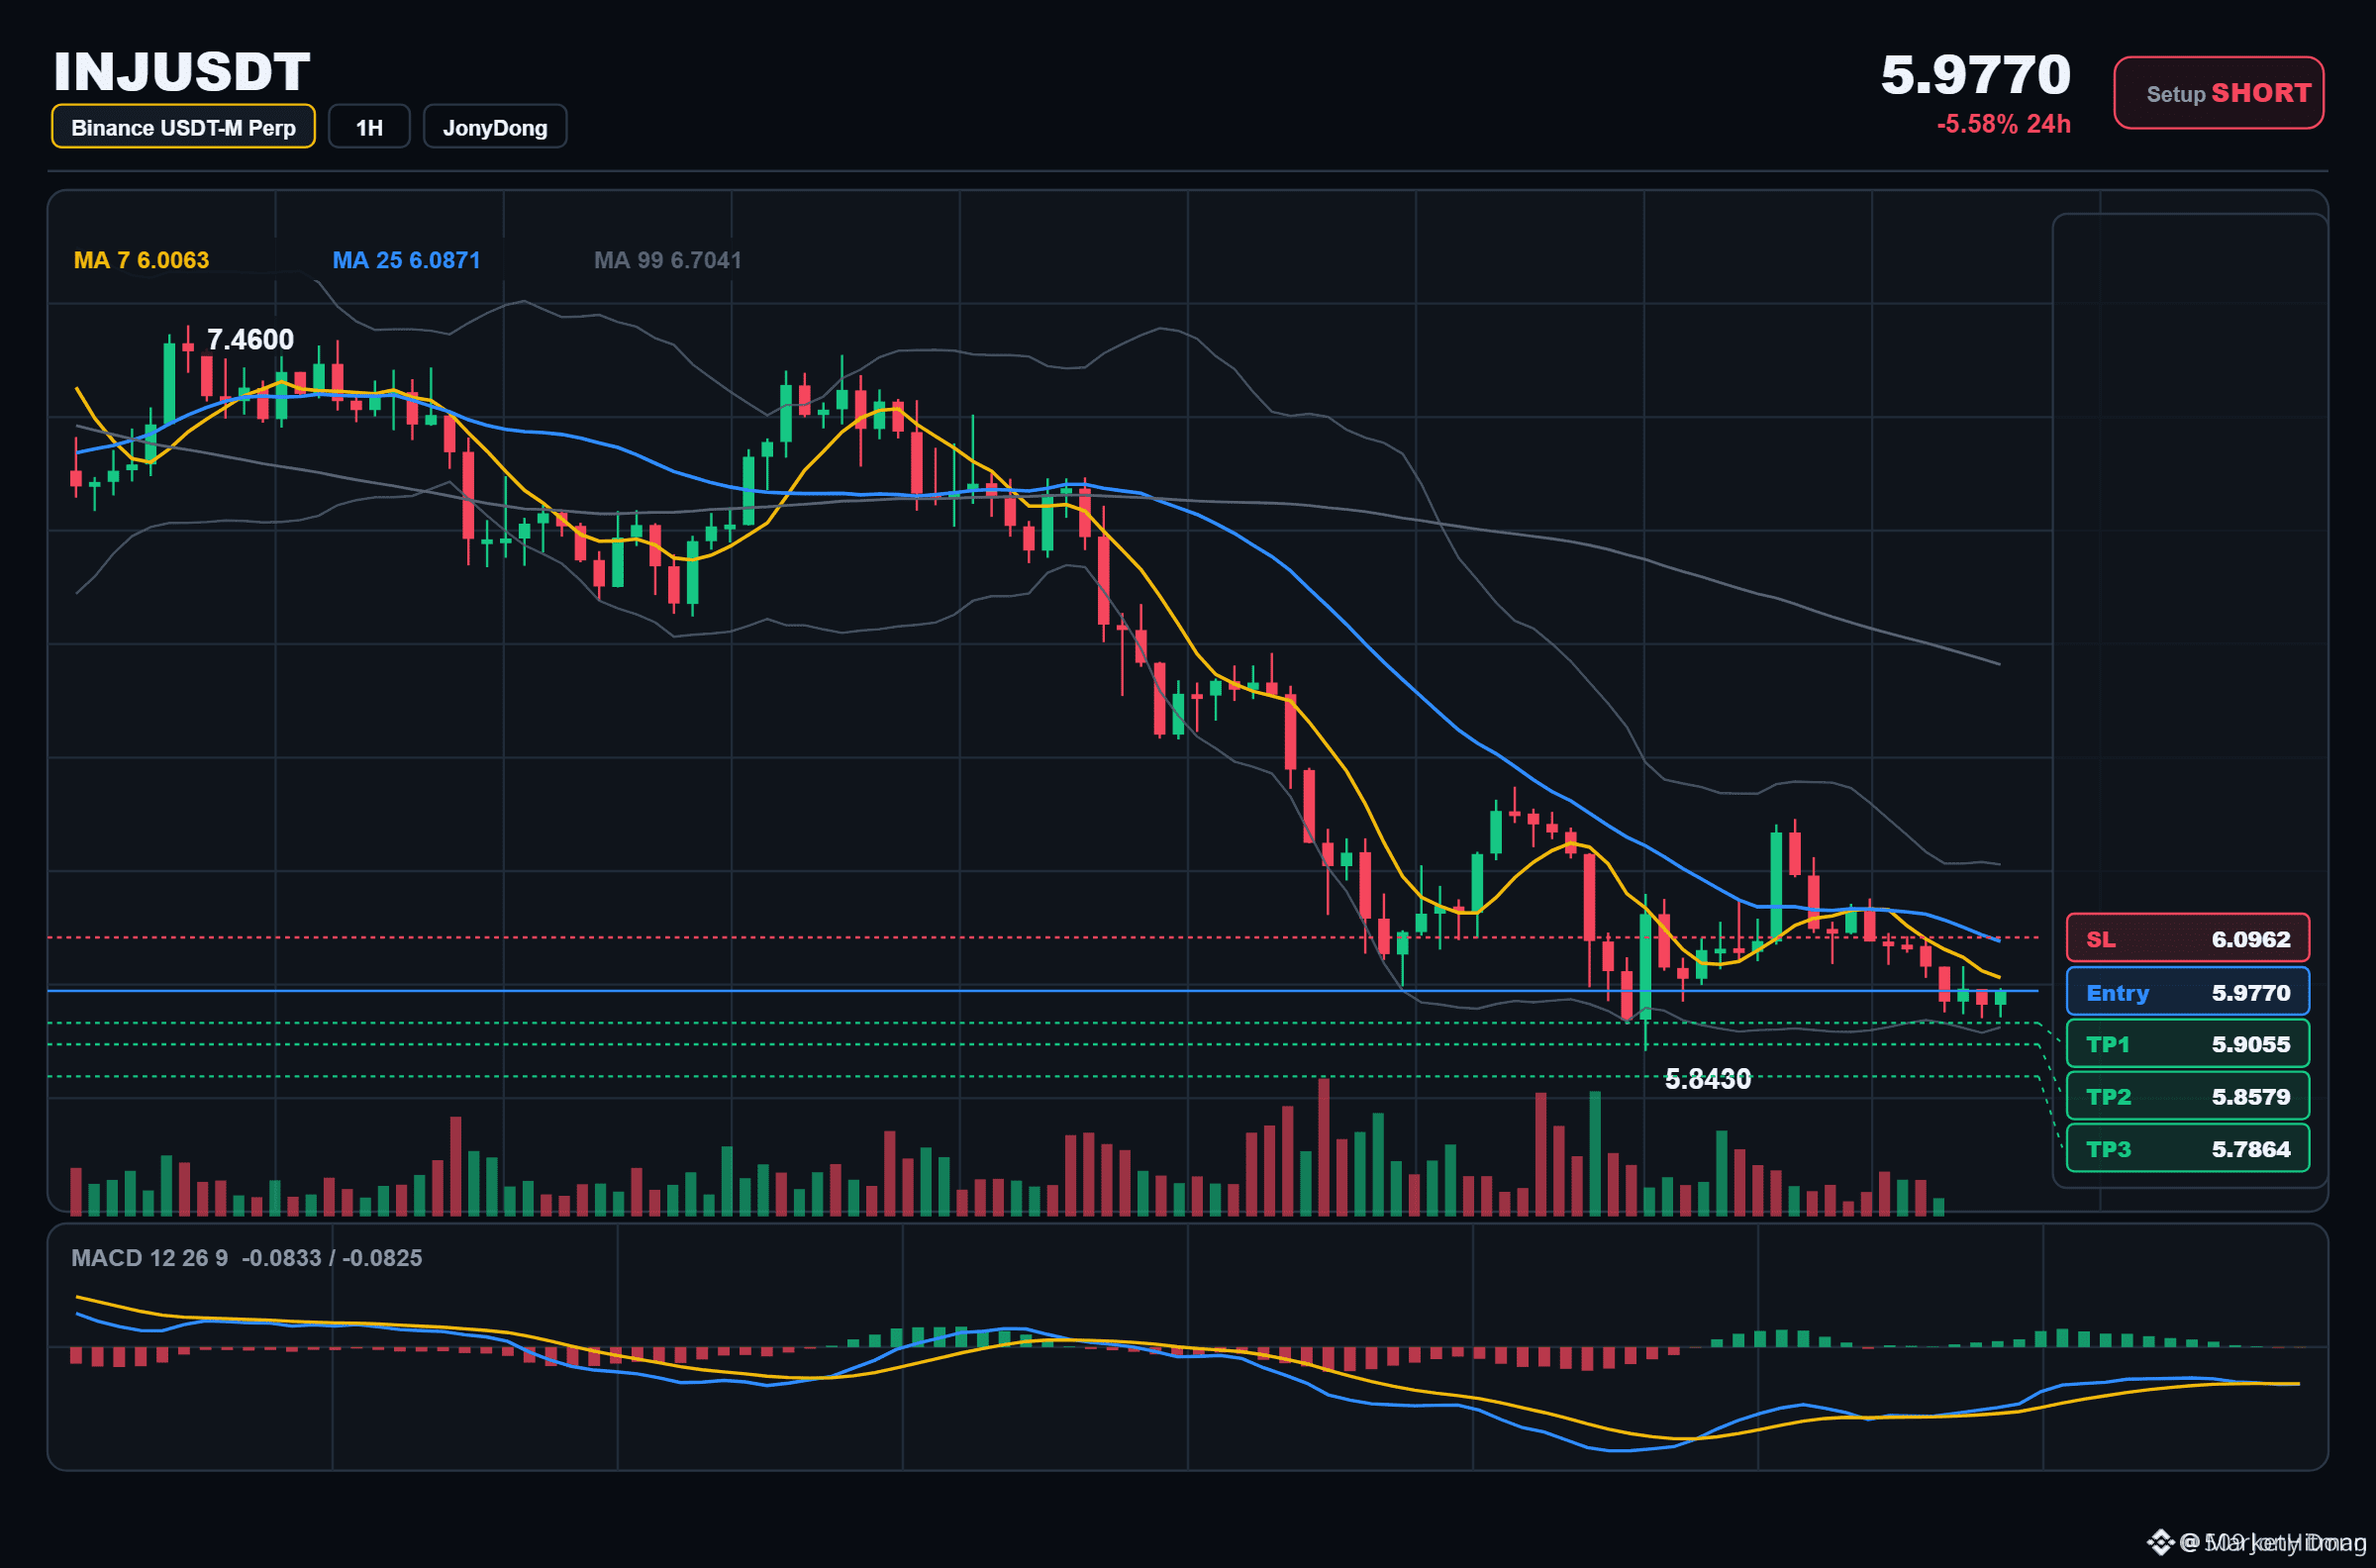
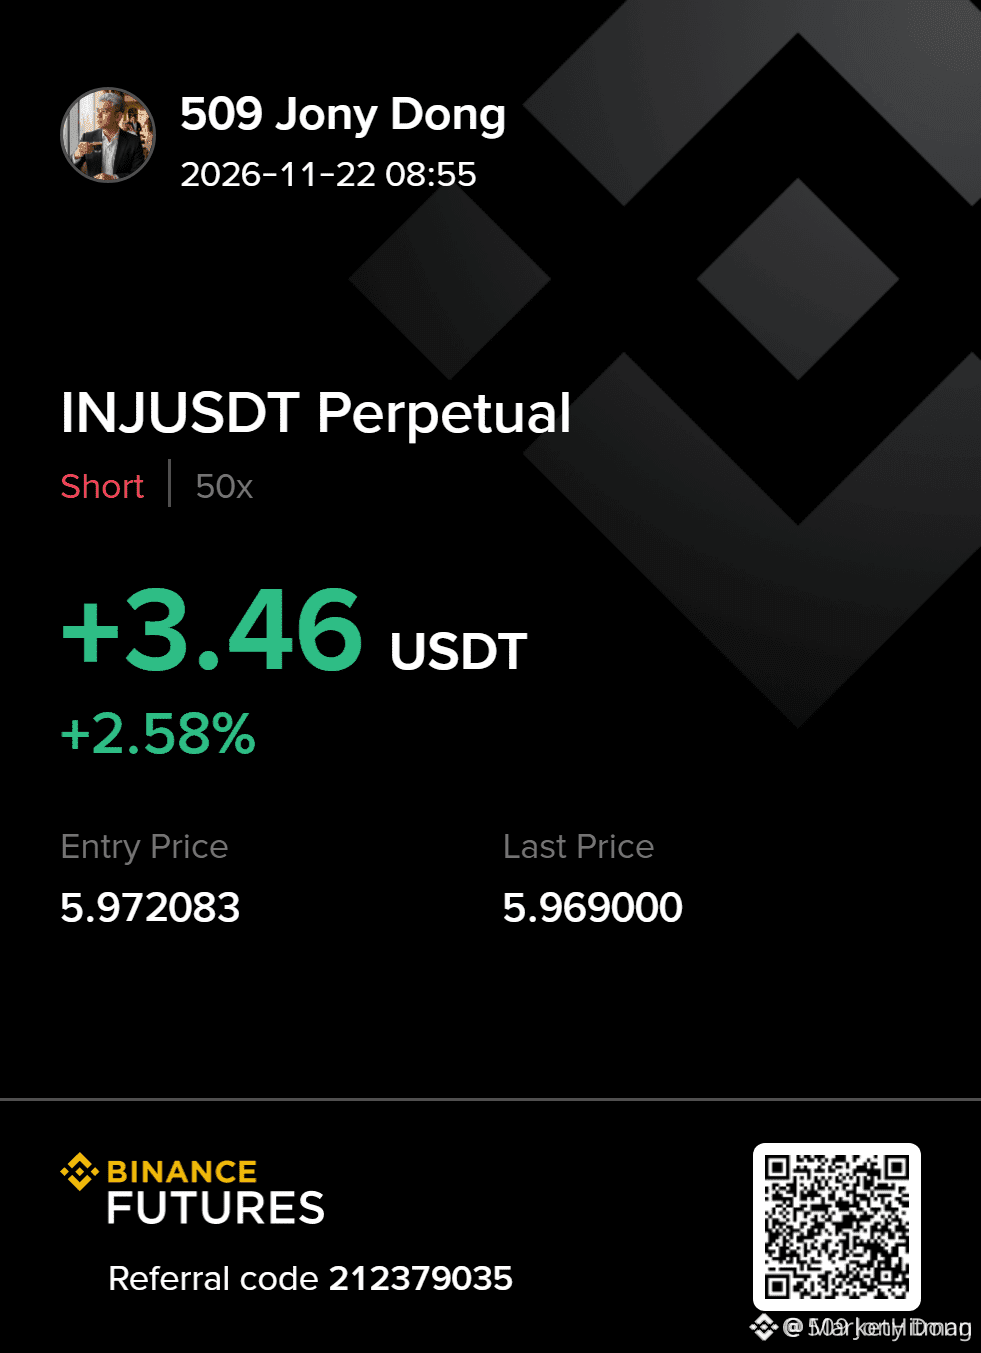
🚨 $INJ PRESSING INTO MAJOR DAILY EMA RESISTANCE FOR A CLEAN SHORT CONTINUATION! 📉
Entry: 5.967–5.987 ⚡
Target: 5.906 🚀
Stop Loss: 6.096 ⚠️
Sellers are maintaining firm control as price probes the daily EMA200 resistance band. Institutional order flow shows strong downside pressure building while lower timeframe structure fails to reclaim key moving averages. 📊
We are eyeing a methodical short entry on any rejection wick back below the local supply cluster. Risk parameters are tightly defined above invalidation to maintain a pristine risk-to-reward profile. 💡
💬 Are you positioning for this trend continuation breakdown or waiting for a deeper sweep? 👇
⚠️ Not financial advice. Always manage your risk. 🛡️
🏷️ #INJ #ShortSetup #OrderBlock #Crypto
🦈 📉
🚨 $INJ PRESSING INTO MAJOR DAILY EMA RESISTANCE FOR A CLEAN SHORT CONTINUATION! 📉
Entry: 5.967–5.987 ⚡
Target: 5.906 🚀
Stop Loss: 6.096 ⚠️
Sellers are maintaining firm control as price probes the daily EMA200 resistance band. Institutional order flow shows strong downside pressure building while lower timeframe structure fails to reclaim key moving averages. 📊
We are eyeing a methodical short entry on any rejection wick back below the local supply cluster. Risk parameters are tightly defined above invalidation to maintain a pristine risk-to-reward profile. 💡
💬 Are you positioning for this trend continuation breakdown or waiting for a deeper sweep? 👇
⚠️ Not financial advice. Always manage your risk. 🛡️
🏷️ #INJ #ShortSetup #OrderBlock #Crypto
🦈 📉
Entry: 5.967–5.987 ⚡
Target: 5.906 🚀
Stop Loss: 6.096 ⚠️
Sellers are maintaining firm control as price probes the daily EMA200 resistance band. Institutional order flow shows strong downside pressure building while lower timeframe structure fails to reclaim key moving averages. 📊
We are eyeing a methodical short entry on any rejection wick back below the local supply cluster. Risk parameters are tightly defined above invalidation to maintain a pristine risk-to-reward profile. 💡
💬 Are you positioning for this trend continuation breakdown or waiting for a deeper sweep? 👇
⚠️ Not financial advice. Always manage your risk. 🛡️
🏷️ #INJ #ShortSetup #OrderBlock #Crypto
🦈 📉
5

·
--
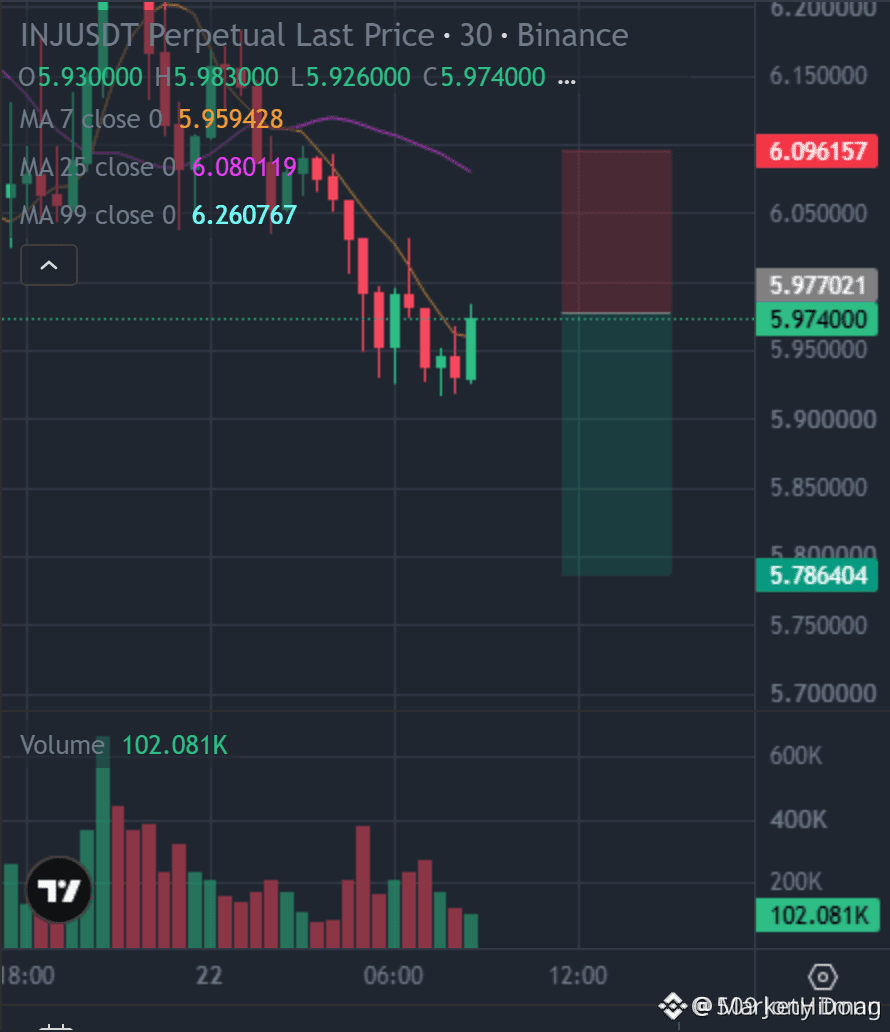
🐻 $INJ IS SLAMMING INTO THE DAILY EMA200 WITH SELLERS READY TO POUNCE! ⚡
Entry: 5.98 ⚡
Target: 5.786 🚀
Stop Loss: 6.096 ⚠️
Bears are firmly dictating terms as price sits compressed beneath the 4H EMA50, leaving upside attempts suffocated by heavy overhead distribution. 📊
The daily structural ceiling at 5.99 acts as an unyielding concrete wall, keeping momentum heavily tilted in favor of the persistent sell-side order flow. 📌
Are you riding this downward wave toward the lower liquidity pockets, or waiting for a cleaner rejection test at resistance? 💬 👇
⚠️ Not financial advice. Always manage your risk. 🛡️
🏷️ #INJ #ShortSetup #Bearish #OrderFlow #Crypto
📉 🦈
🐻 $INJ IS SLAMMING INTO THE DAILY EMA200 WITH SELLERS READY TO POUNCE! ⚡
Entry: 5.98 ⚡
Target: 5.786 🚀
Stop Loss: 6.096 ⚠️
Bears are firmly dictating terms as price sits compressed beneath the 4H EMA50, leaving upside attempts suffocated by heavy overhead distribution. 📊
The daily structural ceiling at 5.99 acts as an unyielding concrete wall, keeping momentum heavily tilted in favor of the persistent sell-side order flow. 📌
Are you riding this downward wave toward the lower liquidity pockets, or waiting for a cleaner rejection test at resistance? 💬 👇
⚠️ Not financial advice. Always manage your risk. 🛡️
🏷️ #INJ #ShortSetup #Bearish #OrderFlow #Crypto
📉 🦈
Entry: 5.98 ⚡
Target: 5.786 🚀
Stop Loss: 6.096 ⚠️
Bears are firmly dictating terms as price sits compressed beneath the 4H EMA50, leaving upside attempts suffocated by heavy overhead distribution. 📊
The daily structural ceiling at 5.99 acts as an unyielding concrete wall, keeping momentum heavily tilted in favor of the persistent sell-side order flow. 📌
Are you riding this downward wave toward the lower liquidity pockets, or waiting for a cleaner rejection test at resistance? 💬 👇
⚠️ Not financial advice. Always manage your risk. 🛡️
🏷️ #INJ #ShortSetup #Bearish #OrderFlow #Crypto
📉 🦈
5

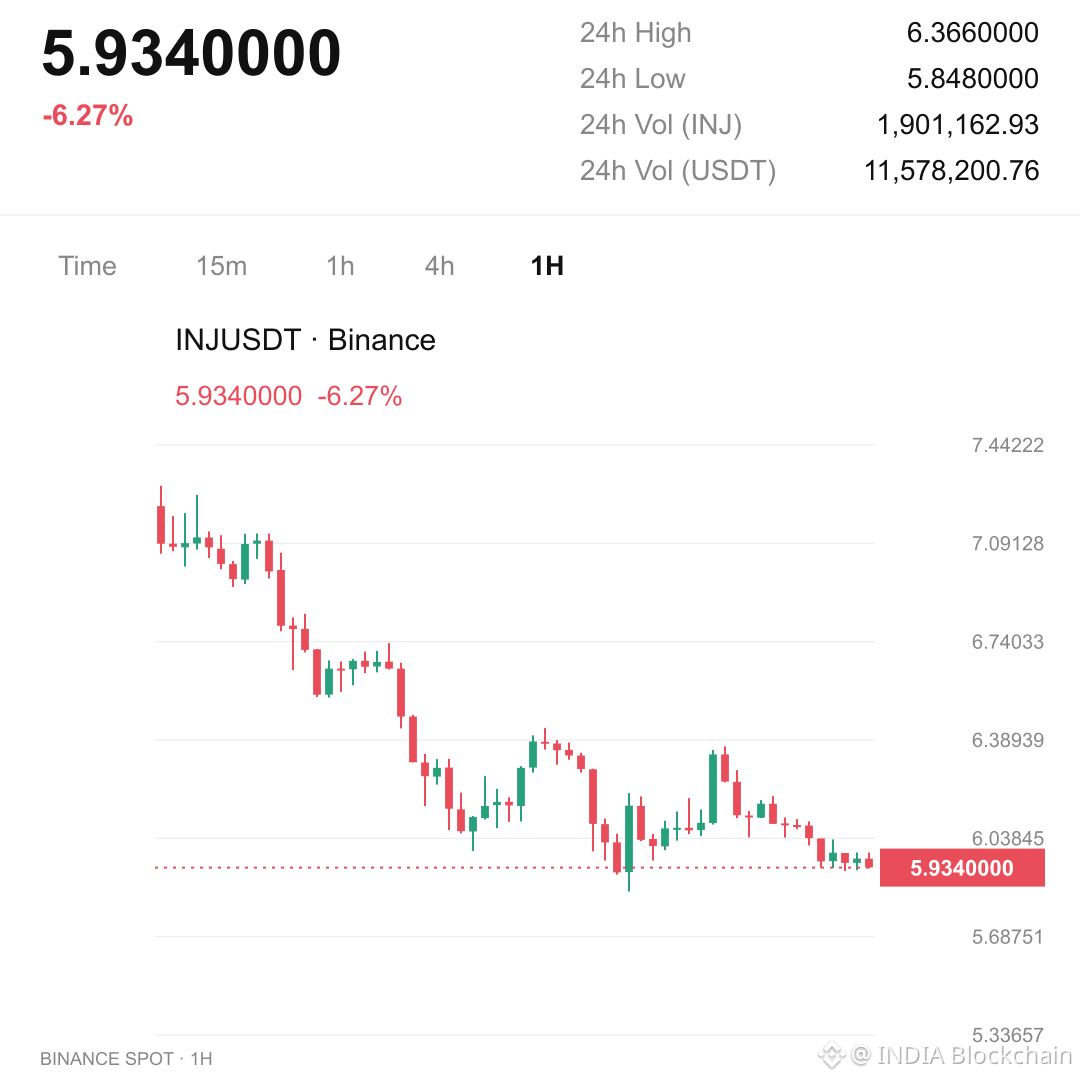
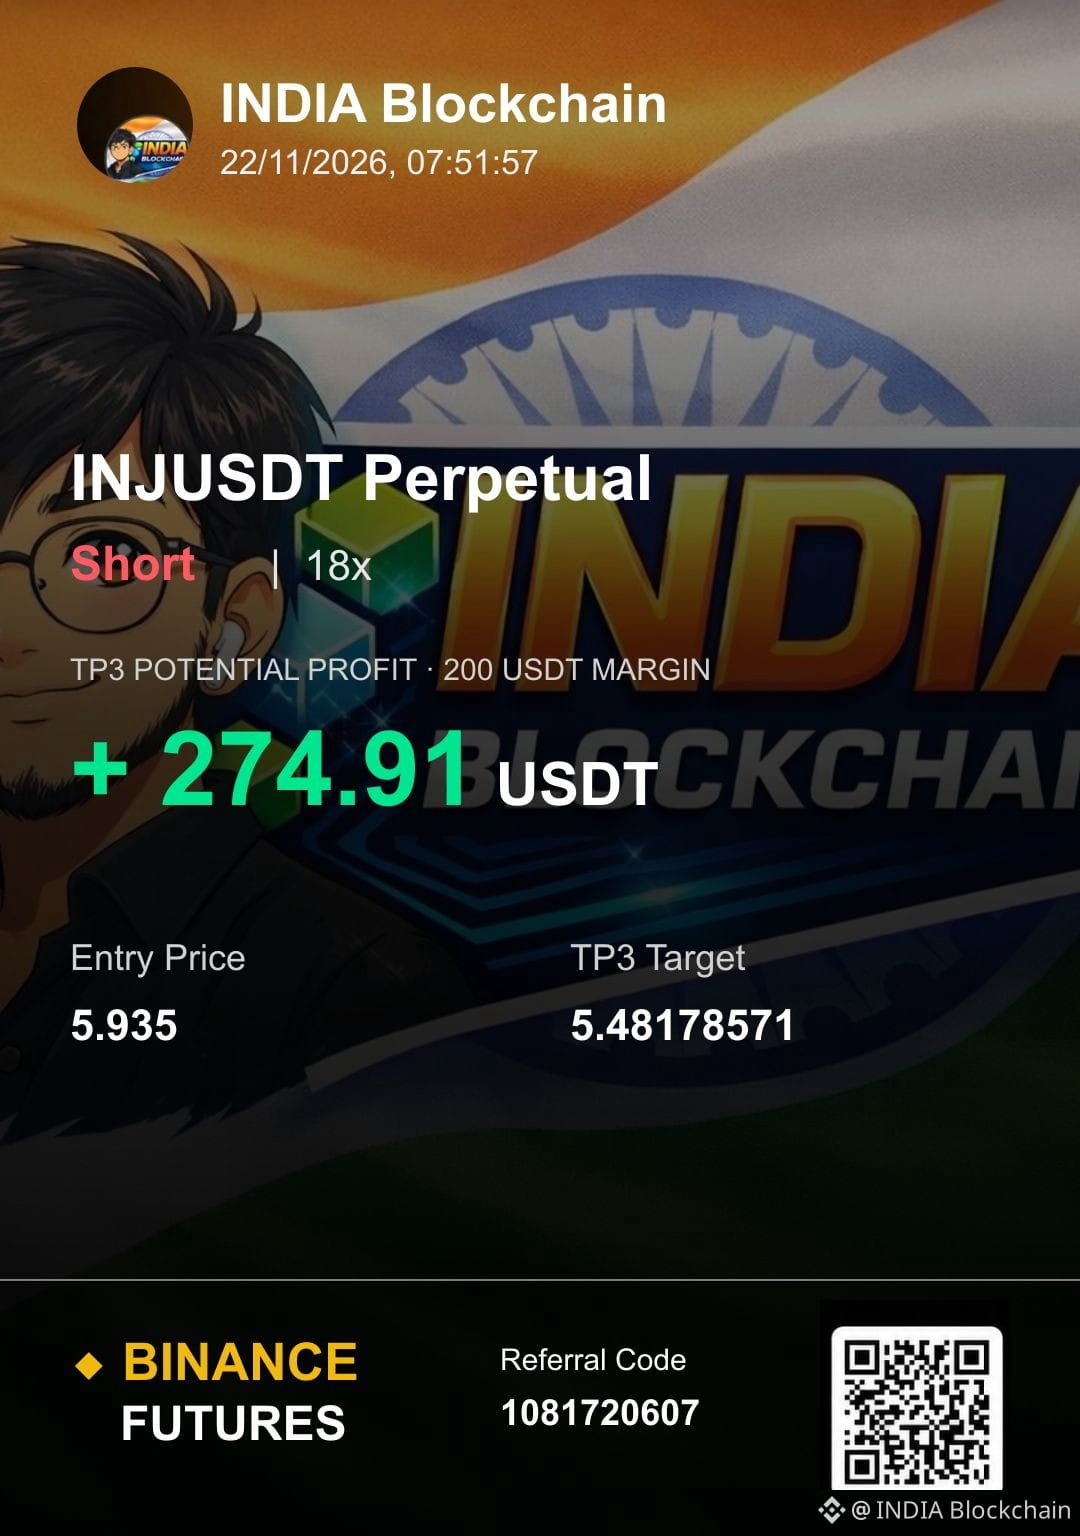

🚨 $INJ Near Critical Support — Relief Rally Incoming?
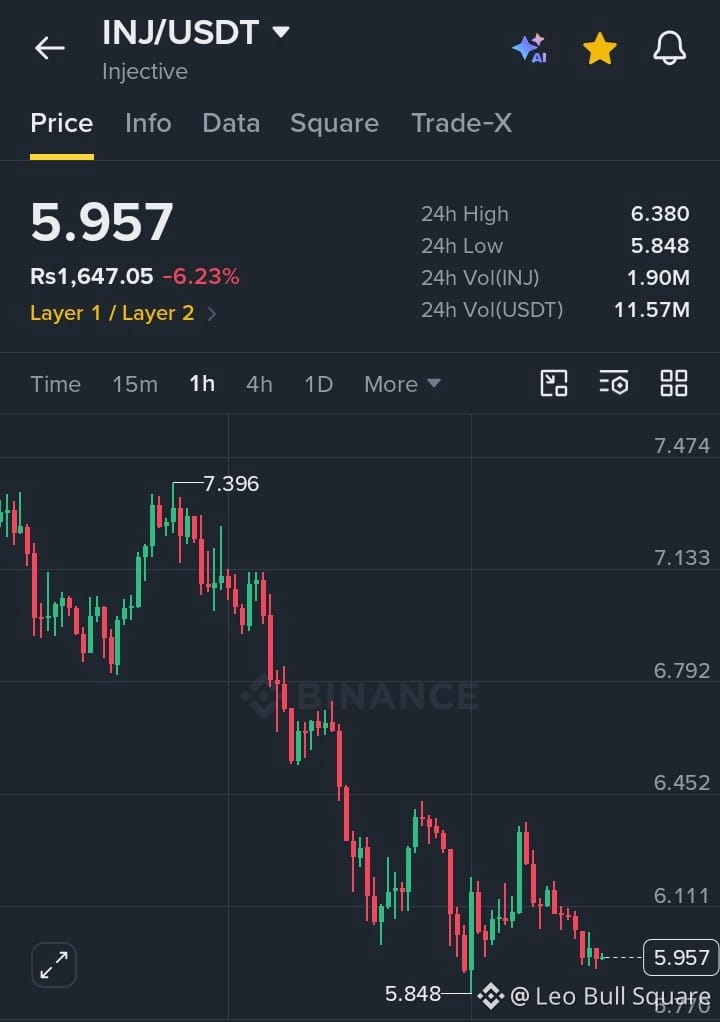
$INJ /USDT is trading at $5.957, down 6.23%, after dropping from its 24-hour high of $6.380 to $5.848, with $11.57M in trading volume.
📊 Technical Outlook: INJ is showing a bearish market structure with consecutive lower highs and lower lows. A potential sell-side liquidity sweep near $5.848, followed by a bullish CHoCH and resistance reclaim at $6.110, could trigger a short-term recovery.
🟢 Conditional Long Setup:
- Entry: $5.950–$6.000 (after bullish confirmation)
- TP1: $6.110
- TP2: $6.280
- TP3: $6.450
- Stop-Loss: $5.780
A breakdown below $5.848 could accelerate selling pressure. Wait for confirmation before entering — the overall trend remains bearish.
Follow for more technical setups and smart-money insights.
#INJ #CryptoTrading #BinanceSquare #PriceAction
#INJ
{spot}(INJUSDT)
🚨 $INJ Near Critical Support — Relief Rally Incoming?
$INJ /USDT is trading at $5.957, down 6.23%, after dropping from its 24-hour high of $6.380 to $5.848, with $11.57M in trading volume.
📊 Technical Outlook: INJ is showing a bearish market structure with consecutive lower highs and lower lows. A potential sell-side liquidity sweep near $5.848, followed by a bullish CHoCH and resistance reclaim at $6.110, could trigger a short-term recovery.
🟢 Conditional Long Setup:
- Entry: $5.950–$6.000 (after bullish confirmation)
- TP1: $6.110
- TP2: $6.280
- TP3: $6.450
- Stop-Loss: $5.780
A breakdown below $5.848 could accelerate selling pressure. Wait for confirmation before entering — the overall trend remains bearish.
Follow for more technical setups and smart-money insights.
#INJ #CryptoTrading #BinanceSquare #PriceAction
#INJ
$INJ /USDT is trading at $5.957, down 6.23%, after dropping from its 24-hour high of $6.380 to $5.848, with $11.57M in trading volume.
📊 Technical Outlook: INJ is showing a bearish market structure with consecutive lower highs and lower lows. A potential sell-side liquidity sweep near $5.848, followed by a bullish CHoCH and resistance reclaim at $6.110, could trigger a short-term recovery.
🟢 Conditional Long Setup:
- Entry: $5.950–$6.000 (after bullish confirmation)
- TP1: $6.110
- TP2: $6.280
- TP3: $6.450
- Stop-Loss: $5.780
A breakdown below $5.848 could accelerate selling pressure. Wait for confirmation before entering — the overall trend remains bearish.
Follow for more technical setups and smart-money insights.
#INJ #CryptoTrading #BinanceSquare #PriceAction
#INJ

follow for more
From Leo Bull Square
Fully Claimed
Uniqornbox:
bio
8
11
101

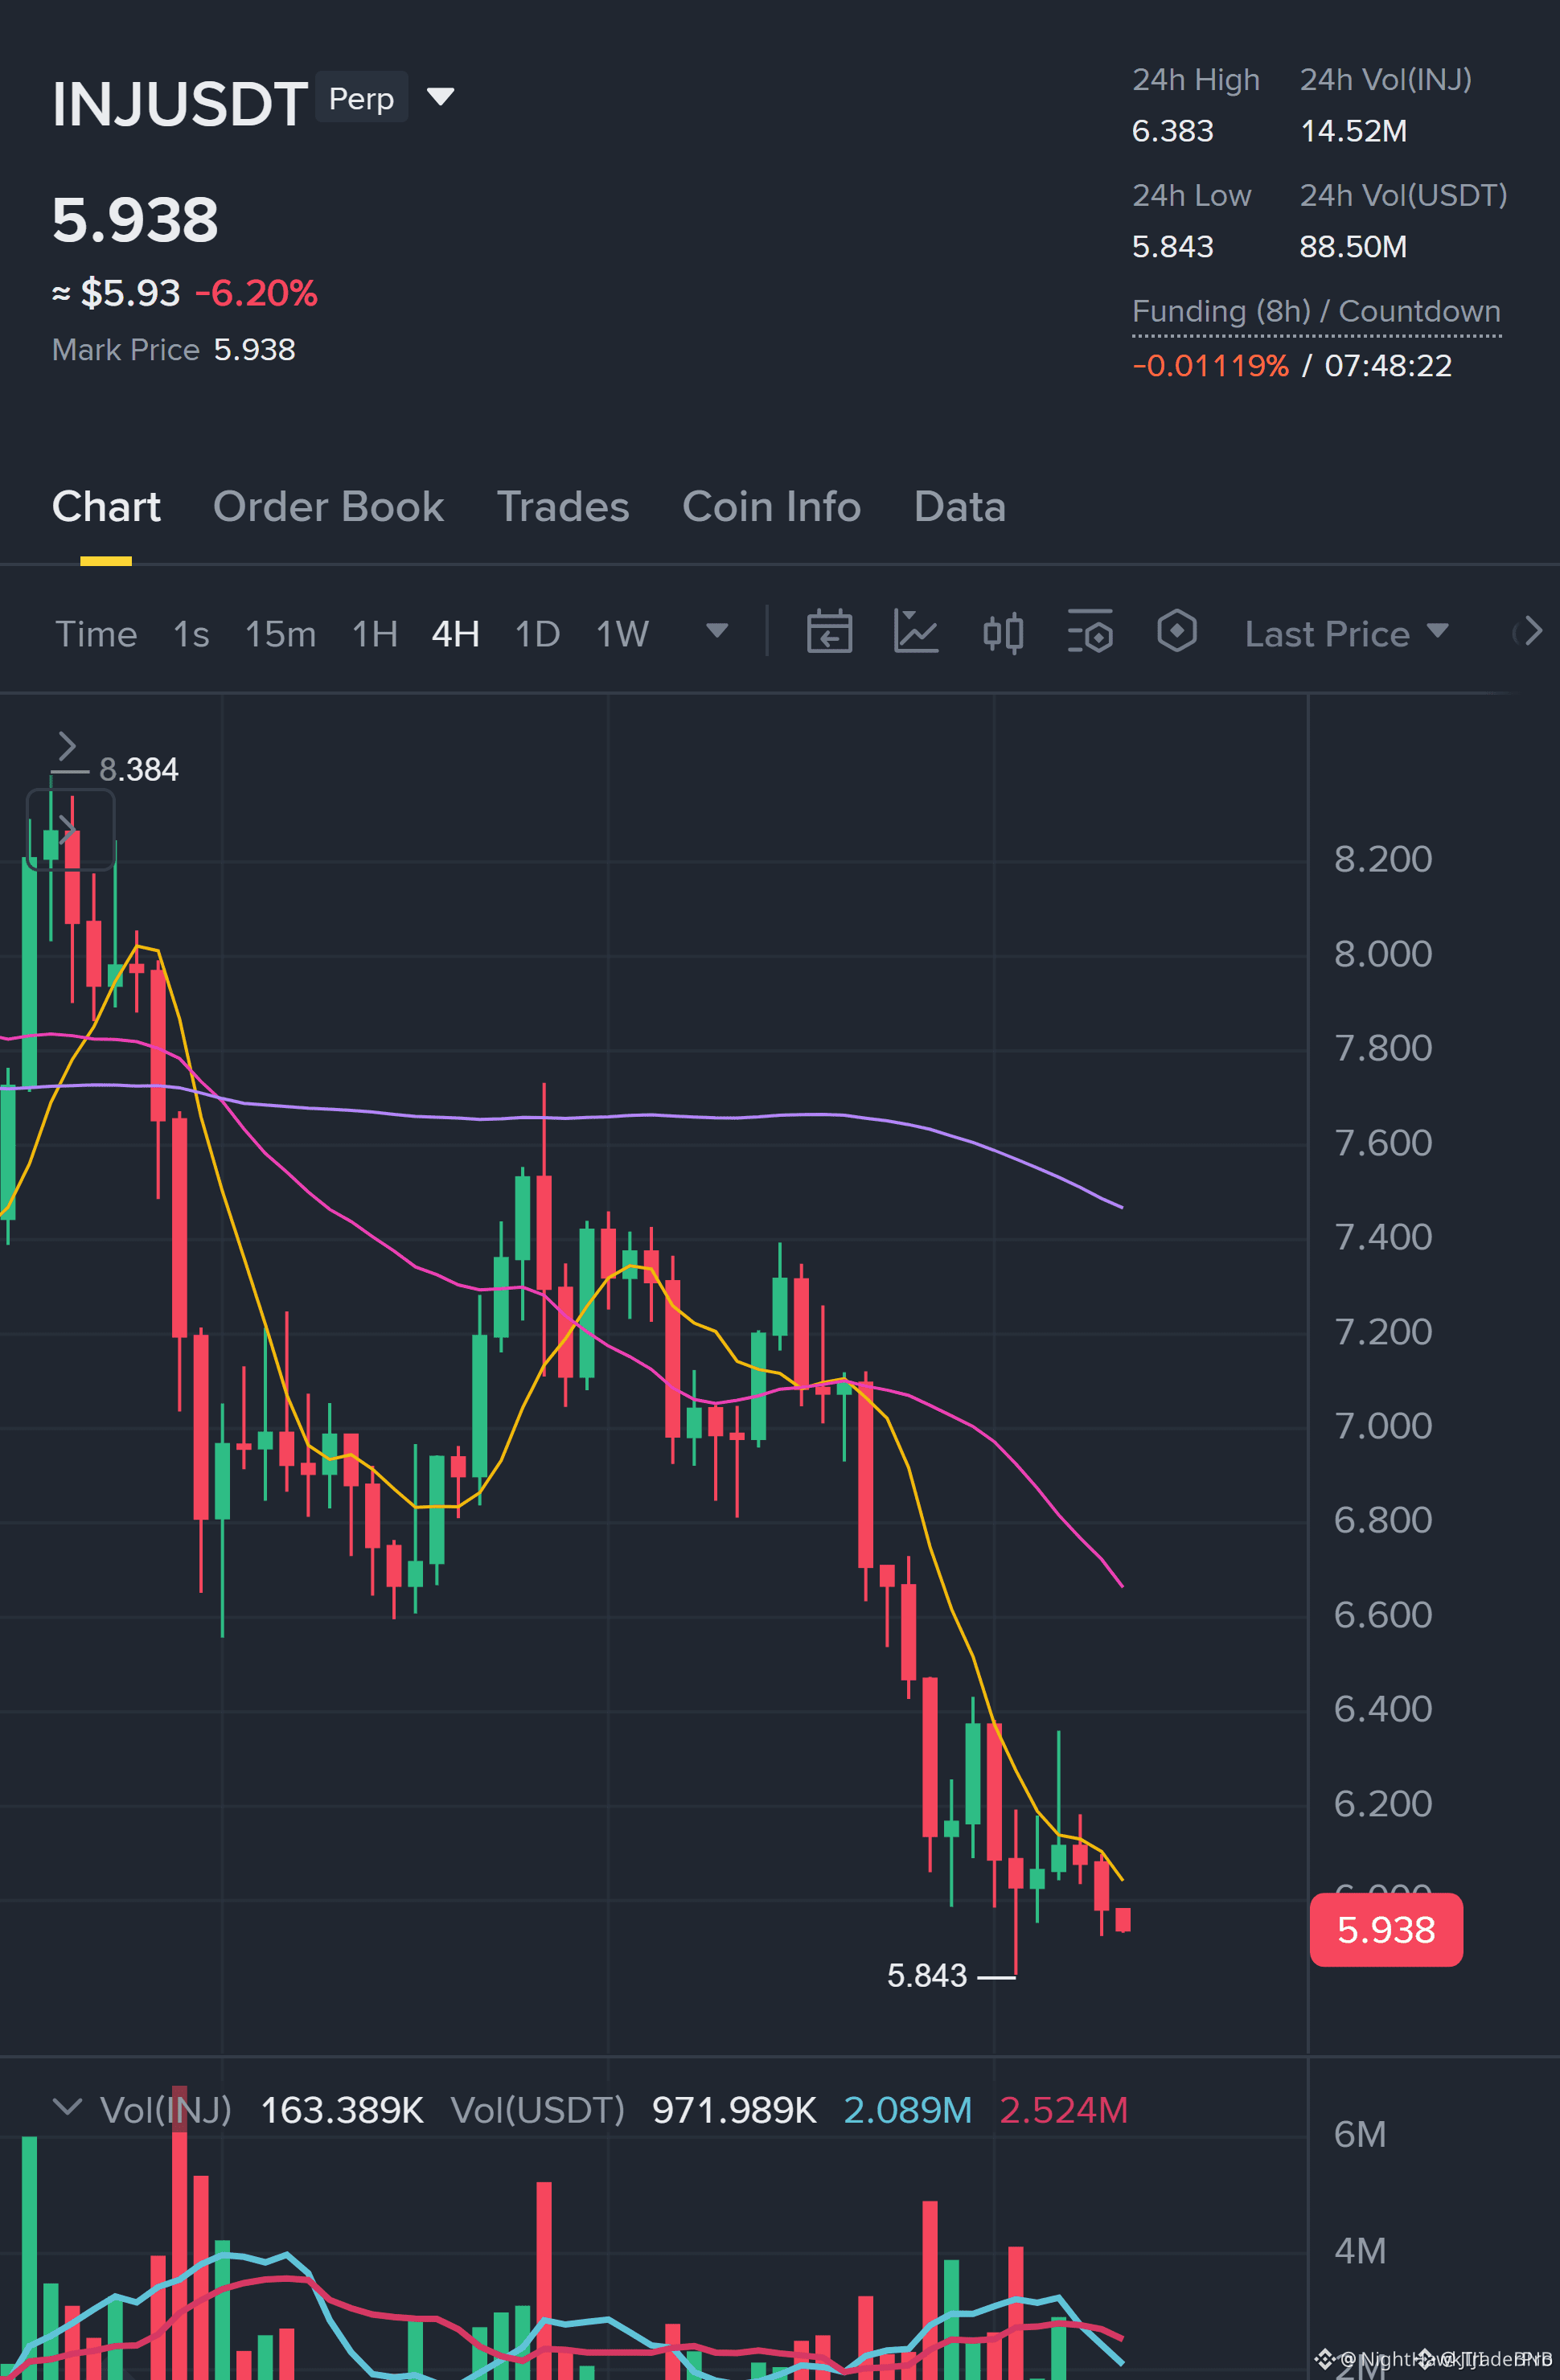
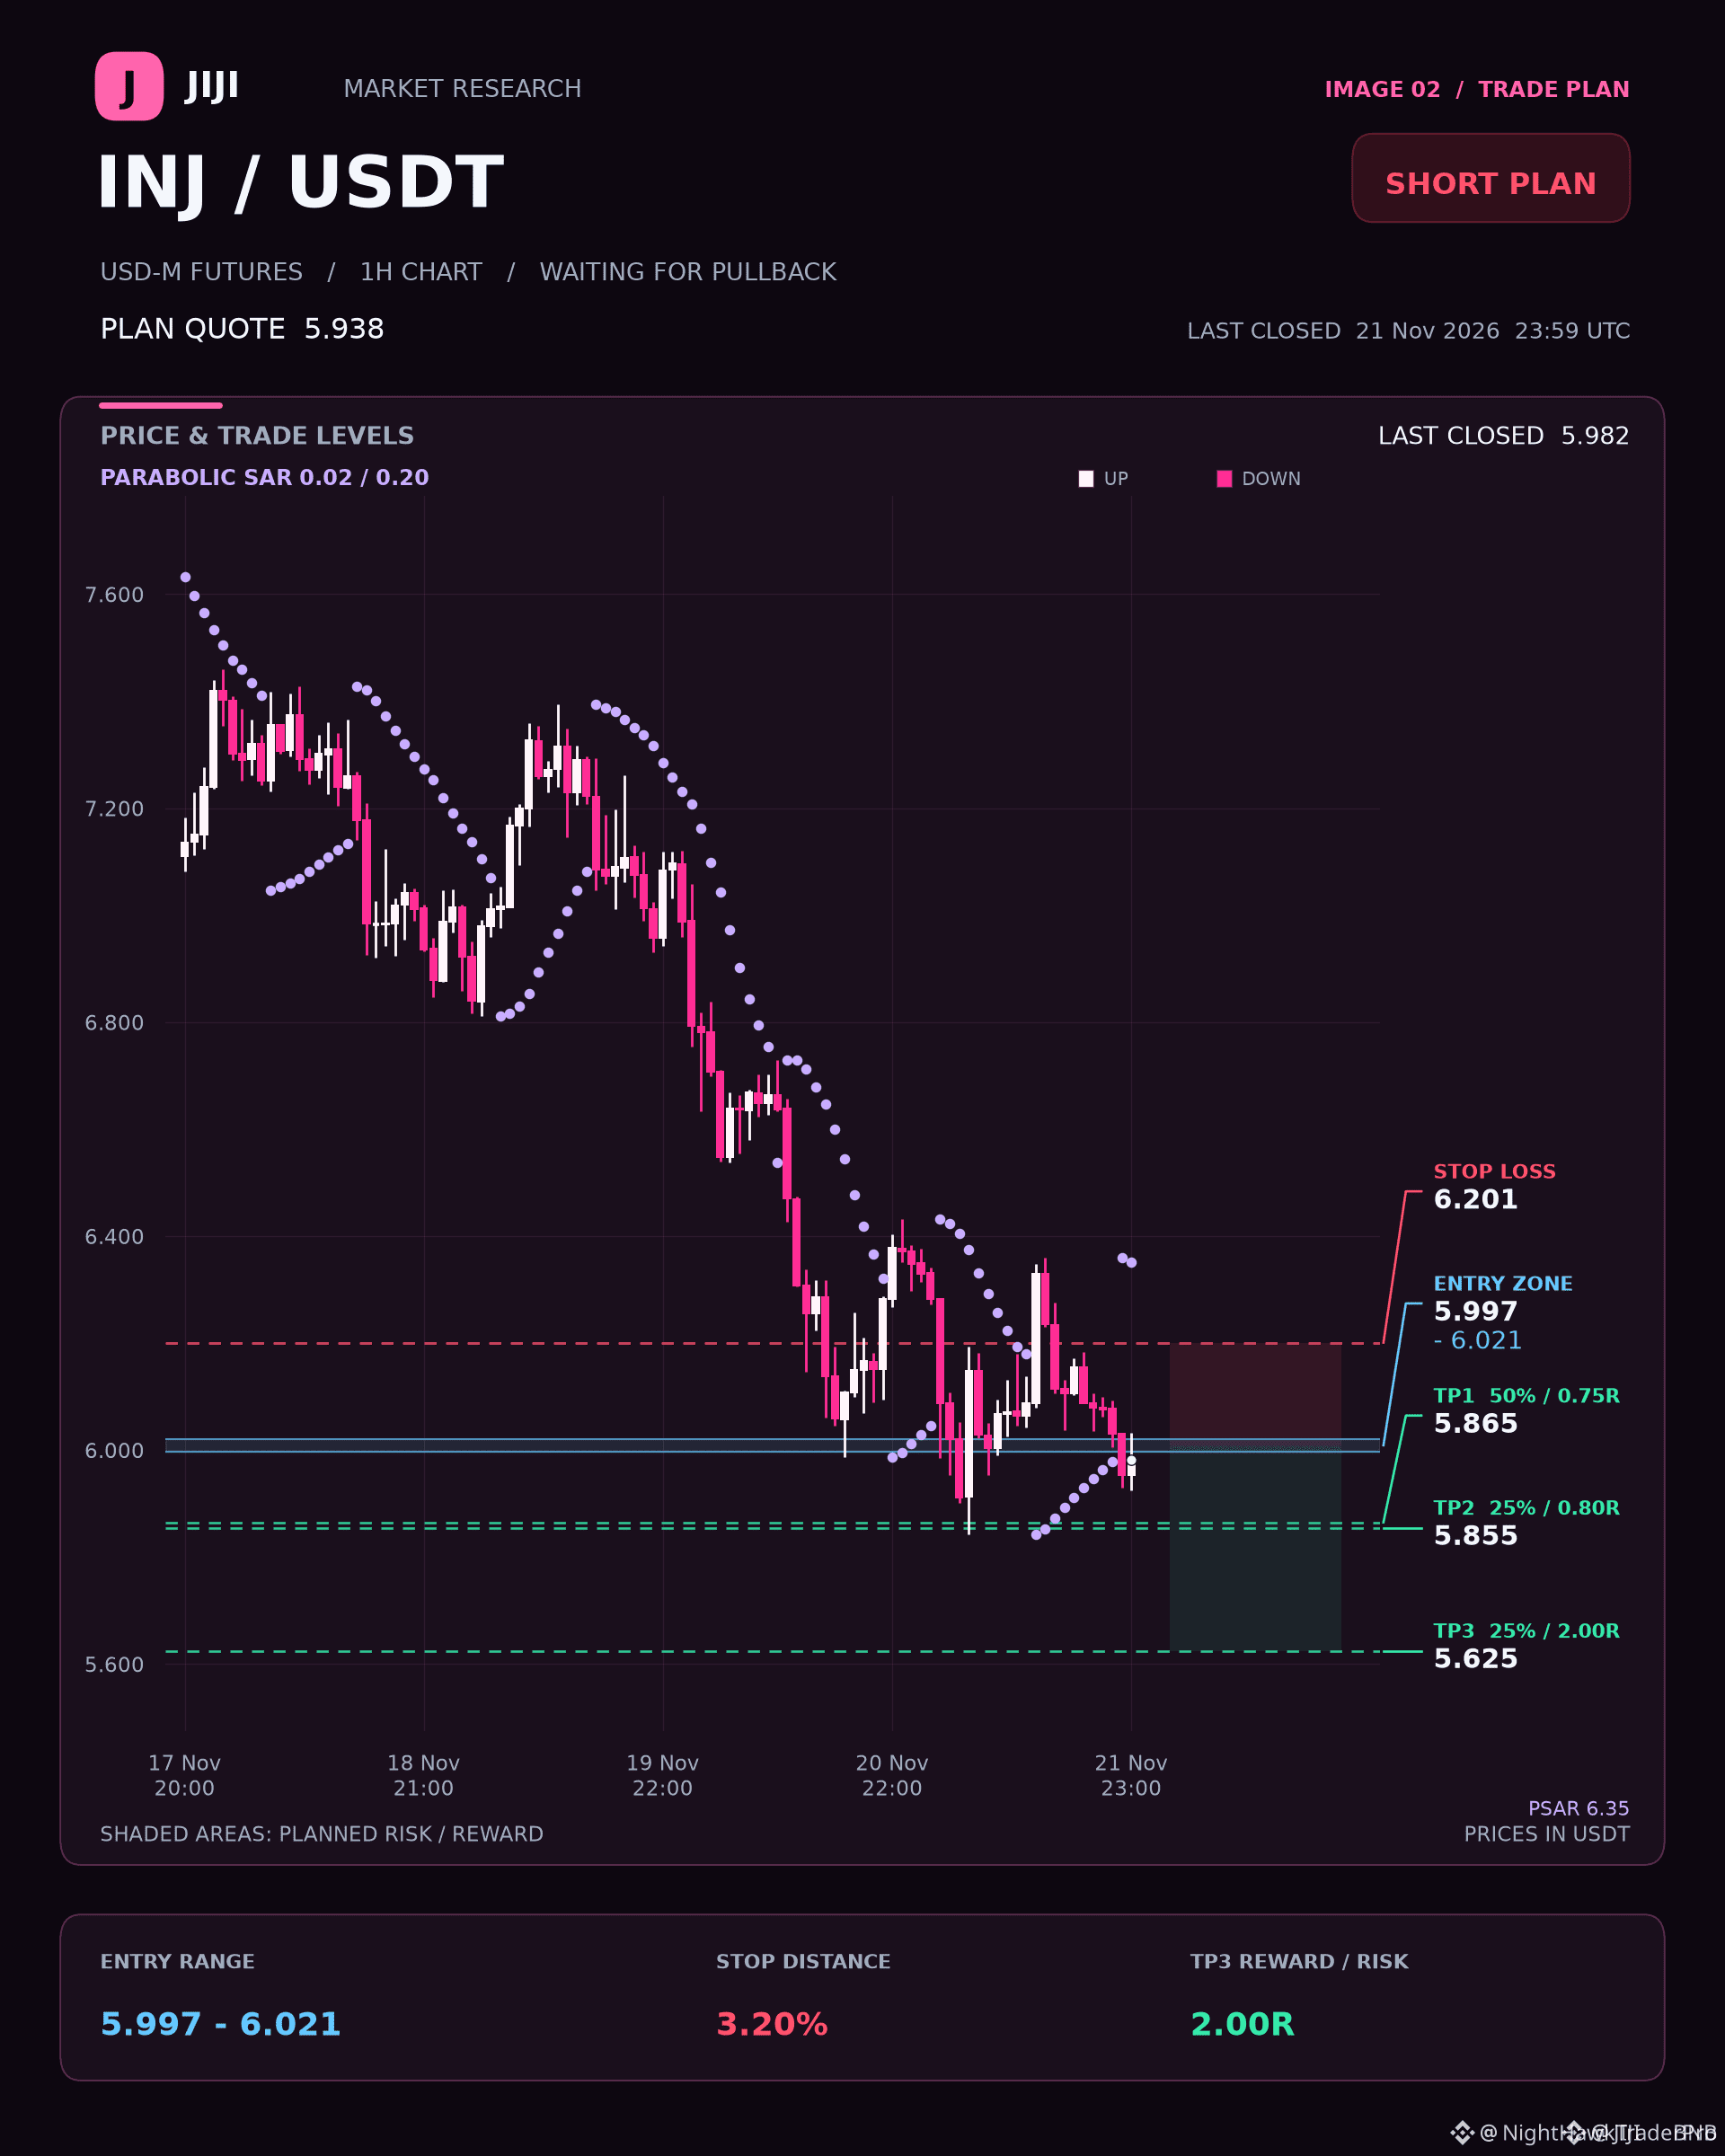
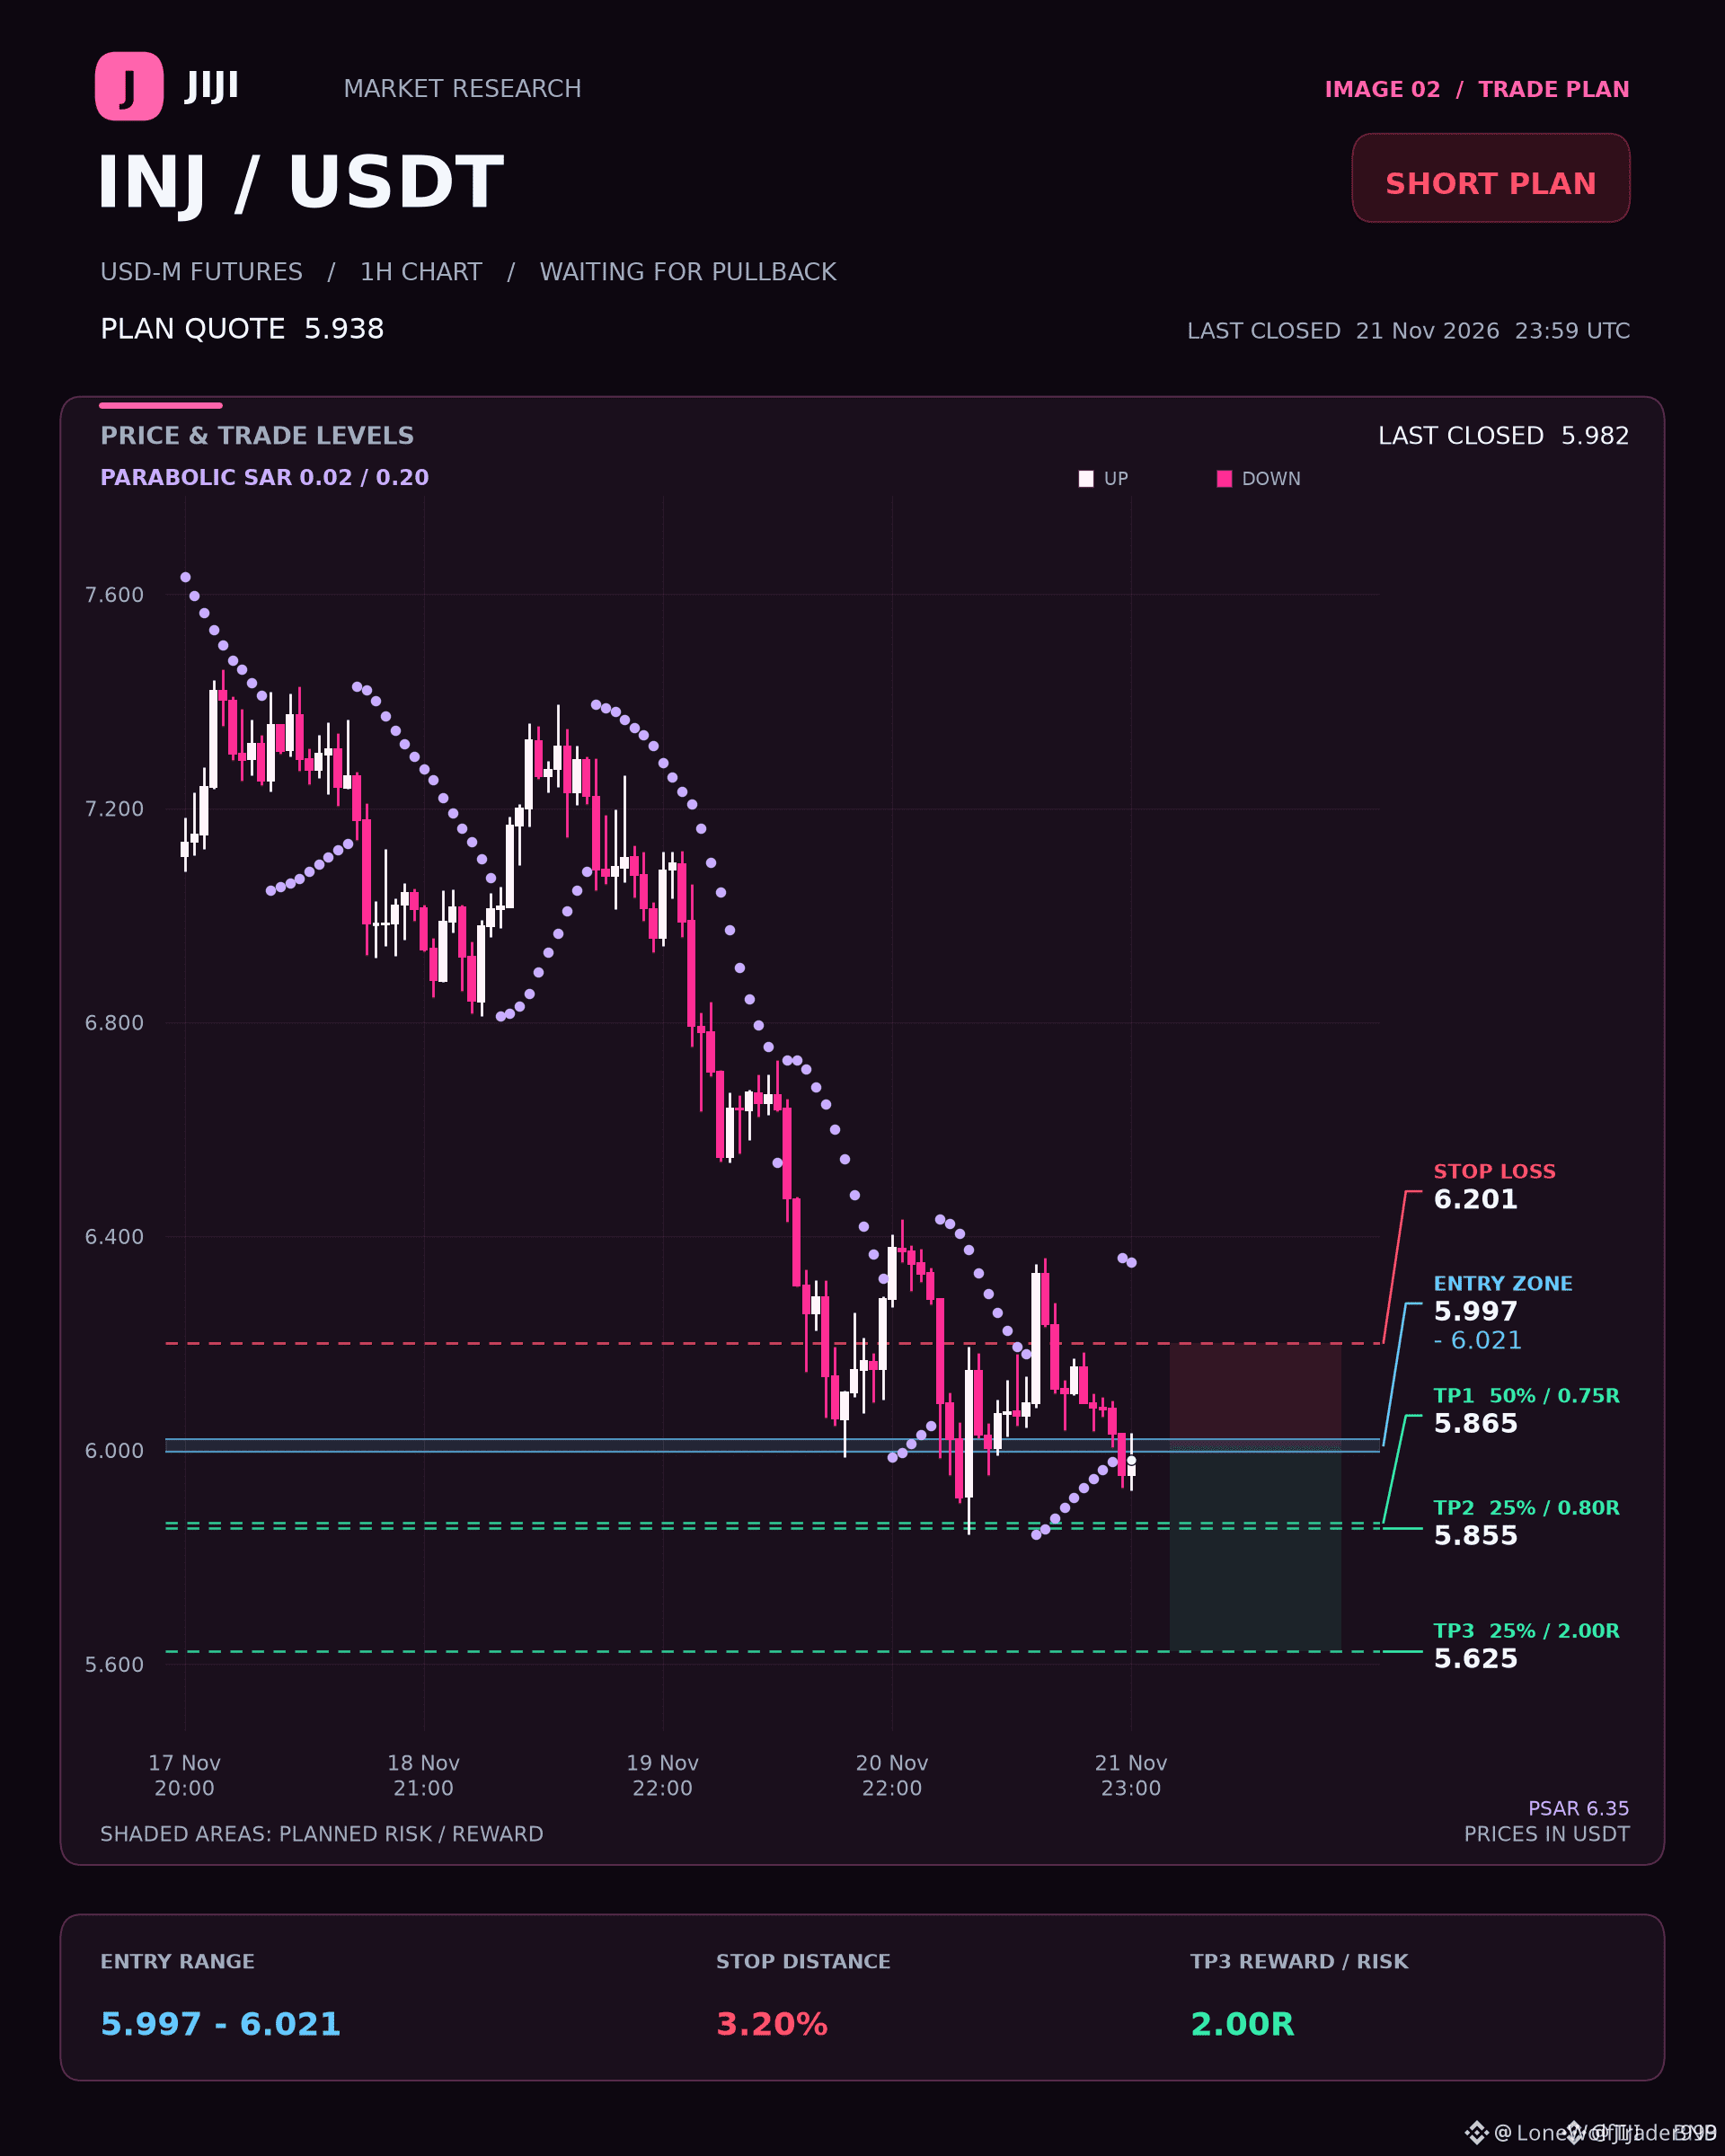
🚨 $INJ BEARISH EMA STACK ALIGNS FOR A HIGH-PROBABILITY SHORT SETUP! 📉
Entry: 5.997 – 6.021 ⚡
Target: 5.625 🚀
Stop Loss: 6.201 ⚠️
Institutional order flow on the four-hour timeframe remains firmly under bear control with a clean EMA stack rejection. Price is currently pulling back toward our designated supply zone to fill the inefficiency before the next leg down. 📊
Momentum indicators support continuation, with the one-hour RSI sitting at 39.4 and directional indices favoring sellers. Watch for a confirmed fifteen-minute candle close inside the entry band to validate the institutional short distribution. 📉
Are you positioning for this bearish expansion down to the primary target, or waiting for a deeper liquidity sweep? 💬
⚠️ Not financial advice. Always manage your risk. 🛡️
🏷️ #INJ #ShortSetup #MarketStructure #Crypto
📉 🦈
🚨 $INJ BEARISH EMA STACK ALIGNS FOR A HIGH-PROBABILITY SHORT SETUP! 📉
Entry: 5.997 – 6.021 ⚡
Target: 5.625 🚀
Stop Loss: 6.201 ⚠️
Institutional order flow on the four-hour timeframe remains firmly under bear control with a clean EMA stack rejection. Price is currently pulling back toward our designated supply zone to fill the inefficiency before the next leg down. 📊
Momentum indicators support continuation, with the one-hour RSI sitting at 39.4 and directional indices favoring sellers. Watch for a confirmed fifteen-minute candle close inside the entry band to validate the institutional short distribution. 📉
Are you positioning for this bearish expansion down to the primary target, or waiting for a deeper liquidity sweep? 💬
⚠️ Not financial advice. Always manage your risk. 🛡️
🏷️ #INJ #ShortSetup #MarketStructure #Crypto
📉 🦈
Entry: 5.997 – 6.021 ⚡
Target: 5.625 🚀
Stop Loss: 6.201 ⚠️
Institutional order flow on the four-hour timeframe remains firmly under bear control with a clean EMA stack rejection. Price is currently pulling back toward our designated supply zone to fill the inefficiency before the next leg down. 📊
Momentum indicators support continuation, with the one-hour RSI sitting at 39.4 and directional indices favoring sellers. Watch for a confirmed fifteen-minute candle close inside the entry band to validate the institutional short distribution. 📉
Are you positioning for this bearish expansion down to the primary target, or waiting for a deeper liquidity sweep? 💬
⚠️ Not financial advice. Always manage your risk. 🛡️
🏷️ #INJ #ShortSetup #MarketStructure #Crypto
📉 🦈
14

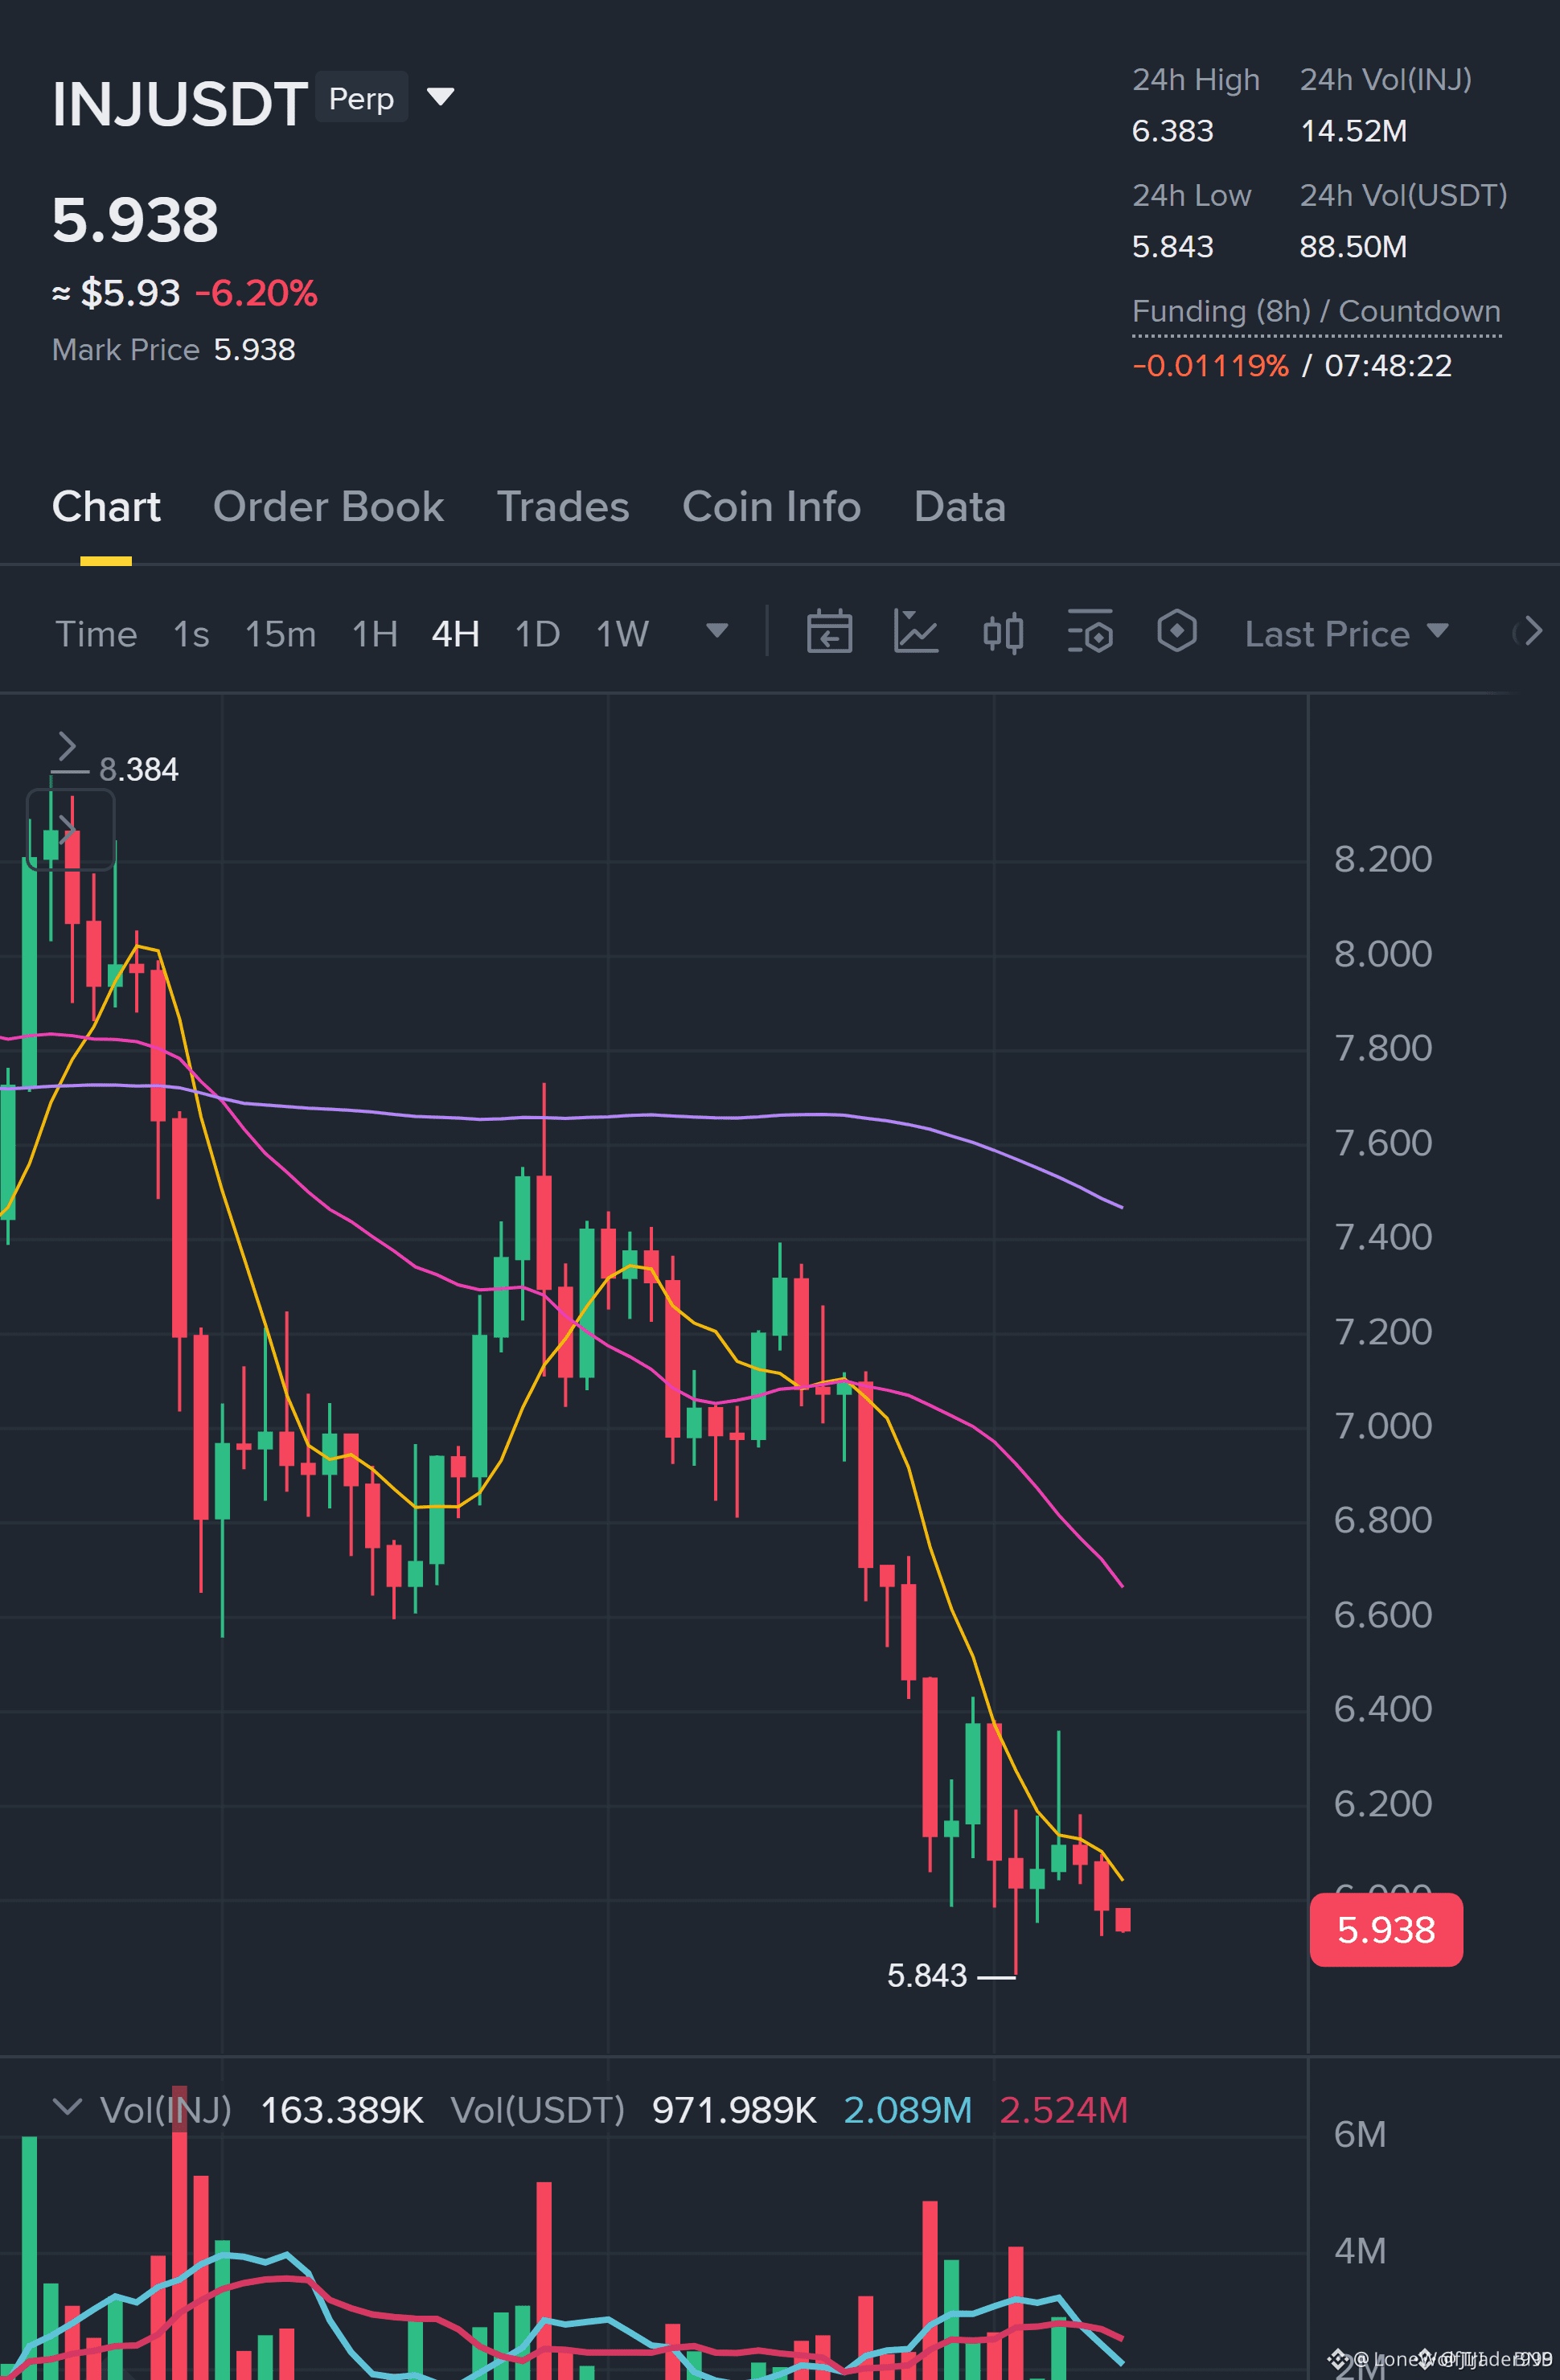
🚨 $INJ BEARS STACK PRESSURE AS SELLER MOMENTUM TIGHTENS THE RANGE 🐻
Entry: 5.997 - 6.021 ⚡
Target: 5.625 🚀
Stop Loss: 6.201 ⚠️
The broader market structure is firmly under seller control with a clean bearish moving average stack on the four-hour chart. Price is currently drifting into our zone where momentum indicators align for a high-probability continuation downward 📊.
We are watching for a confirmed fifteen-minute candle close inside the entry band before committing capital, keeping a close eye on support sitting just below 💡. Patience pays when the order flow favors the downside 🌊.
💬 Are you tracking this short setup or waiting for a deeper sweep? 👇
⚠️ Not financial advice. Always manage your risk. 🛡️
🏷️ #INJ #ShortSetup #CryptoTrading #PriceAction
🔥 📉
🚨 $INJ BEARS STACK PRESSURE AS SELLER MOMENTUM TIGHTENS THE RANGE 🐻
Entry: 5.997 - 6.021 ⚡
Target: 5.625 🚀
Stop Loss: 6.201 ⚠️
The broader market structure is firmly under seller control with a clean bearish moving average stack on the four-hour chart. Price is currently drifting into our zone where momentum indicators align for a high-probability continuation downward 📊.
We are watching for a confirmed fifteen-minute candle close inside the entry band before committing capital, keeping a close eye on support sitting just below 💡. Patience pays when the order flow favors the downside 🌊.
💬 Are you tracking this short setup or waiting for a deeper sweep? 👇
⚠️ Not financial advice. Always manage your risk. 🛡️
🏷️ #INJ #ShortSetup #CryptoTrading #PriceAction
🔥 📉
Entry: 5.997 - 6.021 ⚡
Target: 5.625 🚀
Stop Loss: 6.201 ⚠️
The broader market structure is firmly under seller control with a clean bearish moving average stack on the four-hour chart. Price is currently drifting into our zone where momentum indicators align for a high-probability continuation downward 📊.
We are watching for a confirmed fifteen-minute candle close inside the entry band before committing capital, keeping a close eye on support sitting just below 💡. Patience pays when the order flow favors the downside 🌊.
💬 Are you tracking this short setup or waiting for a deeper sweep? 👇
⚠️ Not financial advice. Always manage your risk. 🛡️
🏷️ #INJ #ShortSetup #CryptoTrading #PriceAction
🔥 📉
35

·
--
Verified
AI compute is now a tradable market on Injective. Its new SICI perpetual tracks rental prices for five Nvidia GPUs (H100 weighted 40%, B200 25%), updates hourly on a 7-day average, and offers up to 10x leverage with USDC margin. A hedge for AI infrastructure costs. #Injective #INJ #AI
AI compute is now a tradable market on Injective. Its new SICI perpetual tracks rental prices for five Nvidia GPUs (H100 weighted 40%, B200 25%), updates hourly on a 7-day average, and offers up to 10x leverage with USDC margin. A hedge for AI infrastructure costs. #Injective #INJ #AI
200

·
--
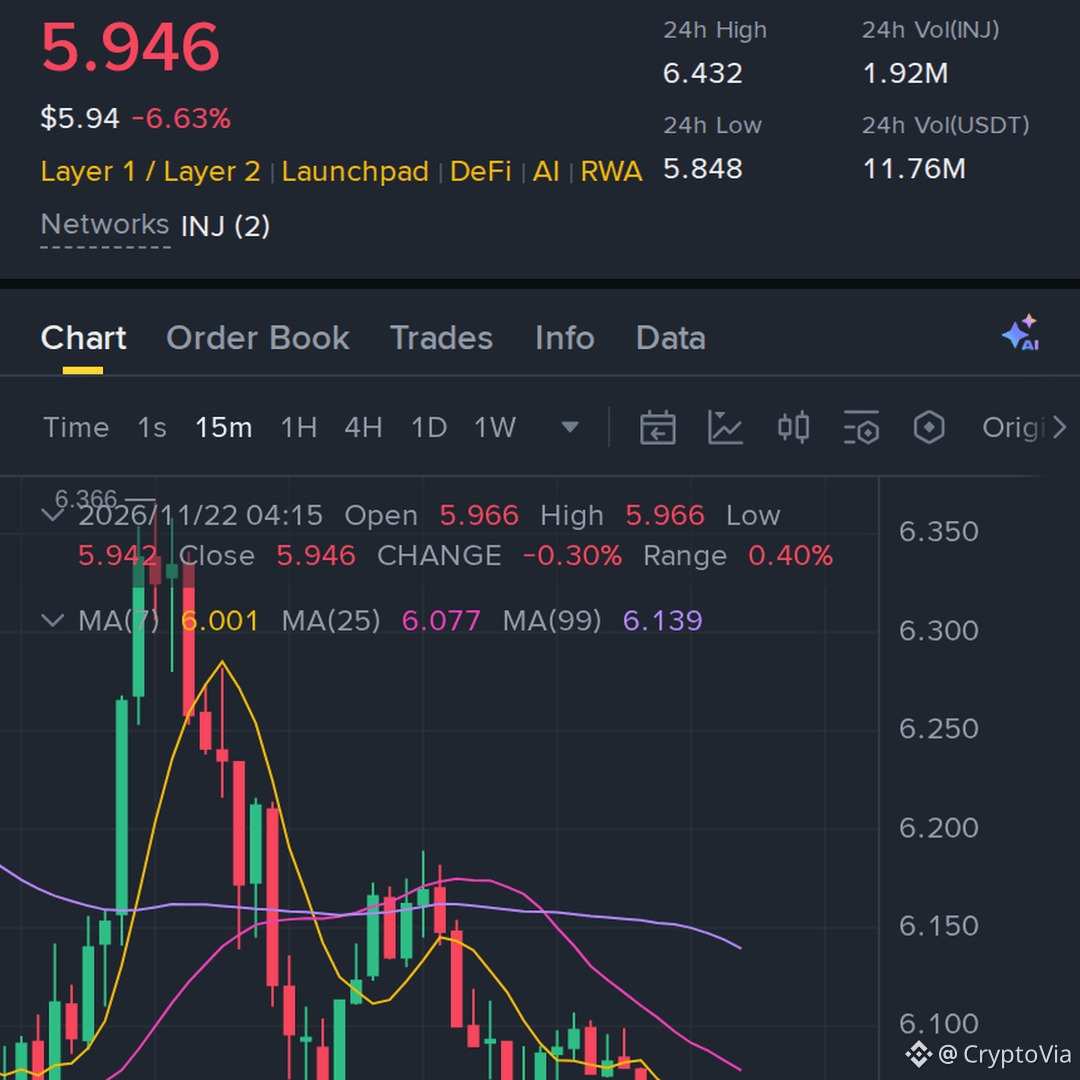
following the price action on $INJ, lost support and sellers are still pressing the move
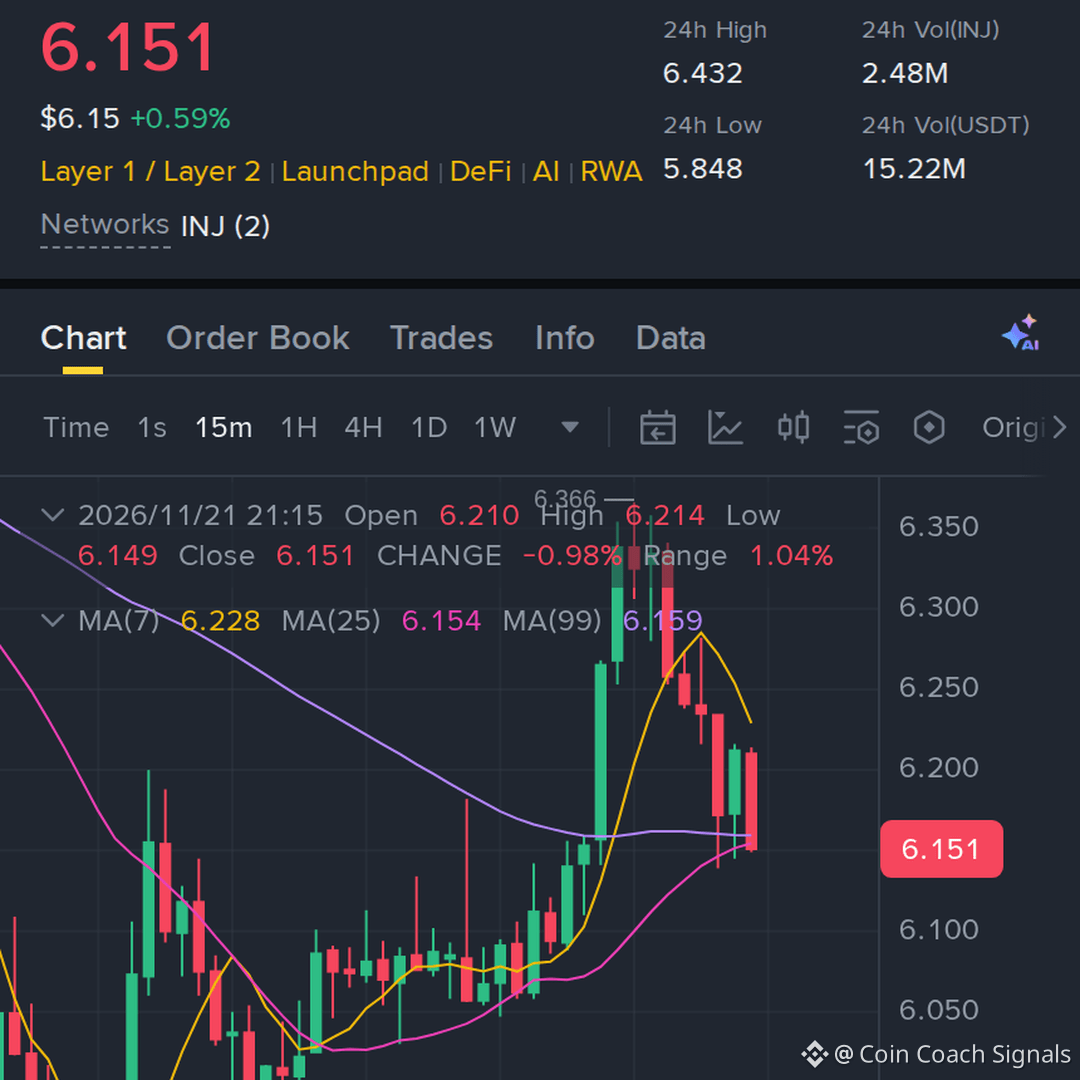
The planned entry is an area to watch for a failed bounce; it avoids chasing an already extended drop. The moving-average structure is still bearish; any bounce needs to prove it can hold before the bias changes. The 24-hour move stands at -6.80%, with the latest price near 5.944. Volume is close to its recent average (0.9x), so follow-through will matter more than one candle. RSI is 24.7; momentum is weak, so a reversal needs confirmation rather than an assumption. The recent support area is around 5.954, while resistance is near 6.189.
Short setup | Spot chart | 15M
Entry: 5.942–5.954
TP1: 5.769 → TP2: 5.621 → TP3: 5.472
Stop Loss: 6.116
#INJ #Write2Earn #crypto #binance
following the price action on $INJ , lost support and sellers are still pressing the move
The planned entry is an area to watch for a failed bounce; it avoids chasing an already extended drop. The moving-average structure is still bearish; any bounce needs to prove it can hold before the bias changes. The 24-hour move stands at -6.80%, with the latest price near 5.944. Volume is close to its recent average (0.9x), so follow-through will matter more than one candle. RSI is 24.7; momentum is weak, so a reversal needs confirmation rather than an assumption. The recent support area is around 5.954, while resistance is near 6.189.
Short setup | Spot chart | 15M
Entry: 5.942–5.954
TP1: 5.769 → TP2: 5.621 → TP3: 5.472
Stop Loss: 6.116
#INJ #Write2Earn #crypto #binance
The planned entry is an area to watch for a failed bounce; it avoids chasing an already extended drop. The moving-average structure is still bearish; any bounce needs to prove it can hold before the bias changes. The 24-hour move stands at -6.80%, with the latest price near 5.944. Volume is close to its recent average (0.9x), so follow-through will matter more than one candle. RSI is 24.7; momentum is weak, so a reversal needs confirmation rather than an assumption. The recent support area is around 5.954, while resistance is near 6.189.
Short setup | Spot chart | 15M
Entry: 5.942–5.954
TP1: 5.769 → TP2: 5.621 → TP3: 5.472
Stop Loss: 6.116
#INJ #Write2Earn #crypto #binance
28

·
--
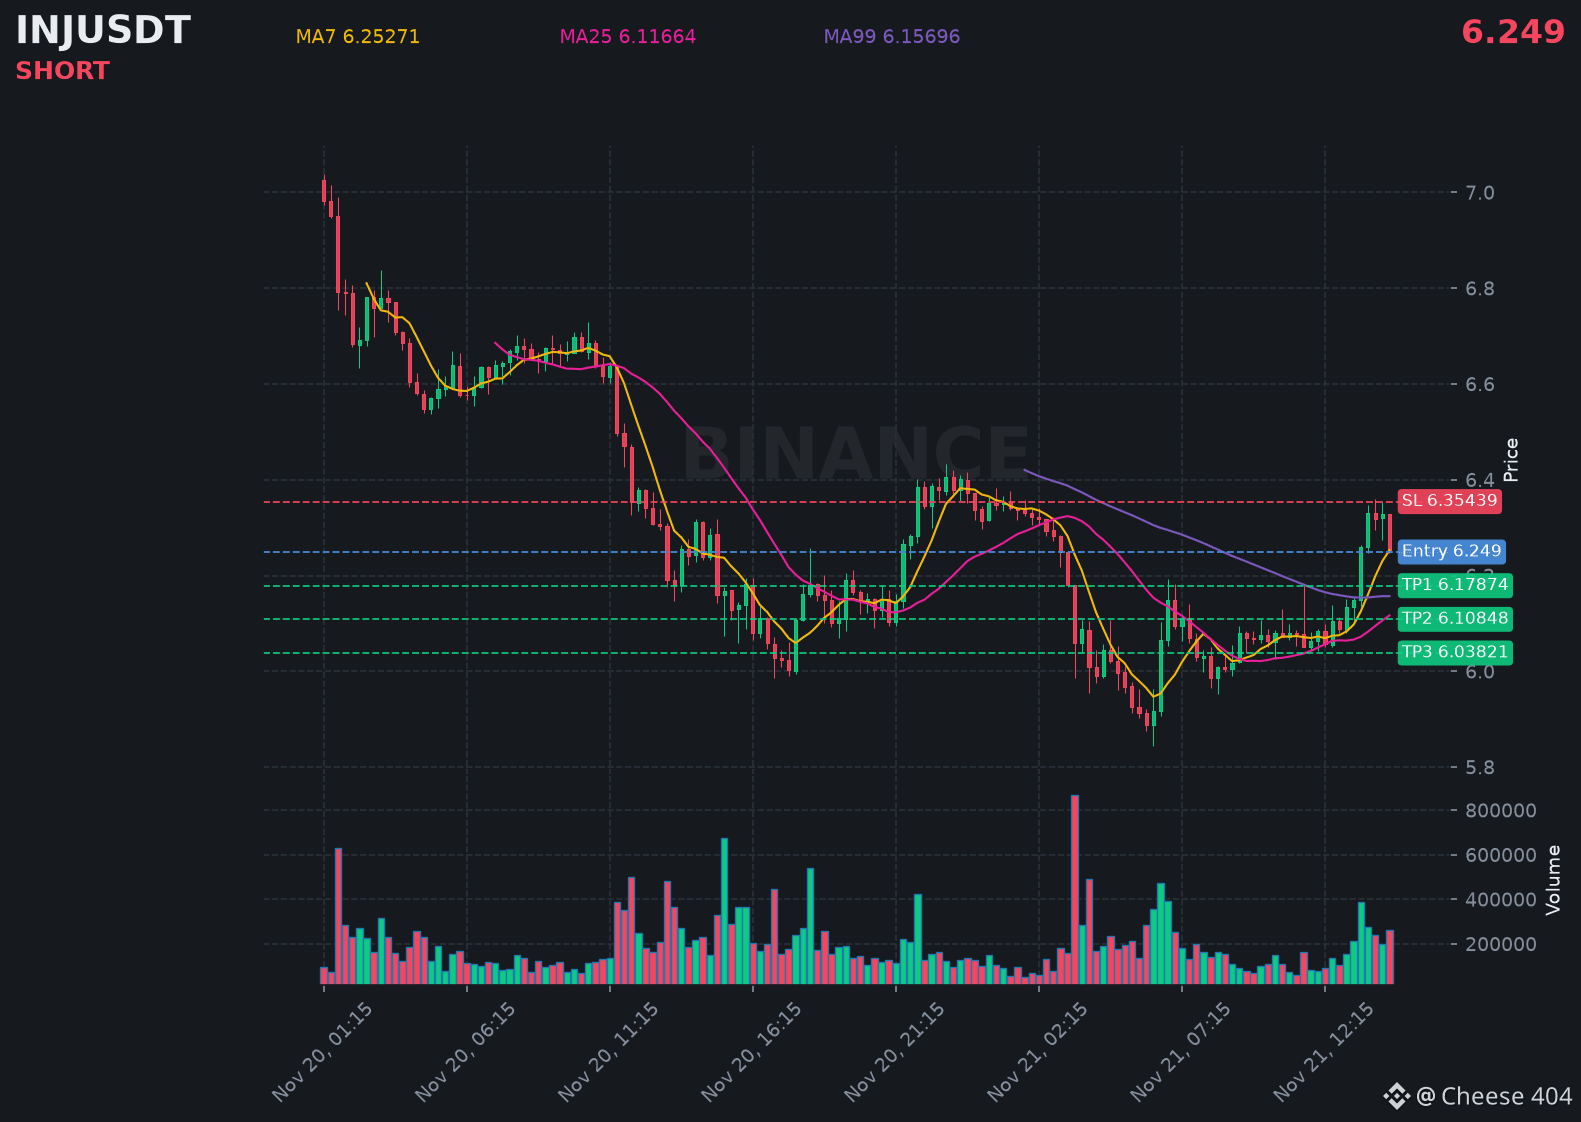
$INJ is showing a clear downtrend, with sellers stepping in and pushing the price lower.
📍 @ 6.249 | Volume: 1.63M USD
RSI 61 | EMA20: 6.16696 USD
📈 Trade Plan:
📈 Entry: 6.22792 – 6.27008
🛑 Stop Loss: 6.35439
🎯 TP1: 6.17874
🎯 TP2: 6.10848
🎯 TP3: 6.03821
Waiting for confirmation, then riding the downtrend.
👉 $INJ 👈 Catch it
#INJ
$INJ is showing a clear downtrend, with sellers stepping in and pushing the price lower.
📍 @ 6.249 | Volume: 1.63M USD
RSI 61 | EMA20: 6.16696 USD
📈 Trade Plan:
📈 Entry: 6.22792 – 6.27008
🛑 Stop Loss: 6.35439
🎯 TP1: 6.17874
🎯 TP2: 6.10848
🎯 TP3: 6.03821
Waiting for confirmation, then riding the downtrend.
👉 $INJ 👈 Catch it
#INJ
📍 @ 6.249 | Volume: 1.63M USD
RSI 61 | EMA20: 6.16696 USD
📈 Trade Plan:
📈 Entry: 6.22792 – 6.27008
🛑 Stop Loss: 6.35439
🎯 TP1: 6.17874
🎯 TP2: 6.10848
🎯 TP3: 6.03821
Waiting for confirmation, then riding the downtrend.
👉 $INJ 👈 Catch it
#INJ
75
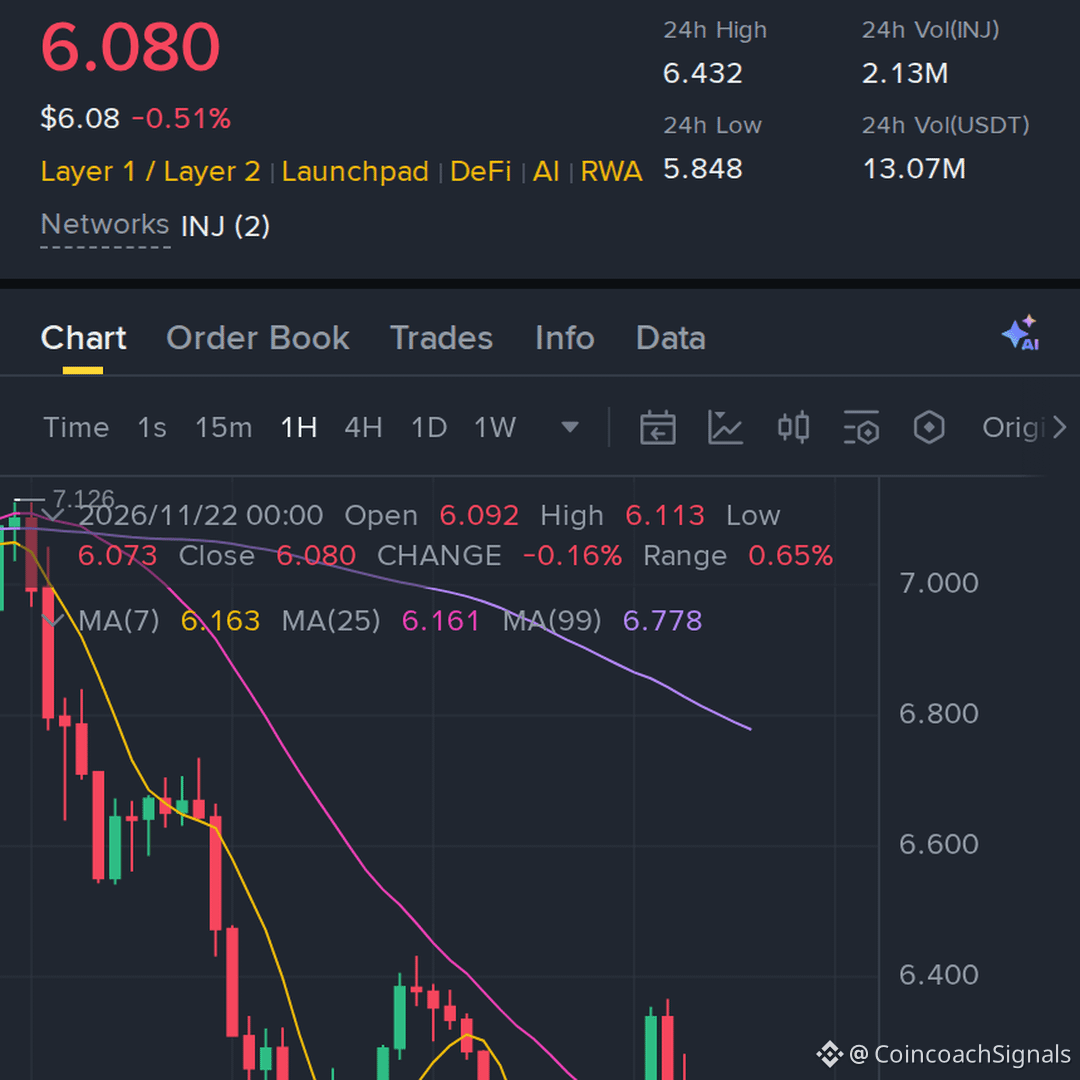

price action on $INJ, tried to recover but the bounce is losing energy again, so I’m working with about 46x
Entry: 6.152–6.187
TP1: 5.954 | TP2: 5.769 | TP3: 5.553
Stop Loss: 6.392
#INJ #Crypto #Write2Earn #binance
price action on $INJ , tried to recover but the bounce is losing energy again, so I’m working with about 46x
Entry: 6.152–6.187
TP1: 5.954 | TP2: 5.769 | TP3: 5.553
Stop Loss: 6.392
#INJ #Crypto #Write2Earn #binance
Entry: 6.152–6.187
TP1: 5.954 | TP2: 5.769 | TP3: 5.553
Stop Loss: 6.392
#INJ #Crypto #Write2Earn #binance
14
·
--
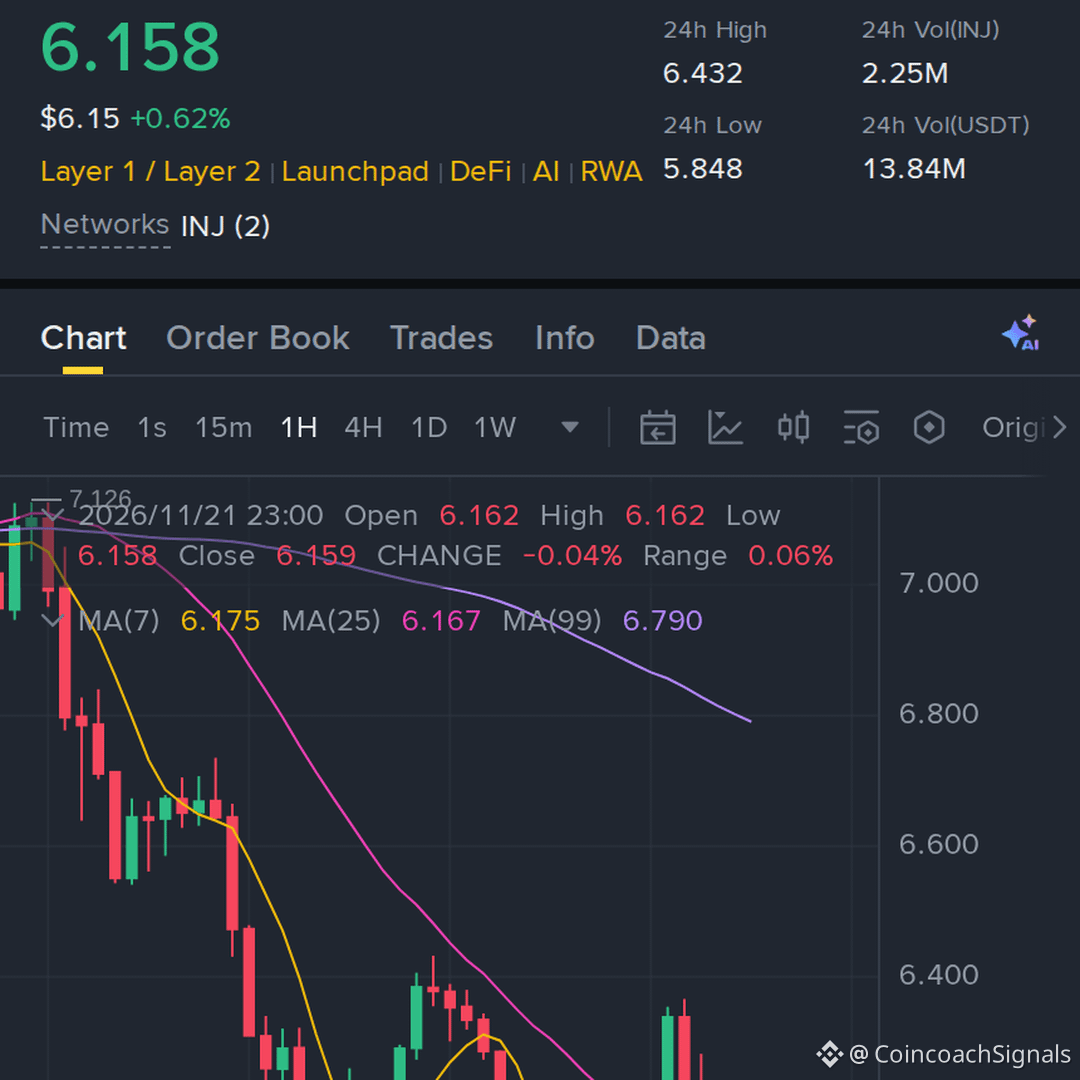
watching $INJ, with a 47x leverage plan, is struggling to hold the recovery
With RSI at 42.7, upside momentum still needs to improve before the move looks convincing. The 24-hour move stands at -0.74%, with the latest price near 6.064. The trend remains under pressure, with the short-term average sitting beneath the slower one. The recent support area is around 5.848, while resistance is near 6.432. Participation is still light at 0.5x average volume; I would not treat this as confirmed momentum yet. The planned entry is an area to watch for a failed bounce; it avoids chasing an already extended drop. This sits in the top three of 34 setups that passed the scan filters, with the mapped entry and stop defining the risk.
Short setup | Spot chart | 1H
Entry: 6.057–6.1
TP1: 5.865 / TP2: 5.683 / TP3: 5.47
Stop Loss: 6.397
#INJ #binance #crypto #Write2Earn!
watching $INJ , with a 47x leverage plan, is struggling to hold the recovery
With RSI at 42.7, upside momentum still needs to improve before the move looks convincing. The 24-hour move stands at -0.74%, with the latest price near 6.064. The trend remains under pressure, with the short-term average sitting beneath the slower one. The recent support area is around 5.848, while resistance is near 6.432. Participation is still light at 0.5x average volume; I would not treat this as confirmed momentum yet. The planned entry is an area to watch for a failed bounce; it avoids chasing an already extended drop. This sits in the top three of 34 setups that passed the scan filters, with the mapped entry and stop defining the risk.
Short setup | Spot chart | 1H
Entry: 6.057–6.1
TP1: 5.865 / TP2: 5.683 / TP3: 5.47
Stop Loss: 6.397
#INJ #binance #crypto #Write2Earn!
With RSI at 42.7, upside momentum still needs to improve before the move looks convincing. The 24-hour move stands at -0.74%, with the latest price near 6.064. The trend remains under pressure, with the short-term average sitting beneath the slower one. The recent support area is around 5.848, while resistance is near 6.432. Participation is still light at 0.5x average volume; I would not treat this as confirmed momentum yet. The planned entry is an area to watch for a failed bounce; it avoids chasing an already extended drop. This sits in the top three of 34 setups that passed the scan filters, with the mapped entry and stop defining the risk.
Short setup | Spot chart | 1H
Entry: 6.057–6.1
TP1: 5.865 / TP2: 5.683 / TP3: 5.47
Stop Loss: 6.397
#INJ #binance #crypto #Write2Earn!
29

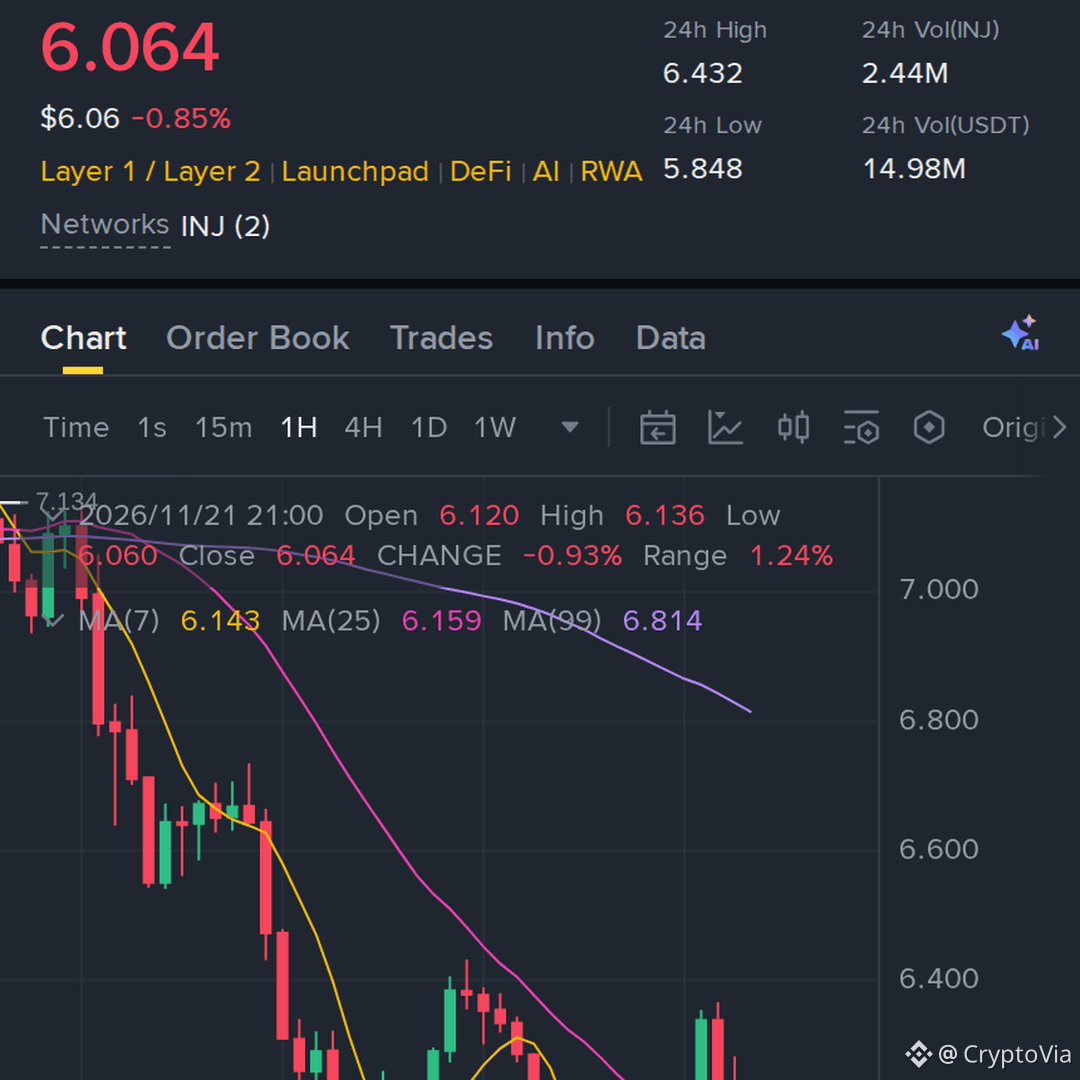
keeping watch here, $INJ looks tired around this level and sellers are coming back
Entry: 6.147–6.169 | Stop Loss: 6.381
TP1: 5.973 / TP2: 5.819 / TP3: 5.665
#INJ #Write2Earn #Crypto #Binance
keeping watch here, $INJ looks tired around this level and sellers are coming back
Entry: 6.147–6.169 | Stop Loss: 6.381
TP1: 5.973 / TP2: 5.819 / TP3: 5.665
#INJ #Write2Earn #Crypto #Binance
Entry: 6.147–6.169 | Stop Loss: 6.381
TP1: 5.973 / TP2: 5.819 / TP3: 5.665
#INJ #Write2Earn #Crypto #Binance
1
95

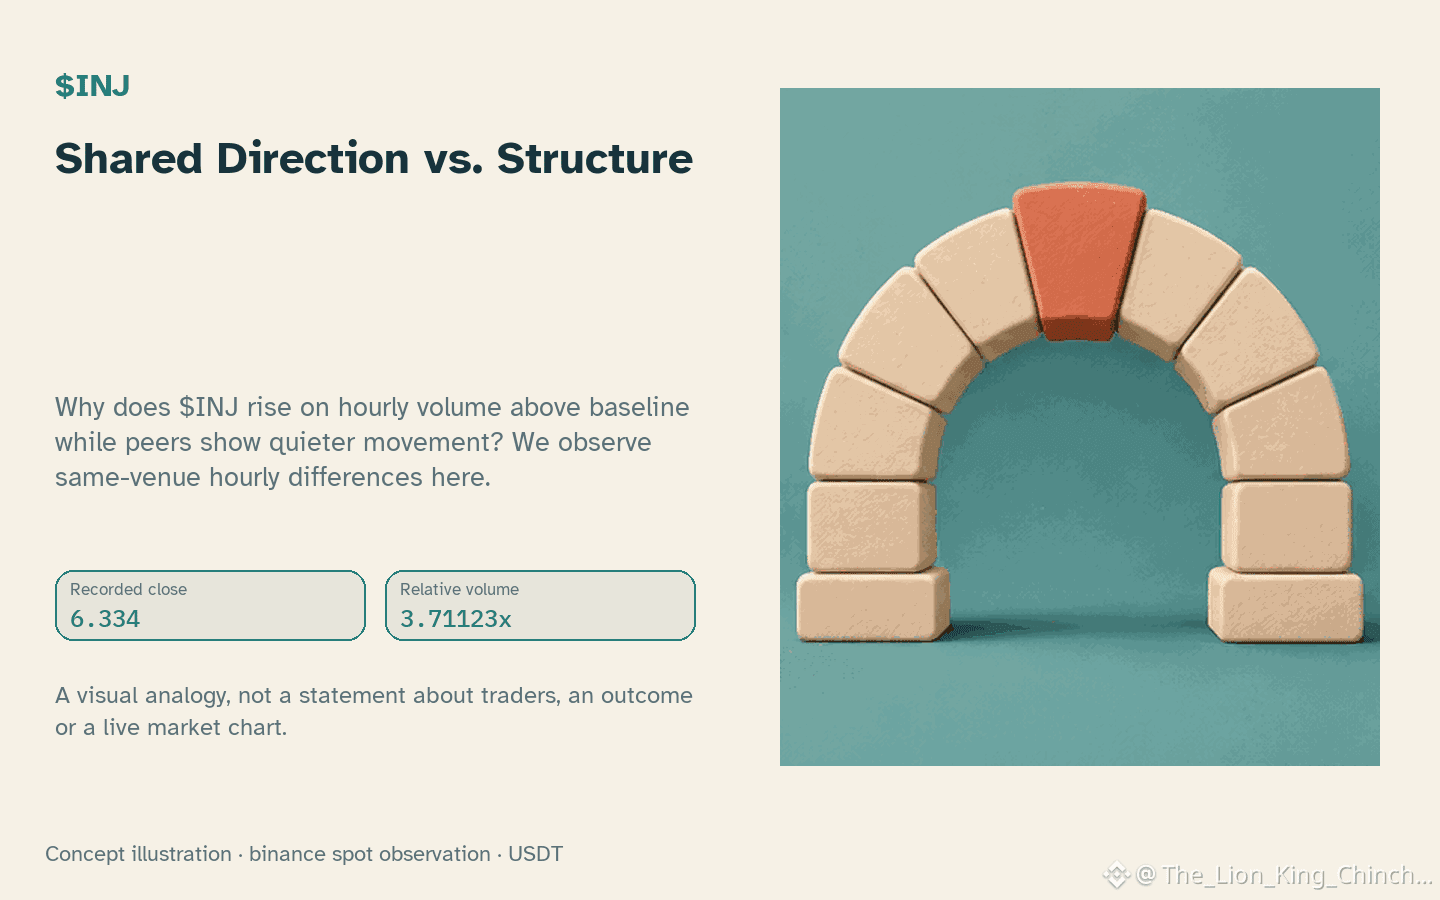
$INJ: Shared Direction vs. Structure
Why does $INJ rise on hourly volume above baseline while peers show quieter movement? We observe same-venue hourly differences here.
The tempting shortcut
Analysts often group active coins together. This assumes a common cause or rotation. That is a hypothetical mechanism. It is not a measured fact in this snapshot.
A more careful interpretation
$INJ now trades near 6.334. The hourly change is 2.94165%. RSI reads 72.8. Volume is 3.71x baseline. Peers $ETH and $TAO also move up hourly. Their volume stays not above baseline. Shared direction is not correlation. It does not prove sector membership. We cannot infer capital rotation from these candles alone. Local support sits at 6.025. Resistance is at 6.366. The range spans 20 bars. These levels describe the saved observation only. They do not predict the next candle.
A useful next observation
Watch for divergence in relative volume. If $INJ holds gains while peers flatten, the structure differs. A self-check reveals the error. Assume all three rise. If $ETH reverses next while $INJ continues, the group hypothesis weakens. This distinguishes individual momentum from shared noise. Do not mix exchange data. Use consistent venues for valid comparison. Limit conclusions to the supplied evidence. Avoid claiming profit from this pattern. Candles and volume cannot confirm motives, absorption, or order flow. The current state remains a single data point. Future closed candles will test this interpretation. Wait for price action to confirm or reject the local range. Treat the rising direction as a conditional signal. Do not treat it as a guaranteed entry. The lack of funding or open interest data adds uncertainty. Stick to verifiable price and volume facts only.
Probabilistic market research, not a recommendation or guaranteed return.
A useful cross-check: $ETH has hourly direction up and volume not above its baseline; $TAO has hourly direction up and volume not above its baseline. This alone does not establish correlation.
#INJ #ETH
$INJ : Shared Direction vs. Structure
Why does $INJ rise on hourly volume above baseline while peers show quieter movement? We observe same-venue hourly differences here.
The tempting shortcut
Analysts often group active coins together. This assumes a common cause or rotation. That is a hypothetical mechanism. It is not a measured fact in this snapshot.
A more careful interpretation
$INJ now trades near 6.334. The hourly change is 2.94165%. RSI reads 72.8. Volume is 3.71x baseline. Peers $ETH and $TAO also move up hourly. Their volume stays not above baseline. Shared direction is not correlation. It does not prove sector membership. We cannot infer capital rotation from these candles alone. Local support sits at 6.025. Resistance is at 6.366. The range spans 20 bars. These levels describe the saved observation only. They do not predict the next candle.
A useful next observation
Watch for divergence in relative volume. If $INJ holds gains while peers flatten, the structure differs. A self-check reveals the error. Assume all three rise. If $ETH reverses next while $INJ continues, the group hypothesis weakens. This distinguishes individual momentum from shared noise. Do not mix exchange data. Use consistent venues for valid comparison. Limit conclusions to the supplied evidence. Avoid claiming profit from this pattern. Candles and volume cannot confirm motives, absorption, or order flow. The current state remains a single data point. Future closed candles will test this interpretation. Wait for price action to confirm or reject the local range. Treat the rising direction as a conditional signal. Do not treat it as a guaranteed entry. The lack of funding or open interest data adds uncertainty. Stick to verifiable price and volume facts only.
Probabilistic market research, not a recommendation or guaranteed return.
A useful cross-check: $ETH has hourly direction up and volume not above its baseline; $TAO has hourly direction up and volume not above its baseline. This alone does not establish correlation.
#INJ #ETH
Why does $INJ rise on hourly volume above baseline while peers show quieter movement? We observe same-venue hourly differences here.
The tempting shortcut
Analysts often group active coins together. This assumes a common cause or rotation. That is a hypothetical mechanism. It is not a measured fact in this snapshot.
A more careful interpretation
$INJ now trades near 6.334. The hourly change is 2.94165%. RSI reads 72.8. Volume is 3.71x baseline. Peers $ETH and $TAO also move up hourly. Their volume stays not above baseline. Shared direction is not correlation. It does not prove sector membership. We cannot infer capital rotation from these candles alone. Local support sits at 6.025. Resistance is at 6.366. The range spans 20 bars. These levels describe the saved observation only. They do not predict the next candle.
A useful next observation
Watch for divergence in relative volume. If $INJ holds gains while peers flatten, the structure differs. A self-check reveals the error. Assume all three rise. If $ETH reverses next while $INJ continues, the group hypothesis weakens. This distinguishes individual momentum from shared noise. Do not mix exchange data. Use consistent venues for valid comparison. Limit conclusions to the supplied evidence. Avoid claiming profit from this pattern. Candles and volume cannot confirm motives, absorption, or order flow. The current state remains a single data point. Future closed candles will test this interpretation. Wait for price action to confirm or reject the local range. Treat the rising direction as a conditional signal. Do not treat it as a guaranteed entry. The lack of funding or open interest data adds uncertainty. Stick to verifiable price and volume facts only.
Probabilistic market research, not a recommendation or guaranteed return.
A useful cross-check: $ETH has hourly direction up and volume not above its baseline; $TAO has hourly direction up and volume not above its baseline. This alone does not establish correlation.
#INJ #ETH
54
Log in to explore more content
Join global crypto users on Binance Square
⚡️ Get latest and useful information about crypto.
💬 Trusted by the world’s largest crypto exchange.
👍 Discover real insights from verified creators.
Email / Phone number
Trending Topics
1
#BTCReboundsAbove$60KAmidWhaleDipBuying
1,568 views
30 Discussing
2
#NvidiaLoses$2.7TrillionInMonthAndAHalf
38,357 views
190 Discussing
3
#GlobalStocksFaceLongestLosingStreakSince2023
368,114 views
2,396 Discussing
4
#BlackRockIBITPostsRecord$541MSingleDayOutflow
51,508 views
133 Discussing
5
#AnthropicPlungesTowardIPOPriceonDay2
191,311 views
1,484 Discussing
6
#TwentyOneCapitalAdds172.25BTC
91,081 views
908 Discussing
7
#HKBillWouldExcludeTokenizedDepositsFromVirtualAssets
13,803 views
63 Discussing
8
#HKBillProposesHK$100KFineForUnauthorizedCryptoTitles
3,375 views
29 Discussing
9
#BitMineFaces$10.1BUnrealizedETHLoss
6,704 views
32 Discussing
10
#StrategyReports$35BNetReserves
3,581 views
20 Discussing