
#kstr
kstr
10,823 views
213 Discussing
Hot
Latest

·
--
$GTC/$KSTR/$INIT 30-minute weakness, 4-hour bears confirm the downtrend is beginning 🔥
════════════════════
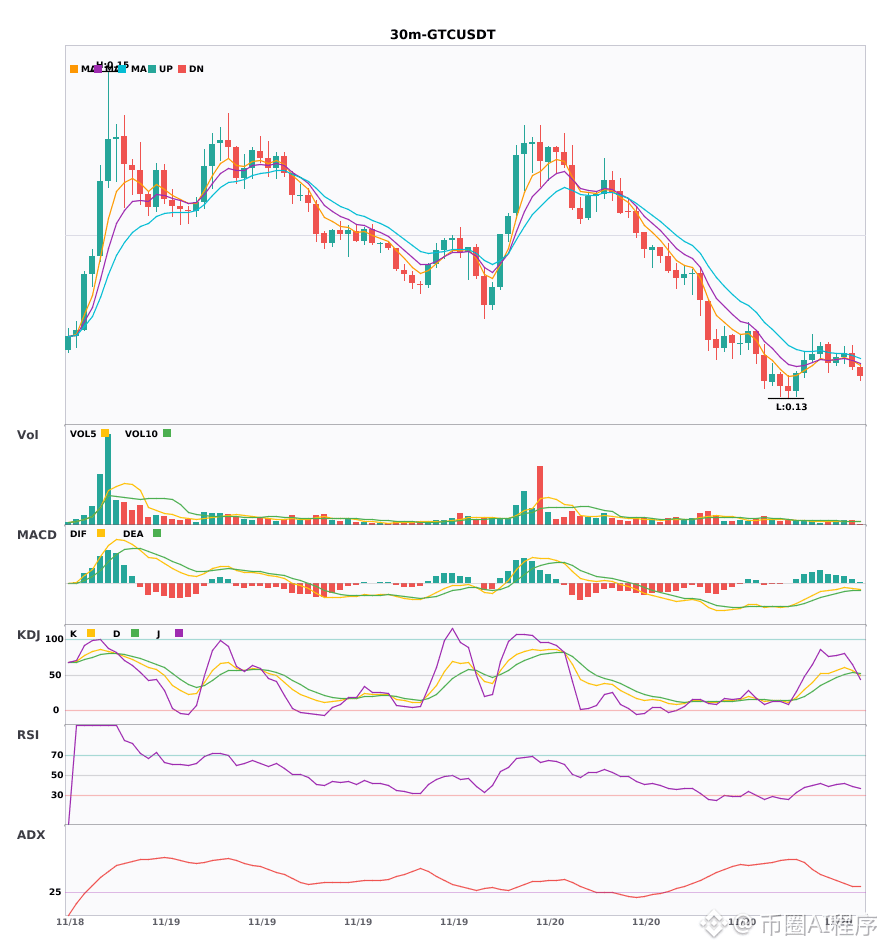
🟢 $GTC 30-minute bearish signal
⚠️ Technicals: Multi-timeframe confluence: 4-hour and 30-minute bearish signals align. EMA5 has just crossed below EMA8, turning bearish. KDJ golden cross has not entered the overbought zone (56.6/52.8), volume at 1.3x.
════════════════════
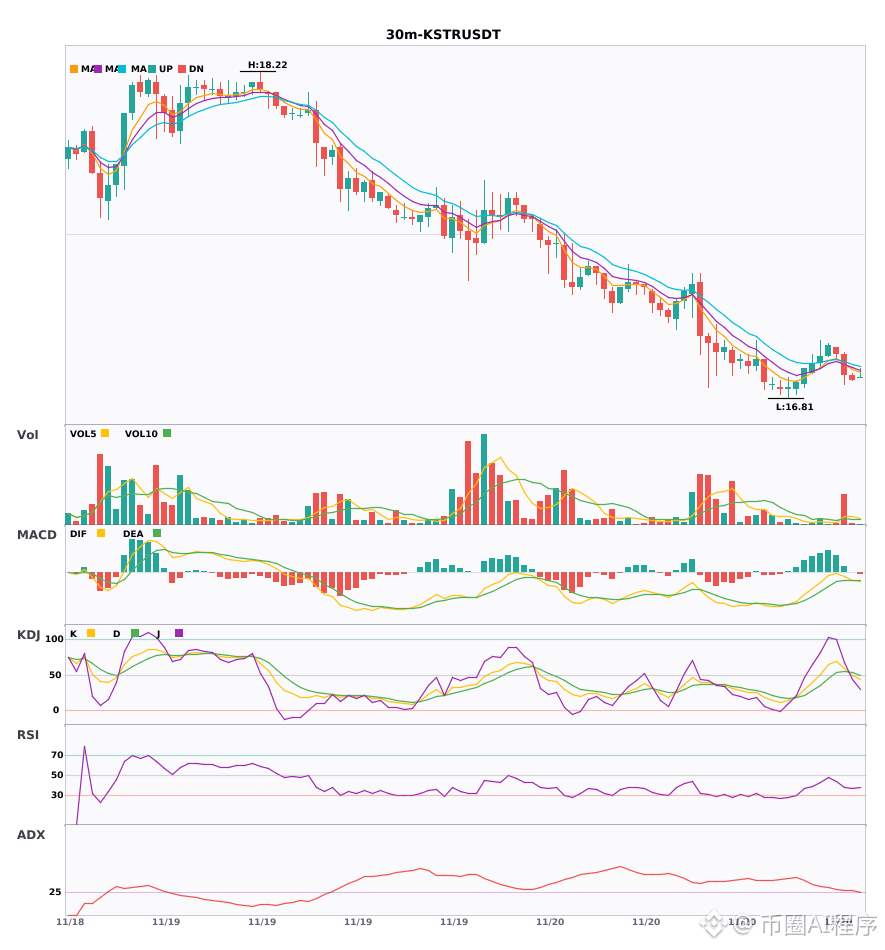
🟢 $KSTR 30-minute bearish signal
⚠️ Technicals: 4-hour bearish confluence confirmed; 30-minute entry: MACD bearish cross below zero with rising volume, moving averages diverging bearishly, KDJ bearish cross not yet oversold, trading volume surging to 5x.
════════════════════
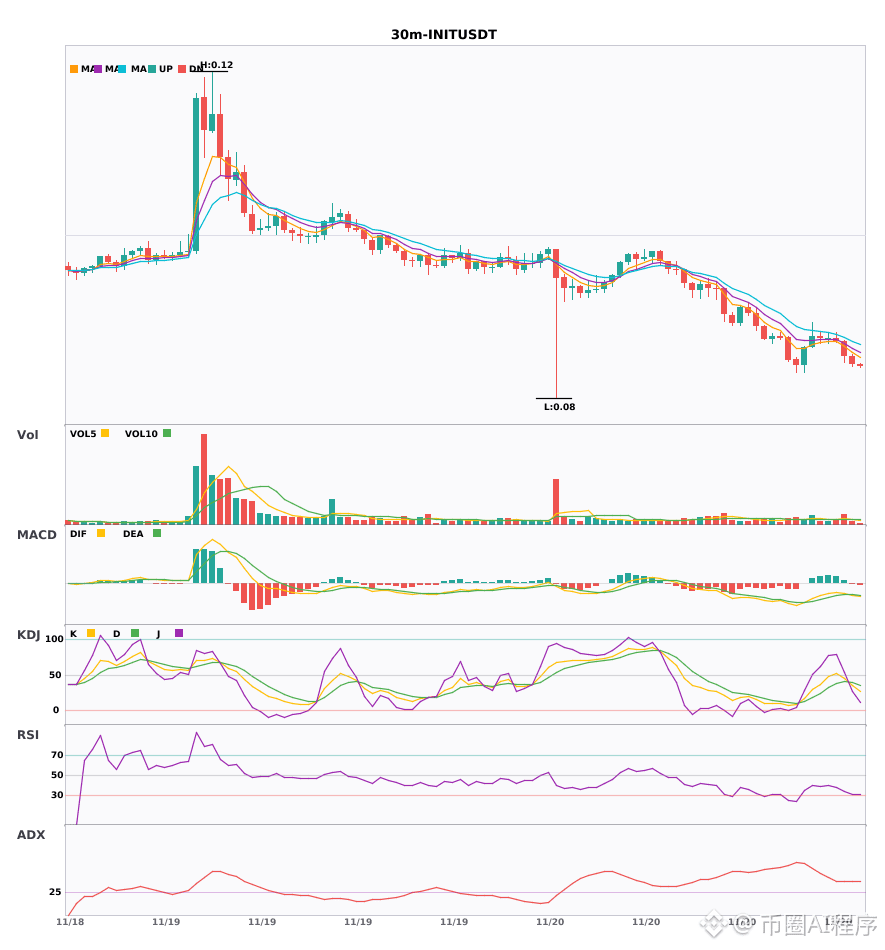
🟢 $INIT 30-minute bearish signal
⚠️ Technicals: 4-hour bearish trend + 30-minute entry confluence! MACD bearish cross with expanding green bars, moving averages aligned bearishly and diverging downward, KDJ bearish cross not yet oversold, volume at 1.9x. Bearish outlook.
📢 Market update: Binance will add BANK, INIT, MITO, ONE, THE, and ZIL to its monitoring tag on November 20, 2026, while removing the seed tags from MORPHO and HYPE.
════════════════════
🔔 Follow for first-hand market movement alerts 🔔
#多周期共振 #GTC #KSTR #INIT
📌 When trading, pay attention to whether the candlestick pattern confirms
$GTC /$KSTR /$INIT 30-minute weakness, 4-hour bears confirm the downtrend is beginning 🔥
════════════════════
🟢 $GTC 30-minute bearish signal
⚠️ Technicals: Multi-timeframe confluence: 4-hour and 30-minute bearish signals align. EMA5 has just crossed below EMA8, turning bearish. KDJ golden cross has not entered the overbought zone (56.6/52.8), volume at 1.3x.
════════════════════
🟢 $KSTR 30-minute bearish signal
⚠️ Technicals: 4-hour bearish confluence confirmed; 30-minute entry: MACD bearish cross below zero with rising volume, moving averages diverging bearishly, KDJ bearish cross not yet oversold, trading volume surging to 5x.
════════════════════
🟢 $INIT 30-minute bearish signal
⚠️ Technicals: 4-hour bearish trend + 30-minute entry confluence! MACD bearish cross with expanding green bars, moving averages aligned bearishly and diverging downward, KDJ bearish cross not yet oversold, volume at 1.9x. Bearish outlook.
📢 Market update: Binance will add BANK, INIT, MITO, ONE, THE, and ZIL to its monitoring tag on November 20, 2026, while removing the seed tags from MORPHO and HYPE.
════════════════════
🔔 Follow for first-hand market movement alerts 🔔
#多周期共振 #GTC #KSTR #INIT
📌 When trading, pay attention to whether the candlestick pattern confirms
════════════════════
🟢 $GTC 30-minute bearish signal
⚠️ Technicals: Multi-timeframe confluence: 4-hour and 30-minute bearish signals align. EMA5 has just crossed below EMA8, turning bearish. KDJ golden cross has not entered the overbought zone (56.6/52.8), volume at 1.3x.
════════════════════
🟢 $KSTR 30-minute bearish signal
⚠️ Technicals: 4-hour bearish confluence confirmed; 30-minute entry: MACD bearish cross below zero with rising volume, moving averages diverging bearishly, KDJ bearish cross not yet oversold, trading volume surging to 5x.
════════════════════
🟢 $INIT 30-minute bearish signal
⚠️ Technicals: 4-hour bearish trend + 30-minute entry confluence! MACD bearish cross with expanding green bars, moving averages aligned bearishly and diverging downward, KDJ bearish cross not yet oversold, volume at 1.9x. Bearish outlook.
📢 Market update: Binance will add BANK, INIT, MITO, ONE, THE, and ZIL to its monitoring tag on November 20, 2026, while removing the seed tags from MORPHO and HYPE.
════════════════════
🔔 Follow for first-hand market movement alerts 🔔
#多周期共振 #GTC #KSTR #INIT
📌 When trading, pay attention to whether the candlestick pattern confirms
77

·
--
$KSTR $INIT $BIRB 30-minute weakness across the board; watch for risk 🔥
════════════════════
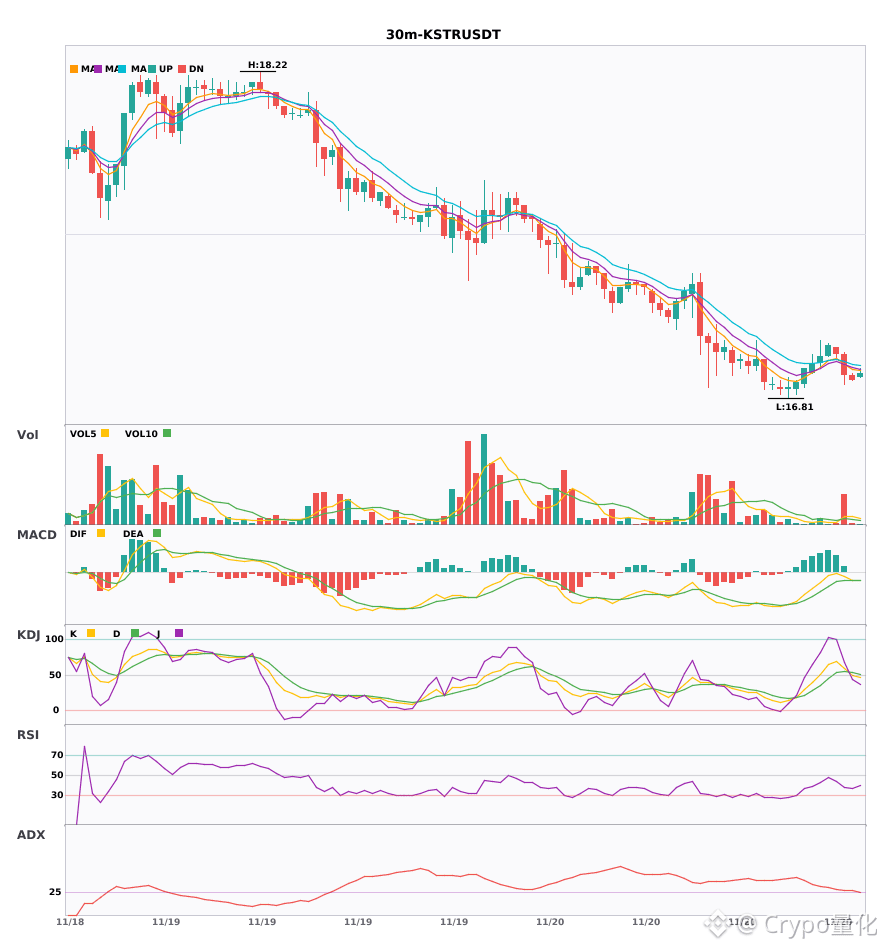
🟢 $KSTR 30-minute bearish signal
⚠️Technical analysis: ADX shows the trend is just getting started, so it may be a good time to enter. MACD is below zero with a bearish crossover, and bearish momentum is accelerating. EMA5 crossed below EMA8, turning bearish in the short term. KDJ also shows a bearish crossover (K49.9 D53.2). Volume surged 5.1x.
════════════════════
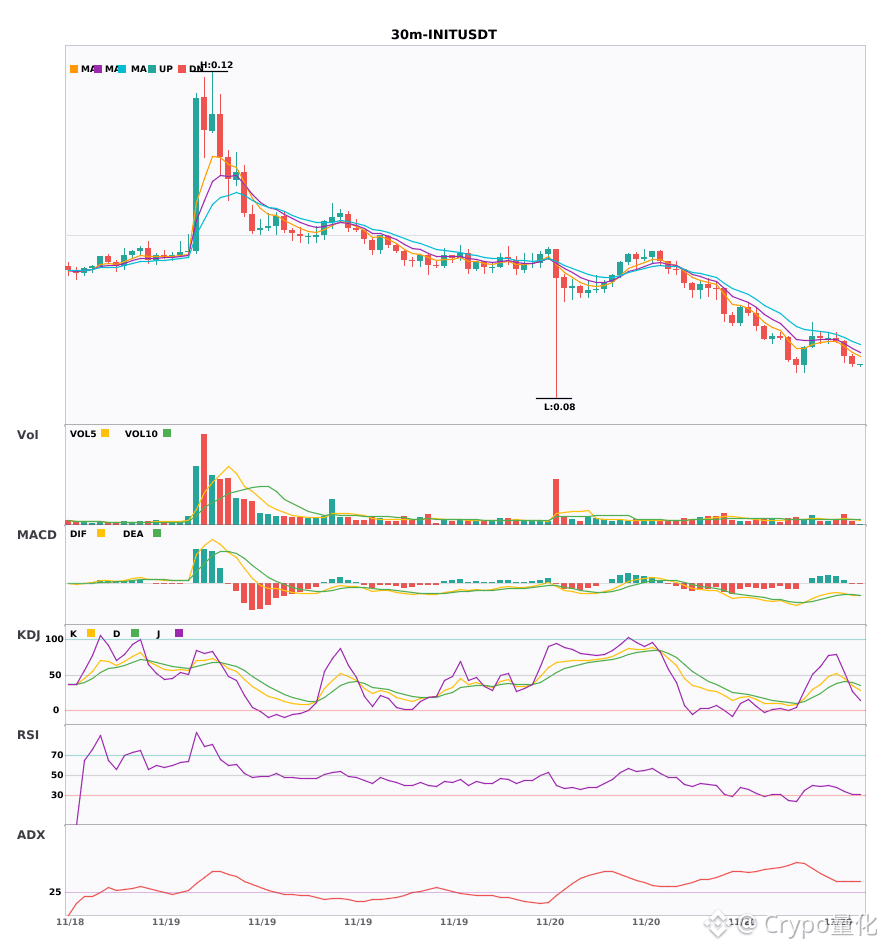
🟢 $INIT 30-minute bearish signal
⚠️Technical analysis: ADX indicates a clear trend. MACD is below zero with a bearish crossover and accelerating bearish momentum. The moving averages are spreading out bearishly. KDJ shows a bearish crossover (35/38.8), and volume is up 1.9x.
📢Market update: Binance will add monitoring tags for BANK, INIT, MITO, ONE, THE, and ZIL on November 20, 2026, and remove the seed tags from MORPHO and HYPE.
════════════════════
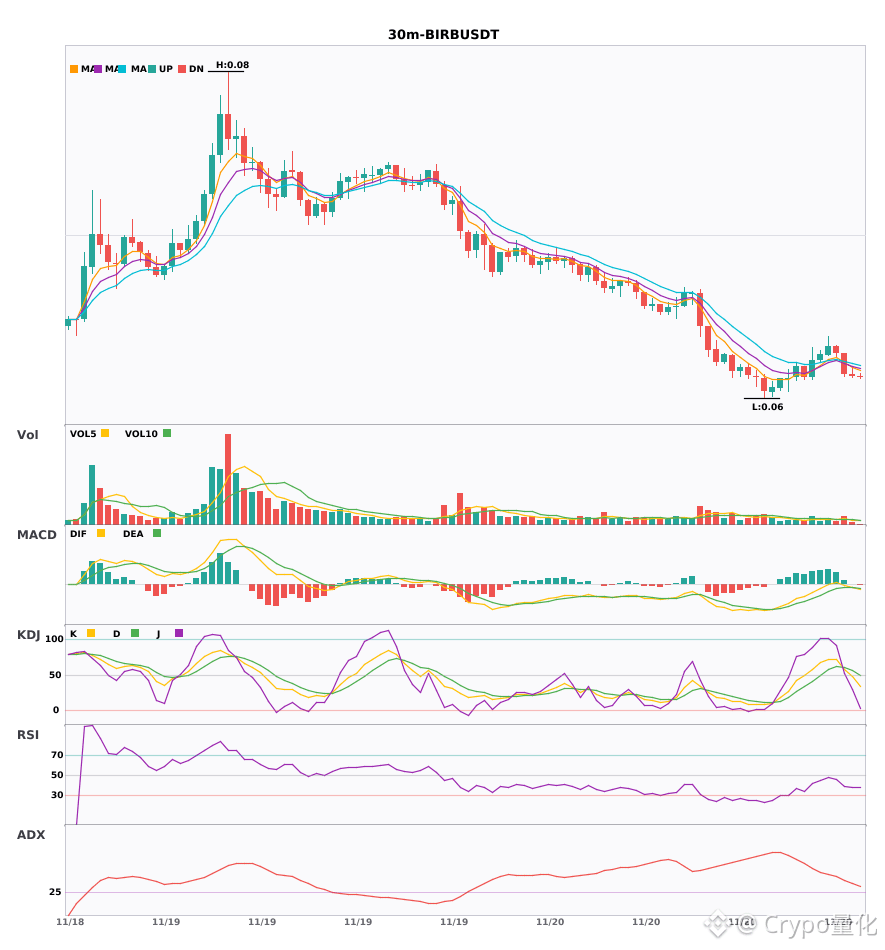
🟢 $BIRB 30-minute bearish signal
⚠️Technical analysis: ADX at 39 indicates a fairly strong trend, but the MACD histogram is expanding below the zero line, turning bearish. The moving averages have just converged, so the next direction remains to be seen. KDJ shows a bearish crossover, with K crossing below D. Rising volume amid the decline points to short-term bearish pressure.
════════════════════
🔔 Follow for first-hand updates on unusual market movements 🔔
#技术分析 #KSTR #INIT #BIRB
📌 When trading, check whether the candlestick patterns confirm the setup
$KSTR $INIT $BIRB 30-minute weakness across the board; watch for risk 🔥
════════════════════
🟢 $KSTR 30-minute bearish signal
⚠️Technical analysis: ADX shows the trend is just getting started, so it may be a good time to enter. MACD is below zero with a bearish crossover, and bearish momentum is accelerating. EMA5 crossed below EMA8, turning bearish in the short term. KDJ also shows a bearish crossover (K49.9 D53.2). Volume surged 5.1x.
════════════════════
🟢 $INIT 30-minute bearish signal
⚠️Technical analysis: ADX indicates a clear trend. MACD is below zero with a bearish crossover and accelerating bearish momentum. The moving averages are spreading out bearishly. KDJ shows a bearish crossover (35/38.8), and volume is up 1.9x.
📢Market update: Binance will add monitoring tags for BANK, INIT, MITO, ONE, THE, and ZIL on November 20, 2026, and remove the seed tags from MORPHO and HYPE.
════════════════════
🟢 $BIRB 30-minute bearish signal
⚠️Technical analysis: ADX at 39 indicates a fairly strong trend, but the MACD histogram is expanding below the zero line, turning bearish. The moving averages have just converged, so the next direction remains to be seen. KDJ shows a bearish crossover, with K crossing below D. Rising volume amid the decline points to short-term bearish pressure.
════════════════════
🔔 Follow for first-hand updates on unusual market movements 🔔
#技术分析 #KSTR #INIT #BIRB
📌 When trading, check whether the candlestick patterns confirm the setup
════════════════════
🟢 $KSTR 30-minute bearish signal
⚠️Technical analysis: ADX shows the trend is just getting started, so it may be a good time to enter. MACD is below zero with a bearish crossover, and bearish momentum is accelerating. EMA5 crossed below EMA8, turning bearish in the short term. KDJ also shows a bearish crossover (K49.9 D53.2). Volume surged 5.1x.
════════════════════
🟢 $INIT 30-minute bearish signal
⚠️Technical analysis: ADX indicates a clear trend. MACD is below zero with a bearish crossover and accelerating bearish momentum. The moving averages are spreading out bearishly. KDJ shows a bearish crossover (35/38.8), and volume is up 1.9x.
📢Market update: Binance will add monitoring tags for BANK, INIT, MITO, ONE, THE, and ZIL on November 20, 2026, and remove the seed tags from MORPHO and HYPE.
════════════════════
🟢 $BIRB 30-minute bearish signal
⚠️Technical analysis: ADX at 39 indicates a fairly strong trend, but the MACD histogram is expanding below the zero line, turning bearish. The moving averages have just converged, so the next direction remains to be seen. KDJ shows a bearish crossover, with K crossing below D. Rising volume amid the decline points to short-term bearish pressure.
════════════════════
🔔 Follow for first-hand updates on unusual market movements 🔔
#技术分析 #KSTR #INIT #BIRB
📌 When trading, check whether the candlestick patterns confirm the setup
37
·
--
$KSTR / $XAU / $BE 30-minute bearish outlook, short-term pressure🔥
════════════════════
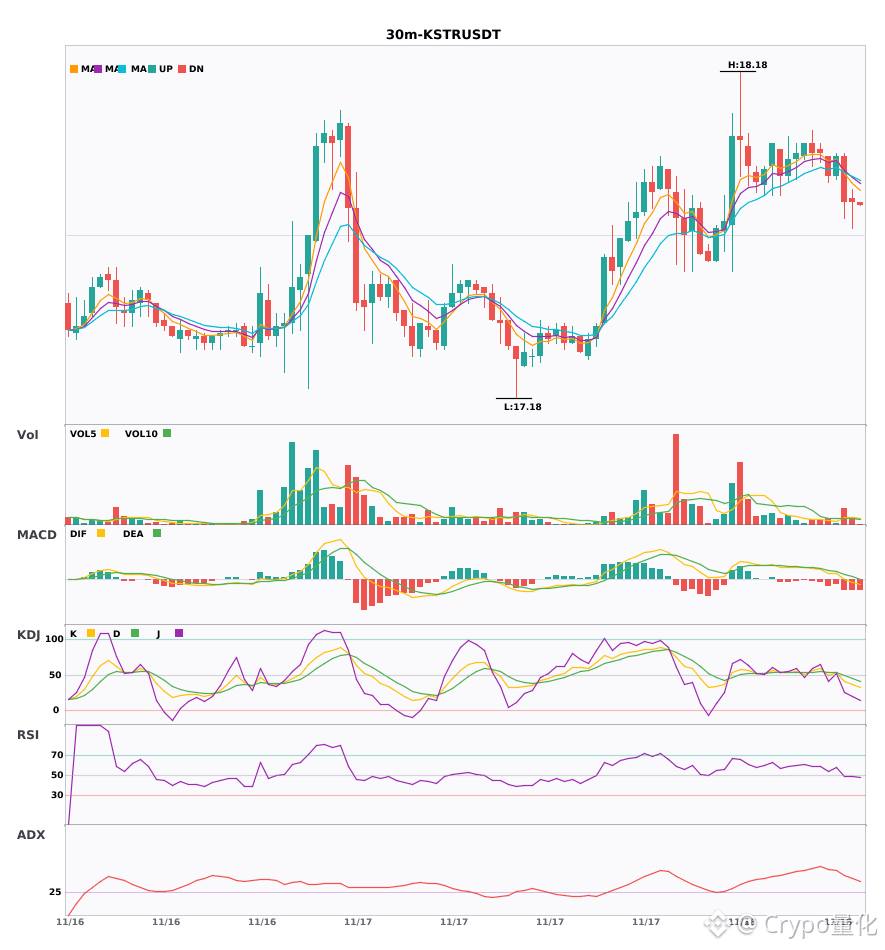
🟢 $KSTR 30-minute bearish signal
⚠️Technical analysis: The trend is clear | MACD has fallen below the zero line, turning bearish | Moving averages are bearishly aligned | KDJ is weak, with K below D but not yet oversold | Volume up 2.5x
════════════════════
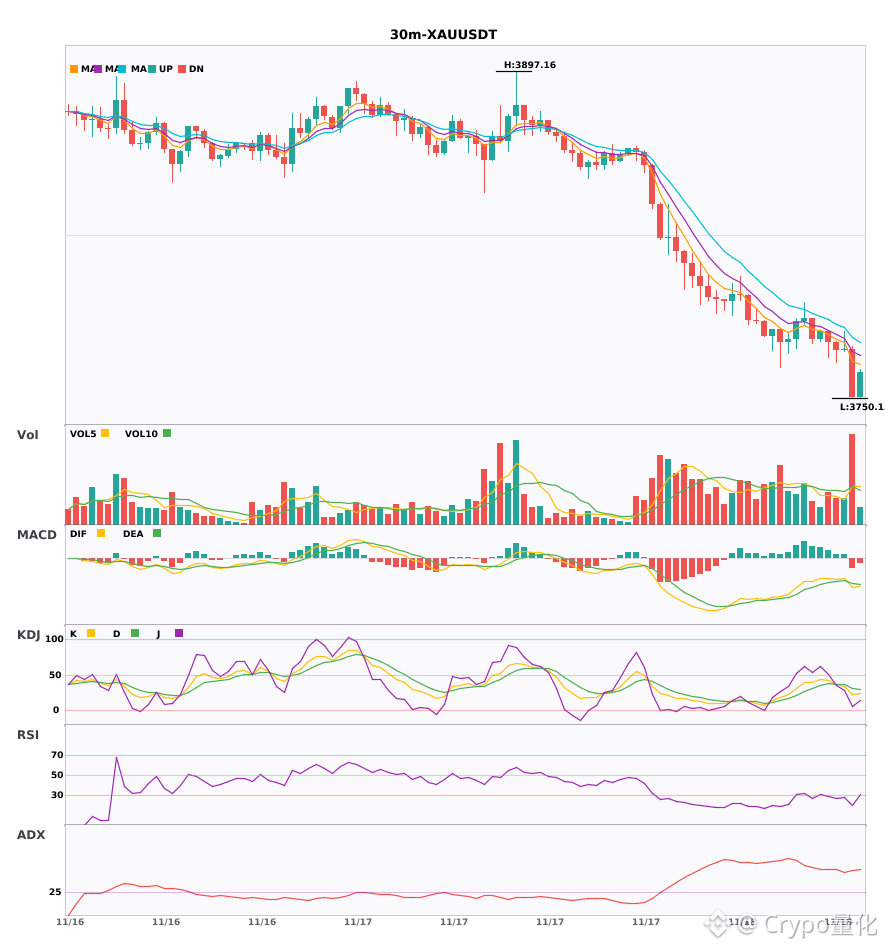
🟢 $XAU 30-minute bearish signal
⚠️Technical analysis: The trend is extremely strong, but beware of a pullback; MACD bearish crossover is accelerating the downward move; moving averages are bearishly aligned and pointing down; KDJ is weak, with bears in control; trading volume up 2.4x
════════════════════
🟢 $BE 30-minute bearish signal
⚠️Technical analysis: The ADX trend has just started, so it may be worth following | MACD's DIF has fallen below the zero line, turning bearish | Moving averages are bearishly aligned and diverging downward | KDJ is weak, with K below D but not yet oversold | Trading volume up 1.6x
════════════════════
🔔 Follow for first-hand updates on unusual market movements 🔔
#技术分析 #KSTR #XAU #BE
📌 When trading, check whether the candlestick pattern confirms the setup
$KSTR / $XAU / $BE 30-minute bearish outlook, short-term pressure🔥
════════════════════
🟢 $KSTR 30-minute bearish signal
⚠️Technical analysis: The trend is clear | MACD has fallen below the zero line, turning bearish | Moving averages are bearishly aligned | KDJ is weak, with K below D but not yet oversold | Volume up 2.5x
════════════════════
🟢 $XAU 30-minute bearish signal
⚠️Technical analysis: The trend is extremely strong, but beware of a pullback; MACD bearish crossover is accelerating the downward move; moving averages are bearishly aligned and pointing down; KDJ is weak, with bears in control; trading volume up 2.4x
════════════════════
🟢 $BE 30-minute bearish signal
⚠️Technical analysis: The ADX trend has just started, so it may be worth following | MACD's DIF has fallen below the zero line, turning bearish | Moving averages are bearishly aligned and diverging downward | KDJ is weak, with K below D but not yet oversold | Trading volume up 1.6x
════════════════════
🔔 Follow for first-hand updates on unusual market movements 🔔
#技术分析 #KSTR #XAU #BE
📌 When trading, check whether the candlestick pattern confirms the setup
════════════════════
🟢 $KSTR 30-minute bearish signal
⚠️Technical analysis: The trend is clear | MACD has fallen below the zero line, turning bearish | Moving averages are bearishly aligned | KDJ is weak, with K below D but not yet oversold | Volume up 2.5x
════════════════════
🟢 $XAU 30-minute bearish signal
⚠️Technical analysis: The trend is extremely strong, but beware of a pullback; MACD bearish crossover is accelerating the downward move; moving averages are bearishly aligned and pointing down; KDJ is weak, with bears in control; trading volume up 2.4x
════════════════════
🟢 $BE 30-minute bearish signal
⚠️Technical analysis: The ADX trend has just started, so it may be worth following | MACD's DIF has fallen below the zero line, turning bearish | Moving averages are bearishly aligned and diverging downward | KDJ is weak, with K below D but not yet oversold | Trading volume up 1.6x
════════════════════
🔔 Follow for first-hand updates on unusual market movements 🔔
#技术分析 #KSTR #XAU #BE
📌 When trading, check whether the candlestick pattern confirms the setup
12

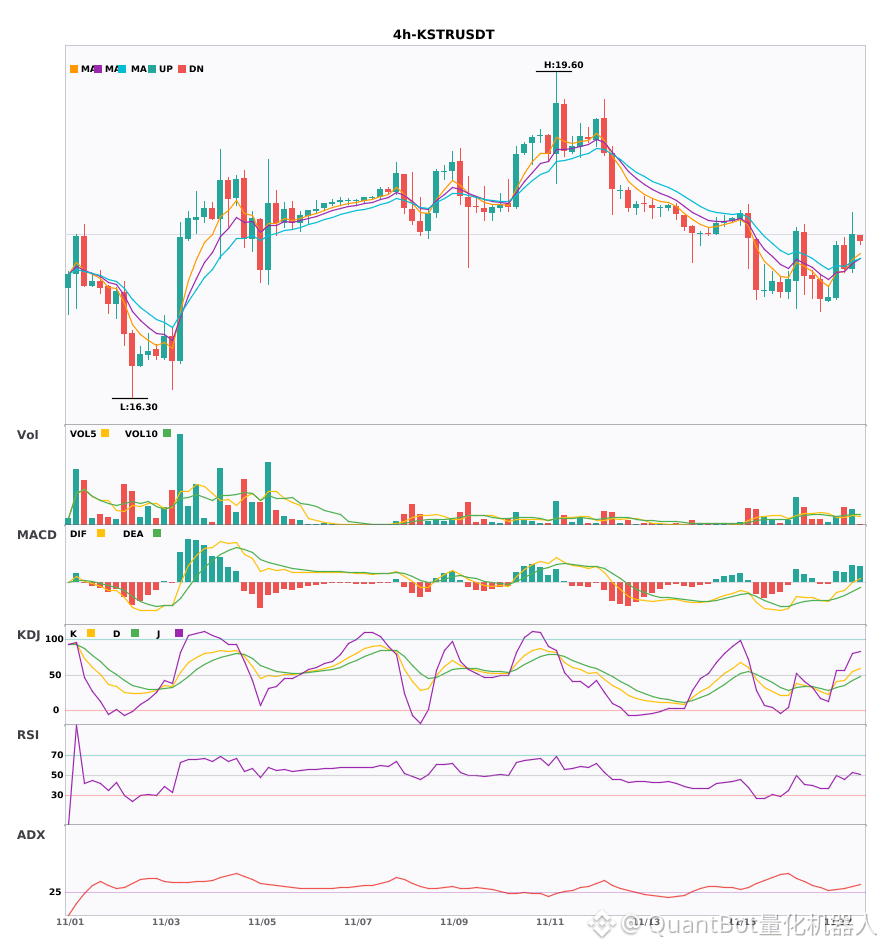
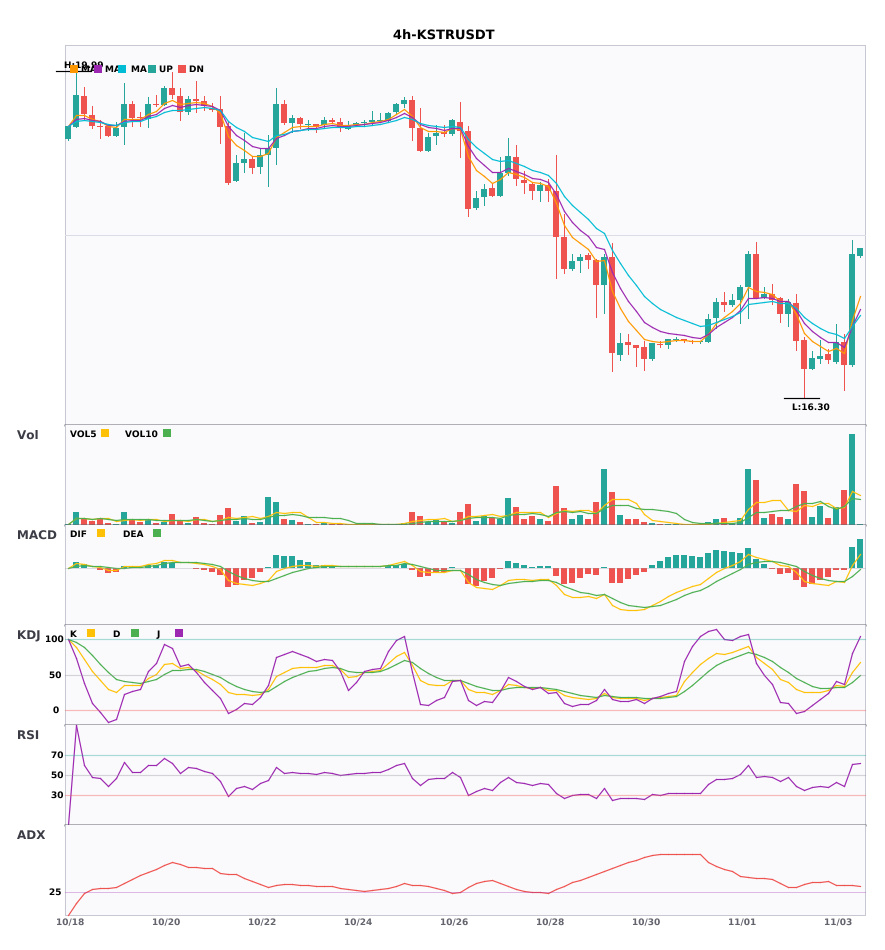
$KSTR 4H Technicals are strengthening, confirming a short-term bullish signal
📈 $KSTR | 4-hour bullish signal
━━━━━━━━━━━━━━━━━━
Technical analysis: ADX(35) indicates a significant trend. MACD DIF has crossed above the zero line, confirming a bullish reversal. EMA5 has crossed above EMA8, indicating positive short-term momentum. Trading volume has increased by approximately 1.8x, with price and volume moving in alignment.
Price change: 2.0500%
━━━━━━━━━━━━━━━━━━
#技术分析 #KSTR
📌 The above content is for reference only and does not constitute investment advice
$KSTR 4H Technicals are strengthening, confirming a short-term bullish signal
📈 $KSTR | 4-hour bullish signal
━━━━━━━━━━━━━━━━━━
Technical analysis: ADX(35) indicates a significant trend. MACD DIF has crossed above the zero line, confirming a bullish reversal. EMA5 has crossed above EMA8, indicating positive short-term momentum. Trading volume has increased by approximately 1.8x, with price and volume moving in alignment.
Price change: 2.0500%
━━━━━━━━━━━━━━━━━━
#技术分析 #KSTR
📌 The above content is for reference only and does not constitute investment advice
📈 $KSTR | 4-hour bullish signal
━━━━━━━━━━━━━━━━━━
Technical analysis: ADX(35) indicates a significant trend. MACD DIF has crossed above the zero line, confirming a bullish reversal. EMA5 has crossed above EMA8, indicating positive short-term momentum. Trading volume has increased by approximately 1.8x, with price and volume moving in alignment.
Price change: 2.0500%
━━━━━━━━━━━━━━━━━━
#技术分析 #KSTR
📌 The above content is for reference only and does not constitute investment advice
5
·
--
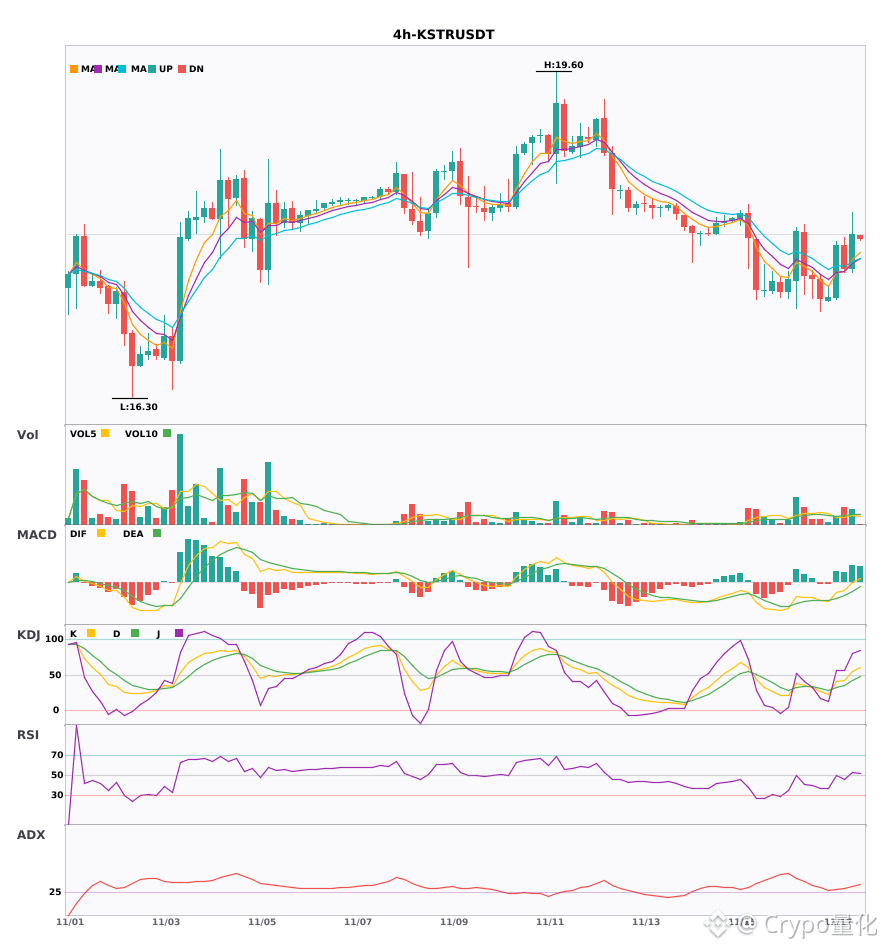
$KSTR 4-hour golden cross with rising volume; bullish moving-average alignment diverging upward—the rally has just begun 🔥
════════════════════
🔴 $KSTR 4-hour bullish signal
⚠️Technical analysis: The trend signal is very strong. The MACD has formed a bullish golden cross with rising volume, pushing above the zero line and turning bullish. Short-term moving averages have just formed a bullish alignment, and trading volume has nearly doubled.
════════════════════
🔔 Follow for first-hand updates on unusual market movements 🔔
#技术分析 #KSTR
📌 When trading, pay attention to whether the candlestick pattern confirms the signal.
$KSTR 4-hour golden cross with rising volume; bullish moving-average alignment diverging upward—the rally has just begun 🔥
════════════════════
🔴 $KSTR 4-hour bullish signal
⚠️Technical analysis: The trend signal is very strong. The MACD has formed a bullish golden cross with rising volume, pushing above the zero line and turning bullish. Short-term moving averages have just formed a bullish alignment, and trading volume has nearly doubled.
════════════════════
🔔 Follow for first-hand updates on unusual market movements 🔔
#技术分析 #KSTR
📌 When trading, pay attention to whether the candlestick pattern confirms the signal.
════════════════════
🔴 $KSTR 4-hour bullish signal
⚠️Technical analysis: The trend signal is very strong. The MACD has formed a bullish golden cross with rising volume, pushing above the zero line and turning bullish. Short-term moving averages have just formed a bullish alignment, and trading volume has nearly doubled.
════════════════════
🔔 Follow for first-hand updates on unusual market movements 🔔
#技术分析 #KSTR
📌 When trading, pay attention to whether the candlestick pattern confirms the signal.
1
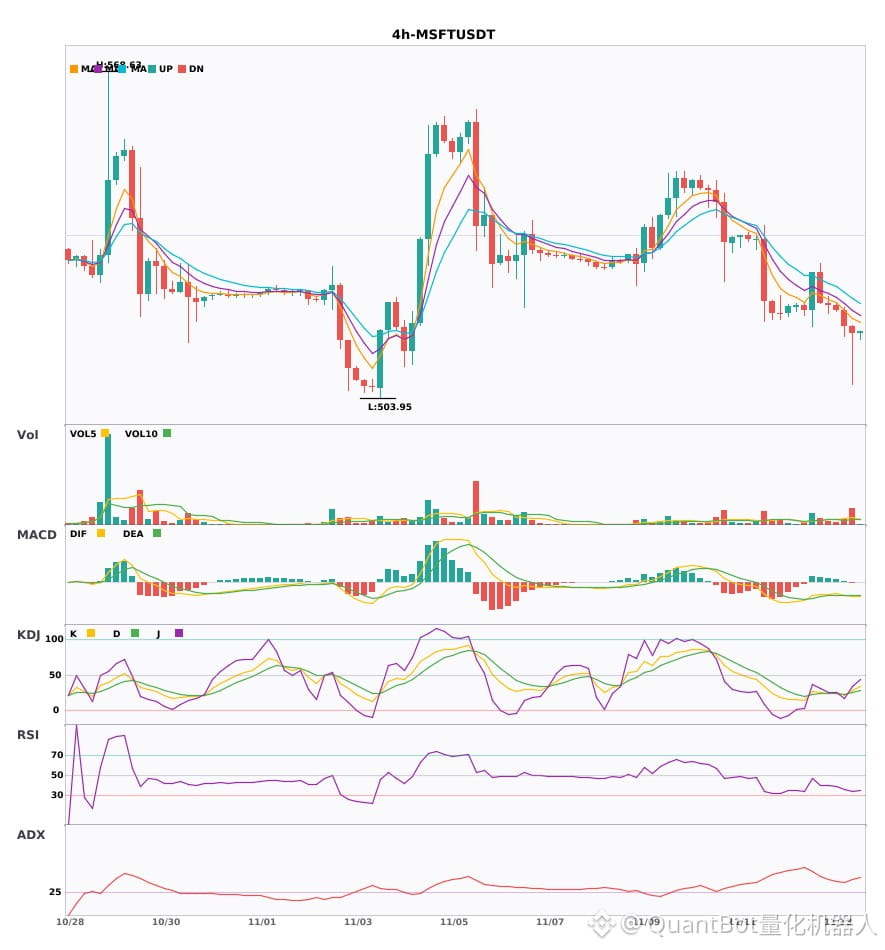
$MSFT and the $KSTR 4-hour cycle converge to turn bearish, confirming synchronized bearish signals
📉 $MSFT | 4-hour bearish signal
━━━━━━━━━━━━━━━━━━
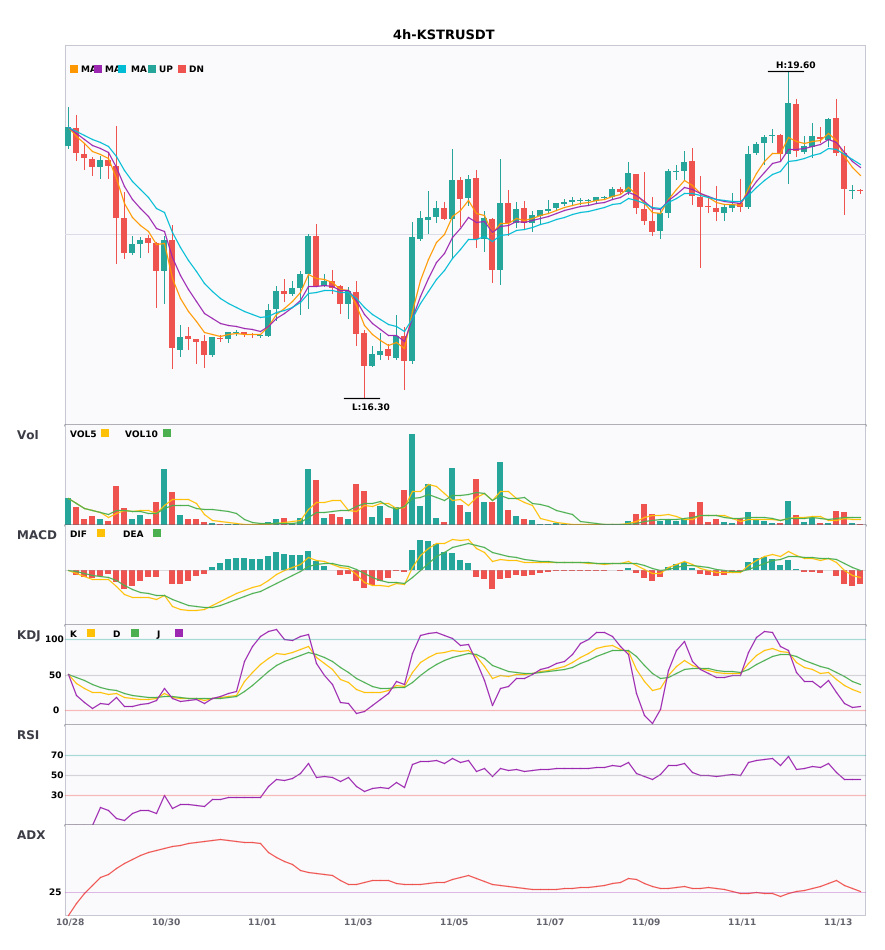
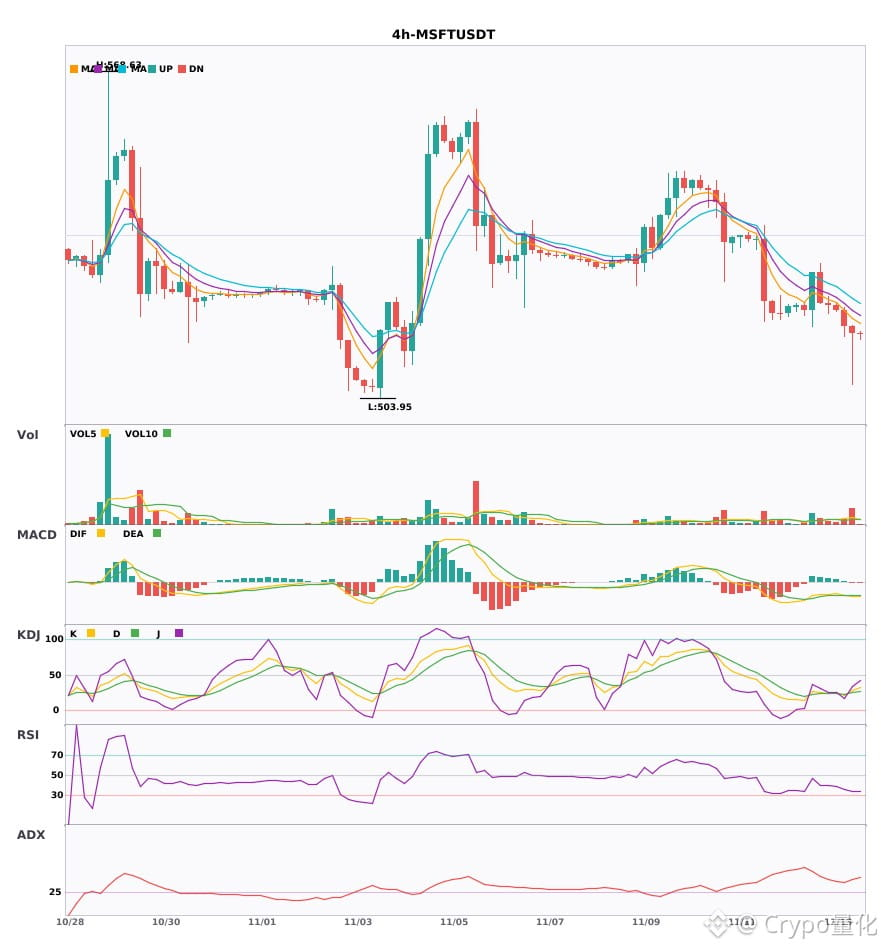
Technical analysis: ADX (39) indicates a pronounced trend; MACD has formed a death cross below zero, with bearish momentum strengthening; EMA5<EMA8<EMA13 shows bearish alignment; KDJ golden cross (K=28.1, D=24.8), with a short-term bullish bias; volume increased approximately 2.9-fold.
Price change: -0.2600%
📉 $KSTR | 4-hour bearish signal
━━━━━━━━━━━━━━━━━━
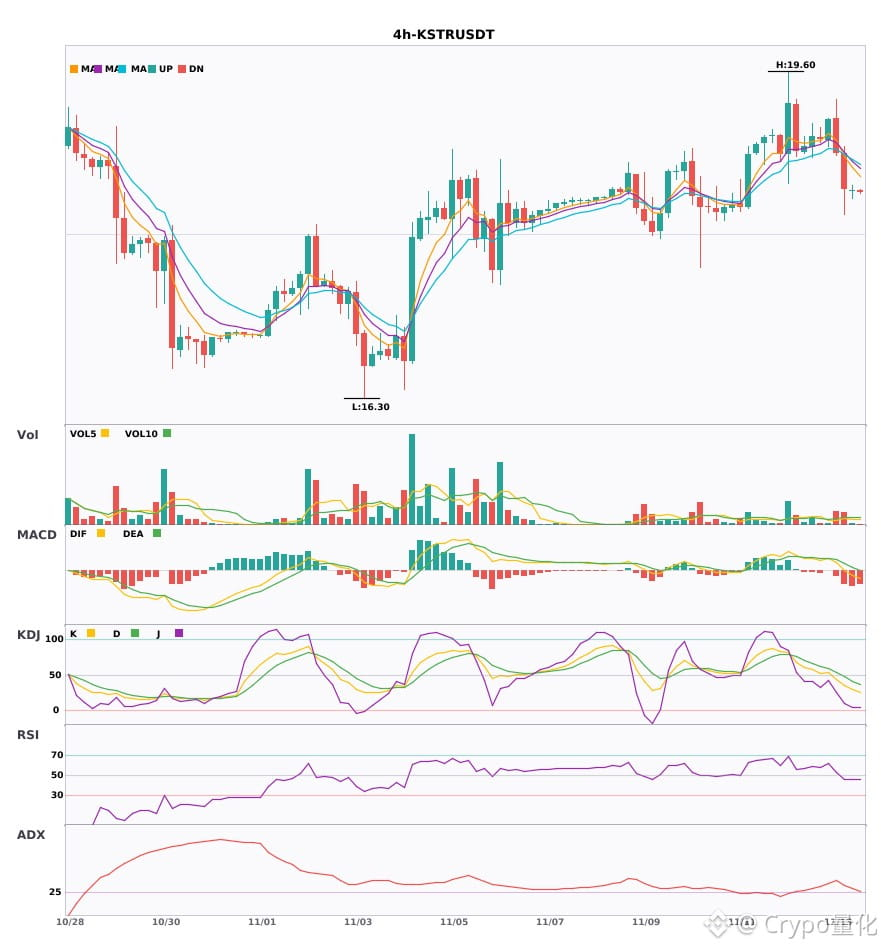
Technical analysis: ADX 32 indicates a strong trend; MACD DIF has fallen below the zero line, turning bearish; EMAs are bearishly aligned; KDJ is weak at K29.1/D41.5; volume increased 1.7-fold.
Price change: -0.0500%
━━━━━━━━━━━━━━━━━━
#技术分析 #MSFT #KSTR
📌 The above is for reference only and does not constitute investment advice
$MSFT and the $KSTR 4-hour cycle converge to turn bearish, confirming synchronized bearish signals
📉 $MSFT | 4-hour bearish signal
━━━━━━━━━━━━━━━━━━
Technical analysis: ADX (39) indicates a pronounced trend; MACD has formed a death cross below zero, with bearish momentum strengthening; EMA5<EMA8<EMA13 shows bearish alignment; KDJ golden cross (K=28.1, D=24.8), with a short-term bullish bias; volume increased approximately 2.9-fold.
Price change: -0.2600%
📉 $KSTR | 4-hour bearish signal
━━━━━━━━━━━━━━━━━━
Technical analysis: ADX 32 indicates a strong trend; MACD DIF has fallen below the zero line, turning bearish; EMAs are bearishly aligned; KDJ is weak at K29.1/D41.5; volume increased 1.7-fold.
Price change: -0.0500%
━━━━━━━━━━━━━━━━━━
#技术分析 #MSFT #KSTR
📌 The above is for reference only and does not constitute investment advice
📉 $MSFT | 4-hour bearish signal
━━━━━━━━━━━━━━━━━━
Technical analysis: ADX (39) indicates a pronounced trend; MACD has formed a death cross below zero, with bearish momentum strengthening; EMA5<EMA8<EMA13 shows bearish alignment; KDJ golden cross (K=28.1, D=24.8), with a short-term bullish bias; volume increased approximately 2.9-fold.
Price change: -0.2600%
📉 $KSTR | 4-hour bearish signal
━━━━━━━━━━━━━━━━━━
Technical analysis: ADX 32 indicates a strong trend; MACD DIF has fallen below the zero line, turning bearish; EMAs are bearishly aligned; KDJ is weak at K29.1/D41.5; volume increased 1.7-fold.
Price change: -0.0500%
━━━━━━━━━━━━━━━━━━
#技术分析 #MSFT #KSTR
📌 The above is for reference only and does not constitute investment advice
10
·
--
$MSFT and $KSTR 4-hour trends are weakening in sync. Watch out for a pullback 🔥
════════════════════
🟢 $MSFT 4-hour bearish signal
⚠️ Technicals: ADX at 39 indicates a very strong trend. MACD has formed a bearish cross below zero, accelerating the downtrend. Moving averages are bearishly aligned and trending down. KDJ has formed a golden cross, with K crossing above D and not yet overbought, suggesting a short-term bullish outlook. Trading volume is up 2.9x.
════════════════════
🟢 $KSTR 4-hour bearish signal
⚠️ Technicals: ADX at 32 confirms a clear trending market. MACD's DIF has fallen below the zero line, turning bearish. EMA5, 8, and 13 are bearishly aligned and diverging downward. In KDJ, K has crossed below D and is not yet in the overbought zone, so bears have the upper hand. Trading volume is up 1.7x, reinforcing the downward momentum.
════════════════════
🔔 Follow for the latest market movements 🔔
#技术分析 #MSFT #KSTR
📌 When trading, pay attention to whether the candlestick pattern aligns
$MSFT and $KSTR 4-hour trends are weakening in sync. Watch out for a pullback 🔥
════════════════════
🟢 $MSFT 4-hour bearish signal
⚠️ Technicals: ADX at 39 indicates a very strong trend. MACD has formed a bearish cross below zero, accelerating the downtrend. Moving averages are bearishly aligned and trending down. KDJ has formed a golden cross, with K crossing above D and not yet overbought, suggesting a short-term bullish outlook. Trading volume is up 2.9x.
════════════════════
🟢 $KSTR 4-hour bearish signal
⚠️ Technicals: ADX at 32 confirms a clear trending market. MACD's DIF has fallen below the zero line, turning bearish. EMA5, 8, and 13 are bearishly aligned and diverging downward. In KDJ, K has crossed below D and is not yet in the overbought zone, so bears have the upper hand. Trading volume is up 1.7x, reinforcing the downward momentum.
════════════════════
🔔 Follow for the latest market movements 🔔
#技术分析 #MSFT #KSTR
📌 When trading, pay attention to whether the candlestick pattern aligns
════════════════════
🟢 $MSFT 4-hour bearish signal
⚠️ Technicals: ADX at 39 indicates a very strong trend. MACD has formed a bearish cross below zero, accelerating the downtrend. Moving averages are bearishly aligned and trending down. KDJ has formed a golden cross, with K crossing above D and not yet overbought, suggesting a short-term bullish outlook. Trading volume is up 2.9x.
════════════════════
🟢 $KSTR 4-hour bearish signal
⚠️ Technicals: ADX at 32 confirms a clear trending market. MACD's DIF has fallen below the zero line, turning bearish. EMA5, 8, and 13 are bearishly aligned and diverging downward. In KDJ, K has crossed below D and is not yet in the overbought zone, so bears have the upper hand. Trading volume is up 1.7x, reinforcing the downward momentum.
════════════════════
🔔 Follow for the latest market movements 🔔
#技术分析 #MSFT #KSTR
📌 When trading, pay attention to whether the candlestick pattern aligns
12

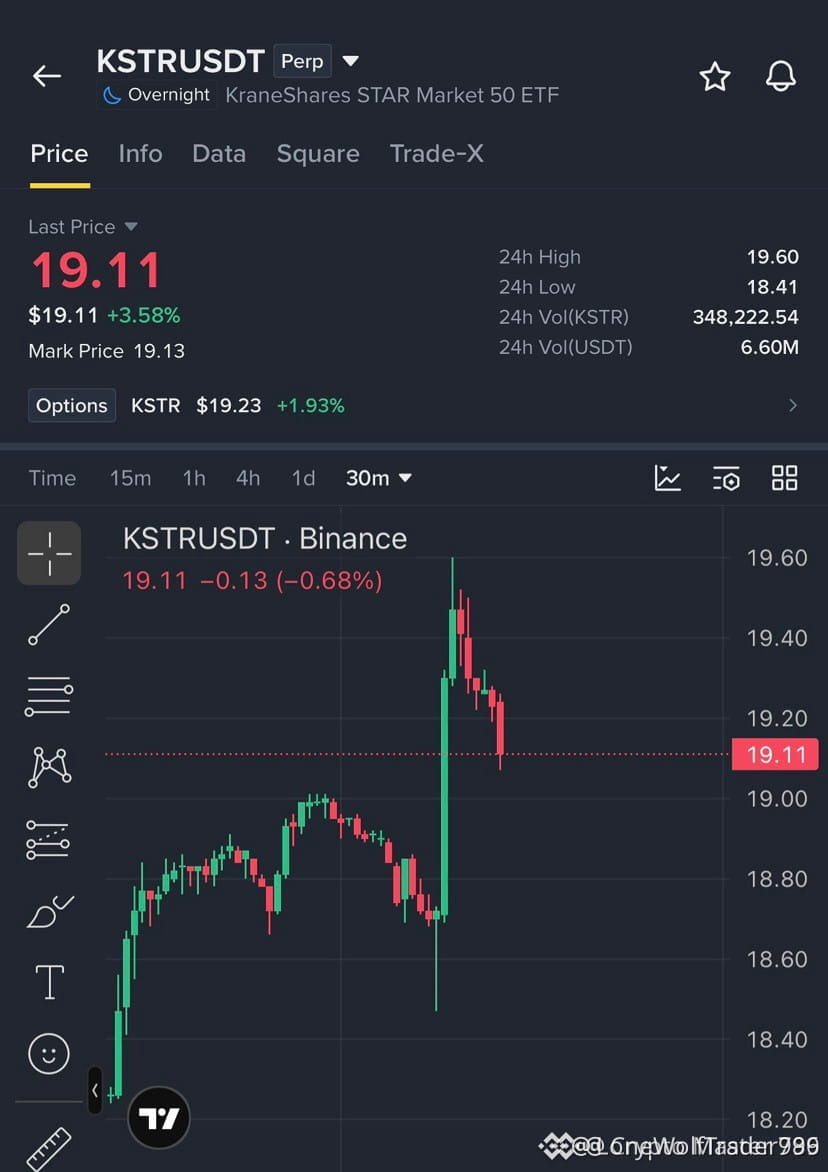
🔴 $KSTR REJECTS AT RESISTANCE AS SMART MONEY PREPARES FOR A LIQUIDITY SWEEP! 📉
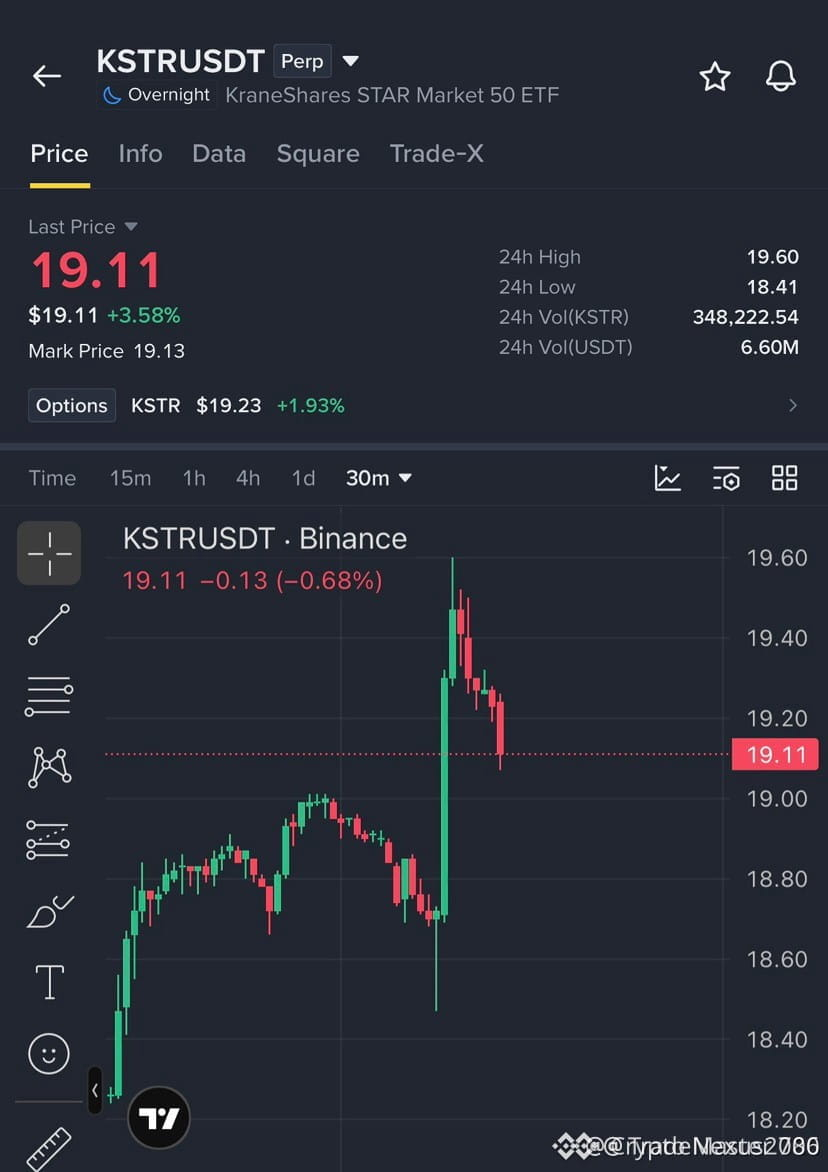
Entry: 19.10 - 19.25 ⚡
Target: 19.00 / 18.80 / 18.60 🚀
Stop Loss: 19.65 ⚠️
Sellers stepped in with heavy institutional volume right at the 19.60 block, creating a clean rejection fractal. 📊 Order flow shows distribution building up as momentum shifts in favor of the bears. ⚡
If price slips under 19.10, expect a rapid descent toward lower liquidity pools as trapped longs face forced liquidation. 🌊 Keep a close eye on how volume reacts at each target level. 🔍
💬 Are you positioning for this downside continuation or waiting for a reclaim above resistance? 👇
⚠️ Not financial advice. Always manage your risk. 🛡️
🏷️ #KSTR #ShortSetup #Bearish #OrderFlow #Crypto
🦈 📉
🔴 $KSTR REJECTS AT RESISTANCE AS SMART MONEY PREPARES FOR A LIQUIDITY SWEEP! 📉
Entry: 19.10 - 19.25 ⚡
Target: 19.00 / 18.80 / 18.60 🚀
Stop Loss: 19.65 ⚠️
Sellers stepped in with heavy institutional volume right at the 19.60 block, creating a clean rejection fractal. 📊 Order flow shows distribution building up as momentum shifts in favor of the bears. ⚡
If price slips under 19.10, expect a rapid descent toward lower liquidity pools as trapped longs face forced liquidation. 🌊 Keep a close eye on how volume reacts at each target level. 🔍
💬 Are you positioning for this downside continuation or waiting for a reclaim above resistance? 👇
⚠️ Not financial advice. Always manage your risk. 🛡️
🏷️ #KSTR #ShortSetup #Bearish #OrderFlow #Crypto
🦈 📉
Entry: 19.10 - 19.25 ⚡
Target: 19.00 / 18.80 / 18.60 🚀
Stop Loss: 19.65 ⚠️
Sellers stepped in with heavy institutional volume right at the 19.60 block, creating a clean rejection fractal. 📊 Order flow shows distribution building up as momentum shifts in favor of the bears. ⚡
If price slips under 19.10, expect a rapid descent toward lower liquidity pools as trapped longs face forced liquidation. 🌊 Keep a close eye on how volume reacts at each target level. 🔍
💬 Are you positioning for this downside continuation or waiting for a reclaim above resistance? 👇
⚠️ Not financial advice. Always manage your risk. 🛡️
🏷️ #KSTR #ShortSetup #Bearish #OrderFlow #Crypto
🦈 📉
12

🔴 $KSTR FACES A BRUTAL REJECTION AS SELLERS SQUEEZE THE ORDER BOOK 📉
Entry: 19.10 - 19.25 ⚡
Target: 19.00 / 18.80 / 18.60 🎯
Stop Loss: 19.65 ⚠️
Overhead resistance at 19.60 acted like an iron ceiling, shutting down buyer enthusiasm with heavy distribution. 📊 Order flow shows aggressive selling pressure stepping in right as bids thin out below the key pivot. ⚡
If momentum confirms a breakdown beneath 19.10, expect a fast slide toward lower liquidity pockets as trapped longs scramble to exit. 📉 Are you positioning for this downside continuation or waiting for a deeper flush? 🤔
⚠️ Not financial advice. Always manage your risk. 🛡️
🏷️ #KSTR #ShortSetup #Bearish #Trading #Crypto
📉 🩸
🔴 $KSTR FACES A BRUTAL REJECTION AS SELLERS SQUEEZE THE ORDER BOOK 📉
Entry: 19.10 - 19.25 ⚡
Target: 19.00 / 18.80 / 18.60 🎯
Stop Loss: 19.65 ⚠️
Overhead resistance at 19.60 acted like an iron ceiling, shutting down buyer enthusiasm with heavy distribution. 📊 Order flow shows aggressive selling pressure stepping in right as bids thin out below the key pivot. ⚡
If momentum confirms a breakdown beneath 19.10, expect a fast slide toward lower liquidity pockets as trapped longs scramble to exit. 📉 Are you positioning for this downside continuation or waiting for a deeper flush? 🤔
⚠️ Not financial advice. Always manage your risk. 🛡️
🏷️ #KSTR #ShortSetup #Bearish #Trading #Crypto
📉 🩸
Entry: 19.10 - 19.25 ⚡
Target: 19.00 / 18.80 / 18.60 🎯
Stop Loss: 19.65 ⚠️
Overhead resistance at 19.60 acted like an iron ceiling, shutting down buyer enthusiasm with heavy distribution. 📊 Order flow shows aggressive selling pressure stepping in right as bids thin out below the key pivot. ⚡
If momentum confirms a breakdown beneath 19.10, expect a fast slide toward lower liquidity pockets as trapped longs scramble to exit. 📉 Are you positioning for this downside continuation or waiting for a deeper flush? 🤔
⚠️ Not financial advice. Always manage your risk. 🛡️
🏷️ #KSTR #ShortSetup #Bearish #Trading #Crypto
📉 🩸
3

·
--
Bearish
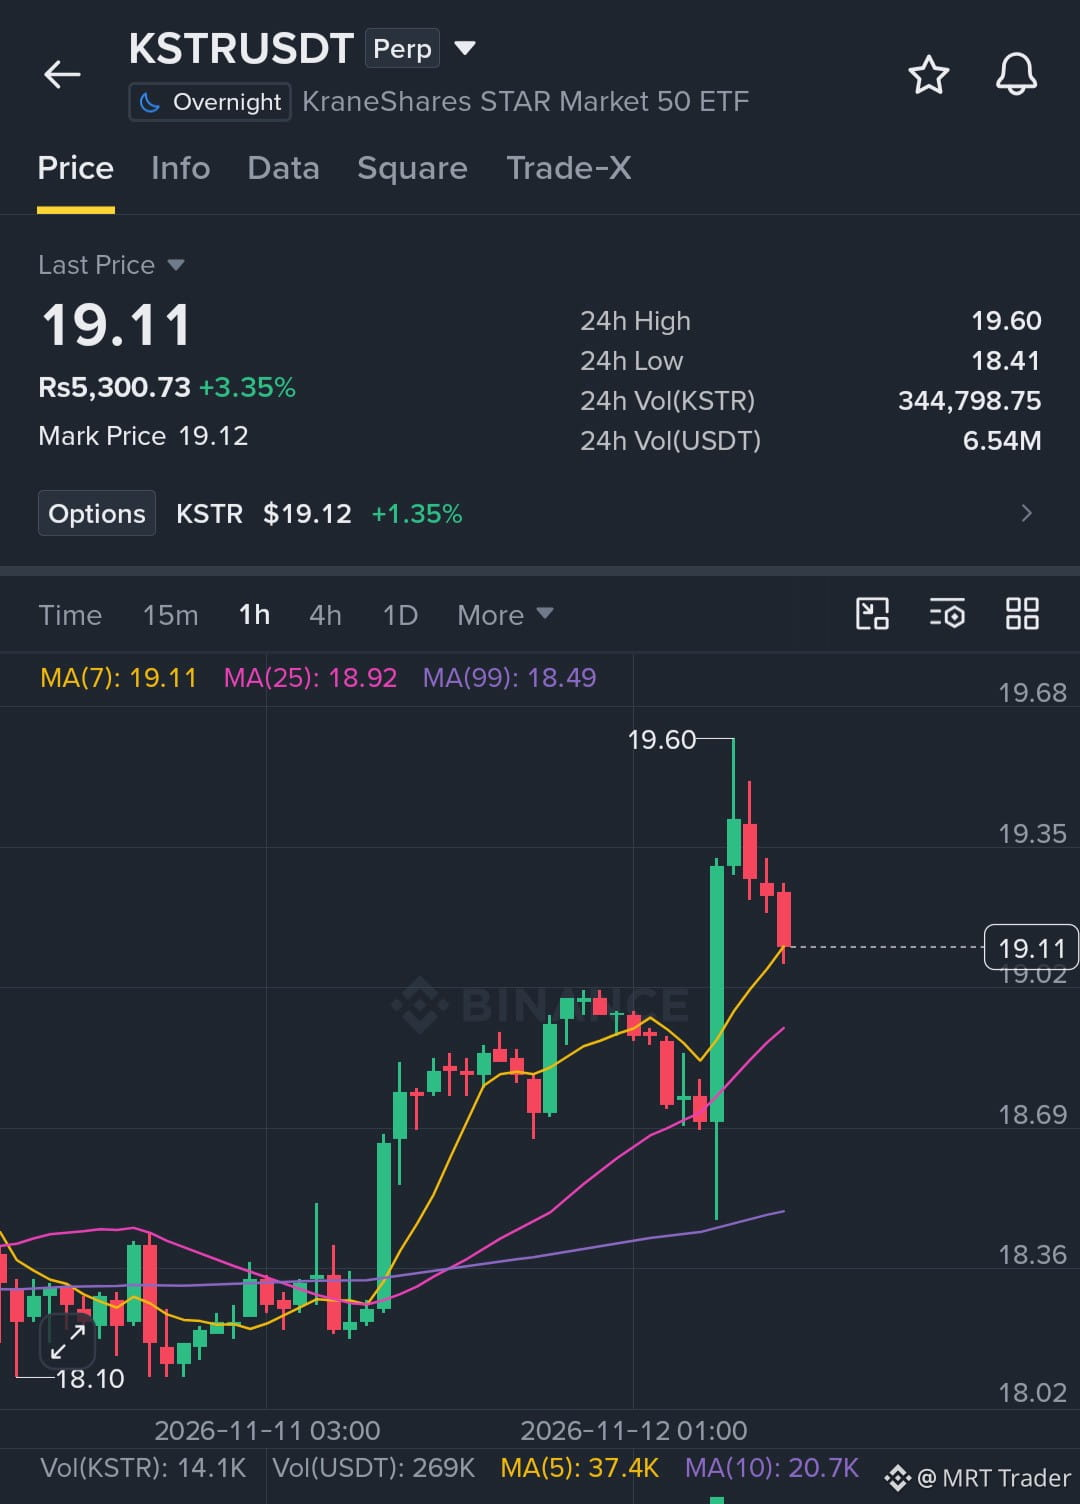
$KSTR is facing a sharp rejection near 19.60, and bears are gaining momentum. A break below 19.10 could trigger another drop. 🔴
Key Level:
🔴 Bearish below: 19.10
Trade Setup (Short):
🔴 Entry Zone: 19.11 – 19.26
🎯 Targets: 19.01 / 18.81 / 18.61
⛔ Stop Loss: 19.66
Price is showing bearish pressure. Look to enter on bounces and manage risk appropriately.
Click here to short now 👉 $KSTR
{future}(KSTRUSDT)
#KSTR #CoreWeaveJumps10%On168%RevenueGrowth
$KSTR is facing a sharp rejection near 19.60, and bears are gaining momentum. A break below 19.10 could trigger another drop. 🔴
Key Level:
🔴 Bearish below: 19.10
Trade Setup (Short):
🔴 Entry Zone: 19.11 – 19.26
🎯 Targets: 19.01 / 18.81 / 18.61
⛔ Stop Loss: 19.66
Price is showing bearish pressure. Look to enter on bounces and manage risk appropriately.
Click here to short now 👉 $KSTR
#KSTR #CoreWeaveJumps10%On168%RevenueGrowth
Key Level:
🔴 Bearish below: 19.10
Trade Setup (Short):
🔴 Entry Zone: 19.11 – 19.26
🎯 Targets: 19.01 / 18.81 / 18.61
⛔ Stop Loss: 19.66
Price is showing bearish pressure. Look to enter on bounces and manage risk appropriately.
Click here to short now 👉 $KSTR
#KSTR #CoreWeaveJumps10%On168%RevenueGrowth
4
34
·
--
Multi-timeframe confluence: 2 assets bullish on the 30-minute chart + 4-hour bullish trend confirmation🔥
════════════════════
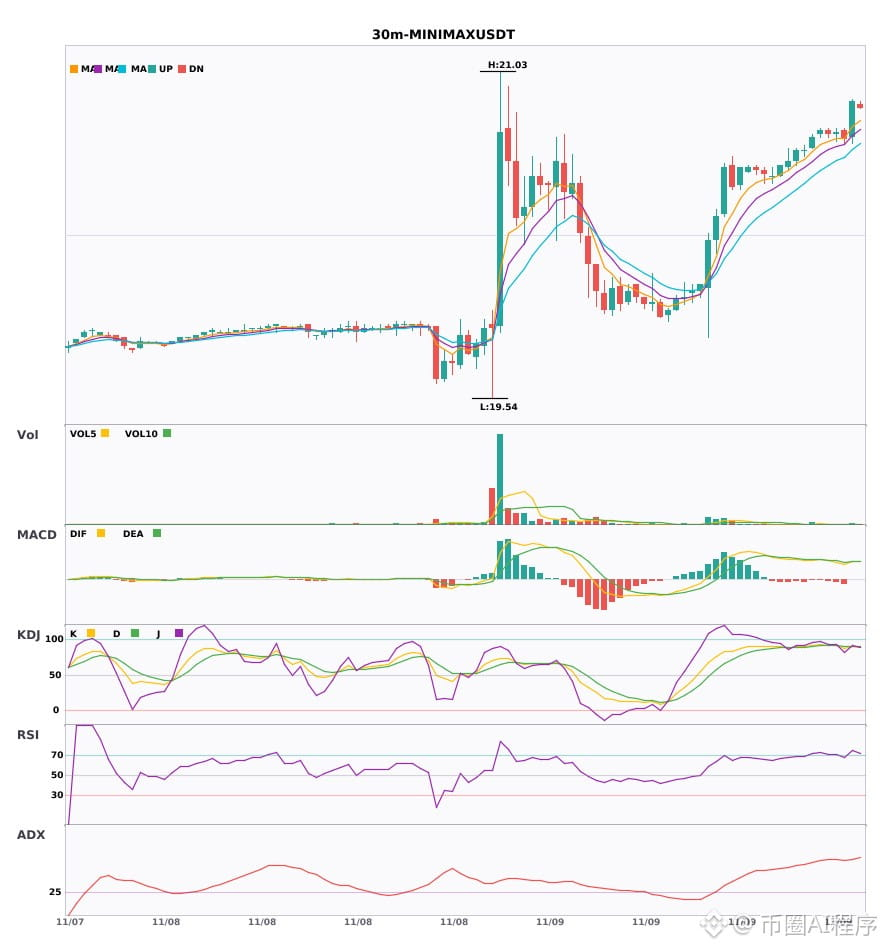
🔴 $MINIMAX 30-minute bullish signal
⚠️Technical analysis: 4-hour bullish confluence confirmed | 30-minute entry: MACD golden cross above zero, bullish momentum released | EMA5 > EMA8 > EMA13, bullish alignment | KDJ golden cross, short-term outlook bullish (K: 90.2, D: 89.9) | Volume increased (2.2x)
════════════════════
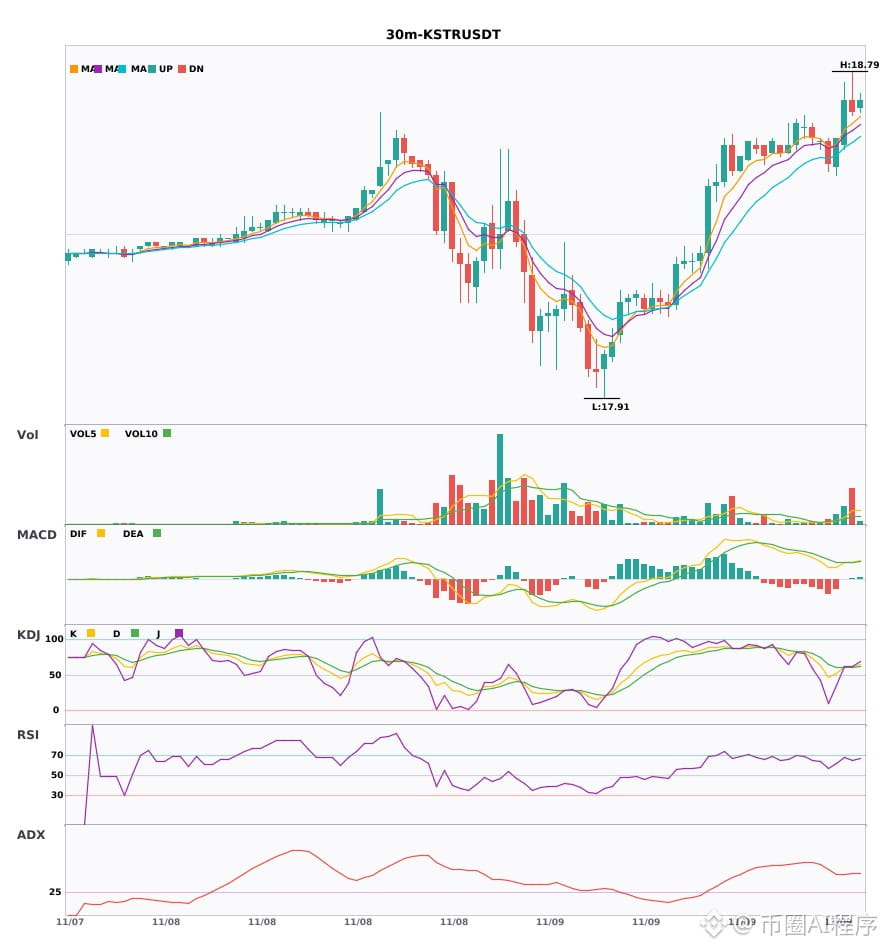
🔴 $KSTR 30-minute bullish signal
⚠️Technical analysis: 4-hour bullish confluence confirmed | 30-minute entry: MACD golden cross above zero, bullish momentum released | EMA5 > EMA8 > EMA13, bullish alignment | KDJ trading strongly, bulls in control (K: 61.2, D: 61.1) | Volume surged (4.3x)
════════════════════
🔔 Follow for first-hand market alerts 🔔
#多周期共振 #MINIMAX #KSTR
📌 When trading, pay attention to whether the candlestick patterns align
Multi-timeframe confluence: 2 assets bullish on the 30-minute chart + 4-hour bullish trend confirmation🔥
════════════════════
🔴 $MINIMAX 30-minute bullish signal
⚠️Technical analysis: 4-hour bullish confluence confirmed | 30-minute entry: MACD golden cross above zero, bullish momentum released | EMA5 > EMA8 > EMA13, bullish alignment | KDJ golden cross, short-term outlook bullish (K: 90.2, D: 89.9) | Volume increased (2.2x)
════════════════════
🔴 $KSTR 30-minute bullish signal
⚠️Technical analysis: 4-hour bullish confluence confirmed | 30-minute entry: MACD golden cross above zero, bullish momentum released | EMA5 > EMA8 > EMA13, bullish alignment | KDJ trading strongly, bulls in control (K: 61.2, D: 61.1) | Volume surged (4.3x)
════════════════════
🔔 Follow for first-hand market alerts 🔔
#多周期共振 #MINIMAX #KSTR
📌 When trading, pay attention to whether the candlestick patterns align
════════════════════
🔴 $MINIMAX 30-minute bullish signal
⚠️Technical analysis: 4-hour bullish confluence confirmed | 30-minute entry: MACD golden cross above zero, bullish momentum released | EMA5 > EMA8 > EMA13, bullish alignment | KDJ golden cross, short-term outlook bullish (K: 90.2, D: 89.9) | Volume increased (2.2x)
════════════════════
🔴 $KSTR 30-minute bullish signal
⚠️Technical analysis: 4-hour bullish confluence confirmed | 30-minute entry: MACD golden cross above zero, bullish momentum released | EMA5 > EMA8 > EMA13, bullish alignment | KDJ trading strongly, bulls in control (K: 61.2, D: 61.1) | Volume surged (4.3x)
════════════════════
🔔 Follow for first-hand market alerts 🔔
#多周期共振 #MINIMAX #KSTR
📌 When trading, pay attention to whether the candlestick patterns align
71
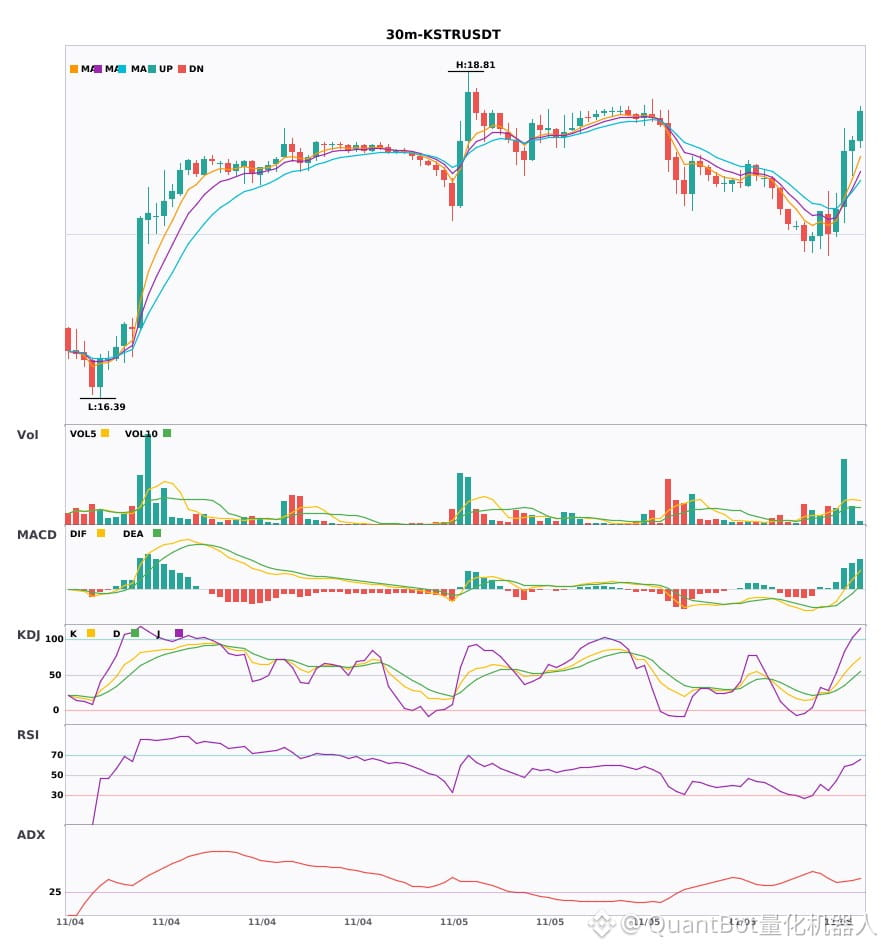
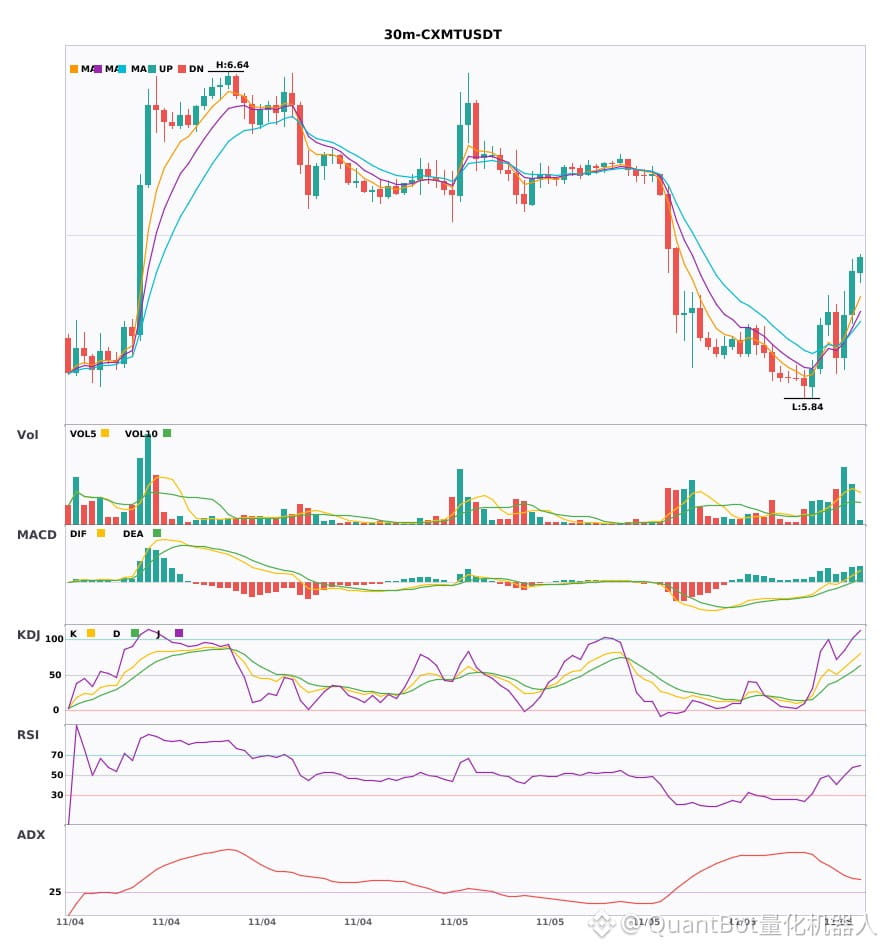
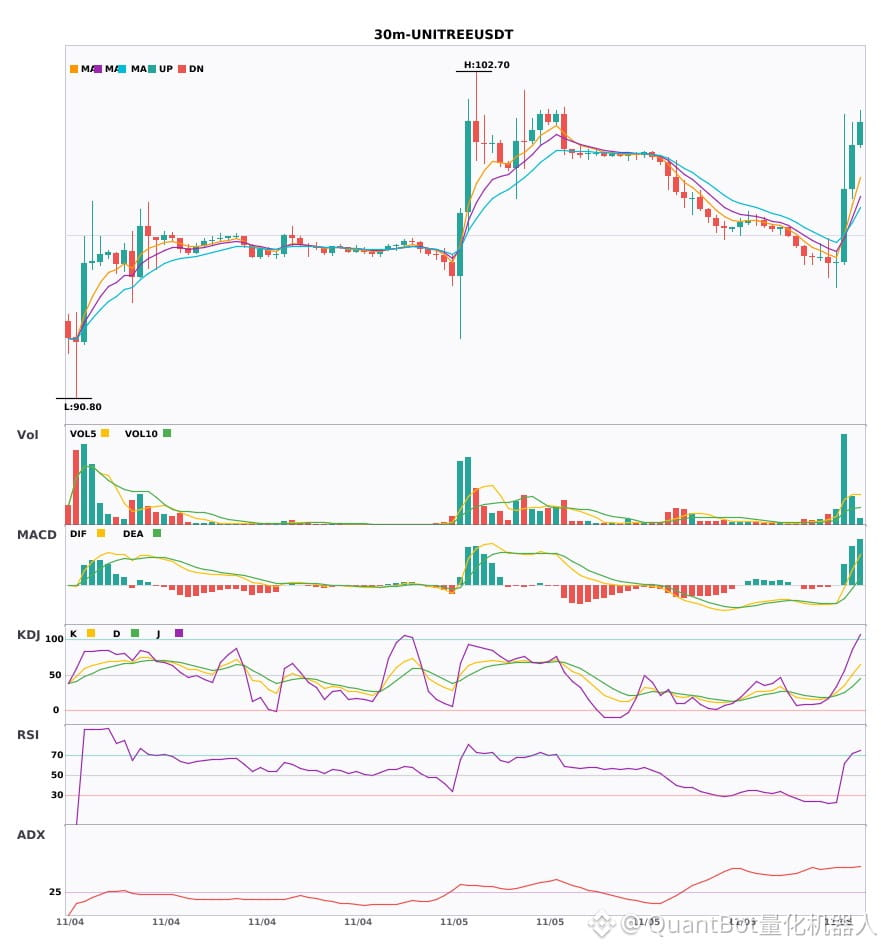
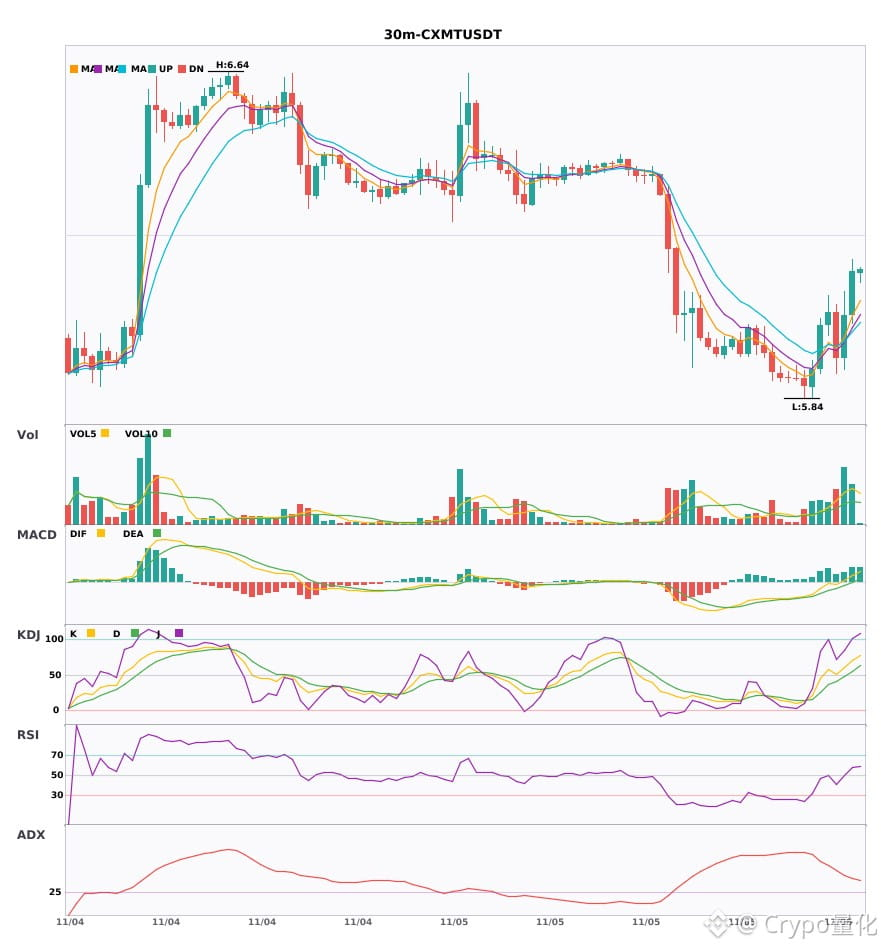
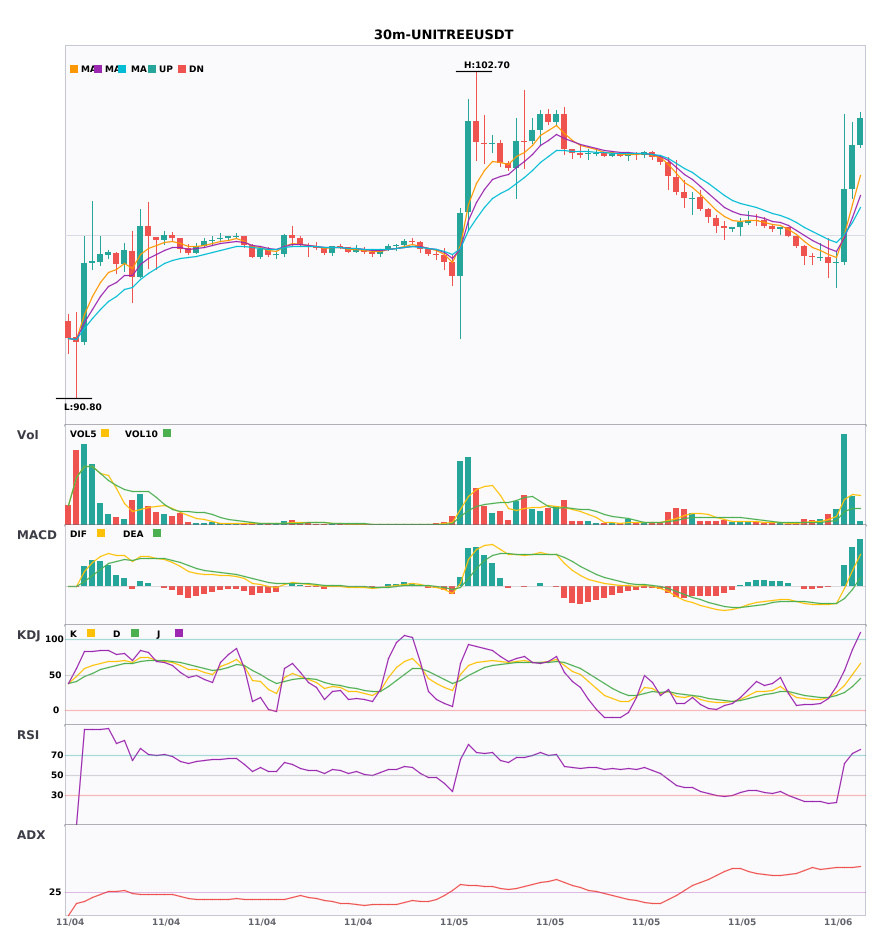
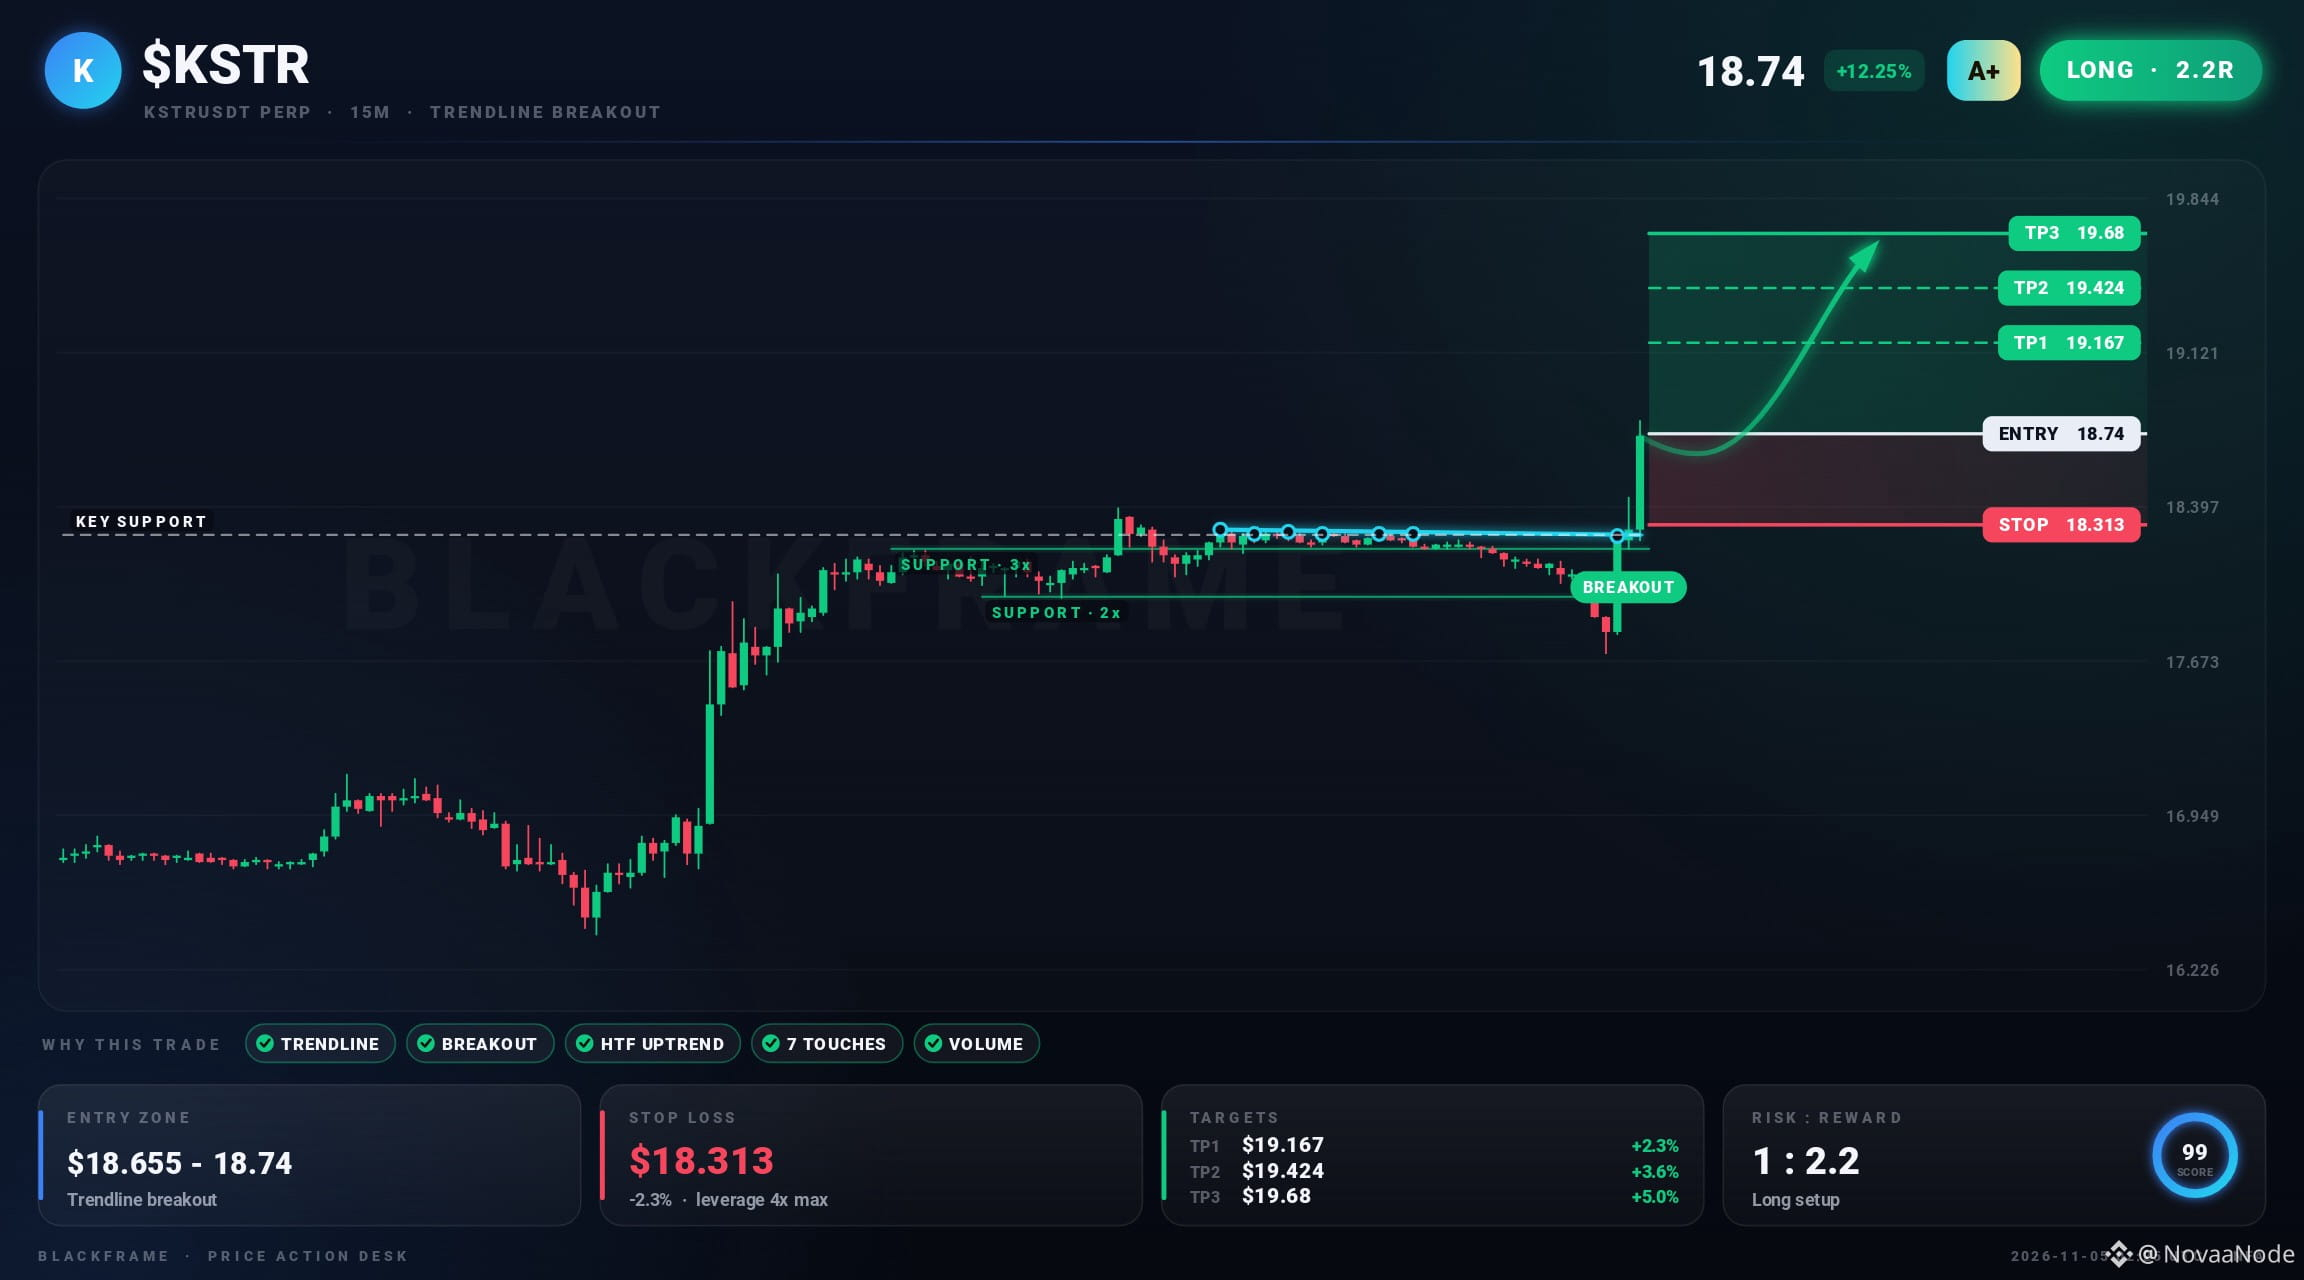
$KSTR / $CXMT / $UNITREE 30-minute technicals are strengthening in sync—which has the greatest breakout potential?
📈 $KSTR | 30-minute bullish signal
━━━━━━━━━━━━━━━━━━
Technical analysis: ADX (41): clear trending market | MACD is bullish; trend is strong and momentum is increasing | EMA5 > EMA8 > EMA13: bullish alignment | Volume surge (4.0x)
Price change: 0.4400%
📈 $CXMT | 30-minute bullish signal
━━━━━━━━━━━━━━━━━━
Technical analysis: ADX (40): clear trending market | MACD is bullish; trend is strong and momentum is increasing | EMA5 > EMA8 > EMA13: bullish alignment | KDJ is strong, with bulls in control (K: 70.3, D: 55.1) | Volume surge (2.7x)
Price change: 1.7900%
📈 $UNITREE | 30-minute bullish signal
━━━━━━━━━━━━━━━━━━
Technical analysis: ADX (55): very strong trend (beware of a pullback from overbought levels) | MACD DIF breaks above the zero line; trend turns bullish | EMA5 > EMA8 > EMA13: bullish alignment | Volume surge (6.5x)
Price change: 1.6300%
━━━━━━━━━━━━━━━━━━
#技术分析 #KSTR #CXMT #UNITREE
📌 The above is for reference only and does not constitute investment advice
$KSTR / $CXMT / $UNITREE 30-minute technicals are strengthening in sync—which has the greatest breakout potential?
📈 $KSTR | 30-minute bullish signal
━━━━━━━━━━━━━━━━━━
Technical analysis: ADX (41): clear trending market | MACD is bullish; trend is strong and momentum is increasing | EMA5 > EMA8 > EMA13: bullish alignment | Volume surge (4.0x)
Price change: 0.4400%
📈 $CXMT | 30-minute bullish signal
━━━━━━━━━━━━━━━━━━
Technical analysis: ADX (40): clear trending market | MACD is bullish; trend is strong and momentum is increasing | EMA5 > EMA8 > EMA13: bullish alignment | KDJ is strong, with bulls in control (K: 70.3, D: 55.1) | Volume surge (2.7x)
Price change: 1.7900%
📈 $UNITREE | 30-minute bullish signal
━━━━━━━━━━━━━━━━━━
Technical analysis: ADX (55): very strong trend (beware of a pullback from overbought levels) | MACD DIF breaks above the zero line; trend turns bullish | EMA5 > EMA8 > EMA13: bullish alignment | Volume surge (6.5x)
Price change: 1.6300%
━━━━━━━━━━━━━━━━━━
#技术分析 #KSTR #CXMT #UNITREE
📌 The above is for reference only and does not constitute investment advice
📈 $KSTR | 30-minute bullish signal
━━━━━━━━━━━━━━━━━━
Technical analysis: ADX (41): clear trending market | MACD is bullish; trend is strong and momentum is increasing | EMA5 > EMA8 > EMA13: bullish alignment | Volume surge (4.0x)
Price change: 0.4400%
📈 $CXMT | 30-minute bullish signal
━━━━━━━━━━━━━━━━━━
Technical analysis: ADX (40): clear trending market | MACD is bullish; trend is strong and momentum is increasing | EMA5 > EMA8 > EMA13: bullish alignment | KDJ is strong, with bulls in control (K: 70.3, D: 55.1) | Volume surge (2.7x)
Price change: 1.7900%
📈 $UNITREE | 30-minute bullish signal
━━━━━━━━━━━━━━━━━━
Technical analysis: ADX (55): very strong trend (beware of a pullback from overbought levels) | MACD DIF breaks above the zero line; trend turns bullish | EMA5 > EMA8 > EMA13: bullish alignment | Volume surge (6.5x)
Price change: 1.6300%
━━━━━━━━━━━━━━━━━━
#技术分析 #KSTR #CXMT #UNITREE
📌 The above is for reference only and does not constitute investment advice
43
·
--
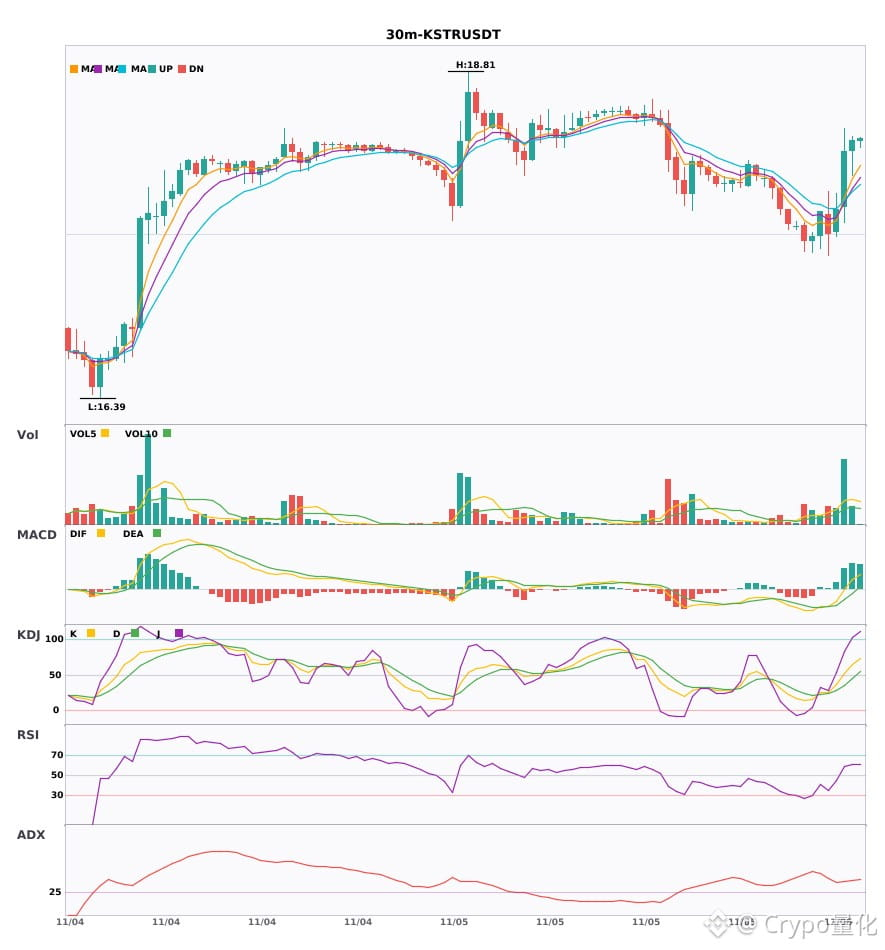
$KSTR / $CXMT / $UNITREE 30-minute confluence turns bullish, with bullish signals appearing simultaneously 🔥
════════════════════
🔴 $KSTR 30-minute bullish signal
⚠️Technical analysis: ADX(41): clear trending market | MACD is bullish, the trend is strong, and momentum is strengthening | EMA5 > EMA8 > EMA13: bullish alignment | Volume surge (4.0x)
════════════════════
🔴 $CXMT 30-minute bullish signal
⚠️Technical analysis: ADX(40): clear trending market | MACD is bullish, the trend is strong, and momentum is strengthening | EMA5 > EMA8 > EMA13: bullish alignment | KDJ is strong, with bulls in control (K: 70.3, D: 55.1) | Volume surge (2.7x)
════════════════════
🔴 $UNITREE 30-minute bullish signal
⚠️Technical analysis: ADX(55): exceptionally strong trend (beware of an overheated pullback) | MACD DIF breaks above the zero line; trend turns bullish | EMA5 > EMA8 > EMA13: bullish alignment | Volume surge (6.5x)
════════════════════
🔔 Follow for first-hand market alerts 🔔
#技术分析 #KSTR #CXMT #UNITREE
📌 When trading, pay attention to whether the candlestick pattern meets the criteria
$KSTR / $CXMT / $UNITREE 30-minute confluence turns bullish, with bullish signals appearing simultaneously 🔥
════════════════════
🔴 $KSTR 30-minute bullish signal
⚠️Technical analysis: ADX(41): clear trending market | MACD is bullish, the trend is strong, and momentum is strengthening | EMA5 > EMA8 > EMA13: bullish alignment | Volume surge (4.0x)
════════════════════
🔴 $CXMT 30-minute bullish signal
⚠️Technical analysis: ADX(40): clear trending market | MACD is bullish, the trend is strong, and momentum is strengthening | EMA5 > EMA8 > EMA13: bullish alignment | KDJ is strong, with bulls in control (K: 70.3, D: 55.1) | Volume surge (2.7x)
════════════════════
🔴 $UNITREE 30-minute bullish signal
⚠️Technical analysis: ADX(55): exceptionally strong trend (beware of an overheated pullback) | MACD DIF breaks above the zero line; trend turns bullish | EMA5 > EMA8 > EMA13: bullish alignment | Volume surge (6.5x)
════════════════════
🔔 Follow for first-hand market alerts 🔔
#技术分析 #KSTR #CXMT #UNITREE
📌 When trading, pay attention to whether the candlestick pattern meets the criteria
════════════════════
🔴 $KSTR 30-minute bullish signal
⚠️Technical analysis: ADX(41): clear trending market | MACD is bullish, the trend is strong, and momentum is strengthening | EMA5 > EMA8 > EMA13: bullish alignment | Volume surge (4.0x)
════════════════════
🔴 $CXMT 30-minute bullish signal
⚠️Technical analysis: ADX(40): clear trending market | MACD is bullish, the trend is strong, and momentum is strengthening | EMA5 > EMA8 > EMA13: bullish alignment | KDJ is strong, with bulls in control (K: 70.3, D: 55.1) | Volume surge (2.7x)
════════════════════
🔴 $UNITREE 30-minute bullish signal
⚠️Technical analysis: ADX(55): exceptionally strong trend (beware of an overheated pullback) | MACD DIF breaks above the zero line; trend turns bullish | EMA5 > EMA8 > EMA13: bullish alignment | Volume surge (6.5x)
════════════════════
🔔 Follow for first-hand market alerts 🔔
#技术分析 #KSTR #CXMT #UNITREE
📌 When trading, pay attention to whether the candlestick pattern meets the criteria
23


·
--
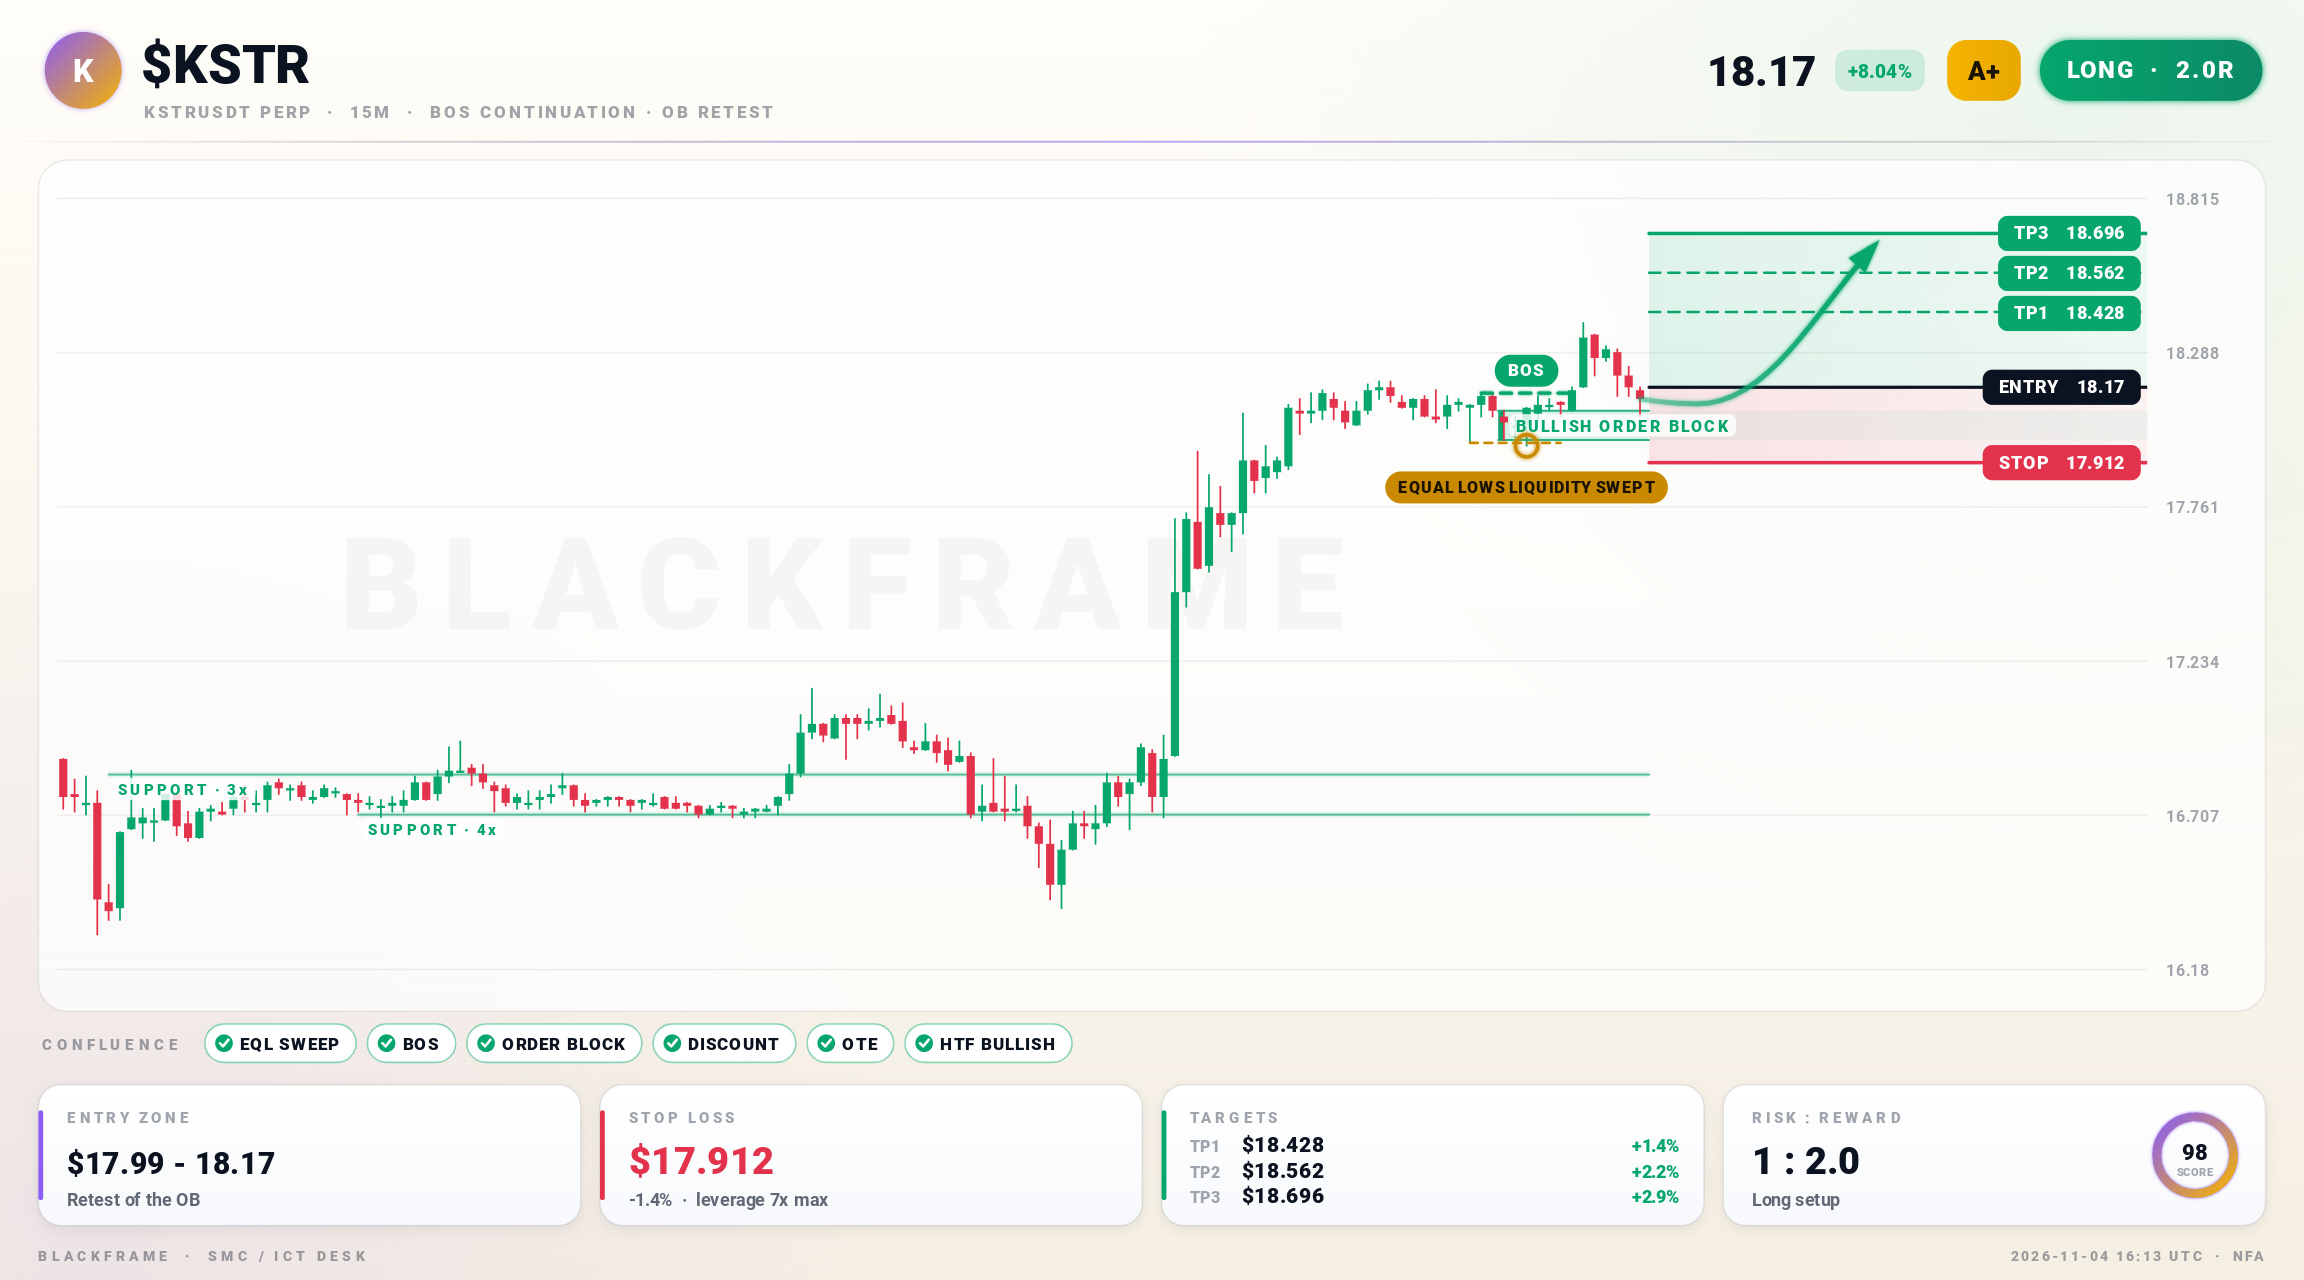
📈 $KSTR broke structure higher, continuation long
LONG · 15M
Entry: $18.09 - $18.17
TP1: $18.428
TP2: $18.562
TP3: $18.696
SL: $17.912
Sell-side liquidity below the equal lows was swept and price closed back inside. Structure continues higher with a fresh BOS on the 15M. Entry is the first retest of the fresh bullish order block in discount, targeting buy-side liquidity above.
#KSTR #PriceAction · NFA
📈 $KSTR broke structure higher, continuation long
LONG · 15M
Entry: $18.09 - $18.17
TP1: $18.428
TP2: $18.562
TP3: $18.696
SL: $17.912
Sell-side liquidity below the equal lows was swept and price closed back inside. Structure continues higher with a fresh BOS on the 15M. Entry is the first retest of the fresh bullish order block in discount, targeting buy-side liquidity above.
#KSTR #PriceAction · NFA
LONG · 15M
Entry: $18.09 - $18.17
TP1: $18.428
TP2: $18.562
TP3: $18.696
SL: $17.912
Sell-side liquidity below the equal lows was swept and price closed back inside. Structure continues higher with a fresh BOS on the 15M. Entry is the first retest of the fresh bullish order block in discount, targeting buy-side liquidity above.
#KSTR #PriceAction · NFA
336
·
--
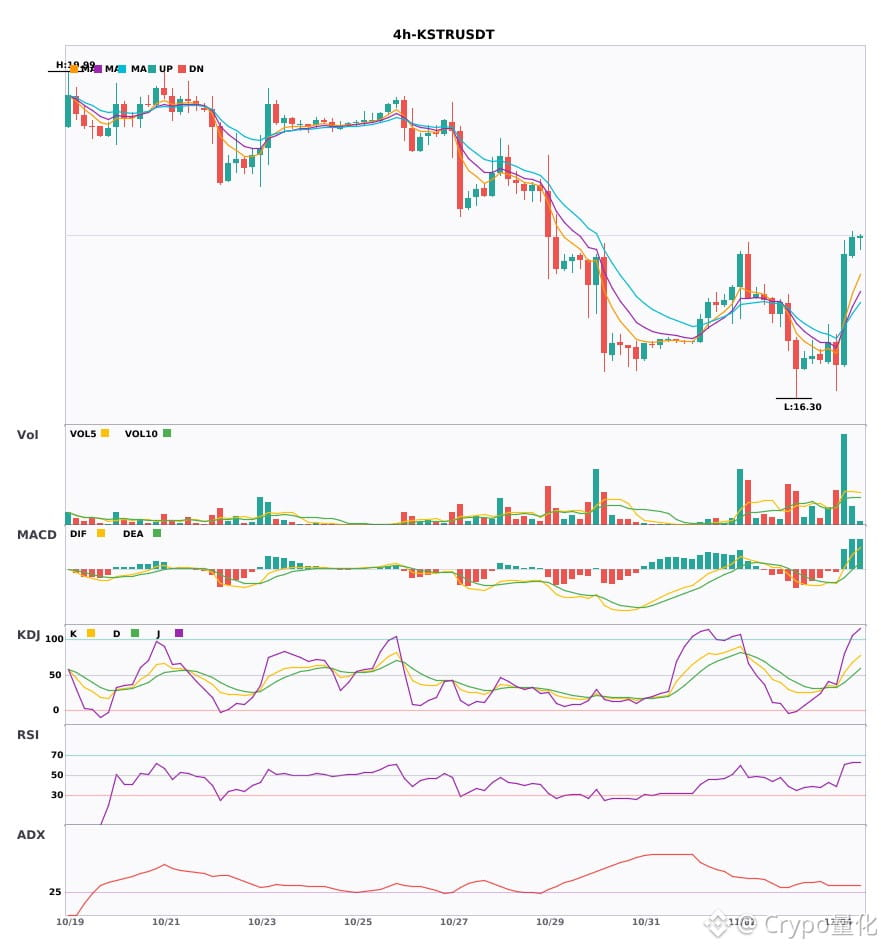
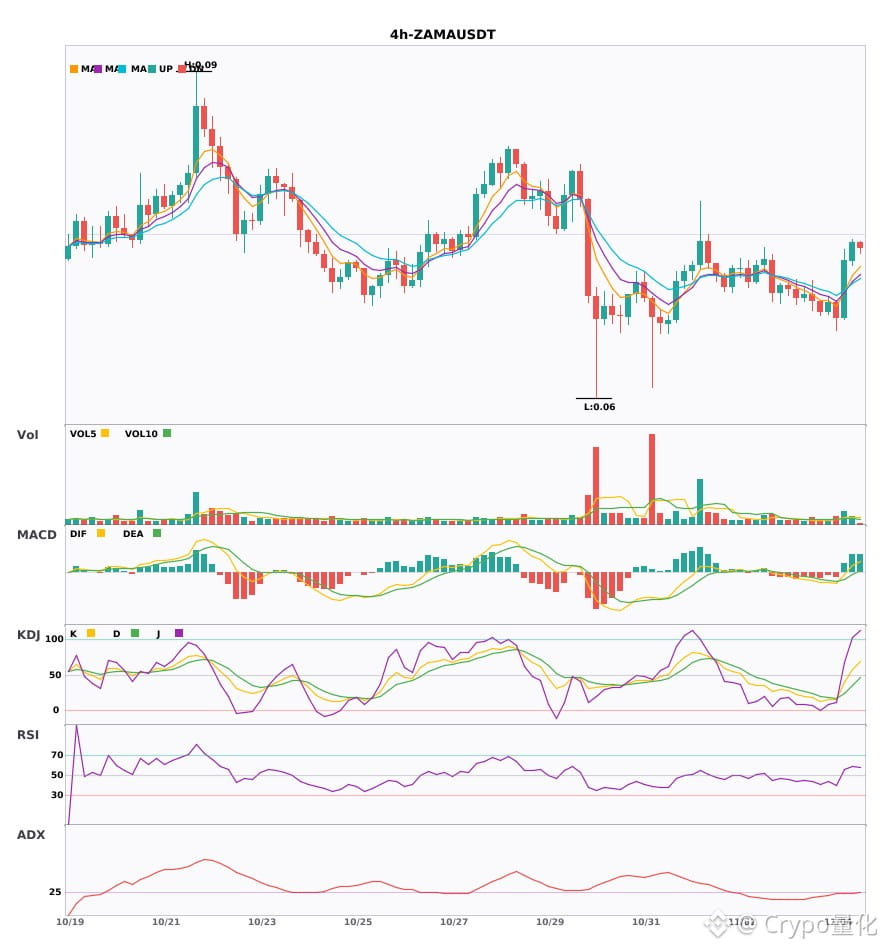
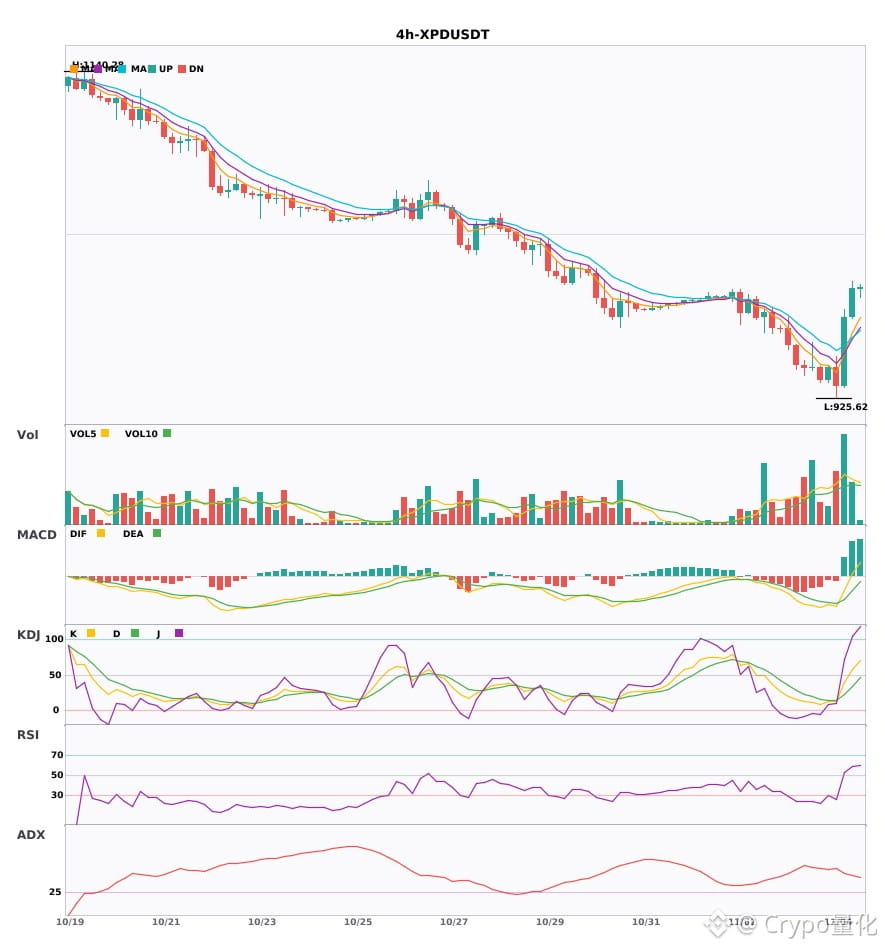
$KSTR / $ZAMA / $XPD 4-hour confluence turns bullish; bullish signals appear simultaneously🔥
════════════════════
🔴 $KSTR 4-hour bullish signal
⚠️Technical analysis: ADX(34) indicates a clear trending market | MACD golden cross above zero, bullish momentum released | EMA5 crosses above EMA8, short-term outlook turns bullish | Volume surge (3.5x)
════════════════════
🔴 $ZAMA 4-hour bullish signal
⚠️Technical analysis: ADX(28) trend is forming, potential entry | MACD DIF breaks above the zero line, trend turns bullish | EMA5 > EMA8 > EMA13, bullish alignment | Volume increases (2.1x)
════════════════════
🔴 $XPD 4-hour bullish signal
⚠️Technical analysis: ADX(45) indicates a clear trending market | MACD DIF breaks above the zero line, trend turns bullish | EMA5 crosses above EMA8, short-term outlook turns bullish | Volume increases (2.4x)
════════════════════
🔔 Follow for the latest market movements 🔔
#技术分析 #KSTR #ZAMA #XPD
📌 When trading, pay attention to whether the candlestick pattern confirms the signal
$KSTR / $ZAMA / $XPD 4-hour confluence turns bullish; bullish signals appear simultaneously🔥
════════════════════
🔴 $KSTR 4-hour bullish signal
⚠️Technical analysis: ADX(34) indicates a clear trending market | MACD golden cross above zero, bullish momentum released | EMA5 crosses above EMA8, short-term outlook turns bullish | Volume surge (3.5x)
════════════════════
🔴 $ZAMA 4-hour bullish signal
⚠️Technical analysis: ADX(28) trend is forming, potential entry | MACD DIF breaks above the zero line, trend turns bullish | EMA5 > EMA8 > EMA13, bullish alignment | Volume increases (2.1x)
════════════════════
🔴 $XPD 4-hour bullish signal
⚠️Technical analysis: ADX(45) indicates a clear trending market | MACD DIF breaks above the zero line, trend turns bullish | EMA5 crosses above EMA8, short-term outlook turns bullish | Volume increases (2.4x)
════════════════════
🔔 Follow for the latest market movements 🔔
#技术分析 #KSTR #ZAMA #XPD
📌 When trading, pay attention to whether the candlestick pattern confirms the signal
════════════════════
🔴 $KSTR 4-hour bullish signal
⚠️Technical analysis: ADX(34) indicates a clear trending market | MACD golden cross above zero, bullish momentum released | EMA5 crosses above EMA8, short-term outlook turns bullish | Volume surge (3.5x)
════════════════════
🔴 $ZAMA 4-hour bullish signal
⚠️Technical analysis: ADX(28) trend is forming, potential entry | MACD DIF breaks above the zero line, trend turns bullish | EMA5 > EMA8 > EMA13, bullish alignment | Volume increases (2.1x)
════════════════════
🔴 $XPD 4-hour bullish signal
⚠️Technical analysis: ADX(45) indicates a clear trending market | MACD DIF breaks above the zero line, trend turns bullish | EMA5 crosses above EMA8, short-term outlook turns bullish | Volume increases (2.4x)
════════════════════
🔔 Follow for the latest market movements 🔔
#技术分析 #KSTR #ZAMA #XPD
📌 When trading, pay attention to whether the candlestick pattern confirms the signal
22
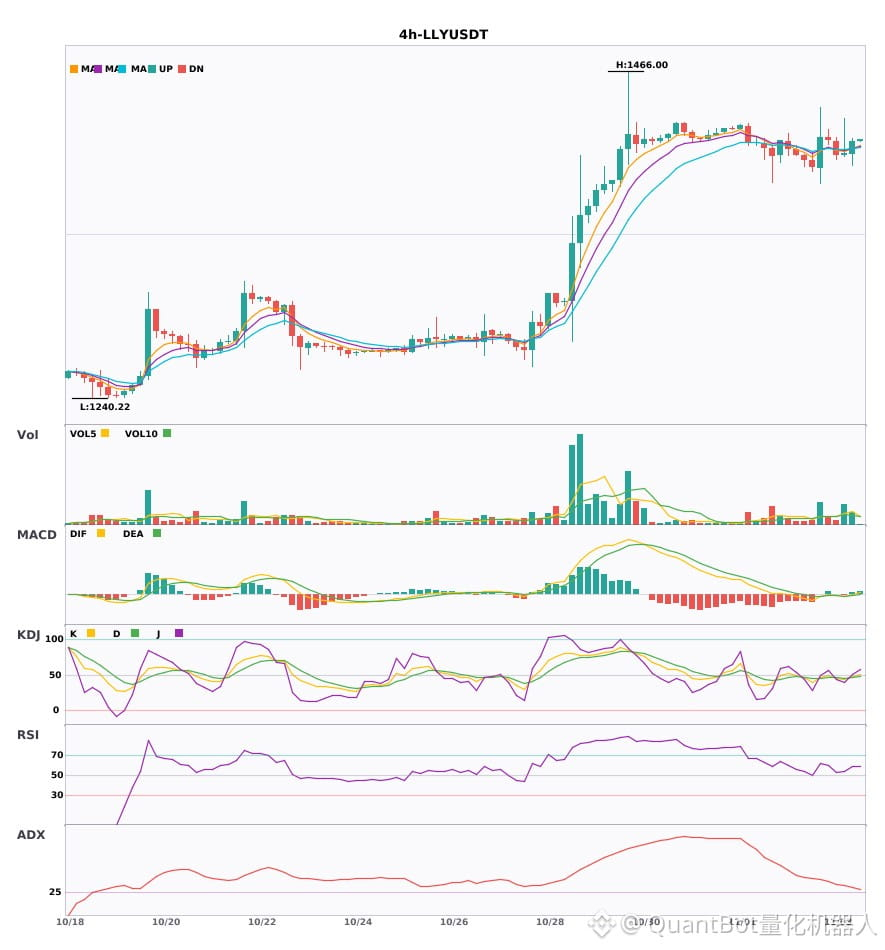
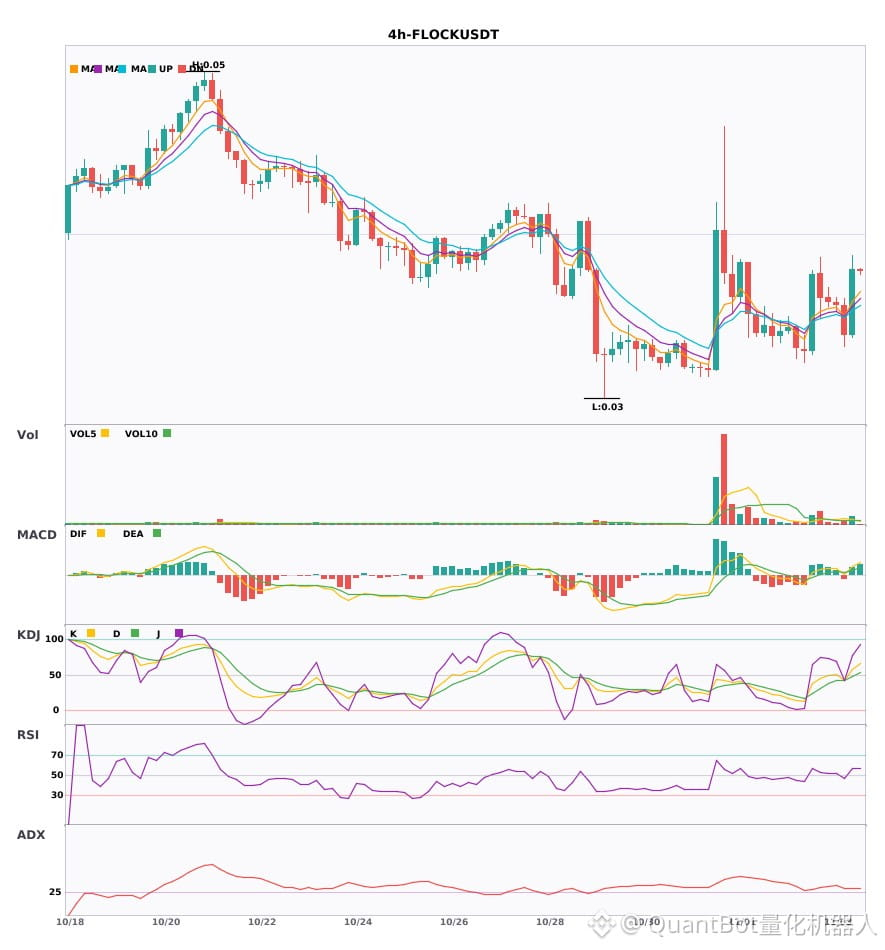
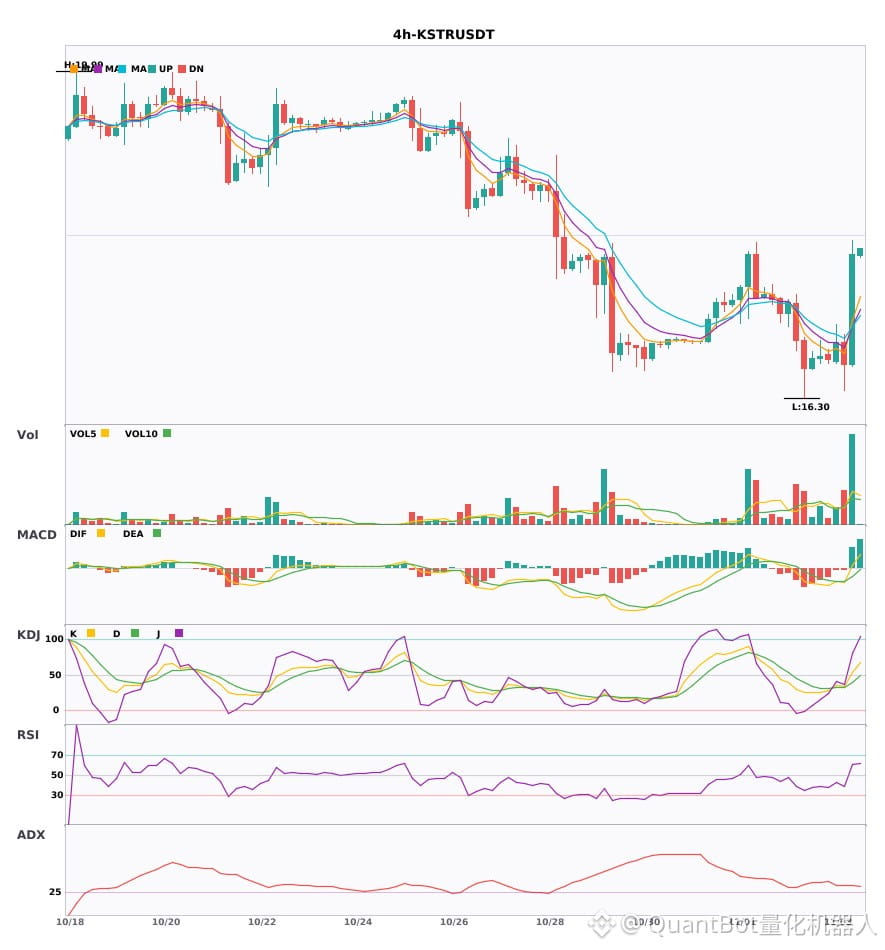
$LLY / $FLOCK / $KSTR 4-hour technicals are strengthening simultaneously—which has greater breakout potential?
📈 $LLY | 4-hour bullish signal
━━━━━━━━━━━━━━━━━━
Technical analysis: ADX(30) Trend is forming; potential entry | MACD bullish crossover above zero, bullish momentum emerging | EMA5 crosses above EMA8, short-term outlook turns bullish | KDJ bullish crossover, bullish short-term outlook (K is 47.3, D is 45.9) | Volume increases (2.0x)
Price change: 0.6000%
📈 $FLOCK | 4-hour bullish signal
━━━━━━━━━━━━━━━━━━
Technical analysis: ADX(28) Trend is forming; potential entry | MACD bullish crossover above zero, bullish momentum emerging | EMA5 crosses above EMA8, short-term outlook turns bullish | Volume increases (1.8x)
Price change: 7.7700%
📈 $KSTR | 4-hour bullish signal
━━━━━━━━━━━━━━━━━━
Technical analysis: ADX(34) Clear trending market | MACD bullish crossover above zero, bullish momentum emerging | EMA5 crosses above EMA8, short-term outlook turns bullish | Volume surges (3.5x)
Price change: 7.4300%
━━━━━━━━━━━━━━━━━━
#技术分析 #LLY #FLOCK #KSTR
📌 The above content is for reference only and does not constitute investment advice
$LLY / $FLOCK / $KSTR 4-hour technicals are strengthening simultaneously—which has greater breakout potential?
📈 $LLY | 4-hour bullish signal
━━━━━━━━━━━━━━━━━━
Technical analysis: ADX(30) Trend is forming; potential entry | MACD bullish crossover above zero, bullish momentum emerging | EMA5 crosses above EMA8, short-term outlook turns bullish | KDJ bullish crossover, bullish short-term outlook (K is 47.3, D is 45.9) | Volume increases (2.0x)
Price change: 0.6000%
📈 $FLOCK | 4-hour bullish signal
━━━━━━━━━━━━━━━━━━
Technical analysis: ADX(28) Trend is forming; potential entry | MACD bullish crossover above zero, bullish momentum emerging | EMA5 crosses above EMA8, short-term outlook turns bullish | Volume increases (1.8x)
Price change: 7.7700%
📈 $KSTR | 4-hour bullish signal
━━━━━━━━━━━━━━━━━━
Technical analysis: ADX(34) Clear trending market | MACD bullish crossover above zero, bullish momentum emerging | EMA5 crosses above EMA8, short-term outlook turns bullish | Volume surges (3.5x)
Price change: 7.4300%
━━━━━━━━━━━━━━━━━━
#技术分析 #LLY #FLOCK #KSTR
📌 The above content is for reference only and does not constitute investment advice
📈 $LLY | 4-hour bullish signal
━━━━━━━━━━━━━━━━━━
Technical analysis: ADX(30) Trend is forming; potential entry | MACD bullish crossover above zero, bullish momentum emerging | EMA5 crosses above EMA8, short-term outlook turns bullish | KDJ bullish crossover, bullish short-term outlook (K is 47.3, D is 45.9) | Volume increases (2.0x)
Price change: 0.6000%
📈 $FLOCK | 4-hour bullish signal
━━━━━━━━━━━━━━━━━━
Technical analysis: ADX(28) Trend is forming; potential entry | MACD bullish crossover above zero, bullish momentum emerging | EMA5 crosses above EMA8, short-term outlook turns bullish | Volume increases (1.8x)
Price change: 7.7700%
📈 $KSTR | 4-hour bullish signal
━━━━━━━━━━━━━━━━━━
Technical analysis: ADX(34) Clear trending market | MACD bullish crossover above zero, bullish momentum emerging | EMA5 crosses above EMA8, short-term outlook turns bullish | Volume surges (3.5x)
Price change: 7.4300%
━━━━━━━━━━━━━━━━━━
#技术分析 #LLY #FLOCK #KSTR
📌 The above content is for reference only and does not constitute investment advice
13
·
--
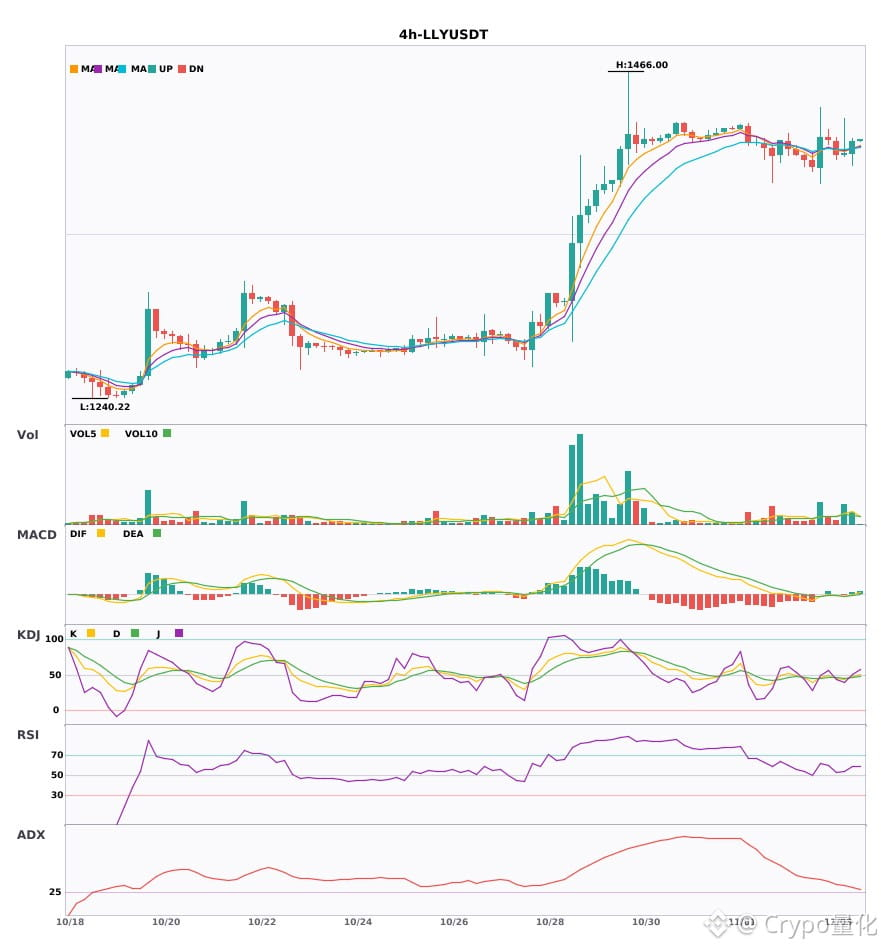
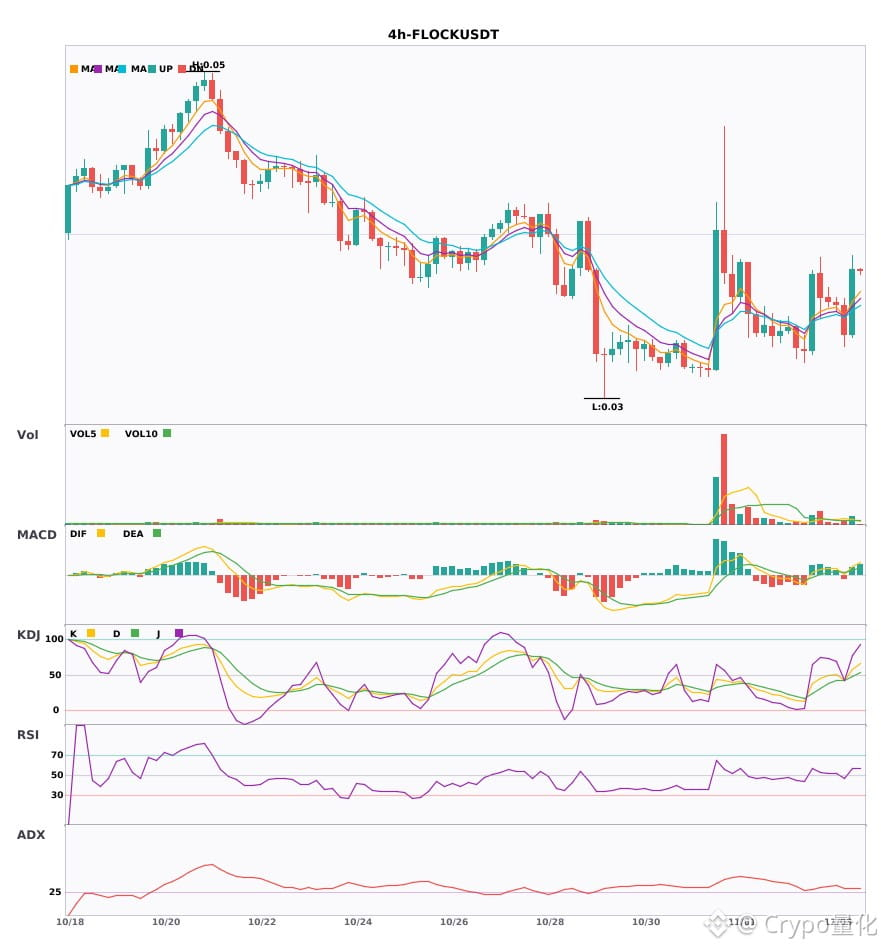
Three 4-hour bullish signals appearing simultaneously: $LLY / $FLOCK / $KSTR🔥
════════════════════
🔴 $LLY 4-hour bullish signal
⚠️Technical analysis: ADX(30): Trend is forming; entry possible | MACD bullish crossover above zero, bullish momentum is building | EMA5 crossed above EMA8, short-term trend turns bullish | KDJ bullish crossover, short-term outlook bullish (K is 47.3, D is 45.9) | Volume increased (2.0x)
════════════════════
🔴 $FLOCK 4-hour bullish signal
⚠️Technical analysis: ADX(28): Trend is forming; entry possible | MACD bullish crossover above zero, bullish momentum is building | EMA5 crossed above EMA8, short-term trend turns bullish | Volume increased (1.8x)
════════════════════
🔴 $KSTR 4-hour bullish signal
⚠️Technical analysis: ADX(34): Clear trending market | MACD bullish crossover above zero, bullish momentum is building | EMA5 crossed above EMA8, short-term trend turns bullish | Volume surged (3.5x)
════════════════════
🔔 Follow for first-hand market updates 🔔
#技术分析 #LLY #FLOCK #KSTR
📌 When trading, pay attention to whether the candlestick pattern confirms the signal
Three 4-hour bullish signals appearing simultaneously: $LLY / $FLOCK / $KSTR 🔥
════════════════════
🔴 $LLY 4-hour bullish signal
⚠️Technical analysis: ADX(30): Trend is forming; entry possible | MACD bullish crossover above zero, bullish momentum is building | EMA5 crossed above EMA8, short-term trend turns bullish | KDJ bullish crossover, short-term outlook bullish (K is 47.3, D is 45.9) | Volume increased (2.0x)
════════════════════
🔴 $FLOCK 4-hour bullish signal
⚠️Technical analysis: ADX(28): Trend is forming; entry possible | MACD bullish crossover above zero, bullish momentum is building | EMA5 crossed above EMA8, short-term trend turns bullish | Volume increased (1.8x)
════════════════════
🔴 $KSTR 4-hour bullish signal
⚠️Technical analysis: ADX(34): Clear trending market | MACD bullish crossover above zero, bullish momentum is building | EMA5 crossed above EMA8, short-term trend turns bullish | Volume surged (3.5x)
════════════════════
🔔 Follow for first-hand market updates 🔔
#技术分析 #LLY #FLOCK #KSTR
📌 When trading, pay attention to whether the candlestick pattern confirms the signal
════════════════════
🔴 $LLY 4-hour bullish signal
⚠️Technical analysis: ADX(30): Trend is forming; entry possible | MACD bullish crossover above zero, bullish momentum is building | EMA5 crossed above EMA8, short-term trend turns bullish | KDJ bullish crossover, short-term outlook bullish (K is 47.3, D is 45.9) | Volume increased (2.0x)
════════════════════
🔴 $FLOCK 4-hour bullish signal
⚠️Technical analysis: ADX(28): Trend is forming; entry possible | MACD bullish crossover above zero, bullish momentum is building | EMA5 crossed above EMA8, short-term trend turns bullish | Volume increased (1.8x)
════════════════════
🔴 $KSTR 4-hour bullish signal
⚠️Technical analysis: ADX(34): Clear trending market | MACD bullish crossover above zero, bullish momentum is building | EMA5 crossed above EMA8, short-term trend turns bullish | Volume surged (3.5x)
════════════════════
🔔 Follow for first-hand market updates 🔔
#技术分析 #LLY #FLOCK #KSTR
📌 When trading, pay attention to whether the candlestick pattern confirms the signal
12
·
--
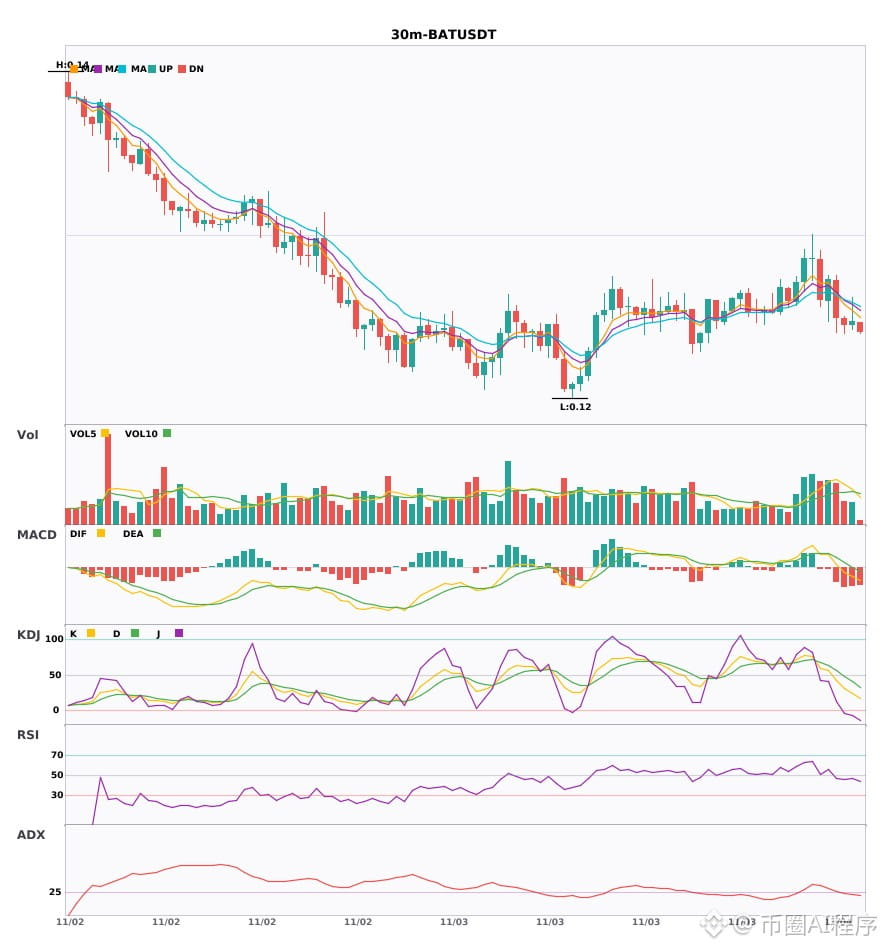
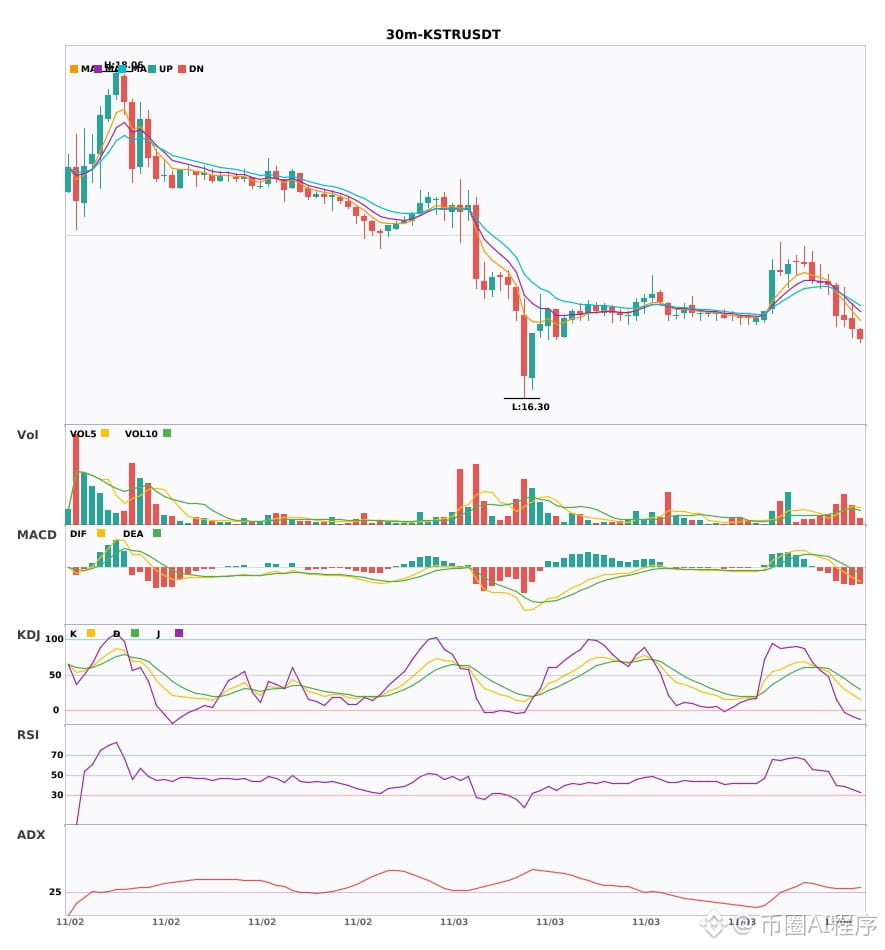
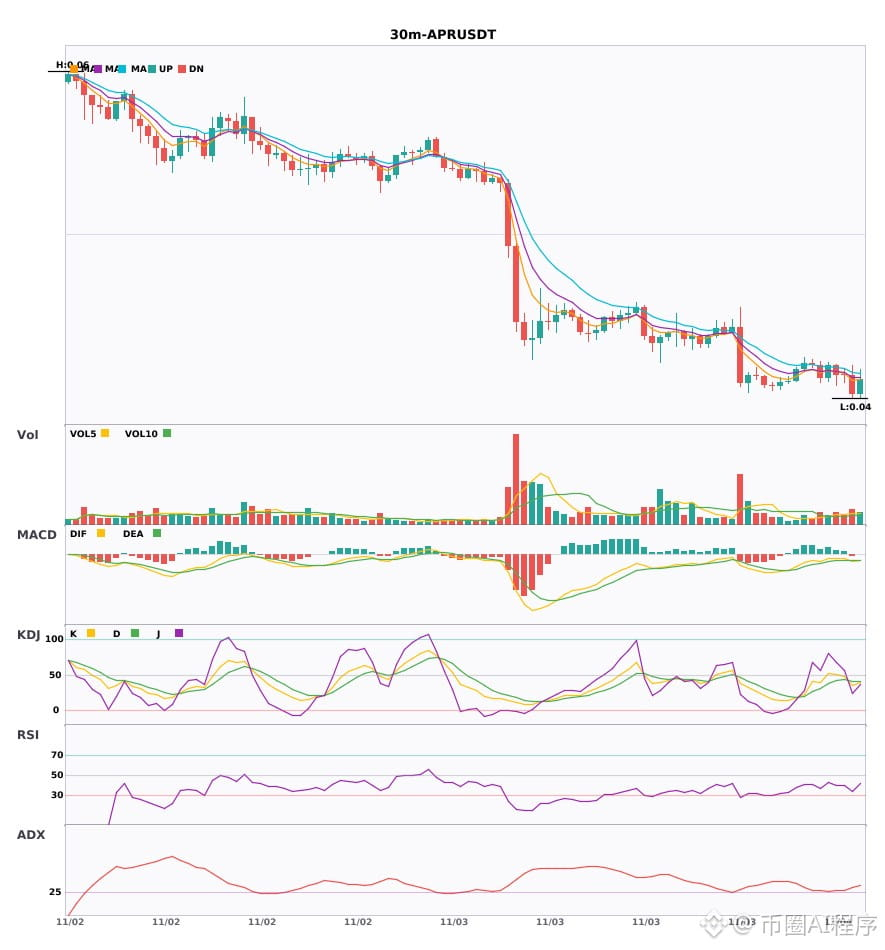
$BAT / $KSTR / $APR 30-minute bearish signal, 4-hour bearish trend confirmed🔥
════════════════════
🟢 $BAT 30-minute bearish signal
⚠️Technical analysis: 4-hour bearish convergence confirmed | 30-minute entry: MACD DIF falls below the zero line, trend turns bearish | EMA5 < EMA8 < EMA13, bearish alignment | KDJ is weak, bears have the upper hand (K: 31.0, D: 48.1) | Normal volume (1.3x)
════════════════════
🟢 $KSTR 30-minute bearish signal
⚠️Technical analysis: 4-hour bearish convergence confirmed | 30-minute entry: MACD DIF falls below the zero line, trend turns bearish | EMA5 < EMA8 < EMA13, bearish alignment | KDJ is weak, bears have the upper hand (K: 29.0, D: 44.6) | Increased trading volume (2.0x)
════════════════════
🟢 $APR 30-minute bearish signal
⚠️Technical analysis: 4-hour bearish convergence confirmed | 30-minute entry: MACD bearish crossover below zero, bearish momentum accelerating | EMA5 < EMA8 < EMA13, bearish alignment | KDJ bearish crossover, short-term outlook is bearish (K: 35.7, D: 41.5) | Increased trading volume (1.7x)
📢Market update: Binance Earn Yield Arena: Earn Up to 35% APR With This Week’s New Limited-Time Offers! (2026-10-28)
════════════════════
🔔 Follow for first-hand market alerts 🔔
#多周期共振 #BAT #KSTR #APR
📌 When trading, pay attention to whether the candlestick pattern matches
$BAT / $KSTR / $APR 30-minute bearish signal, 4-hour bearish trend confirmed🔥
════════════════════
🟢 $BAT 30-minute bearish signal
⚠️Technical analysis: 4-hour bearish convergence confirmed | 30-minute entry: MACD DIF falls below the zero line, trend turns bearish | EMA5 < EMA8 < EMA13, bearish alignment | KDJ is weak, bears have the upper hand (K: 31.0, D: 48.1) | Normal volume (1.3x)
════════════════════
🟢 $KSTR 30-minute bearish signal
⚠️Technical analysis: 4-hour bearish convergence confirmed | 30-minute entry: MACD DIF falls below the zero line, trend turns bearish | EMA5 < EMA8 < EMA13, bearish alignment | KDJ is weak, bears have the upper hand (K: 29.0, D: 44.6) | Increased trading volume (2.0x)
════════════════════
🟢 $APR 30-minute bearish signal
⚠️Technical analysis: 4-hour bearish convergence confirmed | 30-minute entry: MACD bearish crossover below zero, bearish momentum accelerating | EMA5 < EMA8 < EMA13, bearish alignment | KDJ bearish crossover, short-term outlook is bearish (K: 35.7, D: 41.5) | Increased trading volume (1.7x)
📢Market update: Binance Earn Yield Arena: Earn Up to 35% APR With This Week’s New Limited-Time Offers! (2026-10-28)
════════════════════
🔔 Follow for first-hand market alerts 🔔
#多周期共振 #BAT #KSTR #APR
📌 When trading, pay attention to whether the candlestick pattern matches
════════════════════
🟢 $BAT 30-minute bearish signal
⚠️Technical analysis: 4-hour bearish convergence confirmed | 30-minute entry: MACD DIF falls below the zero line, trend turns bearish | EMA5 < EMA8 < EMA13, bearish alignment | KDJ is weak, bears have the upper hand (K: 31.0, D: 48.1) | Normal volume (1.3x)
════════════════════
🟢 $KSTR 30-minute bearish signal
⚠️Technical analysis: 4-hour bearish convergence confirmed | 30-minute entry: MACD DIF falls below the zero line, trend turns bearish | EMA5 < EMA8 < EMA13, bearish alignment | KDJ is weak, bears have the upper hand (K: 29.0, D: 44.6) | Increased trading volume (2.0x)
════════════════════
🟢 $APR 30-minute bearish signal
⚠️Technical analysis: 4-hour bearish convergence confirmed | 30-minute entry: MACD bearish crossover below zero, bearish momentum accelerating | EMA5 < EMA8 < EMA13, bearish alignment | KDJ bearish crossover, short-term outlook is bearish (K: 35.7, D: 41.5) | Increased trading volume (1.7x)
📢Market update: Binance Earn Yield Arena: Earn Up to 35% APR With This Week’s New Limited-Time Offers! (2026-10-28)
════════════════════
🔔 Follow for first-hand market alerts 🔔
#多周期共振 #BAT #KSTR #APR
📌 When trading, pay attention to whether the candlestick pattern matches
10
·
--
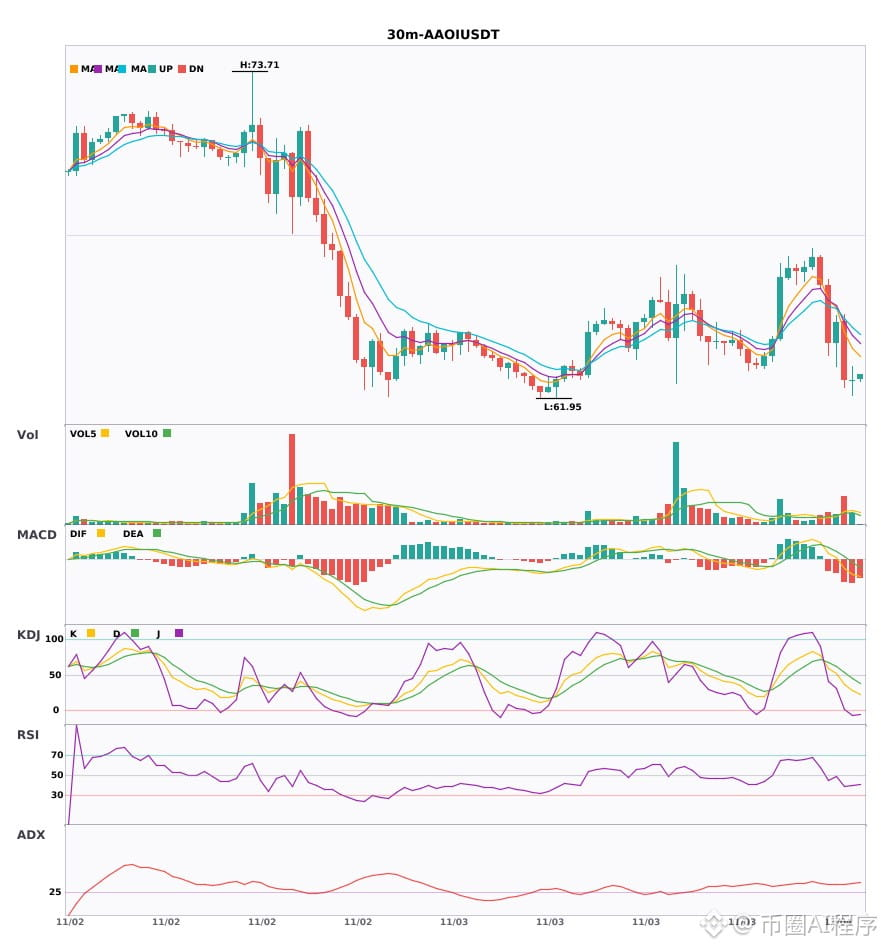
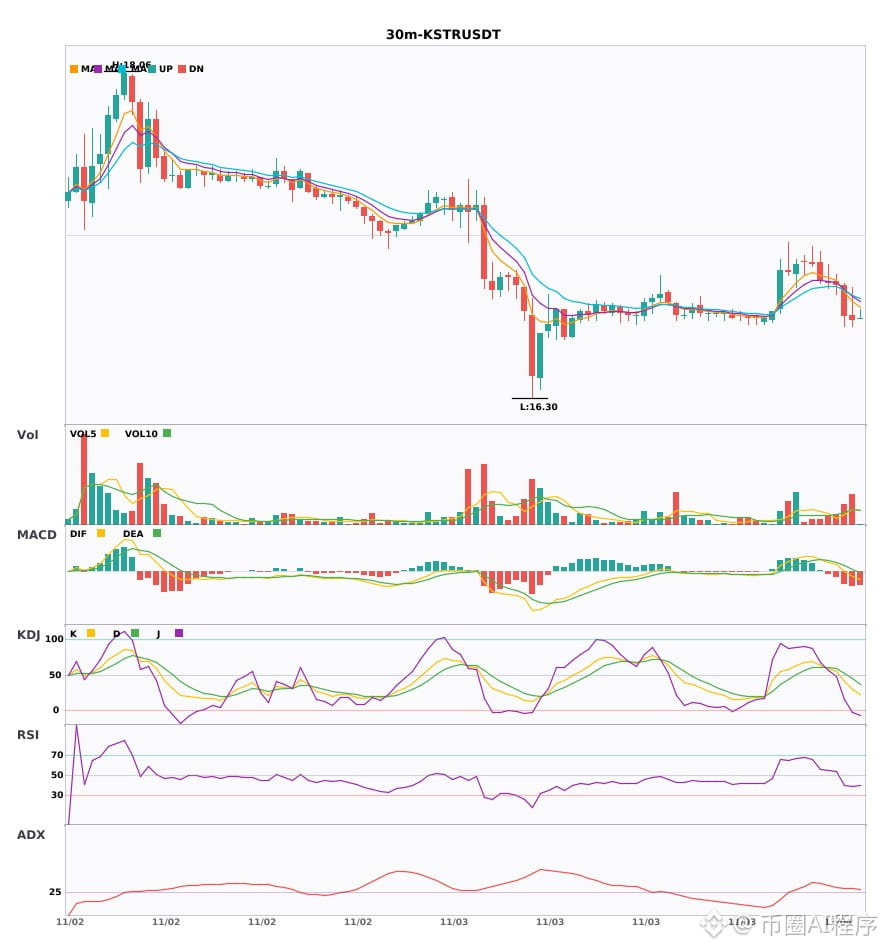
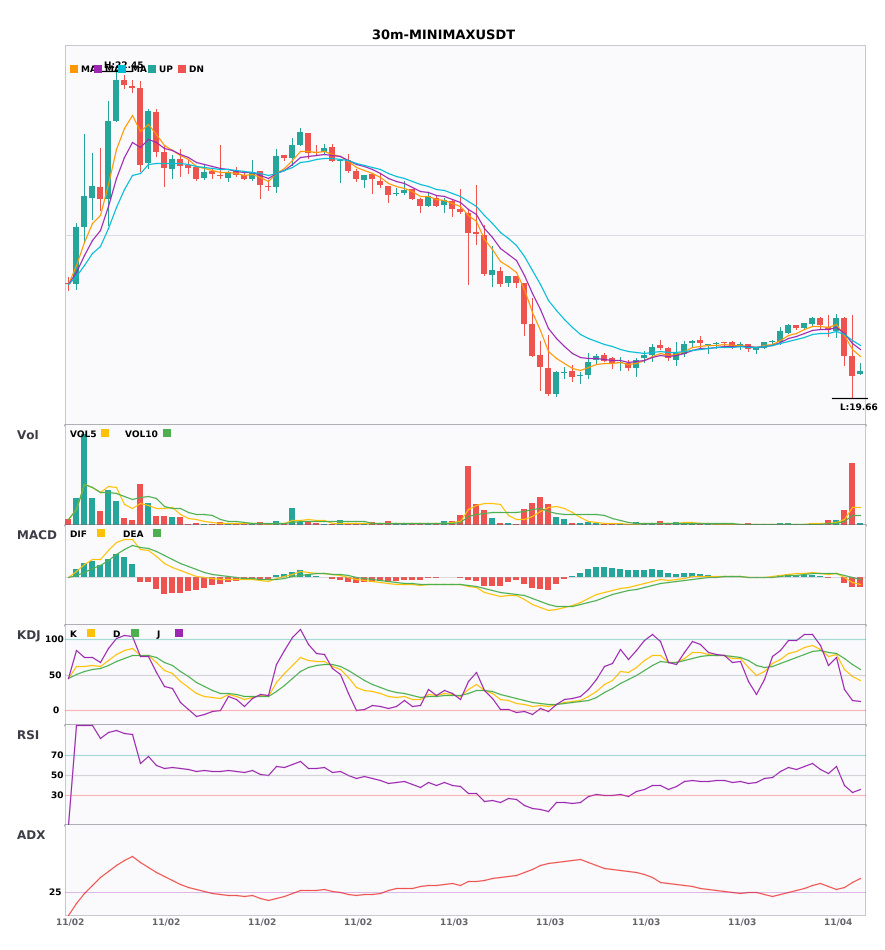
$AAOI / $KSTR / $MINIMAX 30-minute bearish + 4-hour bearish alignment, multi-timeframe confluence turns bearish 🔥
════════════════════
🟢 $AAOI 30-minute bearish signal
⚠️Technical analysis: 4-hour bearish confluence confirmed | 30-minute entry: MACD DIF falls below the zero line, trend turns bearish | EMA5 < EMA8 < EMA13, bearish alignment | Volume increase (2.4x)
════════════════════
🟢 $KSTR 30-minute bearish signal
⚠️Technical analysis: 4-hour bearish confluence confirmed | 30-minute entry: MACD DIF falls below the zero line, trend turns bearish | EMA5 < EMA8 < EMA13, bearish alignment | KDJ is trending weakly, with bears in control (K: 29.0, D: 44.6) | Volume increase (2.0x)
════════════════════
🟢 $MINIMAX 30-minute bearish signal
⚠️Technical analysis: 4-hour bearish confluence confirmed | 30-minute entry: MACD DIF falls below the zero line, trend turns bearish | EMA5 < EMA8 < EMA13, bearish alignment | Volume surge (6.6x)
════════════════════
🔔 Follow for real-time market alerts 🔔
#多周期共振 #AAOI #KSTR #MINIMAX
📌 When trading, pay attention to whether the candlestick pattern is favorable
$AAOI / $KSTR / $MINIMAX 30-minute bearish + 4-hour bearish alignment, multi-timeframe confluence turns bearish 🔥
════════════════════
🟢 $AAOI 30-minute bearish signal
⚠️Technical analysis: 4-hour bearish confluence confirmed | 30-minute entry: MACD DIF falls below the zero line, trend turns bearish | EMA5 < EMA8 < EMA13, bearish alignment | Volume increase (2.4x)
════════════════════
🟢 $KSTR 30-minute bearish signal
⚠️Technical analysis: 4-hour bearish confluence confirmed | 30-minute entry: MACD DIF falls below the zero line, trend turns bearish | EMA5 < EMA8 < EMA13, bearish alignment | KDJ is trending weakly, with bears in control (K: 29.0, D: 44.6) | Volume increase (2.0x)
════════════════════
🟢 $MINIMAX 30-minute bearish signal
⚠️Technical analysis: 4-hour bearish confluence confirmed | 30-minute entry: MACD DIF falls below the zero line, trend turns bearish | EMA5 < EMA8 < EMA13, bearish alignment | Volume surge (6.6x)
════════════════════
🔔 Follow for real-time market alerts 🔔
#多周期共振 #AAOI #KSTR #MINIMAX
📌 When trading, pay attention to whether the candlestick pattern is favorable
════════════════════
🟢 $AAOI 30-minute bearish signal
⚠️Technical analysis: 4-hour bearish confluence confirmed | 30-minute entry: MACD DIF falls below the zero line, trend turns bearish | EMA5 < EMA8 < EMA13, bearish alignment | Volume increase (2.4x)
════════════════════
🟢 $KSTR 30-minute bearish signal
⚠️Technical analysis: 4-hour bearish confluence confirmed | 30-minute entry: MACD DIF falls below the zero line, trend turns bearish | EMA5 < EMA8 < EMA13, bearish alignment | KDJ is trending weakly, with bears in control (K: 29.0, D: 44.6) | Volume increase (2.0x)
════════════════════
🟢 $MINIMAX 30-minute bearish signal
⚠️Technical analysis: 4-hour bearish confluence confirmed | 30-minute entry: MACD DIF falls below the zero line, trend turns bearish | EMA5 < EMA8 < EMA13, bearish alignment | Volume surge (6.6x)
════════════════════
🔔 Follow for real-time market alerts 🔔
#多周期共振 #AAOI #KSTR #MINIMAX
📌 When trading, pay attention to whether the candlestick pattern is favorable
9
Log in to explore more content
Join global crypto users on Binance Square
⚡️ Get latest and useful information about crypto.
💬 Trusted by the world’s largest crypto exchange.
👍 Discover real insights from verified creators.
Email / Phone number
Trending Topics
1
#BitcoinCorePatchesAIDiscoveredVulnerability
7 views
21 Discussing
2
#CanBTCReboundAfterFallingBelow60K?
448,740 views
1,921 Discussing
3
#GlobalStocksFaceLongestLosingStreakSince2023
152,117 views
1,336 Discussing
4
#BlackRockIBITPostsRecord$541MSingleDayOutflow
5,295 views
42 Discussing
5
#AnthropicPlungesTowardIPOPriceonDay2
73,269 views
752 Discussing
6
#TwentyOneCapitalAdds172.25BTC
23,984 views
285 Discussing
7
#HKBillWouldExcludeTokenizedDepositsFromVirtualAssets
2,671 views
31 Discussing
8
#BNBDropsBelow540USDTWith8.46%DailyDecline
42,673 views
370 Discussing
9
#HKBillProposesHK$100KFineForUnauthorizedCryptoTitles
1,500 views
20 Discussing
10
#BitMineFaces$10.1BUnrealizedETHLoss
2,750 views
25 Discussing