
#liquidationmap
liquidationmap
407,741 views
1,193 Discussing
Hot
Latest

·
--
Bullish
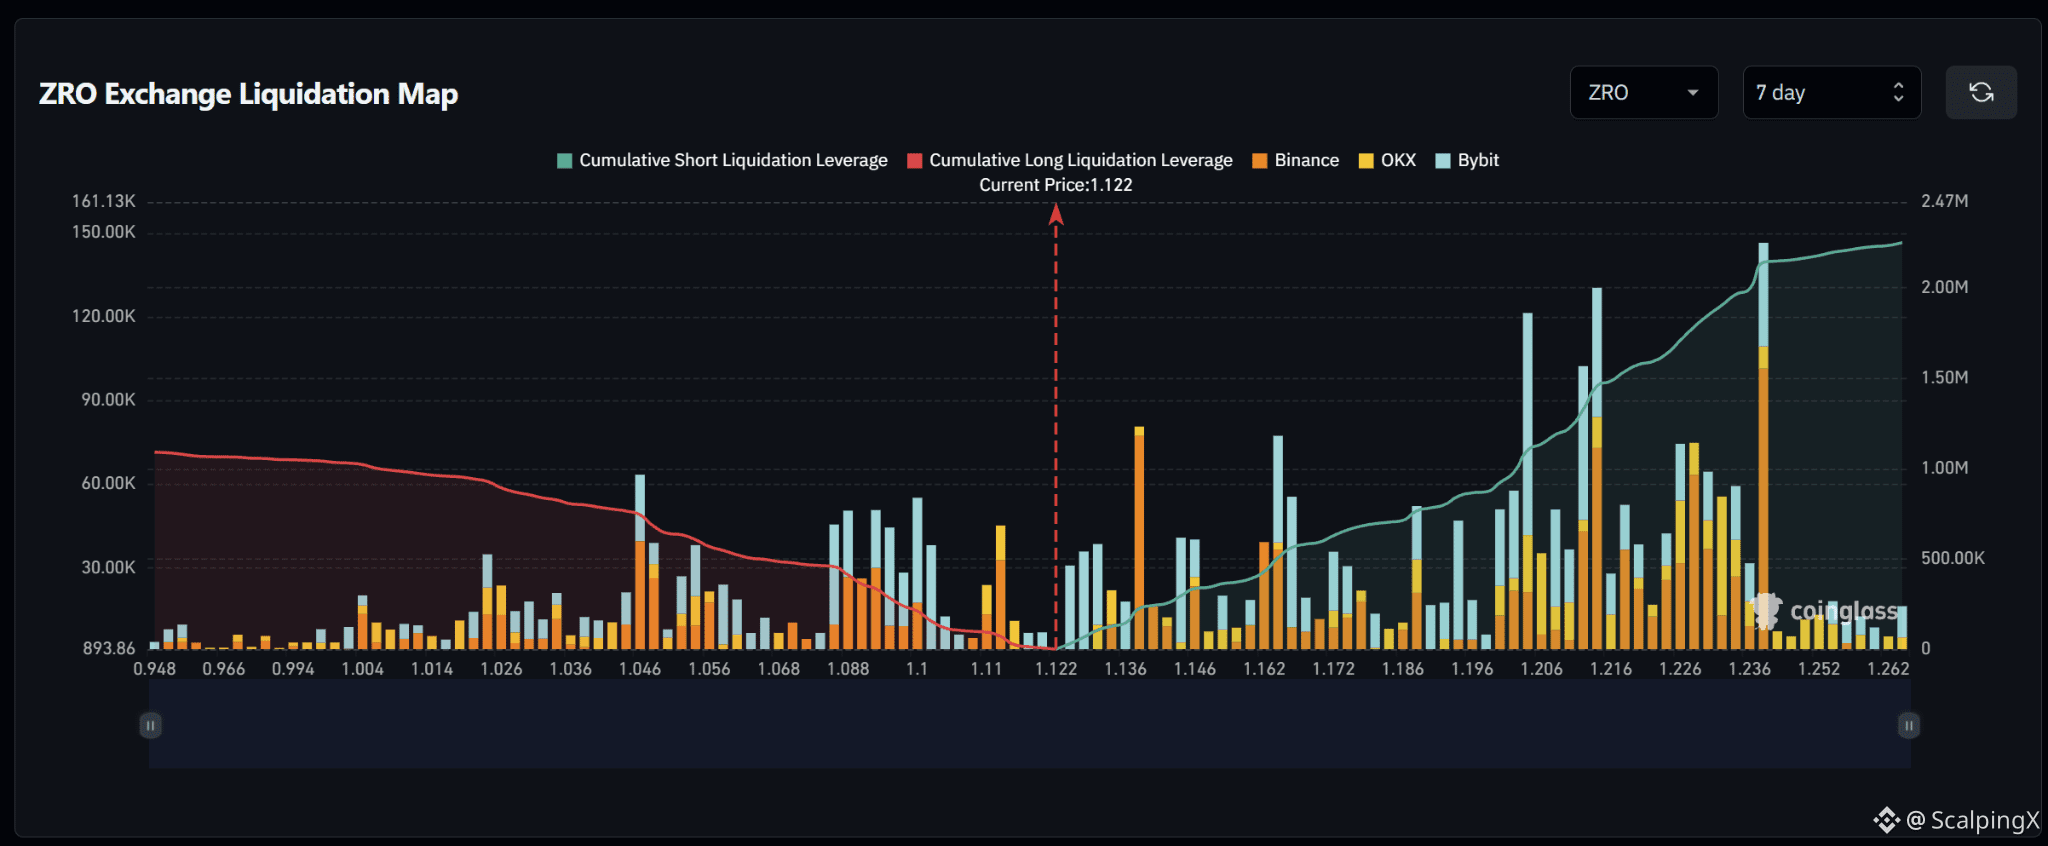
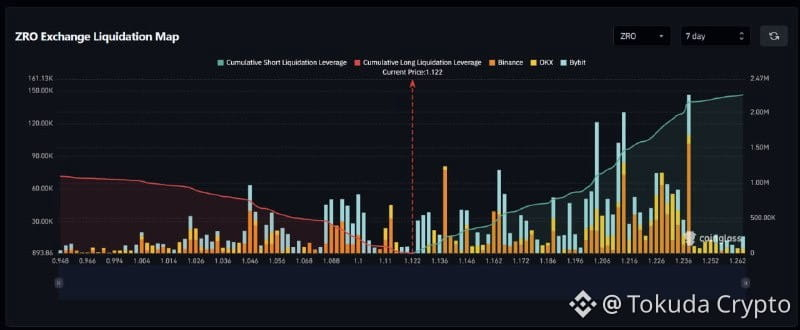
$ZRO – Liquidation Map (7 days) – Index ~1.122
🧭 The preferred scenario is an initial short sweep at 1.124–1.130. These clusters sit close to price, followed by a larger bar near 1.138. The nearest notable long cluster below lies at 1.110–1.114.
🔺 A break and hold above 1.140 would shift focus to 1.144–1.148, then 1.162–1.168. Clusters between these zones are more scattered, with a prominent bar near 1.164.
🎯 Continuation above 1.168 would bring 1.186–1.198 into view ahead of the larger 1.202–1.216 band. Further out, 1.226–1.239 contains additional short clusters, particularly near 1.238. Bar sizes drop noticeably above 1.240.
⚖️ Losing 1.122 without reclaiming it would shift priority to a long sweep at 1.110–1.114. Holding below 1.110 would bring 1.088–1.104 into focus, followed by more scattered clusters at 1.044–1.060. Reclaiming 1.122 after a sweep would weaken downward continuation.
#LiquidationMap
$ZRO – Liquidation Map (7 days) – Index ~1.122
🧭 The preferred scenario is an initial short sweep at 1.124–1.130. These clusters sit close to price, followed by a larger bar near 1.138. The nearest notable long cluster below lies at 1.110–1.114.
🔺 A break and hold above 1.140 would shift focus to 1.144–1.148, then 1.162–1.168. Clusters between these zones are more scattered, with a prominent bar near 1.164.
🎯 Continuation above 1.168 would bring 1.186–1.198 into view ahead of the larger 1.202–1.216 band. Further out, 1.226–1.239 contains additional short clusters, particularly near 1.238. Bar sizes drop noticeably above 1.240.
⚖️ Losing 1.122 without reclaiming it would shift priority to a long sweep at 1.110–1.114. Holding below 1.110 would bring 1.088–1.104 into focus, followed by more scattered clusters at 1.044–1.060. Reclaiming 1.122 after a sweep would weaken downward continuation.
#LiquidationMap
🧭 The preferred scenario is an initial short sweep at 1.124–1.130. These clusters sit close to price, followed by a larger bar near 1.138. The nearest notable long cluster below lies at 1.110–1.114.
🔺 A break and hold above 1.140 would shift focus to 1.144–1.148, then 1.162–1.168. Clusters between these zones are more scattered, with a prominent bar near 1.164.
🎯 Continuation above 1.168 would bring 1.186–1.198 into view ahead of the larger 1.202–1.216 band. Further out, 1.226–1.239 contains additional short clusters, particularly near 1.238. Bar sizes drop noticeably above 1.240.
⚖️ Losing 1.122 without reclaiming it would shift priority to a long sweep at 1.110–1.114. Holding below 1.110 would bring 1.088–1.104 into focus, followed by more scattered clusters at 1.044–1.060. Reclaiming 1.122 after a sweep would weaken downward continuation.
#LiquidationMap
8
·
--
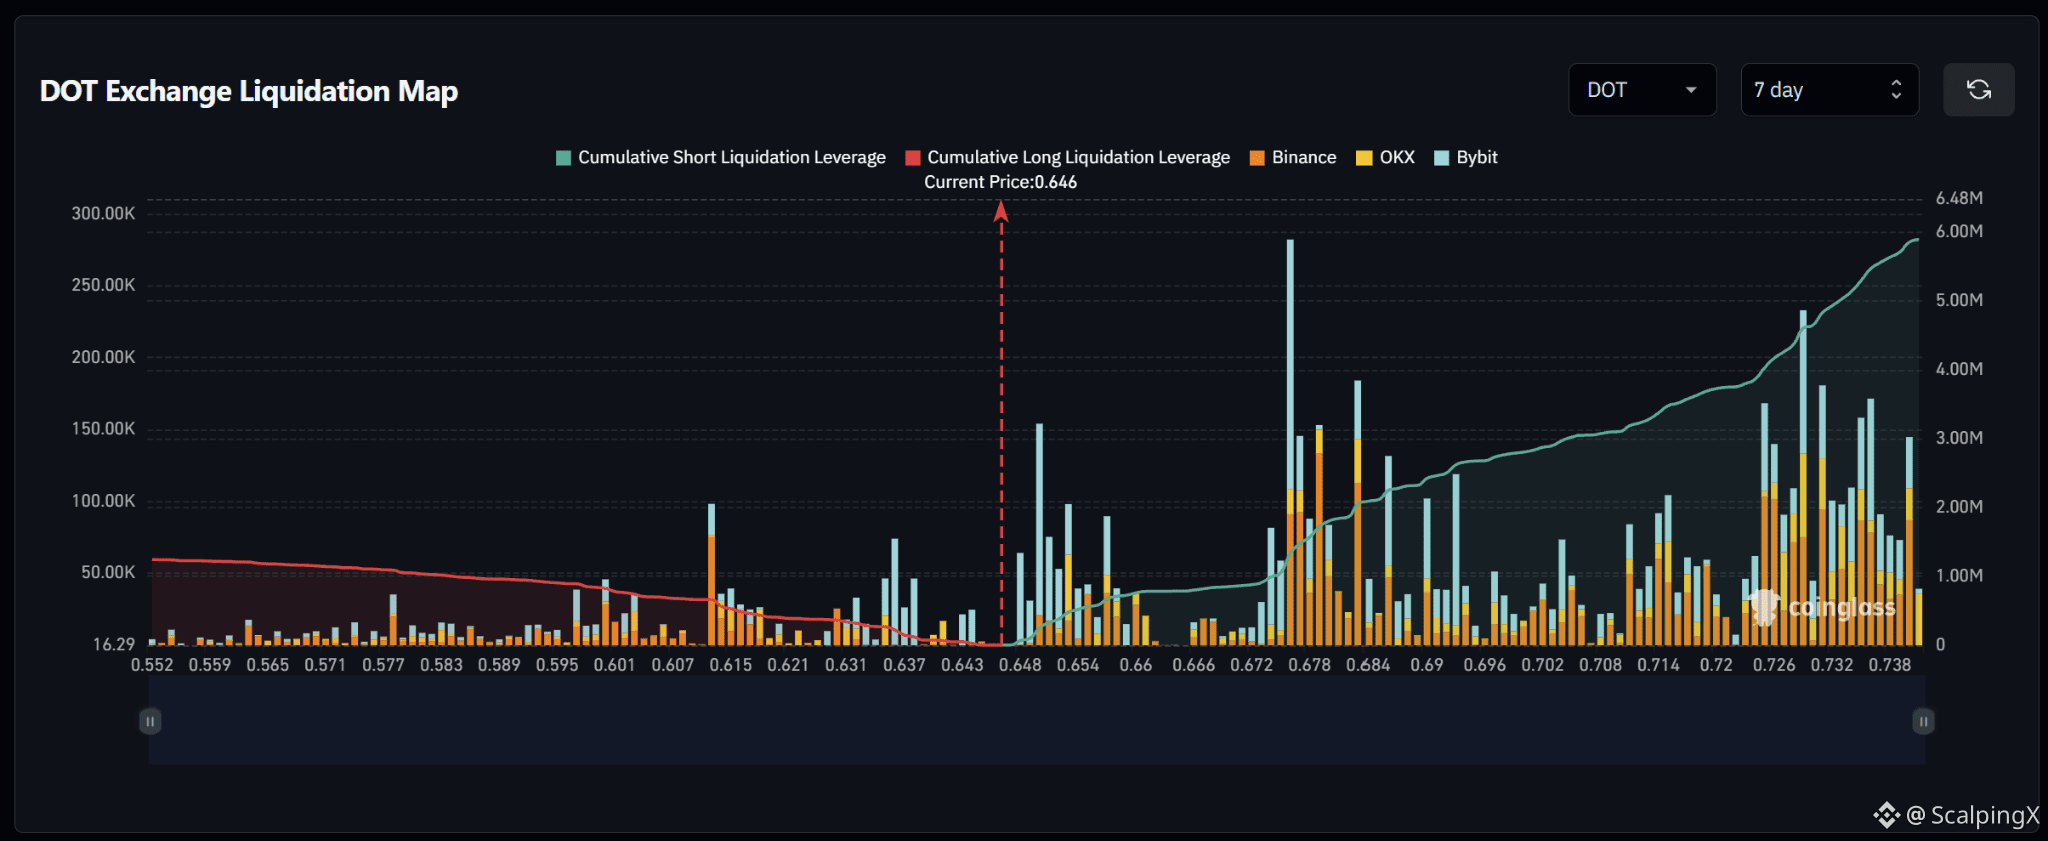
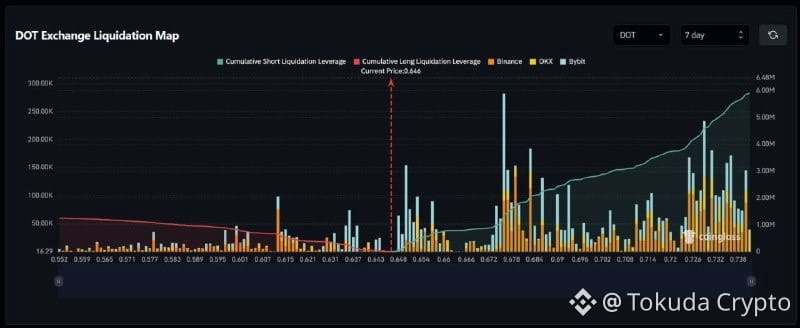
$DOT – Liquidation Map (7 days) – Index ~0.646
🧭 The preferred scenario is a short liquidation sweep at 0.648–0.657. These clusters are close to price and larger than the long clusters immediately below, particularly around 0.650 and 0.653.
🔺 A break and hold above 0.657 would shift focus to 0.674–0.686, with the largest bar near 0.676. The 0.661–0.671 stretch is relatively sparse, while 0.679 and 0.683 mark additional notable clusters above.
🎯 Holding above 0.686 would bring 0.690–0.694 into view. Further out, large clusters build again at 0.726–0.740. A short sweep followed by a drop below 0.646 would weaken upward continuation.
⚖️ Losing 0.646 without reclaiming it would shift priority to a long liquidation sweep at 0.642–0.644, then 0.635–0.639. Below 0.635, clusters are more scattered ahead of 0.612–0.616. Reclaiming 0.646 after a sweep would weaken downward continuation.
#LiquidationMap
$DOT – Liquidation Map (7 days) – Index ~0.646
🧭 The preferred scenario is a short liquidation sweep at 0.648–0.657. These clusters are close to price and larger than the long clusters immediately below, particularly around 0.650 and 0.653.
🔺 A break and hold above 0.657 would shift focus to 0.674–0.686, with the largest bar near 0.676. The 0.661–0.671 stretch is relatively sparse, while 0.679 and 0.683 mark additional notable clusters above.
🎯 Holding above 0.686 would bring 0.690–0.694 into view. Further out, large clusters build again at 0.726–0.740. A short sweep followed by a drop below 0.646 would weaken upward continuation.
⚖️ Losing 0.646 without reclaiming it would shift priority to a long liquidation sweep at 0.642–0.644, then 0.635–0.639. Below 0.635, clusters are more scattered ahead of 0.612–0.616. Reclaiming 0.646 after a sweep would weaken downward continuation.
#LiquidationMap
🧭 The preferred scenario is a short liquidation sweep at 0.648–0.657. These clusters are close to price and larger than the long clusters immediately below, particularly around 0.650 and 0.653.
🔺 A break and hold above 0.657 would shift focus to 0.674–0.686, with the largest bar near 0.676. The 0.661–0.671 stretch is relatively sparse, while 0.679 and 0.683 mark additional notable clusters above.
🎯 Holding above 0.686 would bring 0.690–0.694 into view. Further out, large clusters build again at 0.726–0.740. A short sweep followed by a drop below 0.646 would weaken upward continuation.
⚖️ Losing 0.646 without reclaiming it would shift priority to a long liquidation sweep at 0.642–0.644, then 0.635–0.639. Below 0.635, clusters are more scattered ahead of 0.612–0.616. Reclaiming 0.646 after a sweep would weaken downward continuation.
#LiquidationMap
76
·
--
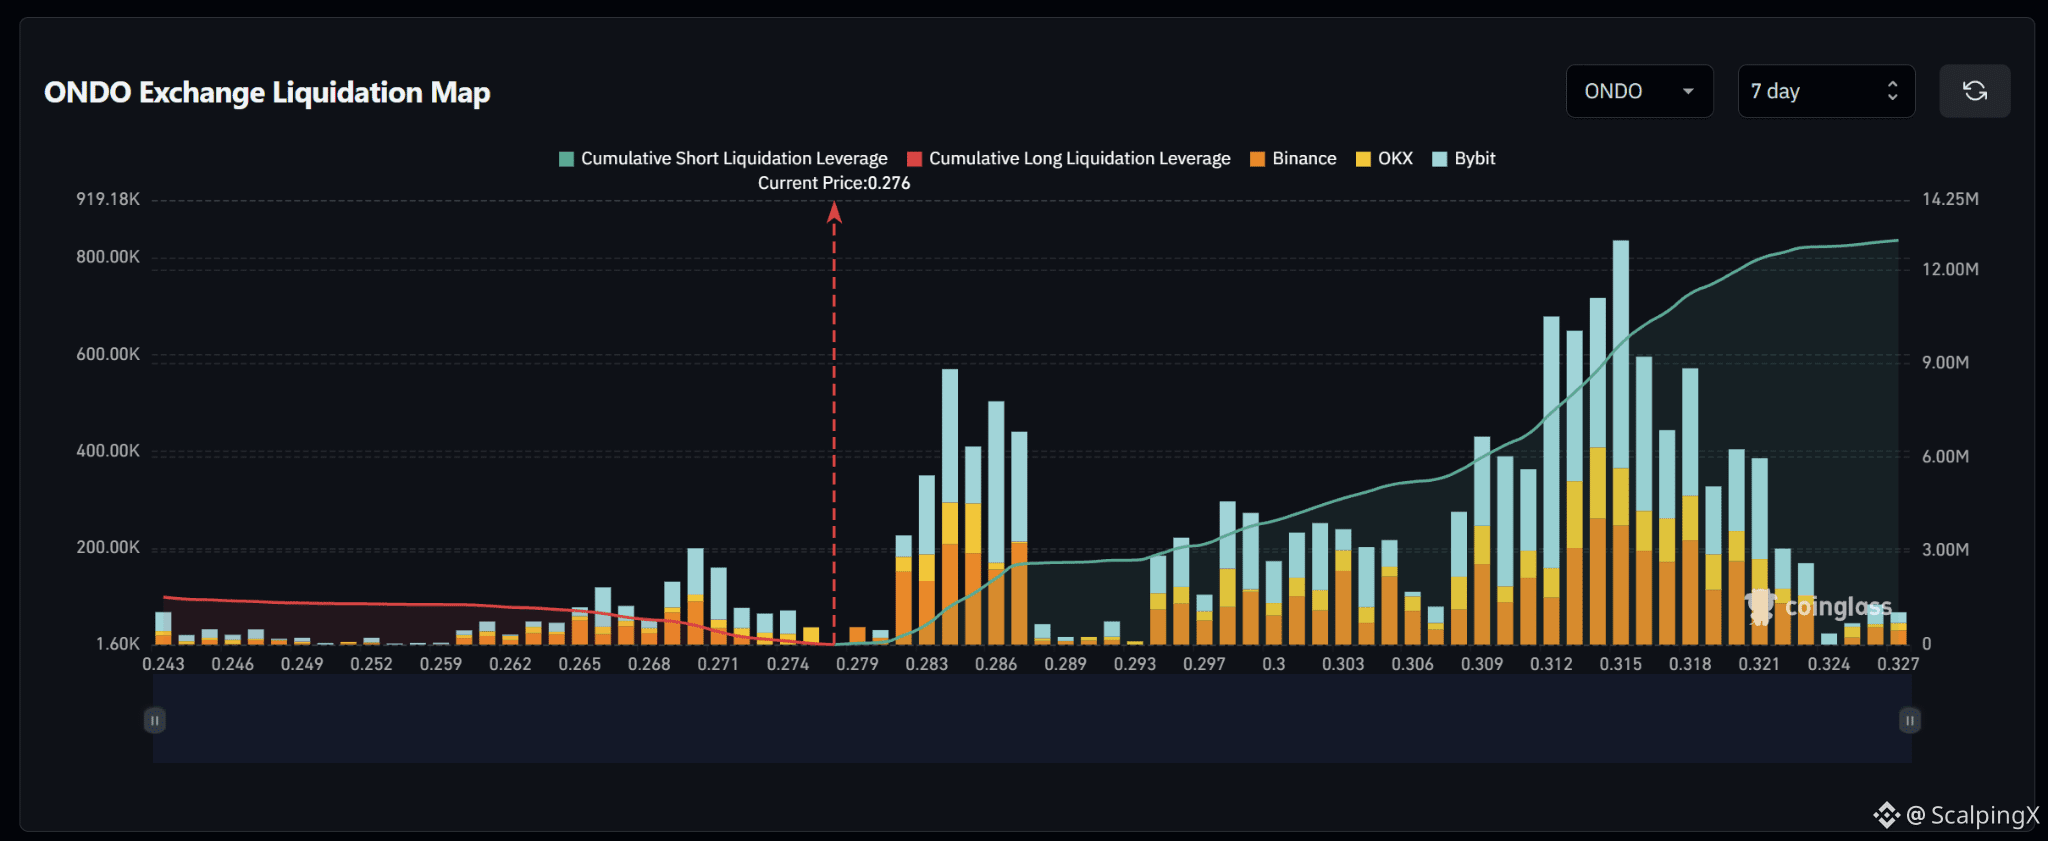
$ONDO – Liquidation Map (7 days) – Index ~0.276
🧭 Favor a short-liquidation sweep at 0.281–0.287. This zone contains several consecutive large bars, particularly around 0.284 and 0.286, while nearby downside long clusters are considerably smaller.
🔺 Breaking and holding above 0.287 would shift focus to 0.294–0.304. The 0.288–0.293 stretch is relatively sparse, while subsequent clusters are moderately sized and more scattered.
🎯 Holding above 0.304 would put 0.309–0.318 in focus, especially 0.312–0.316, with the largest bar around 0.315. Bar sizes decline noticeably above 0.321. A short sweep followed by a drop below 0.276 would weaken upside continuation.
⚖️ Losing 0.276 without reclaiming it would shift preference toward a long-liquidation sweep at 0.270–0.274. Holding below 0.270 would bring 0.265–0.269 into view; lower long clusters are relatively sparse. Reclaiming 0.276 after a sweep would weaken downside continuation.
#LiquidationMap
$ONDO – Liquidation Map (7 days) – Index ~0.276
🧭 Favor a short-liquidation sweep at 0.281–0.287. This zone contains several consecutive large bars, particularly around 0.284 and 0.286, while nearby downside long clusters are considerably smaller.
🔺 Breaking and holding above 0.287 would shift focus to 0.294–0.304. The 0.288–0.293 stretch is relatively sparse, while subsequent clusters are moderately sized and more scattered.
🎯 Holding above 0.304 would put 0.309–0.318 in focus, especially 0.312–0.316, with the largest bar around 0.315. Bar sizes decline noticeably above 0.321. A short sweep followed by a drop below 0.276 would weaken upside continuation.
⚖️ Losing 0.276 without reclaiming it would shift preference toward a long-liquidation sweep at 0.270–0.274. Holding below 0.270 would bring 0.265–0.269 into view; lower long clusters are relatively sparse. Reclaiming 0.276 after a sweep would weaken downside continuation.
#LiquidationMap
🧭 Favor a short-liquidation sweep at 0.281–0.287. This zone contains several consecutive large bars, particularly around 0.284 and 0.286, while nearby downside long clusters are considerably smaller.
🔺 Breaking and holding above 0.287 would shift focus to 0.294–0.304. The 0.288–0.293 stretch is relatively sparse, while subsequent clusters are moderately sized and more scattered.
🎯 Holding above 0.304 would put 0.309–0.318 in focus, especially 0.312–0.316, with the largest bar around 0.315. Bar sizes decline noticeably above 0.321. A short sweep followed by a drop below 0.276 would weaken upside continuation.
⚖️ Losing 0.276 without reclaiming it would shift preference toward a long-liquidation sweep at 0.270–0.274. Holding below 0.270 would bring 0.265–0.269 into view; lower long clusters are relatively sparse. Reclaiming 0.276 after a sweep would weaken downside continuation.
#LiquidationMap
34

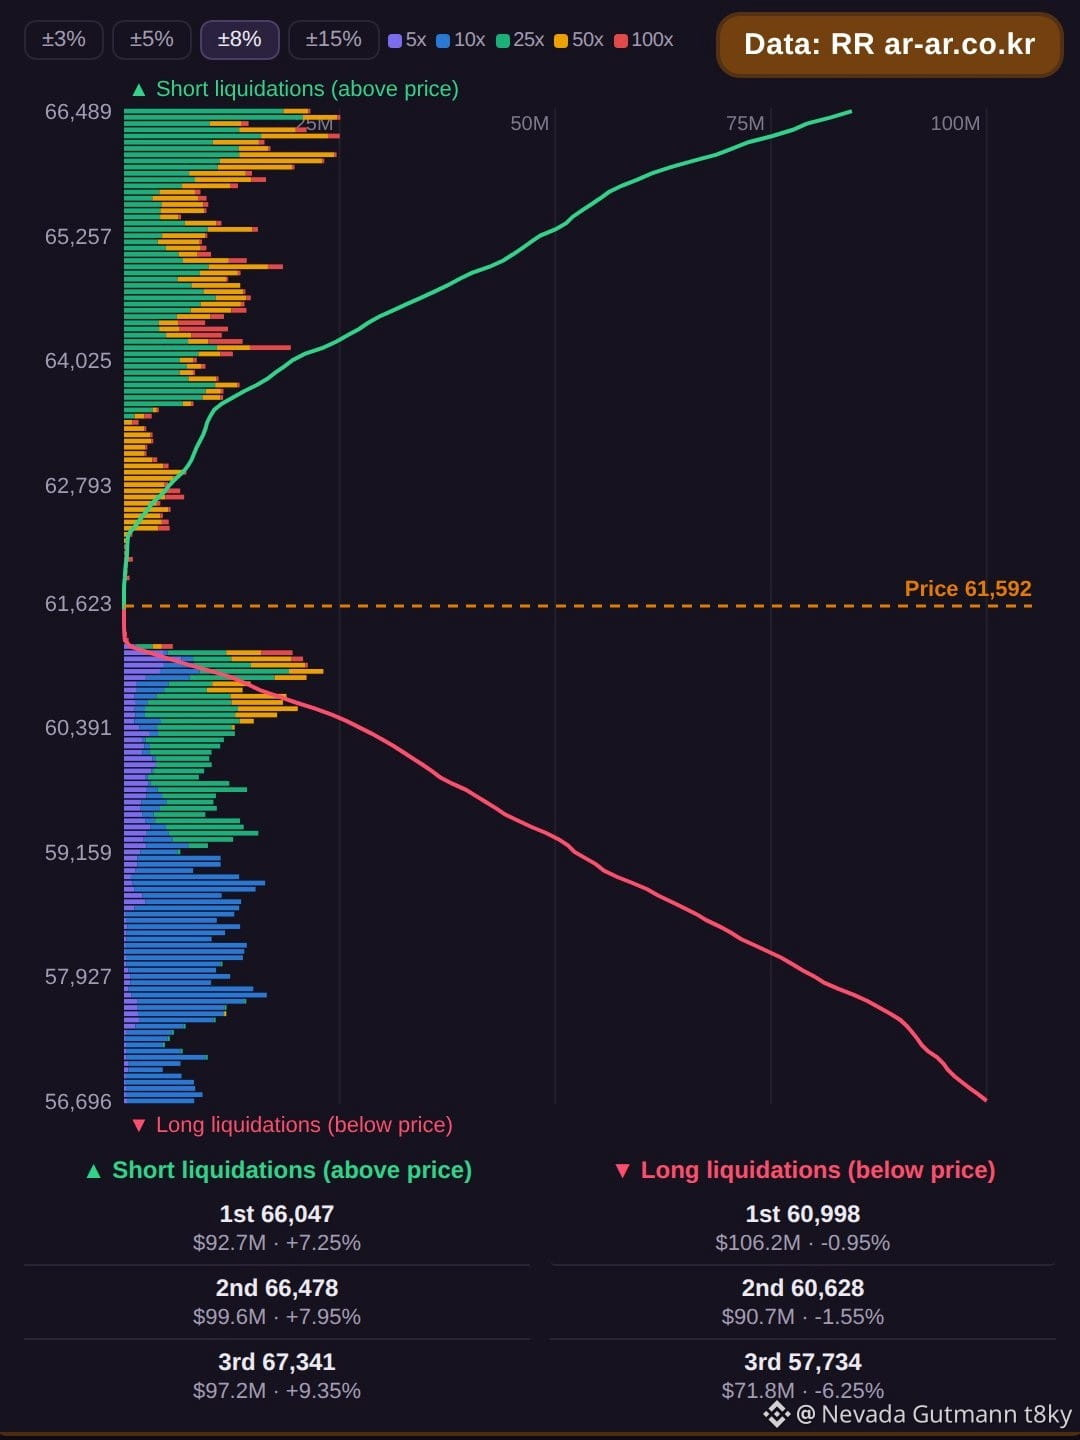
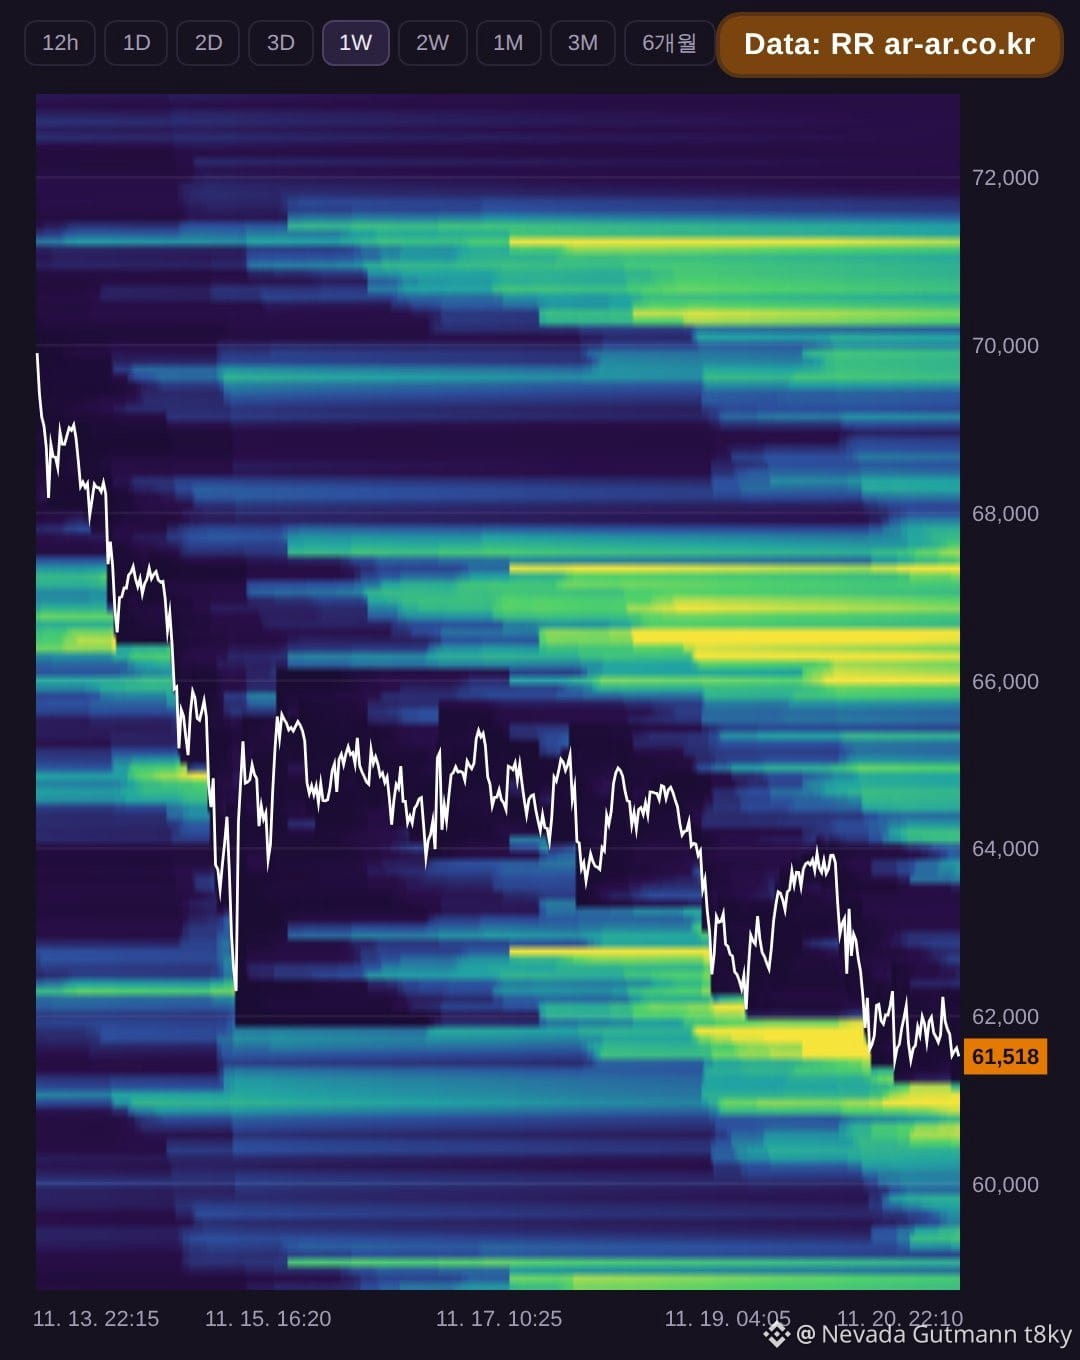
Bitcoin is trading at $61,477 as liquidation clusters form on both sides. Above the current price, short liquidations are stacked at $65,995 with about $91.9M, followed by $66,487 holding roughly $99.6M, and $67,348 showing about $97.3M. The three levels together total $288.8M. Below price, long liquidations sit at $60,954 with about $102.5M, then $60,585 carrying around $91.4M, and $57,757 with about $71.3M. These three sum to $265.3M. Longs are closer to the current price at $60,954, just -0.85% away, while the larger stack is on the short side. Traders may watch whether price action tests the nearby long cluster first or pushes higher toward the heavier short liquidations above.
Data source: RR (ar-ar.co.kr). Estimated from BTCUSDT futures data. Not financial advice.
#BTC #Bitcoin #LiquidationMap #LiquidationHeatmap
Bitcoin is trading at $61,477 as liquidation clusters form on both sides. Above the current price, short liquidations are stacked at $65,995 with about $91.9M, followed by $66,487 holding roughly $99.6M, and $67,348 showing about $97.3M. The three levels together total $288.8M. Below price, long liquidations sit at $60,954 with about $102.5M, then $60,585 carrying around $91.4M, and $57,757 with about $71.3M. These three sum to $265.3M. Longs are closer to the current price at $60,954, just -0.85% away, while the larger stack is on the short side. Traders may watch whether price action tests the nearby long cluster first or pushes higher toward the heavier short liquidations above.
Data source: RR (ar-ar.co.kr). Estimated from BTCUSDT futures data. Not financial advice.
#BTC #Bitcoin #LiquidationMap #LiquidationHeatmap
Data source: RR (ar-ar.co.kr). Estimated from BTCUSDT futures data. Not financial advice.
#BTC #Bitcoin #LiquidationMap #LiquidationHeatmap
64
·
--
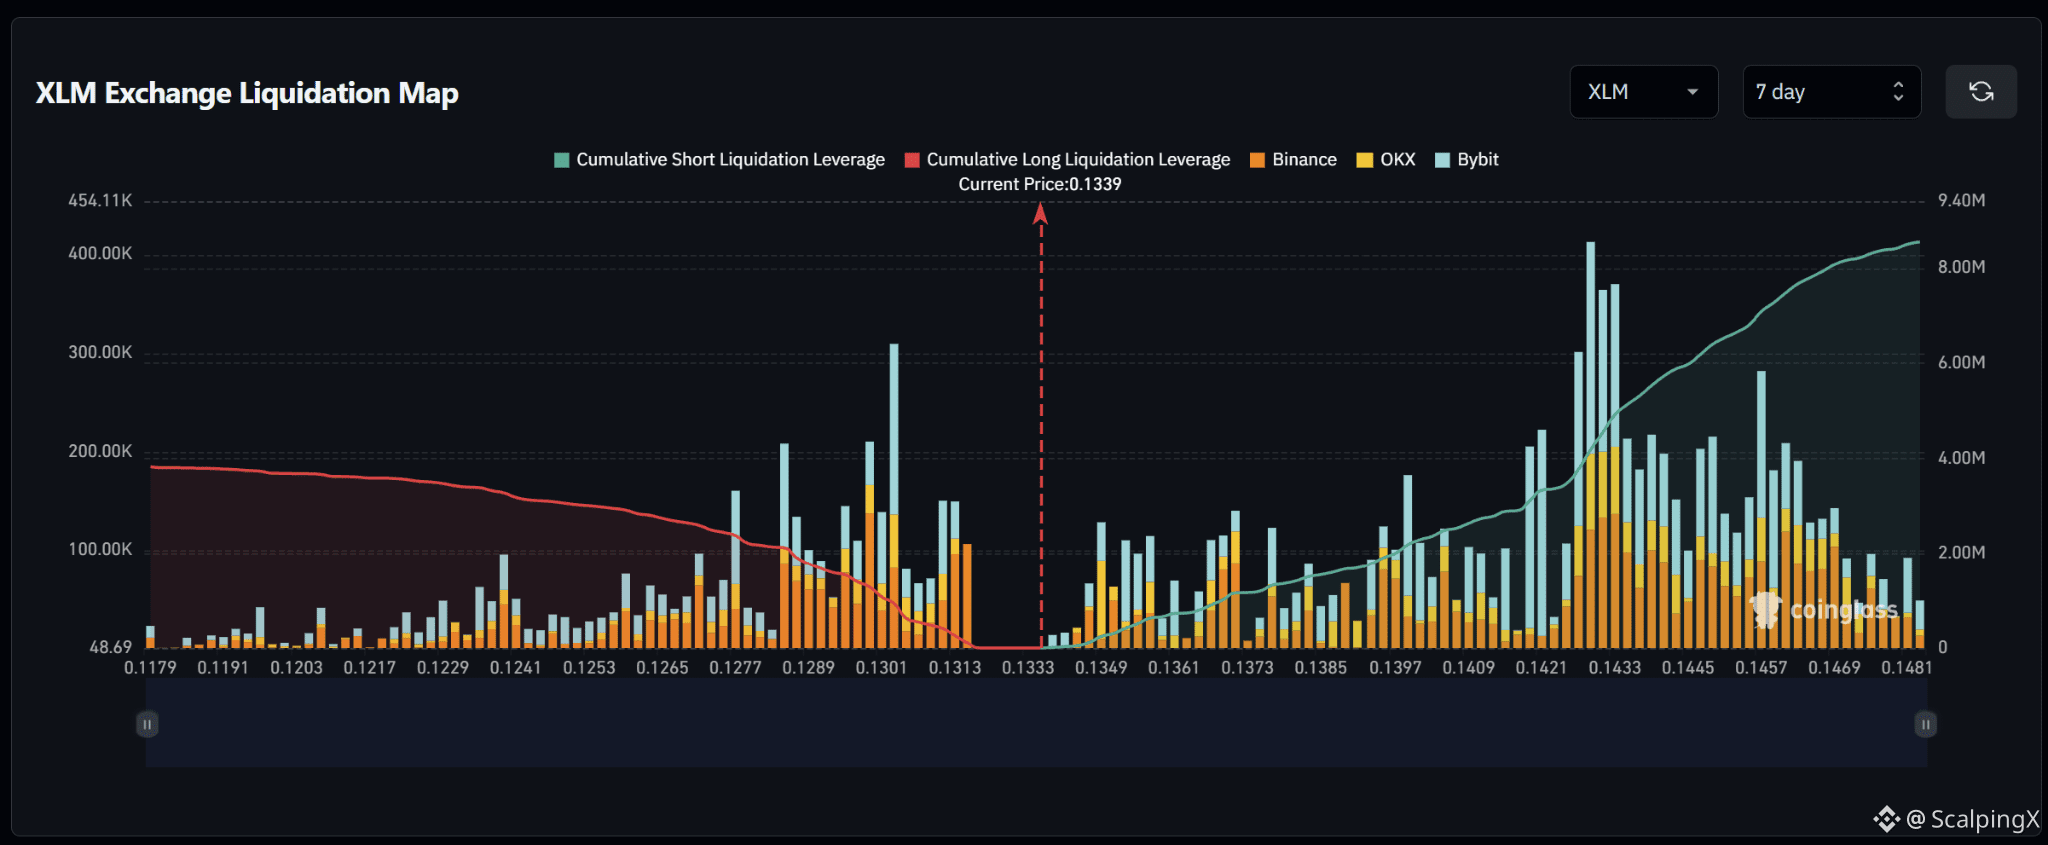
$XLM – Liquidation Map (7 days) – Index ~0.1339
🧭 Favor a short-liquidation sweep at 0.1347–0.1357. Upside bars sit closer to price than the notable long cluster at 0.1311–0.1315, with a relatively sparse stretch immediately below price.
🔺 Breaking and holding above 0.1357 would shift focus to 0.1369–0.1374, then 0.1395–0.1403. These moderately sized clusters precede a larger short zone further up.
🎯 Holding above 0.1403 would put 0.1420–0.1435 in focus, with the largest bar around 0.1429. A sustained move above 0.1435 would extend focus to 0.1440–0.1468. A short sweep followed by a drop below 0.1339 would weaken upside continuation.
⚖️ Losing 0.1333 without reclaiming it would shift preference toward a long-liquidation sweep at 0.1311–0.1315. Holding below 0.1311 would bring 0.1298–0.1305 into view, particularly around 0.1303, followed by 0.1283–0.1293.
#LiquidationMap
$XLM – Liquidation Map (7 days) – Index ~0.1339
🧭 Favor a short-liquidation sweep at 0.1347–0.1357. Upside bars sit closer to price than the notable long cluster at 0.1311–0.1315, with a relatively sparse stretch immediately below price.
🔺 Breaking and holding above 0.1357 would shift focus to 0.1369–0.1374, then 0.1395–0.1403. These moderately sized clusters precede a larger short zone further up.
🎯 Holding above 0.1403 would put 0.1420–0.1435 in focus, with the largest bar around 0.1429. A sustained move above 0.1435 would extend focus to 0.1440–0.1468. A short sweep followed by a drop below 0.1339 would weaken upside continuation.
⚖️ Losing 0.1333 without reclaiming it would shift preference toward a long-liquidation sweep at 0.1311–0.1315. Holding below 0.1311 would bring 0.1298–0.1305 into view, particularly around 0.1303, followed by 0.1283–0.1293.
#LiquidationMap
🧭 Favor a short-liquidation sweep at 0.1347–0.1357. Upside bars sit closer to price than the notable long cluster at 0.1311–0.1315, with a relatively sparse stretch immediately below price.
🔺 Breaking and holding above 0.1357 would shift focus to 0.1369–0.1374, then 0.1395–0.1403. These moderately sized clusters precede a larger short zone further up.
🎯 Holding above 0.1403 would put 0.1420–0.1435 in focus, with the largest bar around 0.1429. A sustained move above 0.1435 would extend focus to 0.1440–0.1468. A short sweep followed by a drop below 0.1339 would weaken upside continuation.
⚖️ Losing 0.1333 without reclaiming it would shift preference toward a long-liquidation sweep at 0.1311–0.1315. Holding below 0.1311 would bring 0.1298–0.1305 into view, particularly around 0.1303, followed by 0.1283–0.1293.
#LiquidationMap
33
·
--
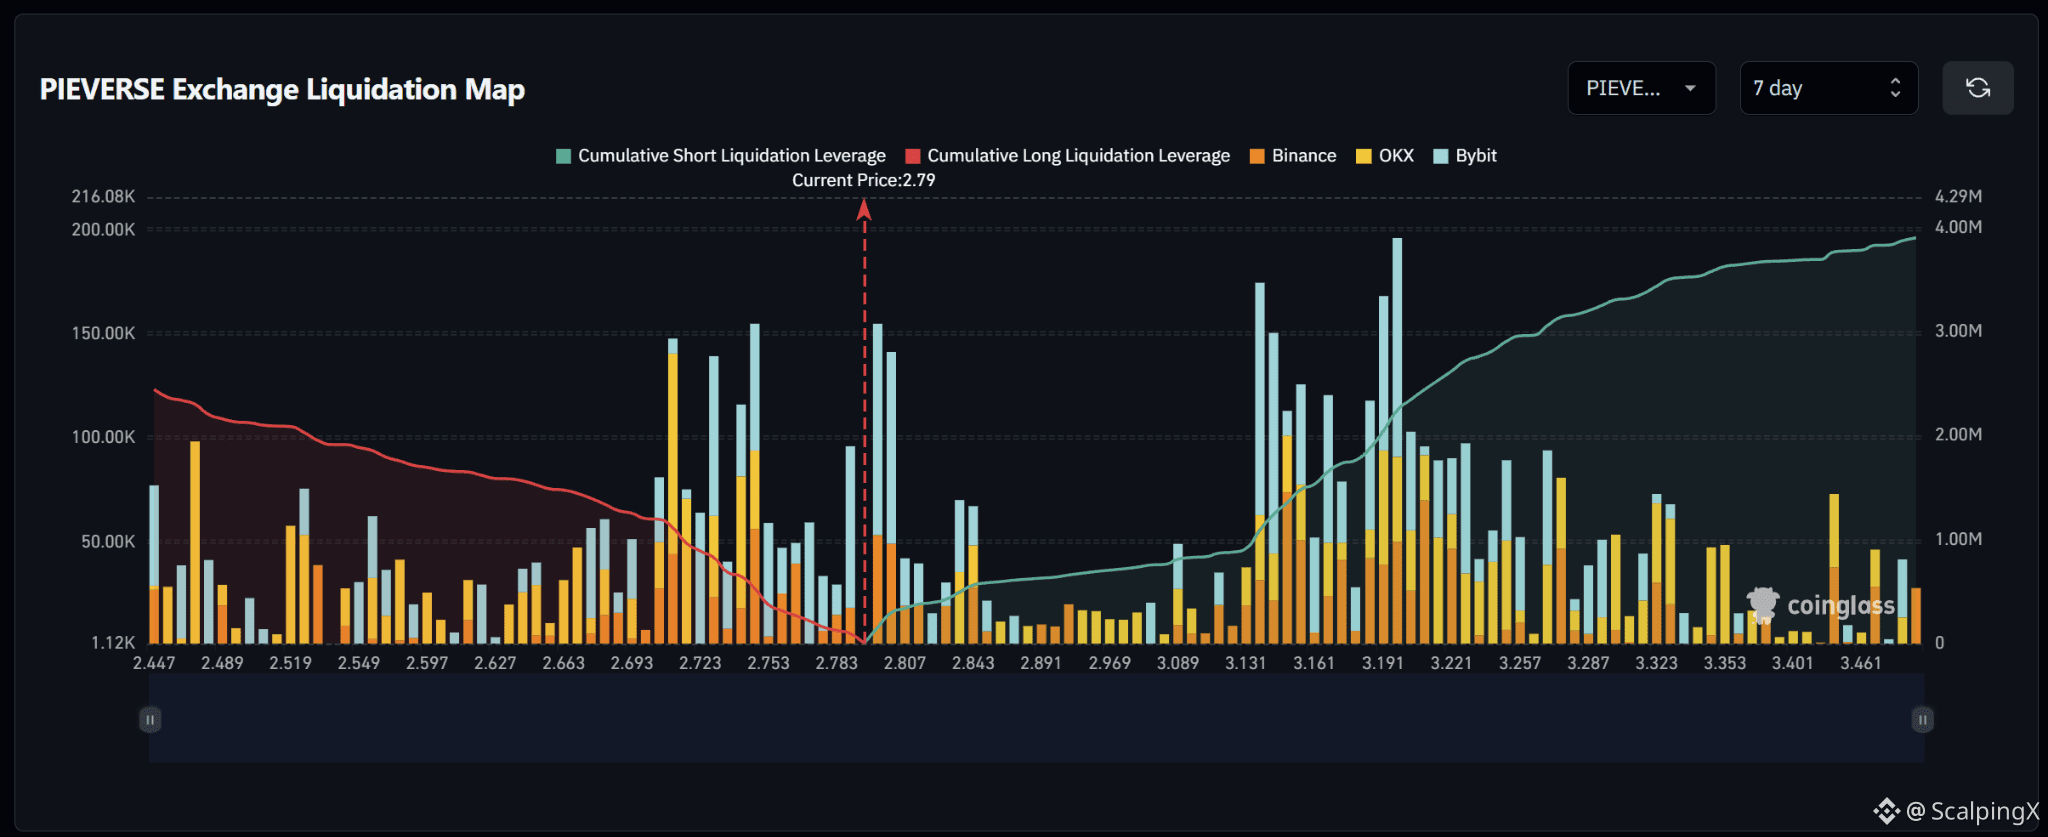
$PIEVERSE – Liquidation Map (7 days) – Index ~2.79
🧭 Favor a short-liquidation sweep at 2.795–2.810. A large bar sits immediately above price, while the nearest opposing long cluster around 2.78–2.79 is smaller.
🔺 Breaking and holding above 2.810 would shift focus to 2.835–2.850. Beyond this zone, liquidation bars decline noticeably and become scattered, without a continuous chain of large clusters.
🎯 The 2.85–3.13 stretch is relatively sparse before the dense short zone at 3.14–3.20, particularly around 3.14 and 3.20. This is a more distant area to watch if price extends higher. Sweeping nearby shorts and falling below 2.79 would weaken upside continuation.
⚖️ Losing 2.783 without reclaiming it would shift preference toward long-liquidation sweeps at 2.750–2.765, then 2.710–2.740. Holding below 2.710 would put 2.675–2.700 in focus; reclaiming 2.79 after a sweep would weaken downside continuation.
#LiquidationMap
$PIEVERSE – Liquidation Map (7 days) – Index ~2.79
🧭 Favor a short-liquidation sweep at 2.795–2.810. A large bar sits immediately above price, while the nearest opposing long cluster around 2.78–2.79 is smaller.
🔺 Breaking and holding above 2.810 would shift focus to 2.835–2.850. Beyond this zone, liquidation bars decline noticeably and become scattered, without a continuous chain of large clusters.
🎯 The 2.85–3.13 stretch is relatively sparse before the dense short zone at 3.14–3.20, particularly around 3.14 and 3.20. This is a more distant area to watch if price extends higher. Sweeping nearby shorts and falling below 2.79 would weaken upside continuation.
⚖️ Losing 2.783 without reclaiming it would shift preference toward long-liquidation sweeps at 2.750–2.765, then 2.710–2.740. Holding below 2.710 would put 2.675–2.700 in focus; reclaiming 2.79 after a sweep would weaken downside continuation.
#LiquidationMap
🧭 Favor a short-liquidation sweep at 2.795–2.810. A large bar sits immediately above price, while the nearest opposing long cluster around 2.78–2.79 is smaller.
🔺 Breaking and holding above 2.810 would shift focus to 2.835–2.850. Beyond this zone, liquidation bars decline noticeably and become scattered, without a continuous chain of large clusters.
🎯 The 2.85–3.13 stretch is relatively sparse before the dense short zone at 3.14–3.20, particularly around 3.14 and 3.20. This is a more distant area to watch if price extends higher. Sweeping nearby shorts and falling below 2.79 would weaken upside continuation.
⚖️ Losing 2.783 without reclaiming it would shift preference toward long-liquidation sweeps at 2.750–2.765, then 2.710–2.740. Holding below 2.710 would put 2.675–2.700 in focus; reclaiming 2.79 after a sweep would weaken downside continuation.
#LiquidationMap
12
·
--
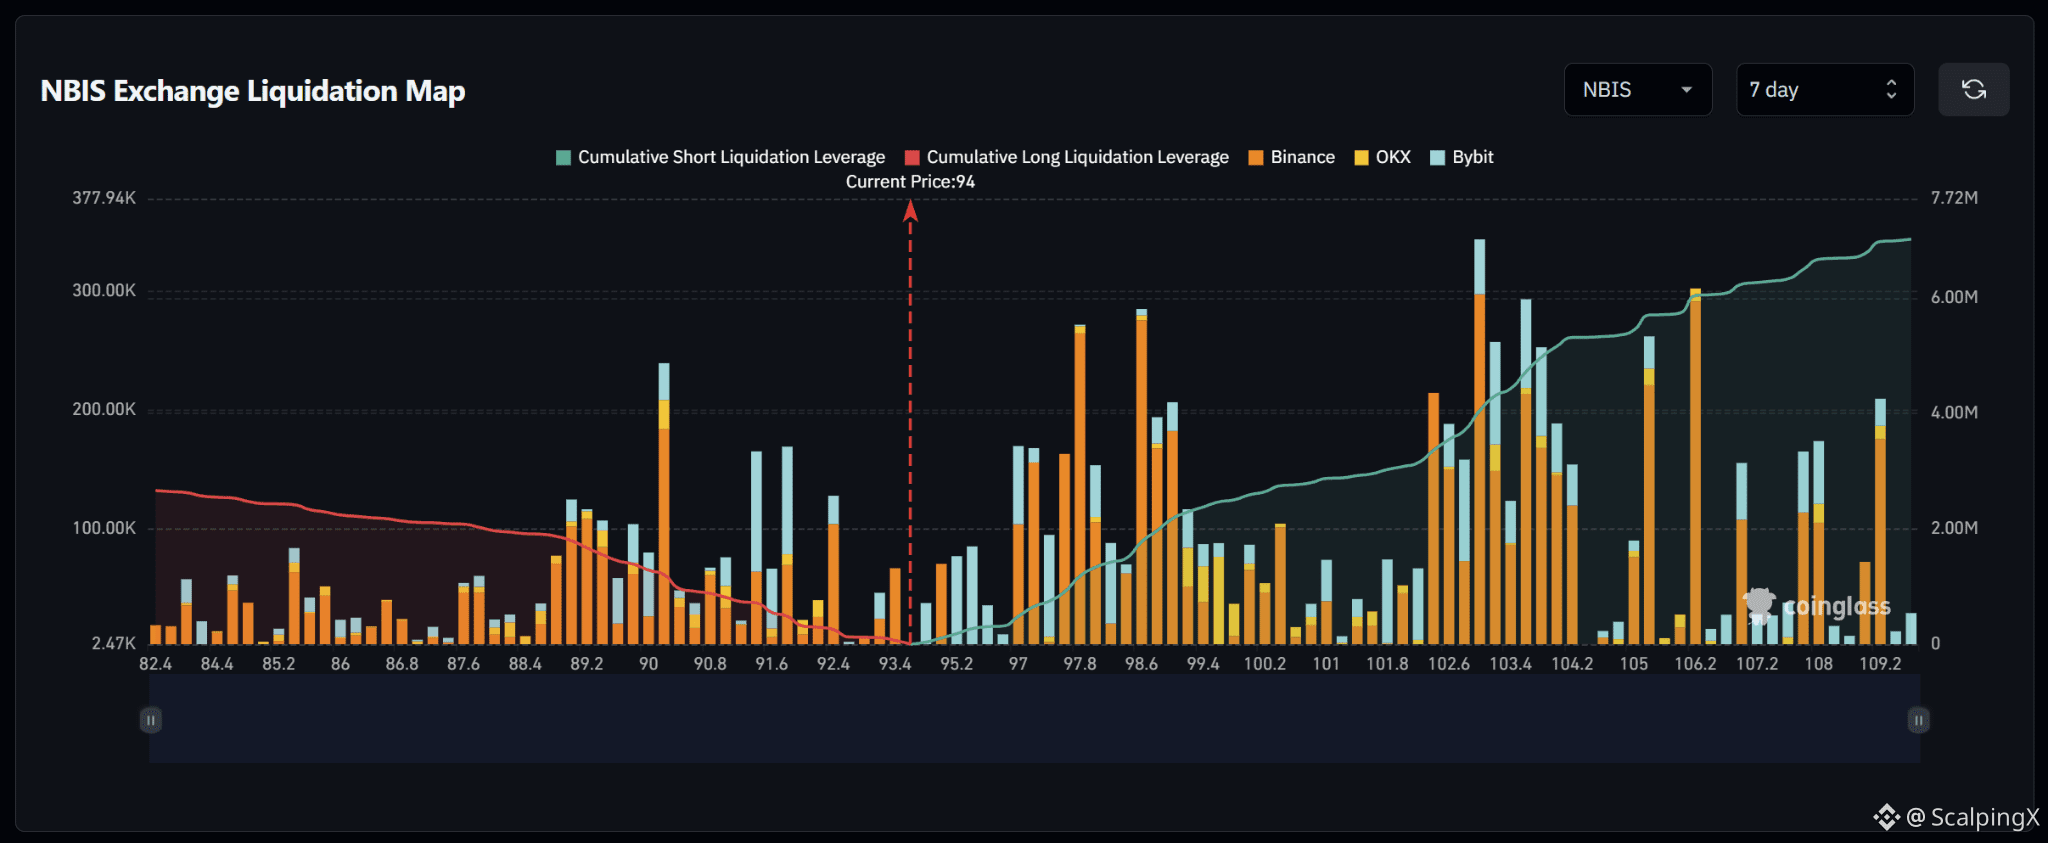
$NBIS – Liquidation Map (7 days) – Index ~94
🧭 Favor a short-liquidation sweep at 94.5–95.4 before an extension toward the larger 97–99 zone. Upside bars gradually increase in size, while longs immediately below price are relatively sparse.
🔺 Breaking and holding above 95.4 would shift focus to 97–99, particularly around 97.8 and 98.6. Holding above 99 would bring smaller clusters at 99.4–100.4 into view.
🎯 The 100.5–102.1 stretch is relatively sparse before the dense short zone at 102.4–104.2, with the largest bar around 103.2. Further clusters sit at 105.2–106.2. A short sweep followed by a drop below 94 would weaken upside continuation.
⚖️ Losing 93.4 without reclaiming it would shift preference toward long-liquidation sweeps at 92.2–92.6, then 91.3–91.9. Holding below 91.3 would put 90.0–90.4 in focus. Reclaiming 94 after a sweep would weaken downside continuation.
#LiquidationMap
$NBIS – Liquidation Map (7 days) – Index ~94
🧭 Favor a short-liquidation sweep at 94.5–95.4 before an extension toward the larger 97–99 zone. Upside bars gradually increase in size, while longs immediately below price are relatively sparse.
🔺 Breaking and holding above 95.4 would shift focus to 97–99, particularly around 97.8 and 98.6. Holding above 99 would bring smaller clusters at 99.4–100.4 into view.
🎯 The 100.5–102.1 stretch is relatively sparse before the dense short zone at 102.4–104.2, with the largest bar around 103.2. Further clusters sit at 105.2–106.2. A short sweep followed by a drop below 94 would weaken upside continuation.
⚖️ Losing 93.4 without reclaiming it would shift preference toward long-liquidation sweeps at 92.2–92.6, then 91.3–91.9. Holding below 91.3 would put 90.0–90.4 in focus. Reclaiming 94 after a sweep would weaken downside continuation.
#LiquidationMap
🧭 Favor a short-liquidation sweep at 94.5–95.4 before an extension toward the larger 97–99 zone. Upside bars gradually increase in size, while longs immediately below price are relatively sparse.
🔺 Breaking and holding above 95.4 would shift focus to 97–99, particularly around 97.8 and 98.6. Holding above 99 would bring smaller clusters at 99.4–100.4 into view.
🎯 The 100.5–102.1 stretch is relatively sparse before the dense short zone at 102.4–104.2, with the largest bar around 103.2. Further clusters sit at 105.2–106.2. A short sweep followed by a drop below 94 would weaken upside continuation.
⚖️ Losing 93.4 without reclaiming it would shift preference toward long-liquidation sweeps at 92.2–92.6, then 91.3–91.9. Holding below 91.3 would put 90.0–90.4 in focus. Reclaiming 94 after a sweep would weaken downside continuation.
#LiquidationMap
7
·
--
Bullish
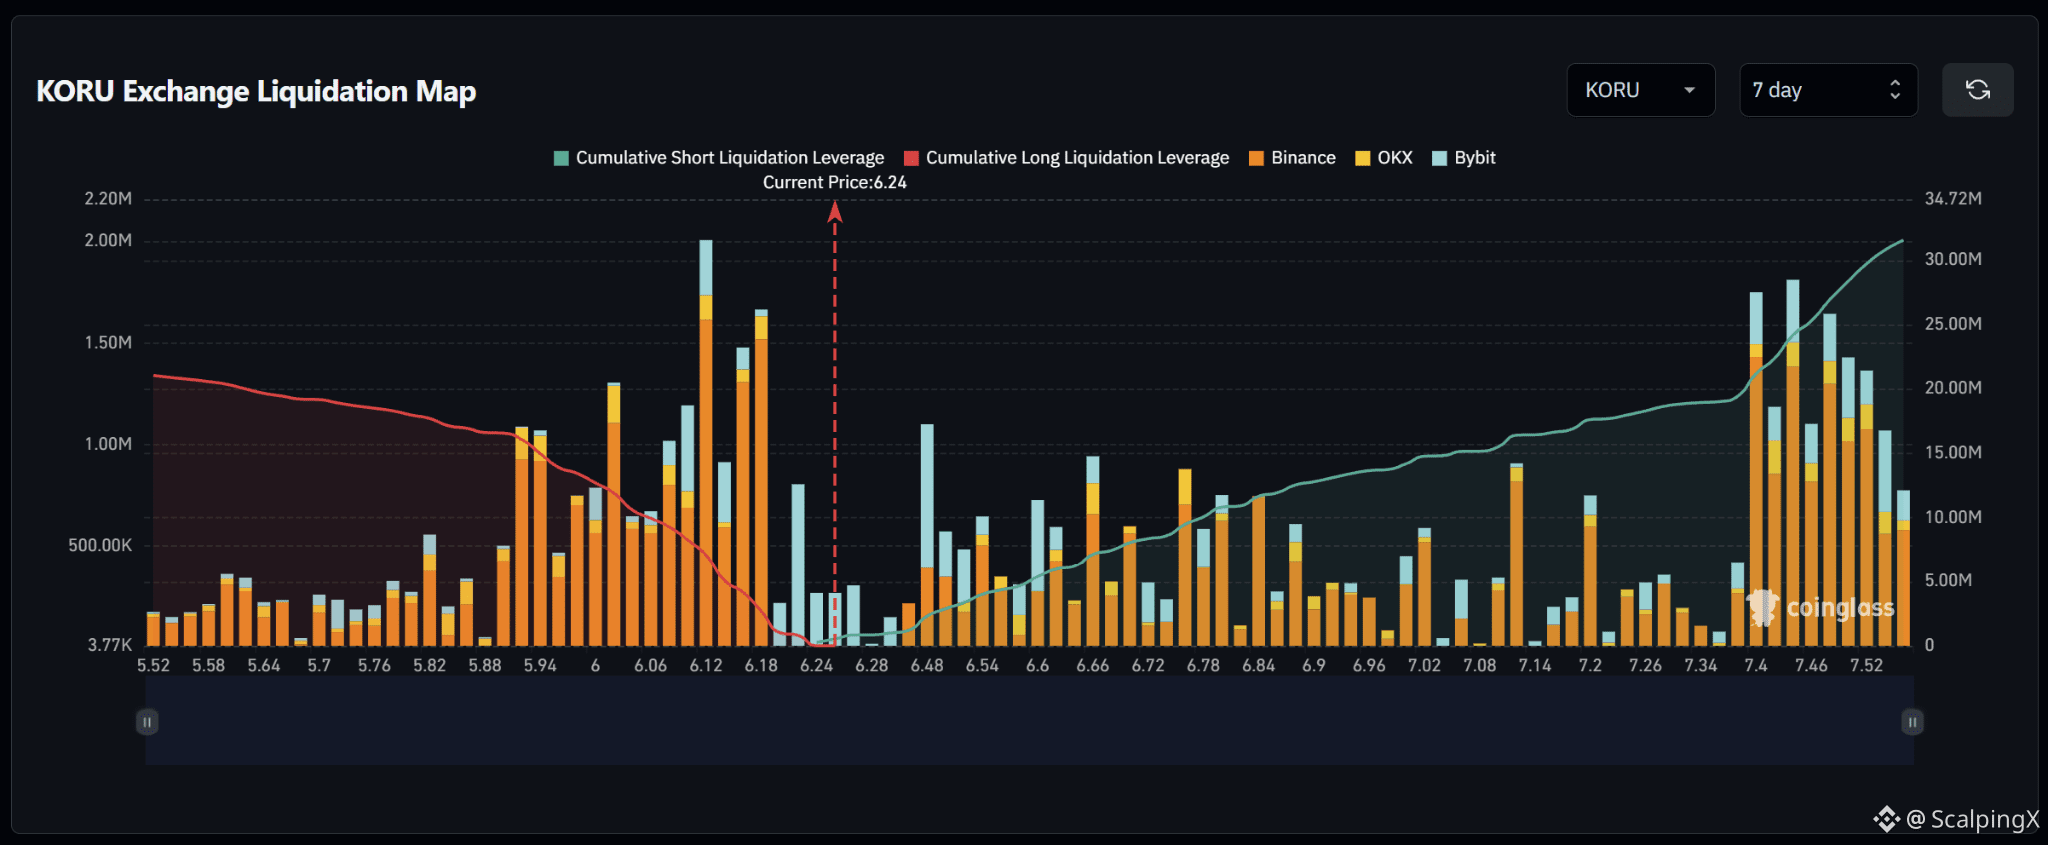
$KORU – Liquidation Map (7 days) – Index ~6.24
🧭 Favor a long-liquidation sweep at 6.18–6.22. Large downside bars sit closer to price than the main short zone at 6.48–6.66, with further long concentrations at 6.10–6.16.
🔻 Losing 6.18 without reclaiming it would shift focus to 6.10–6.16, particularly around 6.12, which contains the largest bar on the map. Holding below 6.10 would bring 6.00–6.08, then 5.92–5.96 into view.
🎯 A long sweep followed by a quick reclaim of 6.24 would weaken downside continuation. Above price, bars are relatively sparse before the large short cluster around 6.48, followed by successive clusters through 6.66.
⚖️ Breaking and holding above 6.48 would shift preference toward short-liquidation sweeps at 6.52–6.66. Holding above 6.66 would put 6.76–6.86 in focus. Further up, 7.40–7.52 contains another concentration of large bars; a short sweep followed by a loss of 6.48 would weaken further upside.
#LiquidationMap
$KORU – Liquidation Map (7 days) – Index ~6.24
🧭 Favor a long-liquidation sweep at 6.18–6.22. Large downside bars sit closer to price than the main short zone at 6.48–6.66, with further long concentrations at 6.10–6.16.
🔻 Losing 6.18 without reclaiming it would shift focus to 6.10–6.16, particularly around 6.12, which contains the largest bar on the map. Holding below 6.10 would bring 6.00–6.08, then 5.92–5.96 into view.
🎯 A long sweep followed by a quick reclaim of 6.24 would weaken downside continuation. Above price, bars are relatively sparse before the large short cluster around 6.48, followed by successive clusters through 6.66.
⚖️ Breaking and holding above 6.48 would shift preference toward short-liquidation sweeps at 6.52–6.66. Holding above 6.66 would put 6.76–6.86 in focus. Further up, 7.40–7.52 contains another concentration of large bars; a short sweep followed by a loss of 6.48 would weaken further upside.
#LiquidationMap
🧭 Favor a long-liquidation sweep at 6.18–6.22. Large downside bars sit closer to price than the main short zone at 6.48–6.66, with further long concentrations at 6.10–6.16.
🔻 Losing 6.18 without reclaiming it would shift focus to 6.10–6.16, particularly around 6.12, which contains the largest bar on the map. Holding below 6.10 would bring 6.00–6.08, then 5.92–5.96 into view.
🎯 A long sweep followed by a quick reclaim of 6.24 would weaken downside continuation. Above price, bars are relatively sparse before the large short cluster around 6.48, followed by successive clusters through 6.66.
⚖️ Breaking and holding above 6.48 would shift preference toward short-liquidation sweeps at 6.52–6.66. Holding above 6.66 would put 6.76–6.86 in focus. Further up, 7.40–7.52 contains another concentration of large bars; a short sweep followed by a loss of 6.48 would weaken further upside.
#LiquidationMap
64
·
--
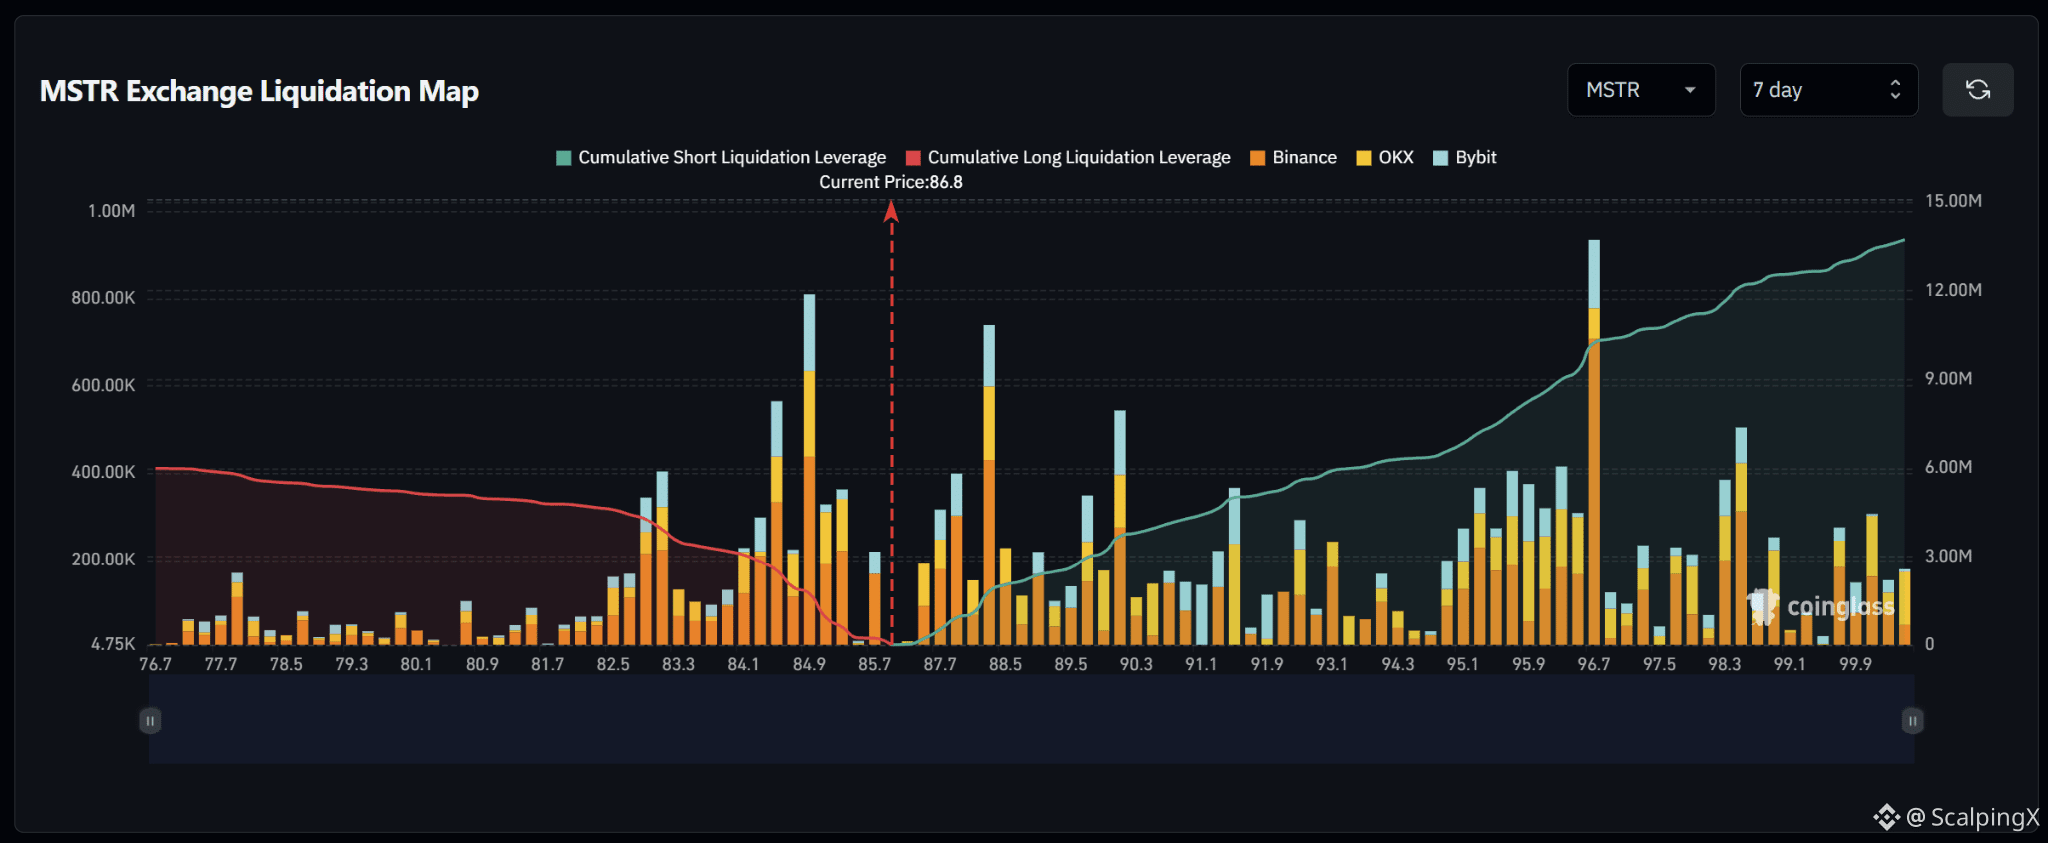
$MSTR – Liquidation Map (7 days) – Index ~86.8
🧭 Favor a short-liquidation sweep at 87.5–88.5, particularly around 88.3. Large bars cluster relatively close above price, while the notable opposing long cluster sits at 85.3–85.7.
🔺 Breaking and holding above 88.5 would shift focus to 89.5–90.2. Holding above 90.2 would bring 91.3–91.7 into view, before liquidation density declines and clusters become more scattered.
🎯 Further up, 95.0–96.7 contains another concentration of large short bars, with the largest bar on the map around 96.7. Sweeping 87.5–88.5 and quickly falling below 86.8 would weaken upside continuation.
⚖️ Losing 85.7 without reclaiming it would shift preference toward a long-liquidation sweep at 84.5–85.3, particularly around 84.9. Holding below 84.5 would put 82.8–83.3 in focus. Reclaiming 86.8 after a sweep would weaken downside continuation.
#LiquidationMap
$MSTR – Liquidation Map (7 days) – Index ~86.8
🧭 Favor a short-liquidation sweep at 87.5–88.5, particularly around 88.3. Large bars cluster relatively close above price, while the notable opposing long cluster sits at 85.3–85.7.
🔺 Breaking and holding above 88.5 would shift focus to 89.5–90.2. Holding above 90.2 would bring 91.3–91.7 into view, before liquidation density declines and clusters become more scattered.
🎯 Further up, 95.0–96.7 contains another concentration of large short bars, with the largest bar on the map around 96.7. Sweeping 87.5–88.5 and quickly falling below 86.8 would weaken upside continuation.
⚖️ Losing 85.7 without reclaiming it would shift preference toward a long-liquidation sweep at 84.5–85.3, particularly around 84.9. Holding below 84.5 would put 82.8–83.3 in focus. Reclaiming 86.8 after a sweep would weaken downside continuation.
#LiquidationMap
🧭 Favor a short-liquidation sweep at 87.5–88.5, particularly around 88.3. Large bars cluster relatively close above price, while the notable opposing long cluster sits at 85.3–85.7.
🔺 Breaking and holding above 88.5 would shift focus to 89.5–90.2. Holding above 90.2 would bring 91.3–91.7 into view, before liquidation density declines and clusters become more scattered.
🎯 Further up, 95.0–96.7 contains another concentration of large short bars, with the largest bar on the map around 96.7. Sweeping 87.5–88.5 and quickly falling below 86.8 would weaken upside continuation.
⚖️ Losing 85.7 without reclaiming it would shift preference toward a long-liquidation sweep at 84.5–85.3, particularly around 84.9. Holding below 84.5 would put 82.8–83.3 in focus. Reclaiming 86.8 after a sweep would weaken downside continuation.
#LiquidationMap
61
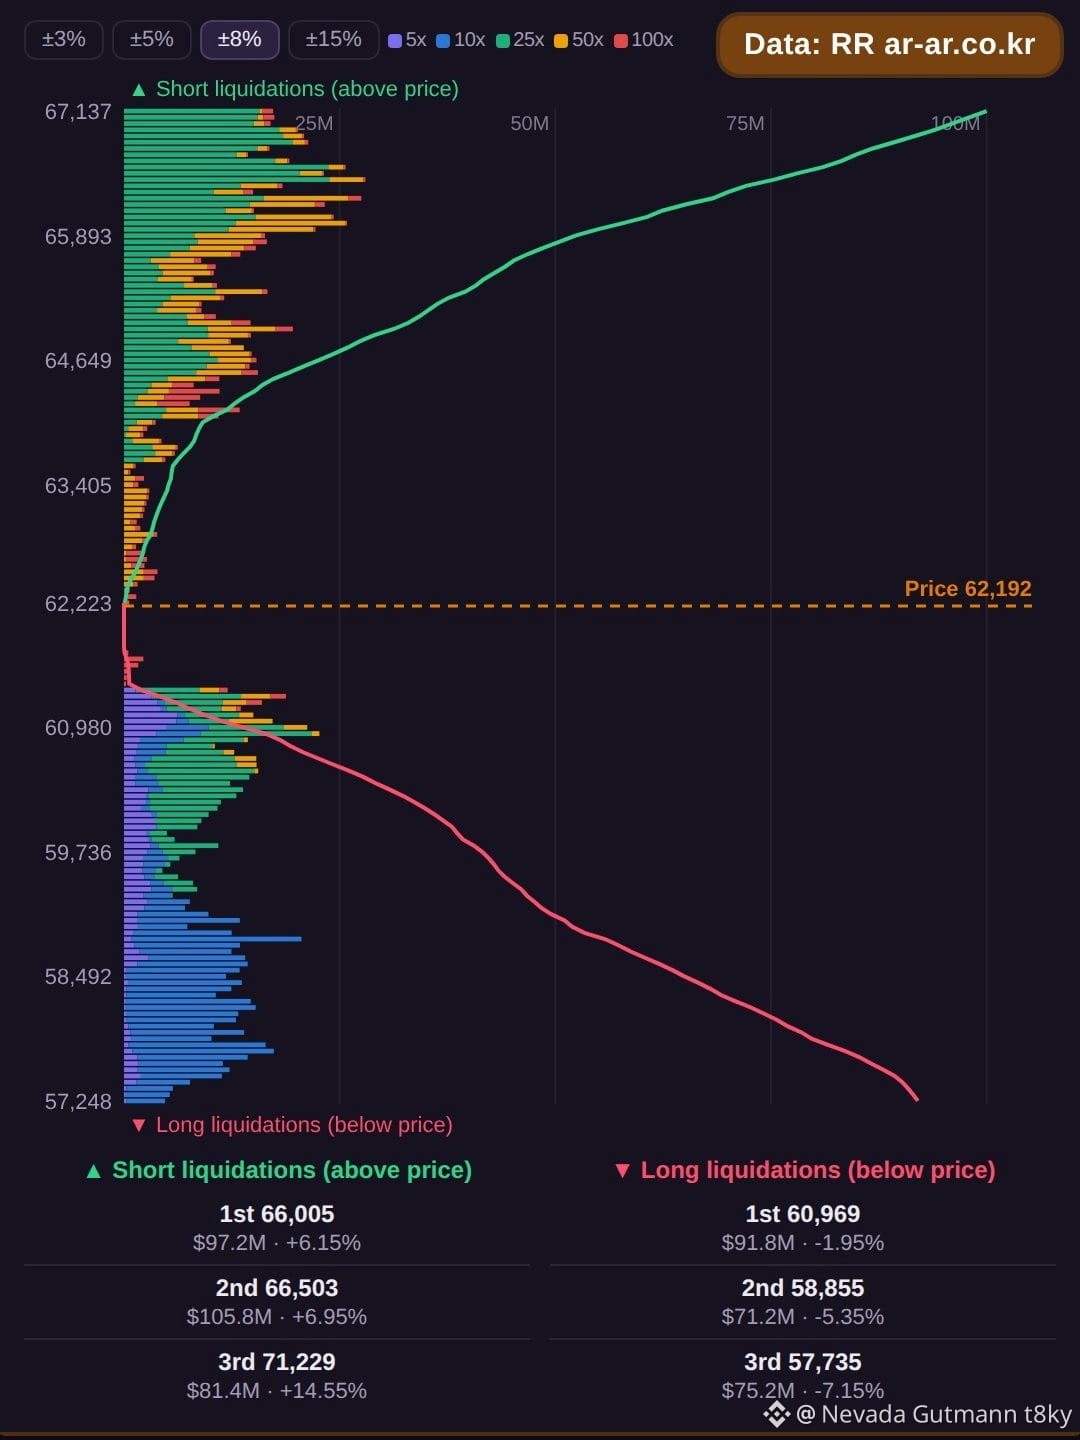
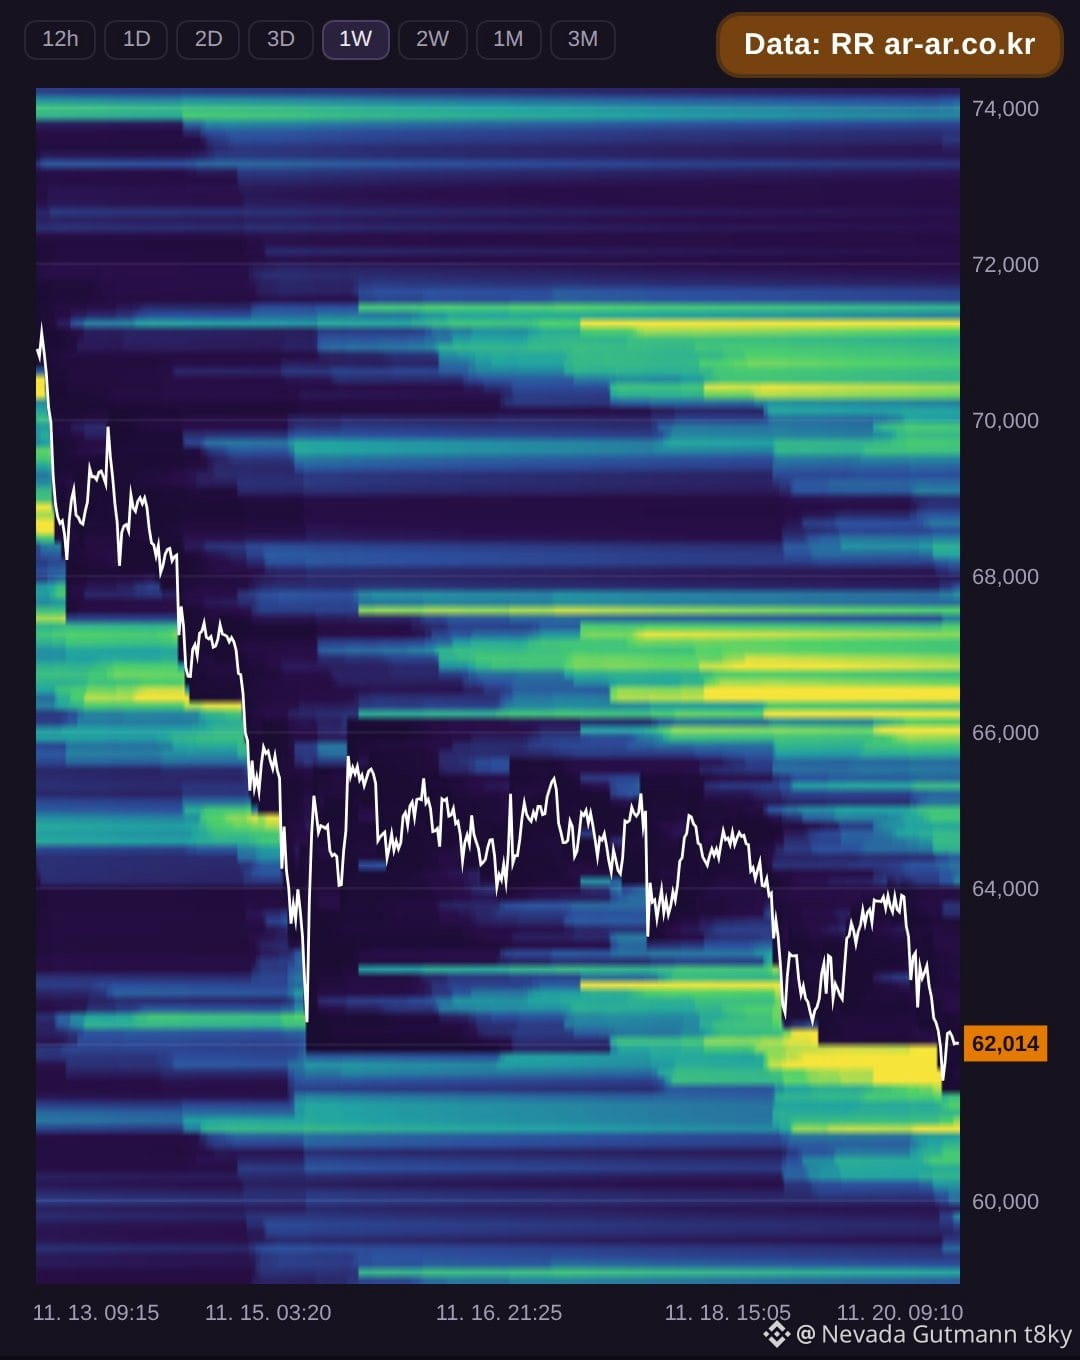
Bitcoin is trading at $62,056 as of 00:30 UTC on Nov 20. The liquidation map shows short positions stacked above current price with significant volume at $65,996 holding about $97.3M, followed by $66,493 with about $104.5M, and $71,209 carrying about $81.8M. Combined, these three short clusters total $283.6M.
Below price, long liquidations sit at $61,280 with about $64.5M, $60,970 holding about $91.7M, and $57,743 with about $74.8M. These three long clusters add up to $231.0M total.
Longs are closer to current price at just -1.25% away, but the larger stack sits on the short side by over fifty million. Traders may watch whether price tests the nearby long levels first or pushes upward toward the heavier short clusters overhead.
Data source: RR (ar-ar.co.kr). Estimated from BTCUSDT futures data. Not financial advice.
#BTC #Bitcoin #LiquidationMap #LiquidationHeatmap
Bitcoin is trading at $62,056 as of 00:30 UTC on Nov 20. The liquidation map shows short positions stacked above current price with significant volume at $65,996 holding about $97.3M, followed by $66,493 with about $104.5M, and $71,209 carrying about $81.8M. Combined, these three short clusters total $283.6M.
Below price, long liquidations sit at $61,280 with about $64.5M, $60,970 holding about $91.7M, and $57,743 with about $74.8M. These three long clusters add up to $231.0M total.
Longs are closer to current price at just -1.25% away, but the larger stack sits on the short side by over fifty million. Traders may watch whether price tests the nearby long levels first or pushes upward toward the heavier short clusters overhead.
Data source: RR (ar-ar.co.kr). Estimated from BTCUSDT futures data. Not financial advice.
#BTC #Bitcoin #LiquidationMap #LiquidationHeatmap
Below price, long liquidations sit at $61,280 with about $64.5M, $60,970 holding about $91.7M, and $57,743 with about $74.8M. These three long clusters add up to $231.0M total.
Longs are closer to current price at just -1.25% away, but the larger stack sits on the short side by over fifty million. Traders may watch whether price tests the nearby long levels first or pushes upward toward the heavier short clusters overhead.
Data source: RR (ar-ar.co.kr). Estimated from BTCUSDT futures data. Not financial advice.
#BTC #Bitcoin #LiquidationMap #LiquidationHeatmap
99

·
--
Bullish
🚨 $EVAA : SHORT LIQUIDITY IS BUILDING ABOVE!
$EVAA has made a strong rally, but the liquidation map is revealing an interesting opportunity.
Here's what the liquidity data shows:
🔴 Short Liquidation Zone
$5.28 — Around $1.5M
Short Magnet Strength: 20.9
🟢 Long Liquidation Zones
$4.91 — Around $1.3M
$4.61 — Around $1.1M
Long Magnet Strength: 9.6
What's Next for $EVAA?
After this sharp rally, the market could move in either direction.
If bullish momentum continues, $EVAA could push toward $5.28 to sweep short liquidity.
However, if buying pressure weakens, price could pull back toward $4.91 or even $4.61 to test long liquidity.
My Focus: Watch how price reacts around these key liquidity zones before taking a position.
Which comes first — $5.28 or a pullback to $4.91?
#EVAA #Crypto #LiquidationMap #Trading #Binance
🚨 $EVAA : SHORT LIQUIDITY IS BUILDING ABOVE!
$EVAA has made a strong rally, but the liquidation map is revealing an interesting opportunity.
Here's what the liquidity data shows:
🔴 Short Liquidation Zone
$5.28 — Around $1.5M
Short Magnet Strength: 20.9
🟢 Long Liquidation Zones
$4.91 — Around $1.3M
$4.61 — Around $1.1M
Long Magnet Strength: 9.6
What's Next for $EVAA ?
After this sharp rally, the market could move in either direction.
If bullish momentum continues, $EVAA could push toward $5.28 to sweep short liquidity.
However, if buying pressure weakens, price could pull back toward $4.91 or even $4.61 to test long liquidity.
My Focus: Watch how price reacts around these key liquidity zones before taking a position.
Which comes first — $5.28 or a pullback to $4.91?
#EVAA #Crypto #LiquidationMap #Trading #Binance
$EVAA has made a strong rally, but the liquidation map is revealing an interesting opportunity.
Here's what the liquidity data shows:
🔴 Short Liquidation Zone
$5.28 — Around $1.5M
Short Magnet Strength: 20.9
🟢 Long Liquidation Zones
$4.91 — Around $1.3M
$4.61 — Around $1.1M
Long Magnet Strength: 9.6
What's Next for $EVAA ?
After this sharp rally, the market could move in either direction.
If bullish momentum continues, $EVAA could push toward $5.28 to sweep short liquidity.
However, if buying pressure weakens, price could pull back toward $4.91 or even $4.61 to test long liquidity.
My Focus: Watch how price reacts around these key liquidity zones before taking a position.
Which comes first — $5.28 or a pullback to $4.91?
#EVAA #Crypto #LiquidationMap #Trading #Binance
28
·
--
Bullish
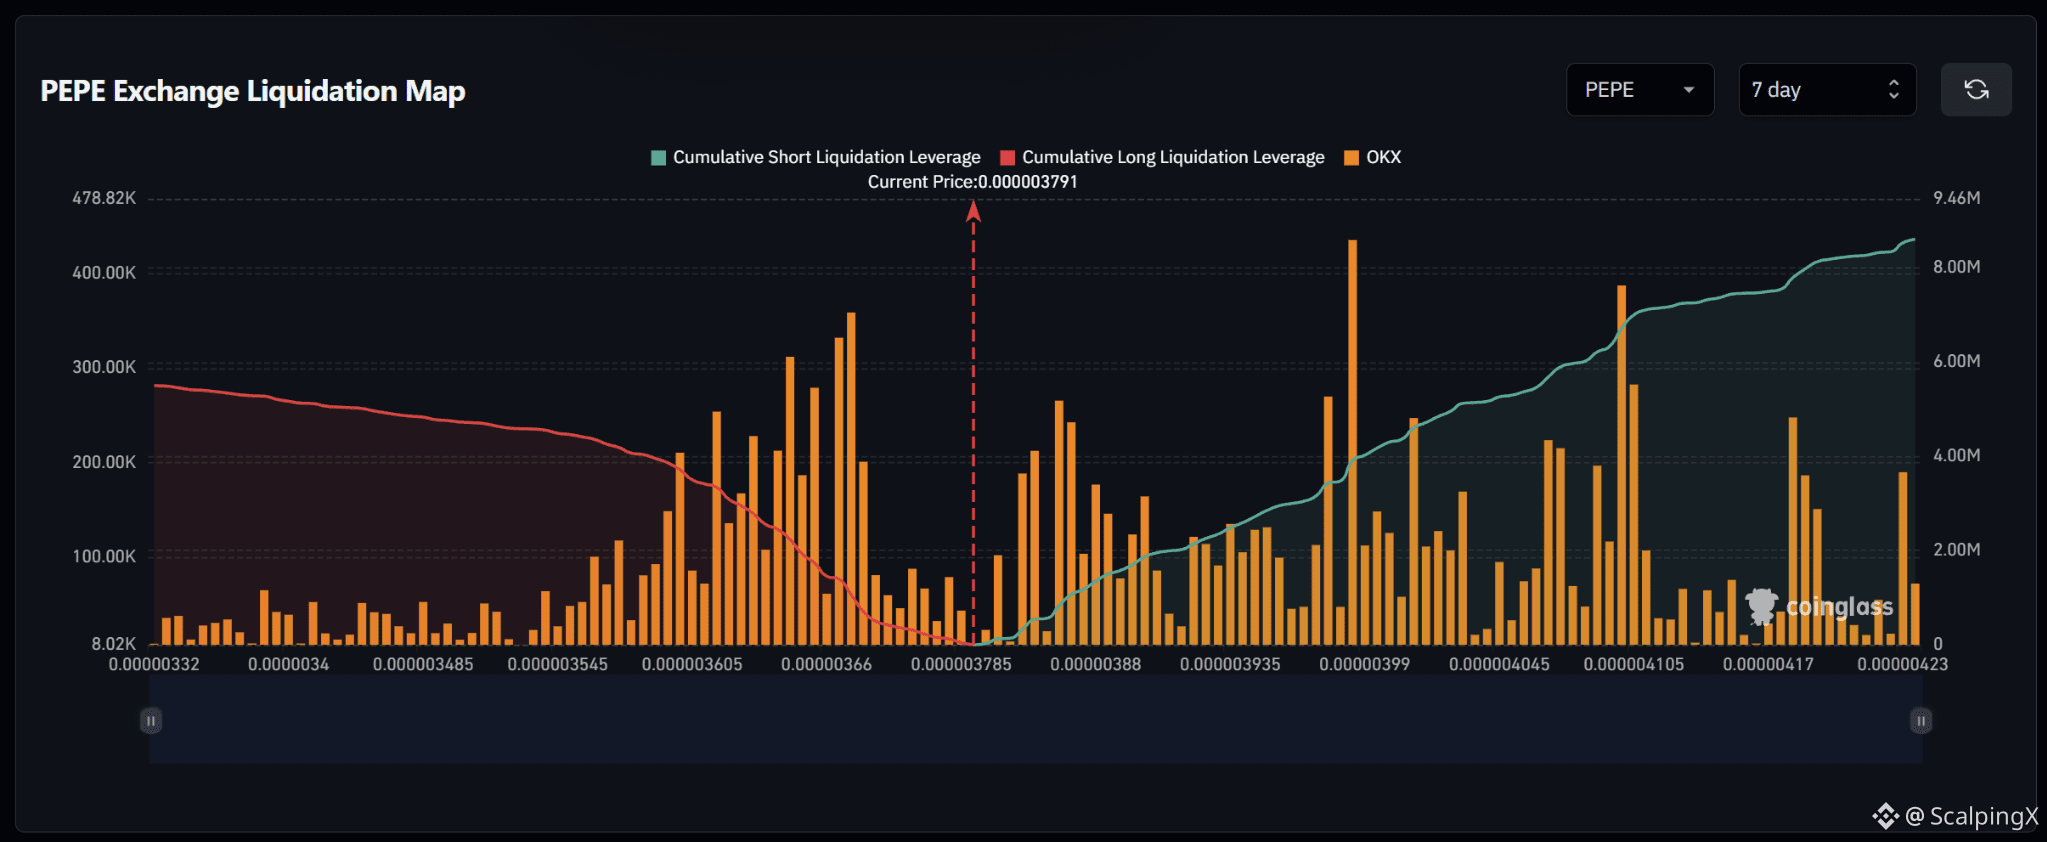
$PEPE – Liquidation Map (7 days) – Index ~0.000003791
🧭 Favor a short-liquidation sweep at 0.00000382–0.00000388. Nearby upside bars are larger than the long cluster immediately below at 0.00000376–0.00000378.
🔺 Breaking and holding above 0.00000388 would shift focus to 0.00000393–0.00000400. The largest short bar on the map stands out around 0.00000398.
🎯 Holding above 0.00000400 would bring 0.00000408–0.00000411 into view. The 0.00000412–0.00000416 stretch is sparse before 0.00000418–0.00000419. A short sweep followed by a drop below 0.000003791 would weaken upside continuation.
⚖️ Losing 0.000003785 without reclaiming it would shift preference toward long-liquidation sweeps at 0.00000374–0.00000377. Holding below 0.00000374 would put the larger 0.00000365–0.00000370 zone in focus; reclaiming 0.000003791 after a sweep would weaken downside continuation.
#LiquidationMap
$PEPE – Liquidation Map (7 days) – Index ~0.000003791
🧭 Favor a short-liquidation sweep at 0.00000382–0.00000388. Nearby upside bars are larger than the long cluster immediately below at 0.00000376–0.00000378.
🔺 Breaking and holding above 0.00000388 would shift focus to 0.00000393–0.00000400. The largest short bar on the map stands out around 0.00000398.
🎯 Holding above 0.00000400 would bring 0.00000408–0.00000411 into view. The 0.00000412–0.00000416 stretch is sparse before 0.00000418–0.00000419. A short sweep followed by a drop below 0.000003791 would weaken upside continuation.
⚖️ Losing 0.000003785 without reclaiming it would shift preference toward long-liquidation sweeps at 0.00000374–0.00000377. Holding below 0.00000374 would put the larger 0.00000365–0.00000370 zone in focus; reclaiming 0.000003791 after a sweep would weaken downside continuation.
#LiquidationMap
🧭 Favor a short-liquidation sweep at 0.00000382–0.00000388. Nearby upside bars are larger than the long cluster immediately below at 0.00000376–0.00000378.
🔺 Breaking and holding above 0.00000388 would shift focus to 0.00000393–0.00000400. The largest short bar on the map stands out around 0.00000398.
🎯 Holding above 0.00000400 would bring 0.00000408–0.00000411 into view. The 0.00000412–0.00000416 stretch is sparse before 0.00000418–0.00000419. A short sweep followed by a drop below 0.000003791 would weaken upside continuation.
⚖️ Losing 0.000003785 without reclaiming it would shift preference toward long-liquidation sweeps at 0.00000374–0.00000377. Holding below 0.00000374 would put the larger 0.00000365–0.00000370 zone in focus; reclaiming 0.000003791 after a sweep would weaken downside continuation.
#LiquidationMap
17
·
--
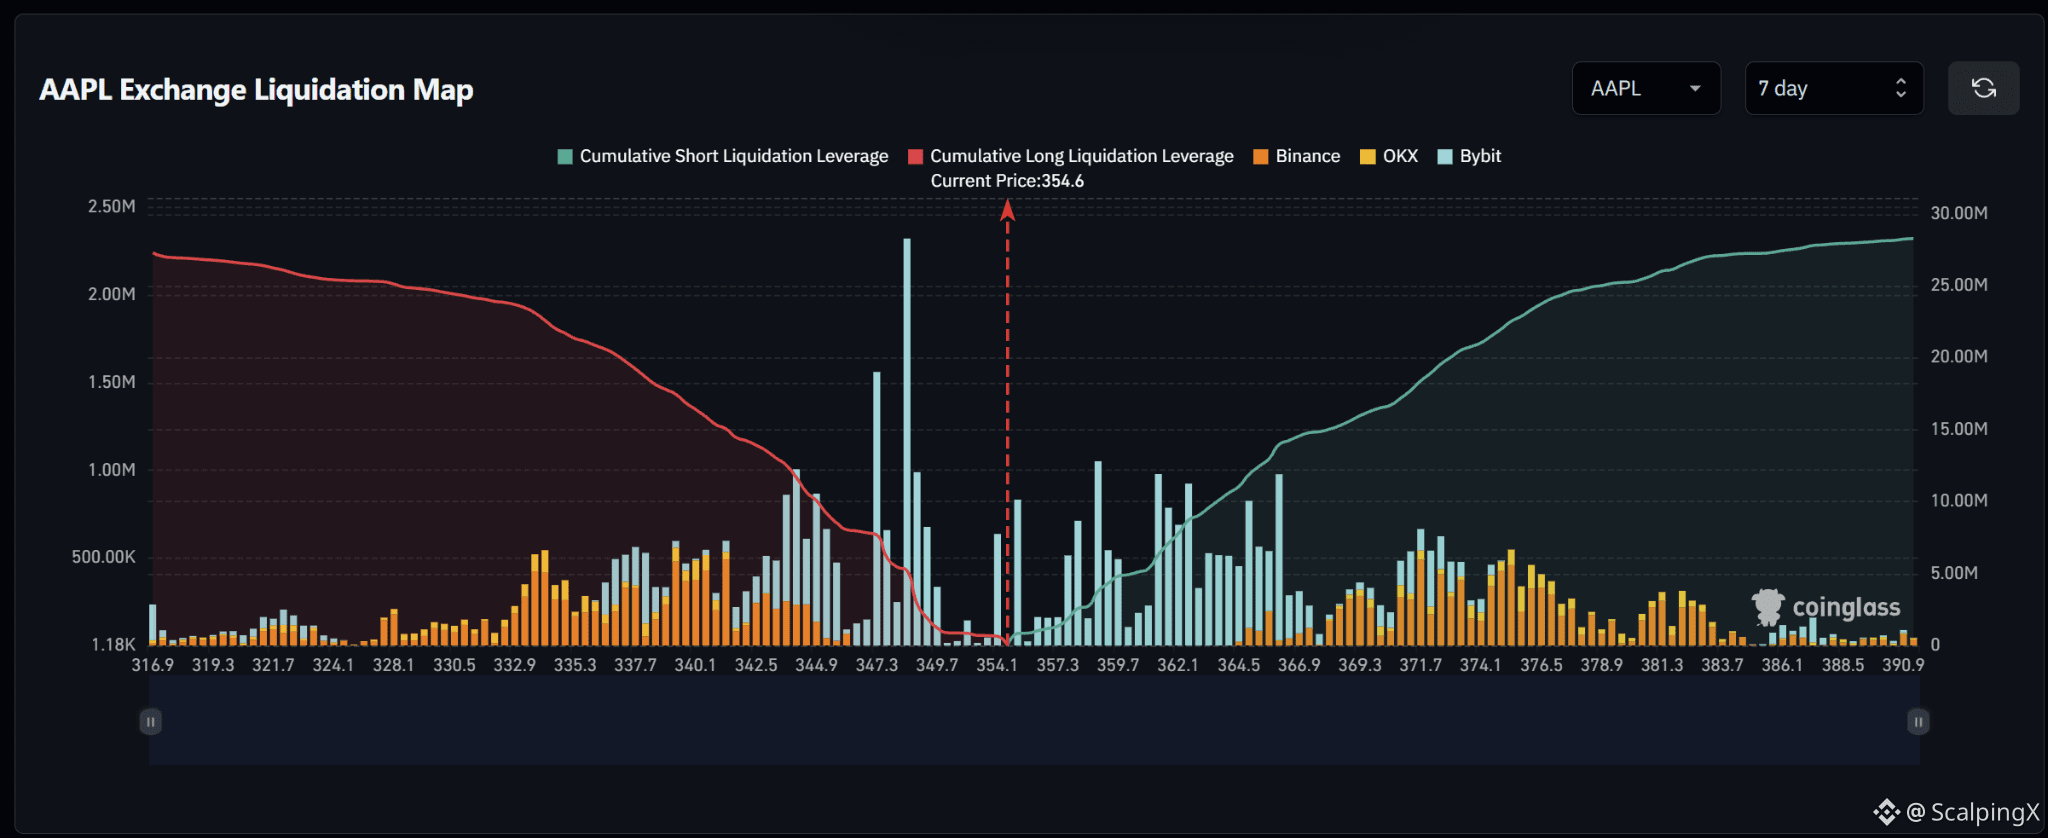
$AAPL – Liquidation Map (7 days) – Index ~354.6
🧭 Favor a short-liquidation sweep at 355–359. Large bars sit relatively close above price, while the most prominent long cluster lies further below at 347–349.
🔺 Breaking and holding above 359 would shift focus to 361–363, then 364.5–366.0. These short zones contain several consecutive large bars, making price retention after each sweep relevant.
🎯 Holding above 366 would bring 370.5–372.5, then 374–377 into view. Liquidation density drops noticeably above 384. Sweeping the initial clusters and quickly falling below 354.6 would weaken upside continuation.
⚖️ Losing 354.1 without reclaiming it would shift preference toward long liquidations at 347–349, with a relatively sparse stretch at 350–353. This zone contains the largest long bar, around 348.5. Holding below 347 would put 344–345.5 in focus; reclaiming 354.6 after a sweep would weaken downside continuation.
#LiquidationMap
$AAPL – Liquidation Map (7 days) – Index ~354.6
🧭 Favor a short-liquidation sweep at 355–359. Large bars sit relatively close above price, while the most prominent long cluster lies further below at 347–349.
🔺 Breaking and holding above 359 would shift focus to 361–363, then 364.5–366.0. These short zones contain several consecutive large bars, making price retention after each sweep relevant.
🎯 Holding above 366 would bring 370.5–372.5, then 374–377 into view. Liquidation density drops noticeably above 384. Sweeping the initial clusters and quickly falling below 354.6 would weaken upside continuation.
⚖️ Losing 354.1 without reclaiming it would shift preference toward long liquidations at 347–349, with a relatively sparse stretch at 350–353. This zone contains the largest long bar, around 348.5. Holding below 347 would put 344–345.5 in focus; reclaiming 354.6 after a sweep would weaken downside continuation.
#LiquidationMap
🧭 Favor a short-liquidation sweep at 355–359. Large bars sit relatively close above price, while the most prominent long cluster lies further below at 347–349.
🔺 Breaking and holding above 359 would shift focus to 361–363, then 364.5–366.0. These short zones contain several consecutive large bars, making price retention after each sweep relevant.
🎯 Holding above 366 would bring 370.5–372.5, then 374–377 into view. Liquidation density drops noticeably above 384. Sweeping the initial clusters and quickly falling below 354.6 would weaken upside continuation.
⚖️ Losing 354.1 without reclaiming it would shift preference toward long liquidations at 347–349, with a relatively sparse stretch at 350–353. This zone contains the largest long bar, around 348.5. Holding below 347 would put 344–345.5 in focus; reclaiming 354.6 after a sweep would weaken downside continuation.
#LiquidationMap
13
·
--
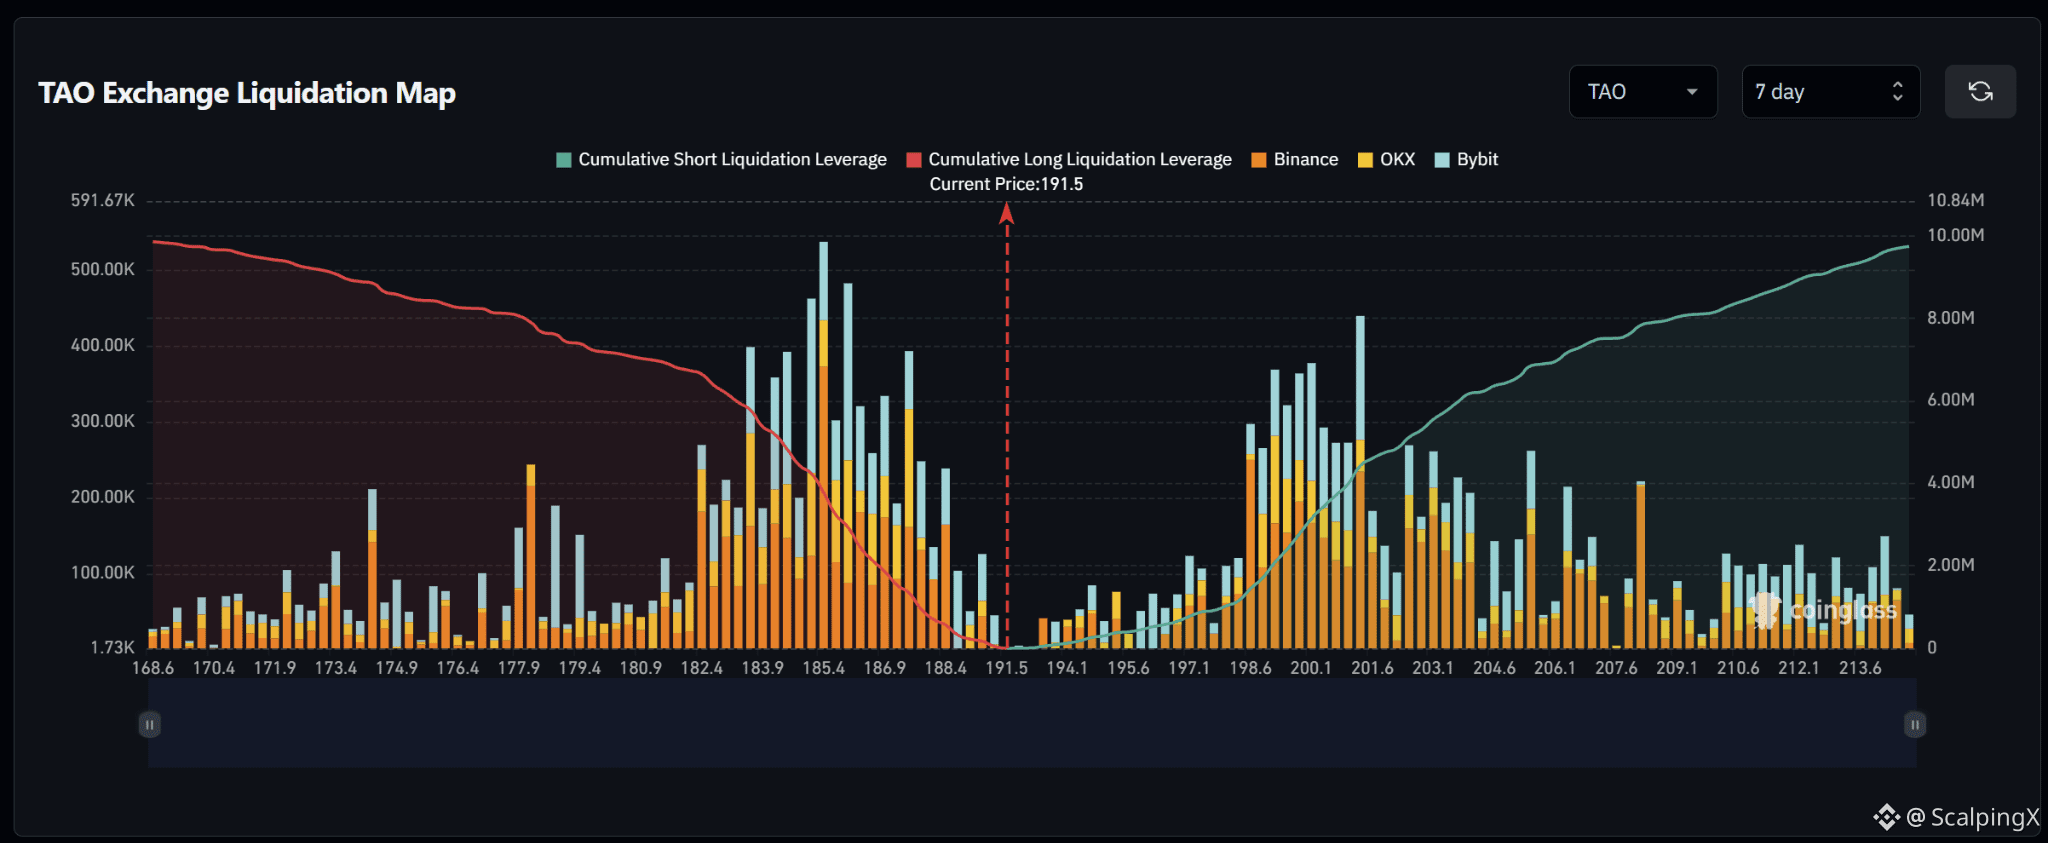
$TAO – Liquidation Map (7 days) – Index ~191.5
🧭 Favor a long-liquidation sweep at 188.4–190.5. Downside clusters sit closer to price than the major short zone at 198.6–201.6, while cumulative exposure is relatively balanced between the two sides.
🔻 Losing 188.4 without reclaiming it would shift focus to 186.0–187.5, then 184.0–185.8. The latter contains several large bars, particularly around 185.4. Holding below 184.0 would bring 182.4–183.4 into view.
🎯 A long sweep followed by a quick reclaim of 191.5 would weaken downside continuation. Above price, 192–196.5 is relatively sparse, with short bars starting to increase around 197.
⚖️ Breaking and holding above 197.5 would shift preference toward a short-liquidation sweep at 198.6–201.6, particularly around 199–200 and 201.3. Holding above 201.6 would put 202.5–204.0 in focus, followed by scattered clusters at 206.1–208.3.
#LiquidationMap
$TAO – Liquidation Map (7 days) – Index ~191.5
🧭 Favor a long-liquidation sweep at 188.4–190.5. Downside clusters sit closer to price than the major short zone at 198.6–201.6, while cumulative exposure is relatively balanced between the two sides.
🔻 Losing 188.4 without reclaiming it would shift focus to 186.0–187.5, then 184.0–185.8. The latter contains several large bars, particularly around 185.4. Holding below 184.0 would bring 182.4–183.4 into view.
🎯 A long sweep followed by a quick reclaim of 191.5 would weaken downside continuation. Above price, 192–196.5 is relatively sparse, with short bars starting to increase around 197.
⚖️ Breaking and holding above 197.5 would shift preference toward a short-liquidation sweep at 198.6–201.6, particularly around 199–200 and 201.3. Holding above 201.6 would put 202.5–204.0 in focus, followed by scattered clusters at 206.1–208.3.
#LiquidationMap
🧭 Favor a long-liquidation sweep at 188.4–190.5. Downside clusters sit closer to price than the major short zone at 198.6–201.6, while cumulative exposure is relatively balanced between the two sides.
🔻 Losing 188.4 without reclaiming it would shift focus to 186.0–187.5, then 184.0–185.8. The latter contains several large bars, particularly around 185.4. Holding below 184.0 would bring 182.4–183.4 into view.
🎯 A long sweep followed by a quick reclaim of 191.5 would weaken downside continuation. Above price, 192–196.5 is relatively sparse, with short bars starting to increase around 197.
⚖️ Breaking and holding above 197.5 would shift preference toward a short-liquidation sweep at 198.6–201.6, particularly around 199–200 and 201.3. Holding above 201.6 would put 202.5–204.0 in focus, followed by scattered clusters at 206.1–208.3.
#LiquidationMap
1
28
·
--
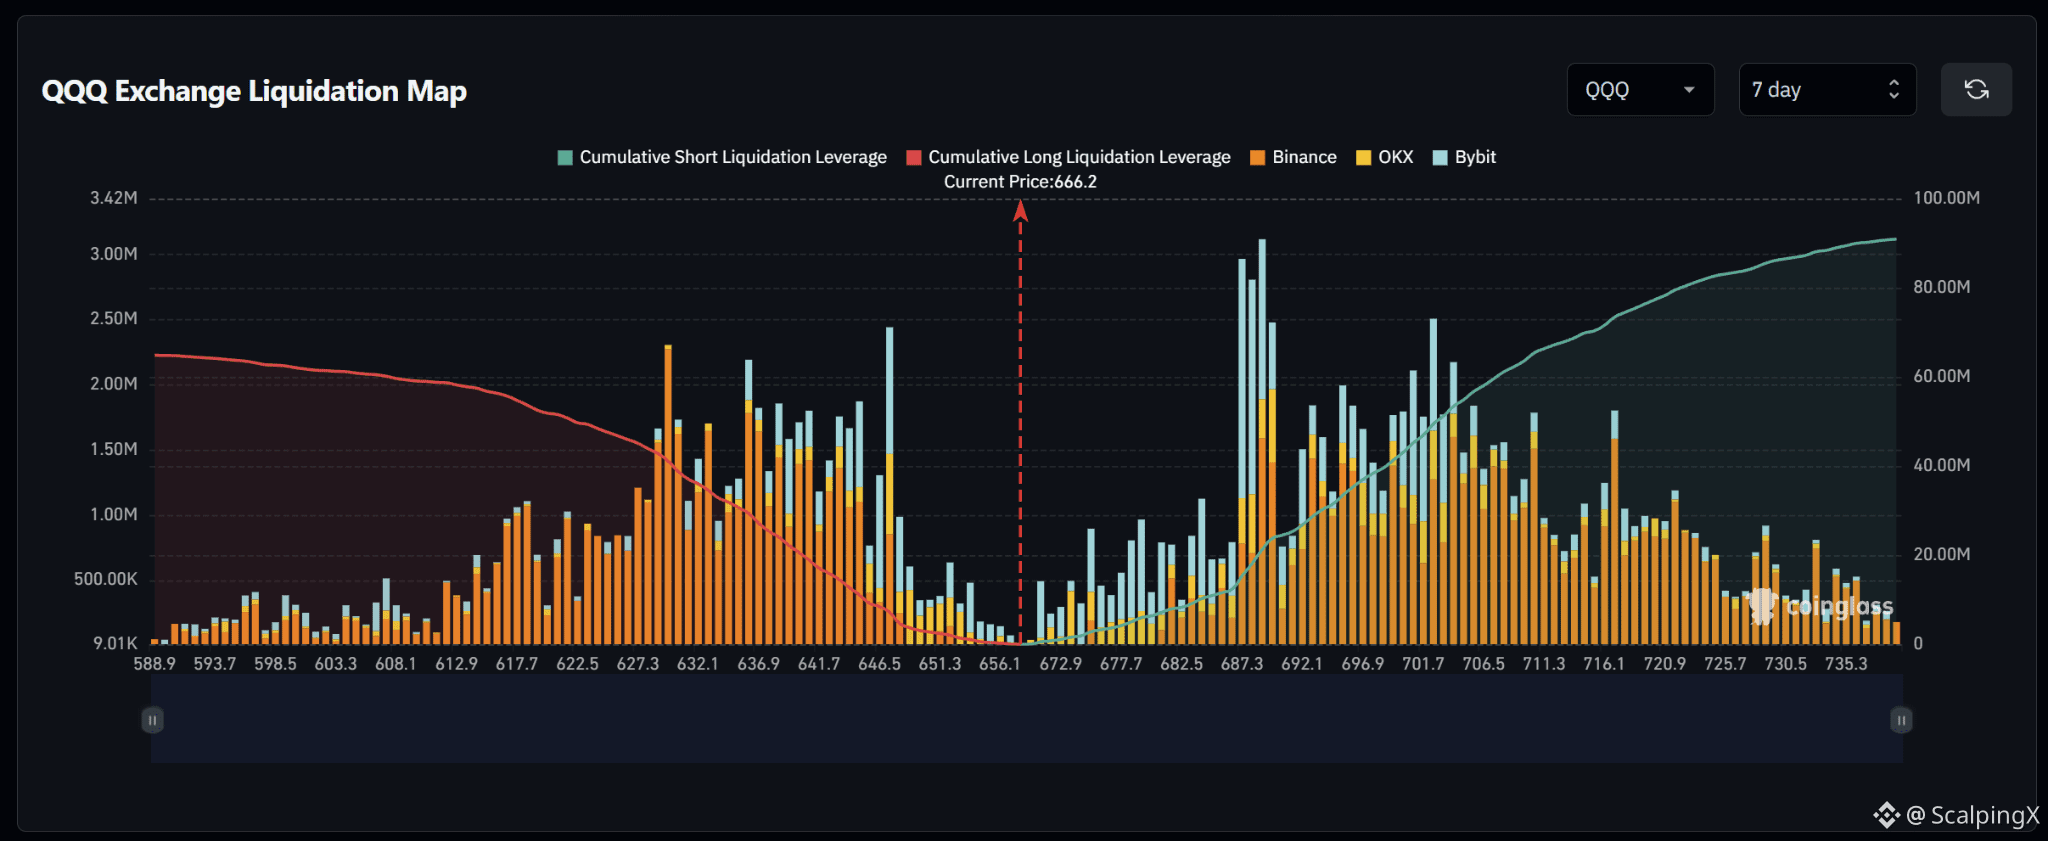
$QQQ – Liquidation Map (7 days) – Index ~666.2
🧭 Favor a short-liquidation sweep at 670–680. Upside clusters gradually increase in size, while longs immediately below price are relatively sparse. The most prominent short zone sits at 687–690.
🔺 Breaking and holding above 680 would shift focus to 683–690, with the largest bar around 689. Holding above 690 would bring 693–705 into view, another zone containing several large bars.
🎯 Above 705, the next notable clusters sit at 707–711 and 716–721. Bar sizes decline noticeably above 725. Sweeping the initial clusters and quickly falling below 666.2 would weaken upside continuation.
⚖️ Losing 665 without reclaiming it would shift preference toward long-liquidation sweeps at 658–662, then 650–655. Holding below 650 would put the larger 640–647 zone in focus. Reclaiming 666.2 after a sweep would weaken downside continuation.
#LiquidationMap
$QQQ – Liquidation Map (7 days) – Index ~666.2
🧭 Favor a short-liquidation sweep at 670–680. Upside clusters gradually increase in size, while longs immediately below price are relatively sparse. The most prominent short zone sits at 687–690.
🔺 Breaking and holding above 680 would shift focus to 683–690, with the largest bar around 689. Holding above 690 would bring 693–705 into view, another zone containing several large bars.
🎯 Above 705, the next notable clusters sit at 707–711 and 716–721. Bar sizes decline noticeably above 725. Sweeping the initial clusters and quickly falling below 666.2 would weaken upside continuation.
⚖️ Losing 665 without reclaiming it would shift preference toward long-liquidation sweeps at 658–662, then 650–655. Holding below 650 would put the larger 640–647 zone in focus. Reclaiming 666.2 after a sweep would weaken downside continuation.
#LiquidationMap
🧭 Favor a short-liquidation sweep at 670–680. Upside clusters gradually increase in size, while longs immediately below price are relatively sparse. The most prominent short zone sits at 687–690.
🔺 Breaking and holding above 680 would shift focus to 683–690, with the largest bar around 689. Holding above 690 would bring 693–705 into view, another zone containing several large bars.
🎯 Above 705, the next notable clusters sit at 707–711 and 716–721. Bar sizes decline noticeably above 725. Sweeping the initial clusters and quickly falling below 666.2 would weaken upside continuation.
⚖️ Losing 665 without reclaiming it would shift preference toward long-liquidation sweeps at 658–662, then 650–655. Holding below 650 would put the larger 640–647 zone in focus. Reclaiming 666.2 after a sweep would weaken downside continuation.
#LiquidationMap
14
·
--
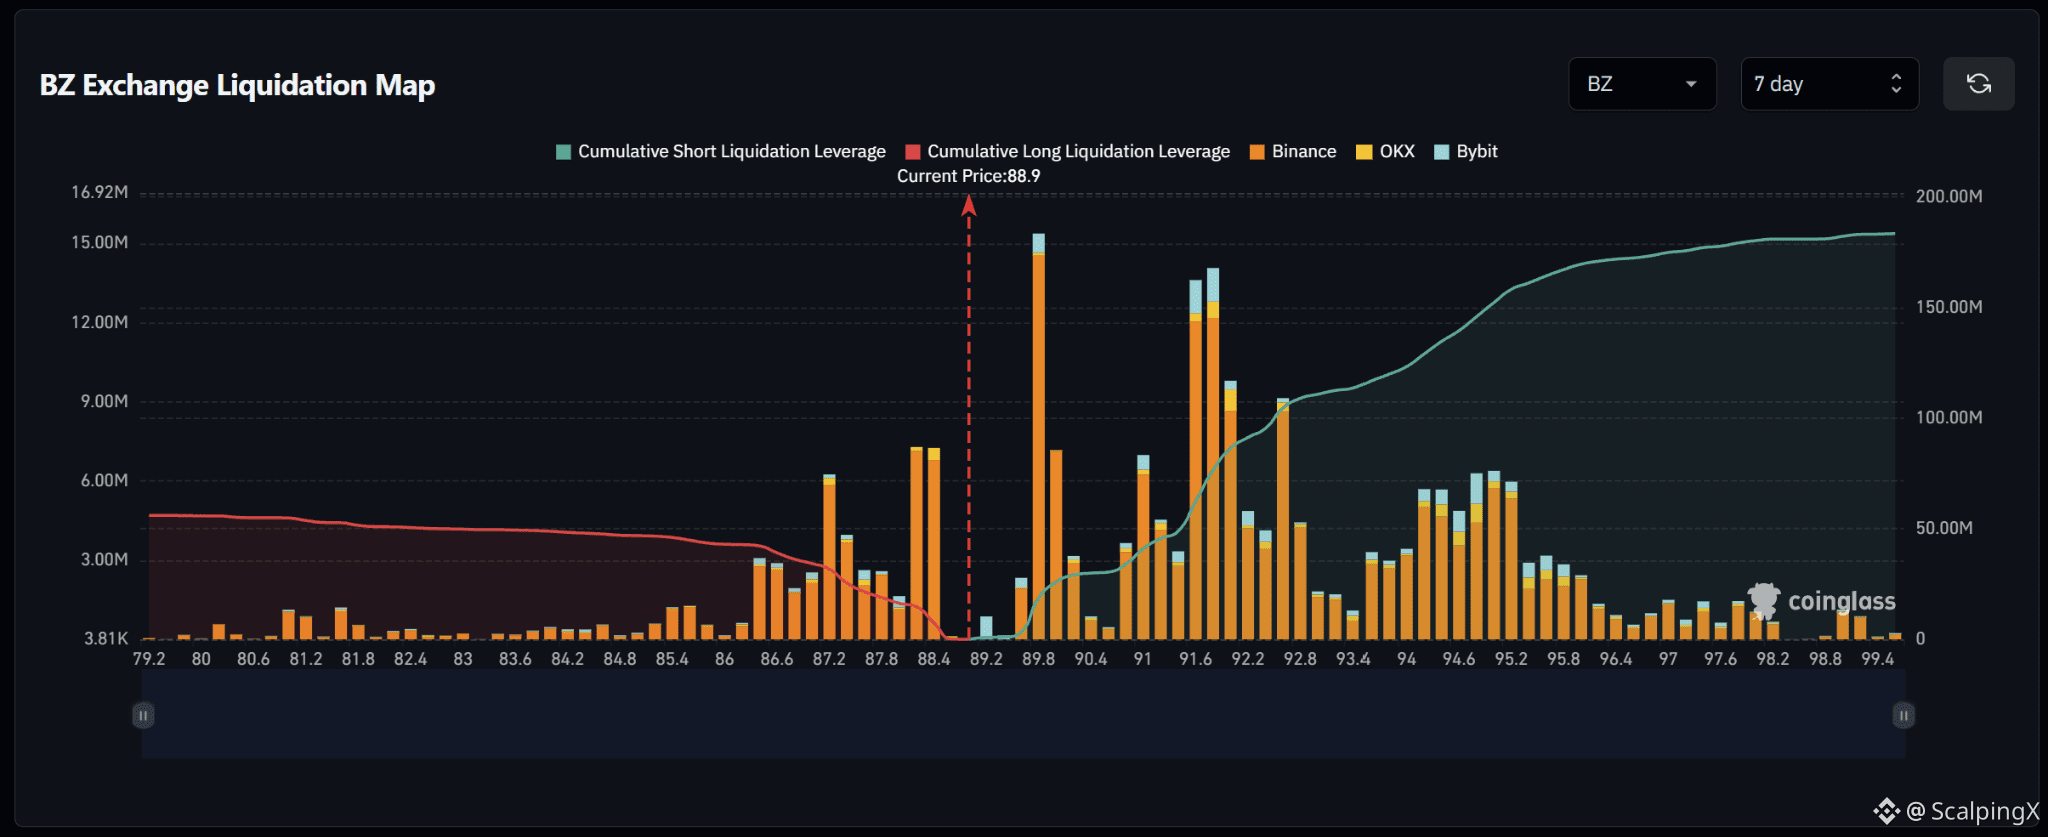
$BZ – Liquidation Map (7 days) – Index ~88.9
🧭 Favor a short-liquidation sweep at 89.6–90.0. The bar around 89.8 is the largest on the map and sits relatively close to price. Below, 88.2–88.4 is the notable opposing long cluster.
🔺 Breaking and holding above 90.0 would shift focus to 90.8–91.2, then 91.6–92.0. The latter contains several large short bars, particularly around 91.6–91.8.
🎯 Holding above 92.0 would bring 92.6–92.8 into view, followed further up by 94.2–95.2, with a relatively sparse stretch at 93.0–93.4. Sweeping 89.6–90.0 and quickly falling below 88.9 would weaken upside continuation.
⚖️ Losing 88.9 without reclaiming it would shift preference toward a long-liquidation sweep at 88.2–88.4. Holding below 88.2 would put 87.2–87.8, then 86.4–87.0 in focus. Reclaiming 88.9 after a sweep would weaken downside continuation.
#LiquidationMap
$BZ – Liquidation Map (7 days) – Index ~88.9
🧭 Favor a short-liquidation sweep at 89.6–90.0. The bar around 89.8 is the largest on the map and sits relatively close to price. Below, 88.2–88.4 is the notable opposing long cluster.
🔺 Breaking and holding above 90.0 would shift focus to 90.8–91.2, then 91.6–92.0. The latter contains several large short bars, particularly around 91.6–91.8.
🎯 Holding above 92.0 would bring 92.6–92.8 into view, followed further up by 94.2–95.2, with a relatively sparse stretch at 93.0–93.4. Sweeping 89.6–90.0 and quickly falling below 88.9 would weaken upside continuation.
⚖️ Losing 88.9 without reclaiming it would shift preference toward a long-liquidation sweep at 88.2–88.4. Holding below 88.2 would put 87.2–87.8, then 86.4–87.0 in focus. Reclaiming 88.9 after a sweep would weaken downside continuation.
#LiquidationMap
🧭 Favor a short-liquidation sweep at 89.6–90.0. The bar around 89.8 is the largest on the map and sits relatively close to price. Below, 88.2–88.4 is the notable opposing long cluster.
🔺 Breaking and holding above 90.0 would shift focus to 90.8–91.2, then 91.6–92.0. The latter contains several large short bars, particularly around 91.6–91.8.
🎯 Holding above 92.0 would bring 92.6–92.8 into view, followed further up by 94.2–95.2, with a relatively sparse stretch at 93.0–93.4. Sweeping 89.6–90.0 and quickly falling below 88.9 would weaken upside continuation.
⚖️ Losing 88.9 without reclaiming it would shift preference toward a long-liquidation sweep at 88.2–88.4. Holding below 88.2 would put 87.2–87.8, then 86.4–87.0 in focus. Reclaiming 88.9 after a sweep would weaken downside continuation.
#LiquidationMap
104
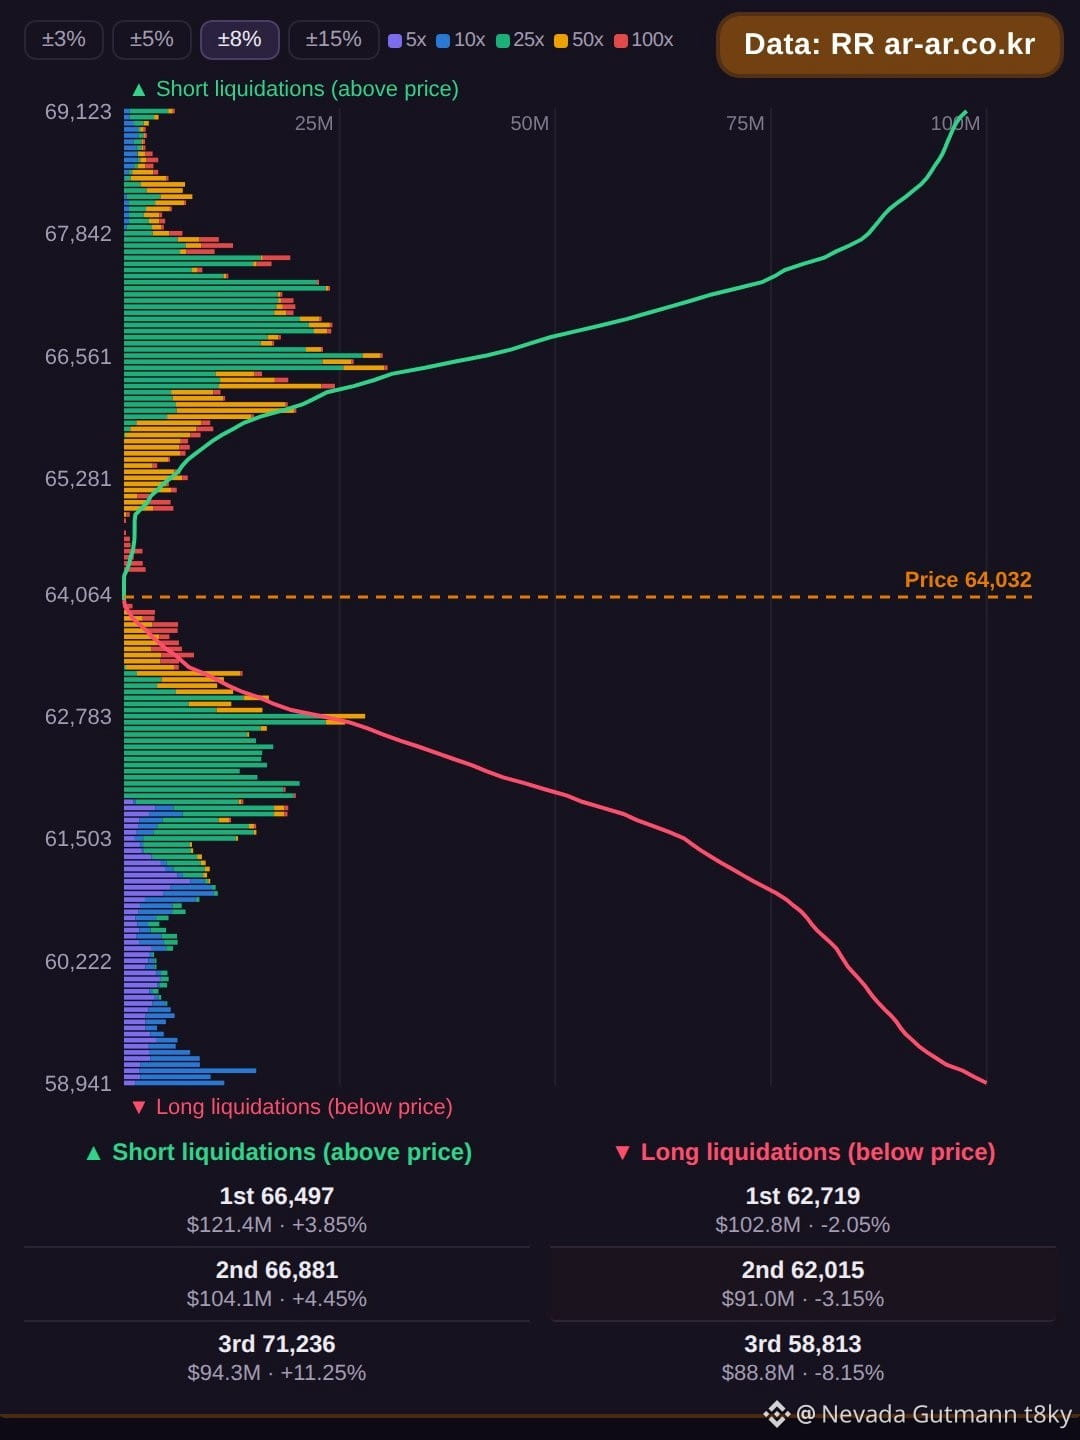
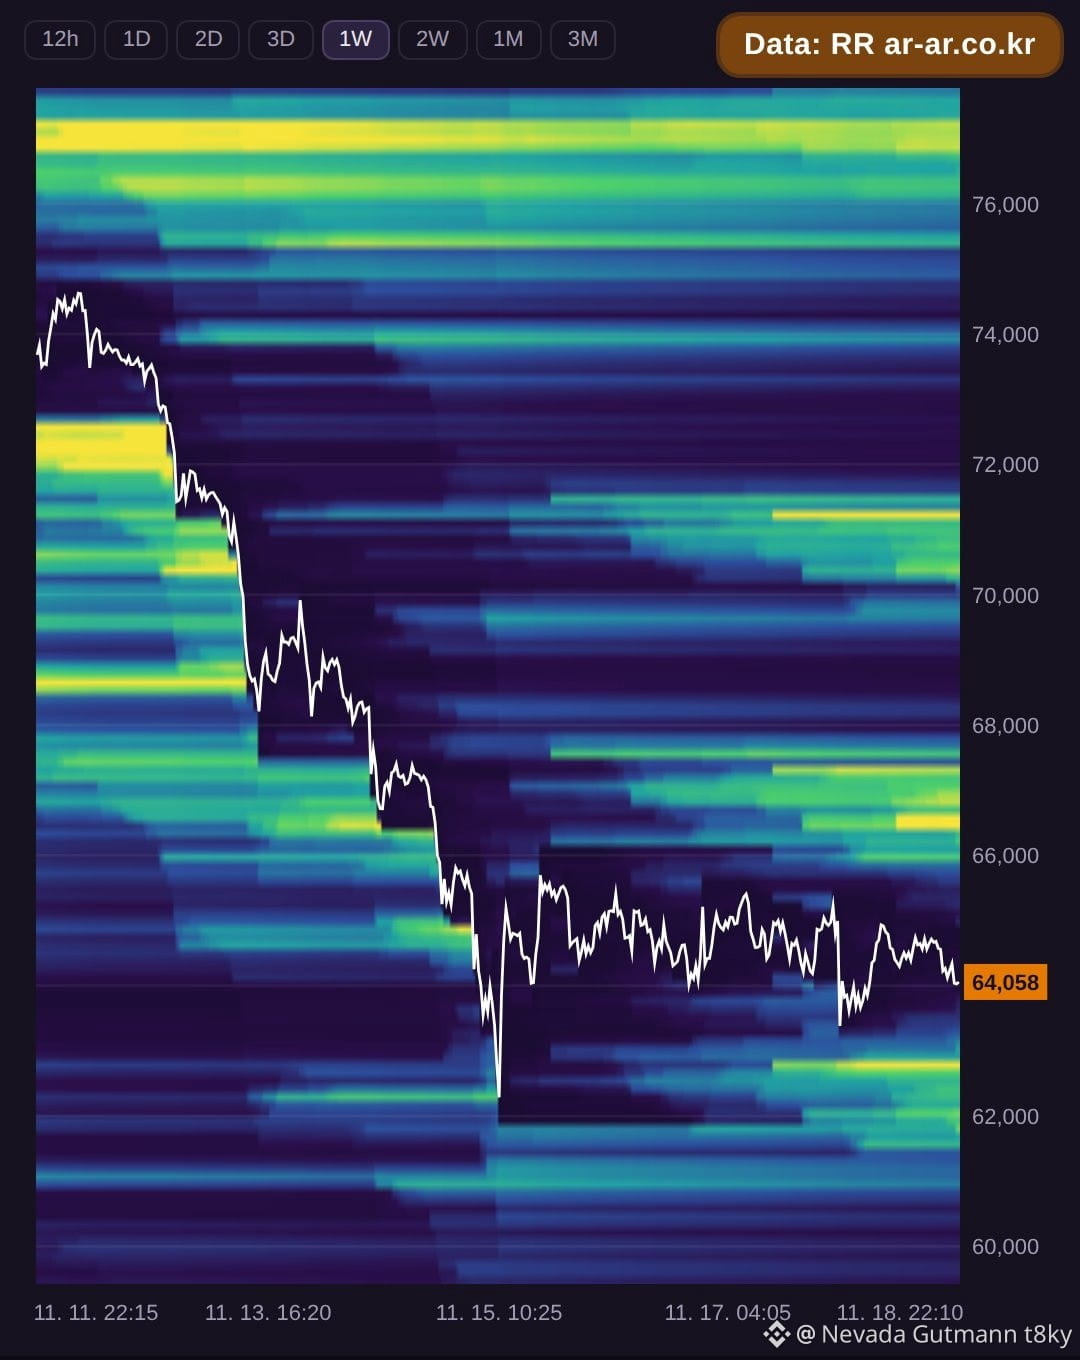
Bitcoin is trading at $64,057 as of 13:30 UTC on November 18. The liquidation map shows substantial short positions stacked above current price. The nearest cluster sits at $66,523, about $123.9M in size and +3.85% away. Further up, another $105.2M is clustered at $66,908, then $95.6M at $71,200. These three short clusters total $324.8M.
Below price, long liquidations are building at $62,744 with roughly $101.5M at risk, just -2.05% down. Additional longs are positioned at $62,039 with $90.2M and at $58,836 with $85.9M. The three long clusters add up to $277.6M.
Longs are closer to current price, but the larger stack is on the short side. Traders may watch whether price tests the nearby long levels first or pushes upward into the heavier short concentration above.
Data source: RR (ar-ar.co.kr). Estimated from BTCUSDT futures data. Not financial advice.
#BTC #Bitcoin #LiquidationMap #LiquidationHeatmap
Bitcoin is trading at $64,057 as of 13:30 UTC on November 18. The liquidation map shows substantial short positions stacked above current price. The nearest cluster sits at $66,523, about $123.9M in size and +3.85% away. Further up, another $105.2M is clustered at $66,908, then $95.6M at $71,200. These three short clusters total $324.8M.
Below price, long liquidations are building at $62,744 with roughly $101.5M at risk, just -2.05% down. Additional longs are positioned at $62,039 with $90.2M and at $58,836 with $85.9M. The three long clusters add up to $277.6M.
Longs are closer to current price, but the larger stack is on the short side. Traders may watch whether price tests the nearby long levels first or pushes upward into the heavier short concentration above.
Data source: RR (ar-ar.co.kr). Estimated from BTCUSDT futures data. Not financial advice.
#BTC #Bitcoin #LiquidationMap #LiquidationHeatmap
Below price, long liquidations are building at $62,744 with roughly $101.5M at risk, just -2.05% down. Additional longs are positioned at $62,039 with $90.2M and at $58,836 with $85.9M. The three long clusters add up to $277.6M.
Longs are closer to current price, but the larger stack is on the short side. Traders may watch whether price tests the nearby long levels first or pushes upward into the heavier short concentration above.
Data source: RR (ar-ar.co.kr). Estimated from BTCUSDT futures data. Not financial advice.
#BTC #Bitcoin #LiquidationMap #LiquidationHeatmap
77
·
--
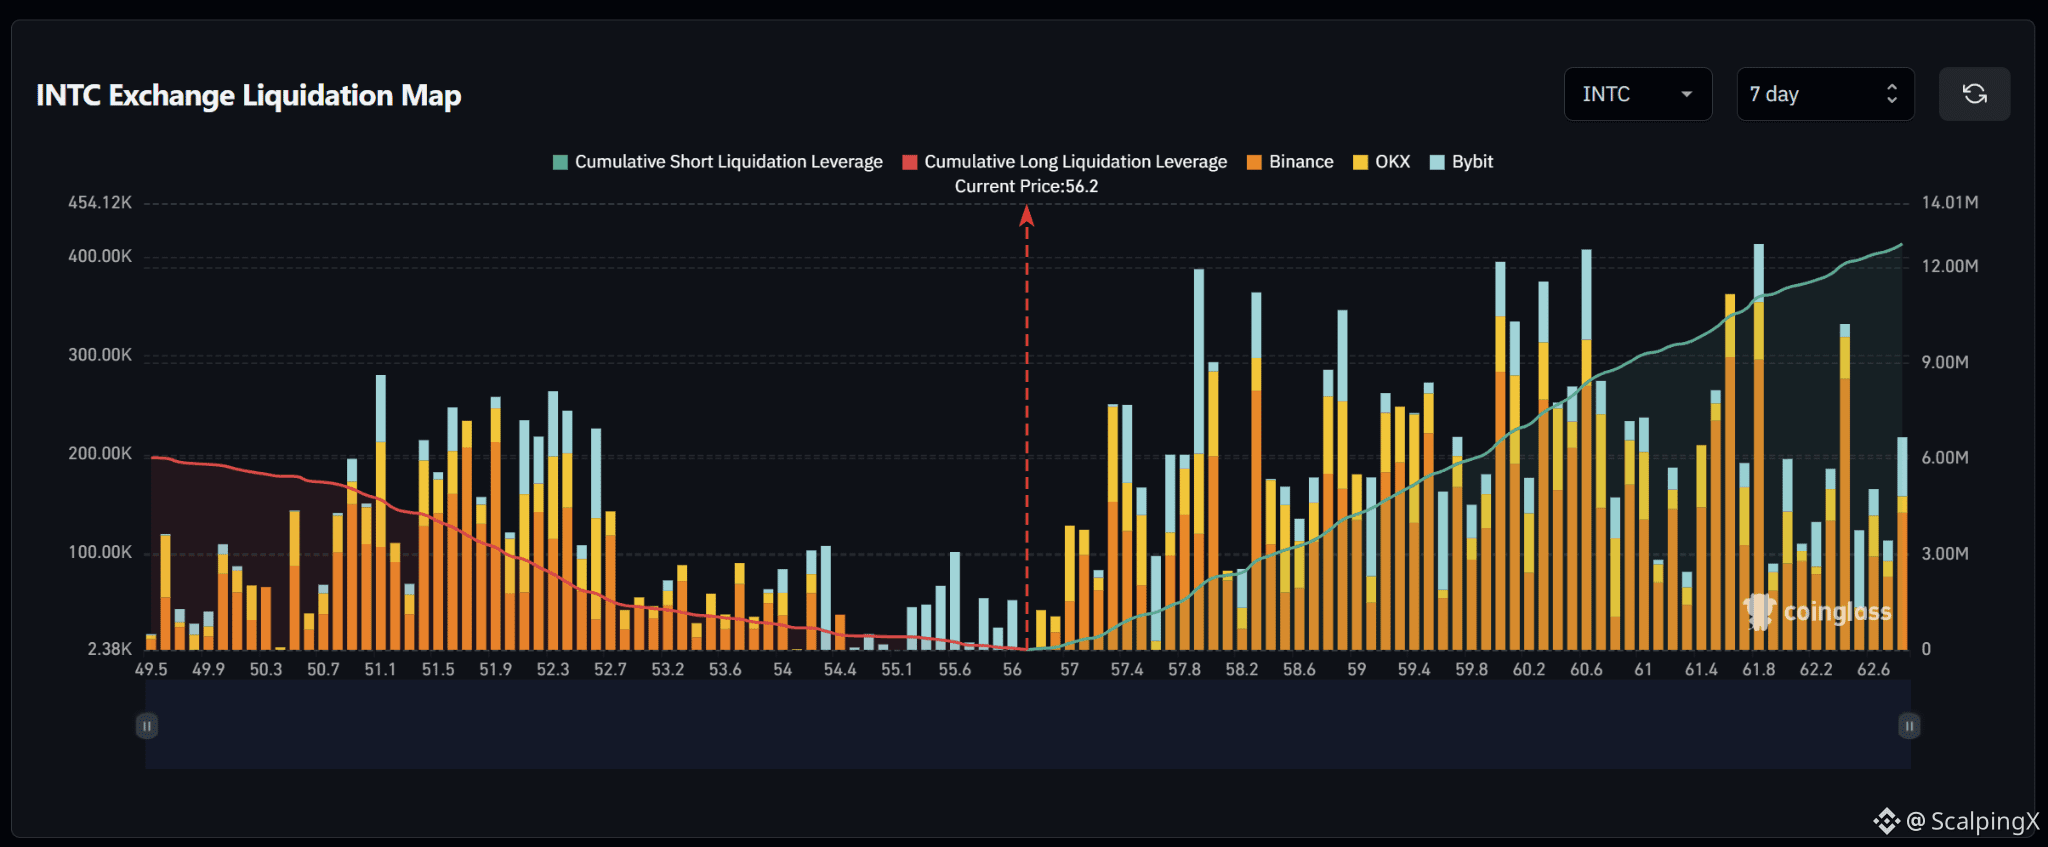
$INTC – Liquidation Map (7 days) – Index ~56.2
🧭 Favor a short-liquidation sweep at 56.9–57.5. Upside bars increase noticeably here, while nearby long clusters at 55.4–56.0 are smaller.
🔺 Breaking and holding above 57.5 would shift focus to 57.8–58.3, particularly around 57.9 and 58.3. Holding above 58.3 would bring 58.8–59.5 into view.
🎯 Above 59.5, the 60.0–60.7 zone contains several more large short bars, followed by 61.5–61.8 further up. Sweeping the initial clusters and quickly falling below 57.0 would weaken upside continuation.
⚖️ Losing 56.2 without reclaiming it would shift preference toward a long-liquidation sweep at 55.4–56.0. Holding below 55.4 would put 54.0–54.2 in focus, with a relatively sparse stretch at 54.4–55.1. A larger long zone lies further down at 51.1–52.7, while reclaiming 56.2 after a sweep would weaken downside continuation.
#LiquidationMap
$INTC – Liquidation Map (7 days) – Index ~56.2
🧭 Favor a short-liquidation sweep at 56.9–57.5. Upside bars increase noticeably here, while nearby long clusters at 55.4–56.0 are smaller.
🔺 Breaking and holding above 57.5 would shift focus to 57.8–58.3, particularly around 57.9 and 58.3. Holding above 58.3 would bring 58.8–59.5 into view.
🎯 Above 59.5, the 60.0–60.7 zone contains several more large short bars, followed by 61.5–61.8 further up. Sweeping the initial clusters and quickly falling below 57.0 would weaken upside continuation.
⚖️ Losing 56.2 without reclaiming it would shift preference toward a long-liquidation sweep at 55.4–56.0. Holding below 55.4 would put 54.0–54.2 in focus, with a relatively sparse stretch at 54.4–55.1. A larger long zone lies further down at 51.1–52.7, while reclaiming 56.2 after a sweep would weaken downside continuation.
#LiquidationMap
🧭 Favor a short-liquidation sweep at 56.9–57.5. Upside bars increase noticeably here, while nearby long clusters at 55.4–56.0 are smaller.
🔺 Breaking and holding above 57.5 would shift focus to 57.8–58.3, particularly around 57.9 and 58.3. Holding above 58.3 would bring 58.8–59.5 into view.
🎯 Above 59.5, the 60.0–60.7 zone contains several more large short bars, followed by 61.5–61.8 further up. Sweeping the initial clusters and quickly falling below 57.0 would weaken upside continuation.
⚖️ Losing 56.2 without reclaiming it would shift preference toward a long-liquidation sweep at 55.4–56.0. Holding below 55.4 would put 54.0–54.2 in focus, with a relatively sparse stretch at 54.4–55.1. A larger long zone lies further down at 51.1–52.7, while reclaiming 56.2 after a sweep would weaken downside continuation.
#LiquidationMap
11

Sharks $ZRO —which side are they getting ready to sweep first, guys? Looking at the 7-day liquidation map around 1.122, the 1.124–1.130 short zone is likely to get hit first. If it breaks 1.140, the path to 1.20+ is wide open, but if 1.122 gives way, watch out for a drop to 1.110.
What do you think, will $ZRO break resistance or support first?
#ZRO #BinanceSquare #CryptoTrading #LiquidationMap
Sharks $ZRO —which side are they getting ready to sweep first, guys? Looking at the 7-day liquidation map around 1.122, the 1.124–1.130 short zone is likely to get hit first. If it breaks 1.140, the path to 1.20+ is wide open, but if 1.122 gives way, watch out for a drop to 1.110.
What do you think, will $ZRO break resistance or support first?
#ZRO #BinanceSquare #CryptoTrading #LiquidationMap
What do you think, will $ZRO break resistance or support first?
#ZRO #BinanceSquare #CryptoTrading #LiquidationMap
4
The 7-day liquidation map for $DOT (Index ~0.646) is flashing an intense signal! The priority short-squeeze zone is opening up at 0.648–0.657, with strong pressure at 0.650 and 0.653. If it breaks above 0.657, the path to 0.674–0.686 will be wide open. Conversely, a drop below 0.646 will trigger a long hunt around 0.635–0.644.
Who do you think will get slaughtered first at this level?
#DOT #BinanceSquare #CryptoTrading #LiquidationMap
The 7-day liquidation map for $DOT (Index ~0.646) is flashing an intense signal! The priority short-squeeze zone is opening up at 0.648–0.657, with strong pressure at 0.650 and 0.653. If it breaks above 0.657, the path to 0.674–0.686 will be wide open. Conversely, a drop below 0.646 will trigger a long hunt around 0.635–0.644.
Who do you think will get slaughtered first at this level?
#DOT #BinanceSquare #CryptoTrading #LiquidationMap
Who do you think will get slaughtered first at this level?
#DOT #BinanceSquare #CryptoTrading #LiquidationMap
7
Log in to explore more content
Join global crypto users on Binance Square
⚡️ Get latest and useful information about crypto.
💬 Trusted by the world’s largest crypto exchange.
👍 Discover real insights from verified creators.
Email / Phone number
Trending Topics
1
#BitcoinCorePatchesAIDiscoveredVulnerability
0 views
2 Discussing
2
#CanBTCReboundAfterFallingBelow60K?
439,213 views
1,895 Discussing
3
#GlobalStocksFaceLongestLosingStreakSince2023
148,467 views
1,318 Discussing
4
#BlackRockIBITPostsRecord$541MSingleDayOutflow
4,598 views
42 Discussing
5
#AnthropicPlungesTowardIPOPriceonDay2
72,415 views
739 Discussing
6
#TwentyOneCapitalAdds172.25BTC
22,355 views
274 Discussing
7
#HKBillWouldExcludeTokenizedDepositsFromVirtualAssets
2,539 views
30 Discussing
8
#BNBDropsBelow540USDTWith8.46%DailyDecline
42,221 views
366 Discussing
9
#HKBillProposesHK$100KFineForUnauthorizedCryptoTitles
1,455 views
20 Discussing
10
#BitMineFaces$10.1BUnrealizedETHLoss
2,623 views
25 Discussing