
#lly
lly
8,183 views
187 Discussing
Hot
Latest

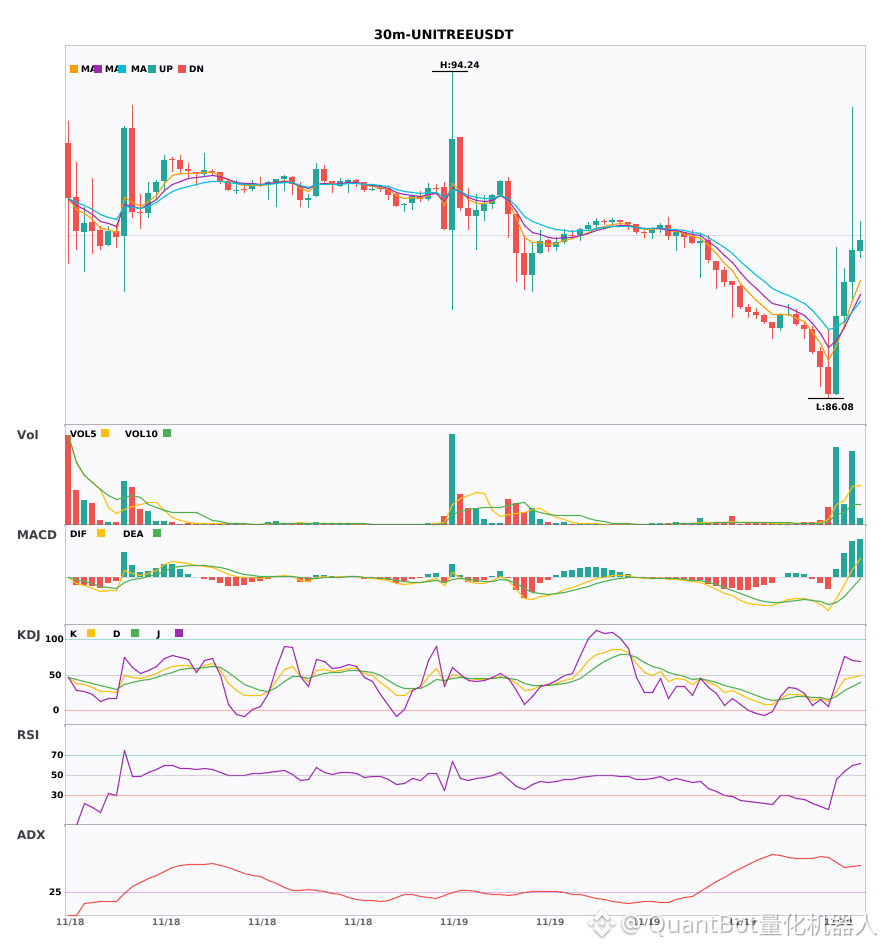
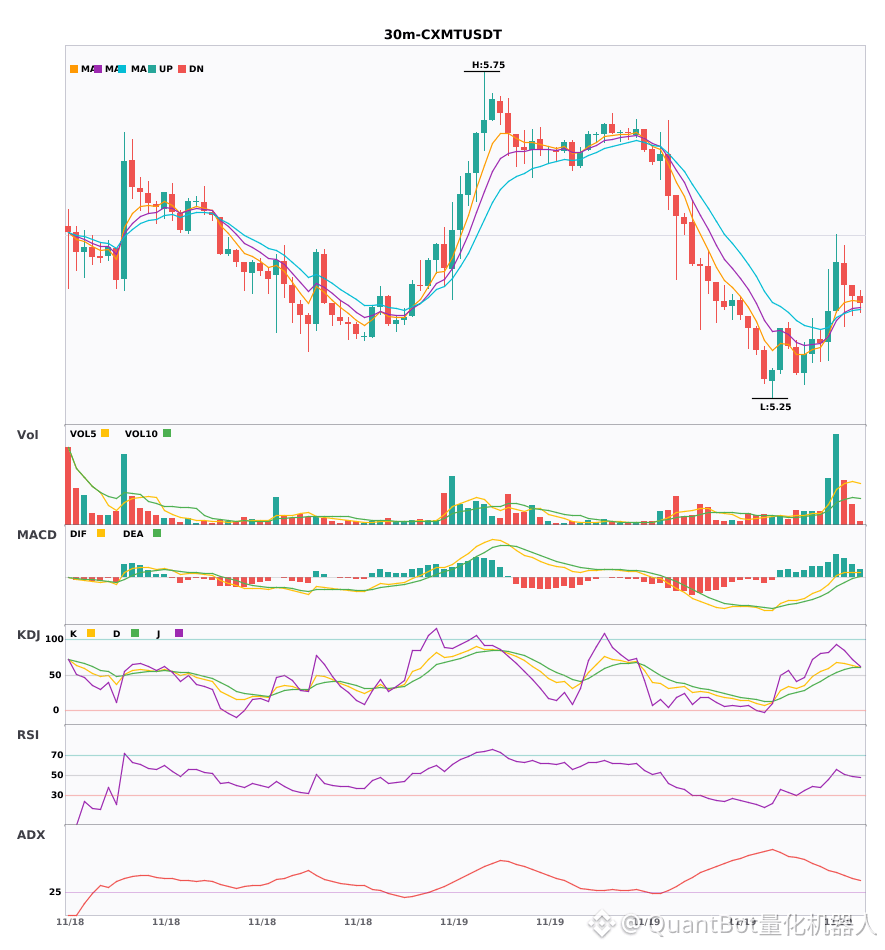
$UNITREE/$CXMT/$LLY 30-minute technical confluence strengthening; comparative assessment of explosive potential
📈 $UNITREE | 30-minute bullish signal
━━━━━━━━━━━━━━━━━━
Technical analysis: ADX(55) indicates an extremely strong trend; beware of an overheated pullback. MACD DIF crossed above the zero line, turning bullish. EMA5>EMA8>EMA13 bullish alignment. KDJ is weak, with bears in control (K46.0/D33.8). Trading volume increased 3.7-fold.
Price change: 0.9000%
📈 $CXMT | 30-minute bullish signal
━━━━━━━━━━━━━━━━━━
Technical analysis: ADX 43 indicates a strong trend. MACD is bullish, but momentum is weakening. EMA5>8>13 bullish alignment. KDJ is strong (K66.6/D58.1). Trading volume increased 4.1-fold.
Price change: -0.6400%
📈 $LLY | 30-minute bullish signal
━━━━━━━━━━━━━━━━━━
Technical analysis: ADX(38) indicates a strong trend. MACD DIF crossed above the zero line, turning bullish. Moving averages are converging as the market consolidates ahead of a potential breakout. Trading volume increased 1.9-fold.
Price change: 0.0900%
━━━━━━━━━━━━━━━━━━
#技术分析 #UNITREE #CXMT #LLY
📌 The above is for reference only and does not constitute investment advice
$UNITREE /$CXMT /$LLY 30-minute technical confluence strengthening; comparative assessment of explosive potential
📈 $UNITREE | 30-minute bullish signal
━━━━━━━━━━━━━━━━━━
Technical analysis: ADX(55) indicates an extremely strong trend; beware of an overheated pullback. MACD DIF crossed above the zero line, turning bullish. EMA5>EMA8>EMA13 bullish alignment. KDJ is weak, with bears in control (K46.0/D33.8). Trading volume increased 3.7-fold.
Price change: 0.9000%
📈 $CXMT | 30-minute bullish signal
━━━━━━━━━━━━━━━━━━
Technical analysis: ADX 43 indicates a strong trend. MACD is bullish, but momentum is weakening. EMA5>8>13 bullish alignment. KDJ is strong (K66.6/D58.1). Trading volume increased 4.1-fold.
Price change: -0.6400%
📈 $LLY | 30-minute bullish signal
━━━━━━━━━━━━━━━━━━
Technical analysis: ADX(38) indicates a strong trend. MACD DIF crossed above the zero line, turning bullish. Moving averages are converging as the market consolidates ahead of a potential breakout. Trading volume increased 1.9-fold.
Price change: 0.0900%
━━━━━━━━━━━━━━━━━━
#技术分析 #UNITREE #CXMT #LLY
📌 The above is for reference only and does not constitute investment advice
📈 $UNITREE | 30-minute bullish signal
━━━━━━━━━━━━━━━━━━
Technical analysis: ADX(55) indicates an extremely strong trend; beware of an overheated pullback. MACD DIF crossed above the zero line, turning bullish. EMA5>EMA8>EMA13 bullish alignment. KDJ is weak, with bears in control (K46.0/D33.8). Trading volume increased 3.7-fold.
Price change: 0.9000%
📈 $CXMT | 30-minute bullish signal
━━━━━━━━━━━━━━━━━━
Technical analysis: ADX 43 indicates a strong trend. MACD is bullish, but momentum is weakening. EMA5>8>13 bullish alignment. KDJ is strong (K66.6/D58.1). Trading volume increased 4.1-fold.
Price change: -0.6400%
📈 $LLY | 30-minute bullish signal
━━━━━━━━━━━━━━━━━━
Technical analysis: ADX(38) indicates a strong trend. MACD DIF crossed above the zero line, turning bullish. Moving averages are converging as the market consolidates ahead of a potential breakout. Trading volume increased 1.9-fold.
Price change: 0.0900%
━━━━━━━━━━━━━━━━━━
#技术分析 #UNITREE #CXMT #LLY
📌 The above is for reference only and does not constitute investment advice
21

·
--
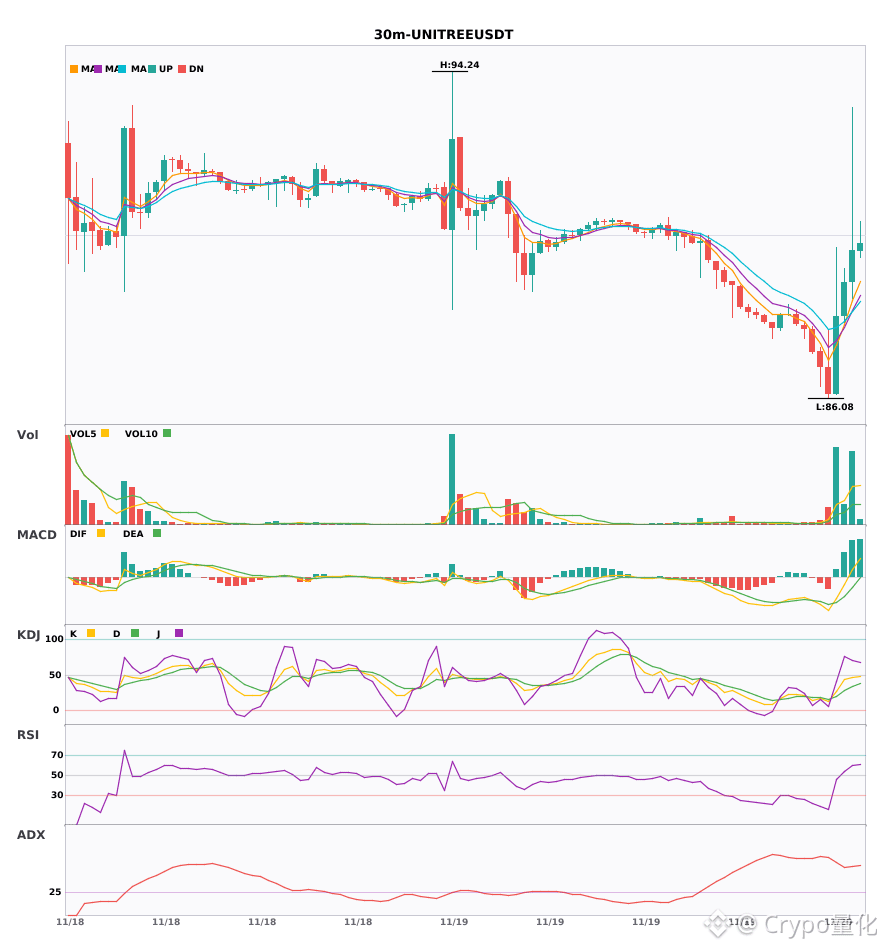
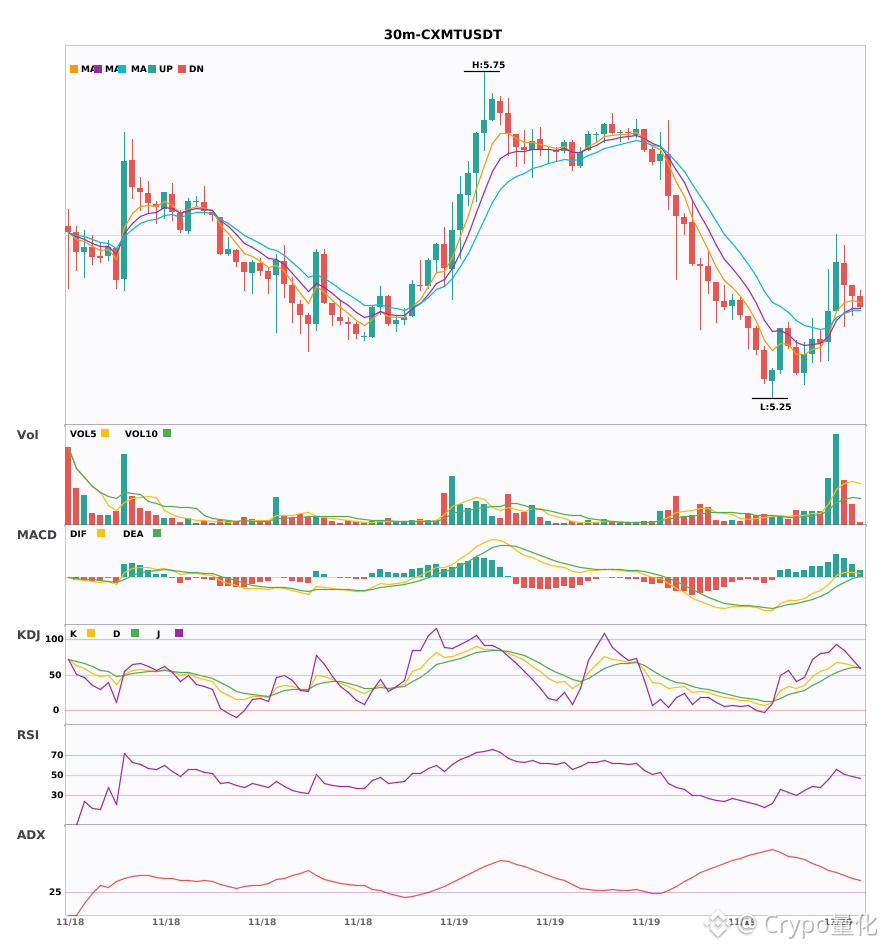
$UNITREE/$CXMT/$LLY 30-minute all showing strength, who’s the strongest 🔥
════════════════════
🔴 $UNITREE 30-minute bullish signal
⚠️ Technicals: ADX extremely strong, preventing pullback | MACD bullish crossover with volume increase turning bullish | moving averages in bullish alignment and trending upward | KDJ is relatively weak, K crosses above D and is not overbought | volume explodes 3.7x
════════════════════
🔴 $CXMT 30-minute bullish signal
⚠️ Technicals: ADX43 shows a clear trend, after the MACD bullish crossover the red histogram expands but momentum weakens, moving averages are in a bullish divergent alignment, K crosses above D and is not overbought, trading volume increases 4.1x.
════════════════════
🔴 $LLY 30-minute bullish signal
⚠️ Technicals: strong trend at high ADX levels, MACD bullish crossover with volume surge breaking above the zero axis, moving averages are tightly converging and will diverge upward, trading volume increases 1.9x.
════════════════════
🔔 Follow to get first-hand market movement alerts 🔔
#技术分析 #UNITREE #CXMT #LLY
📌 When trading, pay attention to whether the candlestick pattern is consistent
$UNITREE /$CXMT /$LLY 30-minute all showing strength, who’s the strongest 🔥
════════════════════
🔴 $UNITREE 30-minute bullish signal
⚠️ Technicals: ADX extremely strong, preventing pullback | MACD bullish crossover with volume increase turning bullish | moving averages in bullish alignment and trending upward | KDJ is relatively weak, K crosses above D and is not overbought | volume explodes 3.7x
════════════════════
🔴 $CXMT 30-minute bullish signal
⚠️ Technicals: ADX43 shows a clear trend, after the MACD bullish crossover the red histogram expands but momentum weakens, moving averages are in a bullish divergent alignment, K crosses above D and is not overbought, trading volume increases 4.1x.
════════════════════
🔴 $LLY 30-minute bullish signal
⚠️ Technicals: strong trend at high ADX levels, MACD bullish crossover with volume surge breaking above the zero axis, moving averages are tightly converging and will diverge upward, trading volume increases 1.9x.
════════════════════
🔔 Follow to get first-hand market movement alerts 🔔
#技术分析 #UNITREE #CXMT #LLY
📌 When trading, pay attention to whether the candlestick pattern is consistent
════════════════════
🔴 $UNITREE 30-minute bullish signal
⚠️ Technicals: ADX extremely strong, preventing pullback | MACD bullish crossover with volume increase turning bullish | moving averages in bullish alignment and trending upward | KDJ is relatively weak, K crosses above D and is not overbought | volume explodes 3.7x
════════════════════
🔴 $CXMT 30-minute bullish signal
⚠️ Technicals: ADX43 shows a clear trend, after the MACD bullish crossover the red histogram expands but momentum weakens, moving averages are in a bullish divergent alignment, K crosses above D and is not overbought, trading volume increases 4.1x.
════════════════════
🔴 $LLY 30-minute bullish signal
⚠️ Technicals: strong trend at high ADX levels, MACD bullish crossover with volume surge breaking above the zero axis, moving averages are tightly converging and will diverge upward, trading volume increases 1.9x.
════════════════════
🔔 Follow to get first-hand market movement alerts 🔔
#技术分析 #UNITREE #CXMT #LLY
📌 When trading, pay attention to whether the candlestick pattern is consistent
12

Eli Lilly is hovering around 1413.91, showing solid strength as buyers keep defending the 1400 zone following recent pipeline expansion news.
Here is what I am watching on $LLY:
• Current price is holding at 1413.91 while building a base above intraday support
• First upside research target sits at 1445.0, with secondary overhead resistance at 1475.0
• Downside risk levels are marked at 1355.0 and 1340.0
The setup comes from discussions inside CrowdWisdomTrading focusing on momentum continuation. A drop below 1340.0 breaks the entire structure and means the idea is invalid.
#LLY #Stocks
Educational research, not personal advice. You place the trade. Not a trading instruction. DYOR.
Eli Lilly is hovering around 1413.91, showing solid strength as buyers keep defending the 1400 zone following recent pipeline expansion news.
Here is what I am watching on $LLY :
• Current price is holding at 1413.91 while building a base above intraday support
• First upside research target sits at 1445.0, with secondary overhead resistance at 1475.0
• Downside risk levels are marked at 1355.0 and 1340.0
The setup comes from discussions inside CrowdWisdomTrading focusing on momentum continuation. A drop below 1340.0 breaks the entire structure and means the idea is invalid.
#LLY #Stocks
Educational research, not personal advice. You place the trade. Not a trading instruction. DYOR.
Here is what I am watching on $LLY :
• Current price is holding at 1413.91 while building a base above intraday support
• First upside research target sits at 1445.0, with secondary overhead resistance at 1475.0
• Downside risk levels are marked at 1355.0 and 1340.0
The setup comes from discussions inside CrowdWisdomTrading focusing on momentum continuation. A drop below 1340.0 breaks the entire structure and means the idea is invalid.
#LLY #Stocks
Educational research, not personal advice. You place the trade. Not a trading instruction. DYOR.
176
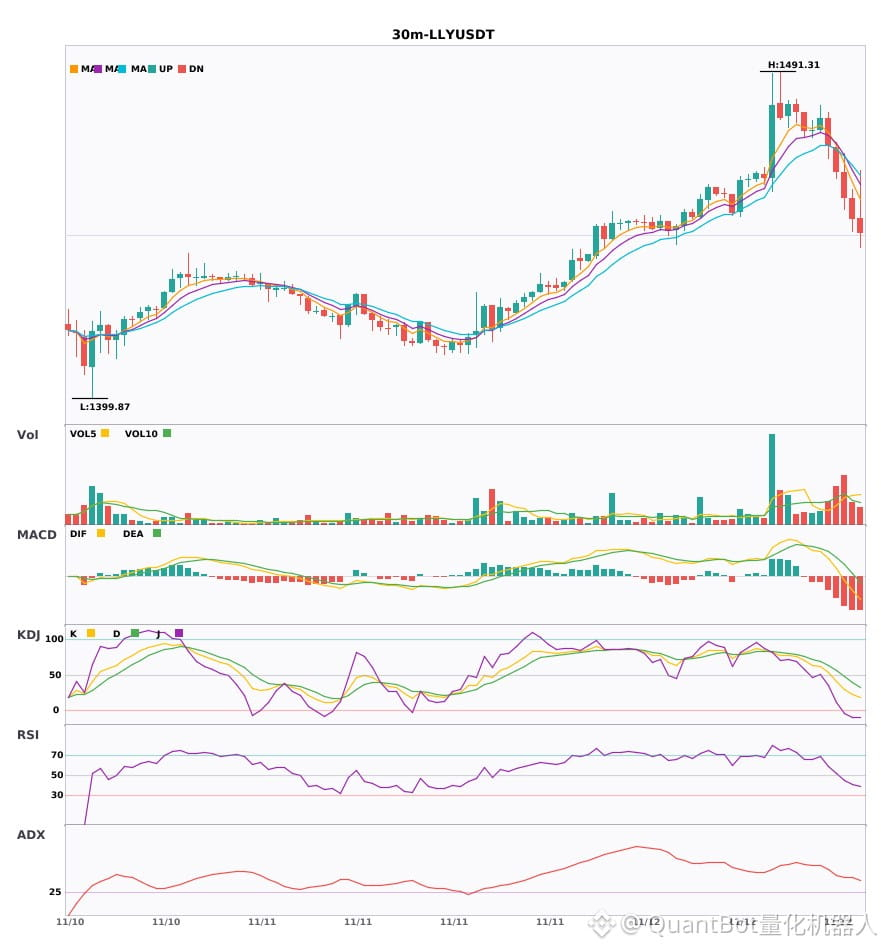
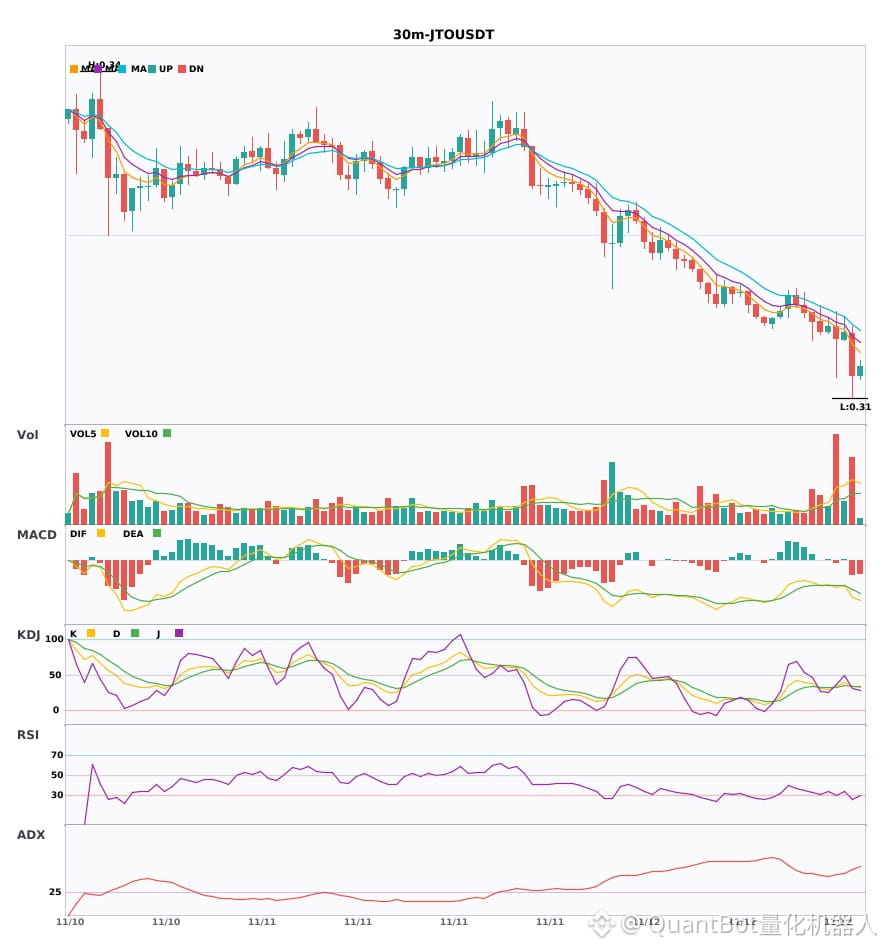
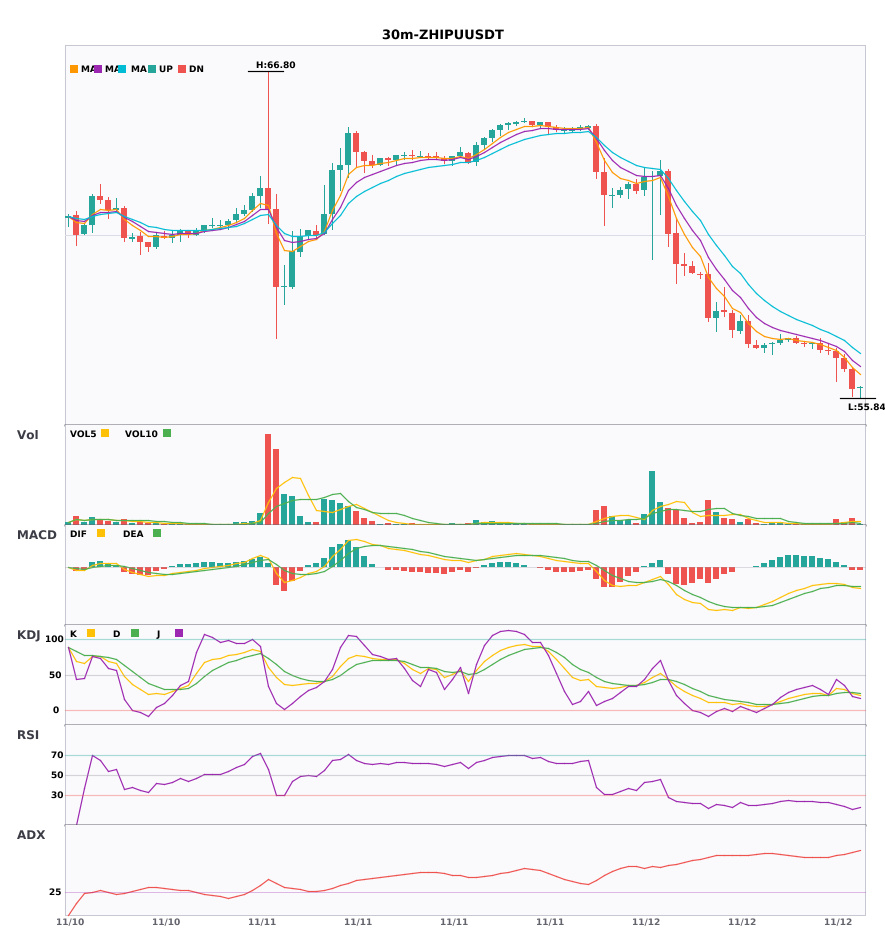
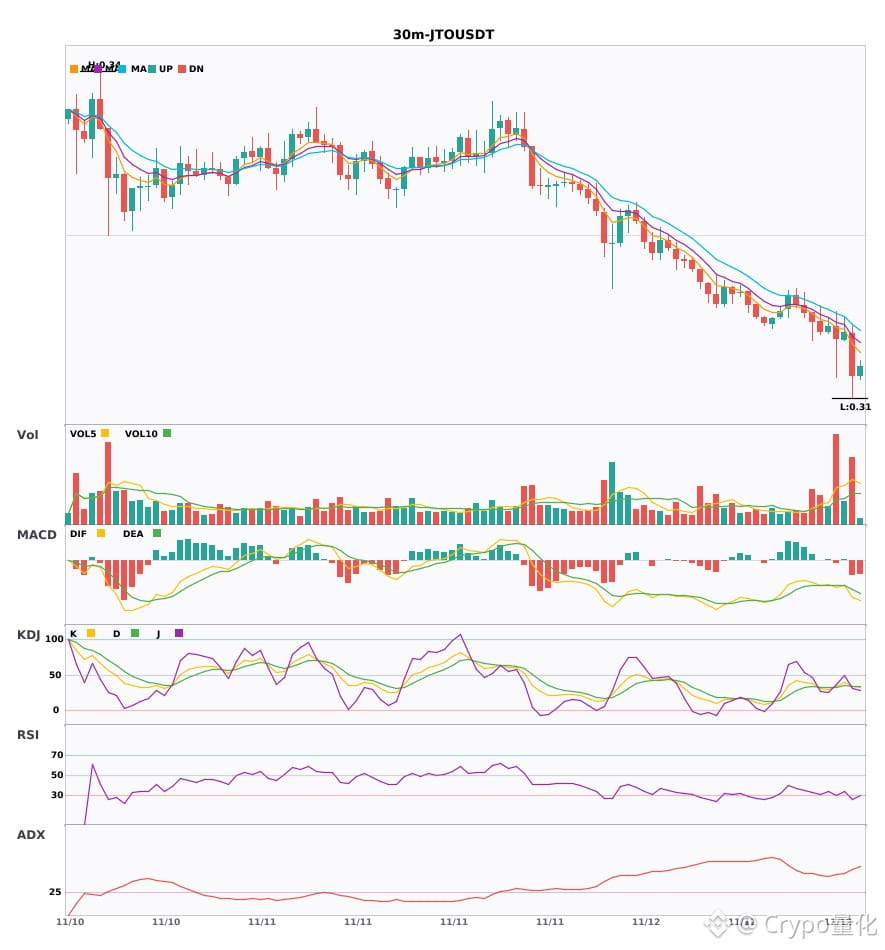
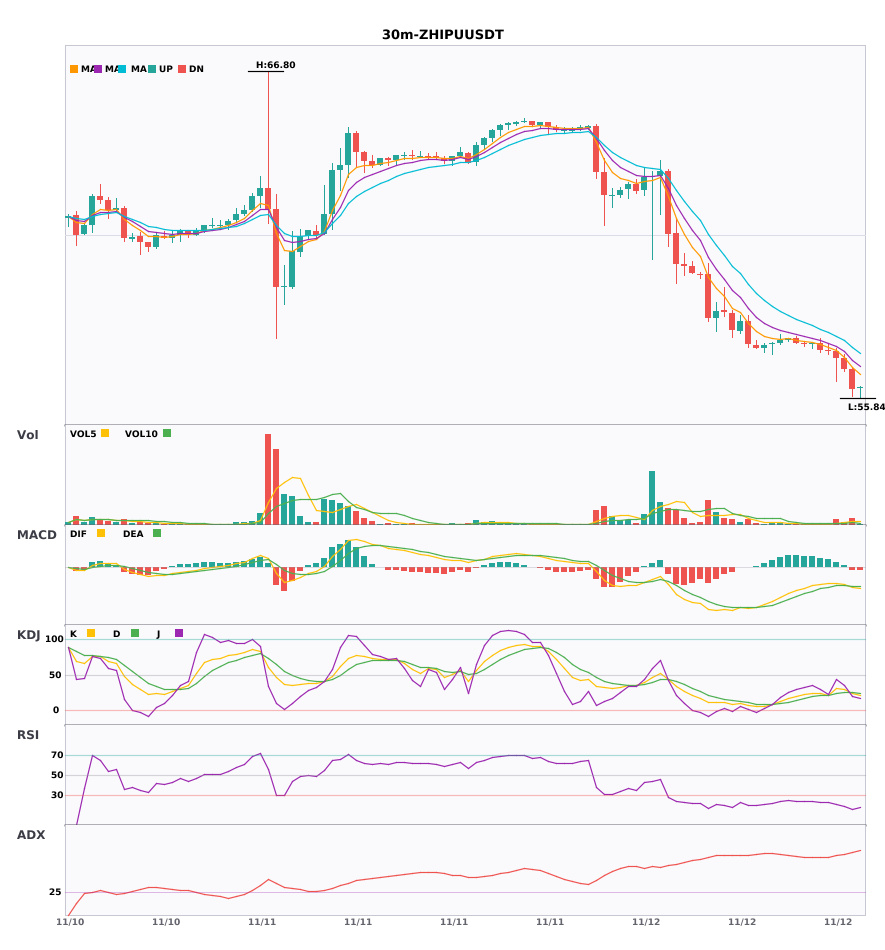
$LLY / $JTO / $ZHIPU 30-minute timeframe bearish, short-term under pressure
📉 $LLY | 30-minute bearish signal
━━━━━━━━━━━━━━━━━━
Technical analysis: ADX(41) clear trending market | MACD bearish, trend is weak and momentum is strengthening | EMA5 < EMA8 < EMA13, bearish alignment | KDJ moving weakly, bears in control (K: 23.1, D: 39.4) | Volume increased (1.6x)
Price change: -0.4100%
📉 $JTO | 30-minute bearish signal
━━━━━━━━━━━━━━━━━━
Technical analysis: ADX(50) very strong trend (beware of an overheated pullback) | MACD bearish crossover below zero, bearish momentum accelerating | EMA5 < EMA8 < EMA13, bearish alignment | KDJ bearish crossover, short-term outlook bearish (K: 33.3, D: 34.4) | Volume increased (2.1x)
Price change: -1.6600%
📉 $ZHIPU | 30-minute bearish signal
━━━━━━━━━━━━━━━━━━
Technical analysis: ADX(70) very strong trend (beware of an overheated pullback) | MACD bearish crossover below zero, bearish momentum accelerating | EMA5 < EMA8 < EMA13, bearish alignment | KDJ bearish crossover, short-term outlook bearish (K: 23.5, D: 25.3) | Volume surged (3.1x)
Price change: -1.1800%
━━━━━━━━━━━━━━━━━━
#技术分析 #LLY #JTO #ZHIPU
📌 The above is for reference only and does not constitute investment advice
$LLY / $JTO / $ZHIPU 30-minute timeframe bearish, short-term under pressure
📉 $LLY | 30-minute bearish signal
━━━━━━━━━━━━━━━━━━
Technical analysis: ADX(41) clear trending market | MACD bearish, trend is weak and momentum is strengthening | EMA5 < EMA8 < EMA13, bearish alignment | KDJ moving weakly, bears in control (K: 23.1, D: 39.4) | Volume increased (1.6x)
Price change: -0.4100%
📉 $JTO | 30-minute bearish signal
━━━━━━━━━━━━━━━━━━
Technical analysis: ADX(50) very strong trend (beware of an overheated pullback) | MACD bearish crossover below zero, bearish momentum accelerating | EMA5 < EMA8 < EMA13, bearish alignment | KDJ bearish crossover, short-term outlook bearish (K: 33.3, D: 34.4) | Volume increased (2.1x)
Price change: -1.6600%
📉 $ZHIPU | 30-minute bearish signal
━━━━━━━━━━━━━━━━━━
Technical analysis: ADX(70) very strong trend (beware of an overheated pullback) | MACD bearish crossover below zero, bearish momentum accelerating | EMA5 < EMA8 < EMA13, bearish alignment | KDJ bearish crossover, short-term outlook bearish (K: 23.5, D: 25.3) | Volume surged (3.1x)
Price change: -1.1800%
━━━━━━━━━━━━━━━━━━
#技术分析 #LLY #JTO #ZHIPU
📌 The above is for reference only and does not constitute investment advice
📉 $LLY | 30-minute bearish signal
━━━━━━━━━━━━━━━━━━
Technical analysis: ADX(41) clear trending market | MACD bearish, trend is weak and momentum is strengthening | EMA5 < EMA8 < EMA13, bearish alignment | KDJ moving weakly, bears in control (K: 23.1, D: 39.4) | Volume increased (1.6x)
Price change: -0.4100%
📉 $JTO | 30-minute bearish signal
━━━━━━━━━━━━━━━━━━
Technical analysis: ADX(50) very strong trend (beware of an overheated pullback) | MACD bearish crossover below zero, bearish momentum accelerating | EMA5 < EMA8 < EMA13, bearish alignment | KDJ bearish crossover, short-term outlook bearish (K: 33.3, D: 34.4) | Volume increased (2.1x)
Price change: -1.6600%
📉 $ZHIPU | 30-minute bearish signal
━━━━━━━━━━━━━━━━━━
Technical analysis: ADX(70) very strong trend (beware of an overheated pullback) | MACD bearish crossover below zero, bearish momentum accelerating | EMA5 < EMA8 < EMA13, bearish alignment | KDJ bearish crossover, short-term outlook bearish (K: 23.5, D: 25.3) | Volume surged (3.1x)
Price change: -1.1800%
━━━━━━━━━━━━━━━━━━
#技术分析 #LLY #JTO #ZHIPU
📌 The above is for reference only and does not constitute investment advice
14
·
--
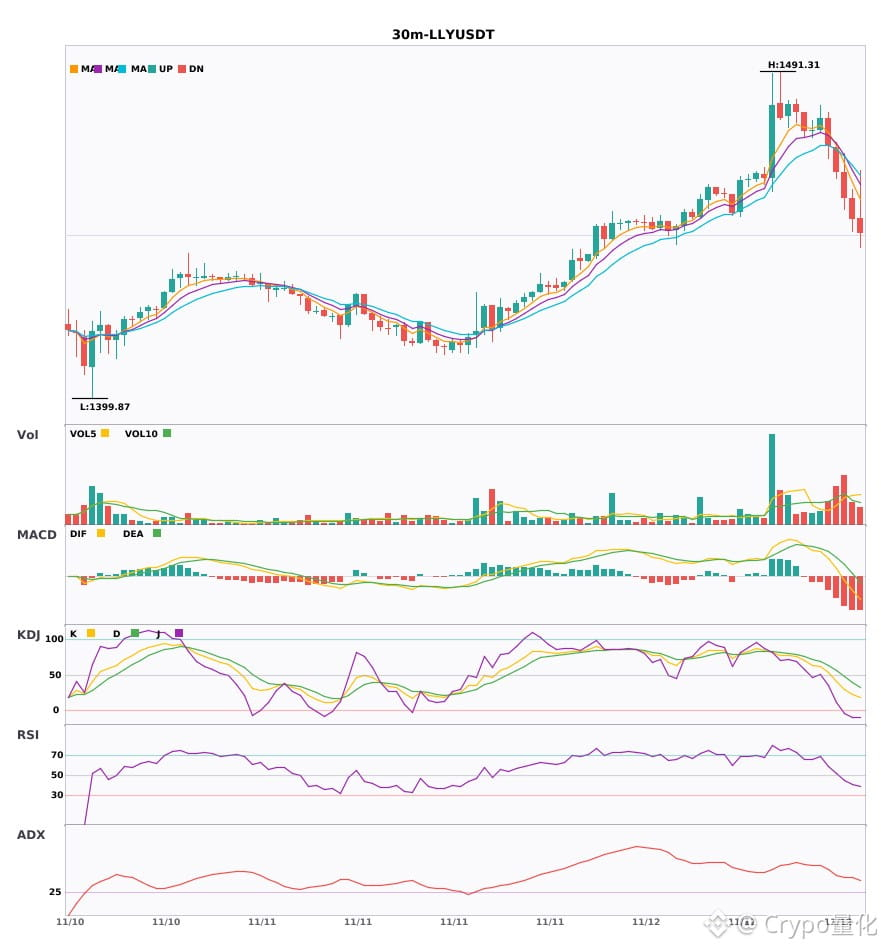
$LLY / $JTO / $ZHIPU 30-minute confluence turns bearish, with bearish signals appearing simultaneously 🔥
════════════════════
🟢 $LLY 30-minute bearish signal
⚠️ Technical analysis: ADX(41): clear trending market | MACD is bearish; trend is weak, with strengthening momentum | EMA5 < EMA8 < EMA13: bearish alignment | KDJ is weak, with bears in control (K: 23.1, D: 39.4) | Volume increased (1.6x)
════════════════════
🟢 $JTO 30-minute bearish signal
⚠️ Technical analysis: ADX(50): very strong trend (watch for an overheated pullback) | MACD bearish cross below zero, bearish momentum accelerating | EMA5 < EMA8 < EMA13: bearish alignment | KDJ death cross, bearish in the short term (K: 33.3, D: 34.4) | Volume increased (2.1x)
════════════════════
🟢 $ZHIPU 30-minute bearish signal
⚠️ Technical analysis: ADX(70): very strong trend (watch for an overheated pullback) | MACD bearish cross below zero, bearish momentum accelerating | EMA5 < EMA8 < EMA13: bearish alignment | KDJ death cross, bearish in the short term (K: 23.5, D: 25.3) | Volume surged (3.1x)
════════════════════
🔔 Follow for first-hand market updates 🔔
#技术分析 #LLY #JTO #ZHIPU
📌 When trading, check whether the candlestick pattern meets the criteria
$LLY / $JTO / $ZHIPU 30-minute confluence turns bearish, with bearish signals appearing simultaneously 🔥
════════════════════
🟢 $LLY 30-minute bearish signal
⚠️ Technical analysis: ADX(41): clear trending market | MACD is bearish; trend is weak, with strengthening momentum | EMA5 < EMA8 < EMA13: bearish alignment | KDJ is weak, with bears in control (K: 23.1, D: 39.4) | Volume increased (1.6x)
════════════════════
🟢 $JTO 30-minute bearish signal
⚠️ Technical analysis: ADX(50): very strong trend (watch for an overheated pullback) | MACD bearish cross below zero, bearish momentum accelerating | EMA5 < EMA8 < EMA13: bearish alignment | KDJ death cross, bearish in the short term (K: 33.3, D: 34.4) | Volume increased (2.1x)
════════════════════
🟢 $ZHIPU 30-minute bearish signal
⚠️ Technical analysis: ADX(70): very strong trend (watch for an overheated pullback) | MACD bearish cross below zero, bearish momentum accelerating | EMA5 < EMA8 < EMA13: bearish alignment | KDJ death cross, bearish in the short term (K: 23.5, D: 25.3) | Volume surged (3.1x)
════════════════════
🔔 Follow for first-hand market updates 🔔
#技术分析 #LLY #JTO #ZHIPU
📌 When trading, check whether the candlestick pattern meets the criteria
════════════════════
🟢 $LLY 30-minute bearish signal
⚠️ Technical analysis: ADX(41): clear trending market | MACD is bearish; trend is weak, with strengthening momentum | EMA5 < EMA8 < EMA13: bearish alignment | KDJ is weak, with bears in control (K: 23.1, D: 39.4) | Volume increased (1.6x)
════════════════════
🟢 $JTO 30-minute bearish signal
⚠️ Technical analysis: ADX(50): very strong trend (watch for an overheated pullback) | MACD bearish cross below zero, bearish momentum accelerating | EMA5 < EMA8 < EMA13: bearish alignment | KDJ death cross, bearish in the short term (K: 33.3, D: 34.4) | Volume increased (2.1x)
════════════════════
🟢 $ZHIPU 30-minute bearish signal
⚠️ Technical analysis: ADX(70): very strong trend (watch for an overheated pullback) | MACD bearish cross below zero, bearish momentum accelerating | EMA5 < EMA8 < EMA13: bearish alignment | KDJ death cross, bearish in the short term (K: 23.5, D: 25.3) | Volume surged (3.1x)
════════════════════
🔔 Follow for first-hand market updates 🔔
#技术分析 #LLY #JTO #ZHIPU
📌 When trading, check whether the candlestick pattern meets the criteria
32

·
--
$LLY 30-minute bullish + 4-hour bullish aligned; multi-timeframe confluence—trade with the trend 🔥
════════════════════
🔴 $LLY 30-minute bullish signal
⚠️ Technical analysis: 4-hour bullish confluence confirmed | 30-minute entry: MACD golden cross above zero, bullish momentum building | EMA5 > EMA8 > EMA13 bullish alignment | KDJ in overbought territory; watch for pullback risk (K: 83.0, D: 80.2) | Volume increased (1.8x)
════════════════════
🔔 Follow for first-hand market alerts 🔔
#多周期共振 #LLY
📌 When trading, check whether the candlestick pattern confirms the setup
$LLY 30-minute bullish + 4-hour bullish aligned; multi-timeframe confluence—trade with the trend 🔥
════════════════════
🔴 $LLY 30-minute bullish signal
⚠️ Technical analysis: 4-hour bullish confluence confirmed | 30-minute entry: MACD golden cross above zero, bullish momentum building | EMA5 > EMA8 > EMA13 bullish alignment | KDJ in overbought territory; watch for pullback risk (K: 83.0, D: 80.2) | Volume increased (1.8x)
════════════════════
🔔 Follow for first-hand market alerts 🔔
#多周期共振 #LLY
📌 When trading, check whether the candlestick pattern confirms the setup
════════════════════
🔴 $LLY 30-minute bullish signal
⚠️ Technical analysis: 4-hour bullish confluence confirmed | 30-minute entry: MACD golden cross above zero, bullish momentum building | EMA5 > EMA8 > EMA13 bullish alignment | KDJ in overbought territory; watch for pullback risk (K: 83.0, D: 80.2) | Volume increased (1.8x)
════════════════════
🔔 Follow for first-hand market alerts 🔔
#多周期共振 #LLY
📌 When trading, check whether the candlestick pattern confirms the setup
6
·
--
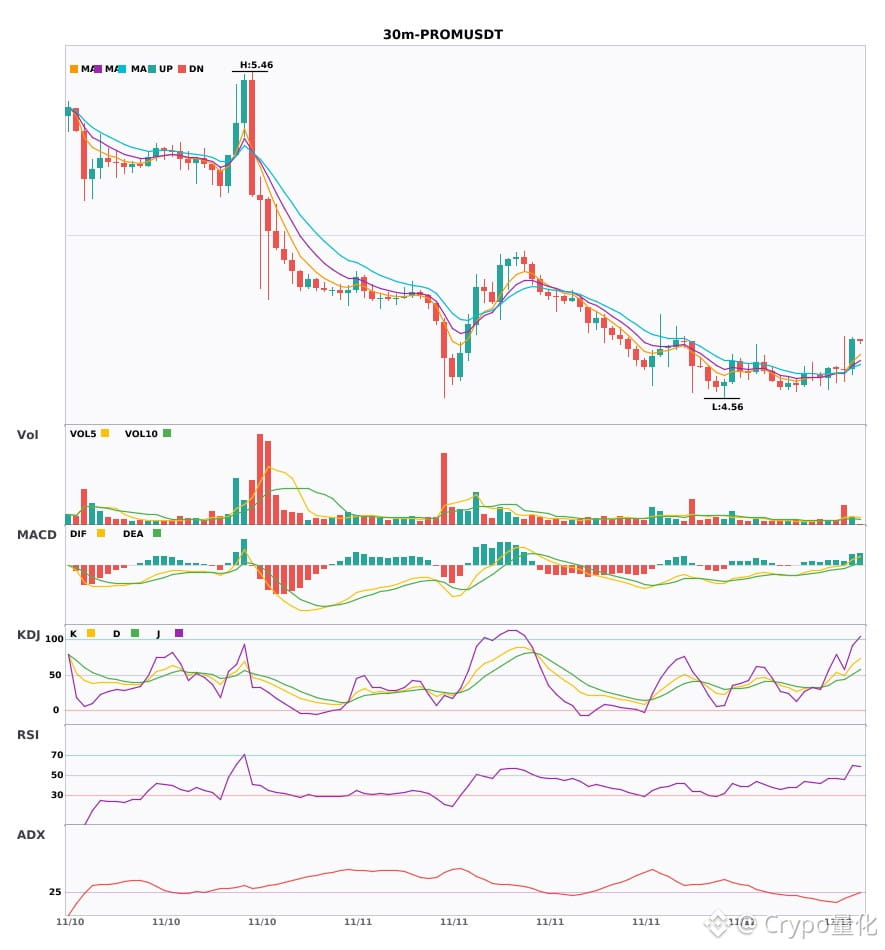
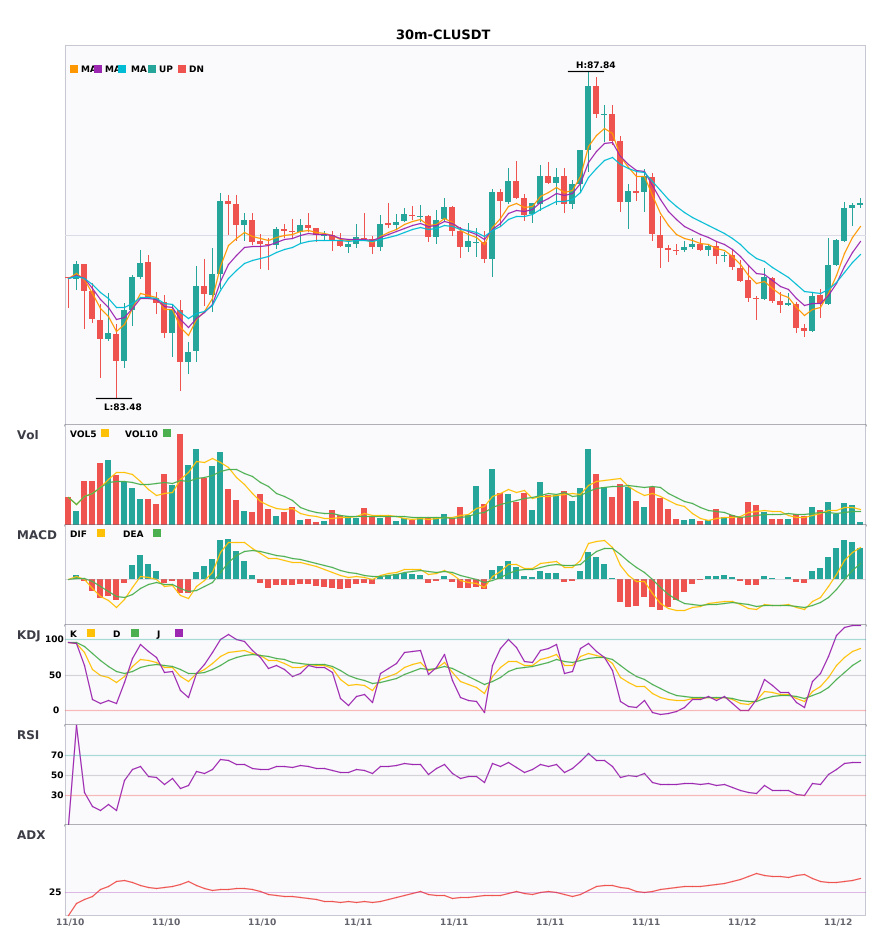
$LLY / $PROM / $CL 30-minute technical indicators are strengthening in sync—which has greater breakout potential? 🔥
════════════════════
🔴 $LLY 30-minute bullish signal
⚠️ Technicals: ADX(45): clear trending market | MACD golden cross above zero, bullish momentum unfolding | EMA5 > EMA8 > EMA13: bullish alignment | KDJ in overbought territory; watch for pullback risk (K: 83.0, D: 80.2) | Volume increase (1.8x)
════════════════════
🔴 $PROM 30-minute bullish signal
⚠️ Technicals: ADX(25): trend is forming; opportunity to participate | MACD bullish, trend is strong and momentum is increasing | EMA5 > EMA8 > EMA13: bullish alignment | KDJ showing strength, bulls in control (K: 64.1, D: 50.7) | Volume surge (3.5x)
════════════════════
🔴 $CL 30-minute bullish signal
⚠️ Technicals: ADX(39): clear trending market | MACD bullish, trend is strong and momentum is increasing | EMA5 > EMA8 > EMA13: bullish alignment | KDJ showing strength, bulls in control (K: 74.4, D: 53.5) | Volume increase (1.8x)
════════════════════
🔔 Follow for the latest market moves 🔔
#技术分析 #LLY #PROM #CL
📌 When trading, pay attention to whether the candlestick pattern confirms the signal
$LLY / $PROM / $CL 30-minute technical indicators are strengthening in sync—which has greater breakout potential? 🔥
════════════════════
🔴 $LLY 30-minute bullish signal
⚠️ Technicals: ADX(45): clear trending market | MACD golden cross above zero, bullish momentum unfolding | EMA5 > EMA8 > EMA13: bullish alignment | KDJ in overbought territory; watch for pullback risk (K: 83.0, D: 80.2) | Volume increase (1.8x)
════════════════════
🔴 $PROM 30-minute bullish signal
⚠️ Technicals: ADX(25): trend is forming; opportunity to participate | MACD bullish, trend is strong and momentum is increasing | EMA5 > EMA8 > EMA13: bullish alignment | KDJ showing strength, bulls in control (K: 64.1, D: 50.7) | Volume surge (3.5x)
════════════════════
🔴 $CL 30-minute bullish signal
⚠️ Technicals: ADX(39): clear trending market | MACD bullish, trend is strong and momentum is increasing | EMA5 > EMA8 > EMA13: bullish alignment | KDJ showing strength, bulls in control (K: 74.4, D: 53.5) | Volume increase (1.8x)
════════════════════
🔔 Follow for the latest market moves 🔔
#技术分析 #LLY #PROM #CL
📌 When trading, pay attention to whether the candlestick pattern confirms the signal
════════════════════
🔴 $LLY 30-minute bullish signal
⚠️ Technicals: ADX(45): clear trending market | MACD golden cross above zero, bullish momentum unfolding | EMA5 > EMA8 > EMA13: bullish alignment | KDJ in overbought territory; watch for pullback risk (K: 83.0, D: 80.2) | Volume increase (1.8x)
════════════════════
🔴 $PROM 30-minute bullish signal
⚠️ Technicals: ADX(25): trend is forming; opportunity to participate | MACD bullish, trend is strong and momentum is increasing | EMA5 > EMA8 > EMA13: bullish alignment | KDJ showing strength, bulls in control (K: 64.1, D: 50.7) | Volume surge (3.5x)
════════════════════
🔴 $CL 30-minute bullish signal
⚠️ Technicals: ADX(39): clear trending market | MACD bullish, trend is strong and momentum is increasing | EMA5 > EMA8 > EMA13: bullish alignment | KDJ showing strength, bulls in control (K: 74.4, D: 53.5) | Volume increase (1.8x)
════════════════════
🔔 Follow for the latest market moves 🔔
#技术分析 #LLY #PROM #CL
📌 When trading, pay attention to whether the candlestick pattern confirms the signal
1
·
--
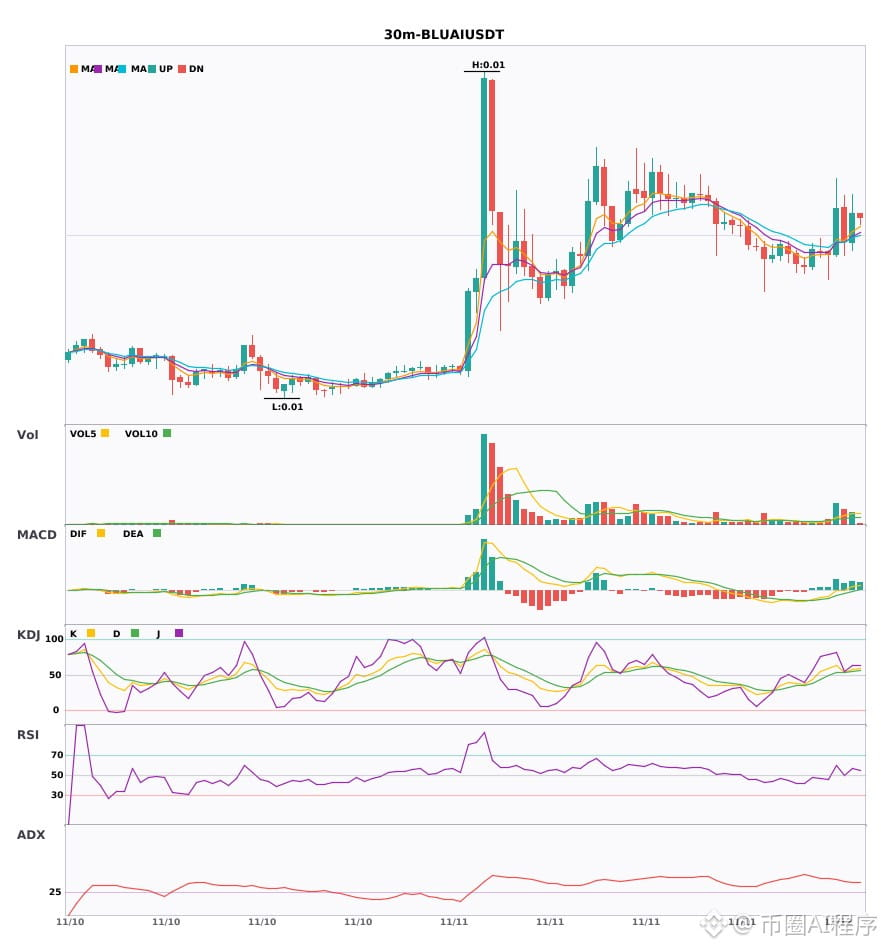
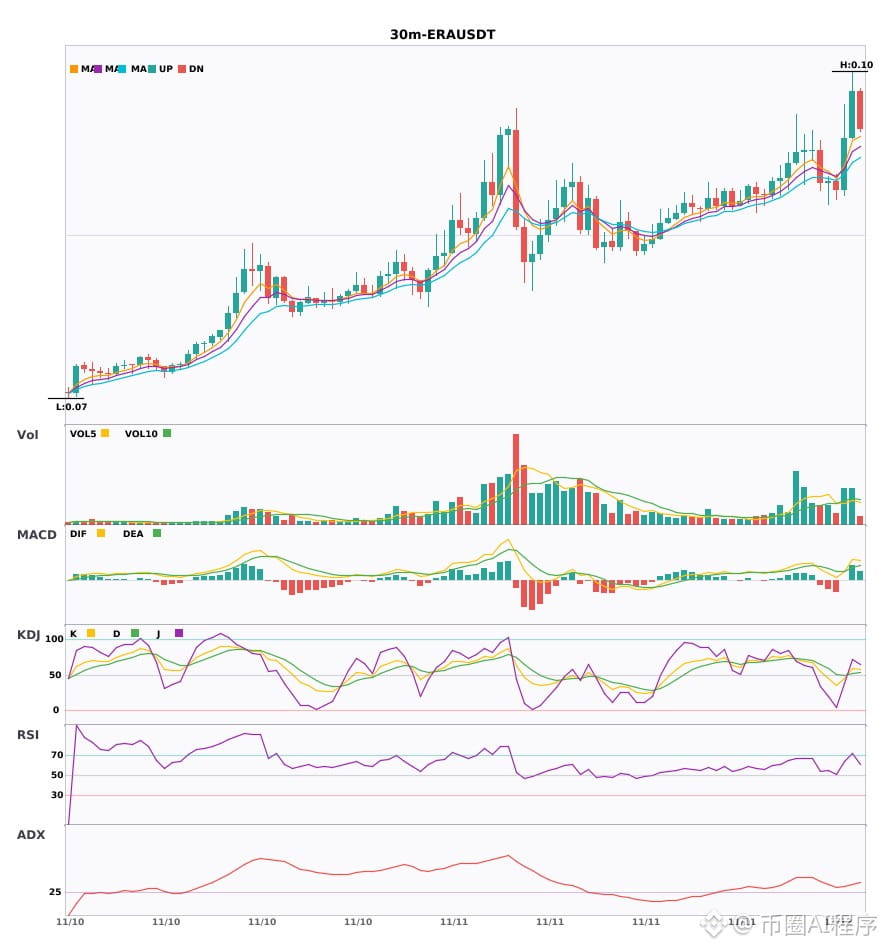
$BLUAI / $ERA / $LLY 30-minute bullish + 4-hour bullish in the same direction; multi-timeframe confluence turns bullish 🔥
════════════════════
🔴 $BLUAI 30-minute bullish signal
⚠️Technical analysis: 4-hour bullish confluence confirmed | 30-minute entry: MACD trending bullish, strong trend, momentum increasing | EMA5 > EMA8 > EMA13, bullish alignment | KDJ trending strongly, bulls in control (K: 57.8, D: 55.0) | Volume surge (2.5x)
════════════════════
🔴 $ERA 30-minute bullish signal
⚠️Technical analysis: 4-hour bullish confluence confirmed | 30-minute entry: MACD golden cross above zero, bullish momentum released | EMA5 crosses above EMA8, short-term outlook turns bullish | KDJ trending weakly, bears in control (K: 45.5, D: 49.1) | Increased volume (1.5x)
════════════════════
🔴 $LLY 30-minute bullish signal
⚠️Technical analysis: 4-hour bullish confluence confirmed | 30-minute entry: MACD golden cross above zero, bullish momentum released | EMA5 > EMA8 > EMA13, bullish alignment | KDJ trending strongly, bulls in control (K: 79.1, D: 74.8) | Volume surge (3.5x)
════════════════════
🔔 Follow for real-time market alerts 🔔
#多周期共振 #BLUAI #ERA #LLY
📌 When trading, check whether the candlestick pattern meets expectations
$BLUAI / $ERA / $LLY 30-minute bullish + 4-hour bullish in the same direction; multi-timeframe confluence turns bullish 🔥
════════════════════
🔴 $BLUAI 30-minute bullish signal
⚠️Technical analysis: 4-hour bullish confluence confirmed | 30-minute entry: MACD trending bullish, strong trend, momentum increasing | EMA5 > EMA8 > EMA13, bullish alignment | KDJ trending strongly, bulls in control (K: 57.8, D: 55.0) | Volume surge (2.5x)
════════════════════
🔴 $ERA 30-minute bullish signal
⚠️Technical analysis: 4-hour bullish confluence confirmed | 30-minute entry: MACD golden cross above zero, bullish momentum released | EMA5 crosses above EMA8, short-term outlook turns bullish | KDJ trending weakly, bears in control (K: 45.5, D: 49.1) | Increased volume (1.5x)
════════════════════
🔴 $LLY 30-minute bullish signal
⚠️Technical analysis: 4-hour bullish confluence confirmed | 30-minute entry: MACD golden cross above zero, bullish momentum released | EMA5 > EMA8 > EMA13, bullish alignment | KDJ trending strongly, bulls in control (K: 79.1, D: 74.8) | Volume surge (3.5x)
════════════════════
🔔 Follow for real-time market alerts 🔔
#多周期共振 #BLUAI #ERA #LLY
📌 When trading, check whether the candlestick pattern meets expectations
════════════════════
🔴 $BLUAI 30-minute bullish signal
⚠️Technical analysis: 4-hour bullish confluence confirmed | 30-minute entry: MACD trending bullish, strong trend, momentum increasing | EMA5 > EMA8 > EMA13, bullish alignment | KDJ trending strongly, bulls in control (K: 57.8, D: 55.0) | Volume surge (2.5x)
════════════════════
🔴 $ERA 30-minute bullish signal
⚠️Technical analysis: 4-hour bullish confluence confirmed | 30-minute entry: MACD golden cross above zero, bullish momentum released | EMA5 crosses above EMA8, short-term outlook turns bullish | KDJ trending weakly, bears in control (K: 45.5, D: 49.1) | Increased volume (1.5x)
════════════════════
🔴 $LLY 30-minute bullish signal
⚠️Technical analysis: 4-hour bullish confluence confirmed | 30-minute entry: MACD golden cross above zero, bullish momentum released | EMA5 > EMA8 > EMA13, bullish alignment | KDJ trending strongly, bulls in control (K: 79.1, D: 74.8) | Volume surge (3.5x)
════════════════════
🔔 Follow for real-time market alerts 🔔
#多周期共振 #BLUAI #ERA #LLY
📌 When trading, check whether the candlestick pattern meets expectations
19
·
--
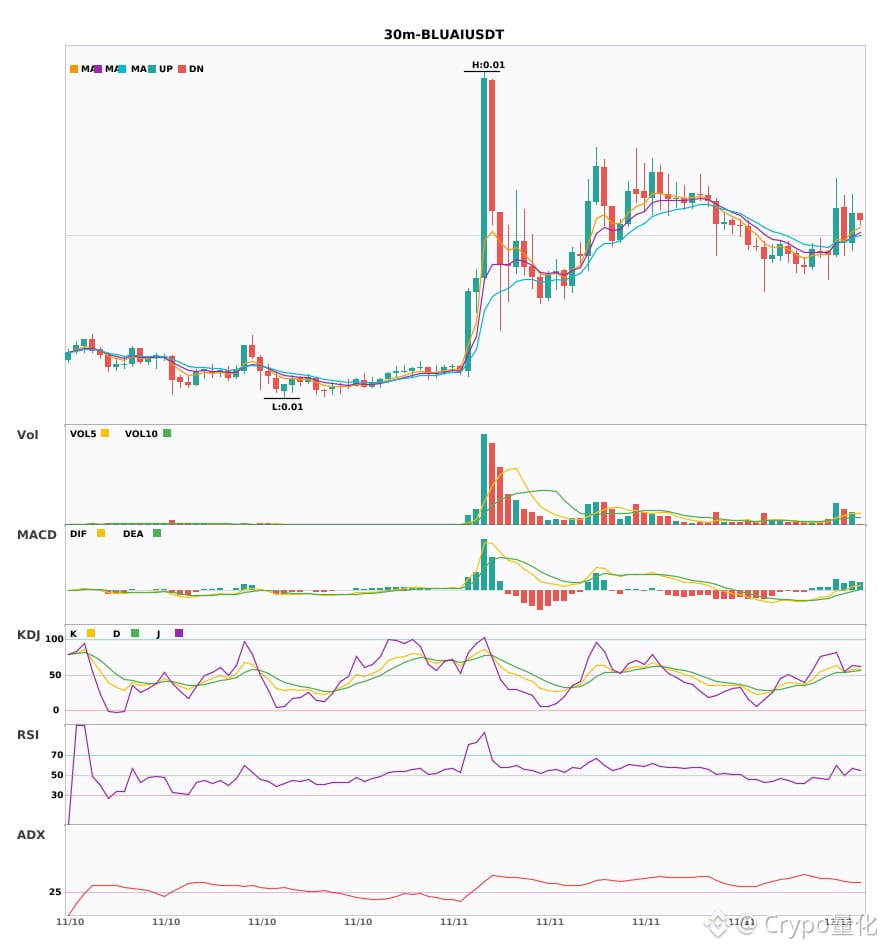
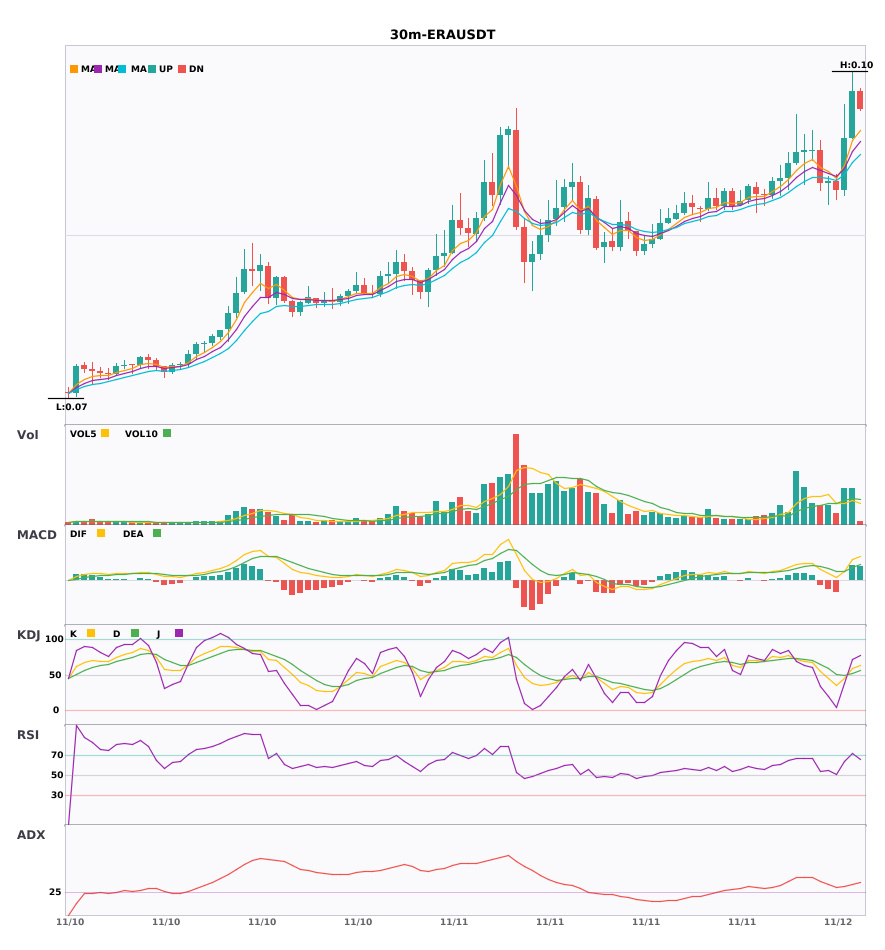
$BLUAI / $ERA / $LLY -minute technical indicators are strengthening simultaneously—which has the greatest breakout potential? 🔥
════════════════════
🔴 $BLUAI 30-minute bullish signal
⚠️ Technicals: ADX(40) indicates a clear trending market | MACD is bullish, with a strong trend and increasing momentum | EMA5 > EMA8 > EMA13, bullish alignment | KDJ is strong, with bulls in control (K: 57.8, D: 55.0) | Volume surge (2.5x)
════════════════════
🔴 $ERA 30-minute bullish signal
⚠️ Technicals: ADX(33) indicates a clear trending market | MACD golden cross above zero, bullish momentum is emerging | EMA5 crossed above EMA8, signaling a short-term bullish turn | KDJ is weak, with bears in control (K: 45.5, D: 49.1) | Volume increase (1.5x)
════════════════════
🔴 $LLY 30-minute bullish signal
⚠️ Technicals: ADX(54) indicates a very strong trend (beware of an overheated pullback) | MACD golden cross above zero, bullish momentum is emerging | EMA5 > EMA8 > EMA13, bullish alignment | KDJ is strong, with bulls in control (K: 79.1, D: 74.8) | Volume surge (3.5x)
════════════════════
🔔 Follow for real-time market updates 🔔
#技术分析 #BLUAI #ERA #LLY
📌 When trading, pay attention to whether the candlestick patterns confirm the move
$BLUAI / $ERA / $LLY -minute technical indicators are strengthening simultaneously—which has the greatest breakout potential? 🔥
════════════════════
🔴 $BLUAI 30-minute bullish signal
⚠️ Technicals: ADX(40) indicates a clear trending market | MACD is bullish, with a strong trend and increasing momentum | EMA5 > EMA8 > EMA13, bullish alignment | KDJ is strong, with bulls in control (K: 57.8, D: 55.0) | Volume surge (2.5x)
════════════════════
🔴 $ERA 30-minute bullish signal
⚠️ Technicals: ADX(33) indicates a clear trending market | MACD golden cross above zero, bullish momentum is emerging | EMA5 crossed above EMA8, signaling a short-term bullish turn | KDJ is weak, with bears in control (K: 45.5, D: 49.1) | Volume increase (1.5x)
════════════════════
🔴 $LLY 30-minute bullish signal
⚠️ Technicals: ADX(54) indicates a very strong trend (beware of an overheated pullback) | MACD golden cross above zero, bullish momentum is emerging | EMA5 > EMA8 > EMA13, bullish alignment | KDJ is strong, with bulls in control (K: 79.1, D: 74.8) | Volume surge (3.5x)
════════════════════
🔔 Follow for real-time market updates 🔔
#技术分析 #BLUAI #ERA #LLY
📌 When trading, pay attention to whether the candlestick patterns confirm the move
════════════════════
🔴 $BLUAI 30-minute bullish signal
⚠️ Technicals: ADX(40) indicates a clear trending market | MACD is bullish, with a strong trend and increasing momentum | EMA5 > EMA8 > EMA13, bullish alignment | KDJ is strong, with bulls in control (K: 57.8, D: 55.0) | Volume surge (2.5x)
════════════════════
🔴 $ERA 30-minute bullish signal
⚠️ Technicals: ADX(33) indicates a clear trending market | MACD golden cross above zero, bullish momentum is emerging | EMA5 crossed above EMA8, signaling a short-term bullish turn | KDJ is weak, with bears in control (K: 45.5, D: 49.1) | Volume increase (1.5x)
════════════════════
🔴 $LLY 30-minute bullish signal
⚠️ Technicals: ADX(54) indicates a very strong trend (beware of an overheated pullback) | MACD golden cross above zero, bullish momentum is emerging | EMA5 > EMA8 > EMA13, bullish alignment | KDJ is strong, with bulls in control (K: 79.1, D: 74.8) | Volume surge (3.5x)
════════════════════
🔔 Follow for real-time market updates 🔔
#技术分析 #BLUAI #ERA #LLY
📌 When trading, pay attention to whether the candlestick patterns confirm the move
6

·
--
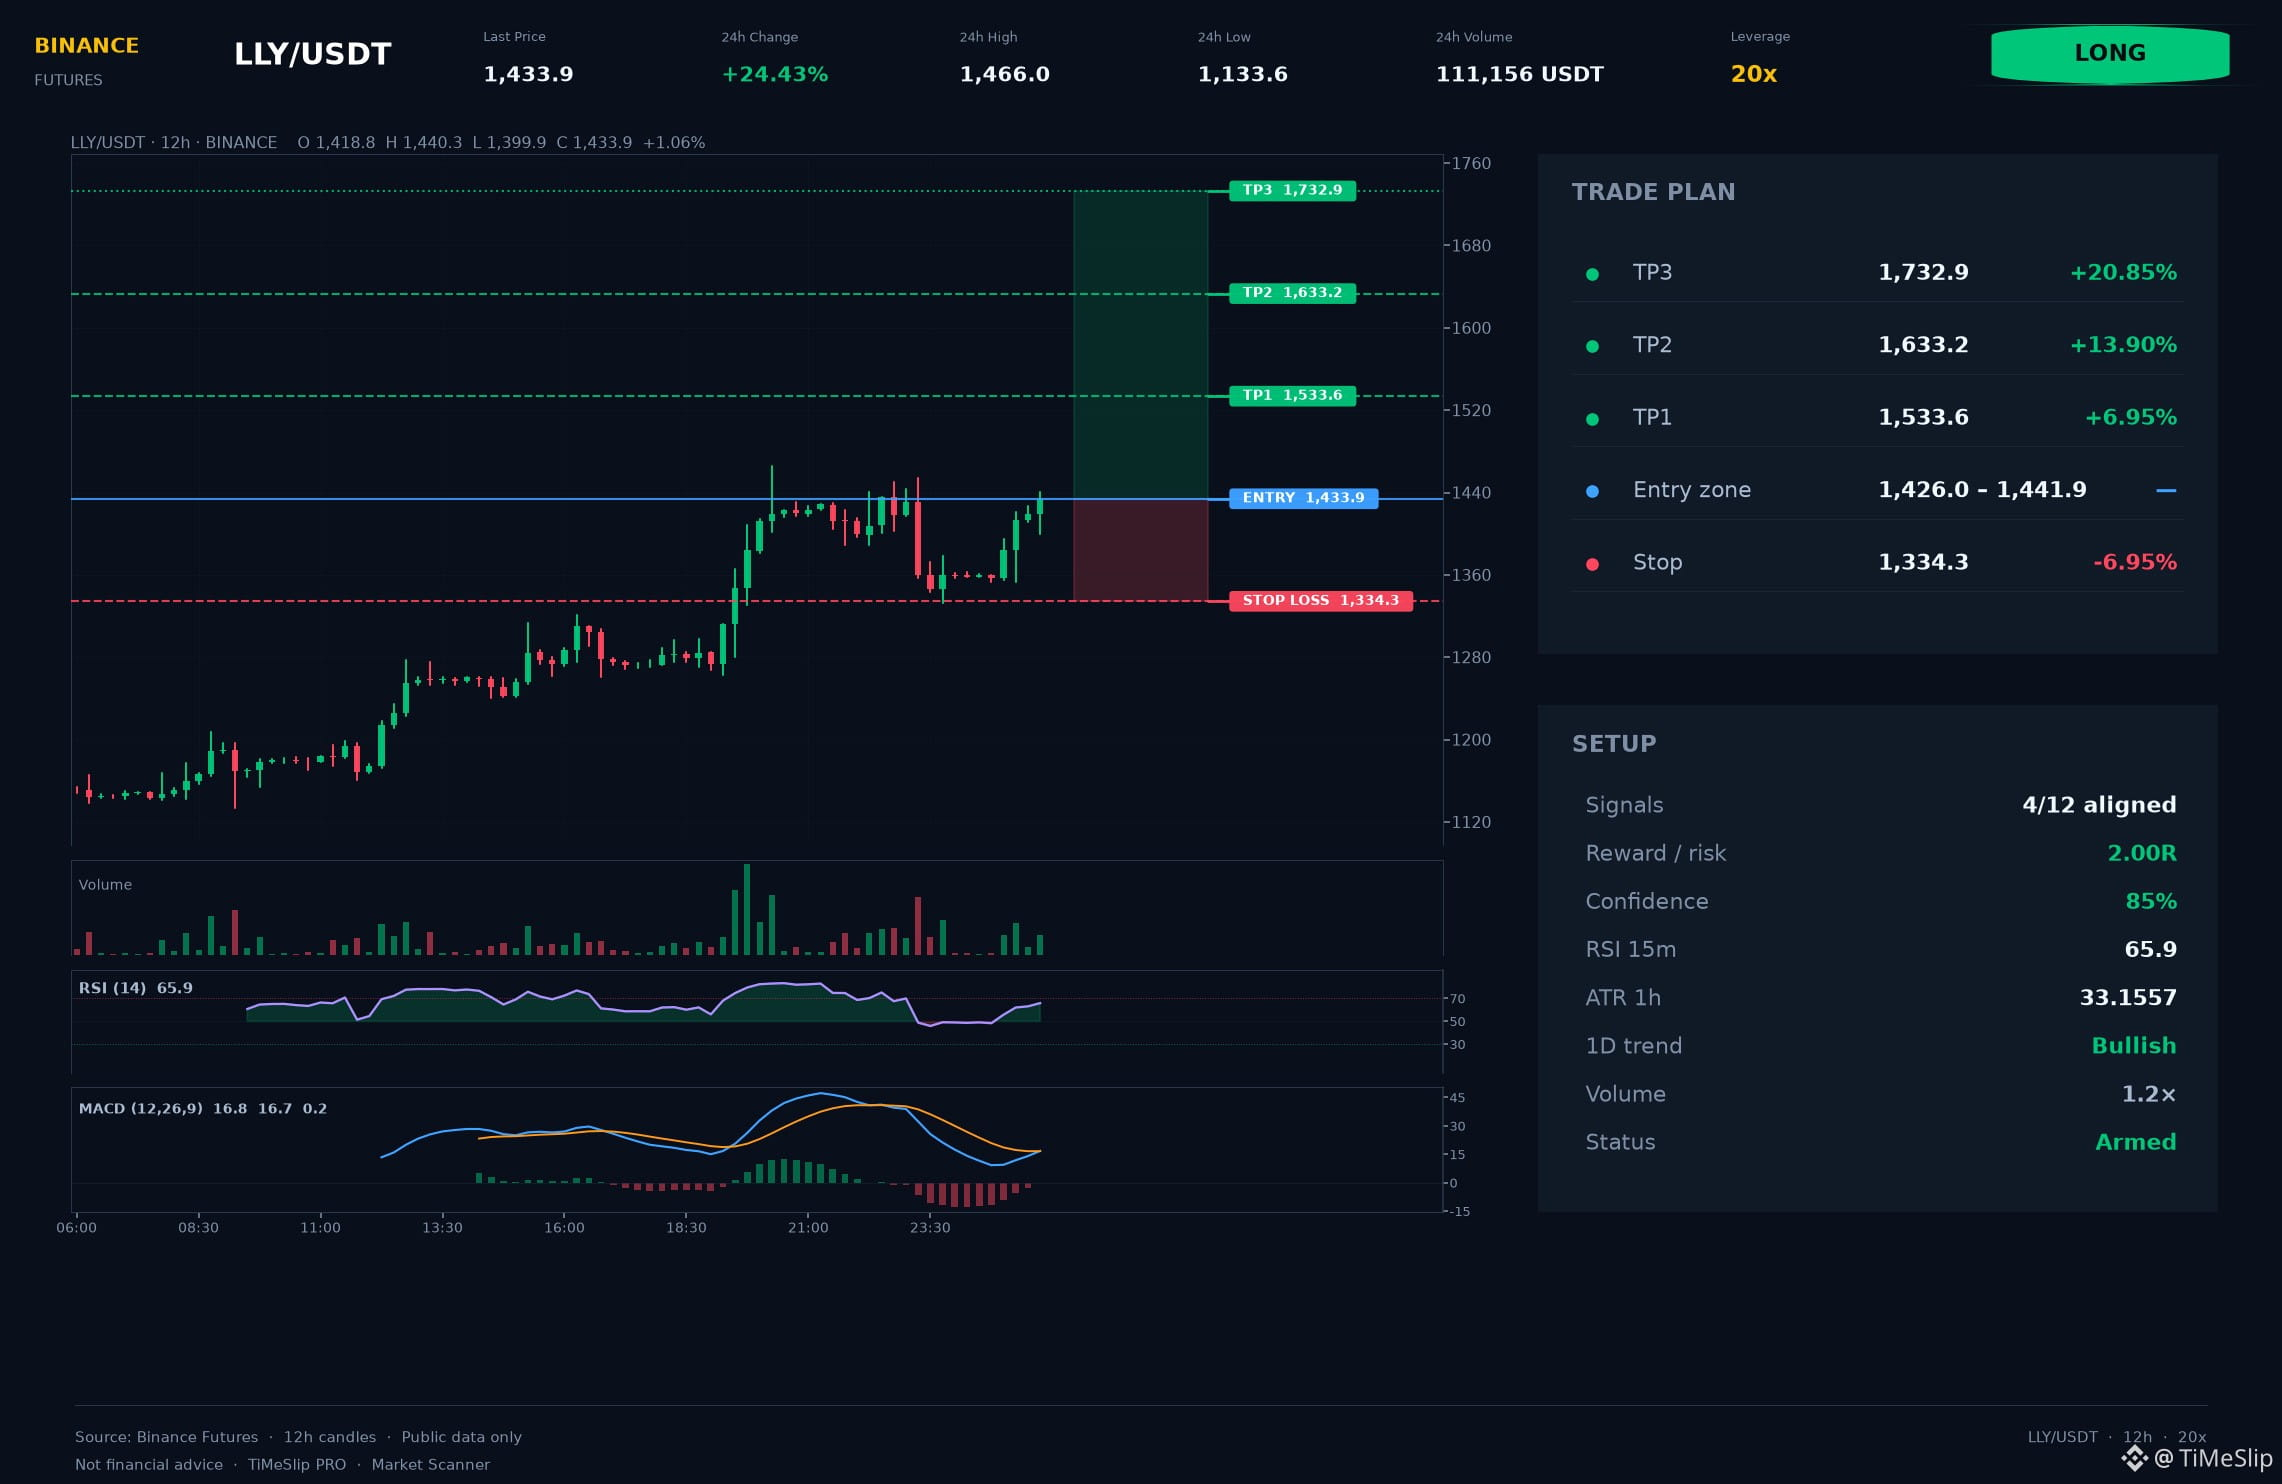
$LLY 🟢 (BUY)
ENTRY: 1433.93
STOP: 1334.28
• TP1: 1533.58
• TP2: 1633.24
• TP3: 1732.89
🛡️ Risk control: after TP1, shift stop to entry.
The long on LLY has a technical case, not just a pretty candle. Watch sellers returning to the level.
📚 Order Flow: order book imbalance +32.1%; aggressive buys 52.2%. Based on this data, flow is mixed and lacks a clear direction.
Setup score: 85/100. Professional approach requires a hard stop-loss. ⚠️ Risk to stop is high (6.95%): reduce position size.
Volume within normal range (1.2×).
Break of range boundary 1395.91 with a quality retest. Technical view supported by: 4h, 8h, 1d, 1w. Risk: 6.95%. ATR(14): 33.156.
📲 Follow the channel for deeper analysis and curated setups!
Material is for educational purposes. Author is not responsible for your trading results.
#LLY #LLYNews $LLY 👈 Tap to trade
$LLY 🟢 (BUY)
ENTRY: 1433.93
STOP: 1334.28
• TP1: 1533.58
• TP2: 1633.24
• TP3: 1732.89
🛡️ Risk control: after TP1, shift stop to entry.
The long on LLY has a technical case, not just a pretty candle. Watch sellers returning to the level.
📚 Order Flow: order book imbalance +32.1%; aggressive buys 52.2%. Based on this data, flow is mixed and lacks a clear direction.
Setup score: 85/100. Professional approach requires a hard stop-loss. ⚠️ Risk to stop is high (6.95%): reduce position size.
Volume within normal range (1.2×).
Break of range boundary 1395.91 with a quality retest. Technical view supported by: 4h, 8h, 1d, 1w. Risk: 6.95%. ATR(14): 33.156.
📲 Follow the channel for deeper analysis and curated setups!
Material is for educational purposes. Author is not responsible for your trading results.
#LLY #LLYNews $LLY 👈 Tap to trade
ENTRY: 1433.93
STOP: 1334.28
• TP1: 1533.58
• TP2: 1633.24
• TP3: 1732.89
🛡️ Risk control: after TP1, shift stop to entry.
The long on LLY has a technical case, not just a pretty candle. Watch sellers returning to the level.
📚 Order Flow: order book imbalance +32.1%; aggressive buys 52.2%. Based on this data, flow is mixed and lacks a clear direction.
Setup score: 85/100. Professional approach requires a hard stop-loss. ⚠️ Risk to stop is high (6.95%): reduce position size.
Volume within normal range (1.2×).
Break of range boundary 1395.91 with a quality retest. Technical view supported by: 4h, 8h, 1d, 1w. Risk: 6.95%. ATR(14): 33.156.
📲 Follow the channel for deeper analysis and curated setups!
Material is for educational purposes. Author is not responsible for your trading results.
#LLY #LLYNews $LLY 👈 Tap to trade
1
259
·
--
$LLY daily bullish signal + weekly bullish trend confirmation, multi-timeframe confluence turns bullish🔥
════════════════════
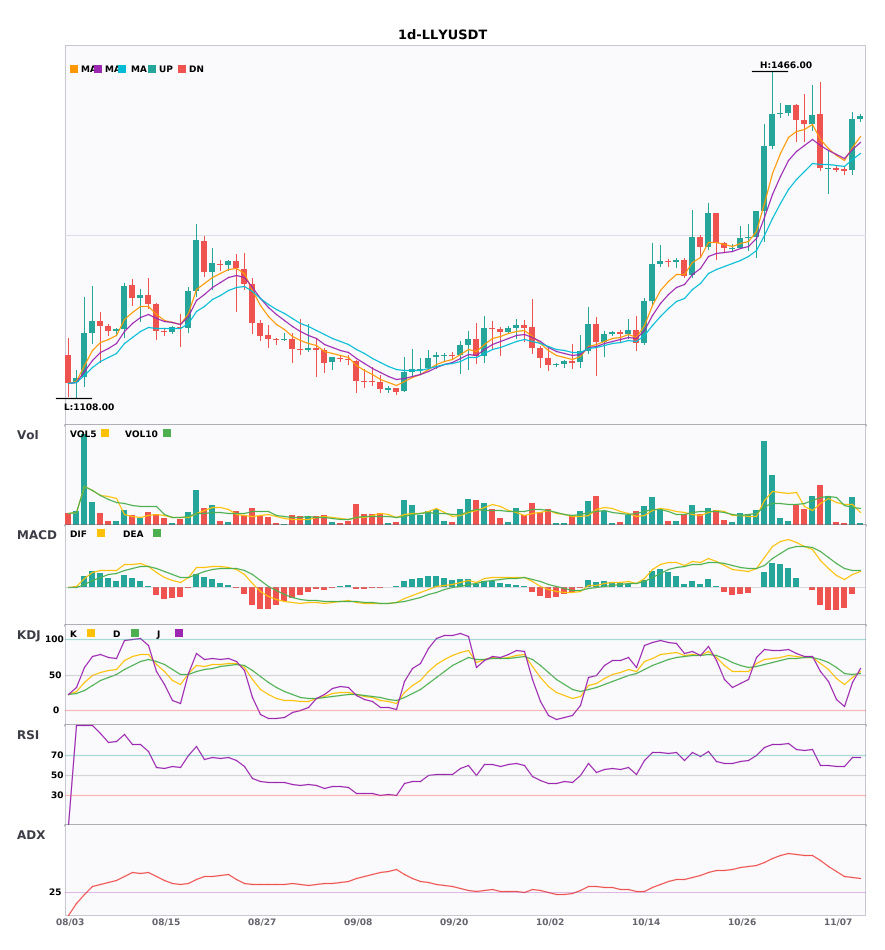
🔴 $LLY daily bullish signal
⚠️Technical analysis: Weekly bullish confluence confirmed | Daily entry: EMA5 crosses above EMA8, signaling a short-term bullish reversal | Increased trading volume (1.6x)
📢Market update: Binance Will Support the International Business Machines Corporation (IBM), Apple Inc. (AAPL), Corning Incorporated (GLW), and Eli Lilly and Company (LLY) Cash Dividend Distribution via bStocks
════════════════════
🔔 Follow for first-hand market updates 🔔
#多周期共振 #LLY
📌 When trading, check whether the candlestick patterns align
$LLY daily bullish signal + weekly bullish trend confirmation, multi-timeframe confluence turns bullish🔥
════════════════════
🔴 $LLY daily bullish signal
⚠️Technical analysis: Weekly bullish confluence confirmed | Daily entry: EMA5 crosses above EMA8, signaling a short-term bullish reversal | Increased trading volume (1.6x)
📢Market update: Binance Will Support the International Business Machines Corporation (IBM), Apple Inc. (AAPL), Corning Incorporated (GLW), and Eli Lilly and Company (LLY) Cash Dividend Distribution via bStocks
════════════════════
🔔 Follow for first-hand market updates 🔔
#多周期共振 #LLY
📌 When trading, check whether the candlestick patterns align
════════════════════
🔴 $LLY daily bullish signal
⚠️Technical analysis: Weekly bullish confluence confirmed | Daily entry: EMA5 crosses above EMA8, signaling a short-term bullish reversal | Increased trading volume (1.6x)
📢Market update: Binance Will Support the International Business Machines Corporation (IBM), Apple Inc. (AAPL), Corning Incorporated (GLW), and Eli Lilly and Company (LLY) Cash Dividend Distribution via bStocks
════════════════════
🔔 Follow for first-hand market updates 🔔
#多周期共振 #LLY
📌 When trading, check whether the candlestick patterns align
18
·
--
Multi-timeframe confluence: 3 assets with 30-minute bearish signals + 4-hour bearish trend confirmation🔥
════════════════════
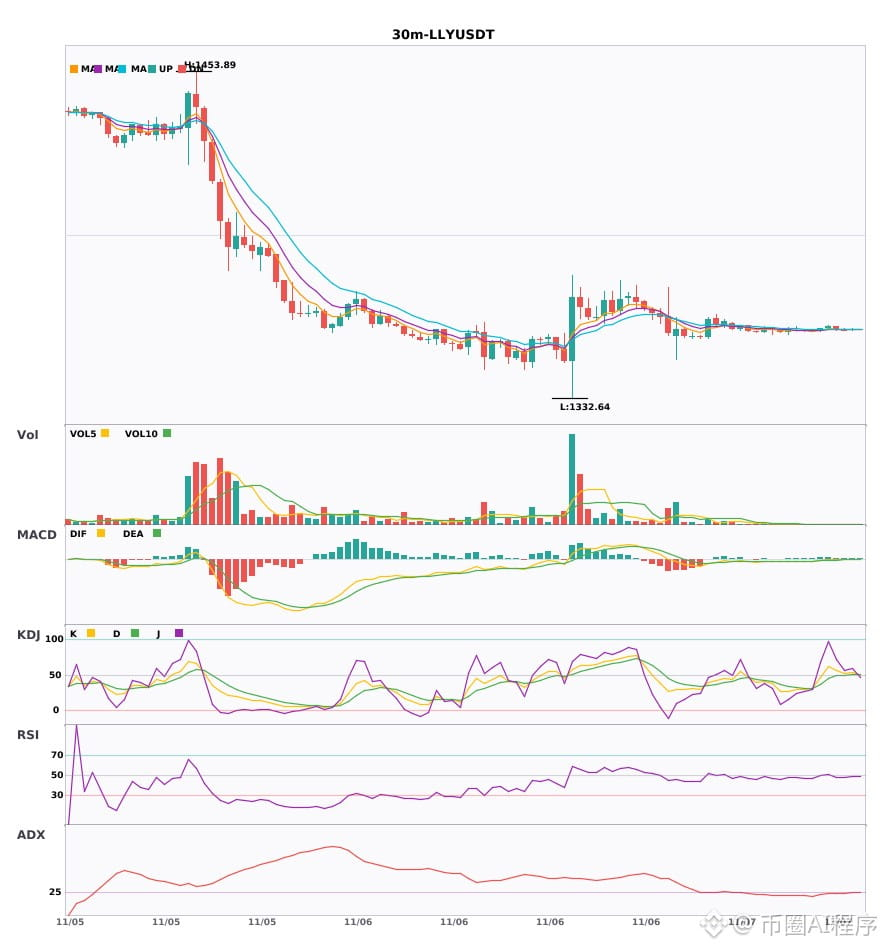
🟢 $LLY 30-minute bearish signal
⚠️Technical analysis: 4-hour bearish confluence confirmed | 30-minute entry: EMA5 crosses below EMA8, short-term bearish shift | Normal volume (1.3x)
📢Market update: Binance Will Support the International Business Machines Corporation (IBM), Apple Inc. (AAPL), Corning Incorporated (GLW), and Eli Lilly and Company (LLY) Cash Dividend Distribution via bStocks
════════════════════
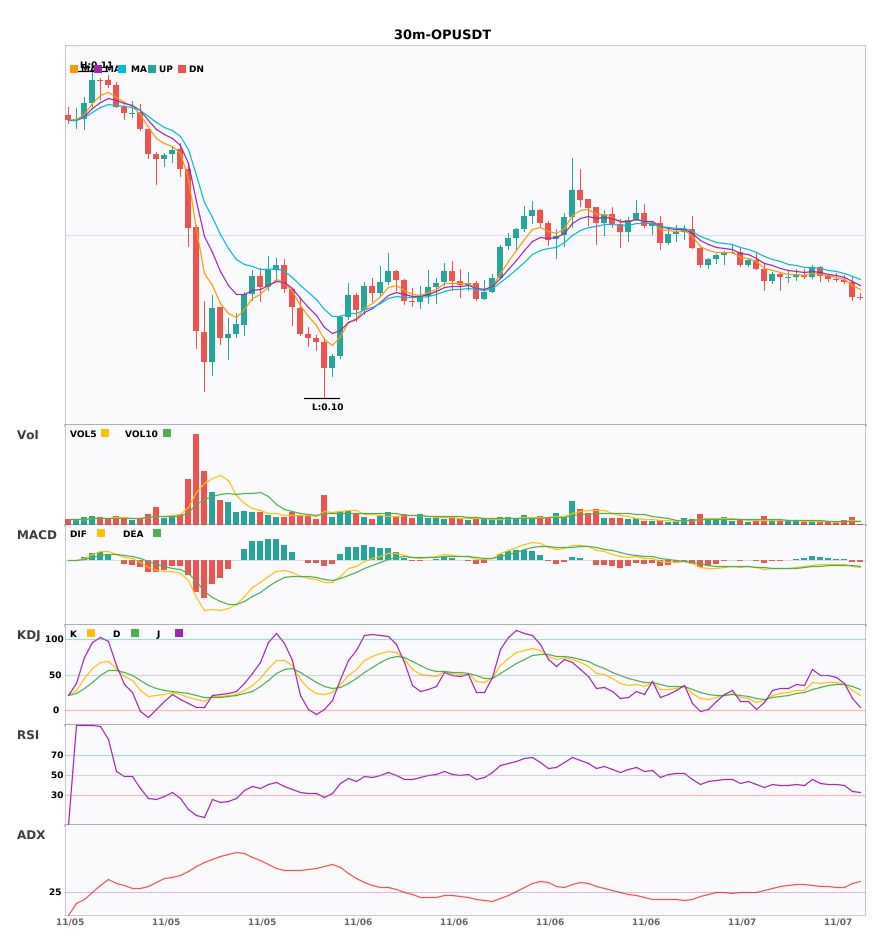
🟢 $OP 30-minute bearish signal
⚠️Technical analysis: 4-hour bearish confluence confirmed | 30-minute entry: MACD bearish crossover below zero, bearish momentum accelerating | EMA5 < EMA8 < EMA13, bearish alignment | KDJ bearish crossover, short-term outlook bearish (K: 28.3, D: 34.0) | Volume increased (2.1x)
════════════════════
🟢 $NIL 30-minute bearish signal
⚠️Technical analysis: 4-hour bearish confluence confirmed | 30-minute entry: MACD bearish crossover below zero, bearish momentum accelerating | EMA5 < EMA8 < EMA13, bearish alignment | KDJ in weak territory, bears in control (K: 23.9, D: 31.6) | Volume increased (1.5x)
════════════════════
🔔 Follow for first-hand market alerts 🔔
#多周期共振 #LLY #OP #NIL
📌 When trading, pay attention to whether the candlestick pattern meets expectations
Multi-timeframe confluence: 3 assets with 30-minute bearish signals + 4-hour bearish trend confirmation🔥
════════════════════
🟢 $LLY 30-minute bearish signal
⚠️Technical analysis: 4-hour bearish confluence confirmed | 30-minute entry: EMA5 crosses below EMA8, short-term bearish shift | Normal volume (1.3x)
📢Market update: Binance Will Support the International Business Machines Corporation (IBM), Apple Inc. (AAPL), Corning Incorporated (GLW), and Eli Lilly and Company (LLY) Cash Dividend Distribution via bStocks
════════════════════
🟢 $OP 30-minute bearish signal
⚠️Technical analysis: 4-hour bearish confluence confirmed | 30-minute entry: MACD bearish crossover below zero, bearish momentum accelerating | EMA5 < EMA8 < EMA13, bearish alignment | KDJ bearish crossover, short-term outlook bearish (K: 28.3, D: 34.0) | Volume increased (2.1x)
════════════════════
🟢 $NIL 30-minute bearish signal
⚠️Technical analysis: 4-hour bearish confluence confirmed | 30-minute entry: MACD bearish crossover below zero, bearish momentum accelerating | EMA5 < EMA8 < EMA13, bearish alignment | KDJ in weak territory, bears in control (K: 23.9, D: 31.6) | Volume increased (1.5x)
════════════════════
🔔 Follow for first-hand market alerts 🔔
#多周期共振 #LLY #OP #NIL
📌 When trading, pay attention to whether the candlestick pattern meets expectations
════════════════════
🟢 $LLY 30-minute bearish signal
⚠️Technical analysis: 4-hour bearish confluence confirmed | 30-minute entry: EMA5 crosses below EMA8, short-term bearish shift | Normal volume (1.3x)
📢Market update: Binance Will Support the International Business Machines Corporation (IBM), Apple Inc. (AAPL), Corning Incorporated (GLW), and Eli Lilly and Company (LLY) Cash Dividend Distribution via bStocks
════════════════════
🟢 $OP 30-minute bearish signal
⚠️Technical analysis: 4-hour bearish confluence confirmed | 30-minute entry: MACD bearish crossover below zero, bearish momentum accelerating | EMA5 < EMA8 < EMA13, bearish alignment | KDJ bearish crossover, short-term outlook bearish (K: 28.3, D: 34.0) | Volume increased (2.1x)
════════════════════
🟢 $NIL 30-minute bearish signal
⚠️Technical analysis: 4-hour bearish confluence confirmed | 30-minute entry: MACD bearish crossover below zero, bearish momentum accelerating | EMA5 < EMA8 < EMA13, bearish alignment | KDJ in weak territory, bears in control (K: 23.9, D: 31.6) | Volume increased (1.5x)
════════════════════
🔔 Follow for first-hand market alerts 🔔
#多周期共振 #LLY #OP #NIL
📌 When trading, pay attention to whether the candlestick pattern meets expectations
16
·
--
$LLY 30-minute bearish signal + 4-hour bearish trend confirmation; multi-timeframe confluence turns bearish 🔥
════════════════════
🟢 $LLY 30-minute bearish signal
⚠️Technical analysis: 4-hour bearish confluence confirmed | 30-minute entry: EMA5 crossed below EMA8, signaling a short-term bearish turn | Volume normal (1.3x)
📢Market update: Binance Will Support the International Business Machines Corporation (IBM), Apple Inc. (AAPL), Corning Incorporated (GLW), and Eli Lilly and Company (LLY) Cash Dividend Distribution via bStocks
════════════════════
🔔 Follow for first-hand market alerts 🔔
#多周期共振 #LLY
📌 When trading, pay attention to whether the candlestick patterns align
$LLY 30-minute bearish signal + 4-hour bearish trend confirmation; multi-timeframe confluence turns bearish 🔥
════════════════════
🟢 $LLY 30-minute bearish signal
⚠️Technical analysis: 4-hour bearish confluence confirmed | 30-minute entry: EMA5 crossed below EMA8, signaling a short-term bearish turn | Volume normal (1.3x)
📢Market update: Binance Will Support the International Business Machines Corporation (IBM), Apple Inc. (AAPL), Corning Incorporated (GLW), and Eli Lilly and Company (LLY) Cash Dividend Distribution via bStocks
════════════════════
🔔 Follow for first-hand market alerts 🔔
#多周期共振 #LLY
📌 When trading, pay attention to whether the candlestick patterns align
════════════════════
🟢 $LLY 30-minute bearish signal
⚠️Technical analysis: 4-hour bearish confluence confirmed | 30-minute entry: EMA5 crossed below EMA8, signaling a short-term bearish turn | Volume normal (1.3x)
📢Market update: Binance Will Support the International Business Machines Corporation (IBM), Apple Inc. (AAPL), Corning Incorporated (GLW), and Eli Lilly and Company (LLY) Cash Dividend Distribution via bStocks
════════════════════
🔔 Follow for first-hand market alerts 🔔
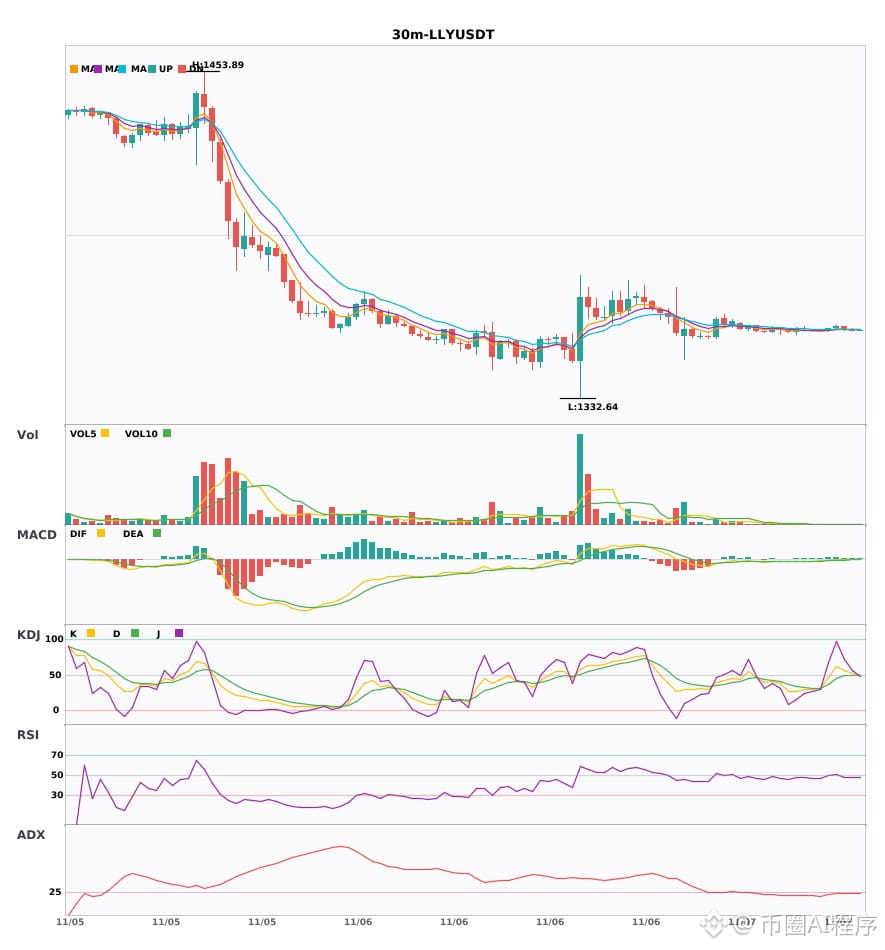
#多周期共振 #LLY
📌 When trading, pay attention to whether the candlestick patterns align
5
$S / $LLY 30-minute timeframe is leaning bearish, with short-term pressure
📉 $S | 30-minute bearish signal
━━━━━━━━━━━━━━━━━━
Technical analysis: ADX(41) indicates a clear trending market | MACD is bearish, the trend is weak, and momentum is strengthening | EMA5 < EMA8 < EMA13, bearish alignment | KDJ is weak, with bears in control (K: 33.4, D: 41.2) | Volume surged (3.9x)
Price change: -1.2700%
📉 $LLY | 30-minute bearish signal
━━━━━━━━━━━━━━━━━━
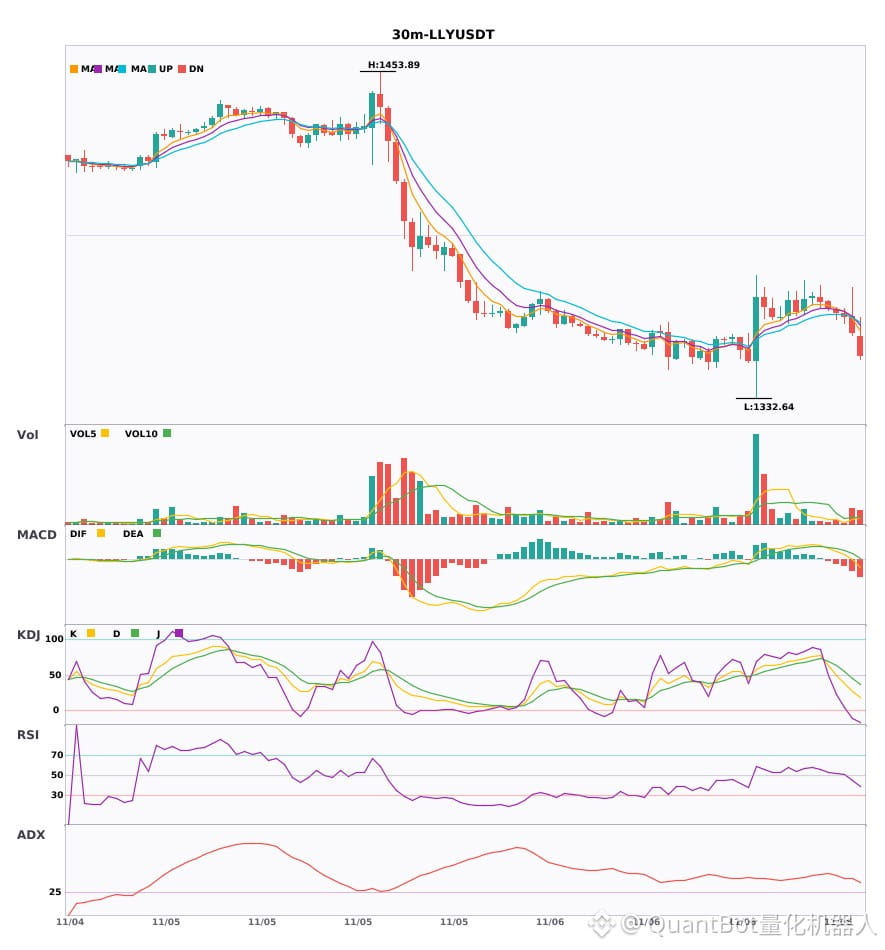
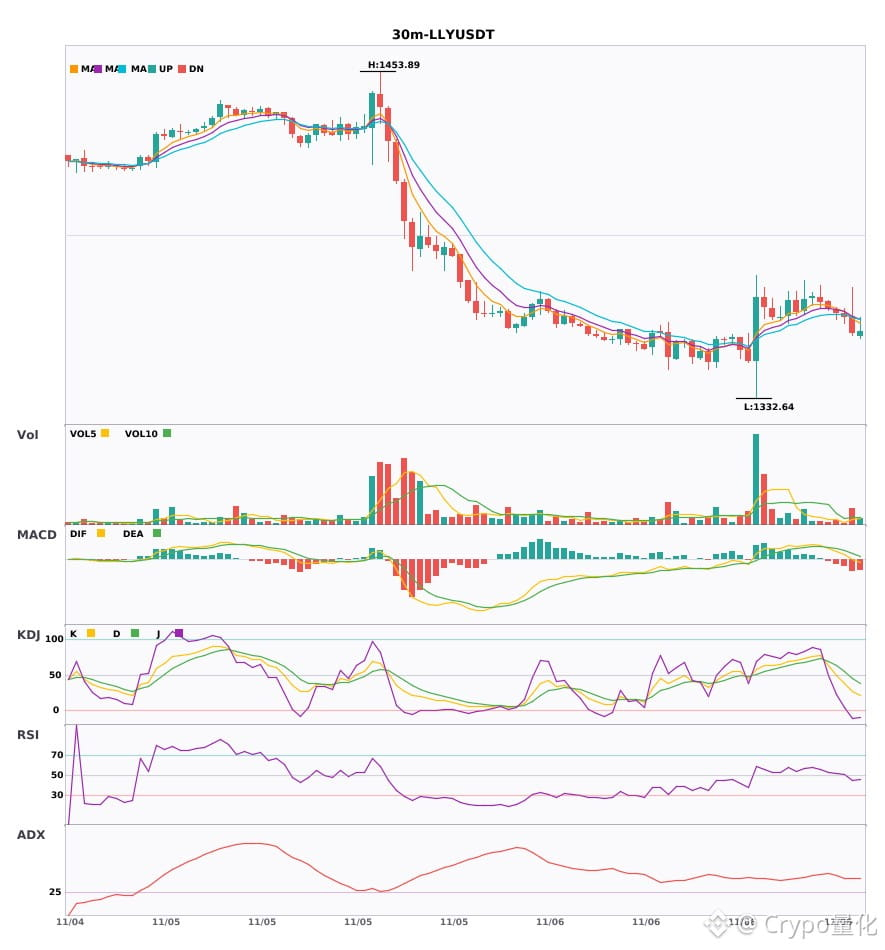
Technical analysis: ADX(43) indicates a clear trending market | MACD DIF has fallen below the zero line, signaling a bearish trend | EMA5 crossed below EMA8, turning bearish in the short term | KDJ is weak, with bears in control (K: 26.5, D: 45.2) | Volume increased (2.4x)
Price change: -0.4400%
📌 Market update: Binance Will Support the International Business Machines Corporation (IBM), Apple Inc. (AAPL), Corning Incorporated (GLW), and Eli Lilly and Company (LLY) Cash Dividend Distribution via bStocks
━━━━━━━━━━━━━━━━━━
#技术分析 #S #LLY
📌 The above content is for reference only and does not constitute investment advice
$S / $LLY 30-minute timeframe is leaning bearish, with short-term pressure
📉 $S | 30-minute bearish signal
━━━━━━━━━━━━━━━━━━
Technical analysis: ADX(41) indicates a clear trending market | MACD is bearish, the trend is weak, and momentum is strengthening | EMA5 < EMA8 < EMA13, bearish alignment | KDJ is weak, with bears in control (K: 33.4, D: 41.2) | Volume surged (3.9x)
Price change: -1.2700%
📉 $LLY | 30-minute bearish signal
━━━━━━━━━━━━━━━━━━
Technical analysis: ADX(43) indicates a clear trending market | MACD DIF has fallen below the zero line, signaling a bearish trend | EMA5 crossed below EMA8, turning bearish in the short term | KDJ is weak, with bears in control (K: 26.5, D: 45.2) | Volume increased (2.4x)
Price change: -0.4400%
📌 Market update: Binance Will Support the International Business Machines Corporation (IBM), Apple Inc. (AAPL), Corning Incorporated (GLW), and Eli Lilly and Company (LLY) Cash Dividend Distribution via bStocks
━━━━━━━━━━━━━━━━━━
#技术分析 #S #LLY
📌 The above content is for reference only and does not constitute investment advice
📉 $S | 30-minute bearish signal
━━━━━━━━━━━━━━━━━━
Technical analysis: ADX(41) indicates a clear trending market | MACD is bearish, the trend is weak, and momentum is strengthening | EMA5 < EMA8 < EMA13, bearish alignment | KDJ is weak, with bears in control (K: 33.4, D: 41.2) | Volume surged (3.9x)
Price change: -1.2700%
📉 $LLY | 30-minute bearish signal
━━━━━━━━━━━━━━━━━━
Technical analysis: ADX(43) indicates a clear trending market | MACD DIF has fallen below the zero line, signaling a bearish trend | EMA5 crossed below EMA8, turning bearish in the short term | KDJ is weak, with bears in control (K: 26.5, D: 45.2) | Volume increased (2.4x)
Price change: -0.4400%
📌 Market update: Binance Will Support the International Business Machines Corporation (IBM), Apple Inc. (AAPL), Corning Incorporated (GLW), and Eli Lilly and Company (LLY) Cash Dividend Distribution via bStocks
━━━━━━━━━━━━━━━━━━
#技术分析 #S #LLY
📌 The above content is for reference only and does not constitute investment advice
7
·
--
$S / $LLY 30-minute confluence turns bearish; bearish signals appear simultaneously 🔥
════════════════════
🟢 $S 30-minute bearish signal
⚠️Technical analysis: ADX(41): Clear trending market | MACD is bearish; trend is weak, momentum is strengthening | EMA5 < EMA8 < EMA13: bearish alignment | KDJ is weak, with bears in control (K: 33.4, D: 41.2) | Volume surge (3.9x)
════════════════════
🟢 $LLY 30-minute bearish signal
⚠️Technical analysis: ADX(43): Clear trending market | MACD DIF fell below the zero line; trend turns bearish | EMA5 crossed below EMA8; short-term trend turns bearish | KDJ is weak, with bears in control (K: 26.5, D: 45.2) | Volume increased (2.4x)
📢Market update: Binance Will Support the International Business Machines Corporation (IBM), Apple Inc. (AAPL), Corning Incorporated (GLW), and Eli Lilly and Company (LLY) Cash Dividend Distribution via bStocks
════════════════════
🔔 Follow for first-hand market updates 🔔
#技术分析 #S #LLY
📌 When trading, pay attention to whether the candlestick pattern matches
$S / $LLY 30-minute confluence turns bearish; bearish signals appear simultaneously 🔥
════════════════════
🟢 $S 30-minute bearish signal
⚠️Technical analysis: ADX(41): Clear trending market | MACD is bearish; trend is weak, momentum is strengthening | EMA5 < EMA8 < EMA13: bearish alignment | KDJ is weak, with bears in control (K: 33.4, D: 41.2) | Volume surge (3.9x)
════════════════════
🟢 $LLY 30-minute bearish signal
⚠️Technical analysis: ADX(43): Clear trending market | MACD DIF fell below the zero line; trend turns bearish | EMA5 crossed below EMA8; short-term trend turns bearish | KDJ is weak, with bears in control (K: 26.5, D: 45.2) | Volume increased (2.4x)
📢Market update: Binance Will Support the International Business Machines Corporation (IBM), Apple Inc. (AAPL), Corning Incorporated (GLW), and Eli Lilly and Company (LLY) Cash Dividend Distribution via bStocks
════════════════════
🔔 Follow for first-hand market updates 🔔
#技术分析 #S #LLY
📌 When trading, pay attention to whether the candlestick pattern matches
════════════════════
🟢 $S 30-minute bearish signal
⚠️Technical analysis: ADX(41): Clear trending market | MACD is bearish; trend is weak, momentum is strengthening | EMA5 < EMA8 < EMA13: bearish alignment | KDJ is weak, with bears in control (K: 33.4, D: 41.2) | Volume surge (3.9x)
════════════════════
🟢 $LLY 30-minute bearish signal
⚠️Technical analysis: ADX(43): Clear trending market | MACD DIF fell below the zero line; trend turns bearish | EMA5 crossed below EMA8; short-term trend turns bearish | KDJ is weak, with bears in control (K: 26.5, D: 45.2) | Volume increased (2.4x)
📢Market update: Binance Will Support the International Business Machines Corporation (IBM), Apple Inc. (AAPL), Corning Incorporated (GLW), and Eli Lilly and Company (LLY) Cash Dividend Distribution via bStocks
════════════════════
🔔 Follow for first-hand market updates 🔔
#技术分析 #S #LLY
📌 When trading, pay attention to whether the candlestick pattern matches
2
·
--
$LLY 30-minute confluence with 4-hour bullish momentum—has a short-term opportunity arrived? 🔥
════════════════════
🔴 $LLY 30-minute bullish signal
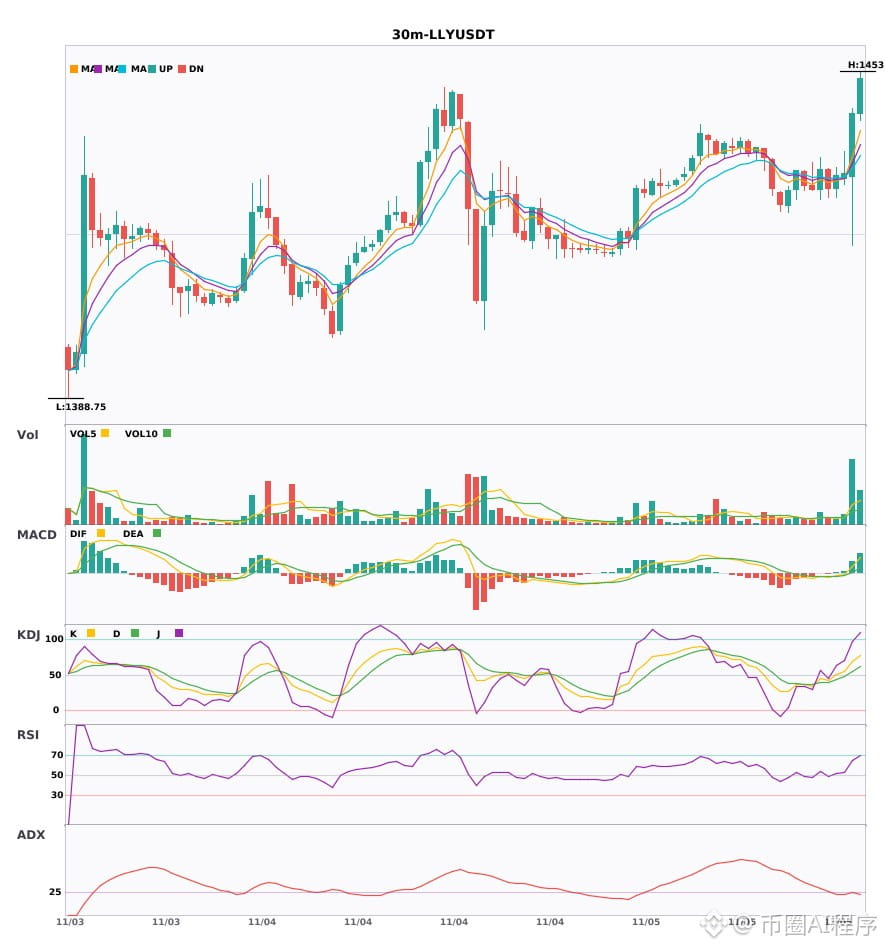
⚠️ Technical analysis: 4-hour bullish confluence confirmed | 30-minute entry: MACD DIF breaks above the zero line, trend turns bullish | EMA5 crosses above EMA8, short-term trend turns bullish | KDJ is running strong, bulls have the upper hand (K is 68.8, D is 54.4) | Volume surges (5.0x)
════════════════════
🔔 Follow for the latest market movements 🔔
#多周期共振 #LLY
📌 When trading, check whether the candlestick pattern confirms the setup
$LLY 30-minute confluence with 4-hour bullish momentum—has a short-term opportunity arrived? 🔥
════════════════════
🔴 $LLY 30-minute bullish signal
⚠️ Technical analysis: 4-hour bullish confluence confirmed | 30-minute entry: MACD DIF breaks above the zero line, trend turns bullish | EMA5 crosses above EMA8, short-term trend turns bullish | KDJ is running strong, bulls have the upper hand (K is 68.8, D is 54.4) | Volume surges (5.0x)
════════════════════
🔔 Follow for the latest market movements 🔔
#多周期共振 #LLY
📌 When trading, check whether the candlestick pattern confirms the setup
════════════════════
🔴 $LLY 30-minute bullish signal
⚠️ Technical analysis: 4-hour bullish confluence confirmed | 30-minute entry: MACD DIF breaks above the zero line, trend turns bullish | EMA5 crosses above EMA8, short-term trend turns bullish | KDJ is running strong, bulls have the upper hand (K is 68.8, D is 54.4) | Volume surges (5.0x)
════════════════════
🔔 Follow for the latest market movements 🔔
#多周期共振 #LLY
📌 When trading, check whether the candlestick pattern confirms the setup
10
·
--
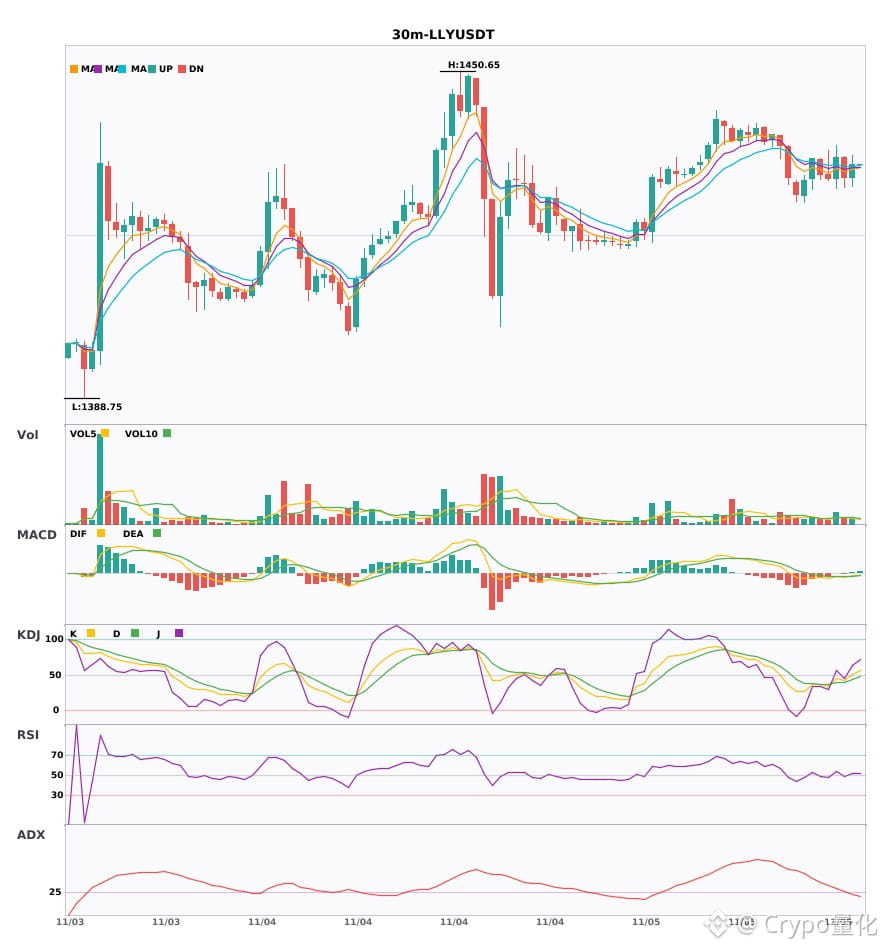
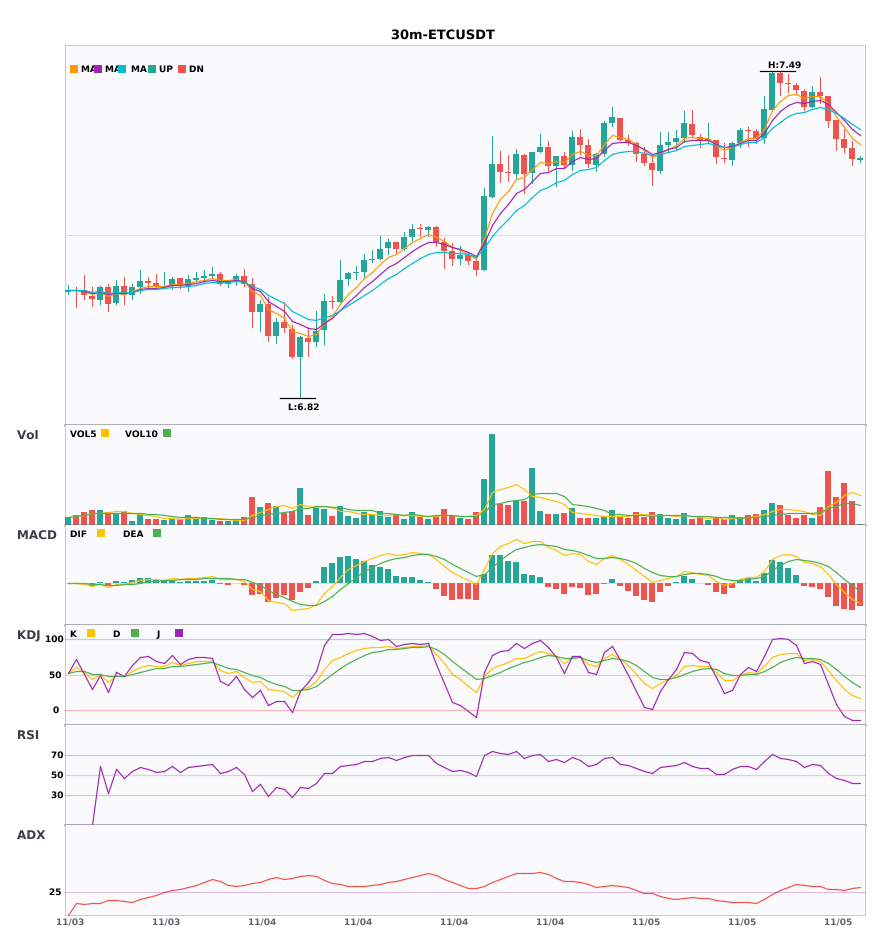
2 30-minute bearish alerts: $LLY / $ETC🔥
════════════════════
🟢 $LLY 30-minute bearish signal
⚠️Technical analysis: ADX(27) Trend is forming; opportunity to participate | MACD bearish crossover below zero; bearish momentum accelerating | EMA5 < EMA8 < EMA13, bearish alignment | KDJ trending weakly; bears have the upper hand (K: 41.9, D: 40.0) | Volume increased (1.8x)
════════════════════
🟢 $ETC 30-minute bearish signal
⚠️Technical analysis: ADX(31) Clear trending market | MACD bearish; trend is weak, momentum strengthening | EMA5 < EMA8 < EMA13, bearish alignment | KDJ trending weakly; bears have the upper hand (K: 29.5, D: 48.6) | Volume increased (2.0x)
════════════════════
🔔 Follow for the latest market movements 🔔
#技术分析 #LLY #ETC
📌 When trading, pay attention to whether the candlestick pattern confirms the signal
2 30-minute bearish alerts: $LLY / $ETC 🔥
════════════════════
🟢 $LLY 30-minute bearish signal
⚠️Technical analysis: ADX(27) Trend is forming; opportunity to participate | MACD bearish crossover below zero; bearish momentum accelerating | EMA5 < EMA8 < EMA13, bearish alignment | KDJ trending weakly; bears have the upper hand (K: 41.9, D: 40.0) | Volume increased (1.8x)
════════════════════
🟢 $ETC 30-minute bearish signal
⚠️Technical analysis: ADX(31) Clear trending market | MACD bearish; trend is weak, momentum strengthening | EMA5 < EMA8 < EMA13, bearish alignment | KDJ trending weakly; bears have the upper hand (K: 29.5, D: 48.6) | Volume increased (2.0x)
════════════════════
🔔 Follow for the latest market movements 🔔
#技术分析 #LLY #ETC
📌 When trading, pay attention to whether the candlestick pattern confirms the signal
════════════════════
🟢 $LLY 30-minute bearish signal
⚠️Technical analysis: ADX(27) Trend is forming; opportunity to participate | MACD bearish crossover below zero; bearish momentum accelerating | EMA5 < EMA8 < EMA13, bearish alignment | KDJ trending weakly; bears have the upper hand (K: 41.9, D: 40.0) | Volume increased (1.8x)
════════════════════
🟢 $ETC 30-minute bearish signal
⚠️Technical analysis: ADX(31) Clear trending market | MACD bearish; trend is weak, momentum strengthening | EMA5 < EMA8 < EMA13, bearish alignment | KDJ trending weakly; bears have the upper hand (K: 29.5, D: 48.6) | Volume increased (2.0x)
════════════════════
🔔 Follow for the latest market movements 🔔
#技术分析 #LLY #ETC
📌 When trading, pay attention to whether the candlestick pattern confirms the signal
8
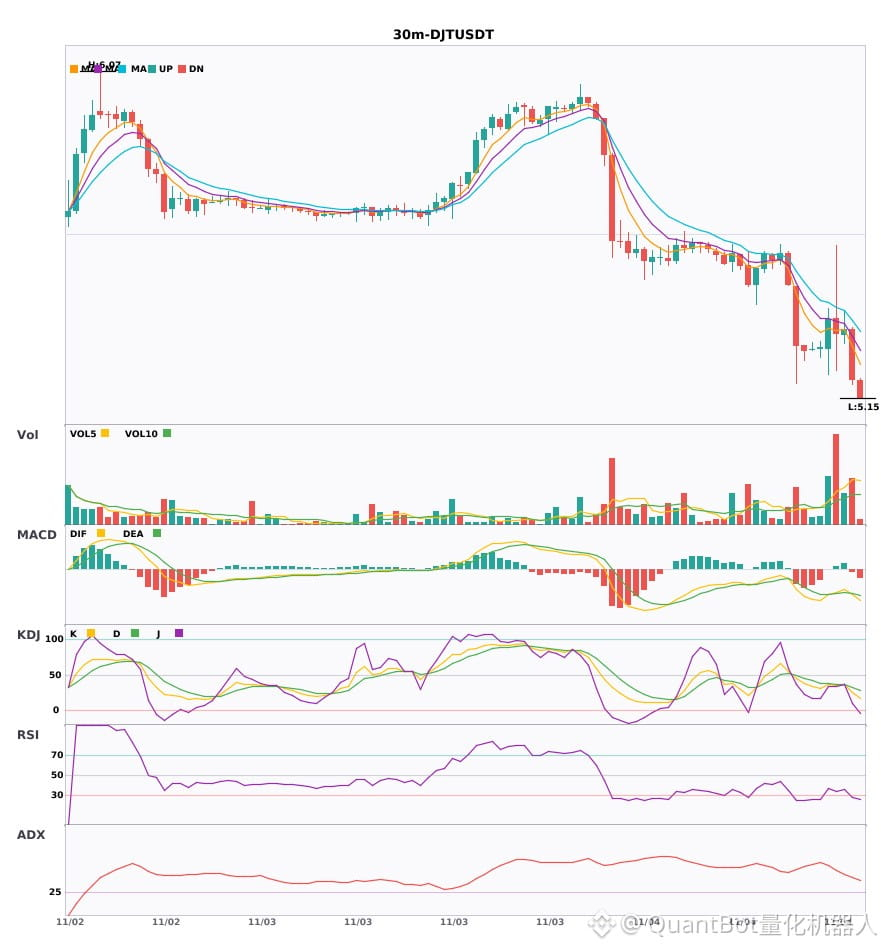
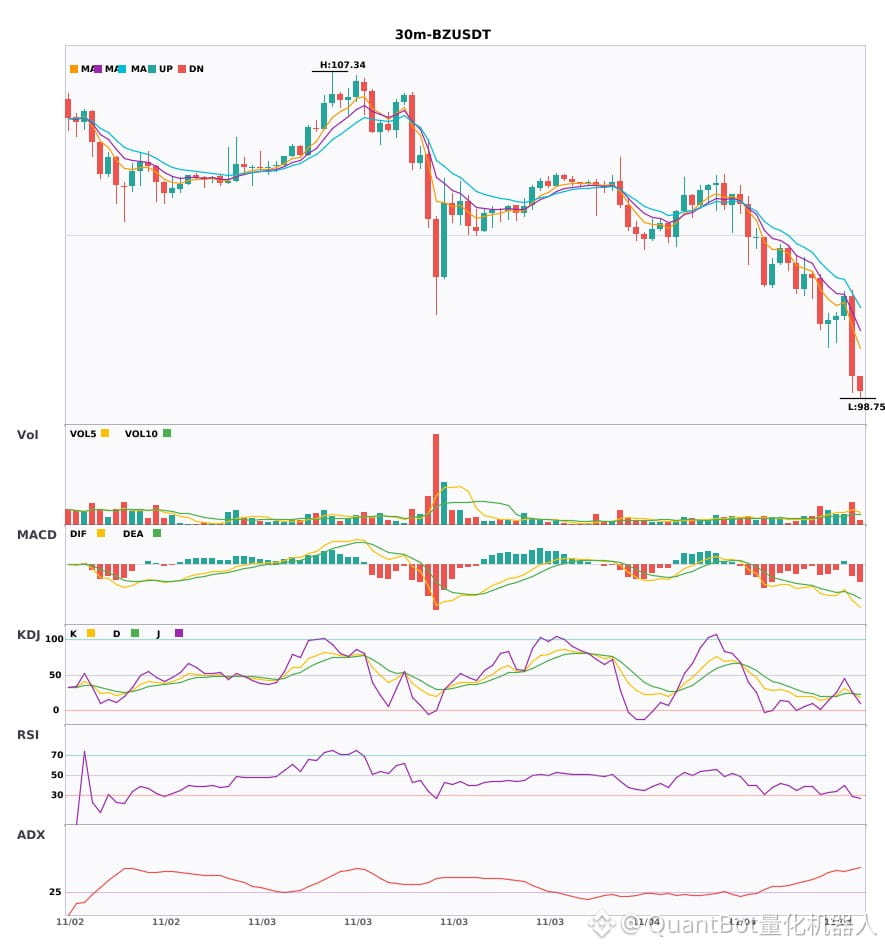
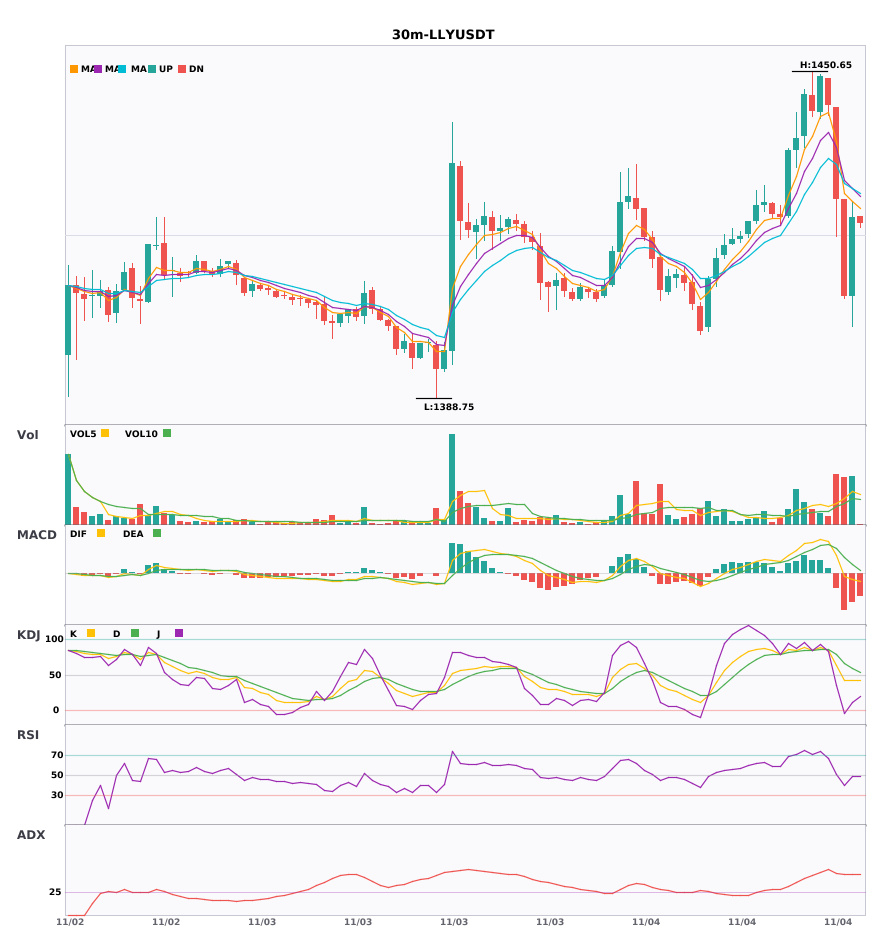
$DJT / $BZ / $LLY 30-minute timeframe bearish, under short-term pressure
📉 $DJT | 30-minute bearish signal
━━━━━━━━━━━━━━━━━━
Technical analysis: ADX(40), clear trending market | MACD bearish death cross below zero, bearish momentum accelerating | EMA5 < EMA8 < EMA13, bearish alignment | KDJ death cross, short-term outlook bearish (K: 25.6, D: 33.1) | Volume increased (1.5x)
Price change: -2.6900%
📉 $BZ | 30-minute bearish signal
━━━━━━━━━━━━━━━━━━
Technical analysis: ADX(54), very strong trend (watch for an overheated pullback) | MACD bearish death cross below zero, bearish momentum accelerating | EMA5 < EMA8 < EMA13, bearish alignment | KDJ showing weakness, bears in control (K: 24.4, D: 24.1) | Volume increased (2.1x)
Price change: -2.0800%
📉 $LLY | 30-minute bearish signal
━━━━━━━━━━━━━━━━━━
Technical analysis: ADX(50), very strong trend (watch for an overheated pullback) | MACD bearish, trend is weak and momentum is fading | EMA5 < EMA8 < EMA13, bearish alignment | Volume increased (2.2x)
Price change: 1.0600%
━━━━━━━━━━━━━━━━━━
#技术分析 #DJT #BZ #LLY
📌 The above is for reference only and does not constitute investment advice
$DJT / $BZ / $LLY 30-minute timeframe bearish, under short-term pressure
📉 $DJT | 30-minute bearish signal
━━━━━━━━━━━━━━━━━━
Technical analysis: ADX(40), clear trending market | MACD bearish death cross below zero, bearish momentum accelerating | EMA5 < EMA8 < EMA13, bearish alignment | KDJ death cross, short-term outlook bearish (K: 25.6, D: 33.1) | Volume increased (1.5x)
Price change: -2.6900%
📉 $BZ | 30-minute bearish signal
━━━━━━━━━━━━━━━━━━
Technical analysis: ADX(54), very strong trend (watch for an overheated pullback) | MACD bearish death cross below zero, bearish momentum accelerating | EMA5 < EMA8 < EMA13, bearish alignment | KDJ showing weakness, bears in control (K: 24.4, D: 24.1) | Volume increased (2.1x)
Price change: -2.0800%
📉 $LLY | 30-minute bearish signal
━━━━━━━━━━━━━━━━━━
Technical analysis: ADX(50), very strong trend (watch for an overheated pullback) | MACD bearish, trend is weak and momentum is fading | EMA5 < EMA8 < EMA13, bearish alignment | Volume increased (2.2x)
Price change: 1.0600%
━━━━━━━━━━━━━━━━━━
#技术分析 #DJT #BZ #LLY
📌 The above is for reference only and does not constitute investment advice
📉 $DJT | 30-minute bearish signal
━━━━━━━━━━━━━━━━━━
Technical analysis: ADX(40), clear trending market | MACD bearish death cross below zero, bearish momentum accelerating | EMA5 < EMA8 < EMA13, bearish alignment | KDJ death cross, short-term outlook bearish (K: 25.6, D: 33.1) | Volume increased (1.5x)
Price change: -2.6900%
📉 $BZ | 30-minute bearish signal
━━━━━━━━━━━━━━━━━━
Technical analysis: ADX(54), very strong trend (watch for an overheated pullback) | MACD bearish death cross below zero, bearish momentum accelerating | EMA5 < EMA8 < EMA13, bearish alignment | KDJ showing weakness, bears in control (K: 24.4, D: 24.1) | Volume increased (2.1x)
Price change: -2.0800%
📉 $LLY | 30-minute bearish signal
━━━━━━━━━━━━━━━━━━
Technical analysis: ADX(50), very strong trend (watch for an overheated pullback) | MACD bearish, trend is weak and momentum is fading | EMA5 < EMA8 < EMA13, bearish alignment | Volume increased (2.2x)
Price change: 1.0600%
━━━━━━━━━━━━━━━━━━
#技术分析 #DJT #BZ #LLY
📌 The above is for reference only and does not constitute investment advice
21
·
--
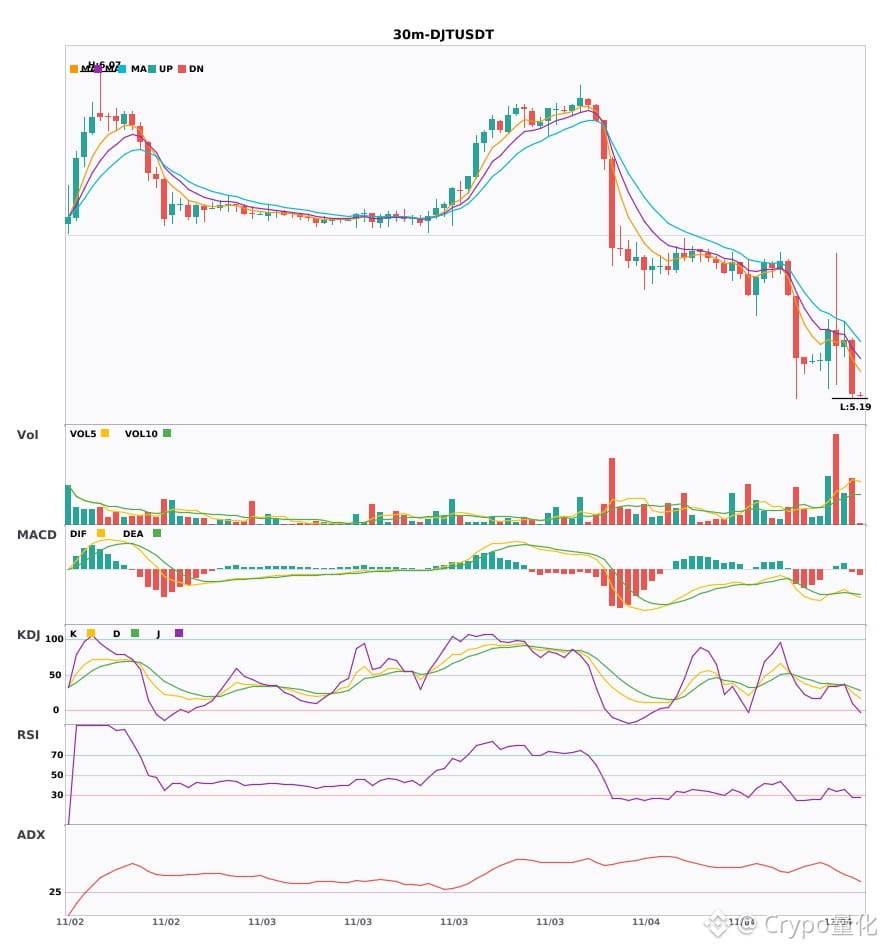
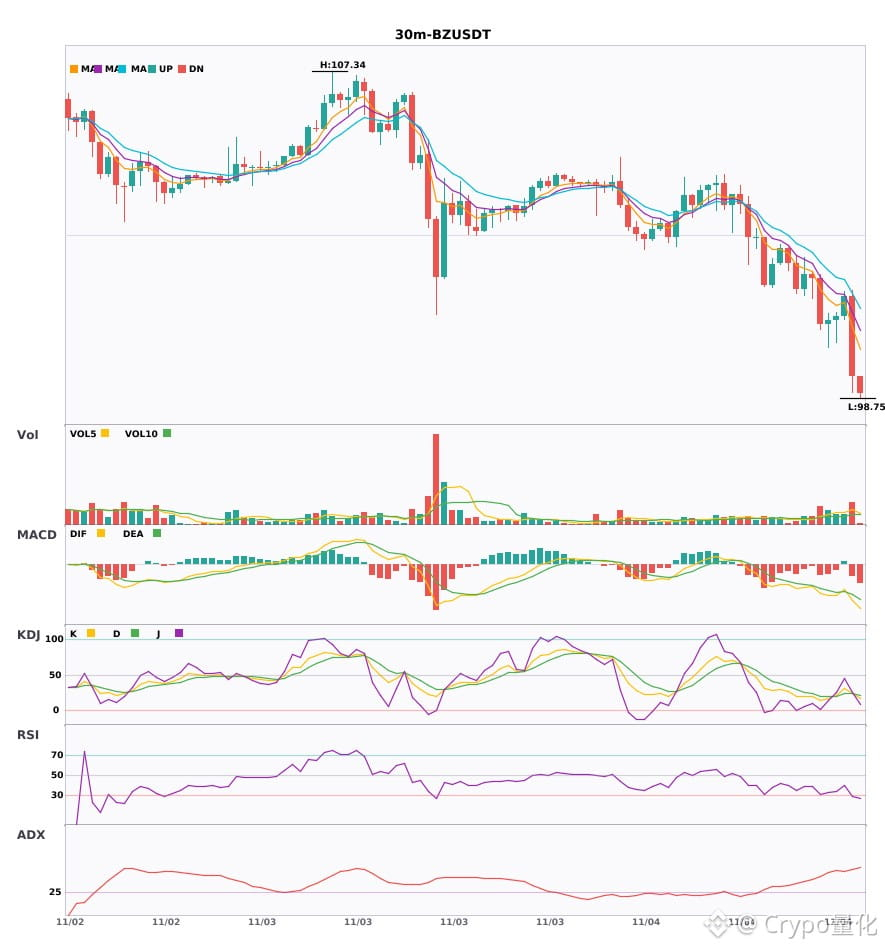
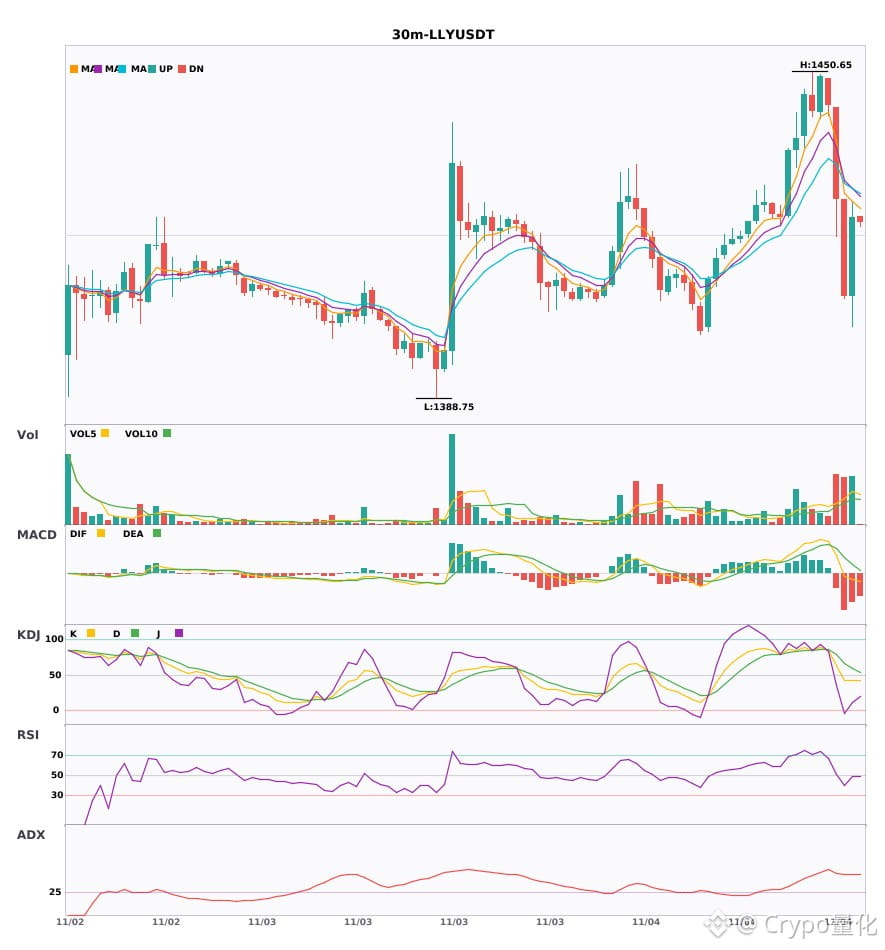
3 bearish alerts on the 30-minute timeframe: $DJT / $BZ / $LLY🔥
════════════════════
🟢 $DJT 30-minute bearish signal
⚠️Technical analysis: ADX(40) indicates a clear trending market | MACD bearish crossover below zero, bearish momentum accelerating | EMA5 < EMA8 < EMA13, bearish alignment | KDJ bearish crossover, short-term outlook bearish (K: 25.6, D: 33.1) | Volume increased (1.5x)
════════════════════
🟢 $BZ 30-minute bearish signal
⚠️Technical analysis: ADX(54) indicates a very strong trend (watch for an overbought pullback) | MACD bearish crossover below zero, bearish momentum accelerating | EMA5 < EMA8 < EMA13, bearish alignment | KDJ trending weakly, bears have the upper hand (K: 24.4, D: 24.1) | Volume increased (2.1x)
════════════════════
🟢 $LLY 30-minute bearish signal
⚠️Technical analysis: ADX(50) indicates a very strong trend (watch for an overbought pullback) | MACD trending bearishly, overall trend is weak and momentum is fading | EMA5 < EMA8 < EMA13, bearish alignment | Volume increased (2.2x)
════════════════════
🔔 Follow for real-time market alerts 🔔
#技术分析 #DJT #BZ #LLY
📌 When trading, pay attention to whether the candlestick pattern confirms the signal
3 bearish alerts on the 30-minute timeframe: $DJT / $BZ / $LLY 🔥
════════════════════
🟢 $DJT 30-minute bearish signal
⚠️Technical analysis: ADX(40) indicates a clear trending market | MACD bearish crossover below zero, bearish momentum accelerating | EMA5 < EMA8 < EMA13, bearish alignment | KDJ bearish crossover, short-term outlook bearish (K: 25.6, D: 33.1) | Volume increased (1.5x)
════════════════════
🟢 $BZ 30-minute bearish signal
⚠️Technical analysis: ADX(54) indicates a very strong trend (watch for an overbought pullback) | MACD bearish crossover below zero, bearish momentum accelerating | EMA5 < EMA8 < EMA13, bearish alignment | KDJ trending weakly, bears have the upper hand (K: 24.4, D: 24.1) | Volume increased (2.1x)
════════════════════
🟢 $LLY 30-minute bearish signal
⚠️Technical analysis: ADX(50) indicates a very strong trend (watch for an overbought pullback) | MACD trending bearishly, overall trend is weak and momentum is fading | EMA5 < EMA8 < EMA13, bearish alignment | Volume increased (2.2x)
════════════════════
🔔 Follow for real-time market alerts 🔔
#技术分析 #DJT #BZ #LLY
📌 When trading, pay attention to whether the candlestick pattern confirms the signal
════════════════════
🟢 $DJT 30-minute bearish signal
⚠️Technical analysis: ADX(40) indicates a clear trending market | MACD bearish crossover below zero, bearish momentum accelerating | EMA5 < EMA8 < EMA13, bearish alignment | KDJ bearish crossover, short-term outlook bearish (K: 25.6, D: 33.1) | Volume increased (1.5x)
════════════════════
🟢 $BZ 30-minute bearish signal
⚠️Technical analysis: ADX(54) indicates a very strong trend (watch for an overbought pullback) | MACD bearish crossover below zero, bearish momentum accelerating | EMA5 < EMA8 < EMA13, bearish alignment | KDJ trending weakly, bears have the upper hand (K: 24.4, D: 24.1) | Volume increased (2.1x)
════════════════════
🟢 $LLY 30-minute bearish signal
⚠️Technical analysis: ADX(50) indicates a very strong trend (watch for an overbought pullback) | MACD trending bearishly, overall trend is weak and momentum is fading | EMA5 < EMA8 < EMA13, bearish alignment | Volume increased (2.2x)
════════════════════
🔔 Follow for real-time market alerts 🔔
#技术分析 #DJT #BZ #LLY
📌 When trading, pay attention to whether the candlestick pattern confirms the signal
18
·
--
$LLY / $1000PEPE / $EVAA 4-hour bullish signals, daily bullish trend confirmed 🔥
════════════════════
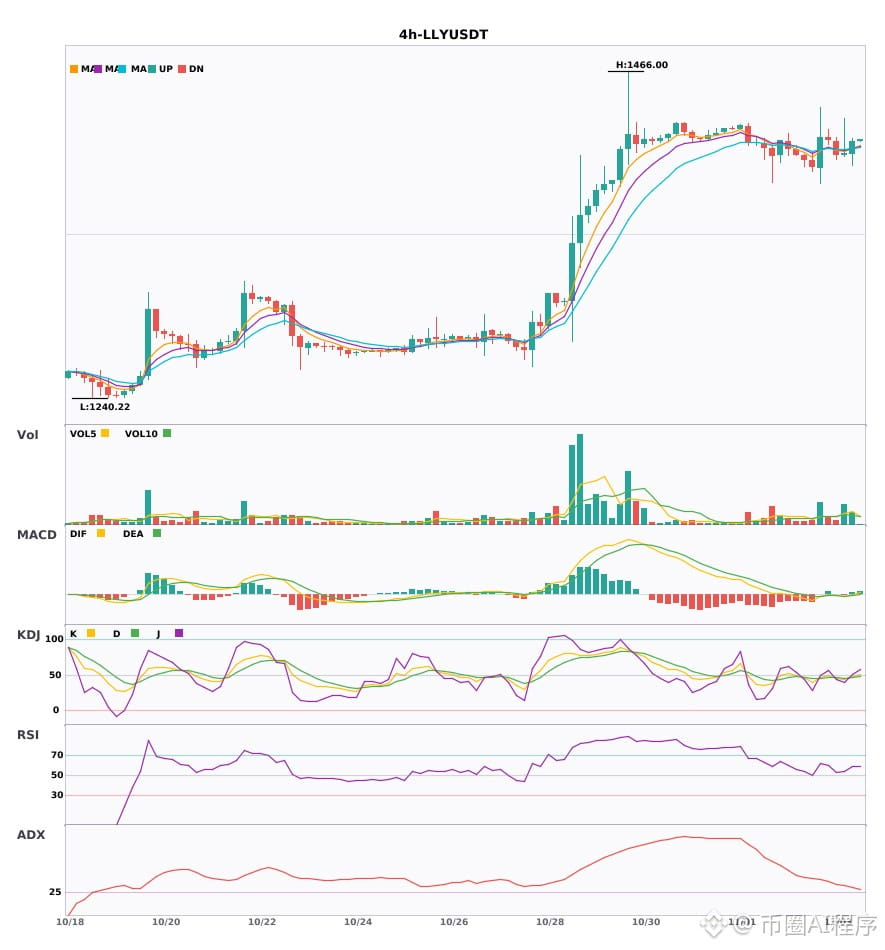
🔴 $LLY 4-hour bullish signal
⚠️Technical analysis: Daily bullish convergence confirmed | 4-hour entry: MACD golden cross above zero, bullish momentum unleashed | EMA5 crosses above EMA8, short-term trend turns bullish | KDJ golden cross, short-term bullish outlook (K: 47.3, D: 45.9) | Volume increased (2.0x)
════════════════════
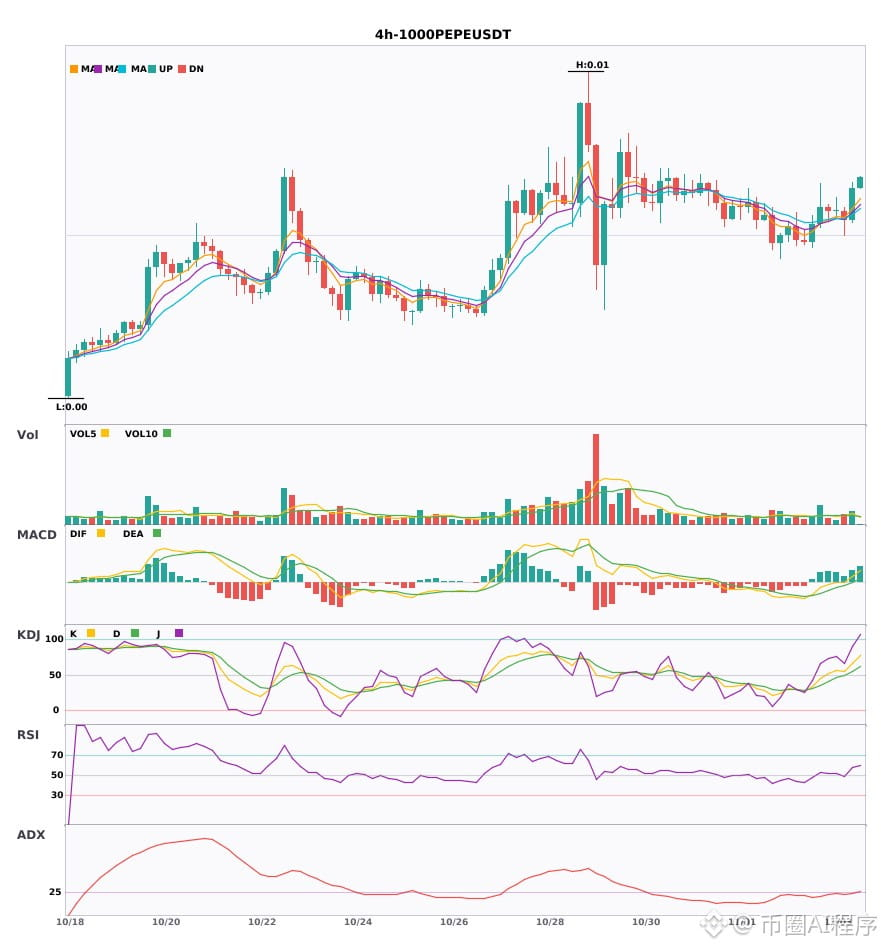
🔴 $1000PEPE 4-hour bullish signal
⚠️Technical analysis: Daily bullish convergence confirmed | 4-hour entry: MACD DIF breaks above the zero line, trend turns bullish | EMA5 > EMA8 > EMA13, bullish alignment | KDJ running strong, bulls in control (K: 66.3, D: 54.6) | Volume normal (1.5x)
════════════════════
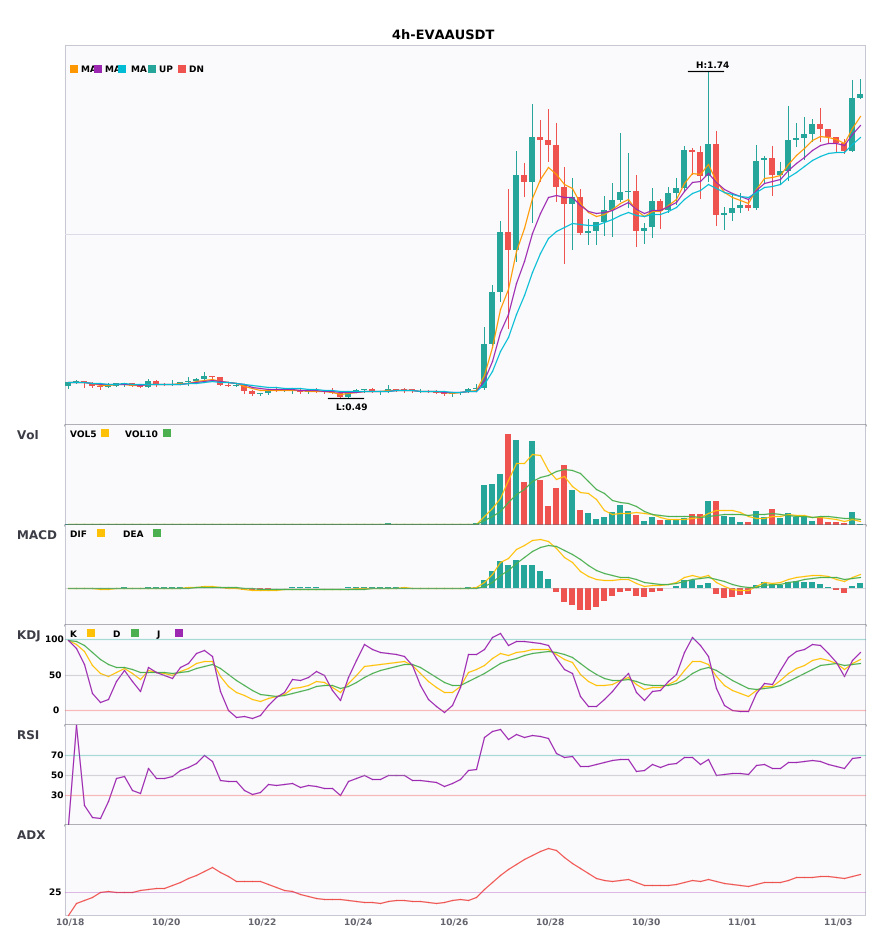
🔴 $EVAA 4-hour bullish signal
⚠️Technical analysis: Daily bullish convergence confirmed | 4-hour entry: MACD golden cross above zero, bullish momentum unleashed | EMA5 > EMA8 > EMA13, bullish alignment | KDJ golden cross, short-term bullish outlook (K: 66.4, D: 64.2) | Volume increased (1.9x)
════════════════════
🔔 Follow for first-hand market alerts 🔔
#多周期共振 #LLY #1000PEPE #EVAA
📌 When trading, pay attention to whether the candlestick pattern is aligned
$LLY / $1000PEPE / $EVAA 4-hour bullish signals, daily bullish trend confirmed 🔥
════════════════════
🔴 $LLY 4-hour bullish signal
⚠️Technical analysis: Daily bullish convergence confirmed | 4-hour entry: MACD golden cross above zero, bullish momentum unleashed | EMA5 crosses above EMA8, short-term trend turns bullish | KDJ golden cross, short-term bullish outlook (K: 47.3, D: 45.9) | Volume increased (2.0x)
════════════════════
🔴 $1000PEPE 4-hour bullish signal
⚠️Technical analysis: Daily bullish convergence confirmed | 4-hour entry: MACD DIF breaks above the zero line, trend turns bullish | EMA5 > EMA8 > EMA13, bullish alignment | KDJ running strong, bulls in control (K: 66.3, D: 54.6) | Volume normal (1.5x)
════════════════════
🔴 $EVAA 4-hour bullish signal
⚠️Technical analysis: Daily bullish convergence confirmed | 4-hour entry: MACD golden cross above zero, bullish momentum unleashed | EMA5 > EMA8 > EMA13, bullish alignment | KDJ golden cross, short-term bullish outlook (K: 66.4, D: 64.2) | Volume increased (1.9x)
════════════════════
🔔 Follow for first-hand market alerts 🔔
#多周期共振 #LLY #1000PEPE #EVAA
📌 When trading, pay attention to whether the candlestick pattern is aligned
════════════════════
🔴 $LLY 4-hour bullish signal
⚠️Technical analysis: Daily bullish convergence confirmed | 4-hour entry: MACD golden cross above zero, bullish momentum unleashed | EMA5 crosses above EMA8, short-term trend turns bullish | KDJ golden cross, short-term bullish outlook (K: 47.3, D: 45.9) | Volume increased (2.0x)
════════════════════
🔴 $1000PEPE 4-hour bullish signal
⚠️Technical analysis: Daily bullish convergence confirmed | 4-hour entry: MACD DIF breaks above the zero line, trend turns bullish | EMA5 > EMA8 > EMA13, bullish alignment | KDJ running strong, bulls in control (K: 66.3, D: 54.6) | Volume normal (1.5x)
════════════════════
🔴 $EVAA 4-hour bullish signal
⚠️Technical analysis: Daily bullish convergence confirmed | 4-hour entry: MACD golden cross above zero, bullish momentum unleashed | EMA5 > EMA8 > EMA13, bullish alignment | KDJ golden cross, short-term bullish outlook (K: 66.4, D: 64.2) | Volume increased (1.9x)
════════════════════
🔔 Follow for first-hand market alerts 🔔
#多周期共振 #LLY #1000PEPE #EVAA
📌 When trading, pay attention to whether the candlestick pattern is aligned
17
Log in to explore more content
Join global crypto users on Binance Square
⚡️ Get latest and useful information about crypto.
💬 Trusted by the world’s largest crypto exchange.
👍 Discover real insights from verified creators.
Email / Phone number
Trending Topics
1
#NvidiaLoses$2.7TrillionInMonthAndAHalf
0 views
0 Discussing
2
#CanBTCReboundAfterFallingBelow60K?
448,740 views
1,977 Discussing
3
#GlobalStocksFaceLongestLosingStreakSince2023
152,117 views
1,373 Discussing
4
#BlackRockIBITPostsRecord$541MSingleDayOutflow
5,295 views
43 Discussing
5
#AnthropicPlungesTowardIPOPriceonDay2
73,269 views
790 Discussing
6
#TwentyOneCapitalAdds172.25BTC
23,984 views
316 Discussing
7
#HKBillWouldExcludeTokenizedDepositsFromVirtualAssets
2,671 views
37 Discussing
8
#BNBDropsBelow540USDTWith8.46%DailyDecline
42,673 views
384 Discussing
9
#HKBillProposesHK$100KFineForUnauthorizedCryptoTitles
1,500 views
20 Discussing
10
#BitMineFaces$10.1BUnrealizedETHLoss
2,750 views
25 Discussing