
#phb
phb
1.3M views
3,666 Discussing
Hot
Latest

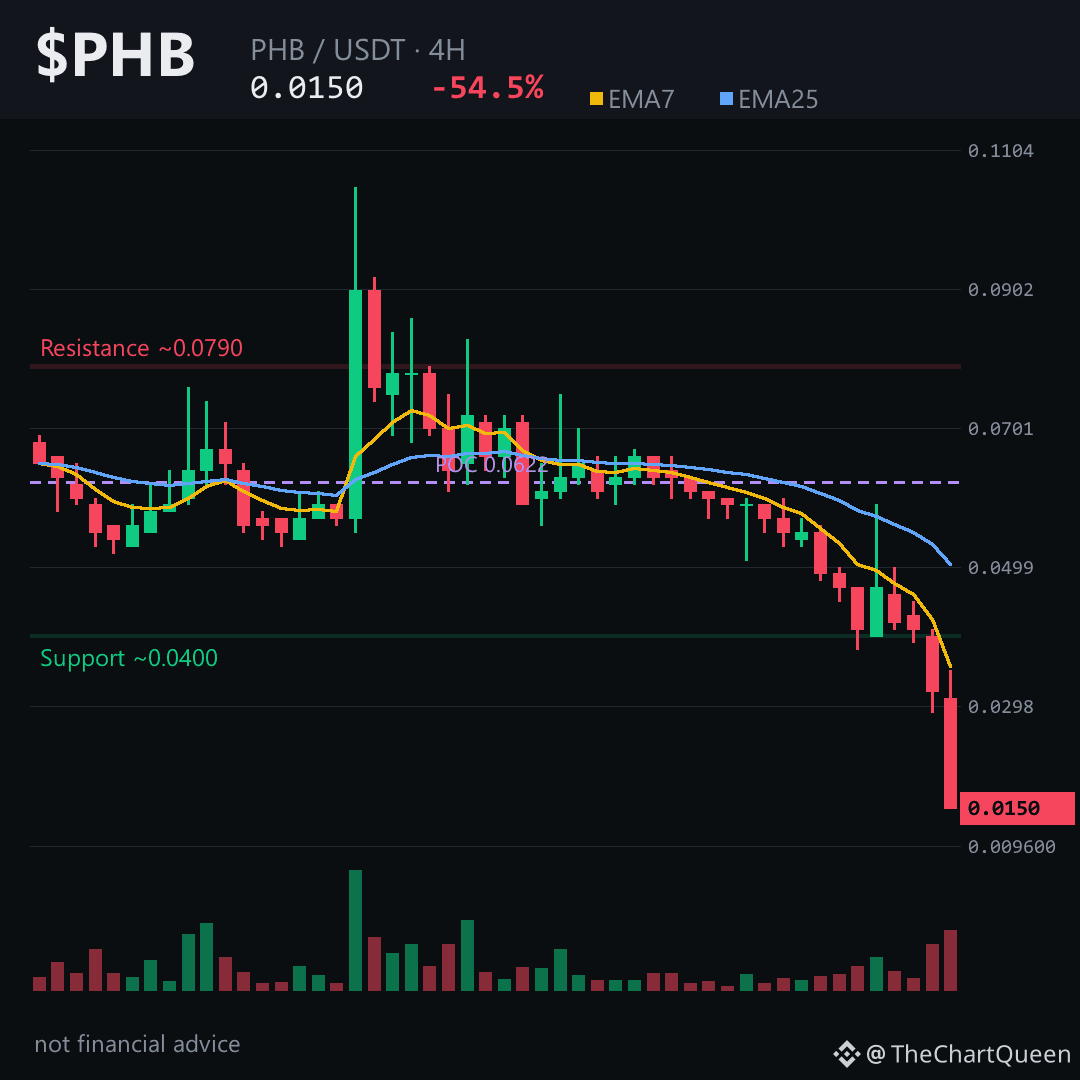
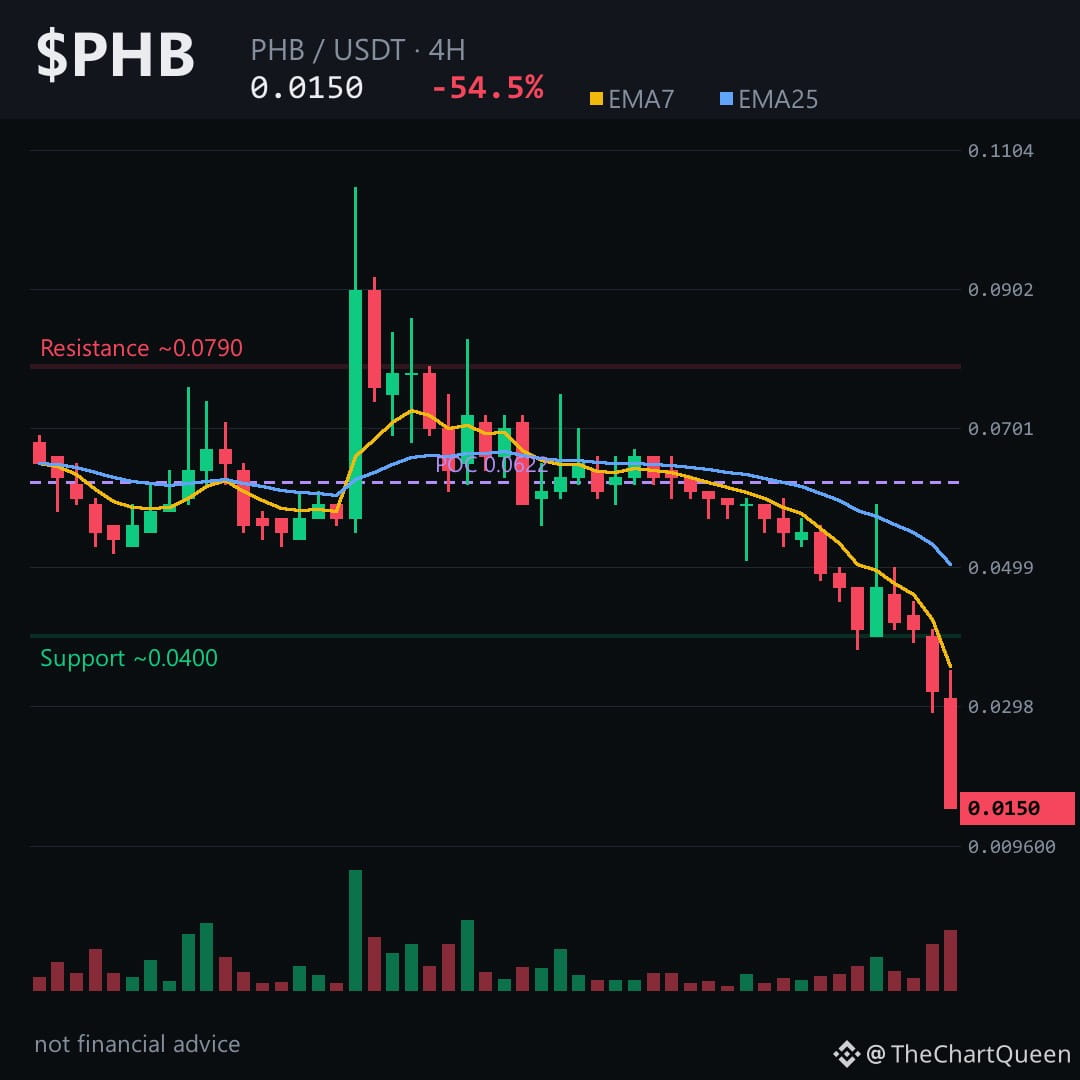
A 51% single-candle flush on the 4H is not normal price action — that is an asset being abandoned, not corrected. And the fact that it happened at the dead-low of the last 48 hours tells you the selling did not find a single meaningful bid on the way down. $PHB just printed the kind of bar that usually marks a regime change, not a dip.
The volume profile's point of control sits near 0.06 — three times higher than current price. Everyone who entered in the last week is underwater, and underwater holders sell rallies. RSI near 20 is extreme, but extremes in freefall can persist. A dead-cat bounce would likely get sold into 0.0158 before the downtrend resumes.
Daily: lower highs since 0.11 failed, bearish FVG still looms at 0.094–0.119. Weekly is uglier — long-term average near 0.17, almost ten times current price. Structural support beneath is thin.
My read: path of least resistance is down. A 4H close below 0.0153 opens 0.013 as the next magnet. Reclaim and hold 0.0158, and freefall shifts to a possible base. Tap $PHB to see how these levels line up with the last 48 hours.
Follow me here for the update when 0.015 gets tested — this is moving fast.
Which level are you trusting more right now on $PHB — the 0.015 floor or the 0.013 magnet below it? 👇
⚠️ Not financial advice. DYOR.
#PHB #Crypto #BinanceSquare #Altcoins
A 51% single-candle flush on the 4H is not normal price action — that is an asset being abandoned, not corrected. And the fact that it happened at the dead-low of the last 48 hours tells you the selling did not find a single meaningful bid on the way down. $PHB just printed the kind of bar that usually marks a regime change, not a dip.
The volume profile's point of control sits near 0.06 — three times higher than current price. Everyone who entered in the last week is underwater, and underwater holders sell rallies. RSI near 20 is extreme, but extremes in freefall can persist. A dead-cat bounce would likely get sold into 0.0158 before the downtrend resumes.
Daily: lower highs since 0.11 failed, bearish FVG still looms at 0.094–0.119. Weekly is uglier — long-term average near 0.17, almost ten times current price. Structural support beneath is thin.
My read: path of least resistance is down. A 4H close below 0.0153 opens 0.013 as the next magnet. Reclaim and hold 0.0158, and freefall shifts to a possible base. Tap $PHB to see how these levels line up with the last 48 hours.
Follow me here for the update when 0.015 gets tested — this is moving fast.
Which level are you trusting more right now on $PHB — the 0.015 floor or the 0.013 magnet below it? 👇
⚠️ Not financial advice. DYOR.
#PHB #Crypto #BinanceSquare #Altcoins
The volume profile's point of control sits near 0.06 — three times higher than current price. Everyone who entered in the last week is underwater, and underwater holders sell rallies. RSI near 20 is extreme, but extremes in freefall can persist. A dead-cat bounce would likely get sold into 0.0158 before the downtrend resumes.
Daily: lower highs since 0.11 failed, bearish FVG still looms at 0.094–0.119. Weekly is uglier — long-term average near 0.17, almost ten times current price. Structural support beneath is thin.
My read: path of least resistance is down. A 4H close below 0.0153 opens 0.013 as the next magnet. Reclaim and hold 0.0158, and freefall shifts to a possible base. Tap $PHB to see how these levels line up with the last 48 hours.
Follow me here for the update when 0.015 gets tested — this is moving fast.
Which level are you trusting more right now on $PHB — the 0.015 floor or the 0.013 magnet below it? 👇
⚠️ Not financial advice. DYOR.
#PHB #Crypto #BinanceSquare #Altcoins
2
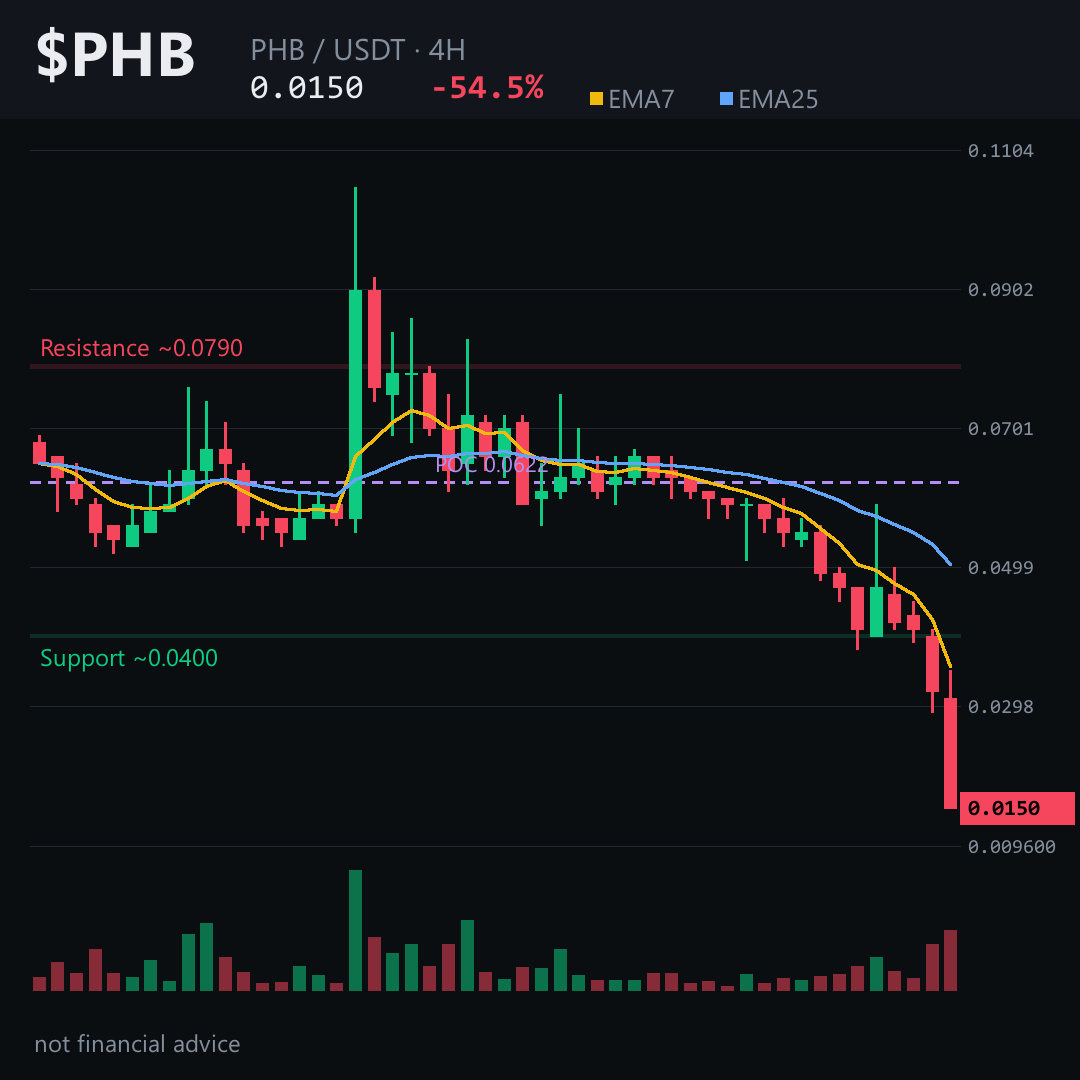
The 4‑hour candle just cracked the $0.0150 floor and the next move could erase half of $PHB’s market cap.
Here’s the play 👇
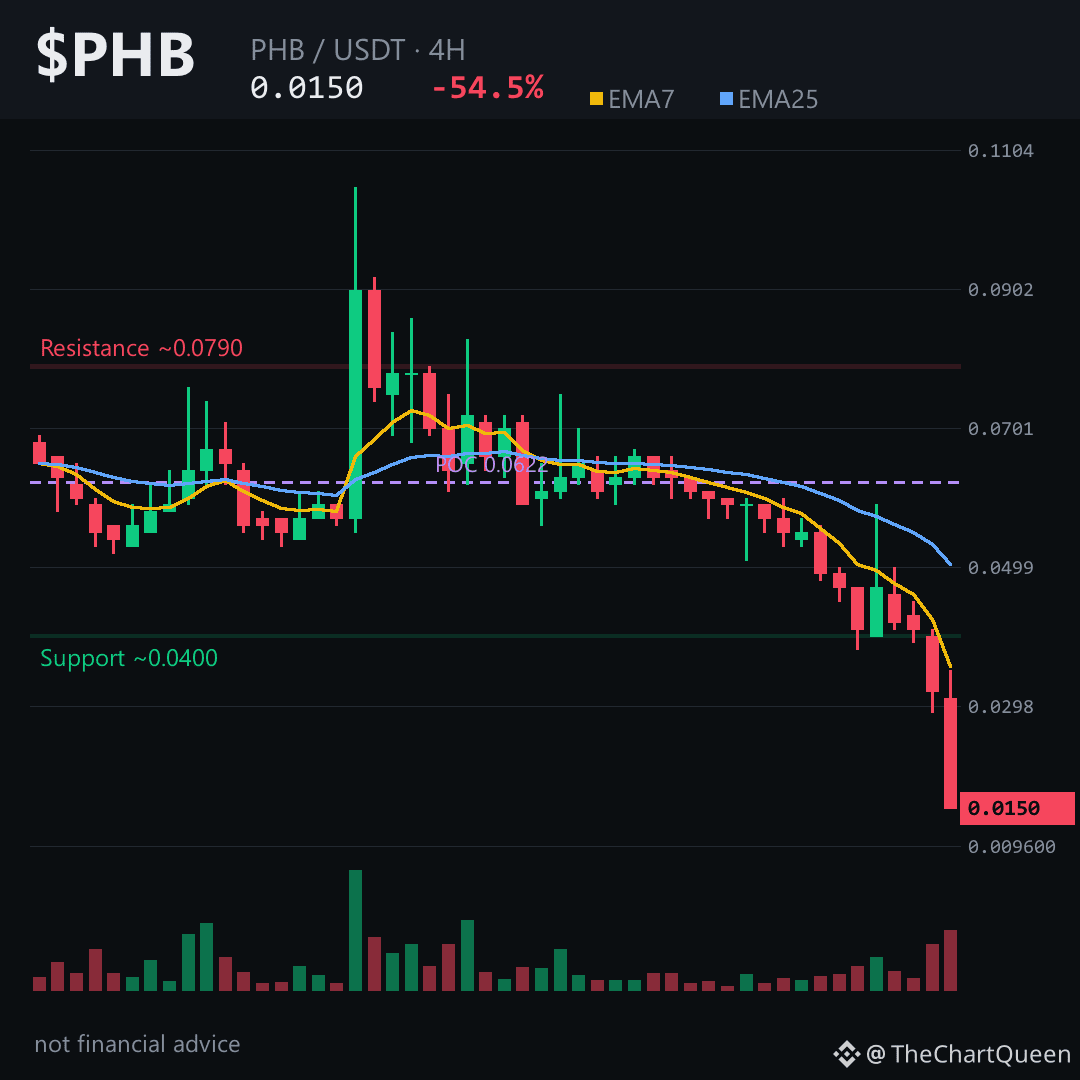
Price is deep in the bears’ camp: EMA7 sits well below EMA25 and RSI hovers around 20, signaling oversold yet still descending. The 4‑hour volume profile centers near $0.062, far above today’s price, so buying pressure is thin.
If $PHB slips below the ~0.0158 barrier the bearish premise crumbles; the current pivot sits around 0.0150 and the next target lies near the 0.0137 zone. Tap $PHB to pull up the chart and see these levels yourself.
The chart is screaming a short‑term sell‑off; the real risk is a bounce above the 0.0158 zone.
Follow me for the next breakdown if the price breaches that level, and let me know which zone you think will hold for PHB 👇
⚠️ Not financial advice. DYOR.
#PHB #Crypto #BinanceSquare
The 4‑hour candle just cracked the $0.0150 floor and the next move could erase half of $PHB’s market cap.
Here’s the play 👇
Price is deep in the bears’ camp: EMA7 sits well below EMA25 and RSI hovers around 20, signaling oversold yet still descending. The 4‑hour volume profile centers near $0.062, far above today’s price, so buying pressure is thin.
If $PHB slips below the ~0.0158 barrier the bearish premise crumbles; the current pivot sits around 0.0150 and the next target lies near the 0.0137 zone. Tap $PHB to pull up the chart and see these levels yourself.
The chart is screaming a short‑term sell‑off; the real risk is a bounce above the 0.0158 zone.
Follow me for the next breakdown if the price breaches that level, and let me know which zone you think will hold for PHB 👇
⚠️ Not financial advice. DYOR.
#PHB #Crypto #BinanceSquare
Here’s the play 👇
Price is deep in the bears’ camp: EMA7 sits well below EMA25 and RSI hovers around 20, signaling oversold yet still descending. The 4‑hour volume profile centers near $0.062, far above today’s price, so buying pressure is thin.
If $PHB slips below the ~0.0158 barrier the bearish premise crumbles; the current pivot sits around 0.0150 and the next target lies near the 0.0137 zone. Tap $PHB to pull up the chart and see these levels yourself.
The chart is screaming a short‑term sell‑off; the real risk is a bounce above the 0.0158 zone.
Follow me for the next breakdown if the price breaches that level, and let me know which zone you think will hold for PHB 👇
⚠️ Not financial advice. DYOR.
#PHB #Crypto #BinanceSquare
7
Picture a coin that just ran a 133% range in a single day, then closed at the very bottom of that range. That’s $PHB right now — and the chart is telling a story most people scroll past.
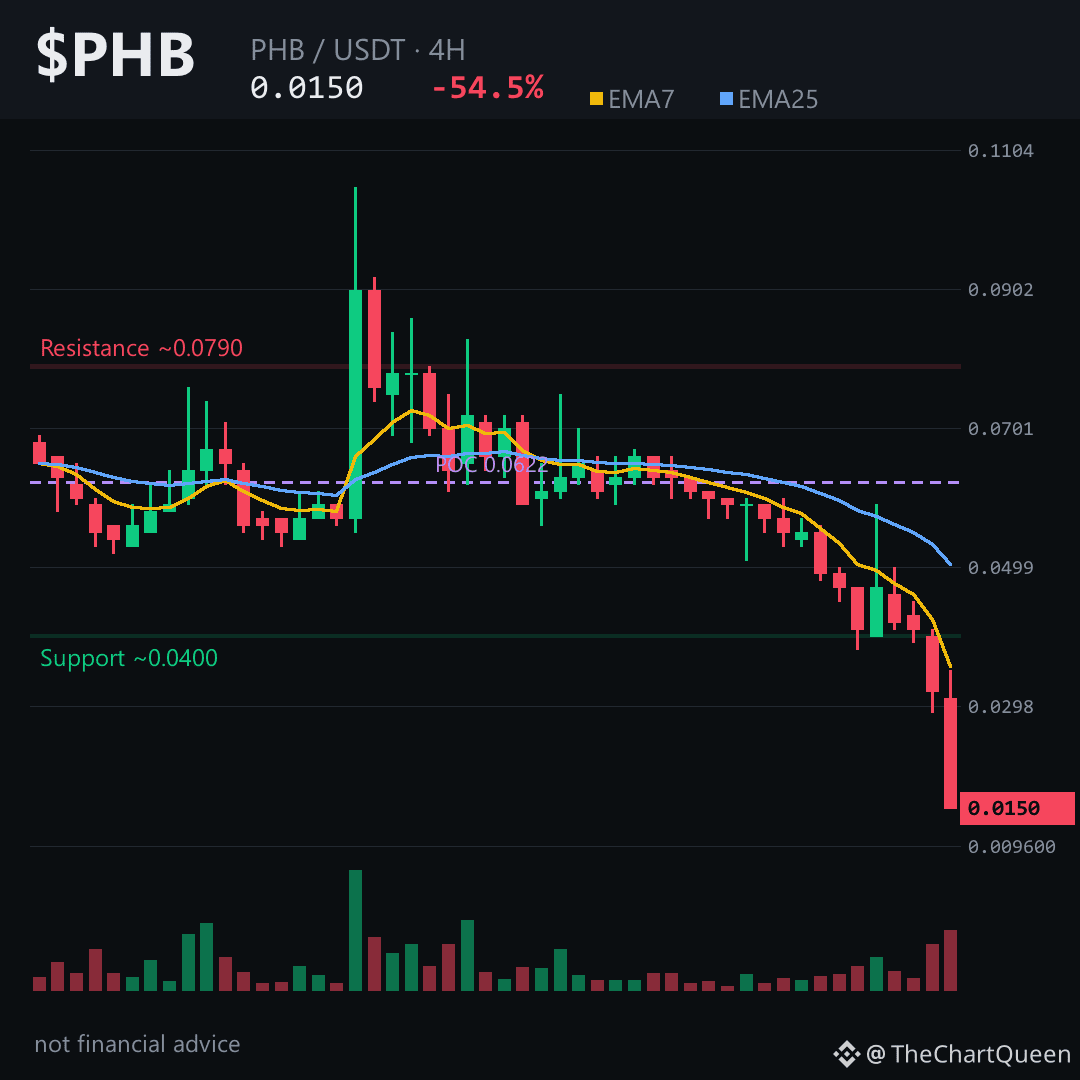
A 54% daily drop isn’t just volatility. It’s a full reset. Nine red 4H candles out of twelve, capped by a -51% single candle slamming price from the low 3s into 1.5. That’s a liquidation cascade with no bid underneath.
Daily RSI sits just above 24 — deeply oversold, but oversold in a falling knife can stay oversold for days. Volume profile shows the heaviest traded zone near 7.2 cents: a massive supply shelf overhead. Any bounce into 4-5 cents meets trapped sellers.
The level that matters most on the 4H is ~0.0158. That’s the line in the sand. If $PHB can’t reclaim it on a 4H close, the path of least resistance points toward the low 1.3s. Tap $PHB to pull up the chart and see how clean that rejection has been.
My read: broken structure on every timeframe. Oversold bounces will come, but they’re counter-trend until the 1.6 area flips. Risk is to the downside until proven otherwise.
I’ll be watching whether the 1.58 zone gets tested or just acts as a ceiling — follow along and we’ll read the reaction together. Which level are you watching more closely: the 1.58 reclaim or the 1.3 breakdown on PHB? 👇
⚠️ Not financial advice. DYOR.
#PHB #Crypto #BinanceSquare #Altcoins
Picture a coin that just ran a 133% range in a single day, then closed at the very bottom of that range. That’s $PHB right now — and the chart is telling a story most people scroll past.
A 54% daily drop isn’t just volatility. It’s a full reset. Nine red 4H candles out of twelve, capped by a -51% single candle slamming price from the low 3s into 1.5. That’s a liquidation cascade with no bid underneath.
Daily RSI sits just above 24 — deeply oversold, but oversold in a falling knife can stay oversold for days. Volume profile shows the heaviest traded zone near 7.2 cents: a massive supply shelf overhead. Any bounce into 4-5 cents meets trapped sellers.
The level that matters most on the 4H is ~0.0158. That’s the line in the sand. If $PHB can’t reclaim it on a 4H close, the path of least resistance points toward the low 1.3s. Tap $PHB to pull up the chart and see how clean that rejection has been.
My read: broken structure on every timeframe. Oversold bounces will come, but they’re counter-trend until the 1.6 area flips. Risk is to the downside until proven otherwise.
I’ll be watching whether the 1.58 zone gets tested or just acts as a ceiling — follow along and we’ll read the reaction together. Which level are you watching more closely: the 1.58 reclaim or the 1.3 breakdown on PHB? 👇
⚠️ Not financial advice. DYOR.
#PHB #Crypto #BinanceSquare #Altcoins
A 54% daily drop isn’t just volatility. It’s a full reset. Nine red 4H candles out of twelve, capped by a -51% single candle slamming price from the low 3s into 1.5. That’s a liquidation cascade with no bid underneath.
Daily RSI sits just above 24 — deeply oversold, but oversold in a falling knife can stay oversold for days. Volume profile shows the heaviest traded zone near 7.2 cents: a massive supply shelf overhead. Any bounce into 4-5 cents meets trapped sellers.
The level that matters most on the 4H is ~0.0158. That’s the line in the sand. If $PHB can’t reclaim it on a 4H close, the path of least resistance points toward the low 1.3s. Tap $PHB to pull up the chart and see how clean that rejection has been.
My read: broken structure on every timeframe. Oversold bounces will come, but they’re counter-trend until the 1.6 area flips. Risk is to the downside until proven otherwise.
I’ll be watching whether the 1.58 zone gets tested or just acts as a ceiling — follow along and we’ll read the reaction together. Which level are you watching more closely: the 1.58 reclaim or the 1.3 breakdown on PHB? 👇
⚠️ Not financial advice. DYOR.
#PHB #Crypto #BinanceSquare #Altcoins
2
Imagine watching a shelf of ice crack in slow motion — that's $PHB right now, down over 54% in a single day.
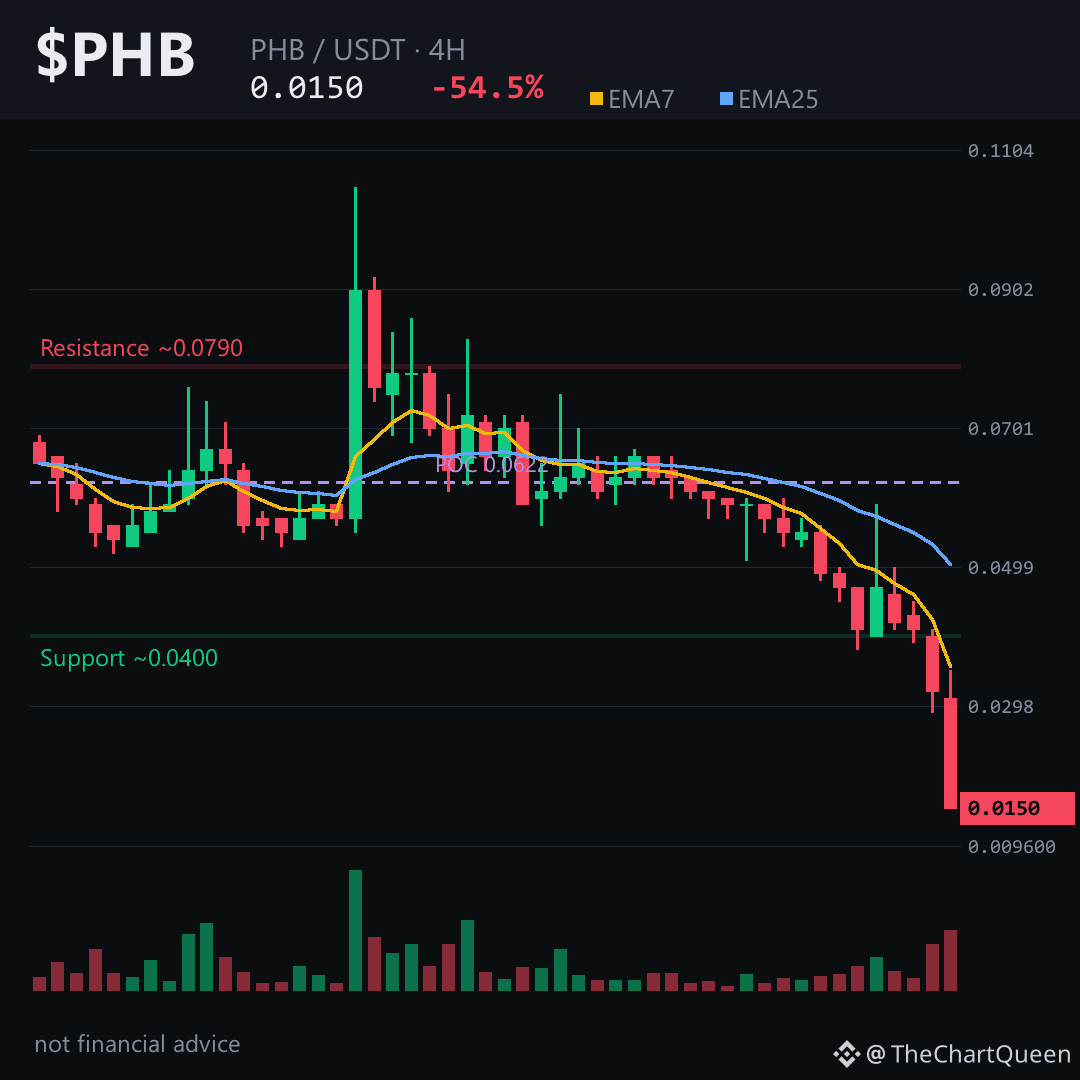
The 4H midnight candle opened near 0.031 and collapsed to 0.015 — a 51% single-candle structural break, not a retracement.
Daily is just as ugly. Price is nowhere near the old 0.072 volume pocket. The unfilled bearish gap between 0.094–0.119 acts as a ceiling if any bounce gets ambitious. But bounces aren't the story — whether 0.0137 can catch this falling knife is.
My read: trend decisively lower. Only real risk to shorting is a violent relief bounce born from exhaustion, not strength. 4H RSI is buried near 20 — oversold, but oversold can stay oversold in a meltdown.
The level I'm watching: if $PHB loses ~0.0137 on a 4H close, there's little chart memory until the macro objective near 0.0095. Tap $PHB to pull up the chart and see how clean that drop really was.
I'll be watching whether that exhaustion bounce materializes or if this just keeps bleeding — follow along and we'll read the next candle together. Which level do you trust more here: the bounce zone or the breakdown? 👇
⚠️ Not financial advice. DYOR.
#PHB #Crypto #BinanceSquare
Imagine watching a shelf of ice crack in slow motion — that's $PHB right now, down over 54% in a single day.
The 4H midnight candle opened near 0.031 and collapsed to 0.015 — a 51% single-candle structural break, not a retracement.
Daily is just as ugly. Price is nowhere near the old 0.072 volume pocket. The unfilled bearish gap between 0.094–0.119 acts as a ceiling if any bounce gets ambitious. But bounces aren't the story — whether 0.0137 can catch this falling knife is.
My read: trend decisively lower. Only real risk to shorting is a violent relief bounce born from exhaustion, not strength. 4H RSI is buried near 20 — oversold, but oversold can stay oversold in a meltdown.
The level I'm watching: if $PHB loses ~0.0137 on a 4H close, there's little chart memory until the macro objective near 0.0095. Tap $PHB to pull up the chart and see how clean that drop really was.
I'll be watching whether that exhaustion bounce materializes or if this just keeps bleeding — follow along and we'll read the next candle together. Which level do you trust more here: the bounce zone or the breakdown? 👇
⚠️ Not financial advice. DYOR.
#PHB #Crypto #BinanceSquare
The 4H midnight candle opened near 0.031 and collapsed to 0.015 — a 51% single-candle structural break, not a retracement.
Daily is just as ugly. Price is nowhere near the old 0.072 volume pocket. The unfilled bearish gap between 0.094–0.119 acts as a ceiling if any bounce gets ambitious. But bounces aren't the story — whether 0.0137 can catch this falling knife is.
My read: trend decisively lower. Only real risk to shorting is a violent relief bounce born from exhaustion, not strength. 4H RSI is buried near 20 — oversold, but oversold can stay oversold in a meltdown.
The level I'm watching: if $PHB loses ~0.0137 on a 4H close, there's little chart memory until the macro objective near 0.0095. Tap $PHB to pull up the chart and see how clean that drop really was.
I'll be watching whether that exhaustion bounce materializes or if this just keeps bleeding — follow along and we'll read the next candle together. Which level do you trust more here: the bounce zone or the breakdown? 👇
⚠️ Not financial advice. DYOR.
#PHB #Crypto #BinanceSquare
6
-54.55% in 24 hours.
That’s not a dip. That’s a structural break — and the chart is still printing lower lows on every timeframe.
The 4H tells the story: nine red candles out of twelve, the last closing at the low of the day. RSI at 20.44 — oversold, but in a falling market that just means sellers aren’t done. EMA structure is inverted, textbook bearish alignment.
Heaviest volume traded near 0.062, so most recent activity is now underwater. That overhead supply will likely act as resistance on any bounce.
Current price hovers around 0.015. If $PHB can’t reclaim roughly 0.0158 on a closing basis, the path of least resistance points toward 0.0137. Lose that, and the macro chart suggests air down toward 0.0095.
My read: a falling knife with no confirmed floor. The invalidation is clear — a 4H close back above 0.0158 would signal the immediate bearish momentum is fading. Until then, bounces are suspect, not strength.
Tap $PHB to pull up the chart and check these levels yourself. I’ll update my read as price reacts to the 0.0137 zone — follow so you don’t miss that breakdown analysis.
What level are you watching on $PHB right now? 👇
⚠️ Not financial advice. DYOR.
#PHB #Crypto #BinanceSquare
-54.55% in 24 hours.
That’s not a dip. That’s a structural break — and the chart is still printing lower lows on every timeframe.
The 4H tells the story: nine red candles out of twelve, the last closing at the low of the day. RSI at 20.44 — oversold, but in a falling market that just means sellers aren’t done. EMA structure is inverted, textbook bearish alignment.
Heaviest volume traded near 0.062, so most recent activity is now underwater. That overhead supply will likely act as resistance on any bounce.
Current price hovers around 0.015. If $PHB can’t reclaim roughly 0.0158 on a closing basis, the path of least resistance points toward 0.0137. Lose that, and the macro chart suggests air down toward 0.0095.
My read: a falling knife with no confirmed floor. The invalidation is clear — a 4H close back above 0.0158 would signal the immediate bearish momentum is fading. Until then, bounces are suspect, not strength.
Tap $PHB to pull up the chart and check these levels yourself. I’ll update my read as price reacts to the 0.0137 zone — follow so you don’t miss that breakdown analysis.
What level are you watching on $PHB right now? 👇
⚠️ Not financial advice. DYOR.
#PHB #Crypto #BinanceSquare
That’s not a dip. That’s a structural break — and the chart is still printing lower lows on every timeframe.
The 4H tells the story: nine red candles out of twelve, the last closing at the low of the day. RSI at 20.44 — oversold, but in a falling market that just means sellers aren’t done. EMA structure is inverted, textbook bearish alignment.
Heaviest volume traded near 0.062, so most recent activity is now underwater. That overhead supply will likely act as resistance on any bounce.
Current price hovers around 0.015. If $PHB can’t reclaim roughly 0.0158 on a closing basis, the path of least resistance points toward 0.0137. Lose that, and the macro chart suggests air down toward 0.0095.
My read: a falling knife with no confirmed floor. The invalidation is clear — a 4H close back above 0.0158 would signal the immediate bearish momentum is fading. Until then, bounces are suspect, not strength.
Tap $PHB to pull up the chart and check these levels yourself. I’ll update my read as price reacts to the 0.0137 zone — follow so you don’t miss that breakdown analysis.
What level are you watching on $PHB right now? 👇
⚠️ Not financial advice. DYOR.
#PHB #Crypto #BinanceSquare
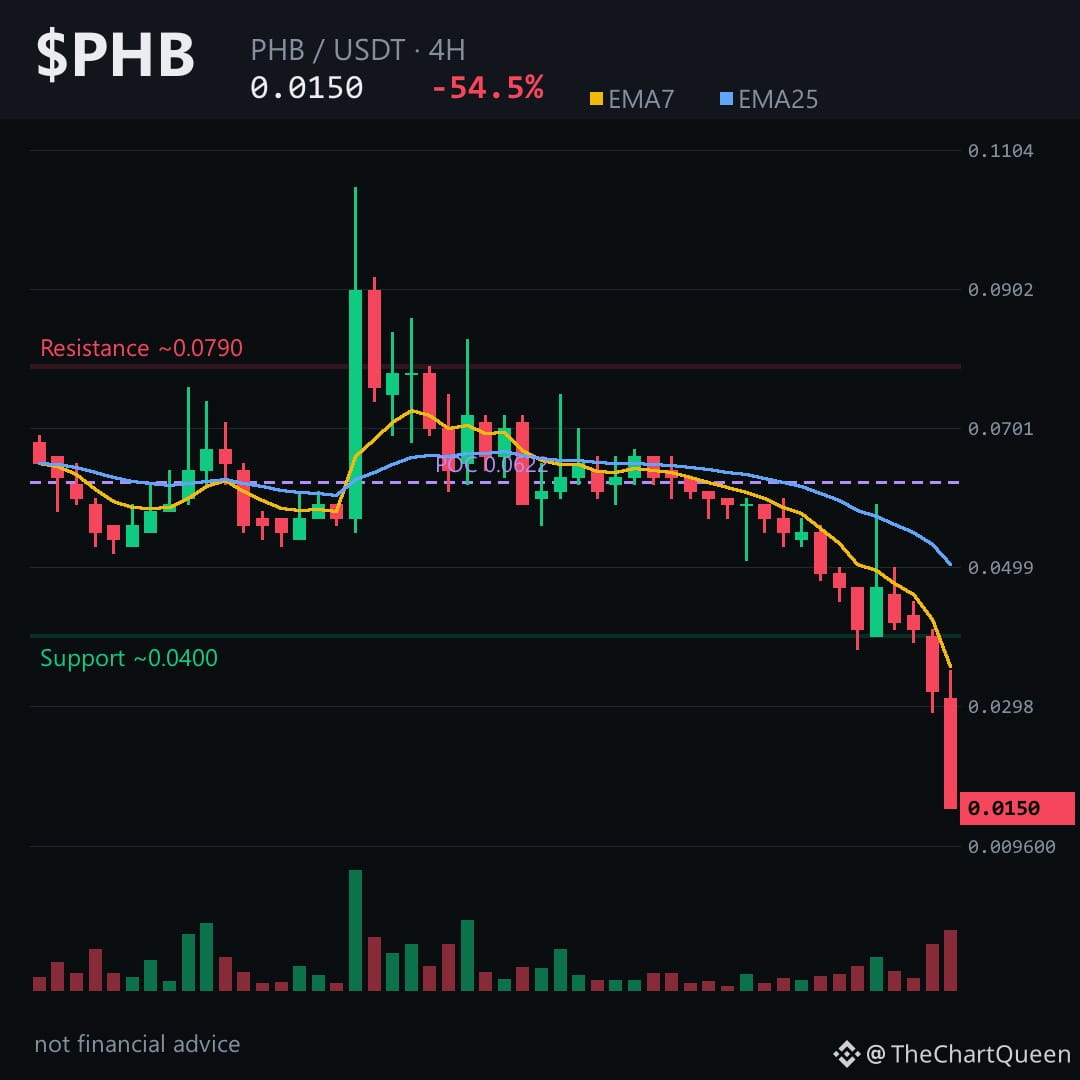
Why is $PHB down over 50% in a single day — and is there any floor left?
That last 4H candle is brutal: opened near 0.031, closed at 0.015. A 51% red candle. Not a slow bleed — a liquidation-style collapse. RSI sits at 20. Extremely oversold, but oversold doesn't mean "bouncing now." It means the trend is in control until price proves otherwise.
Volume profile POC sits near 0.062 — price is now far below where most historical trading happened. Weak structure.
The 1D swing chart is where I'd focus. The invalidation level sits around 0.0165 — if $PHB ever closes a daily candle back above that area, the bearish read weakens significantly. Until then, path of least resistance points toward 0.013, possibly lower.
EMAs are stacked bearish across every timeframe. No fight from buyers yet.
This is a falling knife. The only question is whether 0.013 acts as a shelf or just a pause. I'm not calling a bounce until price reclaims mid-0.016 with volume. Below that, structure stays broken.
Follow me here — if 0.013 fails or holds, I'll break down what that means for the next few days, not just hours.
Which level are you watching closer on $PHB — the 0.013 shelf or the 0.0165 reclaim? 👇
⚠️ Not financial advice. DYOR.
#PHB #Crypto #BinanceSquare #Altcoins
Why is $PHB down over 50% in a single day — and is there any floor left?
That last 4H candle is brutal: opened near 0.031, closed at 0.015. A 51% red candle. Not a slow bleed — a liquidation-style collapse. RSI sits at 20. Extremely oversold, but oversold doesn't mean "bouncing now." It means the trend is in control until price proves otherwise.
Volume profile POC sits near 0.062 — price is now far below where most historical trading happened. Weak structure.
The 1D swing chart is where I'd focus. The invalidation level sits around 0.0165 — if $PHB ever closes a daily candle back above that area, the bearish read weakens significantly. Until then, path of least resistance points toward 0.013, possibly lower.
EMAs are stacked bearish across every timeframe. No fight from buyers yet.
This is a falling knife. The only question is whether 0.013 acts as a shelf or just a pause. I'm not calling a bounce until price reclaims mid-0.016 with volume. Below that, structure stays broken.
Follow me here — if 0.013 fails or holds, I'll break down what that means for the next few days, not just hours.
Which level are you watching closer on $PHB — the 0.013 shelf or the 0.0165 reclaim? 👇
⚠️ Not financial advice. DYOR.
#PHB #Crypto #BinanceSquare #Altcoins
That last 4H candle is brutal: opened near 0.031, closed at 0.015. A 51% red candle. Not a slow bleed — a liquidation-style collapse. RSI sits at 20. Extremely oversold, but oversold doesn't mean "bouncing now." It means the trend is in control until price proves otherwise.
Volume profile POC sits near 0.062 — price is now far below where most historical trading happened. Weak structure.
The 1D swing chart is where I'd focus. The invalidation level sits around 0.0165 — if $PHB ever closes a daily candle back above that area, the bearish read weakens significantly. Until then, path of least resistance points toward 0.013, possibly lower.
EMAs are stacked bearish across every timeframe. No fight from buyers yet.
This is a falling knife. The only question is whether 0.013 acts as a shelf or just a pause. I'm not calling a bounce until price reclaims mid-0.016 with volume. Below that, structure stays broken.
Follow me here — if 0.013 fails or holds, I'll break down what that means for the next few days, not just hours.
Which level are you watching closer on $PHB — the 0.013 shelf or the 0.0165 reclaim? 👇
⚠️ Not financial advice. DYOR.
#PHB #Crypto #BinanceSquare #Altcoins
12
Imagine watching a slow leak turn into a full drain in one candle. That's $PHB right now — a 51% single-candle collapse into a 24-hour low, closing at 0.015 with volume that vanished.
The story isn't over. It's just changed chapters.
4H RSI sits near 20, deeply stretched, and price has shredded every short-term average. But the daily view holds the real wound — an unfilled bearish gap overhead from roughly 0.094 to 0.119, a hole the market may eventually revisit. Not tomorrow, but eventually.
Futures are silent. No funding, no open interest worth naming. This is a spot-driven, liquidity-starved fade. That's not a bounce signal. That's a "no one is left to catch the knife" signal.
The 4H read is my cleanest lens: $PHB is pinned against the 0.015 area, and if it loses that floor on a close, the path of least resistance points toward the 0.0137 zone. The only thing that tells me this bearish read is wrong is a decisive reclaim above 0.0158. Below that threshold, selling pressure still owns the tape. Tap $PHB to see the setup yourself — the levels don't need my words.
My read: bounce attempts are weak, the trend is heavy, and the real risk is assuming a 54% daily drop must mean a bottom. Charts don't owe us symmetry.
I'll keep my eye on how PHB behaves around that 0.015 floor this week — follow along if you want the updated read, not just the headline.
What level are you watching most closely on PHB right now? 👇
⚠️ Not financial advice. DYOR.
#PHB #Crypto #BinanceSquare #Altcoins
Imagine watching a slow leak turn into a full drain in one candle. That's $PHB right now — a 51% single-candle collapse into a 24-hour low, closing at 0.015 with volume that vanished.
The story isn't over. It's just changed chapters.
4H RSI sits near 20, deeply stretched, and price has shredded every short-term average. But the daily view holds the real wound — an unfilled bearish gap overhead from roughly 0.094 to 0.119, a hole the market may eventually revisit. Not tomorrow, but eventually.
Futures are silent. No funding, no open interest worth naming. This is a spot-driven, liquidity-starved fade. That's not a bounce signal. That's a "no one is left to catch the knife" signal.
The 4H read is my cleanest lens: $PHB is pinned against the 0.015 area, and if it loses that floor on a close, the path of least resistance points toward the 0.0137 zone. The only thing that tells me this bearish read is wrong is a decisive reclaim above 0.0158. Below that threshold, selling pressure still owns the tape. Tap $PHB to see the setup yourself — the levels don't need my words.
My read: bounce attempts are weak, the trend is heavy, and the real risk is assuming a 54% daily drop must mean a bottom. Charts don't owe us symmetry.
I'll keep my eye on how PHB behaves around that 0.015 floor this week — follow along if you want the updated read, not just the headline.
What level are you watching most closely on PHB right now? 👇
⚠️ Not financial advice. DYOR.
#PHB #Crypto #BinanceSquare #Altcoins
The story isn't over. It's just changed chapters.
4H RSI sits near 20, deeply stretched, and price has shredded every short-term average. But the daily view holds the real wound — an unfilled bearish gap overhead from roughly 0.094 to 0.119, a hole the market may eventually revisit. Not tomorrow, but eventually.
Futures are silent. No funding, no open interest worth naming. This is a spot-driven, liquidity-starved fade. That's not a bounce signal. That's a "no one is left to catch the knife" signal.
The 4H read is my cleanest lens: $PHB is pinned against the 0.015 area, and if it loses that floor on a close, the path of least resistance points toward the 0.0137 zone. The only thing that tells me this bearish read is wrong is a decisive reclaim above 0.0158. Below that threshold, selling pressure still owns the tape. Tap $PHB to see the setup yourself — the levels don't need my words.
My read: bounce attempts are weak, the trend is heavy, and the real risk is assuming a 54% daily drop must mean a bottom. Charts don't owe us symmetry.
I'll keep my eye on how PHB behaves around that 0.015 floor this week — follow along if you want the updated read, not just the headline.
What level are you watching most closely on PHB right now? 👇
⚠️ Not financial advice. DYOR.
#PHB #Crypto #BinanceSquare #Altcoins
27

·
--
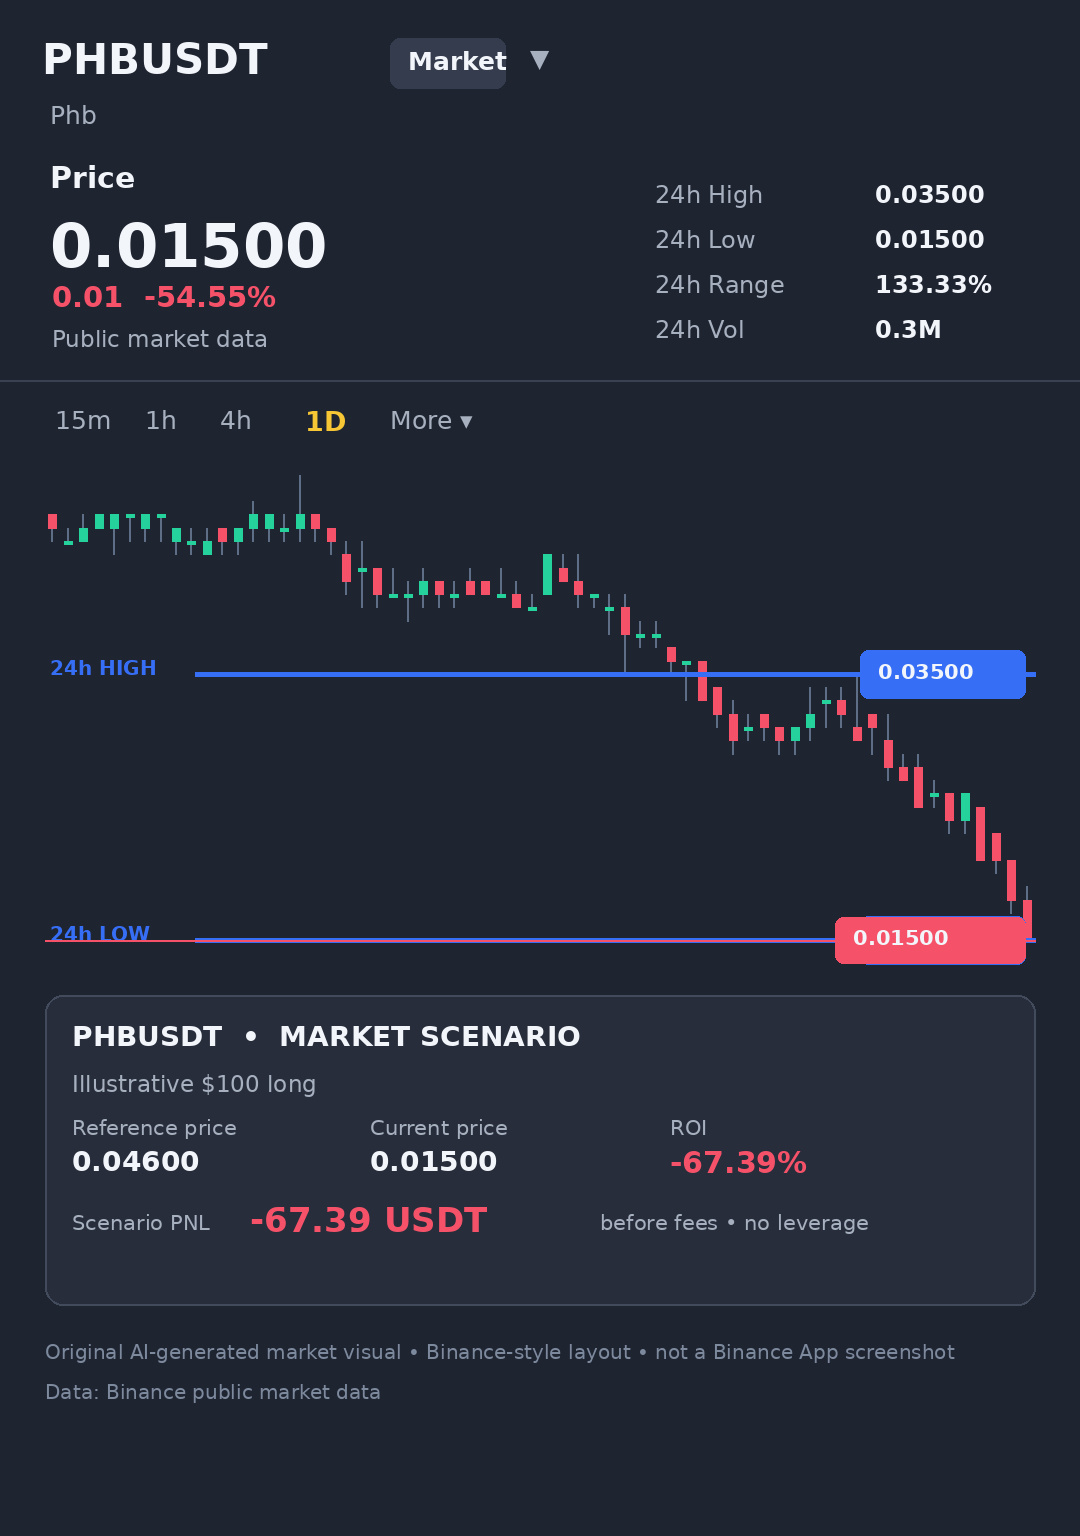
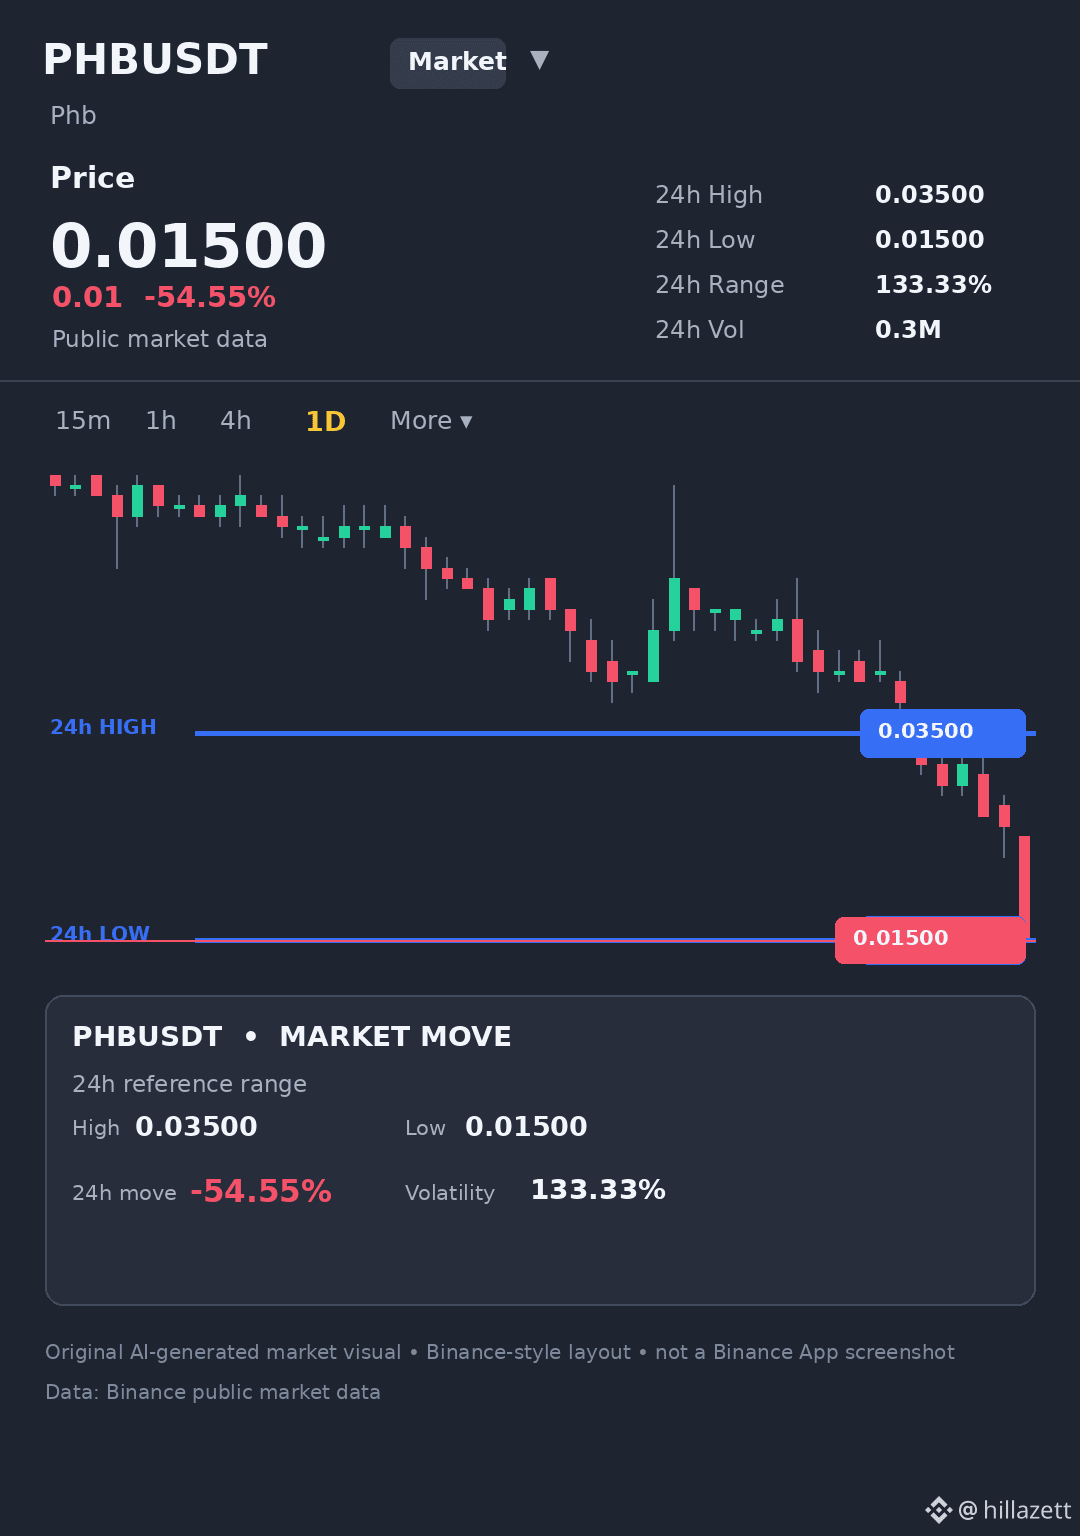
Down 54.55% in 24 hours, $PHB is pinned directly to its session low at 0.015.
It dropped all the way from 0.035, carving out a 133.33% intraday range on $311,302 in volume. When price closes right at the daily floor, seller pressure remains uncontested.
Are you watching for any sign of support here, or staying sidelined? #PHB #CryptoTrading
Down 54.55% in 24 hours, $PHB is pinned directly to its session low at 0.015.
It dropped all the way from 0.035, carving out a 133.33% intraday range on $311,302 in volume. When price closes right at the daily floor, seller pressure remains uncontested.
Are you watching for any sign of support here, or staying sidelined? #PHB #CryptoTrading
It dropped all the way from 0.035, carving out a 133.33% intraday range on $311,302 in volume. When price closes right at the daily floor, seller pressure remains uncontested.
Are you watching for any sign of support here, or staying sidelined? #PHB #CryptoTrading
63
·
--
Zero bounce in sight for $PHB so far today.
The price was cut in half, dropping 54.55% down to 0.015—right at its 24h low after peaking at 0.035. That is a 133.33% spread on $311,302 in trading volume.
When sellers stay in total control all session, trying to guess the bottom usually backfires.
Are you watching from the sidelines, or looking for an entry? #PHB #CryptoTrading
Zero bounce in sight for $PHB so far today.
The price was cut in half, dropping 54.55% down to 0.015—right at its 24h low after peaking at 0.035. That is a 133.33% spread on $311,302 in trading volume.
When sellers stay in total control all session, trying to guess the bottom usually backfires.
Are you watching from the sidelines, or looking for an entry? #PHB #CryptoTrading
The price was cut in half, dropping 54.55% down to 0.015—right at its 24h low after peaking at 0.035. That is a 133.33% spread on $311,302 in trading volume.
When sellers stay in total control all session, trying to guess the bottom usually backfires.
Are you watching from the sidelines, or looking for an entry? #PHB #CryptoTrading
42
·
--
Closing right on the daily low changes the whole chart picture.
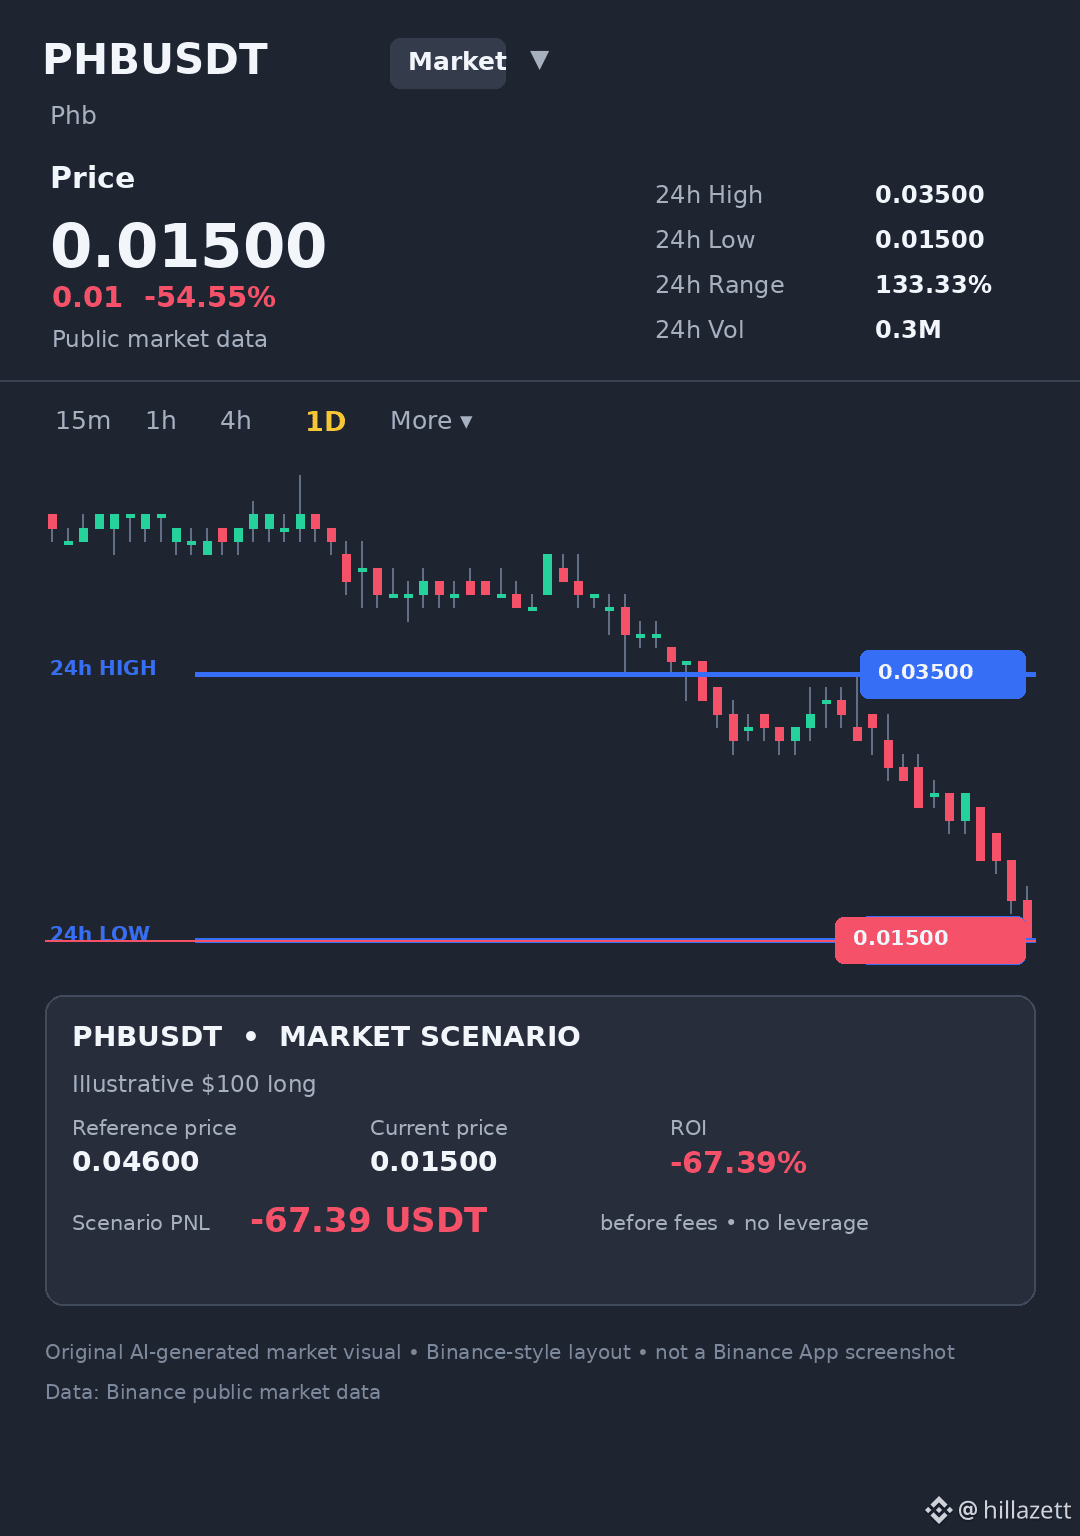
$PHB is down 54.55% at 0.015, sitting exactly at its 24h bottom after rejecting from 0.035. That is a 133.33% intraday spread on $311,302 in volume.
When a candle pins to the floor with zero lower wick to show buyer pushback, momentum is still firmly in one direction.
Are you watching for a bottoming candle or staying away? #PHB #CryptoTrading
Closing right on the daily low changes the whole chart picture.
$PHB is down 54.55% at 0.015, sitting exactly at its 24h bottom after rejecting from 0.035. That is a 133.33% intraday spread on $311,302 in volume.
When a candle pins to the floor with zero lower wick to show buyer pushback, momentum is still firmly in one direction.
Are you watching for a bottoming candle or staying away? #PHB #CryptoTrading
$PHB is down 54.55% at 0.015, sitting exactly at its 24h bottom after rejecting from 0.035. That is a 133.33% intraday spread on $311,302 in volume.
When a candle pins to the floor with zero lower wick to show buyer pushback, momentum is still firmly in one direction.
Are you watching for a bottoming candle or staying away? #PHB #CryptoTrading
42
·
--
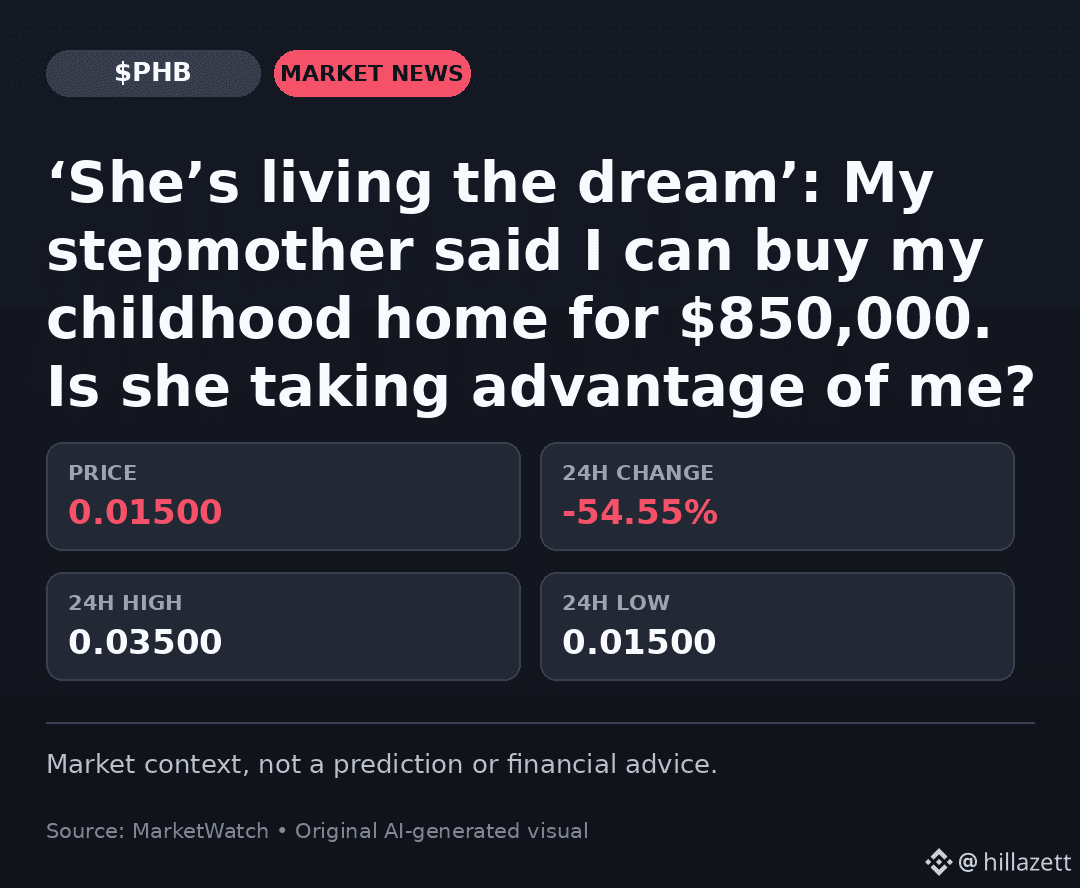
While folks debate whether an $850k home offer is fair value, crypto markets reprice in seconds without asking.
$PHB plunged 54.55% down to 0.015, pinning right at its 24h low after tapping 0.035 earlier. That spans a wild 133.33% range on $311,302 volume.
When intraday drops run this deep, do you wait for a base or keep scrolling? #PHB #CryptoMarket
While folks debate whether an $850k home offer is fair value, crypto markets reprice in seconds without asking.
$PHB plunged 54.55% down to 0.015, pinning right at its 24h low after tapping 0.035 earlier. That spans a wild 133.33% range on $311,302 volume.
When intraday drops run this deep, do you wait for a base or keep scrolling? #PHB #CryptoMarket
$PHB plunged 54.55% down to 0.015, pinning right at its 24h low after tapping 0.035 earlier. That spans a wild 133.33% range on $311,302 volume.
When intraday drops run this deep, do you wait for a base or keep scrolling? #PHB #CryptoMarket

·
--
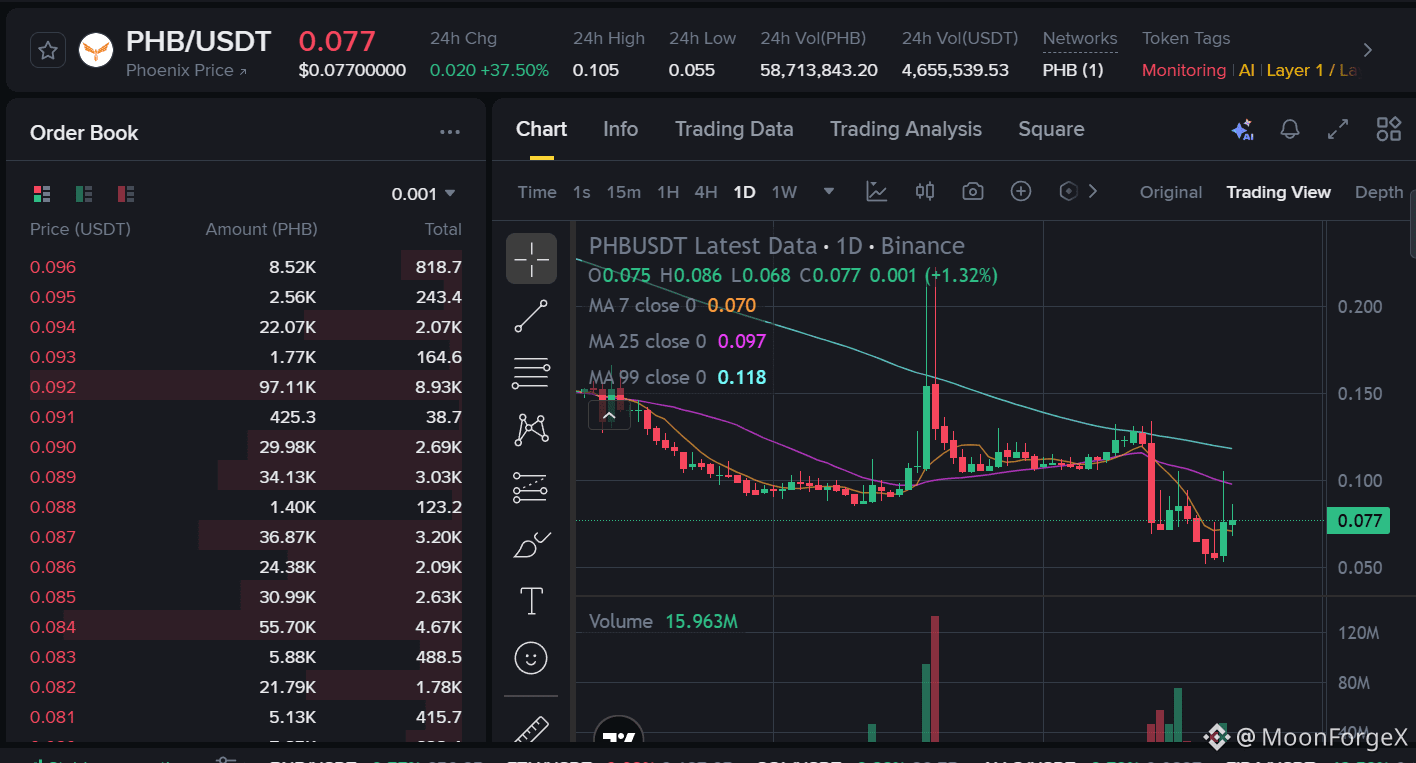
🚀 $PHB EXPLODING +37.50%! Is the Bottom In? 🔥
$PHB /USDT has just woken up with a massive 24h pump, hitting a high of $0.105 before stabilizing around $0.077. The bulls have reclaimed short-term momentum, but a massive upper wick signals heavy resistance ahead.
💡 Trading Signals
🟢 Long Entry: $0.070 – $0.074 (Buying the MA-7 Retest)
🎯 Targets: $0.086 | $0.097 | $0.105
🛑 Stop Loss: Below $0.065
🔴 Short Entry: $0.092 – $0.097 (Fading the MA-25 Resistance)
🎯 Targets: $0.080 | $0.072
🛑 Stop Loss: Above $0.106
⚠️ Quick Take: Avoid FOMO at the top. Watch the $0.070 support carefully for a safer entry, or short if it fails to break past $0.097 on the next bounce.
#PHB #CryptoSignals #Binance #Altcoins
{spot}(PHBUSDT)
🚀 $PHB EXPLODING +37.50%! Is the Bottom In? 🔥
$PHB /USDT has just woken up with a massive 24h pump, hitting a high of $0.105 before stabilizing around $0.077. The bulls have reclaimed short-term momentum, but a massive upper wick signals heavy resistance ahead.
💡 Trading Signals
🟢 Long Entry: $0.070 – $0.074 (Buying the MA-7 Retest)
🎯 Targets: $0.086 | $0.097 | $0.105
🛑 Stop Loss: Below $0.065
🔴 Short Entry: $0.092 – $0.097 (Fading the MA-25 Resistance)
🎯 Targets: $0.080 | $0.072
🛑 Stop Loss: Above $0.106
⚠️ Quick Take: Avoid FOMO at the top. Watch the $0.070 support carefully for a safer entry, or short if it fails to break past $0.097 on the next bounce.
#PHB #CryptoSignals #Binance #Altcoins
$PHB /USDT has just woken up with a massive 24h pump, hitting a high of $0.105 before stabilizing around $0.077. The bulls have reclaimed short-term momentum, but a massive upper wick signals heavy resistance ahead.
💡 Trading Signals
🟢 Long Entry: $0.070 – $0.074 (Buying the MA-7 Retest)
🎯 Targets: $0.086 | $0.097 | $0.105
🛑 Stop Loss: Below $0.065
🔴 Short Entry: $0.092 – $0.097 (Fading the MA-25 Resistance)
🎯 Targets: $0.080 | $0.072
🛑 Stop Loss: Above $0.106
⚠️ Quick Take: Avoid FOMO at the top. Watch the $0.070 support carefully for a safer entry, or short if it fails to break past $0.097 on the next bounce.
#PHB #CryptoSignals #Binance #Altcoins
91

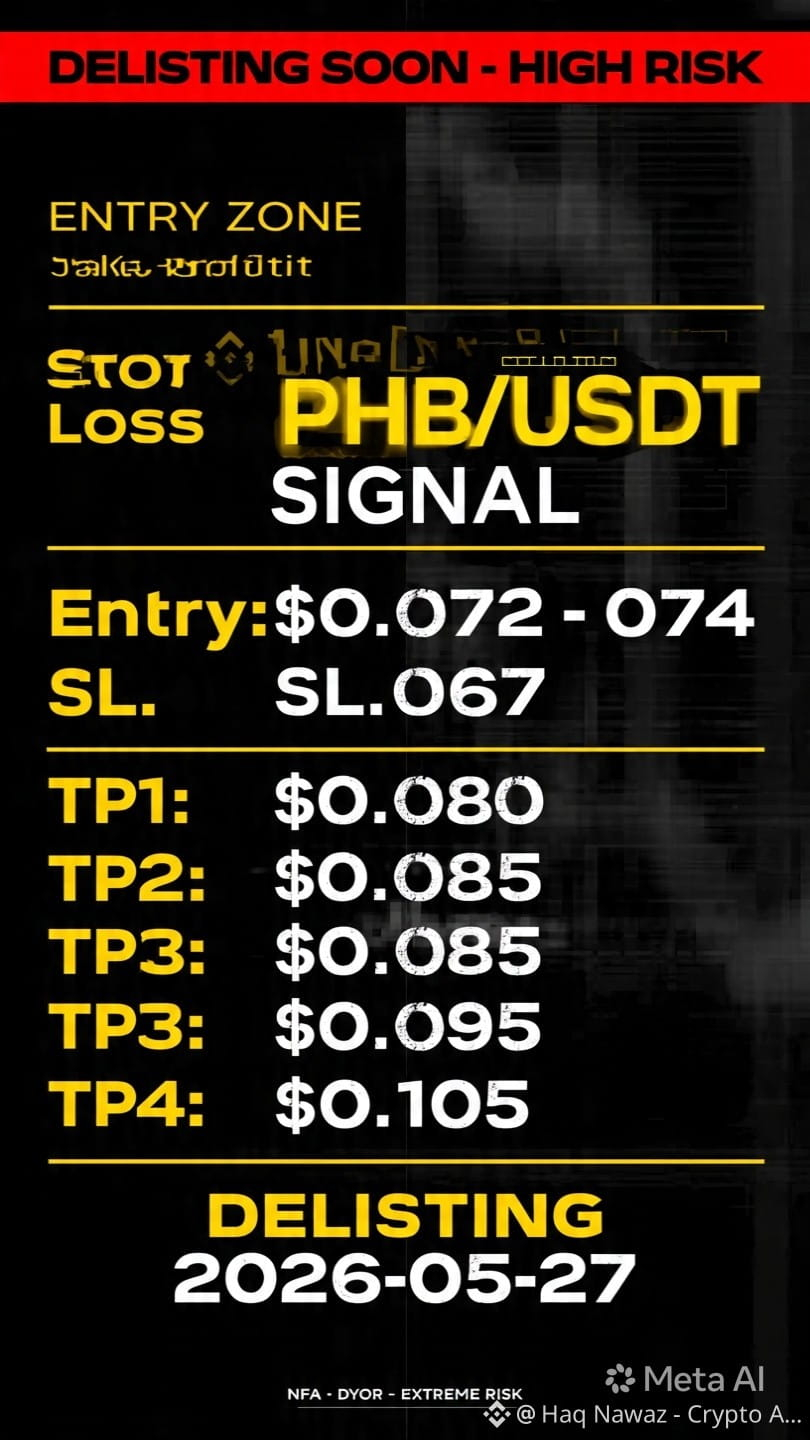
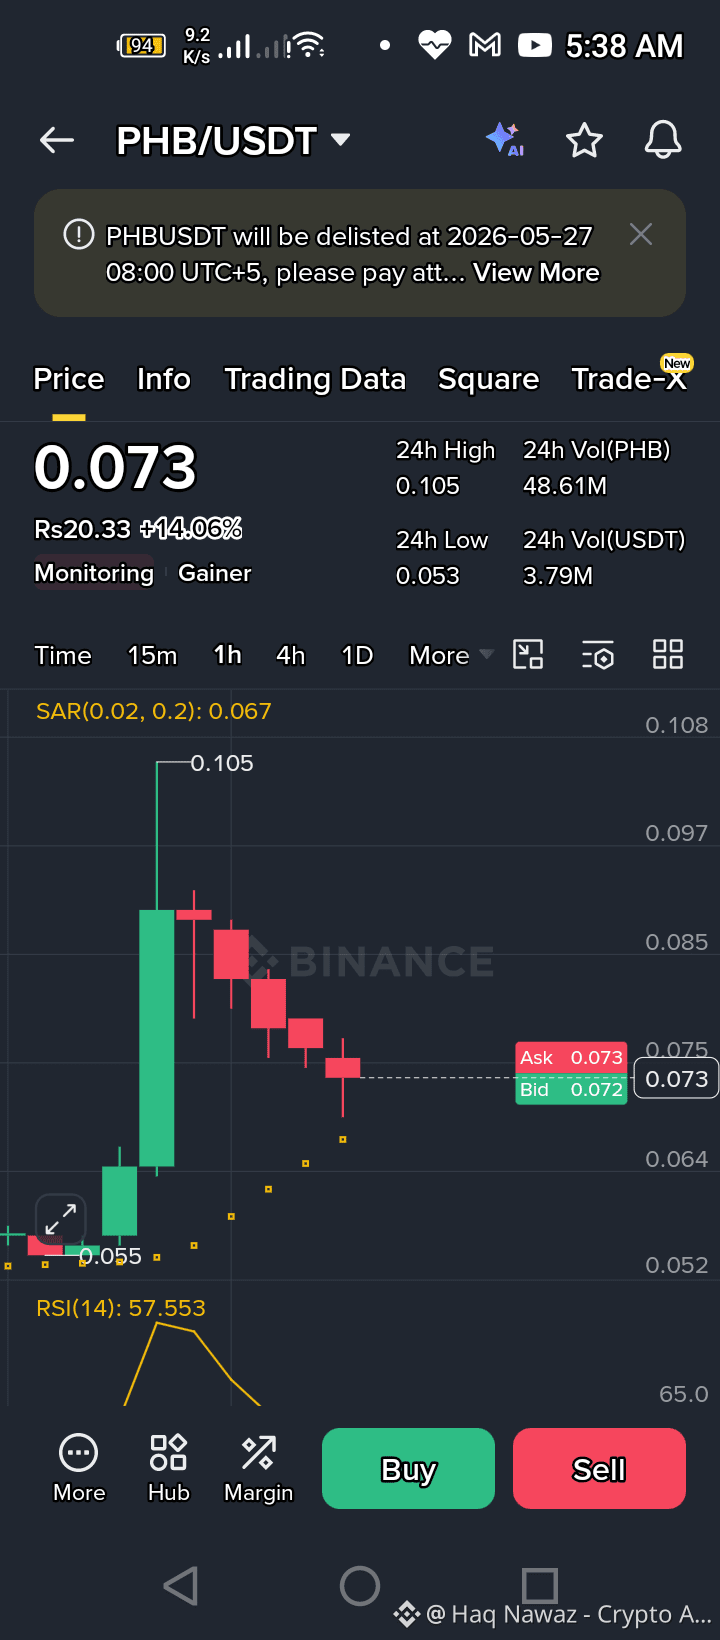
$PHB alert
Binance is moving on May 27
Currently at 0.073
Look for an entry at 0.072
SL below 0.067
targeting up to 0.08
There's risk, so I'm skipping this one
NFA
#PHB
$PHB alert
Binance is moving on May 27
Currently at 0.073
Look for an entry at 0.072
SL below 0.067
targeting up to 0.08
There's risk, so I'm skipping this one
NFA
#PHB
Binance is moving on May 27
Currently at 0.073
Look for an entry at 0.072
SL below 0.067
targeting up to 0.08
There's risk, so I'm skipping this one
NFA
#PHB
158


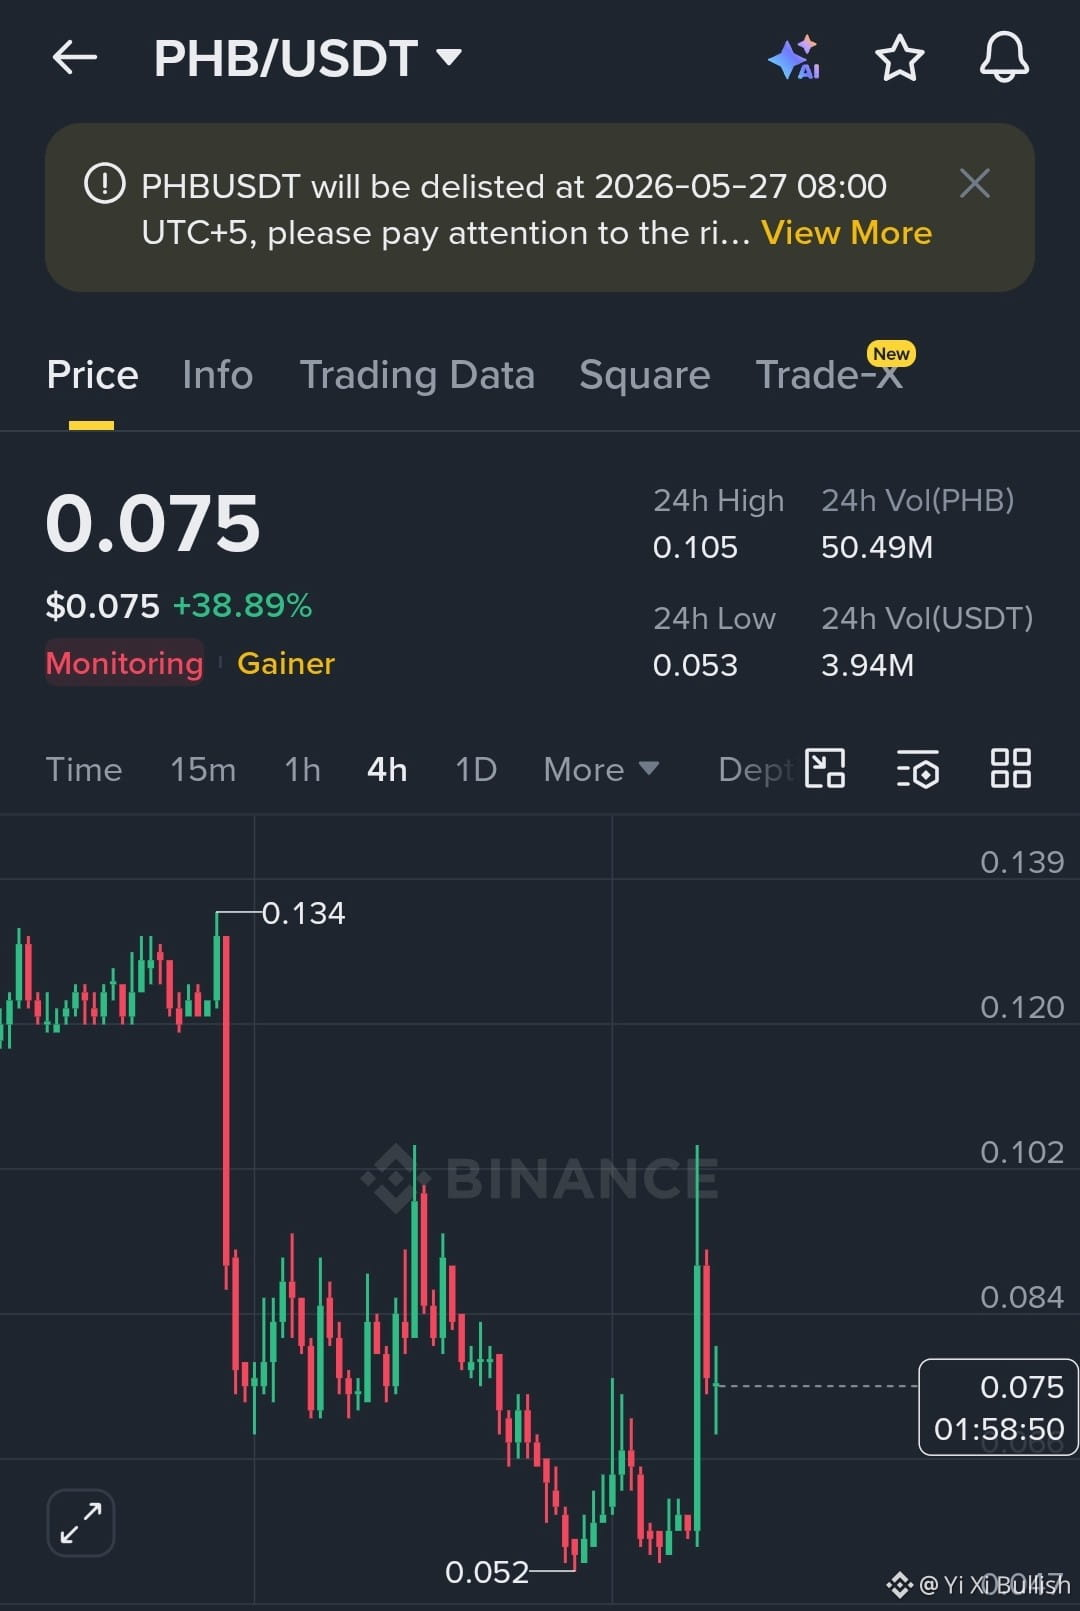
$PHB USDT is currently moving with extremely high volatility after the delisting announcement. Even though the coin pumped nearly 39%, traders should stay very careful because delisting news usually creates unstable price action with sharp pumps and dumps. Right now the main resistance zone is around 0.084–0.105, while support remains near 0.052. If buyers fail to hold momentum, strong selling pressure can appear anytime before delisting.
{spot}(PHBUSDT)
Risky Trade Setup ⚠️
Entry Zone: 0.070 – 0.075
Stop Loss: 0.062
Targets: 0.084 → 0.095 → 0.105
This is a high-risk momentum play, not a safe long-term hold after the delisting notice.
#PHB #CryptoOIDropsOver50Percent #SECPausesNewETFApplicationReview #OpenAIToConfidentiallyFileForIPO #MoonPayLaunchesBankTokenizedAssetPlatform
$PHB USDT is currently moving with extremely high volatility after the delisting announcement. Even though the coin pumped nearly 39%, traders should stay very careful because delisting news usually creates unstable price action with sharp pumps and dumps. Right now the main resistance zone is around 0.084–0.105, while support remains near 0.052. If buyers fail to hold momentum, strong selling pressure can appear anytime before delisting.
Risky Trade Setup ⚠️
Entry Zone: 0.070 – 0.075
Stop Loss: 0.062
Targets: 0.084 → 0.095 → 0.105
This is a high-risk momentum play, not a safe long-term hold after the delisting notice.
#PHB #CryptoOIDropsOver50Percent #SECPausesNewETFApplicationReview #OpenAIToConfidentiallyFileForIPO #MoonPayLaunchesBankTokenizedAssetPlatform
Risky Trade Setup ⚠️
Entry Zone: 0.070 – 0.075
Stop Loss: 0.062
Targets: 0.084 → 0.095 → 0.105
This is a high-risk momentum play, not a safe long-term hold after the delisting notice.
#PHB #CryptoOIDropsOver50Percent #SECPausesNewETFApplicationReview #OpenAIToConfidentiallyFileForIPO #MoonPayLaunchesBankTokenizedAssetPlatform
1
342


·
--
Bullish
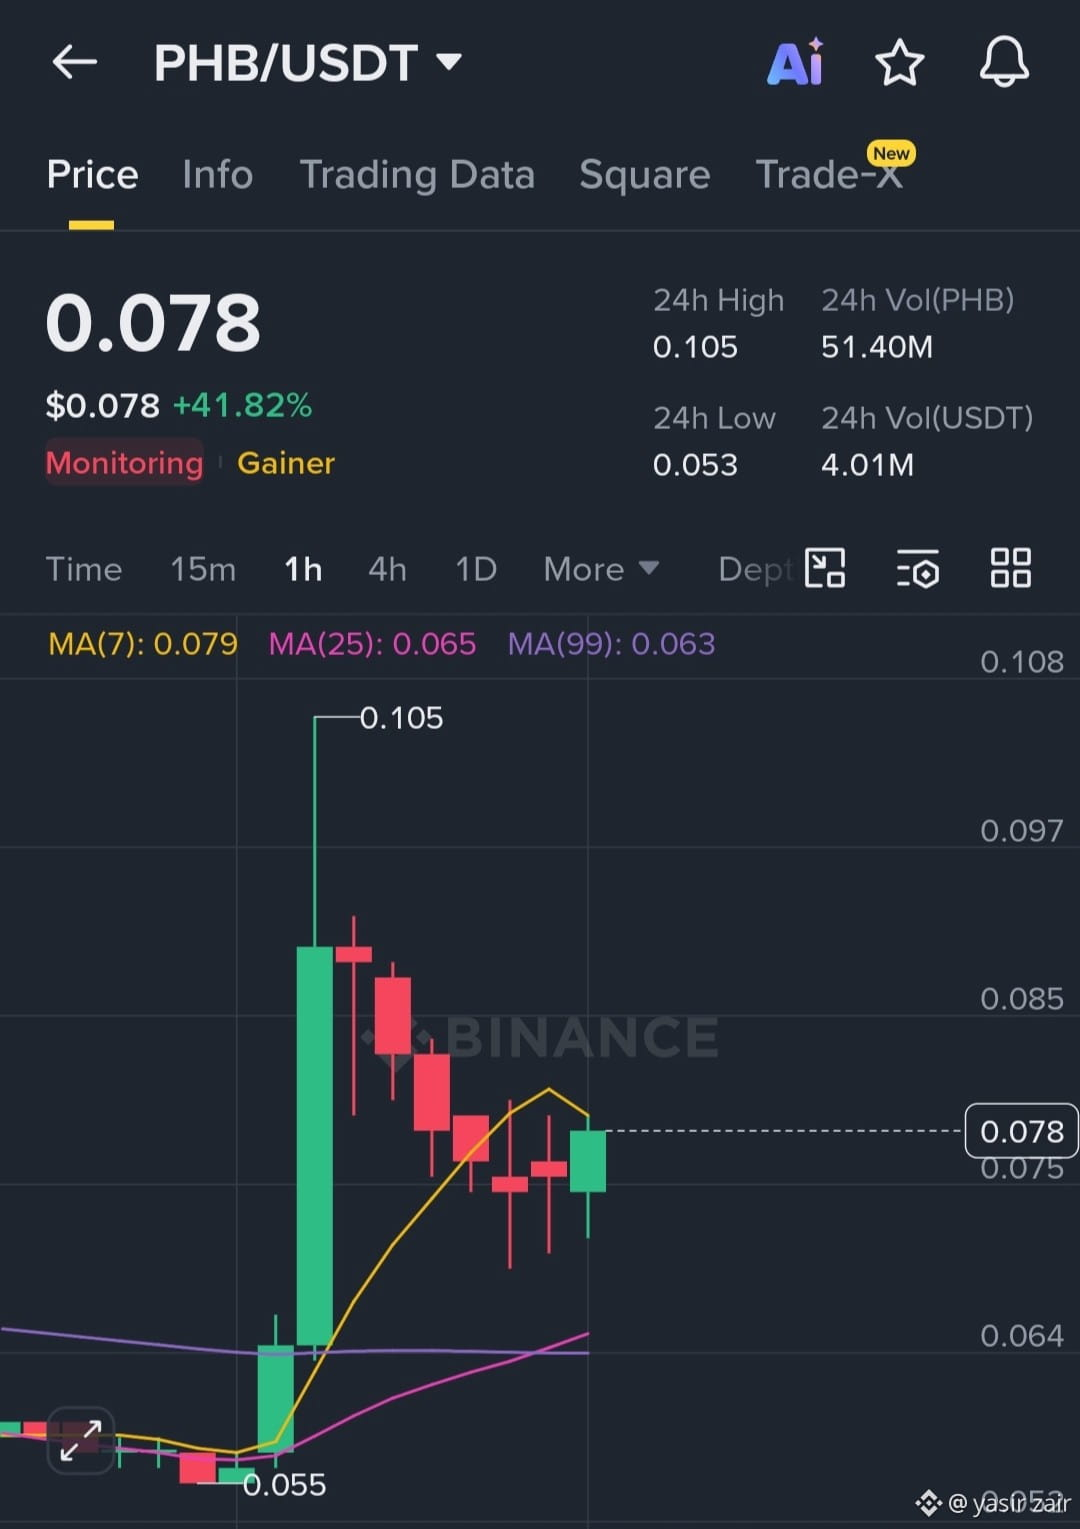
🚀 $PHB showing signs of strong recovery after massive volatility
After a sharp pump, buyers are slowly regaining control and price is stabilizing above key moving averages 📈
If momentum keeps building from this zone, another strong move can surprise the market soon 🔥
Click below and buy now$PHB
{spot}(PHBUSDT)
#PHB #YasirZair
🚀 $PHB showing signs of strong recovery after massive volatility
After a sharp pump, buyers are slowly regaining control and price is stabilizing above key moving averages 📈
If momentum keeps building from this zone, another strong move can surprise the market soon 🔥
Click below and buy now$PHB
#PHB #YasirZair
After a sharp pump, buyers are slowly regaining control and price is stabilizing above key moving averages 📈
If momentum keeps building from this zone, another strong move can surprise the market soon 🔥
Click below and buy now$PHB
#PHB #YasirZair
102

PHB is sitting pretty at 0.06200, and I'm watching that order block zone like a hawk - it's a ticking time bomb waiting to unleash a massive breakout. The fact that we're seeing a sweep of the lows at 0.06287 tells me that smart money is getting ready to pounce.
From a technical standpoint, the HTF is looking bullish, and with an RSI of 33, we're in oversold territory - a perfect recipe for a long play. The volume is a bit concerning at 0.2x, but I believe that's just a sign of the calm before the storm. Our SMC Score is at 3.8/10, which indicates a decent amount of skepticism in the market - music to my ears.
Here are the trade levels:
- Entry: 0.06600
- TP1: 0.07614 (RR 3.2x)
- TP2: 0.09136 (RR 8.1x)
- SL: 0.06287
I'm trading long with a tight stop, expecting a high reward. The $PHBUSDT chart is setting up beautifully, and I believe we're on the cusp of a major move.
Followers, get ready to ride the wave - let's make some money. #BinanceSquare #PHB #CryptoSignals #Futures #SmartMoney
PHB is sitting pretty at 0.06200, and I'm watching that order block zone like a hawk - it's a ticking time bomb waiting to unleash a massive breakout. The fact that we're seeing a sweep of the lows at 0.06287 tells me that smart money is getting ready to pounce.
From a technical standpoint, the HTF is looking bullish, and with an RSI of 33, we're in oversold territory - a perfect recipe for a long play. The volume is a bit concerning at 0.2x, but I believe that's just a sign of the calm before the storm. Our SMC Score is at 3.8/10, which indicates a decent amount of skepticism in the market - music to my ears.
Here are the trade levels:
- Entry: 0.06600
- TP1: 0.07614 (RR 3.2x)
- TP2: 0.09136 (RR 8.1x)
- SL: 0.06287
I'm trading long with a tight stop, expecting a high reward. The $PHBUSDT chart is setting up beautifully, and I believe we're on the cusp of a major move.
Followers, get ready to ride the wave - let's make some money. #BinanceSquare #PHB #CryptoSignals #Futures #SmartMoney
From a technical standpoint, the HTF is looking bullish, and with an RSI of 33, we're in oversold territory - a perfect recipe for a long play. The volume is a bit concerning at 0.2x, but I believe that's just a sign of the calm before the storm. Our SMC Score is at 3.8/10, which indicates a decent amount of skepticism in the market - music to my ears.
Here are the trade levels:
- Entry: 0.06600
- TP1: 0.07614 (RR 3.2x)
- TP2: 0.09136 (RR 8.1x)
- SL: 0.06287
I'm trading long with a tight stop, expecting a high reward. The $PHBUSDT chart is setting up beautifully, and I believe we're on the cusp of a major move.
Followers, get ready to ride the wave - let's make some money. #BinanceSquare #PHB #CryptoSignals #Futures #SmartMoney
141
🚨 Warning: $PHB in free fall 📉. Full setup below 👇
Brutal truth: Market is oversold, but internals reveal a hidden trap. Funding Rate is 0%, indicating no premium for longs, while Open Interest is $0, showing smart money is absent. Long/Short Ratio is 0, signaling a lack of conviction.
Price looks bearish, but the real danger is the lack of liquidity. The window for this trade is closing fast.
Below $0.015 -> Flush to $0.010. Entry: $0.015 | SL: $0.018 | TP: $0.010 | Leverage: 10x Cross
I'm trading this setup. R:R is too good to ignore.
Daily free signals for followers. Save this post before it's gone. If you don't follow, you'll wonder 'what if' in 48h. LONG or SHORT $PHB here? Comment below! 👇
⚠️ Not financial advice. DYOR. #PHB #Crypto #BinanceSquare
🚨 Warning: $PHB in free fall 📉. Full setup below 👇
Brutal truth: Market is oversold, but internals reveal a hidden trap. Funding Rate is 0%, indicating no premium for longs, while Open Interest is $0, showing smart money is absent. Long/Short Ratio is 0, signaling a lack of conviction.
Price looks bearish, but the real danger is the lack of liquidity. The window for this trade is closing fast.
Below $0.015 -> Flush to $0.010. Entry: $0.015 | SL: $0.018 | TP: $0.010 | Leverage: 10x Cross
I'm trading this setup. R:R is too good to ignore.
Daily free signals for followers. Save this post before it's gone. If you don't follow, you'll wonder 'what if' in 48h. LONG or SHORT $PHB here? Comment below! 👇
⚠️ Not financial advice. DYOR. #PHB #Crypto #BinanceSquare
Brutal truth: Market is oversold, but internals reveal a hidden trap. Funding Rate is 0%, indicating no premium for longs, while Open Interest is $0, showing smart money is absent. Long/Short Ratio is 0, signaling a lack of conviction.
Price looks bearish, but the real danger is the lack of liquidity. The window for this trade is closing fast.
Below $0.015 -> Flush to $0.010. Entry: $0.015 | SL: $0.018 | TP: $0.010 | Leverage: 10x Cross
I'm trading this setup. R:R is too good to ignore.
Daily free signals for followers. Save this post before it's gone. If you don't follow, you'll wonder 'what if' in 48h. LONG or SHORT $PHB here? Comment below! 👇
⚠️ Not financial advice. DYOR. #PHB #Crypto #BinanceSquare
13

·
--
PHB EXPERIENCING STEEP DECLINE 📉💸
The $PHB price is currently testing a crucial support zone at ~$0.01507, a level that could determine whether this is a healthy correction or a structural breakdown 📊. This downward momentum is fueled by a significant increase in selling pressure, with the 24h volume reaching $1.47M, indicating a strong interest in the asset among traders, but bears are firmly in control 📉. The $PHB has also breached a key order block, which could lead to further downside if the support zone is broken 📈.
The macro asset accumulation is slowing down, and the momentum acceleration is clearly favoring the bears, with $PHB being one of the top losers, dropping by -69.39% in the last 24 hours 📉. It is essential to monitor the mid-range area at $0.03700, as a potential resistance zone, and the support zone at ~$0.01507, which is being tested 📊.
DYOR
Follow for Updates
#PHB #GENERAL_ALTCOIN #CryptoTrending #BinanceSquare
PHB EXPERIENCING STEEP DECLINE 📉💸
The $PHB price is currently testing a crucial support zone at ~$0.01507, a level that could determine whether this is a healthy correction or a structural breakdown 📊. This downward momentum is fueled by a significant increase in selling pressure, with the 24h volume reaching $1.47M, indicating a strong interest in the asset among traders, but bears are firmly in control 📉. The $PHB has also breached a key order block, which could lead to further downside if the support zone is broken 📈.
The macro asset accumulation is slowing down, and the momentum acceleration is clearly favoring the bears, with $PHB being one of the top losers, dropping by -69.39% in the last 24 hours 📉. It is essential to monitor the mid-range area at $0.03700, as a potential resistance zone, and the support zone at ~$0.01507, which is being tested 📊.
DYOR
Follow for Updates
#PHB #GENERAL_ALTCOIN #CryptoTrending #BinanceSquare
The $PHB price is currently testing a crucial support zone at ~$0.01507, a level that could determine whether this is a healthy correction or a structural breakdown 📊. This downward momentum is fueled by a significant increase in selling pressure, with the 24h volume reaching $1.47M, indicating a strong interest in the asset among traders, but bears are firmly in control 📉. The $PHB has also breached a key order block, which could lead to further downside if the support zone is broken 📈.
The macro asset accumulation is slowing down, and the momentum acceleration is clearly favoring the bears, with $PHB being one of the top losers, dropping by -69.39% in the last 24 hours 📉. It is essential to monitor the mid-range area at $0.03700, as a potential resistance zone, and the support zone at ~$0.01507, which is being tested 📊.
DYOR
Follow for Updates
#PHB #GENERAL_ALTCOIN #CryptoTrending #BinanceSquare
4
·
--
PHB PLUMMETS 70% IN 24 HOURS 📉💸
$PHB is experiencing a severe price collapse, dropping 70% in the last 24 hours, with a significant increase in selling volume, indicating a strong bearish sentiment in the market 📉. This downward momentum is driven by a substantial order block breach, leading to a surge in momentum acceleration to the downside for $PHB 🚀. The coin is currently testing its key support level around $0.01507, which is a crucial zone to watch for potential reversal or further downside 📊.
The current price action suggests a structural breakdown, with $PHB failing to hold its mid-range level of $0.03700, and now approaching its support zone, which may lead to a further decline if it fails to hold 📉. The lack of buying interest and increasing selling pressure are key factors contributing to the current bearish trend for $PHB 💸.
DYOR
Follow for Updates
#PHB #GENERAL_ALTCOIN #CryptoTrending #BinanceSquare
PHB PLUMMETS 70% IN 24 HOURS 📉💸
$PHB is experiencing a severe price collapse, dropping 70% in the last 24 hours, with a significant increase in selling volume, indicating a strong bearish sentiment in the market 📉. This downward momentum is driven by a substantial order block breach, leading to a surge in momentum acceleration to the downside for $PHB 🚀. The coin is currently testing its key support level around $0.01507, which is a crucial zone to watch for potential reversal or further downside 📊.
The current price action suggests a structural breakdown, with $PHB failing to hold its mid-range level of $0.03700, and now approaching its support zone, which may lead to a further decline if it fails to hold 📉. The lack of buying interest and increasing selling pressure are key factors contributing to the current bearish trend for $PHB 💸.
DYOR
Follow for Updates
#PHB #GENERAL_ALTCOIN #CryptoTrending #BinanceSquare
$PHB is experiencing a severe price collapse, dropping 70% in the last 24 hours, with a significant increase in selling volume, indicating a strong bearish sentiment in the market 📉. This downward momentum is driven by a substantial order block breach, leading to a surge in momentum acceleration to the downside for $PHB 🚀. The coin is currently testing its key support level around $0.01507, which is a crucial zone to watch for potential reversal or further downside 📊.
The current price action suggests a structural breakdown, with $PHB failing to hold its mid-range level of $0.03700, and now approaching its support zone, which may lead to a further decline if it fails to hold 📉. The lack of buying interest and increasing selling pressure are key factors contributing to the current bearish trend for $PHB 💸.
DYOR
Follow for Updates
#PHB #GENERAL_ALTCOIN #CryptoTrending #BinanceSquare
5
Log in to explore more content
Join global crypto users on Binance Square
⚡️ Get latest and useful information about crypto.
💬 Trusted by the world’s largest crypto exchange.
👍 Discover real insights from verified creators.
Email / Phone number
Trending Topics
1
#NvidiaLoses$2.7TrillionInMonthAndAHalf
21,076 views
135 Discussing
2
#CanBTCReboundAfterFallingBelow60K?
783,118 views
3,013 Discussing
3
#GlobalStocksFaceLongestLosingStreakSince2023
286,132 views
2,012 Discussing
4
#BlackRockIBITPostsRecord$541MSingleDayOutflow
34,435 views
101 Discussing
5
#AnthropicPlungesTowardIPOPriceonDay2
146,952 views
1,228 Discussing
6
#TwentyOneCapitalAdds172.25BTC
67,425 views
673 Discussing
7
#HKBillWouldExcludeTokenizedDepositsFromVirtualAssets
8,886 views
50 Discussing
8
#BNBDropsBelow540USDTWith8.46%DailyDecline
79,793 views
656 Discussing
9
#HKBillProposesHK$100KFineForUnauthorizedCryptoTitles
2,674 views
22 Discussing
10
#BitMineFaces$10.1BUnrealizedETHLoss
5,618 views
28 Discussing