
#stablecoins
stablecoins
7.8M views
30,626 Discussing
Hot
Latest

·
--
The biggest opportunity in crypto might be sitting on the sidelines right now. 👀
Something interesting happened in trading activity: BTC and USDC almost matched each other in Binance's reported USDT volume breakdown.
That raises a bigger question…
Are traders converting to stablecoins because they are scared—or quietly preparing to buy when the market gives them a better opportunity?
Cash on the sidelines can mean fear. It can also mean potential buying power.
What do you think is happening right now: capital leaving crypto, or capital waiting for the right entry?
$BTC
{spot}(BTCUSDT)
$USDC $ETH
#CryptoMarket #Bitcoin #Stablecoins #BinanceSquare
The biggest opportunity in crypto might be sitting on the sidelines right now. 👀
Something interesting happened in trading activity: BTC and USDC almost matched each other in Binance's reported USDT volume breakdown.
That raises a bigger question…
Are traders converting to stablecoins because they are scared—or quietly preparing to buy when the market gives them a better opportunity?
Cash on the sidelines can mean fear. It can also mean potential buying power.
What do you think is happening right now: capital leaving crypto, or capital waiting for the right entry?
$BTC
$USDC $ETH
#CryptoMarket #Bitcoin #Stablecoins #BinanceSquare
Something interesting happened in trading activity: BTC and USDC almost matched each other in Binance's reported USDT volume breakdown.
That raises a bigger question…
Are traders converting to stablecoins because they are scared—or quietly preparing to buy when the market gives them a better opportunity?
Cash on the sidelines can mean fear. It can also mean potential buying power.
What do you think is happening right now: capital leaving crypto, or capital waiting for the right entry?
$BTC
$USDC $ETH
#CryptoMarket #Bitcoin #Stablecoins #BinanceSquare

67

·
--
Bullish
Partly True
🚀 Sui's Stablecoin Market Hits a New Milestone!
The total stablecoin market cap on the Sui network reached $600.84 million on November 19, marking its highest level since December 2025.
That's a remarkable 27.54% increase from $471.09 million at the beginning of 2026.
Circle's USDC dominates the ecosystem, accounting for $430.02 million of the total.
📈 Growing stablecoin liquidity signals increasing capital flow and expanding activity across the Sui ecosystem.
Sui's ecosystem continues to gain momentum! 🔥
#SUI #USDC #Stablecoins #Crypto
$SUI
{spot}(SUIUSDT)
🚀 Sui's Stablecoin Market Hits a New Milestone!
The total stablecoin market cap on the Sui network reached $600.84 million on November 19, marking its highest level since December 2025.
That's a remarkable 27.54% increase from $471.09 million at the beginning of 2026.
Circle's USDC dominates the ecosystem, accounting for $430.02 million of the total.
📈 Growing stablecoin liquidity signals increasing capital flow and expanding activity across the Sui ecosystem.
Sui's ecosystem continues to gain momentum! 🔥
#SUI #USDC #Stablecoins #Crypto
$SUI
The total stablecoin market cap on the Sui network reached $600.84 million on November 19, marking its highest level since December 2025.
That's a remarkable 27.54% increase from $471.09 million at the beginning of 2026.
Circle's USDC dominates the ecosystem, accounting for $430.02 million of the total.
📈 Growing stablecoin liquidity signals increasing capital flow and expanding activity across the Sui ecosystem.
Sui's ecosystem continues to gain momentum! 🔥
#SUI #USDC #Stablecoins #Crypto
$SUI


3
649

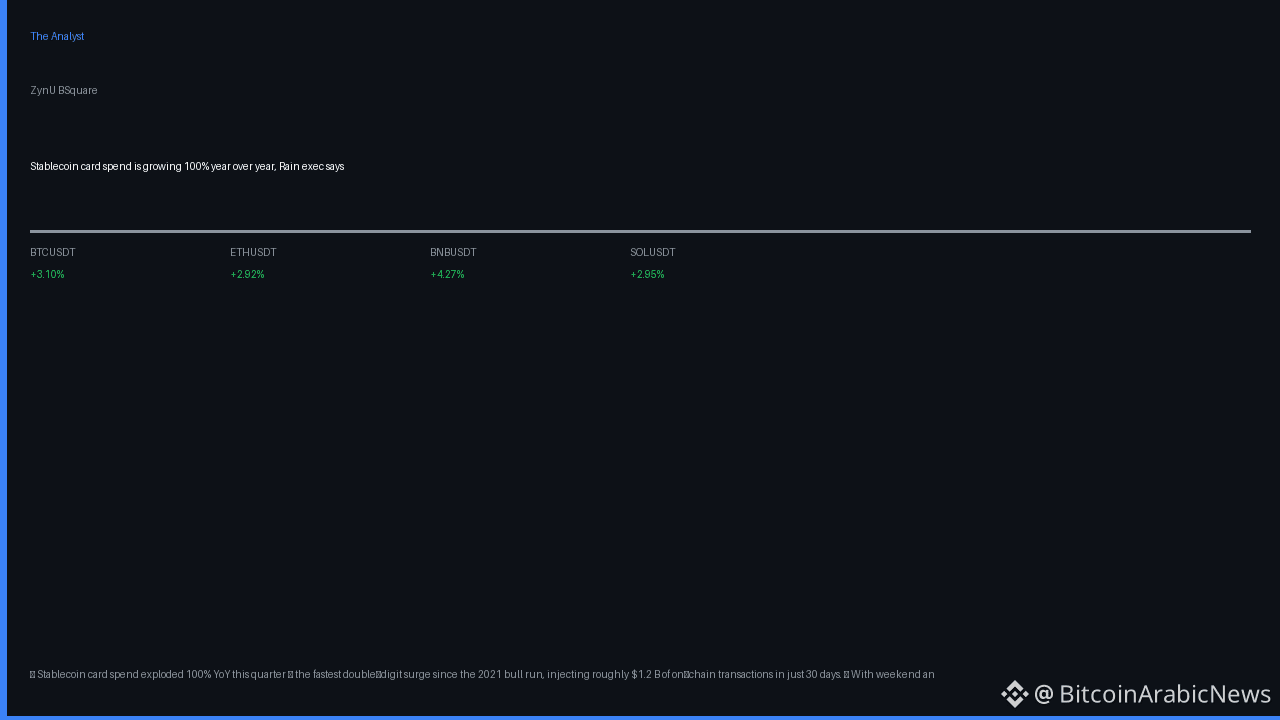
⚡ Stablecoin card spend exploded 100% YoY this quarter — the fastest double‑digit surge since the 2021 bull run, injecting roughly $1.2 B of on‑chain transactions in just 30 days.
📈 With weekend and holiday settlement erasing over 40% of trapped capital, issuers now enjoy true 24/7 liquidity, tightening the feedback loop between retail spend and on‑chain supply.
💡 Smart money is already rebalancing: BTC futures open interest sits at $5.57 B, funding is positive (+0.0051%), and the long/short ratio of 2.34 (70% longs) fuels a 3.1% rise to $59,723. ETH futures show $3.89 B OI, funding –0.0021% and a 1.89 L/S ratio, hinting at a modest pull‑back while #BTC, #Stablecoins and #DeFi together capture a 15% surge in on‑chain spend volume. On‑chain wallets like FIONA and DCTY are net‑buying Solana (+12.9% & +1.3% respectively), underscoring cross‑chain appetite for liquid assets.
🚀 Watch the $60,000 barrier on #BTC and the $1,720 mark on ETH — a clean close above either within 48 h historically ignites a 20‑30% upside, amplified by the inflow of $2‑$3 B weekly into #CardSpend‑backed stablecoins.
❓ If stablecoins can now fund your coffee and your next Bitcoin purchase, are you still treating them as mere hedges or as the new backbone of retail crypto demand?
⚡ Stablecoin card spend exploded 100% YoY this quarter — the fastest double‑digit surge since the 2021 bull run, injecting roughly $1.2 B of on‑chain transactions in just 30 days.
📈 With weekend and holiday settlement erasing over 40% of trapped capital, issuers now enjoy true 24/7 liquidity, tightening the feedback loop between retail spend and on‑chain supply.
💡 Smart money is already rebalancing: BTC futures open interest sits at $5.57 B, funding is positive (+0.0051%), and the long/short ratio of 2.34 (70% longs) fuels a 3.1% rise to $59,723. ETH futures show $3.89 B OI, funding –0.0021% and a 1.89 L/S ratio, hinting at a modest pull‑back while #BTC, #Stablecoins and #DeFi together capture a 15% surge in on‑chain spend volume. On‑chain wallets like FIONA and DCTY are net‑buying Solana (+12.9% & +1.3% respectively), underscoring cross‑chain appetite for liquid assets.
🚀 Watch the $60,000 barrier on #BTC and the $1,720 mark on ETH — a clean close above either within 48 h historically ignites a 20‑30% upside, amplified by the inflow of $2‑$3 B weekly into #CardSpend‑backed stablecoins.
❓ If stablecoins can now fund your coffee and your next Bitcoin purchase, are you still treating them as mere hedges or as the new backbone of retail crypto demand?
📈 With weekend and holiday settlement erasing over 40% of trapped capital, issuers now enjoy true 24/7 liquidity, tightening the feedback loop between retail spend and on‑chain supply.
💡 Smart money is already rebalancing: BTC futures open interest sits at $5.57 B, funding is positive (+0.0051%), and the long/short ratio of 2.34 (70% longs) fuels a 3.1% rise to $59,723. ETH futures show $3.89 B OI, funding –0.0021% and a 1.89 L/S ratio, hinting at a modest pull‑back while #BTC, #Stablecoins and #DeFi together capture a 15% surge in on‑chain spend volume. On‑chain wallets like FIONA and DCTY are net‑buying Solana (+12.9% & +1.3% respectively), underscoring cross‑chain appetite for liquid assets.
🚀 Watch the $60,000 barrier on #BTC and the $1,720 mark on ETH — a clean close above either within 48 h historically ignites a 20‑30% upside, amplified by the inflow of $2‑$3 B weekly into #CardSpend‑backed stablecoins.
❓ If stablecoins can now fund your coffee and your next Bitcoin purchase, are you still treating them as mere hedges or as the new backbone of retail crypto demand?
52

·
--
🦈 $USDT LIQUIDITY MEETS AI AGENTS AS SINGAPORE LAUNCHES INSTITUTIONAL SANDBOX ⚡
The Monetary Authority of Singapore is bridging traditional finance and tokenized liquidity with a novel know-your-agent protocol. By deploying the Agentic Money Sandbox, institutional heavyweights can test stablecoin payment rails under rigorous risk parameters. 📊
This structural shift transforms how programmatic capital interacts with digital ledgers, laying the groundwork for verifiable institutional adoption. As settlement efficiency scales, liquidity footprints will evolve across global financial networks. 💡
💬 Are tokenized deposits and automated settlement agents the ultimate catalyst for the next wave of liquidity inflows?
⚠️ Not financial advice. Always manage your risk. 🛡️
🏷️ #USDT #Stablecoins #CryptoNews #Tokenization #MarketStructure
🦈 📈
🦈 $USDT LIQUIDITY MEETS AI AGENTS AS SINGAPORE LAUNCHES INSTITUTIONAL SANDBOX ⚡
The Monetary Authority of Singapore is bridging traditional finance and tokenized liquidity with a novel know-your-agent protocol. By deploying the Agentic Money Sandbox, institutional heavyweights can test stablecoin payment rails under rigorous risk parameters. 📊
This structural shift transforms how programmatic capital interacts with digital ledgers, laying the groundwork for verifiable institutional adoption. As settlement efficiency scales, liquidity footprints will evolve across global financial networks. 💡
💬 Are tokenized deposits and automated settlement agents the ultimate catalyst for the next wave of liquidity inflows?
⚠️ Not financial advice. Always manage your risk. 🛡️
🏷️ #USDT #Stablecoins #CryptoNews #Tokenization #MarketStructure
🦈 📈
The Monetary Authority of Singapore is bridging traditional finance and tokenized liquidity with a novel know-your-agent protocol. By deploying the Agentic Money Sandbox, institutional heavyweights can test stablecoin payment rails under rigorous risk parameters. 📊
This structural shift transforms how programmatic capital interacts with digital ledgers, laying the groundwork for verifiable institutional adoption. As settlement efficiency scales, liquidity footprints will evolve across global financial networks. 💡
💬 Are tokenized deposits and automated settlement agents the ultimate catalyst for the next wave of liquidity inflows?
⚠️ Not financial advice. Always manage your risk. 🛡️
🏷️ #USDT #Stablecoins #CryptoNews #Tokenization #MarketStructure
🦈 📈


🚨 $USDT LIQUIDITY RAILS JUST LEVELED UP AS SINGAPORE LAUNCHES AI PAYMENT SANDBOX! ⚡
Institutional plumbing is quietly evolving behind closed doors while retail chases the noise. Singapore is paving the way with a dedicated sandbox for AI agents to route stablecoin transactions securely. 📊
This institutional push brings structural maturity to digital asset settlement, bridging traditional finance with algorithmic execution. 💡 When central banks start building native verification protocols for on-chain liquidity, smart money is already positioning for the shift. 🌊
💬 Are automated AI micro-transactions going to be the catalyst that unlocks trillions in institutional volume this cycle? 👇
⚠️ Not financial advice. Always manage your risk. 🛡️
🏷️ #USDT #Stablecoins #CryptoNews #Liquidity
🔥 💎
🚨 $USDT LIQUIDITY RAILS JUST LEVELED UP AS SINGAPORE LAUNCHES AI PAYMENT SANDBOX! ⚡
Institutional plumbing is quietly evolving behind closed doors while retail chases the noise. Singapore is paving the way with a dedicated sandbox for AI agents to route stablecoin transactions securely. 📊
This institutional push brings structural maturity to digital asset settlement, bridging traditional finance with algorithmic execution. 💡 When central banks start building native verification protocols for on-chain liquidity, smart money is already positioning for the shift. 🌊
💬 Are automated AI micro-transactions going to be the catalyst that unlocks trillions in institutional volume this cycle? 👇
⚠️ Not financial advice. Always manage your risk. 🛡️
🏷️ #USDT #Stablecoins #CryptoNews #Liquidity
🔥 💎
Institutional plumbing is quietly evolving behind closed doors while retail chases the noise. Singapore is paving the way with a dedicated sandbox for AI agents to route stablecoin transactions securely. 📊
This institutional push brings structural maturity to digital asset settlement, bridging traditional finance with algorithmic execution. 💡 When central banks start building native verification protocols for on-chain liquidity, smart money is already positioning for the shift. 🌊
💬 Are automated AI micro-transactions going to be the catalyst that unlocks trillions in institutional volume this cycle? 👇
⚠️ Not financial advice. Always manage your risk. 🛡️
🏷️ #USDT #Stablecoins #CryptoNews #Liquidity
🔥 💎

3

This move shows Singapore is serious about integrating AI in finance. It's a step towards more efficient payments, but we need to watch how it impacts regulation.
Singapore to Test Stablecoin Payments via AI Agents
Singapore's central bank, the Monetary Authority of Singapore (MAS), announced plans to develop a common framework for verifying AI agents in financial transactions. This was outlined by Chia Der Jiun on November 19, during a presentation on the future of finance. The proposed know-your-agent protocol will help banks confirm the identity of AI agents and understand their authority and responsibilities.
Part of this initiative includes a dedicated sandbox, named the Agentic Money Sandbox, where institutions can test payment processes using stablecoins and tokenized deposits. This controlled environment allows banks to assess the agents' identity and authority while applying necessary risk controls before executing instructions.
The MAS aims to roll out the know-your-agent protocol in the next phase of its Safeguards for Agentic Finance initiative. This will ensure that customers clearly define the actions their AI agents can take, thereby increasing accountability and minimizing risks associated with agent errors.
As this initiative progresses, it could shape how digital payments operate, especially with the inclusion of stablecoins. The outcome of these tests may influence future regulations and the broader adoption of AI in financial services.
#Stablecoins #CryptoNews
This move shows Singapore is serious about integrating AI in finance. It's a step towards more efficient payments, but we need to watch how it impacts regulation.
Singapore to Test Stablecoin Payments via AI Agents
Singapore's central bank, the Monetary Authority of Singapore (MAS), announced plans to develop a common framework for verifying AI agents in financial transactions. This was outlined by Chia Der Jiun on November 19, during a presentation on the future of finance. The proposed know-your-agent protocol will help banks confirm the identity of AI agents and understand their authority and responsibilities.
Part of this initiative includes a dedicated sandbox, named the Agentic Money Sandbox, where institutions can test payment processes using stablecoins and tokenized deposits. This controlled environment allows banks to assess the agents' identity and authority while applying necessary risk controls before executing instructions.
The MAS aims to roll out the know-your-agent protocol in the next phase of its Safeguards for Agentic Finance initiative. This will ensure that customers clearly define the actions their AI agents can take, thereby increasing accountability and minimizing risks associated with agent errors.
As this initiative progresses, it could shape how digital payments operate, especially with the inclusion of stablecoins. The outcome of these tests may influence future regulations and the broader adoption of AI in financial services.
#Stablecoins #CryptoNews
Singapore to Test Stablecoin Payments via AI Agents
Singapore's central bank, the Monetary Authority of Singapore (MAS), announced plans to develop a common framework for verifying AI agents in financial transactions. This was outlined by Chia Der Jiun on November 19, during a presentation on the future of finance. The proposed know-your-agent protocol will help banks confirm the identity of AI agents and understand their authority and responsibilities.
Part of this initiative includes a dedicated sandbox, named the Agentic Money Sandbox, where institutions can test payment processes using stablecoins and tokenized deposits. This controlled environment allows banks to assess the agents' identity and authority while applying necessary risk controls before executing instructions.
The MAS aims to roll out the know-your-agent protocol in the next phase of its Safeguards for Agentic Finance initiative. This will ensure that customers clearly define the actions their AI agents can take, thereby increasing accountability and minimizing risks associated with agent errors.
As this initiative progresses, it could shape how digital payments operate, especially with the inclusion of stablecoins. The outcome of these tests may influence future regulations and the broader adoption of AI in financial services.
#Stablecoins #CryptoNews

2
550

·
--
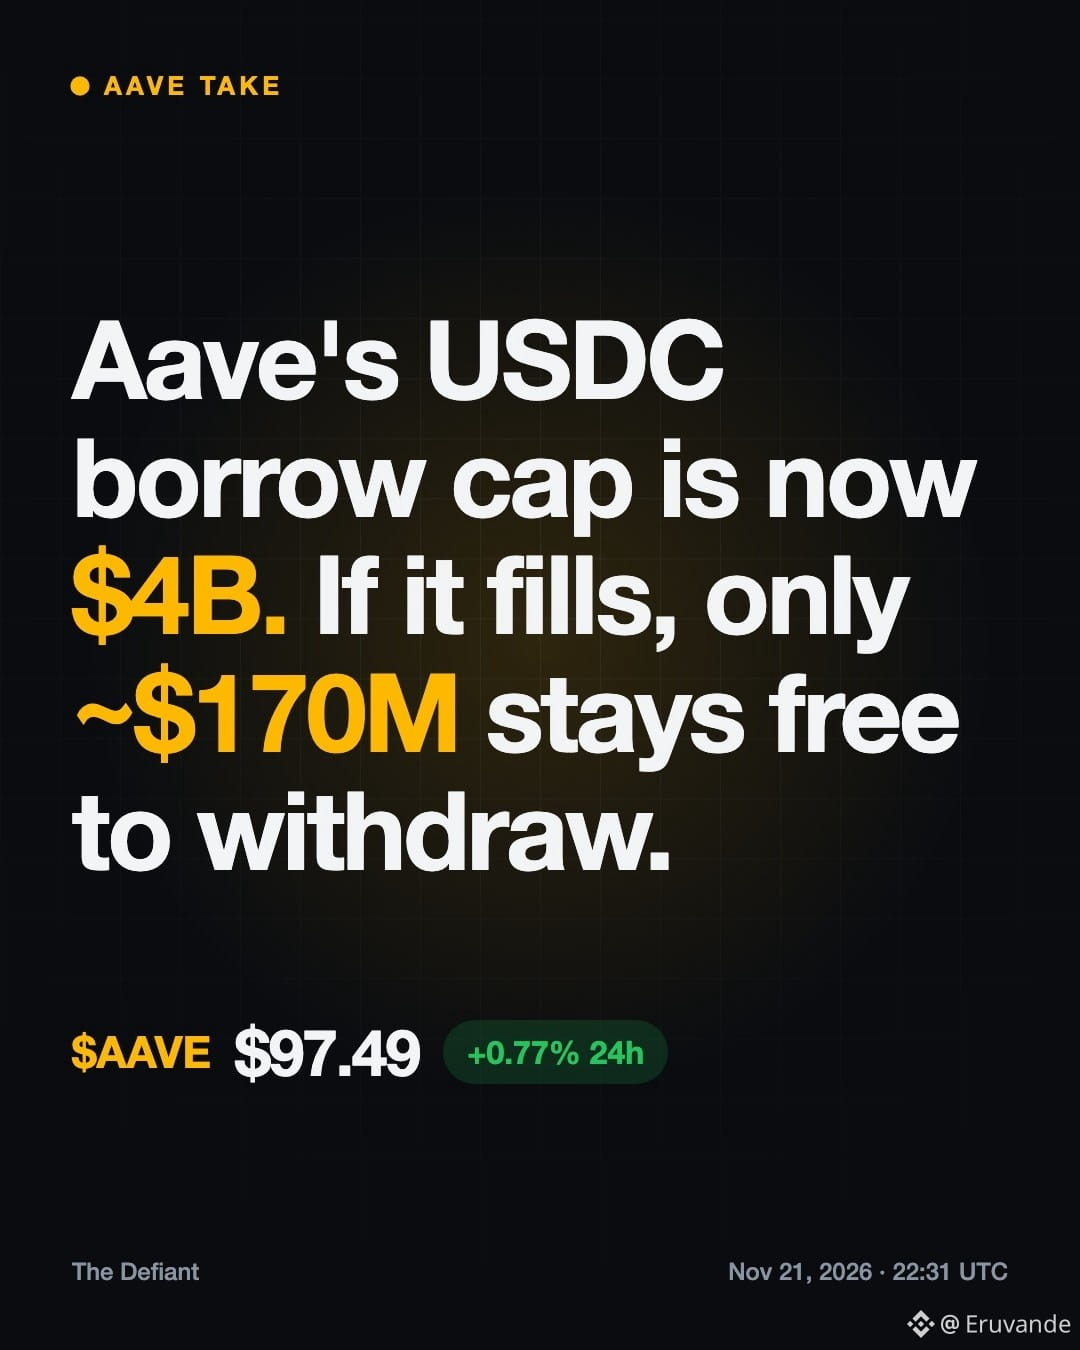
Aave just raised its Ethereum USDC borrow cap to $4B. If loans fill it, only about $170M of USDC stays free, per The Defiant. $AAVE
#Aave #Stablecoins
Aave just raised its Ethereum USDC borrow cap to $4B. If loans fill it, only about $170M of USDC stays free, per The Defiant. $AAVE
#Aave #Stablecoins
#Aave #Stablecoins
37

Singapore is pioneering the future of fintech by exploring stablecoin payments executed directly by AI agents. This sandbox project is a critical step toward automating digital commerce while ensuring strict security and identity verification. By bridging AI autonomy with regulated financial frameworks, Singapore reinforces its role as a global crypto hub. Expect this to set a new standard for how machine-to-machine economies operate under the oversight of traditional banking institutions. $USDC $PYUSD #Singapore #Stablecoins #AI
Singapore is pioneering the future of fintech by exploring stablecoin payments executed directly by AI agents. This sandbox project is a critical step toward automating digital commerce while ensuring strict security and identity verification. By bridging AI autonomy with regulated financial frameworks, Singapore reinforces its role as a global crypto hub. Expect this to set a new standard for how machine-to-machine economies operate under the oversight of traditional banking institutions. $USDC $PYUSD #Singapore #Stablecoins #AI
2

🚨 THE WALL STREET BRIDGE IS FINALLY OPENING AS $BTC HOLDS $58K! ⚡
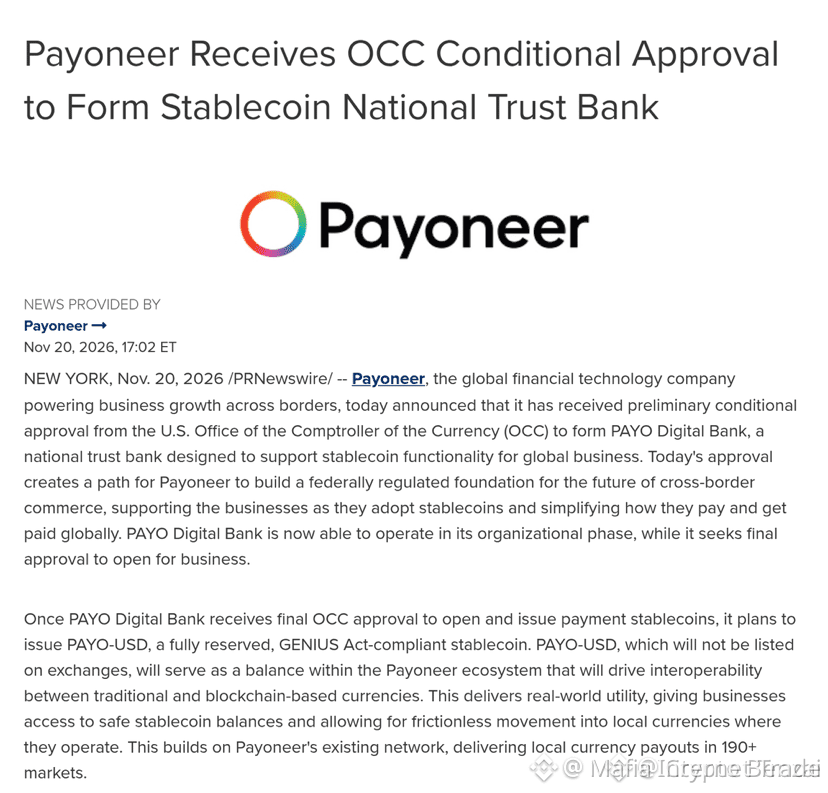
Traditional finance keeps digging deeper into blockchain rails while $BTC tests liquidity near 58K. Payoneer just secured preliminary OCC conditional approval to launch a dedicated stablecoin trust bank. 📊
This institutional push brings fully reserved digital dollars straight into business accounts across 190 plus markets. When legacy giants bypass traditional friction to embrace stablecoin settlement, the macro narrative shifts permanently. 💡
Which legacy payments titan makes the next aggressive move into on-chain liquidity? 🤔
⚠️ Not financial advice. Always manage your risk. 🛡️
🏷️ #BTC #Stablecoins #Macro #Crypto #Banking
🔥 💎
🚨 THE WALL STREET BRIDGE IS FINALLY OPENING AS $BTC HOLDS $58K! ⚡
Traditional finance keeps digging deeper into blockchain rails while $BTC tests liquidity near 58K. Payoneer just secured preliminary OCC conditional approval to launch a dedicated stablecoin trust bank. 📊
This institutional push brings fully reserved digital dollars straight into business accounts across 190 plus markets. When legacy giants bypass traditional friction to embrace stablecoin settlement, the macro narrative shifts permanently. 💡
Which legacy payments titan makes the next aggressive move into on-chain liquidity? 🤔
⚠️ Not financial advice. Always manage your risk. 🛡️
🏷️ #BTC #Stablecoins #Macro #Crypto #Banking
🔥 💎
Traditional finance keeps digging deeper into blockchain rails while $BTC tests liquidity near 58K. Payoneer just secured preliminary OCC conditional approval to launch a dedicated stablecoin trust bank. 📊
This institutional push brings fully reserved digital dollars straight into business accounts across 190 plus markets. When legacy giants bypass traditional friction to embrace stablecoin settlement, the macro narrative shifts permanently. 💡
Which legacy payments titan makes the next aggressive move into on-chain liquidity? 🤔
⚠️ Not financial advice. Always manage your risk. 🛡️
🏷️ #BTC #Stablecoins #Macro #Crypto #Banking
🔥 💎
10

·
--
Bullish
🚨 STABLECOINS ARE ENTERING A NEW ERA!
MoonPay is seeking a U.S. national trust bank charter for stablecoin services.
Could stablecoins become a bigger part of global payments? 💵
$STABLE $BNB $BTC
#Stablecoins #CryptoNews #Blockchain #Finance #RajaBTC
🚨 STABLECOINS ARE ENTERING A NEW ERA!
MoonPay is seeking a U.S. national trust bank charter for stablecoin services.
Could stablecoins become a bigger part of global payments? 💵
$STABLE $BNB $BTC
#Stablecoins #CryptoNews #Blockchain #Finance #RajaBTC
MoonPay is seeking a U.S. national trust bank charter for stablecoin services.
Could stablecoins become a bigger part of global payments? 💵
$STABLE $BNB $BTC
#Stablecoins #CryptoNews #Blockchain #Finance #RajaBTC

61

·
--
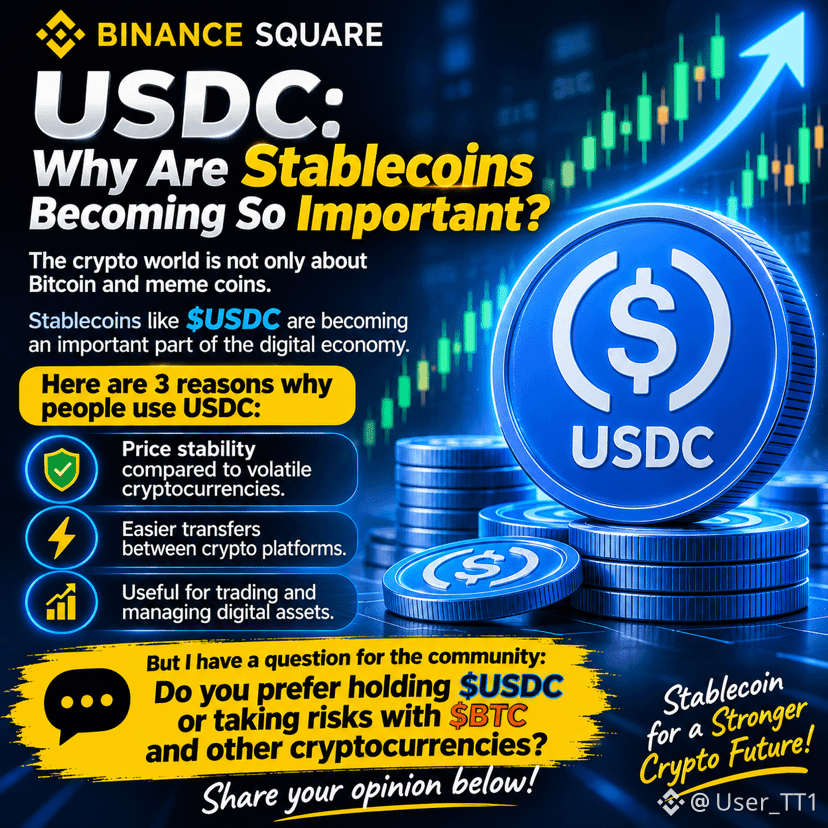
💵 USDC: Why Are Stablecoins Becoming So Important?
The crypto world is not only about Bitcoin and meme coins.
Stablecoins like $USDC are becoming an important part of the digital economy.
Here are 3 reasons why people use USDC:
🔹 Price stability compared to volatile cryptocurrencies.
🔹 Easier transfers between crypto platforms.
🔹 Useful for trading and managing digital assets.
But I have a question for the community:
Do you prefer holding $USDC or taking risks with $BTC and other cryptocurrencies?
Share your opinion below! 👇
#USDC
#Stablecoins
#Bitcoin
#Crypto
#BinanceSquare
💵 USDC: Why Are Stablecoins Becoming So Important?
The crypto world is not only about Bitcoin and meme coins.
Stablecoins like $USDC are becoming an important part of the digital economy.
Here are 3 reasons why people use USDC:
🔹 Price stability compared to volatile cryptocurrencies.
🔹 Easier transfers between crypto platforms.
🔹 Useful for trading and managing digital assets.
But I have a question for the community:
Do you prefer holding $USDC or taking risks with $BTC and other cryptocurrencies?
Share your opinion below! 👇
#USDC
#Stablecoins
#Bitcoin
#Crypto
#BinanceSquare
The crypto world is not only about Bitcoin and meme coins.
Stablecoins like $USDC are becoming an important part of the digital economy.
Here are 3 reasons why people use USDC:
🔹 Price stability compared to volatile cryptocurrencies.
🔹 Easier transfers between crypto platforms.
🔹 Useful for trading and managing digital assets.
But I have a question for the community:
Do you prefer holding $USDC or taking risks with $BTC and other cryptocurrencies?
Share your opinion below! 👇
#USDC
#Stablecoins
#Bitcoin
#Crypto
#BinanceSquare
1
94
Most conversations about cross-border payments focus on the fee. The bigger cost is the gap.
A freelancer finishes the work on a Tuesday and sends the invoice. The client pays the same morning. The money still isn't usable. It travels through correspondent banks that don't work weekends, or it arrives as a stablecoin transfer between two people who have never met — where one side is waiting on the other to release funds held in trust.
By the time it lands, three days have passed and the number is smaller than the invoice.
Stablecoins over a fast network remove most of that gap: confirmation in seconds rather than days, a fraction of the cost of a traditional international transfer, and no anonymous counterparty deciding when to release.
If you invoice abroad, the metric worth tracking isn't the headline fee. It's how long your money spends in transit.
#Stablecoins #CrossBorderPayments
Most conversations about cross-border payments focus on the fee. The bigger cost is the gap.
A freelancer finishes the work on a Tuesday and sends the invoice. The client pays the same morning. The money still isn't usable. It travels through correspondent banks that don't work weekends, or it arrives as a stablecoin transfer between two people who have never met — where one side is waiting on the other to release funds held in trust.
By the time it lands, three days have passed and the number is smaller than the invoice.
Stablecoins over a fast network remove most of that gap: confirmation in seconds rather than days, a fraction of the cost of a traditional international transfer, and no anonymous counterparty deciding when to release.
If you invoice abroad, the metric worth tracking isn't the headline fee. It's how long your money spends in transit.
#Stablecoins #CrossBorderPayments
A freelancer finishes the work on a Tuesday and sends the invoice. The client pays the same morning. The money still isn't usable. It travels through correspondent banks that don't work weekends, or it arrives as a stablecoin transfer between two people who have never met — where one side is waiting on the other to release funds held in trust.
By the time it lands, three days have passed and the number is smaller than the invoice.
Stablecoins over a fast network remove most of that gap: confirmation in seconds rather than days, a fraction of the cost of a traditional international transfer, and no anonymous counterparty deciding when to release.
If you invoice abroad, the metric worth tracking isn't the headline fee. It's how long your money spends in transit.
#Stablecoins #CrossBorderPayments
28
There's a detail in stablecoin payments that gets less attention than it deserves: what the balance becomes once it arrives.
Deposits of USDT or USDC can settle as USD at 1:1 — a dollar in, a dollar of balance out. You invoiced in dollars, you were paid in dollars, you hold dollars. No price exposure, and no second conversion before the money is actually useful.
That sounds minor until you compare it to the alternative: holding a stablecoin you intend to spend, and hoping nothing moves before you convert it.
It's the difference between a payment and a position.
#Stablecoins #Payments
There's a detail in stablecoin payments that gets less attention than it deserves: what the balance becomes once it arrives.
Deposits of USDT or USDC can settle as USD at 1:1 — a dollar in, a dollar of balance out. You invoiced in dollars, you were paid in dollars, you hold dollars. No price exposure, and no second conversion before the money is actually useful.
That sounds minor until you compare it to the alternative: holding a stablecoin you intend to spend, and hoping nothing moves before you convert it.
It's the difference between a payment and a position.
#Stablecoins #Payments
Deposits of USDT or USDC can settle as USD at 1:1 — a dollar in, a dollar of balance out. You invoiced in dollars, you were paid in dollars, you hold dollars. No price exposure, and no second conversion before the money is actually useful.
That sounds minor until you compare it to the alternative: holding a stablecoin you intend to spend, and hoping nothing moves before you convert it.
It's the difference between a payment and a position.
#Stablecoins #Payments
2

Article
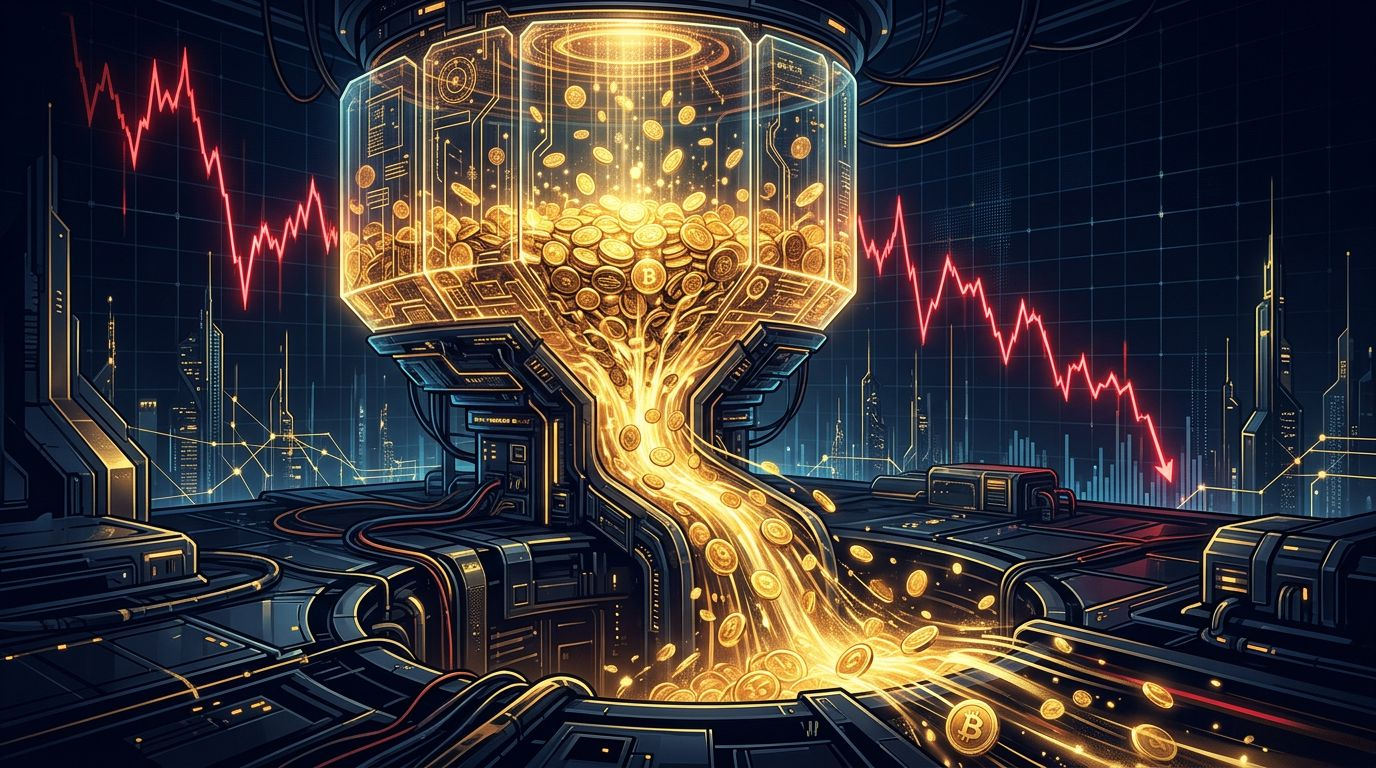
Stablecoin Supply Is Shrinking Fast, and XRP Is Feeling ItEveryone is staring at the price chart. I think the more important chart right now is the one that shows how much dollar firepower is sitting inside crypto, and it is shrinking fast.
What Happened
XRP slid to a low of 89 cents, its weakest level since November 2024, according to CoinDesk. The token is down 36% this quarter and has been sliding since it peaked above $3.60 in July 2025. Bitcoin and ether, meanwhile, dropped to levels last seen in August.
XRP is just the loudest symptom. Spot XRP ETFs in the US posted a net outflow of $19.13 million last week, the largest since March 2026, per SoSoValue. Since launching a year ago, those products have attracted roughly $1.5 billion in total, a small figure next to the multi-billion inflows that bitcoin and ether funds have seen. And even those bigger funds have been bleeding recently.
The Stablecoin Signal
Here is the part that caught my eye. The combined market cap of USDT and USDC has contracted to $244 billion, the lowest since September 2025. It peaked around $270 billion in early May, and the slide has been steady over the past seven weeks, falling from $260 billion in a near-straight line.
Glassnode analysts put it bluntly: stablecoin supply fell by $17 billion over the last month, the steepest drop since 2022. When holders swap stables for fiat, they drain buying power from BTC and the rest of the market.
Why It Matters
Stablecoins are the fuel tank of this market. They are how traders fund purchases and move value across borders. When supply grows, there is dry powder waiting to chase narratives. When it shrinks, rallies struggle to find buyers, and every dip gets harder to absorb.
That is why this feels different from a normal pullback driven by one headline. Price is down, ETF flows are negative, and the underlying liquidity pool is draining at the same time. Three different gauges are pointing the same way.
It also explains why altcoins with thinner demand, XRP included, tend to get hit hardest. XRP ETFs simply do not have the inflow cushion that bitcoin products built over time, so outflows show up faster in price.
Market Impact
The numbers from the report tell the story: XRP at 89 cents, down 36% on the quarter; USDT plus USDC at $244 billion versus a $270 billion peak in May; a $17 billion monthly drop in stablecoin supply. BTC and ETH sit at August levels. None of this says a bottom is in or isn't. It says that the demand side is currently weaker than the supply side.
My take: capitulation-style moves usually feel awful right when the data is most one-sided, but liquidity is the variable I would not ignore. Prices can bounce on sentiment alone, yet lasting trends have historically needed fresh capital behind them.
What to Watch Next
First, whether stablecoin supply stabilizes. A flat or rising line would be the first sign that money is no longer leaving.
Second, ETF flow data for XRP, BTC and ETH over the coming weeks. Consecutive inflow days would mark a shift in tone.
Third, macro. Rate expectations and the dollar have been driving risk appetite across markets, and crypto has been trading as a high-beta part of that picture.
The Question
Do you treat shrinking stablecoin supply as a leading indicator, or is it just a lagging reflection of price? Where do you look first when judging whether liquidity is coming back? Let me know in the comments.
#XRP #Stablecoins #CryptoMarket
$XRP $BTC $USDT
Stablecoin Supply Is Shrinking Fast, and XRP Is Feeling It
Everyone is staring at the price chart. I think the more important chart right now is the one that shows how much dollar firepower is sitting inside crypto, and it is shrinking fast.
What Happened
XRP slid to a low of 89 cents, its weakest level since November 2024, according to CoinDesk. The token is down 36% this quarter and has been sliding since it peaked above $3.60 in July 2025. Bitcoin and ether, meanwhile, dropped to levels last seen in August.
XRP is just the loudest symptom. Spot XRP ETFs in the US posted a net outflow of $19.13 million last week, the largest since March 2026, per SoSoValue. Since launching a year ago, those products have attracted roughly $1.5 billion in total, a small figure next to the multi-billion inflows that bitcoin and ether funds have seen. And even those bigger funds have been bleeding recently.
The Stablecoin Signal
Here is the part that caught my eye. The combined market cap of USDT and USDC has contracted to $244 billion, the lowest since September 2025. It peaked around $270 billion in early May, and the slide has been steady over the past seven weeks, falling from $260 billion in a near-straight line.
Glassnode analysts put it bluntly: stablecoin supply fell by $17 billion over the last month, the steepest drop since 2022. When holders swap stables for fiat, they drain buying power from BTC and the rest of the market.
Why It Matters
Stablecoins are the fuel tank of this market. They are how traders fund purchases and move value across borders. When supply grows, there is dry powder waiting to chase narratives. When it shrinks, rallies struggle to find buyers, and every dip gets harder to absorb.
That is why this feels different from a normal pullback driven by one headline. Price is down, ETF flows are negative, and the underlying liquidity pool is draining at the same time. Three different gauges are pointing the same way.
It also explains why altcoins with thinner demand, XRP included, tend to get hit hardest. XRP ETFs simply do not have the inflow cushion that bitcoin products built over time, so outflows show up faster in price.
Market Impact
The numbers from the report tell the story: XRP at 89 cents, down 36% on the quarter; USDT plus USDC at $244 billion versus a $270 billion peak in May; a $17 billion monthly drop in stablecoin supply. BTC and ETH sit at August levels. None of this says a bottom is in or isn't. It says that the demand side is currently weaker than the supply side.
My take: capitulation-style moves usually feel awful right when the data is most one-sided, but liquidity is the variable I would not ignore. Prices can bounce on sentiment alone, yet lasting trends have historically needed fresh capital behind them.
What to Watch Next
First, whether stablecoin supply stabilizes. A flat or rising line would be the first sign that money is no longer leaving.
Second, ETF flow data for XRP, BTC and ETH over the coming weeks. Consecutive inflow days would mark a shift in tone.
Third, macro. Rate expectations and the dollar have been driving risk appetite across markets, and crypto has been trading as a high-beta part of that picture.
The Question
Do you treat shrinking stablecoin supply as a leading indicator, or is it just a lagging reflection of price? Where do you look first when judging whether liquidity is coming back? Let me know in the comments.
#XRP #Stablecoins #CryptoMarket
$XRP $BTC $USDT
What Happened
XRP slid to a low of 89 cents, its weakest level since November 2024, according to CoinDesk. The token is down 36% this quarter and has been sliding since it peaked above $3.60 in July 2025. Bitcoin and ether, meanwhile, dropped to levels last seen in August.
XRP is just the loudest symptom. Spot XRP ETFs in the US posted a net outflow of $19.13 million last week, the largest since March 2026, per SoSoValue. Since launching a year ago, those products have attracted roughly $1.5 billion in total, a small figure next to the multi-billion inflows that bitcoin and ether funds have seen. And even those bigger funds have been bleeding recently.
The Stablecoin Signal
Here is the part that caught my eye. The combined market cap of USDT and USDC has contracted to $244 billion, the lowest since September 2025. It peaked around $270 billion in early May, and the slide has been steady over the past seven weeks, falling from $260 billion in a near-straight line.
Glassnode analysts put it bluntly: stablecoin supply fell by $17 billion over the last month, the steepest drop since 2022. When holders swap stables for fiat, they drain buying power from BTC and the rest of the market.
Why It Matters
Stablecoins are the fuel tank of this market. They are how traders fund purchases and move value across borders. When supply grows, there is dry powder waiting to chase narratives. When it shrinks, rallies struggle to find buyers, and every dip gets harder to absorb.
That is why this feels different from a normal pullback driven by one headline. Price is down, ETF flows are negative, and the underlying liquidity pool is draining at the same time. Three different gauges are pointing the same way.
It also explains why altcoins with thinner demand, XRP included, tend to get hit hardest. XRP ETFs simply do not have the inflow cushion that bitcoin products built over time, so outflows show up faster in price.
Market Impact
The numbers from the report tell the story: XRP at 89 cents, down 36% on the quarter; USDT plus USDC at $244 billion versus a $270 billion peak in May; a $17 billion monthly drop in stablecoin supply. BTC and ETH sit at August levels. None of this says a bottom is in or isn't. It says that the demand side is currently weaker than the supply side.
My take: capitulation-style moves usually feel awful right when the data is most one-sided, but liquidity is the variable I would not ignore. Prices can bounce on sentiment alone, yet lasting trends have historically needed fresh capital behind them.
What to Watch Next
First, whether stablecoin supply stabilizes. A flat or rising line would be the first sign that money is no longer leaving.
Second, ETF flow data for XRP, BTC and ETH over the coming weeks. Consecutive inflow days would mark a shift in tone.
Third, macro. Rate expectations and the dollar have been driving risk appetite across markets, and crypto has been trading as a high-beta part of that picture.
The Question
Do you treat shrinking stablecoin supply as a leading indicator, or is it just a lagging reflection of price? Where do you look first when judging whether liquidity is coming back? Let me know in the comments.
#XRP #Stablecoins #CryptoMarket
$XRP $BTC $USDT
150

·
--
Bearish
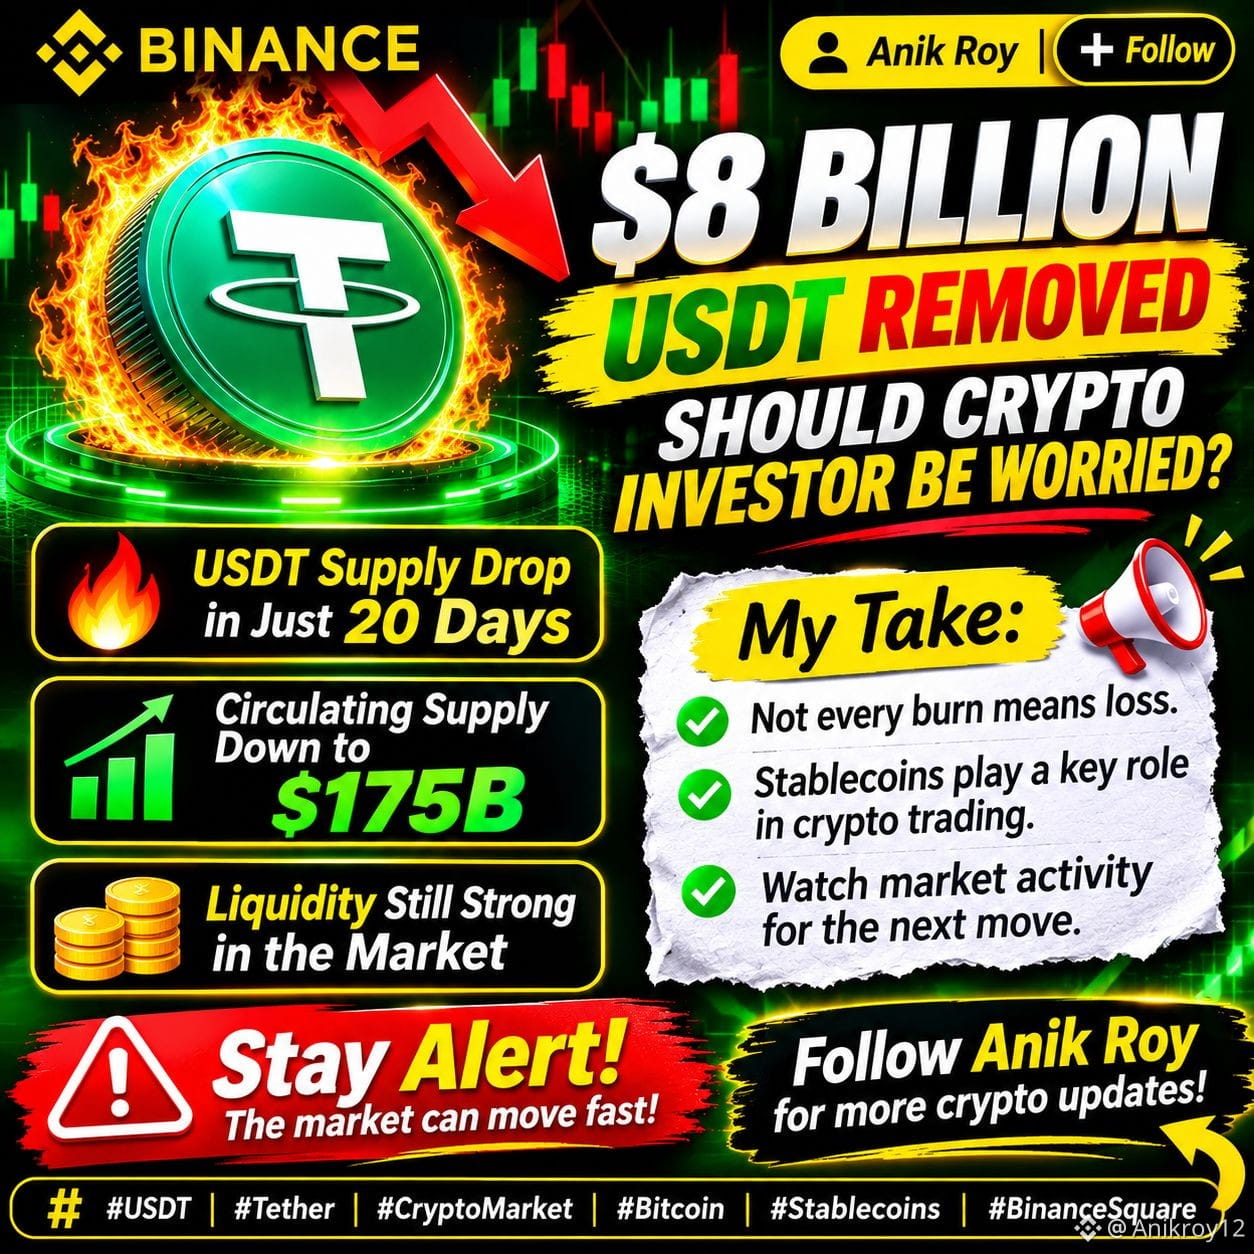
Tokens may be removed from circulation due to redemptions and treasury operations
🔹 2. Not Every Burn Means Loss: A token burn does not automatically mean holders have lost their funds.
🔹 3. Liquidity Matters: important role in crypto trading and market liquidity.
🔹 4. Watch Market Activity: Changes in supply, trading volume, and BTC price action can offer useful market signals.
⚠️ My Take:
Don't panic just because stablecoinsup declines. Look at the bigger picture before making any decisions.
👀 Keep watching USDTsupplyandoveral market liquidity. The next market move could be interesting!
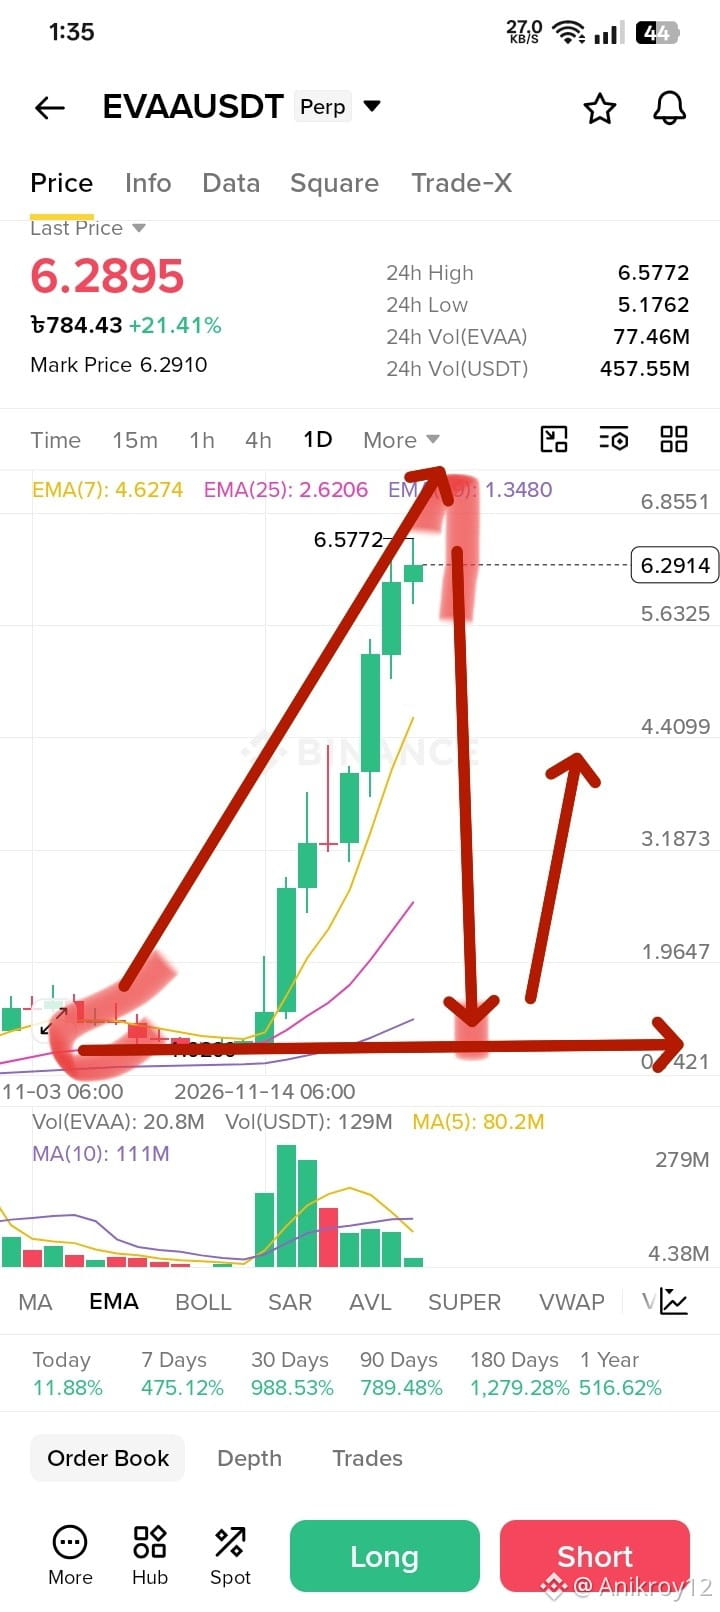
Market Watch: $EVAA $SOXSB
Follow for more crypto market updates.
#TetherBurns8BillionUSDTInPast20Days #USDT🔥🔥🔥 #Tether. #CryptoMarket #Stablecoins
{future}(EVAAUSDT)
Tokens may be removed from circulation due to redemptions and treasury operations
🔹 2. Not Every Burn Means Loss: A token burn does not automatically mean holders have lost their funds.
🔹 3. Liquidity Matters: important role in crypto trading and market liquidity.
🔹 4. Watch Market Activity: Changes in supply, trading volume, and BTC price action can offer useful market signals.
⚠️ My Take:
Don't panic just because stablecoinsup declines. Look at the bigger picture before making any decisions.
👀 Keep watching USDTsupplyandoveral market liquidity. The next market move could be interesting!
Market Watch: $EVAA $SOXSB
Follow for more crypto market updates.
#TetherBurns8BillionUSDTInPast20Days #USDT🔥🔥🔥 #Tether. #CryptoMarket #Stablecoins
🔹 2. Not Every Burn Means Loss: A token burn does not automatically mean holders have lost their funds.
🔹 3. Liquidity Matters: important role in crypto trading and market liquidity.
🔹 4. Watch Market Activity: Changes in supply, trading volume, and BTC price action can offer useful market signals.
⚠️ My Take:
Don't panic just because stablecoinsup declines. Look at the bigger picture before making any decisions.
👀 Keep watching USDTsupplyandoveral market liquidity. The next market move could be interesting!
Market Watch: $EVAA $SOXSB
Follow for more crypto market updates.
#TetherBurns8BillionUSDTInPast20Days #USDT🔥🔥🔥 #Tether. #CryptoMarket #Stablecoins
1
2
509

·
--
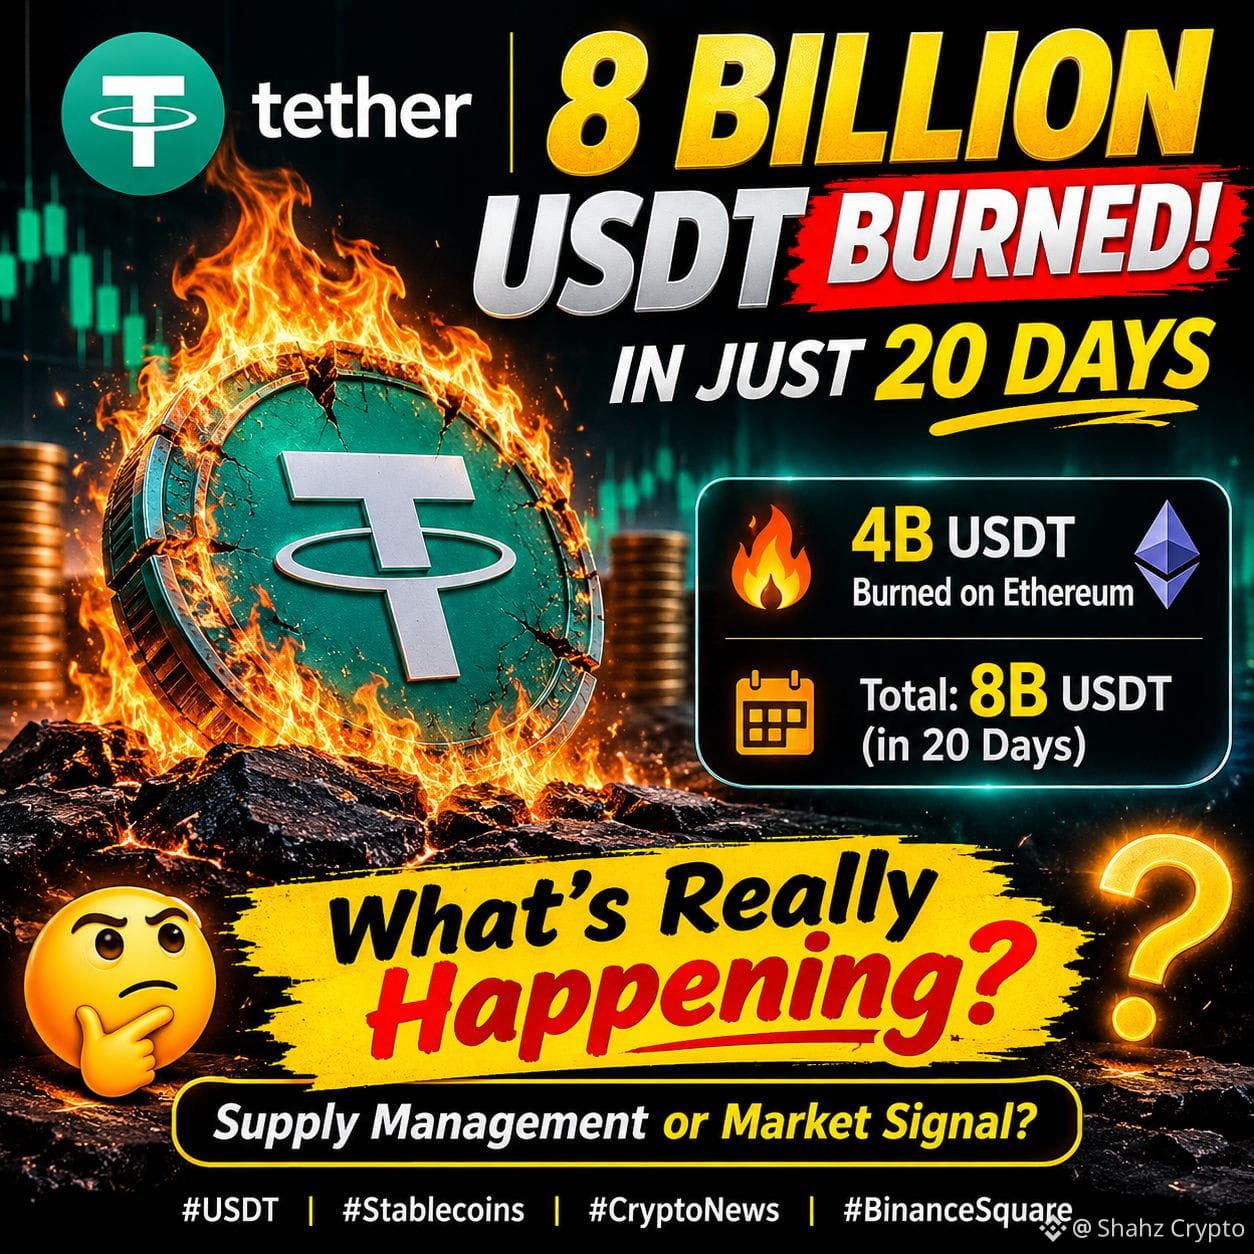
🚨 8 BILLION USDT BURNED IN JUST 20 DAYS!
Tether has removed billions of USDT from its token supply, including a massive 4B burn on Ethereum.
But here's what matters: a token burn doesn't automatically mean billions left the market overnight.
Is this routine supply management or a sign of changing crypto demand?
What's your take? 👇
$USDT $ETH
#Stablecoins #CryptoNews #BinanceSquare
🚨 8 BILLION USDT BURNED IN JUST 20 DAYS!
Tether has removed billions of USDT from its token supply, including a massive 4B burn on Ethereum.
But here's what matters: a token burn doesn't automatically mean billions left the market overnight.
Is this routine supply management or a sign of changing crypto demand?
What's your take? 👇
$USDT $ETH
#Stablecoins #CryptoNews #BinanceSquare
Tether has removed billions of USDT from its token supply, including a massive 4B burn on Ethereum.
But here's what matters: a token burn doesn't automatically mean billions left the market overnight.
Is this routine supply management or a sign of changing crypto demand?
What's your take? 👇
$USDT $ETH
#Stablecoins #CryptoNews #BinanceSquare
105
Traditional banking is finally catching up to crypto speed. DBS teaming up with JPMorgan and Circle to offer 24/7 USDC settlement in Asia is a massive step for liquidity. Instead of waiting for traditional banking hours, institutional players get instant rails. This blurs the line between fiat and stablecoins permanently. Watch for Asian markets to drive the next wave of stablecoin adoption as cross-border friction disappears. $USDC #CryptoNews #Stablecoins #Banking
Traditional banking is finally catching up to crypto speed. DBS teaming up with JPMorgan and Circle to offer 24/7 USDC settlement in Asia is a massive step for liquidity. Instead of waiting for traditional banking hours, institutional players get instant rails. This blurs the line between fiat and stablecoins permanently. Watch for Asian markets to drive the next wave of stablecoin adoption as cross-border friction disappears. $USDC #CryptoNews #Stablecoins #Banking
242
Binance just bumped the RLUSD yield to 6.37%, accompanied by a notable 54% jump in underlying token rewards. This move highlights how platforms are creatively incentivizing stablecoin liquidity paired with specific network assets. While promotional rates fluctuate, seeing dynamic reward adjustments like this shows the ongoing evolution of yield generation strategies across major exchange ecosystems. Always fascinating to watch liquidity flows shift in real time. $XRP #Binance #YieldFarming #Stablecoins
Binance just bumped the RLUSD yield to 6.37%, accompanied by a notable 54% jump in underlying token rewards. This move highlights how platforms are creatively incentivizing stablecoin liquidity paired with specific network assets. While promotional rates fluctuate, seeing dynamic reward adjustments like this shows the ongoing evolution of yield generation strategies across major exchange ecosystems. Always fascinating to watch liquidity flows shift in real time. $XRP #Binance #YieldFarming #Stablecoins
40

·
--
Tether has burned about 8 billion USDT over the 20 days to Nov 20, including a 4 billion USDT burn on Ethereum that day and 2 billion on Oct 31. Burns follow completed redemptions, and USDT circulating supply is now around 175 billion, down from 2026 peaks in the 180 to 190 billion range. The peg has held near 1 dollar throughout. #Tether #USDT #Stablecoins
Tether has burned about 8 billion USDT over the 20 days to Nov 20, including a 4 billion USDT burn on Ethereum that day and 2 billion on Oct 31. Burns follow completed redemptions, and USDT circulating supply is now around 175 billion, down from 2026 peaks in the 180 to 190 billion range. The peg has held near 1 dollar throughout. #Tether #USDT #Stablecoins
32
Log in to explore more content
Join global crypto users on Binance Square
⚡️ Get latest and useful information about crypto.
💬 Trusted by the world’s largest crypto exchange.
👍 Discover real insights from verified creators.
Email / Phone number
Trending Topics
1
#BTCReboundsAbove$60KAmidWhaleDipBuying
25,160 views
152 Discussing
2
#SolanaSets2027RoadmapToDoubleComputeCapacity
7,930 views
277 Discussing
3
#CaliforniaNvidiaProbeExaminesPotentialCriminalViolations
3,667 views
45 Discussing
4
#BlackRockLaunchesHKDollarDigitalLiquidityFund
8,048 views
257 Discussing
5
#NvidiaLoses$2.7TrillionInMonthAndAHalf
55,612 views
252 Discussing
6
#GlobalStocksFaceLongestLosingStreakSince2023
463,997 views
2,977 Discussing
7
#BlackRockIBITPostsRecord$541MSingleDayOutflow
72,829 views
158 Discussing
8
#AnthropicPlungesTowardIPOPriceonDay2
253,677 views
1,970 Discussing
9
#TwentyOneCapitalAdds172.25BTC
125,880 views
1,317 Discussing
10
#HKBillWouldExcludeTokenizedDepositsFromVirtualAssets
15,863 views
90 Discussing