
#ta
ta
1.7M views
6,969 Discussing
Hot
Latest

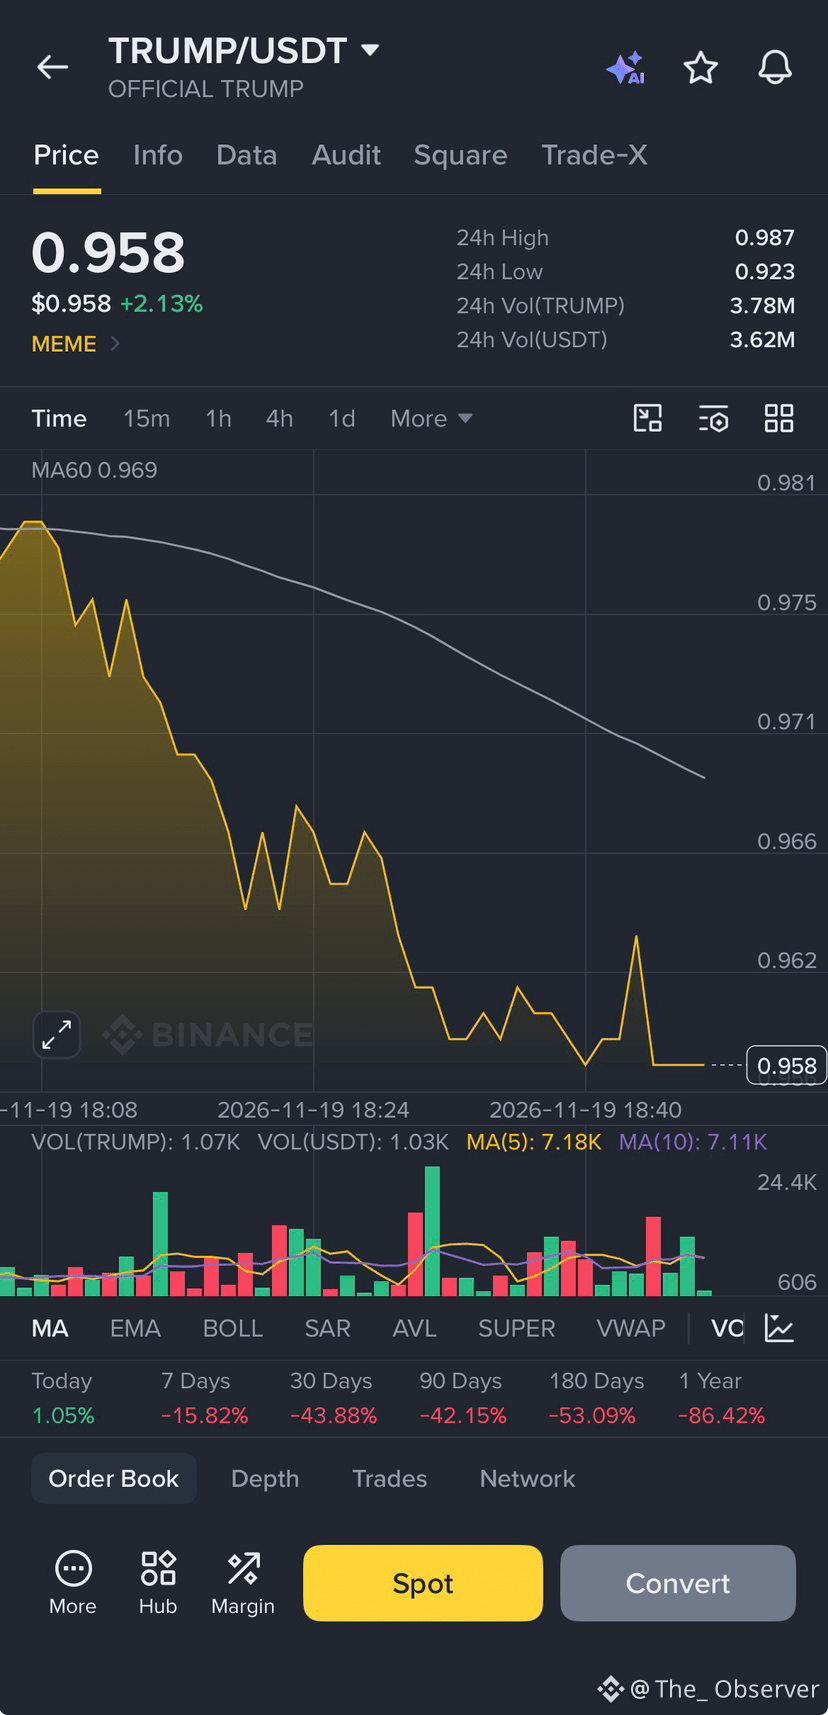
$TRUMP /USDT: Downward Pressure 🇺🇸📉
Minor relief bounce (+2.13%), but the macro trend remains heavily bearish.
📊 Key Zones:
• Ceiling: 0.969 (MA60) — major resistance.
• Floor: 0.923 (24h Low) — critical support.
🔮 Direction: Bearish. Price is grinding below the MA60 with lower highs. The bounce looks weak—sellers remain in control until 0.969 is reclaimed. 📉
⚠️ Meme volatility—stay sharp! 🛡️
#TRUMP #Crypto #TA
{spot}(TRUMPUSDT)
$TRUMP /USDT: Downward Pressure 🇺🇸📉
Minor relief bounce (+2.13%), but the macro trend remains heavily bearish.
📊 Key Zones:
• Ceiling: 0.969 (MA60) — major resistance.
• Floor: 0.923 (24h Low) — critical support.
🔮 Direction: Bearish. Price is grinding below the MA60 with lower highs. The bounce looks weak—sellers remain in control until 0.969 is reclaimed. 📉
⚠️ Meme volatility—stay sharp! 🛡️
#TRUMP #Crypto #TA
Minor relief bounce (+2.13%), but the macro trend remains heavily bearish.
📊 Key Zones:
• Ceiling: 0.969 (MA60) — major resistance.
• Floor: 0.923 (24h Low) — critical support.
🔮 Direction: Bearish. Price is grinding below the MA60 with lower highs. The bounce looks weak—sellers remain in control until 0.969 is reclaimed. 📉
⚠️ Meme volatility—stay sharp! 🛡️
#TRUMP #Crypto #TA
273
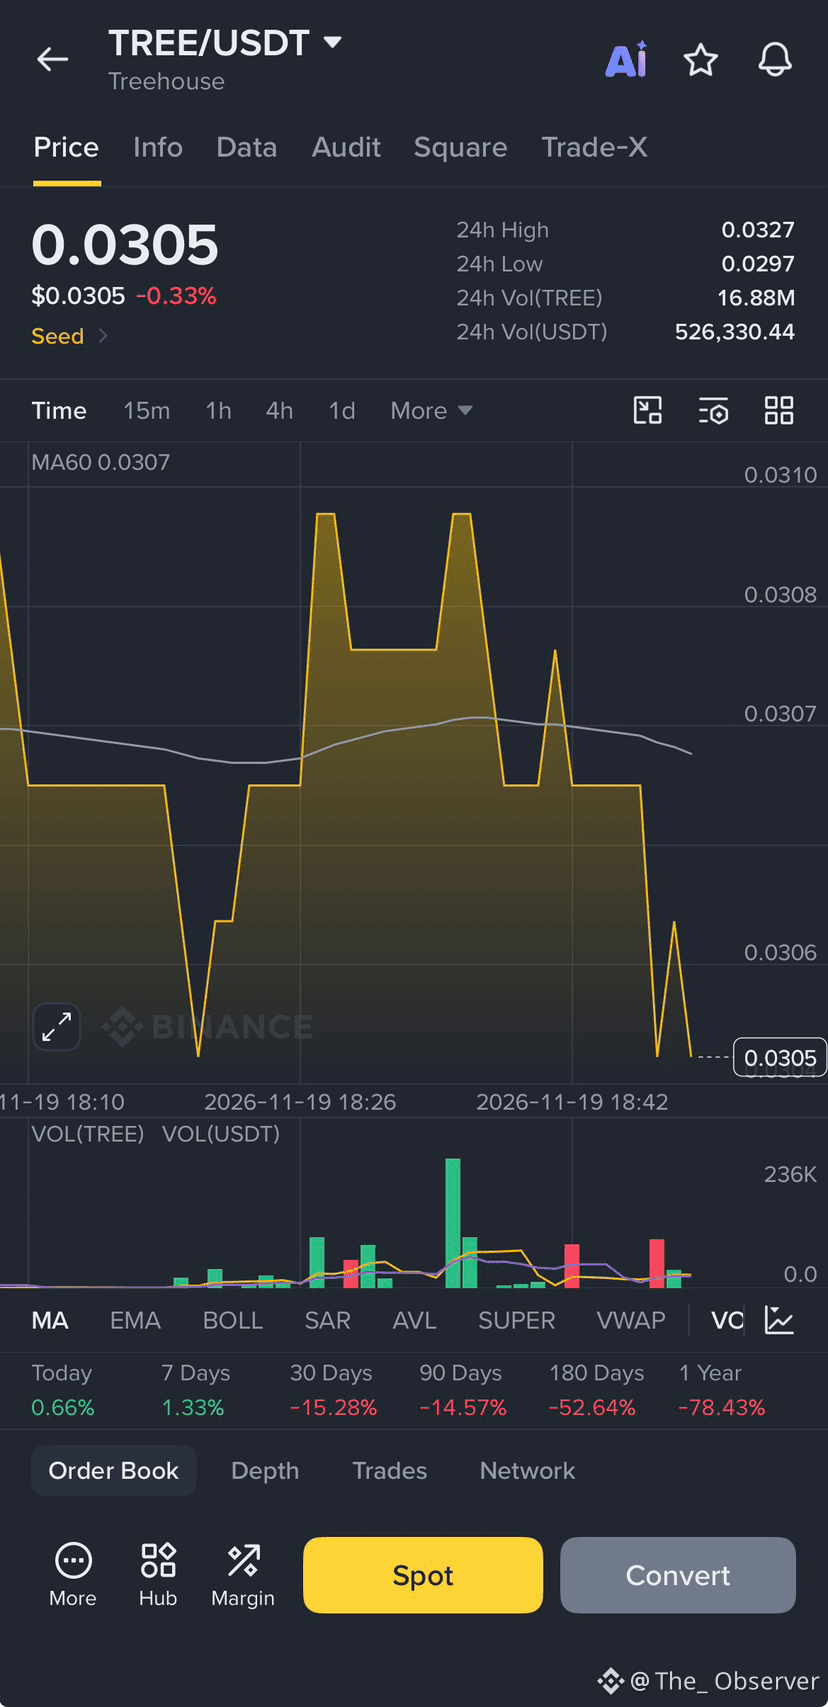
$TREE /USDT: Tight Range Chop 🌲😴
TREE is stuck in a low-volatility sideways grind, barely moving at -0.33%.
📊 Key Zones:
• Resistance: 0.0307 (MA60) — the ceiling.
• Support: 0.0297 (24h Low) — the floor.
🔮 Direction: Neutral. Price is pinned right on the MA60 with choppy, erratic wicks. No clear momentum—range-bound action until a decisive breakout.
⚠️ Low volume trap—wait for confirmation! 🛡️
#TREE #Crypto #TA
{spot}(TREEUSDT)
$TREE /USDT: Tight Range Chop 🌲😴
TREE is stuck in a low-volatility sideways grind, barely moving at -0.33%.
📊 Key Zones:
• Resistance: 0.0307 (MA60) — the ceiling.
• Support: 0.0297 (24h Low) — the floor.
🔮 Direction: Neutral. Price is pinned right on the MA60 with choppy, erratic wicks. No clear momentum—range-bound action until a decisive breakout.
⚠️ Low volume trap—wait for confirmation! 🛡️
#TREE #Crypto #TA
TREE is stuck in a low-volatility sideways grind, barely moving at -0.33%.
📊 Key Zones:
• Resistance: 0.0307 (MA60) — the ceiling.
• Support: 0.0297 (24h Low) — the floor.
🔮 Direction: Neutral. Price is pinned right on the MA60 with choppy, erratic wicks. No clear momentum—range-bound action until a decisive breakout.
⚠️ Low volume trap—wait for confirmation! 🛡️
#TREE #Crypto #TA
234

·
--
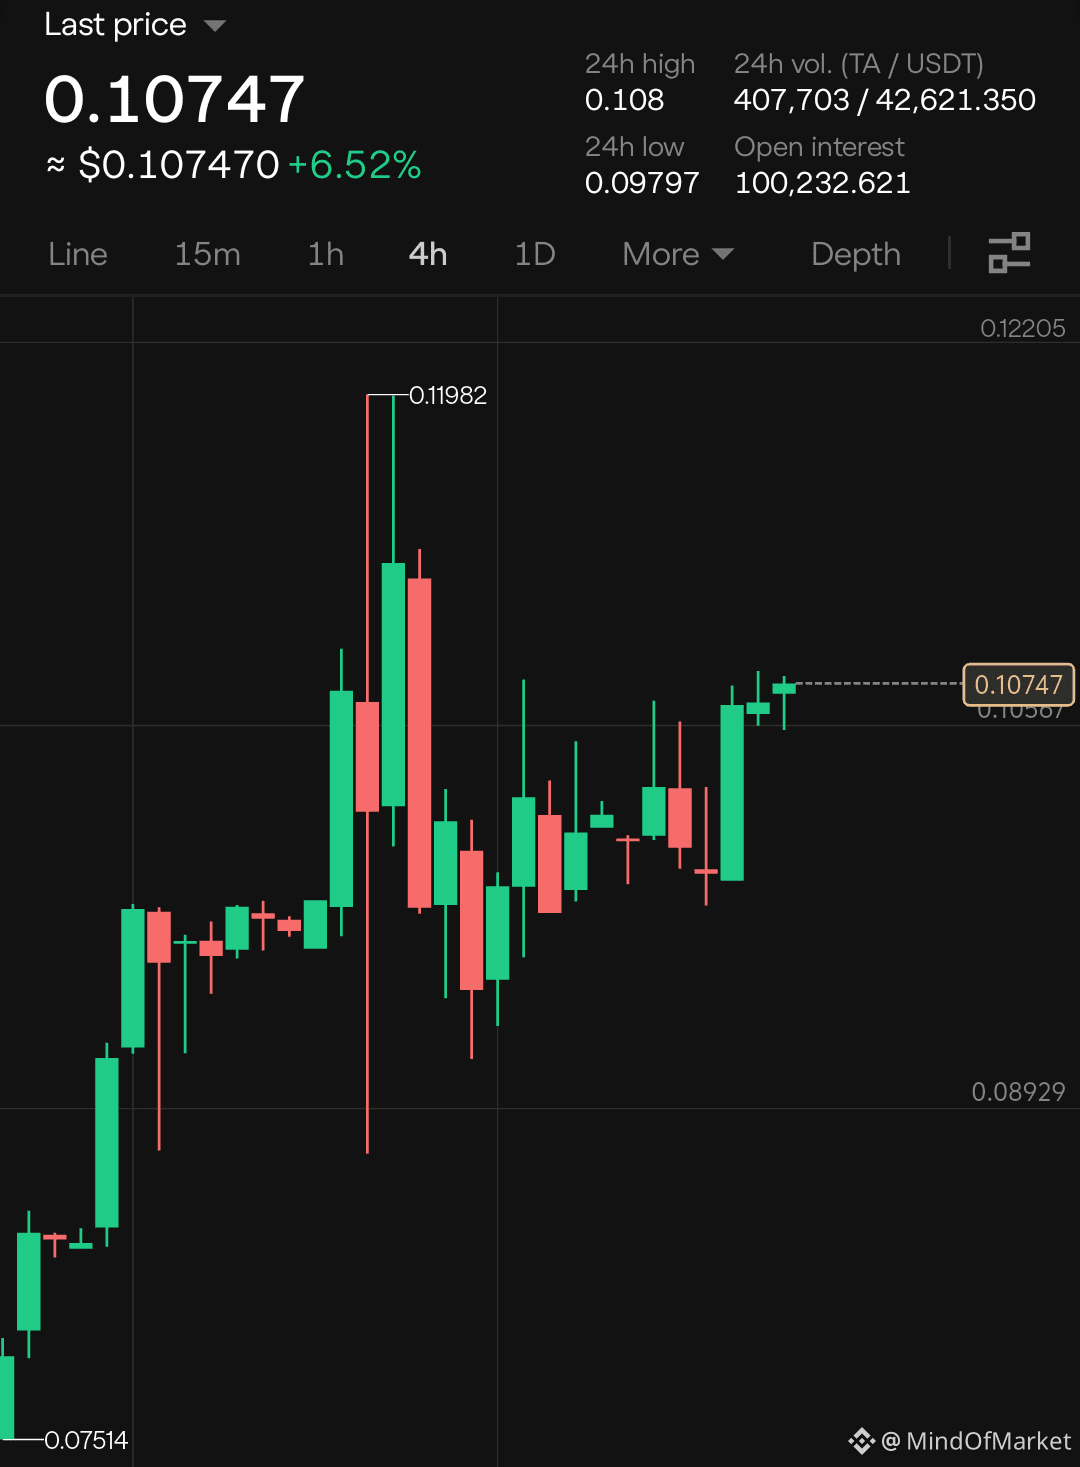
🚨 $TA TESTING A CRITICAL DEMAND BLOCK READY FOR A CLEAN UPSIDE ROTATION! ⚡
Entry: 0.1066 - 0.1080 ⚡
Target: 0.1250 🚀
Stop Loss: 0.090 ⚠️
Smart money footprints are clearly visible across the 4H timeframe as passive liquidity gets absorbed within this tight accumulation band. 📊 Institutional buyers are defending the lower boundary, setting up an efficient path toward higher resting liquidity pools. 💡
Momentum indicators suggest exhaustion among aggressive sellers while order book imbalances tilt heavily in favor of a structural markup. ⚡ Are you positioning inside this institutional demand zone or waiting for confirmation above resistance? 💬
⚠️ Not financial advice. Always manage your risk. 🛡️
🏷️ #TA #SmartMoney #OrderBlock #Crypto #LongSetup
🔥 💎
🚨 $TA TESTING A CRITICAL DEMAND BLOCK READY FOR A CLEAN UPSIDE ROTATION! ⚡
Entry: 0.1066 - 0.1080 ⚡
Target: 0.1250 🚀
Stop Loss: 0.090 ⚠️
Smart money footprints are clearly visible across the 4H timeframe as passive liquidity gets absorbed within this tight accumulation band. 📊 Institutional buyers are defending the lower boundary, setting up an efficient path toward higher resting liquidity pools. 💡
Momentum indicators suggest exhaustion among aggressive sellers while order book imbalances tilt heavily in favor of a structural markup. ⚡ Are you positioning inside this institutional demand zone or waiting for confirmation above resistance? 💬
⚠️ Not financial advice. Always manage your risk. 🛡️
🏷️ #TA #SmartMoney #OrderBlock #Crypto #LongSetup
🔥 💎
Entry: 0.1066 - 0.1080 ⚡
Target: 0.1250 🚀
Stop Loss: 0.090 ⚠️
Smart money footprints are clearly visible across the 4H timeframe as passive liquidity gets absorbed within this tight accumulation band. 📊 Institutional buyers are defending the lower boundary, setting up an efficient path toward higher resting liquidity pools. 💡
Momentum indicators suggest exhaustion among aggressive sellers while order book imbalances tilt heavily in favor of a structural markup. ⚡ Are you positioning inside this institutional demand zone or waiting for confirmation above resistance? 💬
⚠️ Not financial advice. Always manage your risk. 🛡️
🏷️ #TA #SmartMoney #OrderBlock #Crypto #LongSetup
🔥 💎
4

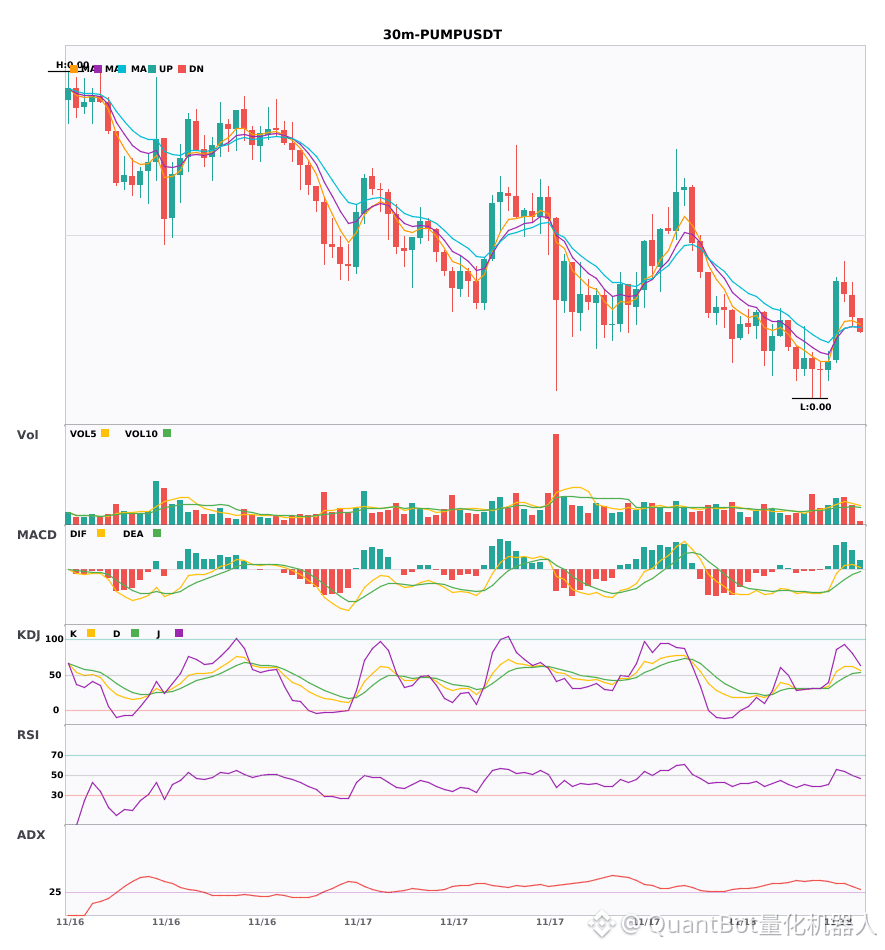
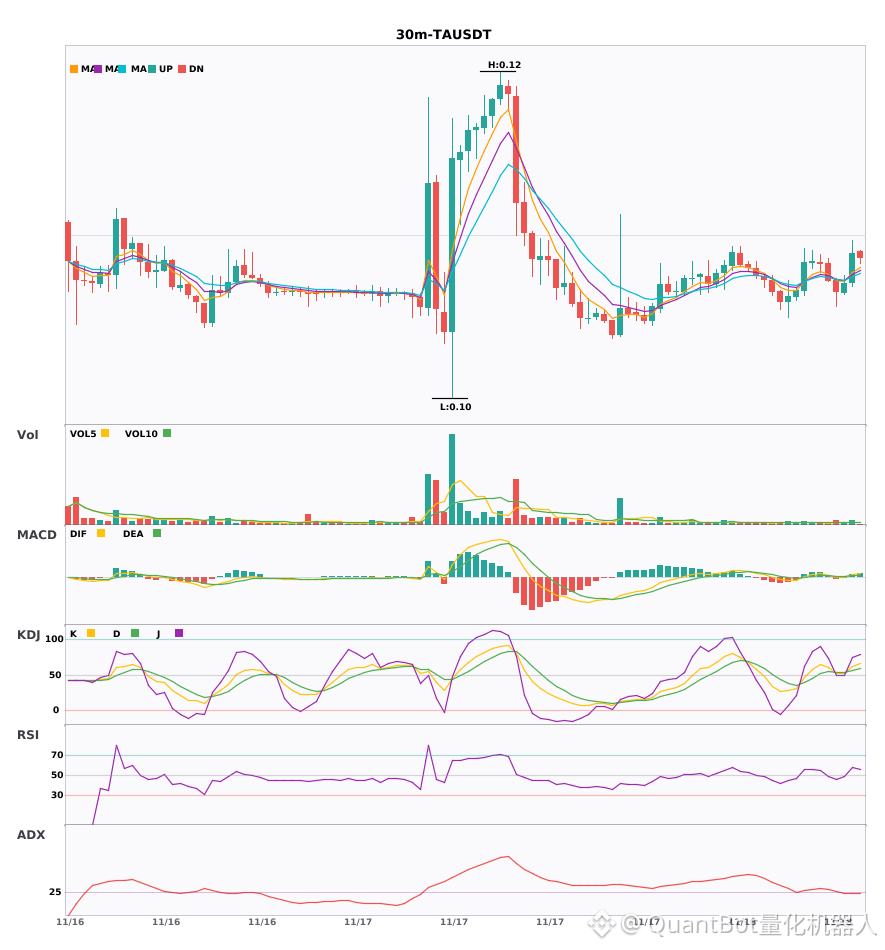
$PUMP/$TA 30-minute technical indicators align and strengthen; comparison of upward momentum strength
📈 $PUMP | 30-minute bullish signal
━━━━━━━━━━━━━━━━━━
Technical analysis: ADX(34) indicates a strong trend; MACD is strongly bullish, but momentum is weakening; EMA5>8>13 in bullish alignment; KDJ is strong (K61.2 D51.8); volume expanded 1.6x.
Price change: -0.7300%
📈 $TA | 30-minute bullish signal
━━━━━━━━━━━━━━━━━━
Technical analysis: ADX(25) indicates a developing trend, suggesting a potential entry; MACD bullish crossover above zero with strengthening momentum; EMA5 crosses above EMA8, turning bullish; KDJ bullish crossover (62.4/56.4); volume expanded 1.6x
Price change: 1.5100%
━━━━━━━━━━━━━━━━━━
#技术分析 #PUMP #TA
📌 The above is for reference only and does not constitute investment advice
$PUMP /$TA 30-minute technical indicators align and strengthen; comparison of upward momentum strength
📈 $PUMP | 30-minute bullish signal
━━━━━━━━━━━━━━━━━━
Technical analysis: ADX(34) indicates a strong trend; MACD is strongly bullish, but momentum is weakening; EMA5>8>13 in bullish alignment; KDJ is strong (K61.2 D51.8); volume expanded 1.6x.
Price change: -0.7300%
📈 $TA | 30-minute bullish signal
━━━━━━━━━━━━━━━━━━
Technical analysis: ADX(25) indicates a developing trend, suggesting a potential entry; MACD bullish crossover above zero with strengthening momentum; EMA5 crosses above EMA8, turning bullish; KDJ bullish crossover (62.4/56.4); volume expanded 1.6x
Price change: 1.5100%
━━━━━━━━━━━━━━━━━━
#技术分析 #PUMP #TA
📌 The above is for reference only and does not constitute investment advice
📈 $PUMP | 30-minute bullish signal
━━━━━━━━━━━━━━━━━━
Technical analysis: ADX(34) indicates a strong trend; MACD is strongly bullish, but momentum is weakening; EMA5>8>13 in bullish alignment; KDJ is strong (K61.2 D51.8); volume expanded 1.6x.
Price change: -0.7300%
📈 $TA | 30-minute bullish signal
━━━━━━━━━━━━━━━━━━
Technical analysis: ADX(25) indicates a developing trend, suggesting a potential entry; MACD bullish crossover above zero with strengthening momentum; EMA5 crosses above EMA8, turning bullish; KDJ bullish crossover (62.4/56.4); volume expanded 1.6x
Price change: 1.5100%
━━━━━━━━━━━━━━━━━━
#技术分析 #PUMP #TA
📌 The above is for reference only and does not constitute investment advice
24

·
--
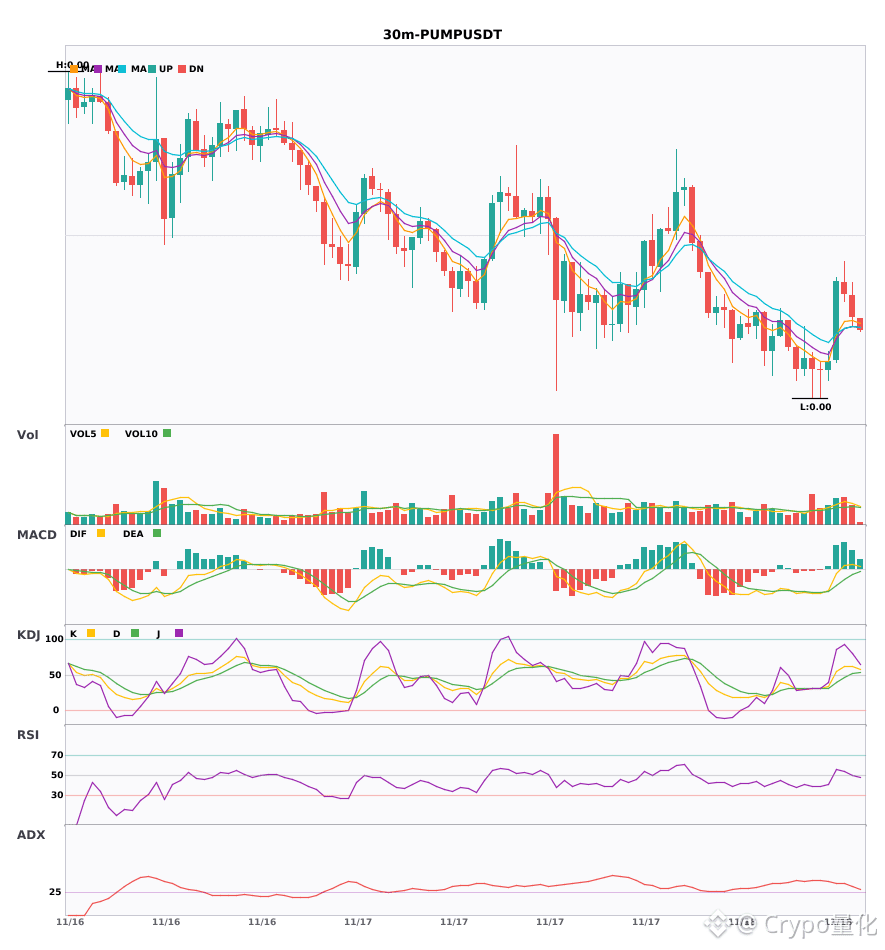
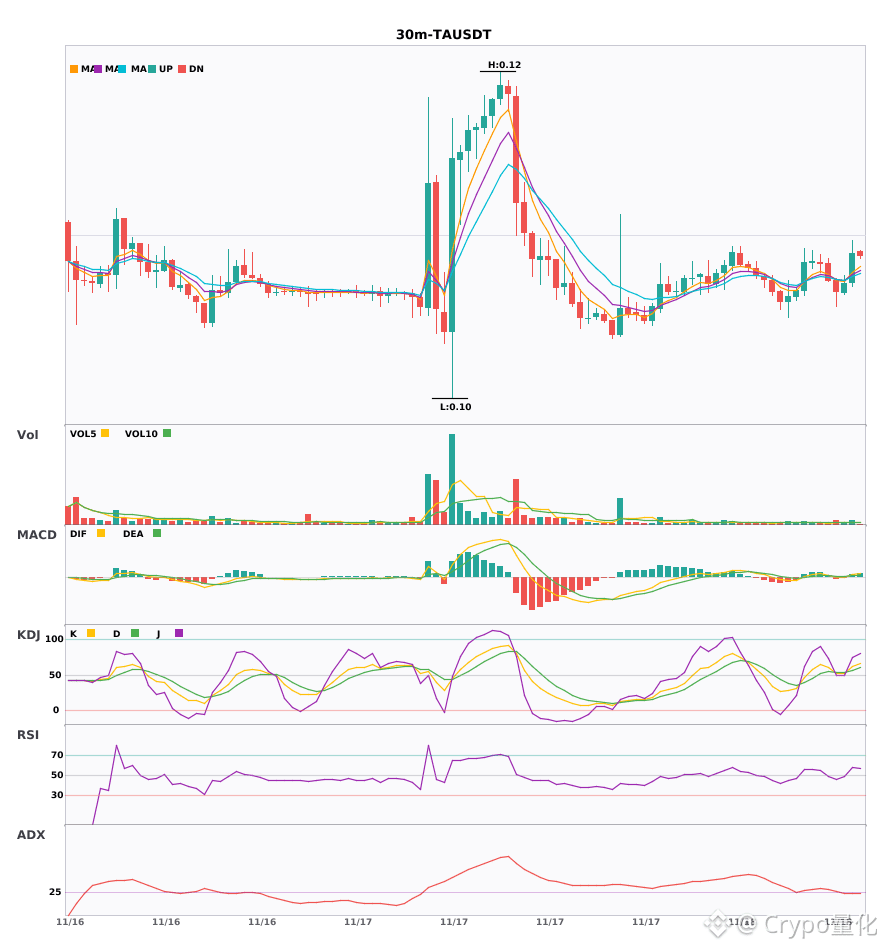
Both coins are strengthening simultaneously on the 30-minute chart; bullish signals are flashing for $PUMP / $TA 🔥
════════════════════
🔴 $PUMP 30-minute bullish signal
⚠️ Technical analysis: ADX shows a clear trend. After the MACD golden cross, volume increased and the red bars expanded, though momentum has eased slightly. Moving averages are in a bullish alignment and spreading upward. K crossed above D without entering the overbought zone, favoring bulls. Volume increased to 1.6×.
════════════════════
🔴 $TA 30-minute bullish signal
⚠️ Technical analysis: The ADX trend is beginning to form, so there may be an opportunity to participate. The MACD golden cross is accompanied by expanding red bars. EMA5 crossed above EMA8, turning bullish. KDJ formed a golden cross without entering overbought territory (K62.4 D56.4). Volume increased to 1.6×.
════════════════════
🔔 Follow for first-hand market movement alerts 🔔
#技术分析 #PUMP #TA
📌 When trading, pay attention to whether the candlestick pattern confirms the setup
Both coins are strengthening simultaneously on the 30-minute chart; bullish signals are flashing for $PUMP / $TA 🔥
════════════════════
🔴 $PUMP 30-minute bullish signal
⚠️ Technical analysis: ADX shows a clear trend. After the MACD golden cross, volume increased and the red bars expanded, though momentum has eased slightly. Moving averages are in a bullish alignment and spreading upward. K crossed above D without entering the overbought zone, favoring bulls. Volume increased to 1.6×.
════════════════════
🔴 $TA 30-minute bullish signal
⚠️ Technical analysis: The ADX trend is beginning to form, so there may be an opportunity to participate. The MACD golden cross is accompanied by expanding red bars. EMA5 crossed above EMA8, turning bullish. KDJ formed a golden cross without entering overbought territory (K62.4 D56.4). Volume increased to 1.6×.
════════════════════
🔔 Follow for first-hand market movement alerts 🔔
#技术分析 #PUMP #TA
📌 When trading, pay attention to whether the candlestick pattern confirms the setup
════════════════════
🔴 $PUMP 30-minute bullish signal
⚠️ Technical analysis: ADX shows a clear trend. After the MACD golden cross, volume increased and the red bars expanded, though momentum has eased slightly. Moving averages are in a bullish alignment and spreading upward. K crossed above D without entering the overbought zone, favoring bulls. Volume increased to 1.6×.
════════════════════
🔴 $TA 30-minute bullish signal
⚠️ Technical analysis: The ADX trend is beginning to form, so there may be an opportunity to participate. The MACD golden cross is accompanied by expanding red bars. EMA5 crossed above EMA8, turning bullish. KDJ formed a golden cross without entering overbought territory (K62.4 D56.4). Volume increased to 1.6×.
════════════════════
🔔 Follow for first-hand market movement alerts 🔔
#技术分析 #PUMP #TA
📌 When trading, pay attention to whether the candlestick pattern confirms the setup
26
·
--
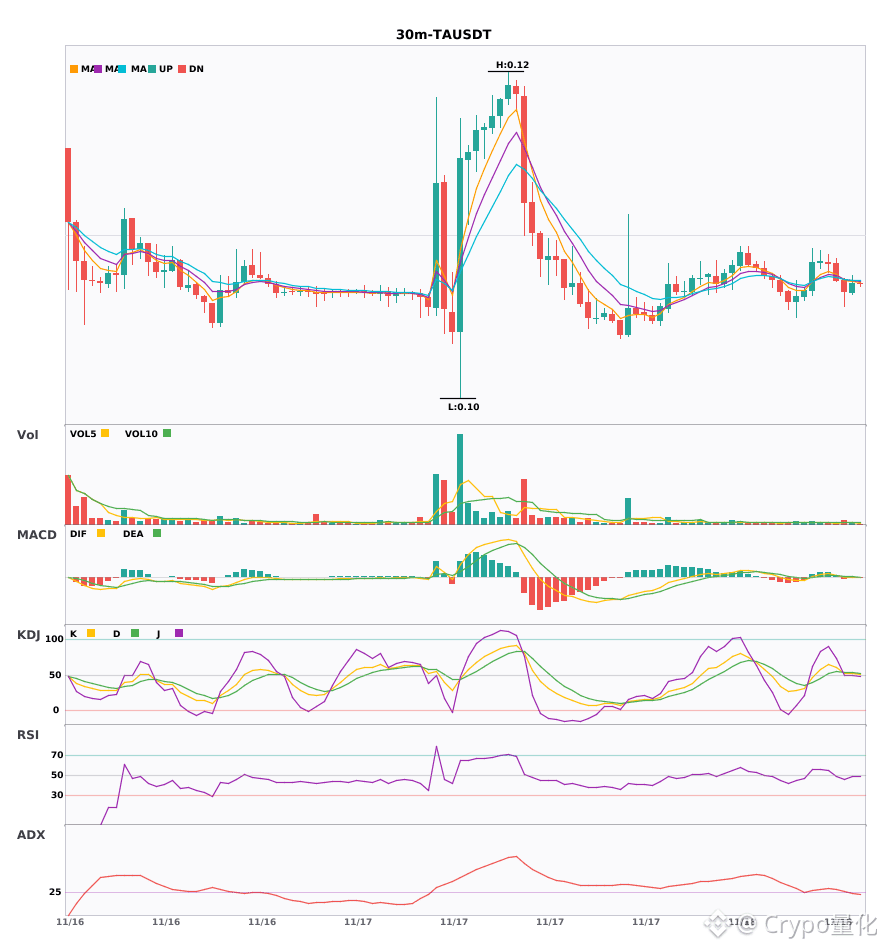
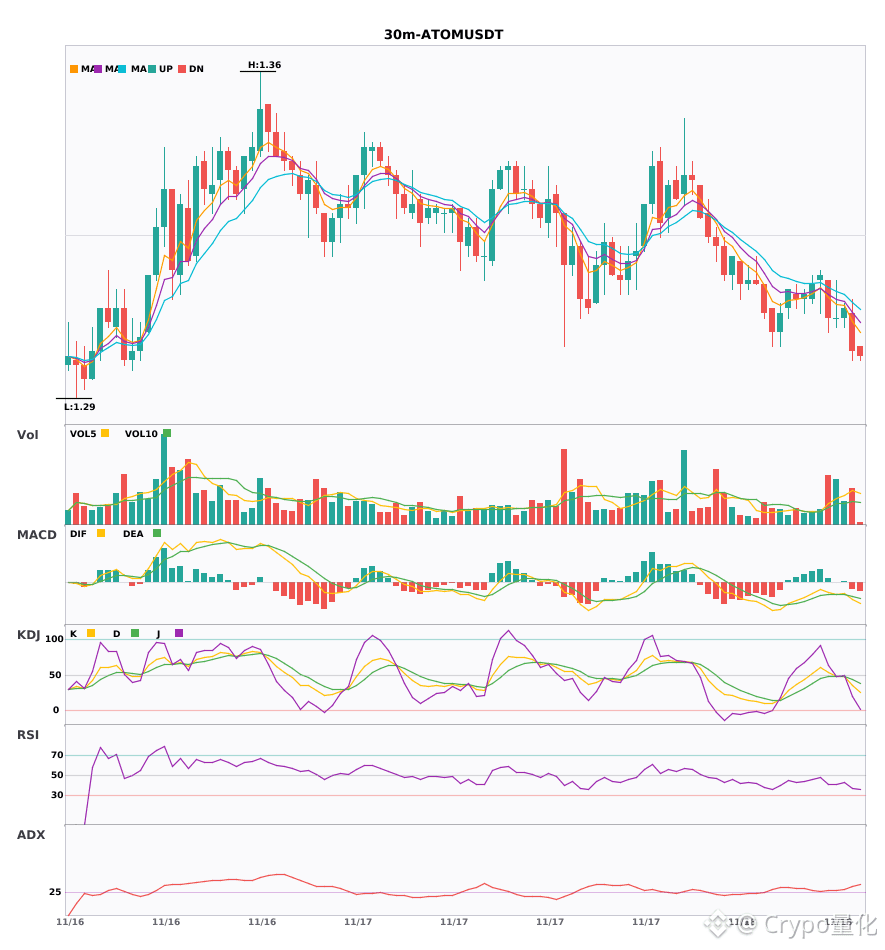
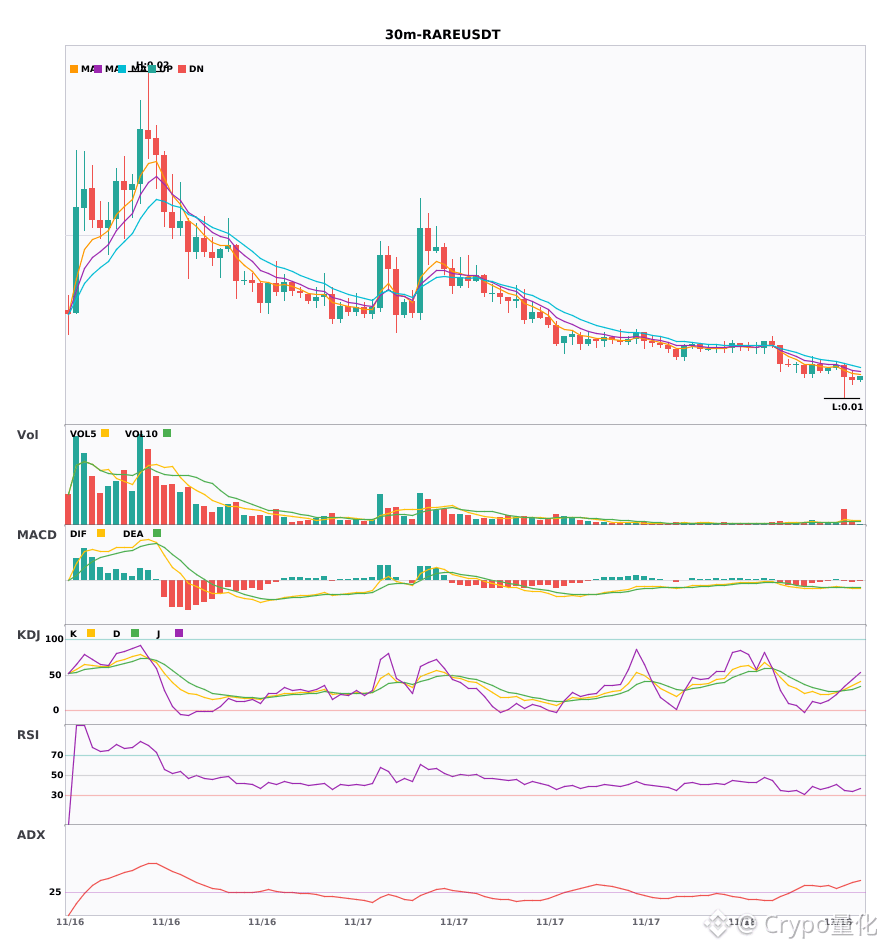
$TA/$ATOM/$RARE 30-minute bearish bias; significant short-term pressure 🔥
════════════════════
🟢 $TA 30-minute bearish signal
⚠️ Technicals: ADX trend established; MACD bearish crossover below zero, with expanding green bars; EMA5 crossed below EMA8, turning bearish; KDJ bearish crossover, with K below D; volume up 1.6×
════════════════════
🟢 $ATOM 30-minute bearish signal
⚠️ Technicals: Trend is quite clear; MACD bearish crossover below zero, with bearish momentum accelerating; moving averages are bearishly aligned and trending down; KDJ bearish crossover, with K crossing below D, indicating a bearish outlook; volume up 1.6×
════════════════════
🟢 $RARE 30-minute bearish signal
⚠️ Technicals: Clear trend; MACD bearish crossover below zero, with bearish momentum accelerating; moving averages are bearishly aligned and diverging; KDJ has crossed above D and is not overbought; trading volume up 3.9×.
════════════════════
🔔 Follow for the latest market movements 🔔
#技术分析 #TA #ATOM #RARE
📌 When trading, watch for whether the candlestick patterns confirm the signal
$TA /$ATOM /$RARE 30-minute bearish bias; significant short-term pressure 🔥
════════════════════
🟢 $TA 30-minute bearish signal
⚠️ Technicals: ADX trend established; MACD bearish crossover below zero, with expanding green bars; EMA5 crossed below EMA8, turning bearish; KDJ bearish crossover, with K below D; volume up 1.6×
════════════════════
🟢 $ATOM 30-minute bearish signal
⚠️ Technicals: Trend is quite clear; MACD bearish crossover below zero, with bearish momentum accelerating; moving averages are bearishly aligned and trending down; KDJ bearish crossover, with K crossing below D, indicating a bearish outlook; volume up 1.6×
════════════════════
🟢 $RARE 30-minute bearish signal
⚠️ Technicals: Clear trend; MACD bearish crossover below zero, with bearish momentum accelerating; moving averages are bearishly aligned and diverging; KDJ has crossed above D and is not overbought; trading volume up 3.9×.
════════════════════
🔔 Follow for the latest market movements 🔔
#技术分析 #TA #ATOM #RARE
📌 When trading, watch for whether the candlestick patterns confirm the signal
════════════════════
🟢 $TA 30-minute bearish signal
⚠️ Technicals: ADX trend established; MACD bearish crossover below zero, with expanding green bars; EMA5 crossed below EMA8, turning bearish; KDJ bearish crossover, with K below D; volume up 1.6×
════════════════════
🟢 $ATOM 30-minute bearish signal
⚠️ Technicals: Trend is quite clear; MACD bearish crossover below zero, with bearish momentum accelerating; moving averages are bearishly aligned and trending down; KDJ bearish crossover, with K crossing below D, indicating a bearish outlook; volume up 1.6×
════════════════════
🟢 $RARE 30-minute bearish signal
⚠️ Technicals: Clear trend; MACD bearish crossover below zero, with bearish momentum accelerating; moving averages are bearishly aligned and diverging; KDJ has crossed above D and is not overbought; trading volume up 3.9×.
════════════════════
🔔 Follow for the latest market movements 🔔
#技术分析 #TA #ATOM #RARE
📌 When trading, watch for whether the candlestick patterns confirm the signal
14

·
--
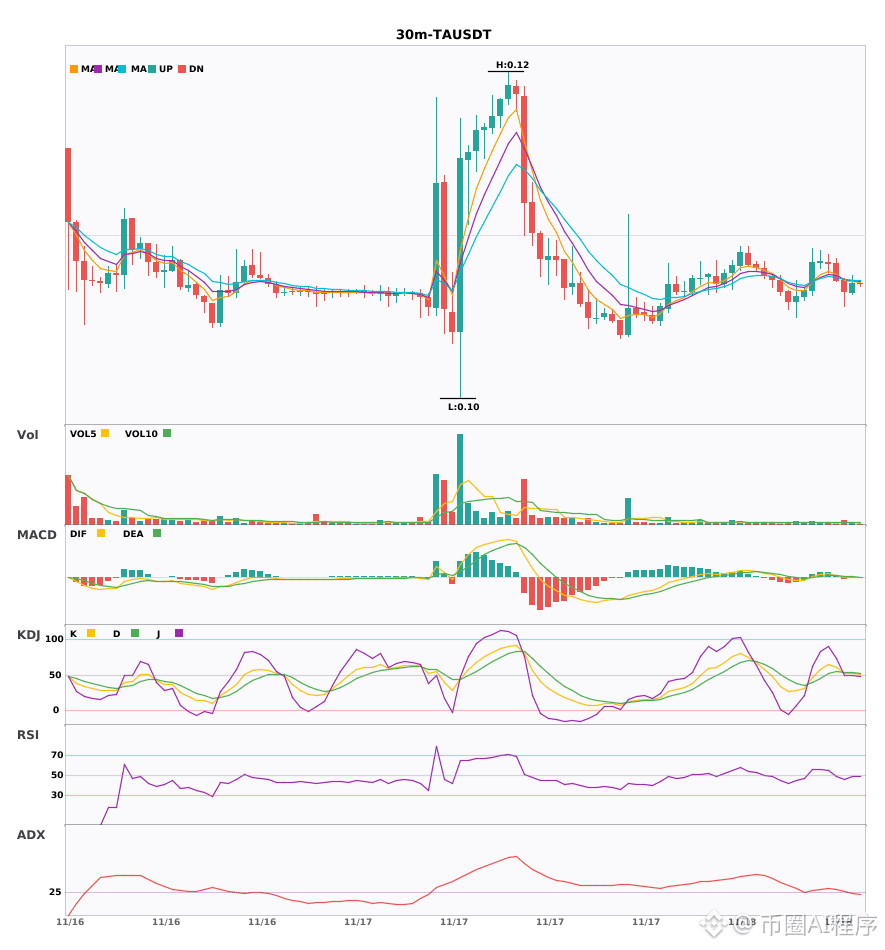
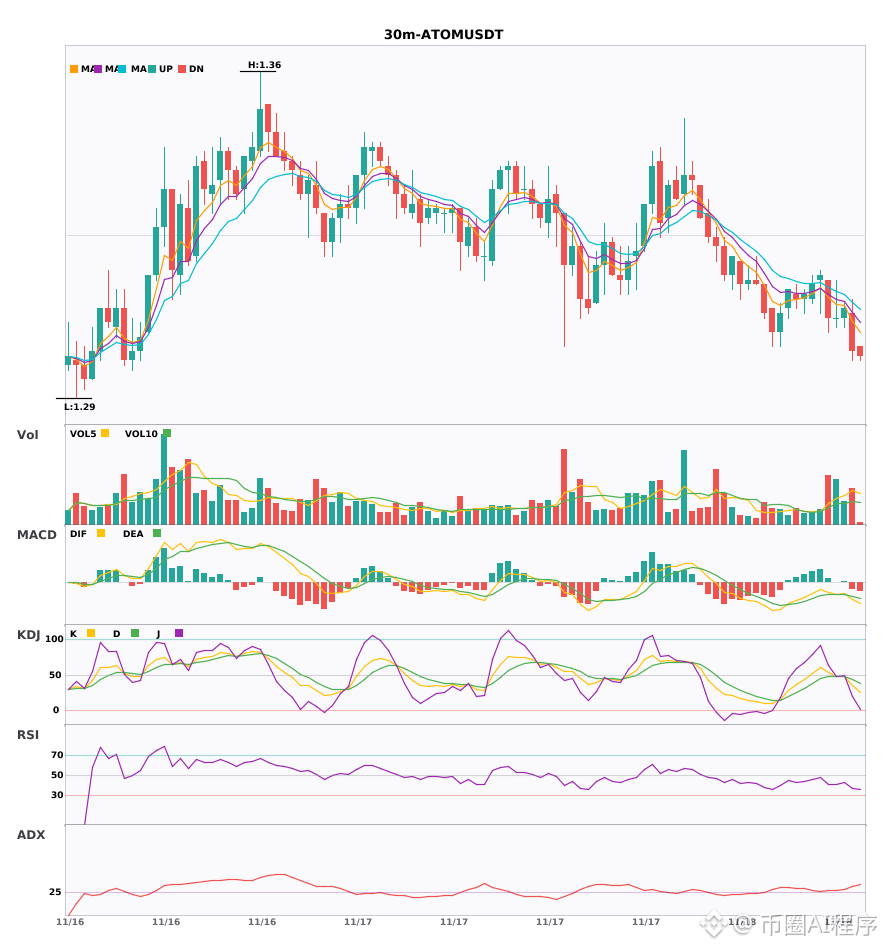
$TA $ATOM 30 minutes, 4-hour and 30-minute timeframes both turn bearish; multi-timeframe convergence points downward as the decline begins 🔥
════════════════════
🟢 $TA 30-minute bearish signal
⚠️ Technical analysis: 4-hour and 30-minute bearish signals are confirmed in confluence, with multiple timeframes aligned! MACD is below zero with a volume-backed death cross; moving averages have just formed a bearish alignment and are pointing down. KDJ has crossed down but is not oversold, and volume is up 1.6x. The outlook remains bearish.
════════════════════
🟢 $ATOM 30-minute bearish signal
⚠️ Technical analysis: 4-hour bearish momentum confirmed in confluence with the 30-minute timeframe! After the 30-minute MACD death cross, the green histogram bars have expanded; moving averages are bearishly aligned and spreading downward. KDJ has crossed down but is not oversold, and volume is up 1.6x. The short-term outlook is bearish.
════════════════════
🔔 Follow for first-hand market updates 🔔
#多周期共振 #TA #ATOM
📌 When trading, pay attention to whether the candlestick patterns confirm the signal
$TA $ATOM 30 minutes, 4-hour and 30-minute timeframes both turn bearish; multi-timeframe convergence points downward as the decline begins 🔥
════════════════════
🟢 $TA 30-minute bearish signal
⚠️ Technical analysis: 4-hour and 30-minute bearish signals are confirmed in confluence, with multiple timeframes aligned! MACD is below zero with a volume-backed death cross; moving averages have just formed a bearish alignment and are pointing down. KDJ has crossed down but is not oversold, and volume is up 1.6x. The outlook remains bearish.
════════════════════
🟢 $ATOM 30-minute bearish signal
⚠️ Technical analysis: 4-hour bearish momentum confirmed in confluence with the 30-minute timeframe! After the 30-minute MACD death cross, the green histogram bars have expanded; moving averages are bearishly aligned and spreading downward. KDJ has crossed down but is not oversold, and volume is up 1.6x. The short-term outlook is bearish.
════════════════════
🔔 Follow for first-hand market updates 🔔
#多周期共振 #TA #ATOM
📌 When trading, pay attention to whether the candlestick patterns confirm the signal
════════════════════
🟢 $TA 30-minute bearish signal
⚠️ Technical analysis: 4-hour and 30-minute bearish signals are confirmed in confluence, with multiple timeframes aligned! MACD is below zero with a volume-backed death cross; moving averages have just formed a bearish alignment and are pointing down. KDJ has crossed down but is not oversold, and volume is up 1.6x. The outlook remains bearish.
════════════════════
🟢 $ATOM 30-minute bearish signal
⚠️ Technical analysis: 4-hour bearish momentum confirmed in confluence with the 30-minute timeframe! After the 30-minute MACD death cross, the green histogram bars have expanded; moving averages are bearishly aligned and spreading downward. KDJ has crossed down but is not oversold, and volume is up 1.6x. The short-term outlook is bearish.
════════════════════
🔔 Follow for first-hand market updates 🔔
#多周期共振 #TA #ATOM
📌 When trading, pay attention to whether the candlestick patterns confirm the signal
11

·
--
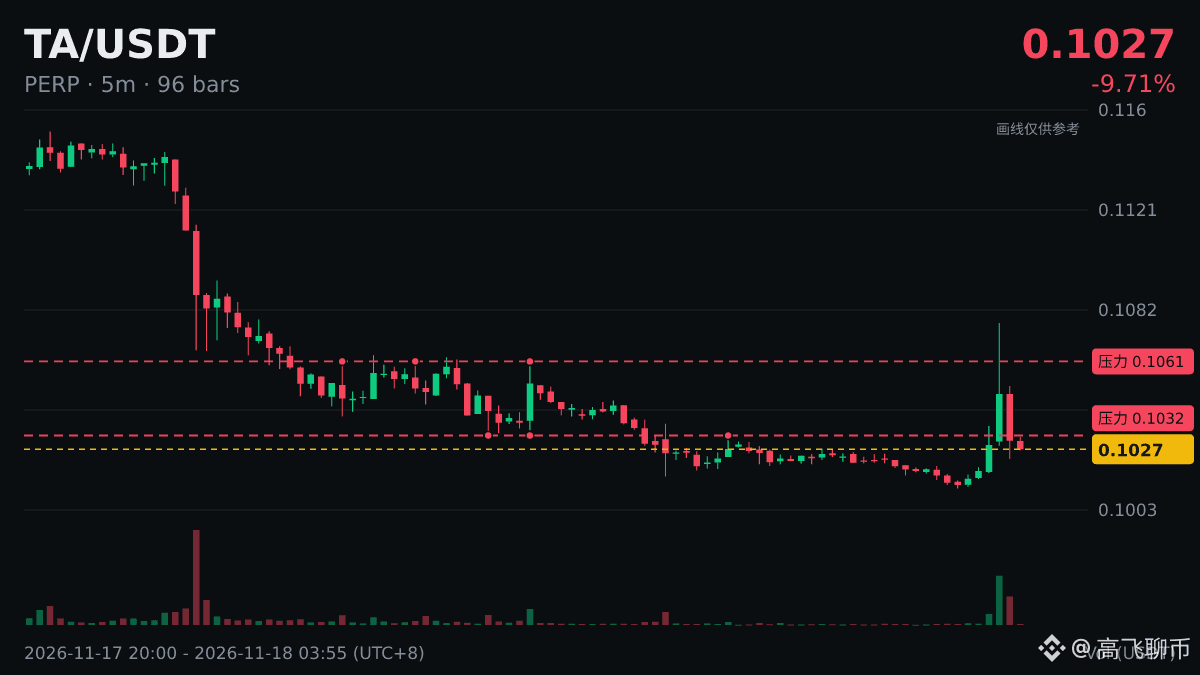
Why did $TA suddenly drop? It fell 3.61% in 5 minutes, to 0.1027. Honestly, I don’t know why it’s falling either; all I can see is that selling pressure has increased. Don’t chase it—let’s wait and see.
#TA
Why did $TA suddenly drop? It fell 3.61% in 5 minutes, to 0.1027. Honestly, I don’t know why it’s falling either; all I can see is that selling pressure has increased. Don’t chase it—let’s wait and see.
#TA
#TA
1
197

·
--
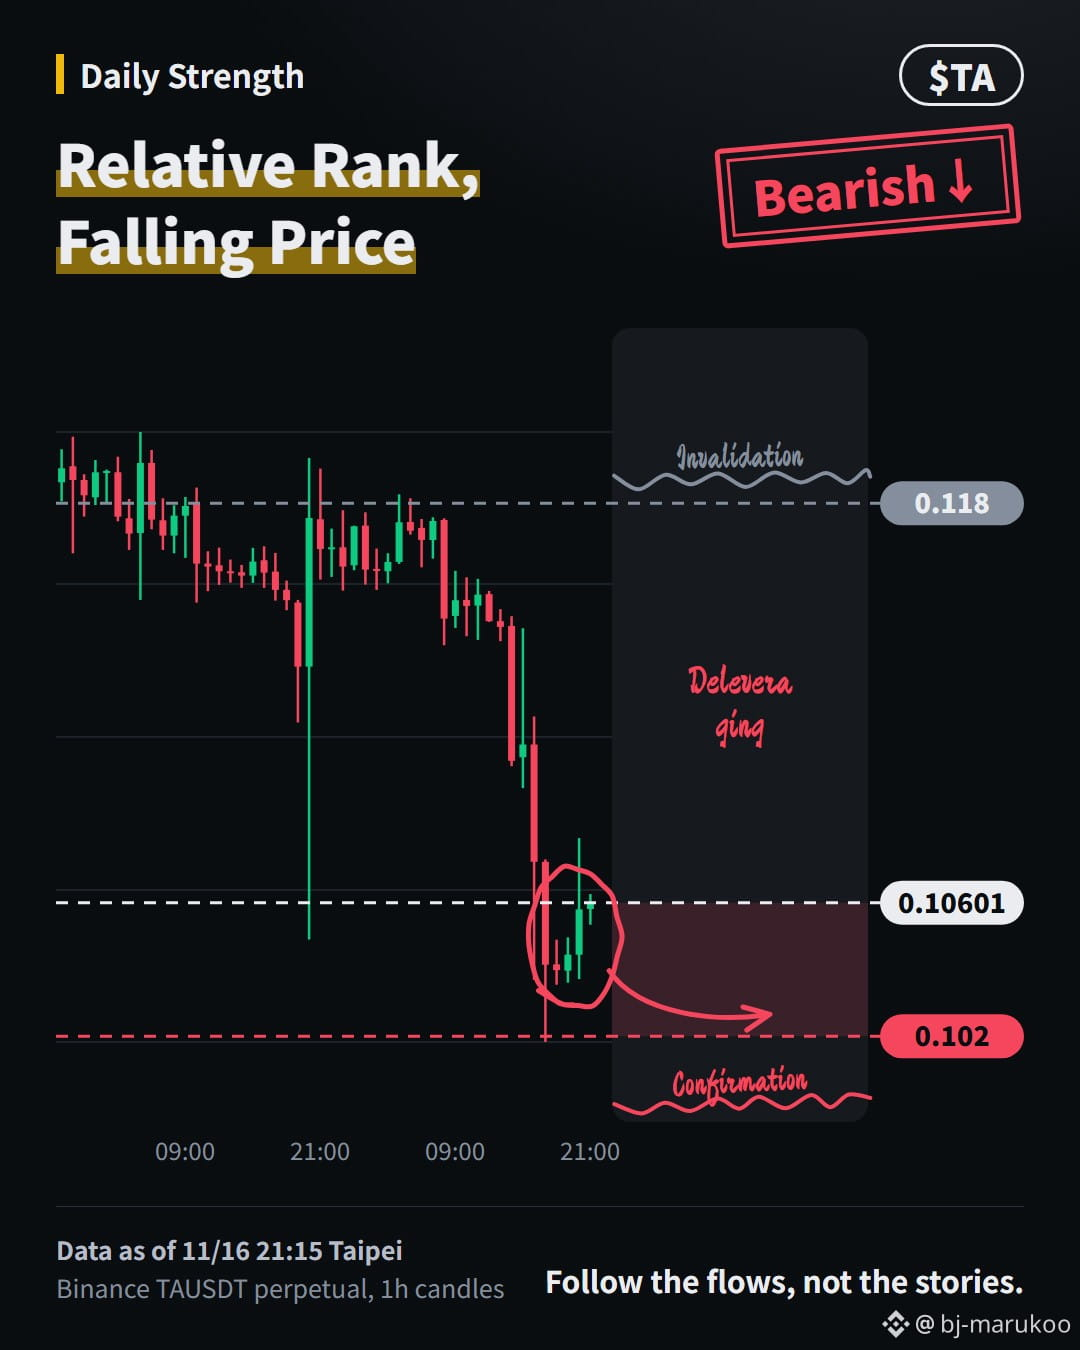
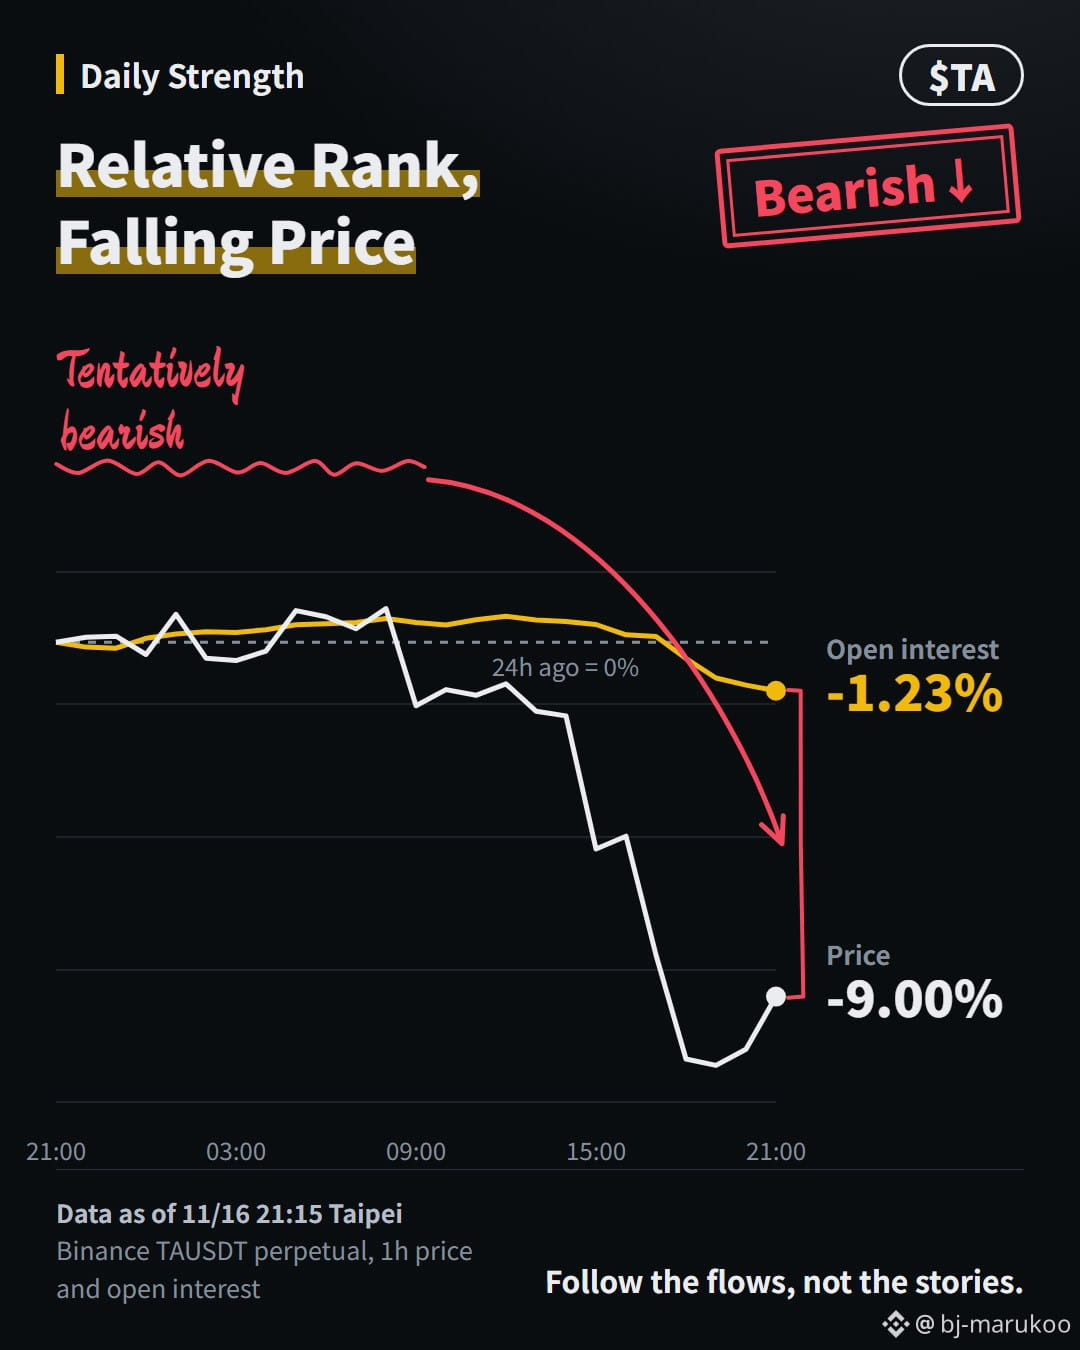
Our daily assessment is tentatively bearish on $TA after a 9.00% 24h decline; $TA ranks third on today's relative-strength list.
- Price is 0.10601, down 4.29% over 6h.
- Over 24h, open interest notional fell from $14.04M to $12.51M, and contract open interest declined 1.23%.
- The long/short account ratio rose from 0.8272 to 1.0903 over 24h.
- Prior-day volume was 0.37 times its 7d average.
- BTC is 64,156.7, down 2.08% over 24h, outside a bullish trend regime; latest DVOL is 42.85 versus realized volatility of 48.74.
There are no notable headlines. Falling price and 1.23% lower contract open interest over 24h suggest deleveraging. Alternatively, the retreat could be a correction within the 4.89% 7d gain.
A break below the 24h low of 0.102 confirms the bearish view; a move above the 24h high of 0.118 invalidates it.
The 4.89% 7d gain leaves a recovery as the main risk to this assessment. Prior-day volume at 0.37 times its 7d average suggests limited participation could amplify reversals.
What would you need to see for the 4.89% 7d gain to outweigh the 9.00% 24h decline?
#TA #CryptoMarket
Data from Binance public market data. Not financial advice.
Our daily assessment is tentatively bearish on $TA after a 9.00% 24h decline; $TA ranks third on today's relative-strength list.
- Price is 0.10601, down 4.29% over 6h.
- Over 24h, open interest notional fell from $14.04M to $12.51M, and contract open interest declined 1.23%.
- The long/short account ratio rose from 0.8272 to 1.0903 over 24h.
- Prior-day volume was 0.37 times its 7d average.
- BTC is 64,156.7, down 2.08% over 24h, outside a bullish trend regime; latest DVOL is 42.85 versus realized volatility of 48.74.
There are no notable headlines. Falling price and 1.23% lower contract open interest over 24h suggest deleveraging. Alternatively, the retreat could be a correction within the 4.89% 7d gain.
A break below the 24h low of 0.102 confirms the bearish view; a move above the 24h high of 0.118 invalidates it.
The 4.89% 7d gain leaves a recovery as the main risk to this assessment. Prior-day volume at 0.37 times its 7d average suggests limited participation could amplify reversals.
What would you need to see for the 4.89% 7d gain to outweigh the 9.00% 24h decline?
#TA #CryptoMarket
Data from Binance public market data. Not financial advice.
- Price is 0.10601, down 4.29% over 6h.
- Over 24h, open interest notional fell from $14.04M to $12.51M, and contract open interest declined 1.23%.
- The long/short account ratio rose from 0.8272 to 1.0903 over 24h.
- Prior-day volume was 0.37 times its 7d average.
- BTC is 64,156.7, down 2.08% over 24h, outside a bullish trend regime; latest DVOL is 42.85 versus realized volatility of 48.74.
There are no notable headlines. Falling price and 1.23% lower contract open interest over 24h suggest deleveraging. Alternatively, the retreat could be a correction within the 4.89% 7d gain.
A break below the 24h low of 0.102 confirms the bearish view; a move above the 24h high of 0.118 invalidates it.
The 4.89% 7d gain leaves a recovery as the main risk to this assessment. Prior-day volume at 0.37 times its 7d average suggests limited participation could amplify reversals.
What would you need to see for the 4.89% 7d gain to outweigh the 9.00% 24h decline?
#TA #CryptoMarket
Data from Binance public market data. Not financial advice.
1
352

·
--
🐋 Is a whale dumping $TA ?
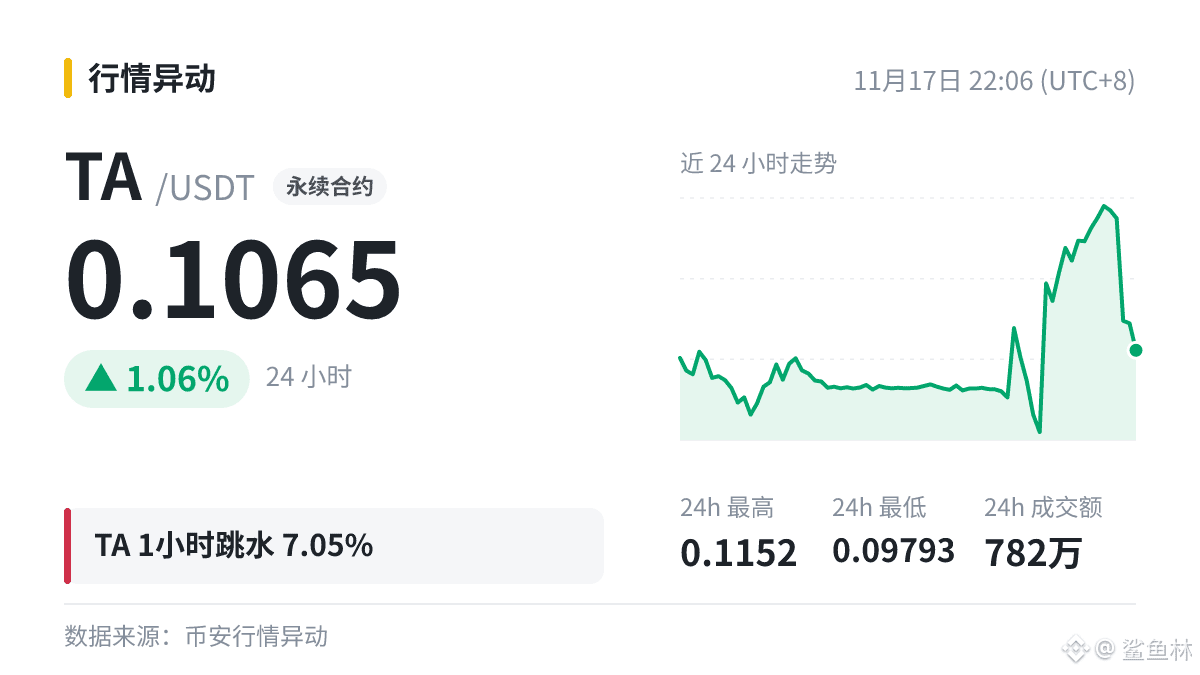
Down 7.05% in 1 hour, with 24h trading volume of $7.82 million. A dump this large in such a short time usually means a concentrated wave of market sell orders.
The drop isn’t too sharp yet. Let’s see whether buyers are stepping in below.
Describe your view right now in one sentence?
#TA
🐋 Is a whale dumping $TA ?
Down 7.05% in 1 hour, with 24h trading volume of $7.82 million. A dump this large in such a short time usually means a concentrated wave of market sell orders.
The drop isn’t too sharp yet. Let’s see whether buyers are stepping in below.
Describe your view right now in one sentence?
#TA
Down 7.05% in 1 hour, with 24h trading volume of $7.82 million. A dump this large in such a short time usually means a concentrated wave of market sell orders.
The drop isn’t too sharp yet. Let’s see whether buyers are stepping in below.
Describe your view right now in one sentence?
#TA
1

·
--
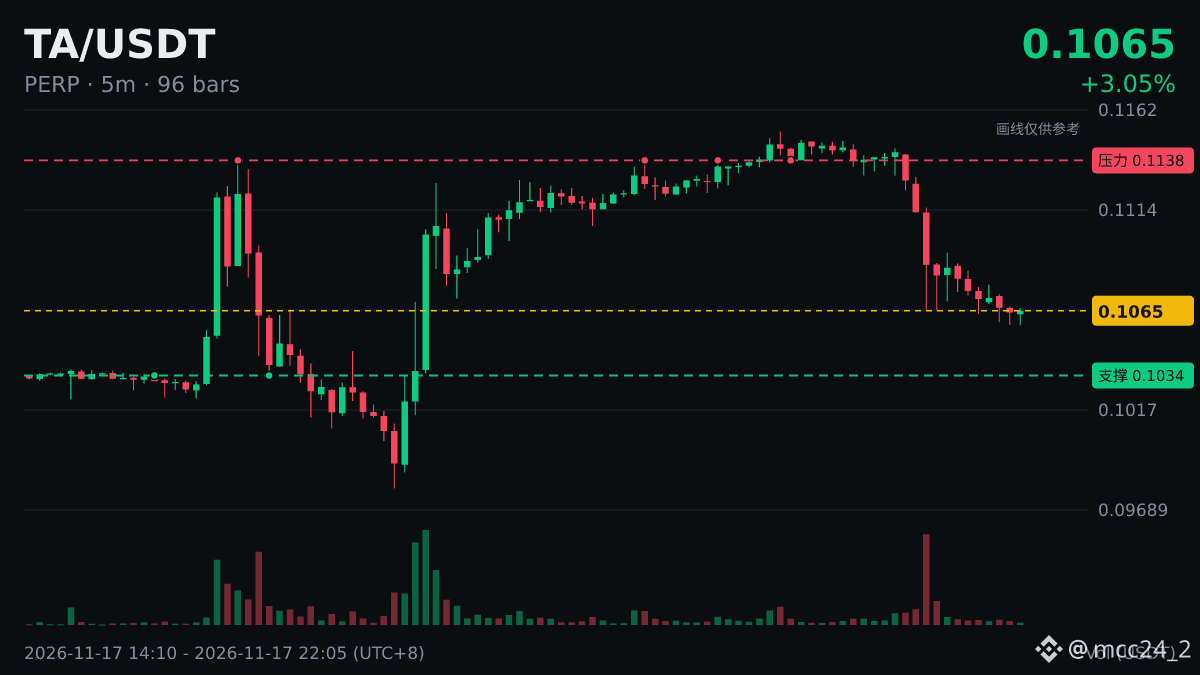
$TA hours, a huge bearish candle plunged 7.05%, and the K-line is bungee jumping again 📉
Current price: 0.1065, 1h -6.26%, 24h +1.09%.
Today’s tears have already been shed in advance.
Stay calm, don’t hold onto losing positions.
#TA
This does not constitute investment advice. You are responsible for your own gains and losses.
$TA hours, a huge bearish candle plunged 7.05%, and the K-line is bungee jumping again 📉
Current price: 0.1065, 1h -6.26%, 24h +1.09%.
Today’s tears have already been shed in advance.
Stay calm, don’t hold onto losing positions.
#TA
This does not constitute investment advice. You are responsible for your own gains and losses.
Current price: 0.1065, 1h -6.26%, 24h +1.09%.
Today’s tears have already been shed in advance.
Stay calm, don’t hold onto losing positions.
#TA
This does not constitute investment advice. You are responsible for your own gains and losses.
377

·
--
👀 Capital flow view:
$TA fell 3.3% in 5 minutes, with the current price at 0.1086 and 24h trading volume of $7.48 million.
A breakdown of the capital flows:
· The drop was concentrated in just 5 minutes, indicating aggressive selling
· It’s still up 2.16% over 24h, pointing to profit-taking
· Next, watch for large buy orders to support the price near the lows. Without them, it may continue to fall
Stay tuned—we’ll share unusual movements as soon as they happen.
#TA
👀 Capital flow view:
$TA fell 3.3% in 5 minutes, with the current price at 0.1086 and 24h trading volume of $7.48 million.
A breakdown of the capital flows:
· The drop was concentrated in just 5 minutes, indicating aggressive selling
· It’s still up 2.16% over 24h, pointing to profit-taking
· Next, watch for large buy orders to support the price near the lows. Without them, it may continue to fall
Stay tuned—we’ll share unusual movements as soon as they happen.
#TA
$TA fell 3.3% in 5 minutes, with the current price at 0.1086 and 24h trading volume of $7.48 million.
A breakdown of the capital flows:
· The drop was concentrated in just 5 minutes, indicating aggressive selling
· It’s still up 2.16% over 24h, pointing to profit-taking
· Next, watch for large buy orders to support the price near the lows. Without them, it may continue to fall
Stay tuned—we’ll share unusual movements as soon as they happen.
#TA

·
--
Watching where the money is flowing is much more practical than predicting the direction.
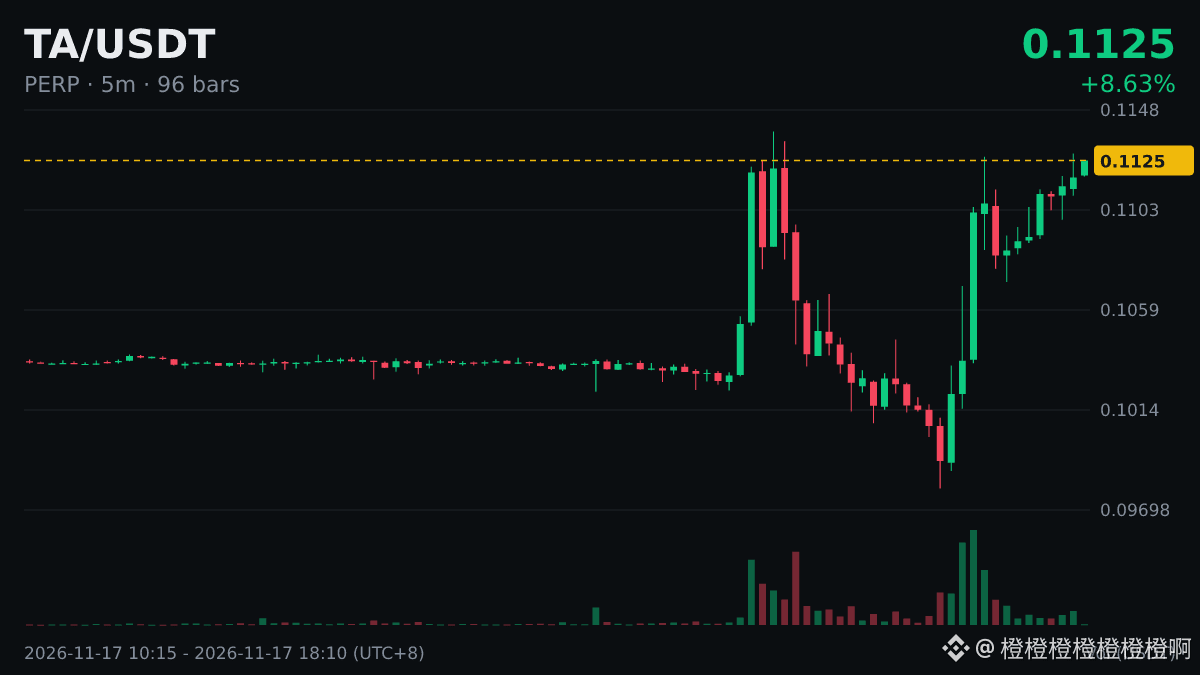
$TA 's move: +13.92% in 1 hour, +8.18% in 24 hours. How many times have you seen a market like this? What usually happens next?
#TA
Just chatting—everyone has to bear the consequences of their own gains and losses.
Watching where the money is flowing is much more practical than predicting the direction.
$TA 's move: +13.92% in 1 hour, +8.18% in 24 hours. How many times have you seen a market like this? What usually happens next?
#TA
Just chatting—everyone has to bear the consequences of their own gains and losses.
$TA 's move: +13.92% in 1 hour, +8.18% in 24 hours. How many times have you seen a market like this? What usually happens next?
#TA
Just chatting—everyone has to bear the consequences of their own gains and losses.
2
·
--
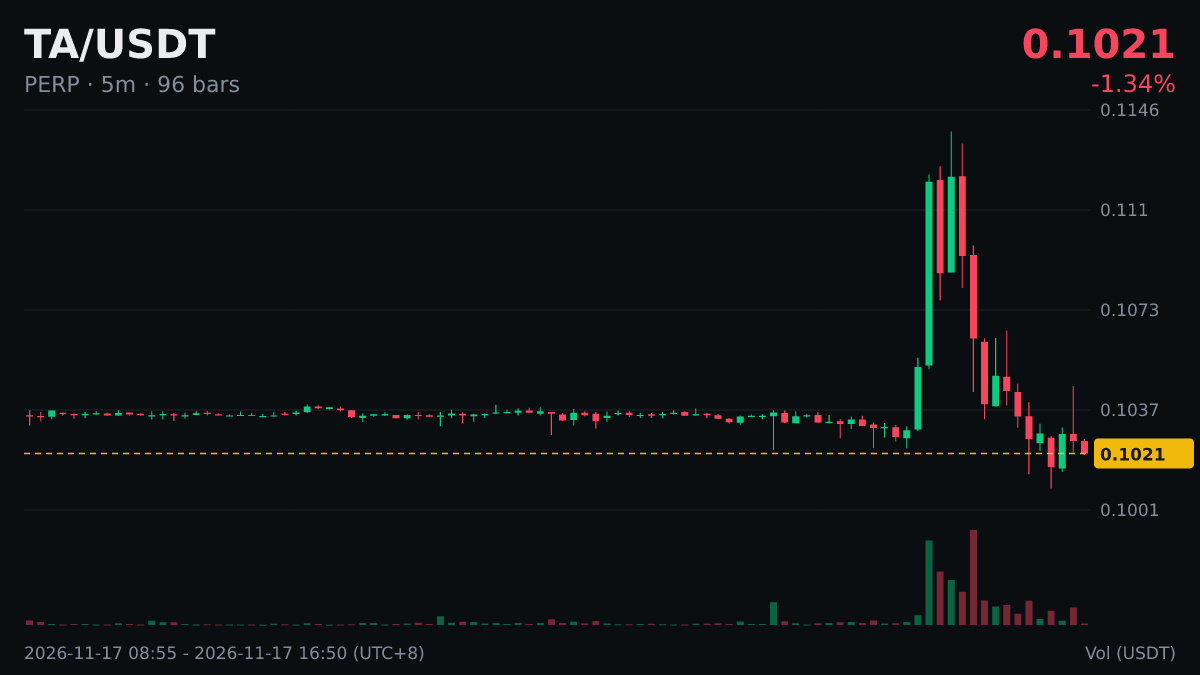
$TA 1 hours -8.21%, current price 0.1022. If you're itching to buy the dip, ask yourself three questions first:
① The 24h low of 0.1008 is holding as support—is there any sign the price has stopped falling?
② This was a sudden plunge. If it tests the bottom a second time, can you handle it?
③ Have you planned your stop-loss? What will you do if your dip-buying call is wrong?
If you haven't thought it through, it's better to wait and see.
#TA
Just sharing my thoughts—don't take this as investment advice.
$TA 1 hours -8.21%, current price 0.1022. If you're itching to buy the dip, ask yourself three questions first:
① The 24h low of 0.1008 is holding as support—is there any sign the price has stopped falling?
② This was a sudden plunge. If it tests the bottom a second time, can you handle it?
③ Have you planned your stop-loss? What will you do if your dip-buying call is wrong?
If you haven't thought it through, it's better to wait and see.
#TA
Just sharing my thoughts—don't take this as investment advice.
① The 24h low of 0.1008 is holding as support—is there any sign the price has stopped falling?
② This was a sudden plunge. If it tests the bottom a second time, can you handle it?
③ Have you planned your stop-loss? What will you do if your dip-buying call is wrong?
If you haven't thought it through, it's better to wait and see.
#TA
Just sharing my thoughts—don't take this as investment advice.
2
·
--
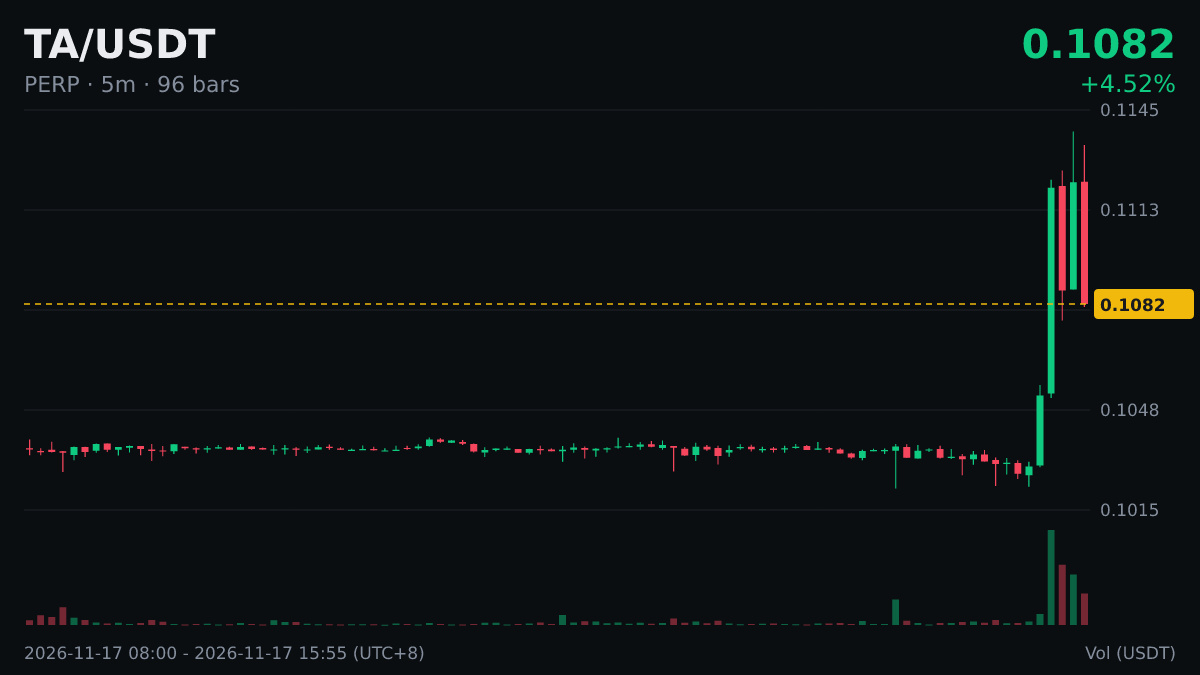
Just saw $TA drop a bit—down 3.11% in 5 minutes. That was a pretty sharp fall, and it might not bounce back. Honestly, I’ve been burned trying to catch a falling knife, so I’ve been a bit slower to act these past couple of years.
#TA
Just saw $TA drop a bit—down 3.11% in 5 minutes. That was a pretty sharp fall, and it might not bounce back. Honestly, I’ve been burned trying to catch a falling knife, so I’ve been a bit slower to act these past couple of years.
#TA
#TA
107

·
--
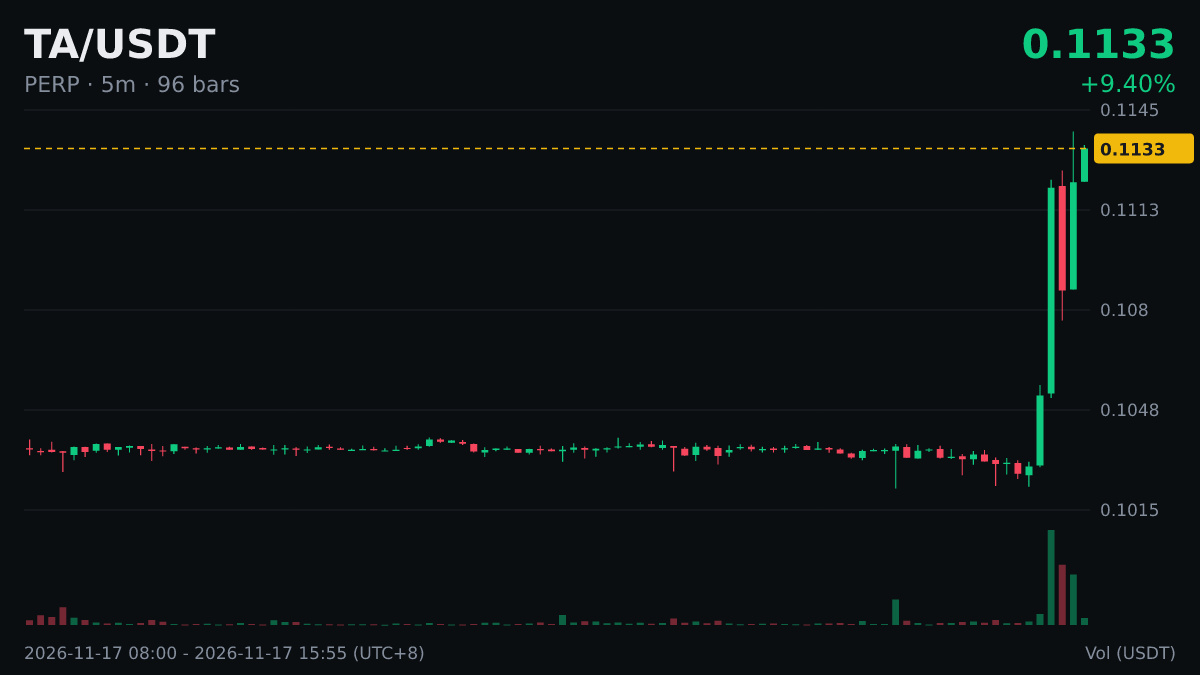
Technical observations|$TA
· 5-minute gain +3.52%, 1h +9.14%, 4h +9.13%
· Current price 0.1129, 24h range 0.1017 ~ 0.1138
The pace is relatively moderate. Watch whether the upward move can continue; if the price falls back below the breakout level, treat it as a false breakout.
#TA
Technical observations|$TA
· 5-minute gain +3.52%, 1h +9.14%, 4h +9.13%
· Current price 0.1129, 24h range 0.1017 ~ 0.1138
The pace is relatively moderate. Watch whether the upward move can continue; if the price falls back below the breakout level, treat it as a false breakout.
#TA
· 5-minute gain +3.52%, 1h +9.14%, 4h +9.13%
· Current price 0.1129, 24h range 0.1017 ~ 0.1138
The pace is relatively moderate. Watch whether the upward move can continue; if the price falls back below the breakout level, treat it as a false breakout.
#TA
2

·
--
TA futures, closed at +6.34% on the 5m chart at 2026-11-17 15:45 Beijing time. At the observation time, 2026-11-17 15:45:01 Beijing time, the current price was 0.11132, 24h turnover was 4.948 million, price was above VWAP 0.105585, and RSI was 87.6. First, focus on the key data. What matters more now is that the market is repricing it.
Can it hold VWAP 0.105585 on a pullback? I’ll wait for confirmation rather than rush into the first move.
Note: 24h trading volume is under $5 million, and the order book is thin. Watch out for slippage.
#TA #UnusualMovementAlert
TA futures, closed at +6.34% on the 5m chart at 2026-11-17 15:45 Beijing time. At the observation time, 2026-11-17 15:45:01 Beijing time, the current price was 0.11132, 24h turnover was 4.948 million, price was above VWAP 0.105585, and RSI was 87.6. First, focus on the key data. What matters more now is that the market is repricing it.
Can it hold VWAP 0.105585 on a pullback? I’ll wait for confirmation rather than rush into the first move.
Note: 24h trading volume is under $5 million, and the order book is thin. Watch out for slippage.
#TA #UnusualMovementAlert
Can it hold VWAP 0.105585 on a pullback? I’ll wait for confirmation rather than rush into the first move.
Note: 24h trading volume is under $5 million, and the order book is thin. Watch out for slippage.
#TA #UnusualMovementAlert
4
·
--
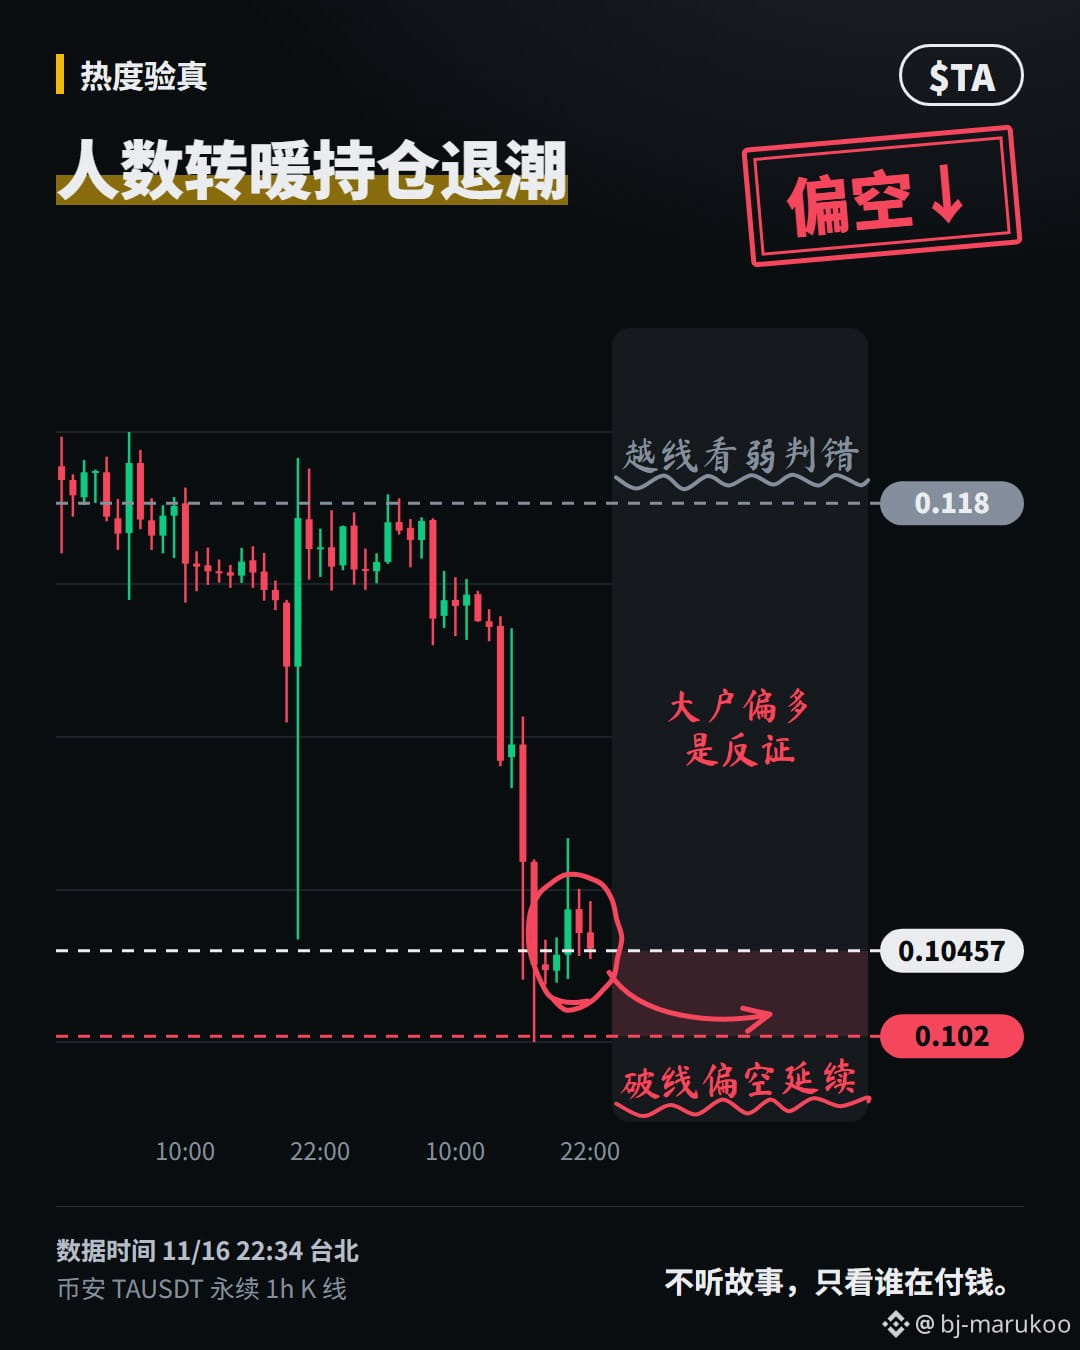
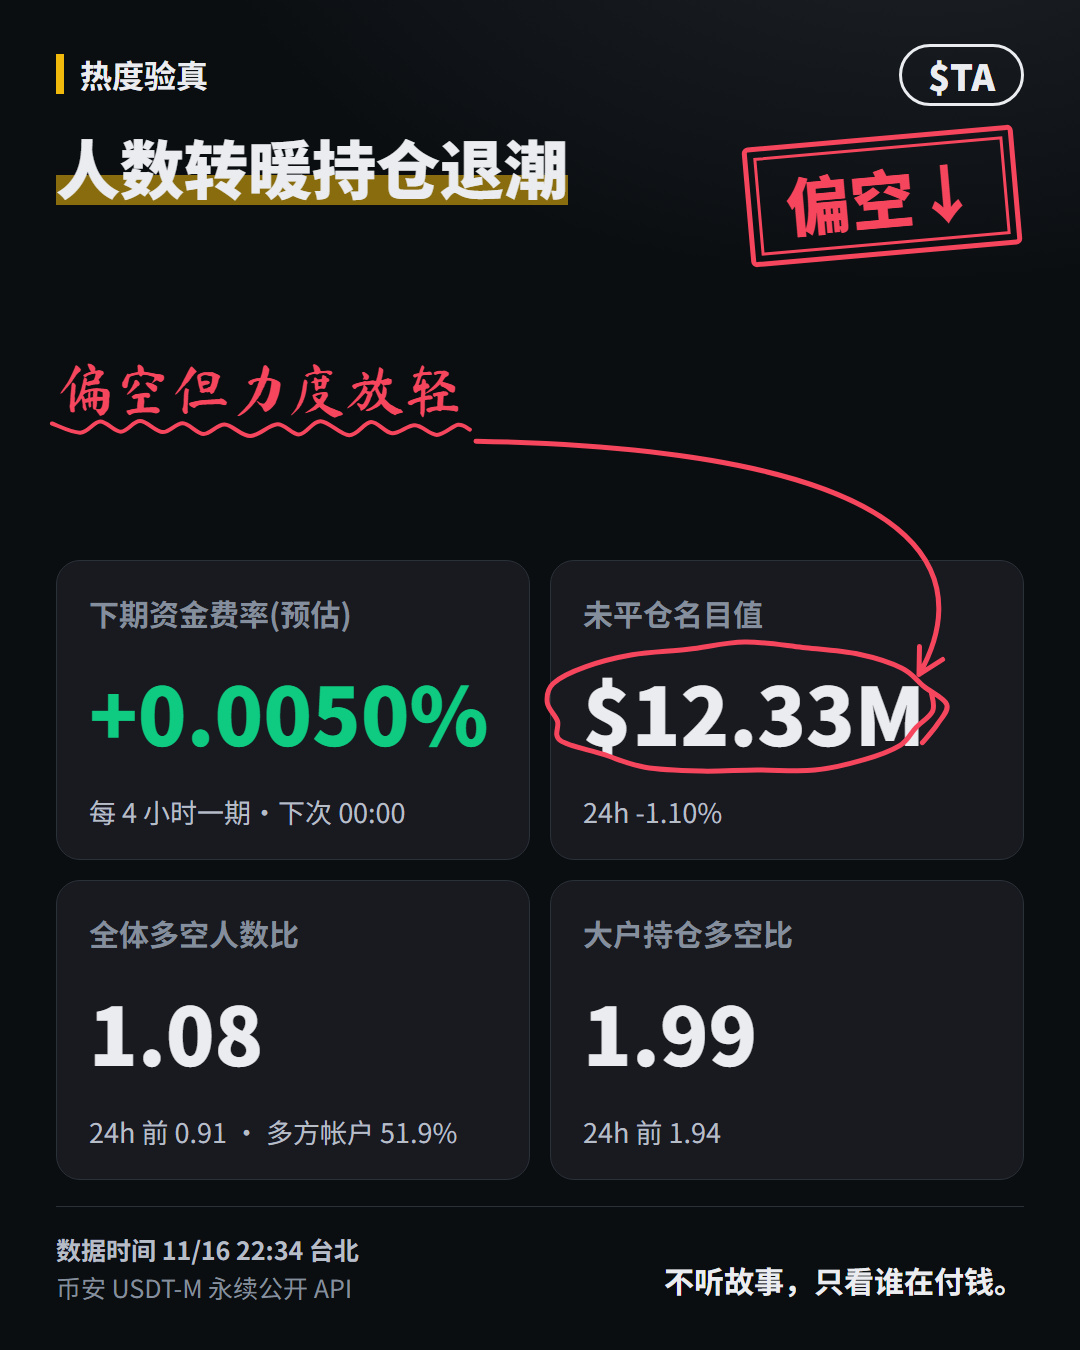
Open interest is declining, which means the total number of outstanding contracts is shrinking. Yet the share of long accounts for $TA is rising.
Over the past day, open interest fell 1.10% from yesterday, huh~.
Over the same period, the long-to-short account ratio rose from 0.91 to 1.08.
The four-hour funding rate this period was 0.005%, unchanged from the previous period.
I’m bearish, trusting sentiment to recover before open interest does; I’m not ready to call it a broadening rally.
But large traders’ positioning also shifted long over the past day. Mm-hmm, that leaves me only mildly bearish.
If the bulls take a rebound in account numbers as a return of capital, I call that “mistaking the choir’s volume for box-office sales.”
This time, I’ll let the boundaries decide:
If price breaks below the past day’s lower bound of 0.102, I’ll renew my bearish stance.
If it breaks above the same period’s upper bound of 0.118, I’ll issue a correction to my bearish call.
Which sounds more convincing to you: “1.10% is cooling off” or “1.10% is just taking a breather”?
#TA #Open Interest
Data from Binance’s public market data; not investment advice
Open interest is declining, which means the total number of outstanding contracts is shrinking. Yet the share of long accounts for $TA is rising.
Over the past day, open interest fell 1.10% from yesterday, huh~.
Over the same period, the long-to-short account ratio rose from 0.91 to 1.08.
The four-hour funding rate this period was 0.005%, unchanged from the previous period.
I’m bearish, trusting sentiment to recover before open interest does; I’m not ready to call it a broadening rally.
But large traders’ positioning also shifted long over the past day. Mm-hmm, that leaves me only mildly bearish.
If the bulls take a rebound in account numbers as a return of capital, I call that “mistaking the choir’s volume for box-office sales.”
This time, I’ll let the boundaries decide:
If price breaks below the past day’s lower bound of 0.102, I’ll renew my bearish stance.
If it breaks above the same period’s upper bound of 0.118, I’ll issue a correction to my bearish call.
Which sounds more convincing to you: “1.10% is cooling off” or “1.10% is just taking a breather”?
#TA #Open Interest
Data from Binance’s public market data; not investment advice
Over the past day, open interest fell 1.10% from yesterday, huh~.
Over the same period, the long-to-short account ratio rose from 0.91 to 1.08.
The four-hour funding rate this period was 0.005%, unchanged from the previous period.
I’m bearish, trusting sentiment to recover before open interest does; I’m not ready to call it a broadening rally.
But large traders’ positioning also shifted long over the past day. Mm-hmm, that leaves me only mildly bearish.
If the bulls take a rebound in account numbers as a return of capital, I call that “mistaking the choir’s volume for box-office sales.”
This time, I’ll let the boundaries decide:
If price breaks below the past day’s lower bound of 0.102, I’ll renew my bearish stance.
If it breaks above the same period’s upper bound of 0.118, I’ll issue a correction to my bearish call.
Which sounds more convincing to you: “1.10% is cooling off” or “1.10% is just taking a breather”?
#TA #Open Interest
Data from Binance’s public market data; not investment advice
410
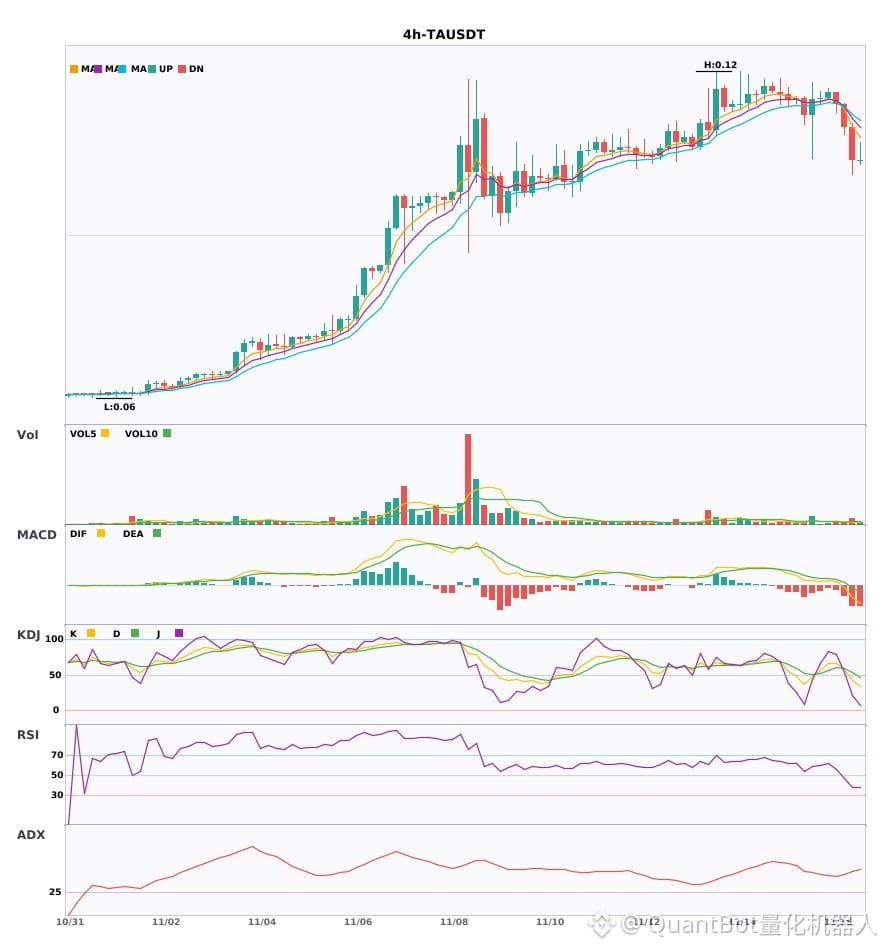
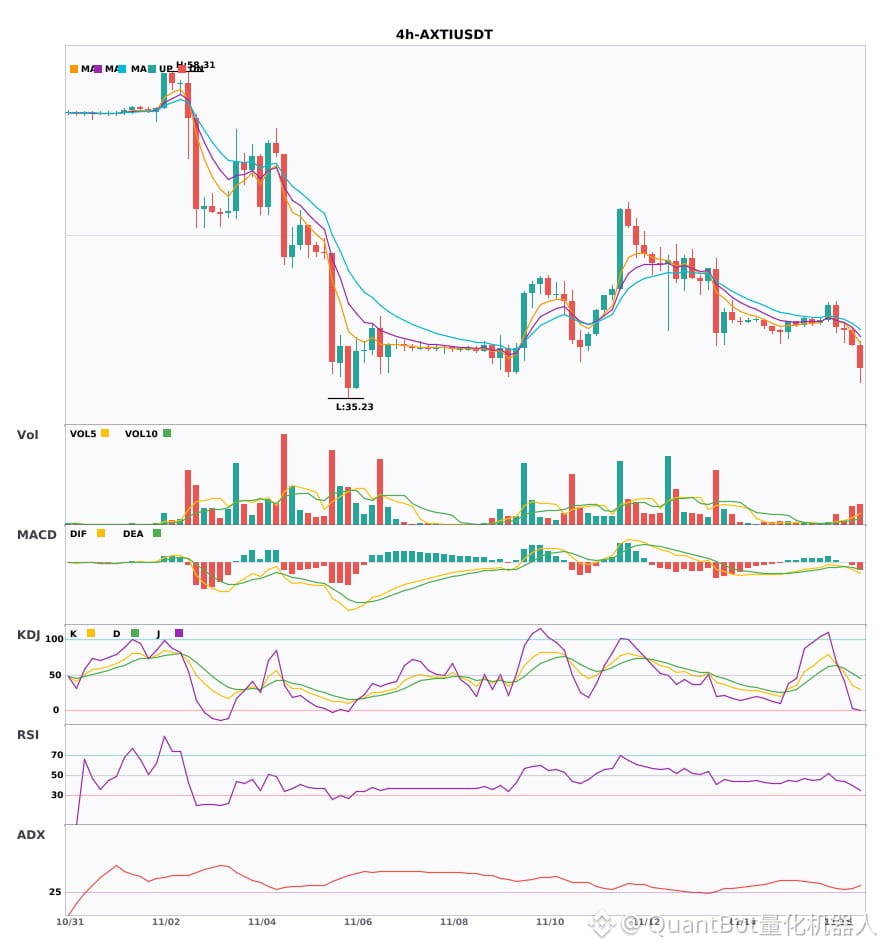
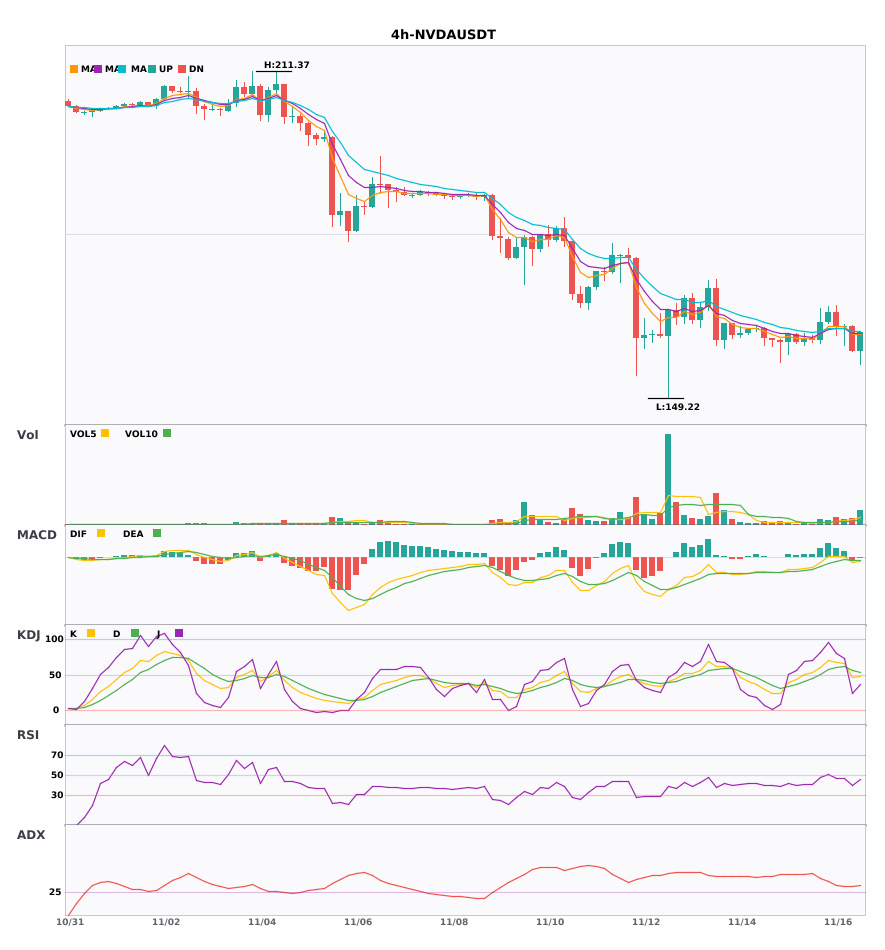
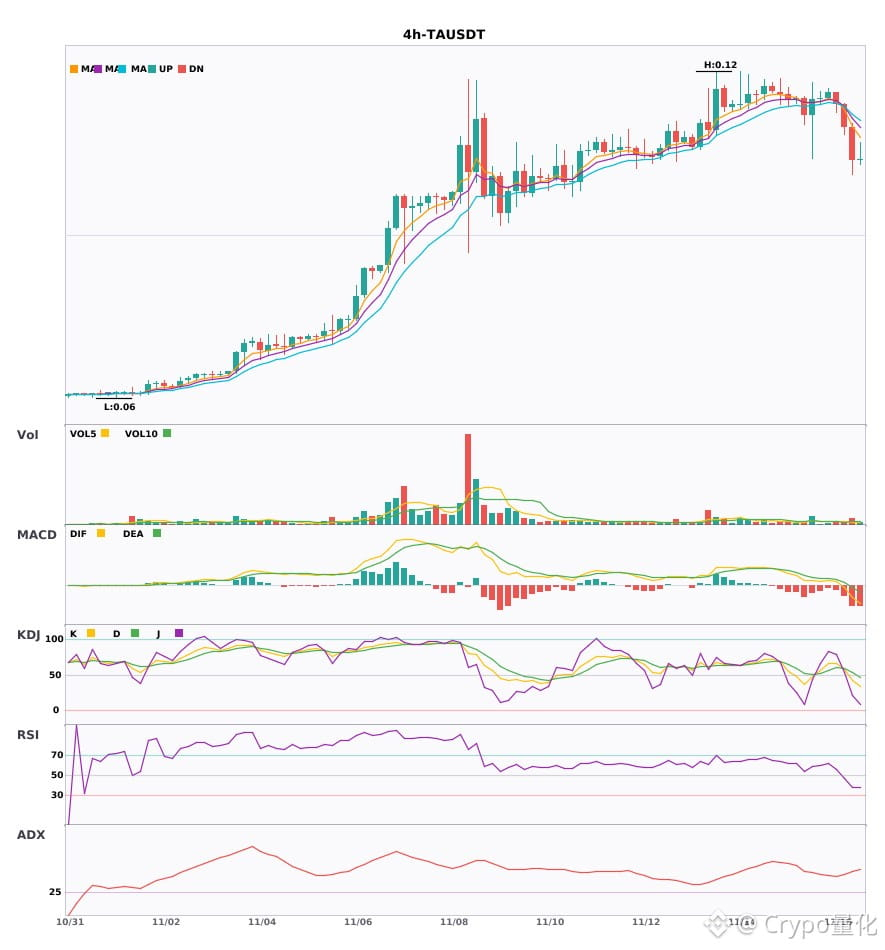
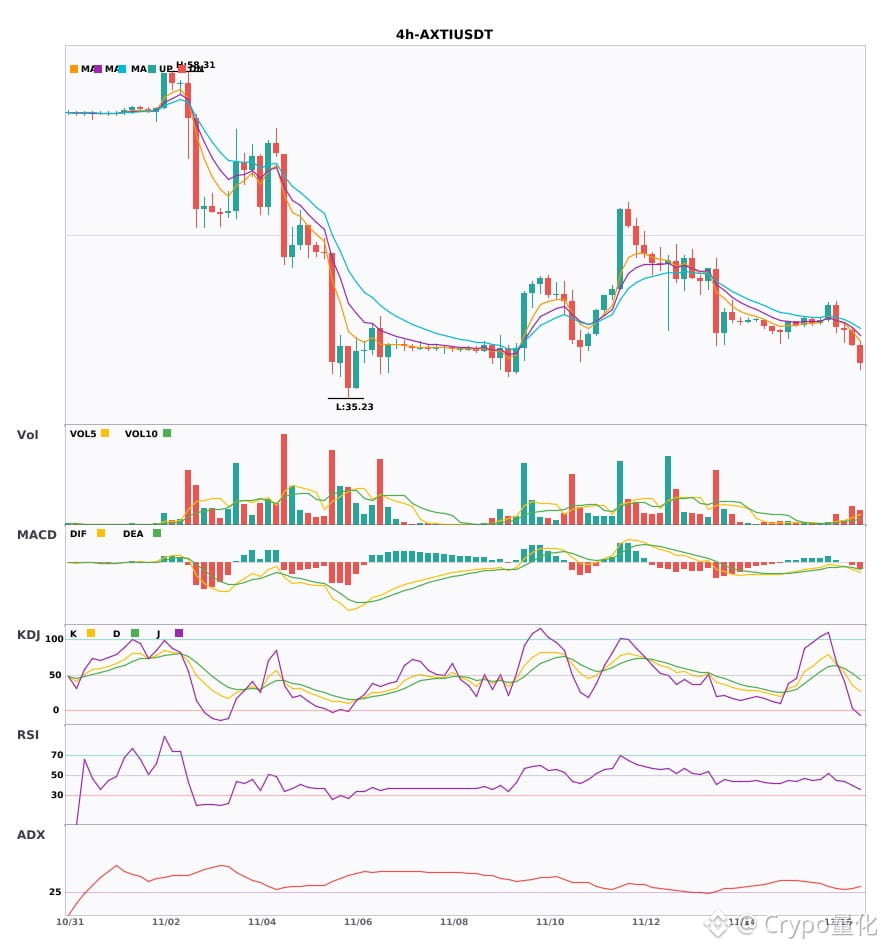
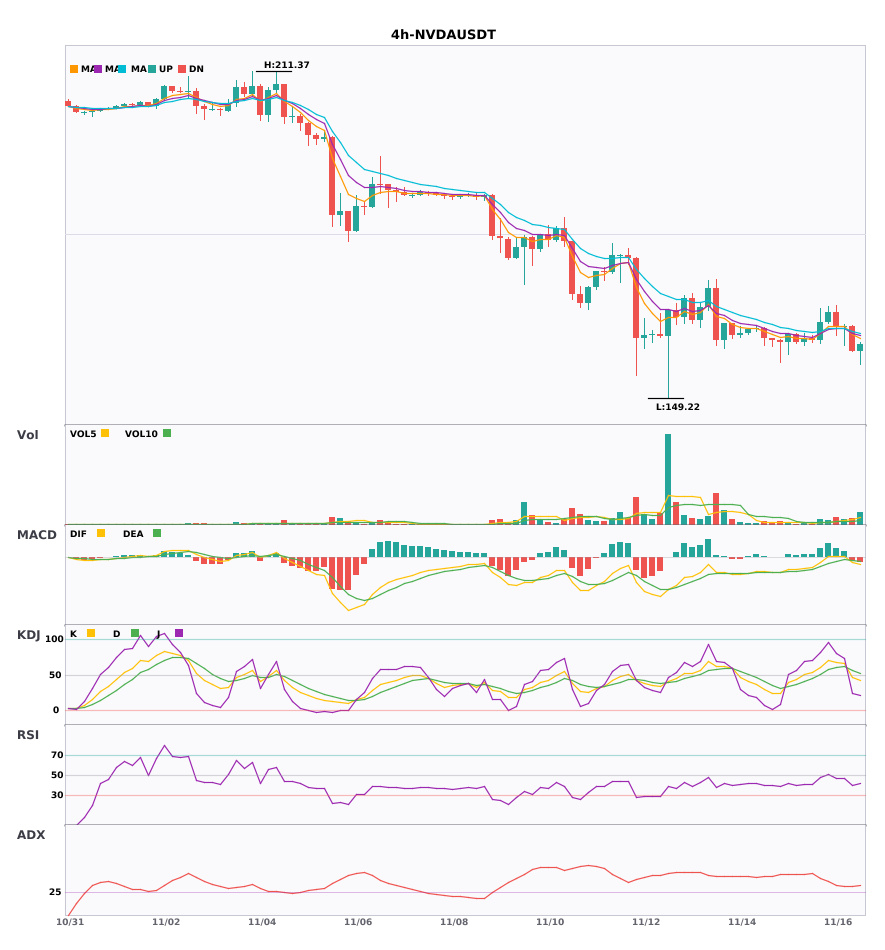
$TA/$AXTI/$NVDA 4H indicators moving down in sync; risk warning
📉 $TA | 4-hour bearish signal
━━━━━━━━━━━━━━━━━━
Technical analysis: ADX(53) indicates an extremely strong trend; beware of a pullback | MACD bearish momentum increasing | EMA5<8<13 bearish alignment | volume up 2x
Price change: -5.7000%
📉 $AXTI | 4-hour bearish signal
━━━━━━━━━━━━━━━━━━
Technical analysis: ADX(30) trend taking shape; entry possible; MACD bearish crossover below the zero line, bearish momentum accelerating; EMA5<EMA8<EMA13 bearish alignment; volume up 3.8x.
Price change: -2.7000%
📉 $NVDA | 4-hour bearish signal
━━━━━━━━━━━━━━━━━━
Technical analysis: ADX(31) trend is clear; MACD bearish crossover below zero, bearish momentum strengthening; EMA5 crosses below EMA8; KDJ bearish crossover (K46.0/D56.9); volume up 1.7x, short-term bias is bearish.
Price change: -2.9500%
━━━━━━━━━━━━━━━━━━
#技术分析 #TA #AXTI #NVDA
📌 The above content is for reference only and does not constitute investment advice
$TA /$AXTI /$NVDA 4H indicators moving down in sync; risk warning
📉 $TA | 4-hour bearish signal
━━━━━━━━━━━━━━━━━━
Technical analysis: ADX(53) indicates an extremely strong trend; beware of a pullback | MACD bearish momentum increasing | EMA5<8<13 bearish alignment | volume up 2x
Price change: -5.7000%
📉 $AXTI | 4-hour bearish signal
━━━━━━━━━━━━━━━━━━
Technical analysis: ADX(30) trend taking shape; entry possible; MACD bearish crossover below the zero line, bearish momentum accelerating; EMA5<EMA8<EMA13 bearish alignment; volume up 3.8x.
Price change: -2.7000%
📉 $NVDA | 4-hour bearish signal
━━━━━━━━━━━━━━━━━━
Technical analysis: ADX(31) trend is clear; MACD bearish crossover below zero, bearish momentum strengthening; EMA5 crosses below EMA8; KDJ bearish crossover (K46.0/D56.9); volume up 1.7x, short-term bias is bearish.
Price change: -2.9500%
━━━━━━━━━━━━━━━━━━
#技术分析 #TA #AXTI #NVDA
📌 The above content is for reference only and does not constitute investment advice
📉 $TA | 4-hour bearish signal
━━━━━━━━━━━━━━━━━━
Technical analysis: ADX(53) indicates an extremely strong trend; beware of a pullback | MACD bearish momentum increasing | EMA5<8<13 bearish alignment | volume up 2x
Price change: -5.7000%
📉 $AXTI | 4-hour bearish signal
━━━━━━━━━━━━━━━━━━
Technical analysis: ADX(30) trend taking shape; entry possible; MACD bearish crossover below the zero line, bearish momentum accelerating; EMA5<EMA8<EMA13 bearish alignment; volume up 3.8x.
Price change: -2.7000%
📉 $NVDA | 4-hour bearish signal
━━━━━━━━━━━━━━━━━━
Technical analysis: ADX(31) trend is clear; MACD bearish crossover below zero, bearish momentum strengthening; EMA5 crosses below EMA8; KDJ bearish crossover (K46.0/D56.9); volume up 1.7x, short-term bias is bearish.
Price change: -2.9500%
━━━━━━━━━━━━━━━━━━
#技术分析 #TA #AXTI #NVDA
📌 The above content is for reference only and does not constitute investment advice
2
·
--
$TA $AXTI $NVDA 4 hours, all turning bearish, with short signals appearing together 🔥
════════════════════
🟢 $TA 4-hour short signal
⚠️ Technicals: ADX is as high as 53, indicating an extremely strong trend, but beware of a pullback from overbought conditions; MACD is bearish, with momentum strengthening; moving averages are bearishly aligned and diverging downward; volume has doubled.
════════════════════
🟢 $AXTI 4-hour short signal
⚠️ Technicals: ADX is above 30, and the trend has just emerged, so it can be followed. MACD has formed a bearish death cross below the zero line, with bears gaining strength. The 5, 8, and 13 moving averages are turning downward, and a bearish alignment has just formed. Volume has increased 3.8 times.
════════════════════
🟢 $NVDA 4-hour short signal
⚠️ Technicals: ADX is quite high, indicating a clear trend. MACD has formed a bearish death cross, with bears gaining strength. EMA5 has crossed below EMA8, signaling short-term weakness. KDJ has formed a death cross but is not yet oversold. Volume has increased by about 1.7 times.
════════════════════
🔔 Follow for first-hand market movement alerts 🔔
#技术分析 #TA #AXTI #NVDA
📌 When trading, pay attention to whether the candlestick pattern confirms the signal
$TA $AXTI $NVDA 4 hours, all turning bearish, with short signals appearing together 🔥
════════════════════
🟢 $TA 4-hour short signal
⚠️ Technicals: ADX is as high as 53, indicating an extremely strong trend, but beware of a pullback from overbought conditions; MACD is bearish, with momentum strengthening; moving averages are bearishly aligned and diverging downward; volume has doubled.
════════════════════
🟢 $AXTI 4-hour short signal
⚠️ Technicals: ADX is above 30, and the trend has just emerged, so it can be followed. MACD has formed a bearish death cross below the zero line, with bears gaining strength. The 5, 8, and 13 moving averages are turning downward, and a bearish alignment has just formed. Volume has increased 3.8 times.
════════════════════
🟢 $NVDA 4-hour short signal
⚠️ Technicals: ADX is quite high, indicating a clear trend. MACD has formed a bearish death cross, with bears gaining strength. EMA5 has crossed below EMA8, signaling short-term weakness. KDJ has formed a death cross but is not yet oversold. Volume has increased by about 1.7 times.
════════════════════
🔔 Follow for first-hand market movement alerts 🔔
#技术分析 #TA #AXTI #NVDA
📌 When trading, pay attention to whether the candlestick pattern confirms the signal
════════════════════
🟢 $TA 4-hour short signal
⚠️ Technicals: ADX is as high as 53, indicating an extremely strong trend, but beware of a pullback from overbought conditions; MACD is bearish, with momentum strengthening; moving averages are bearishly aligned and diverging downward; volume has doubled.
════════════════════
🟢 $AXTI 4-hour short signal
⚠️ Technicals: ADX is above 30, and the trend has just emerged, so it can be followed. MACD has formed a bearish death cross below the zero line, with bears gaining strength. The 5, 8, and 13 moving averages are turning downward, and a bearish alignment has just formed. Volume has increased 3.8 times.
════════════════════
🟢 $NVDA 4-hour short signal
⚠️ Technicals: ADX is quite high, indicating a clear trend. MACD has formed a bearish death cross, with bears gaining strength. EMA5 has crossed below EMA8, signaling short-term weakness. KDJ has formed a death cross but is not yet oversold. Volume has increased by about 1.7 times.
════════════════════
🔔 Follow for first-hand market movement alerts 🔔
#技术分析 #TA #AXTI #NVDA
📌 When trading, pay attention to whether the candlestick pattern confirms the signal
14
Log in to explore more content
Join global crypto users on Binance Square
⚡️ Get latest and useful information about crypto.
💬 Trusted by the world’s largest crypto exchange.
👍 Discover real insights from verified creators.
Email / Phone number
Trending Topics
1
#XRPDropsToTwoYearLowNear87Cents
4,815 views
112 Discussing
2
#BitcoinFallsBelow$57KToTwoYearLow
3,011 views
23 Discussing
3
#NvidiaLoses$2.7TrillionInMonthAndAHalf
797 views
36 Discussing
4
#CanBTCReboundAfterFallingBelow60K?
513,571 views
2,269 Discussing
5
#GlobalStocksFaceLongestLosingStreakSince2023
177,458 views
1,568 Discussing
6
#BlackRockIBITPostsRecord$541MSingleDayOutflow
10,361 views
50 Discussing
7
#AnthropicPlungesTowardIPOPriceonDay2
89,022 views
900 Discussing
8
#TwentyOneCapitalAdds172.25BTC
36,020 views
419 Discussing
9
#HKBillWouldExcludeTokenizedDepositsFromVirtualAssets
3,176 views
42 Discussing
10
#BNBDropsBelow540USDTWith8.46%DailyDecline
50,322 views
466 Discussing