

DocCompound
Surgeon by profession. Investor by discipline. DCA & patience. No hype, no shortcuts. Building financial freedom for the long game.
985 Following
144 Followers
16 Liked
Posts
All
Quotes



RAMESSES Tob TRD
·
--
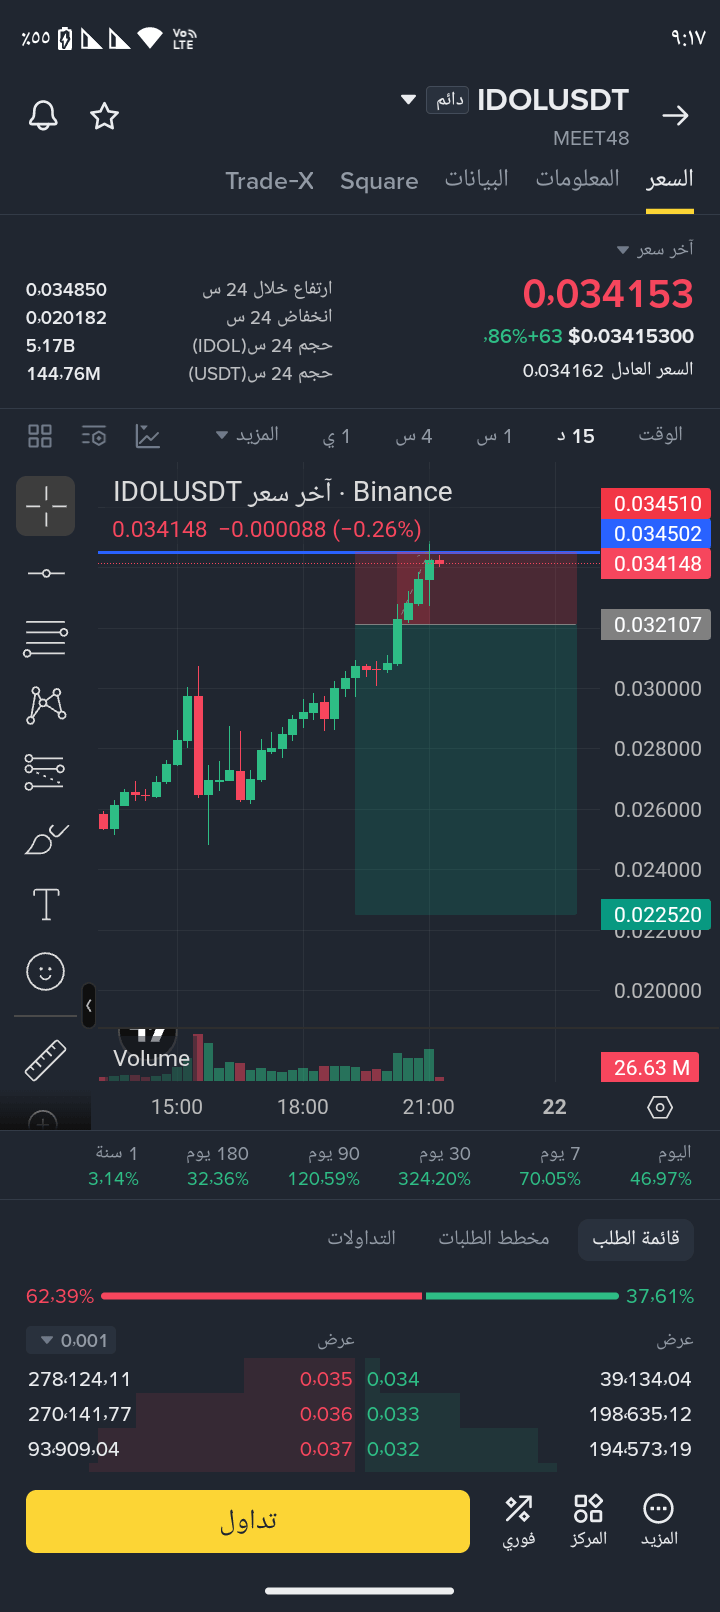
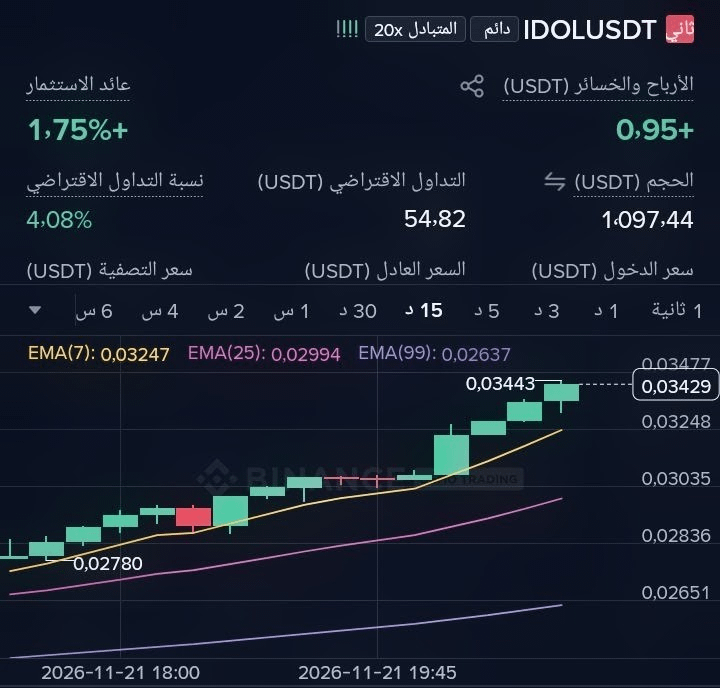
BearishI just opened a quick short trade on $IDOL
Entry now: sell at 0.034400 or 0.035300
First target: 0.03200
Second: 0.03000
Third: 0.02800
Final: 0.02600
++
Stop loss above 0.038500
A very strong selling opportunity is coming; RSI has reached 95%
Entry now: sell at 0.034400 or 0.035300
First target: 0.03200
Second: 0.03000
Third: 0.02800
Final: 0.02600
++
Stop loss above 0.038500
A very strong selling opportunity is coming; RSI has reached 95%

香如故
·
--
The Financial Crisis Unfolding in This Market Cycle
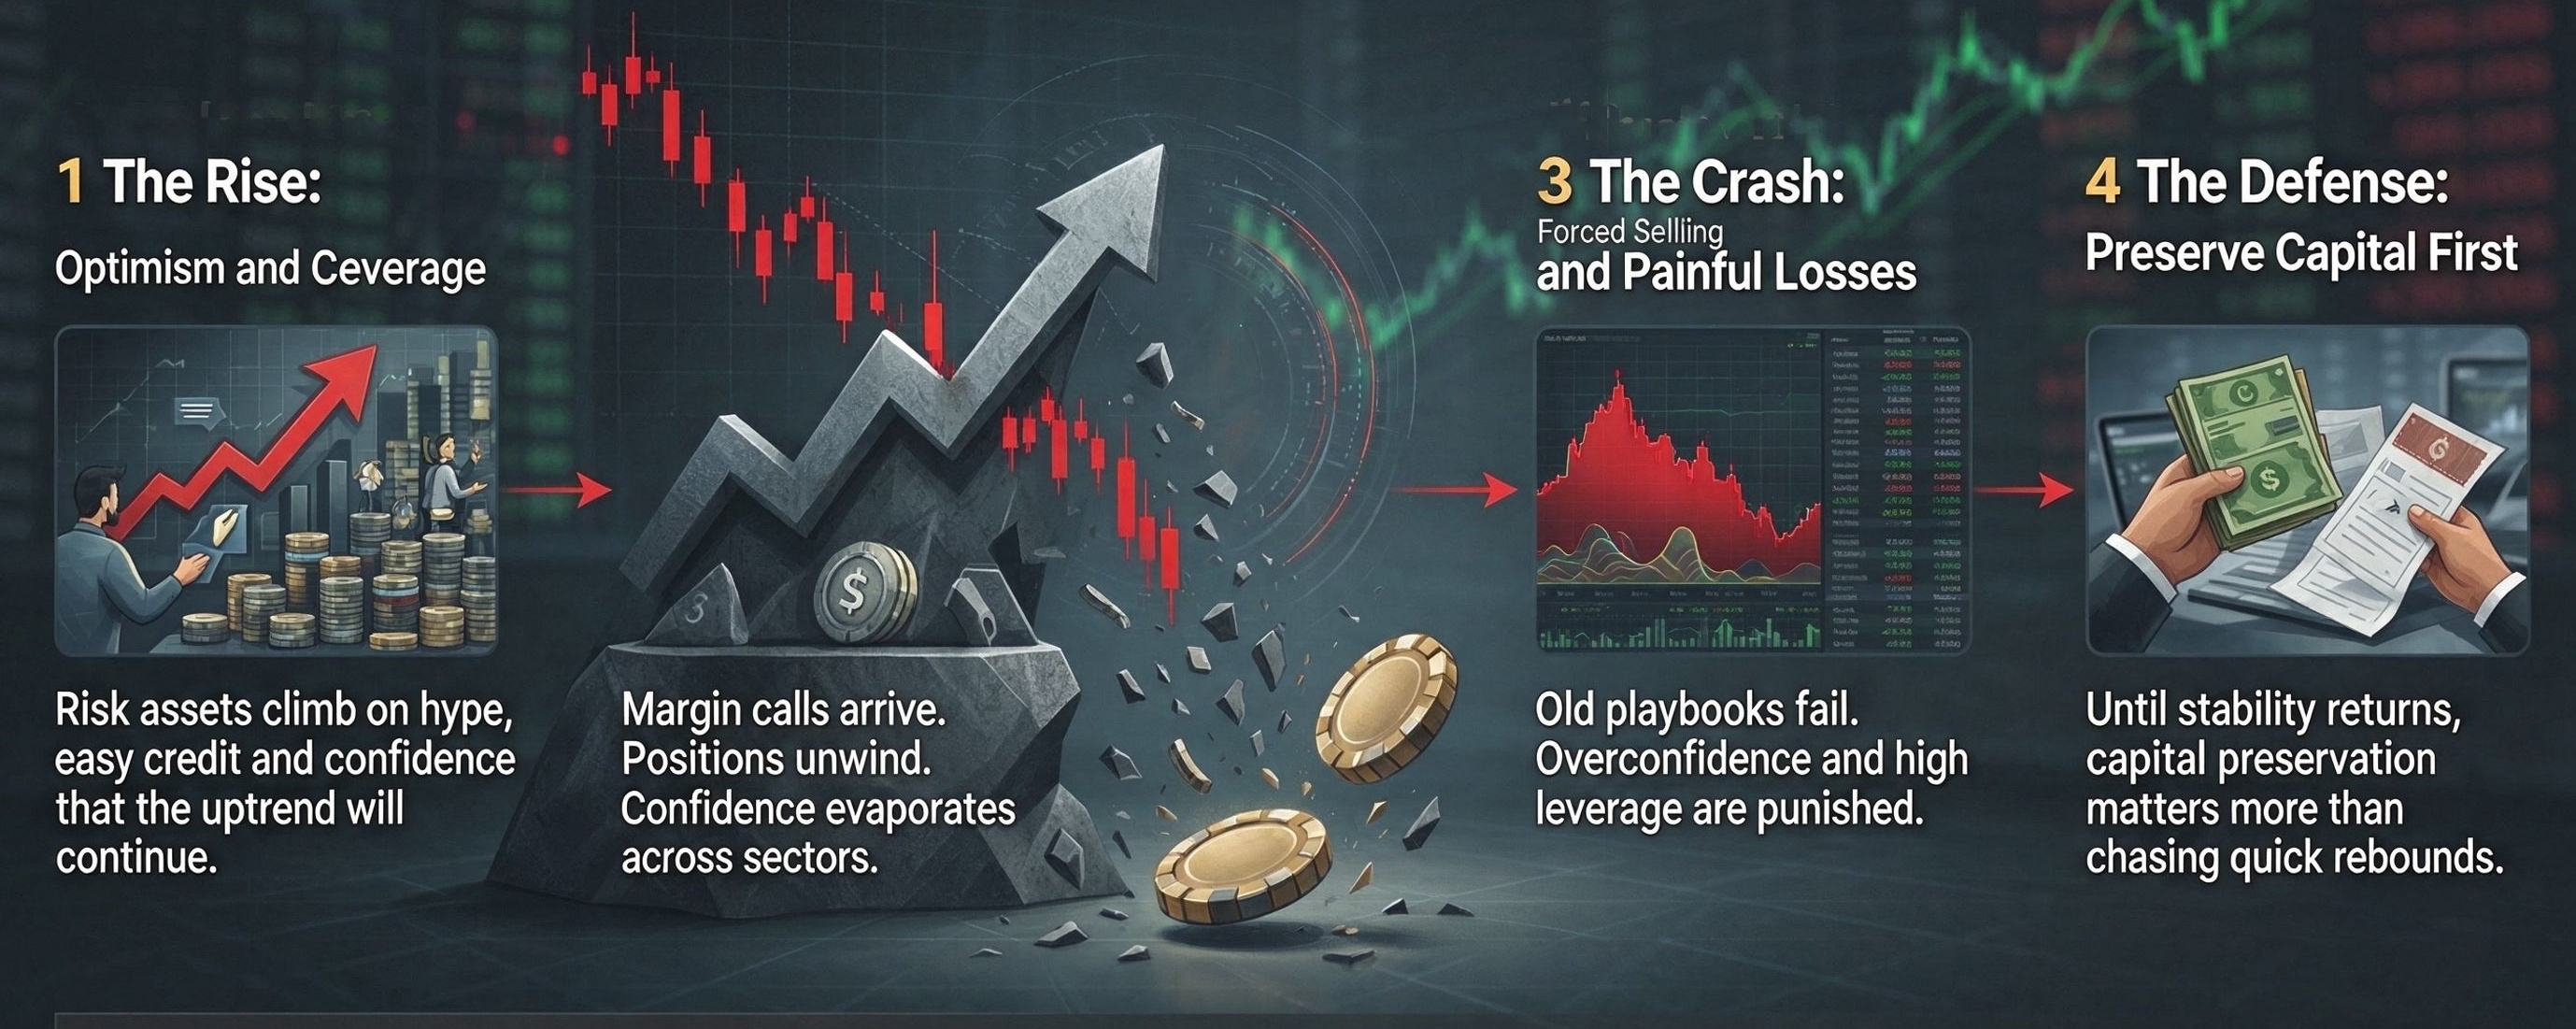
The market is trembling, and signs of a financial crisis are unfolding right in front of us. What started as a routine pullback has quickly turned into a brutal deleveraging wave across stocks, crypto and risky assets.
For months, the market was lifted by optimism, hype and cheap leverage. Investors chased rallies, piled into high-flying growth trades and believed the uptrend would last forever. Few prepared for the moment liquidity would vanish. Now the tide has reversed.
Risk assets are selling off sharply. Margin calls keep coming. Positions that looked profitable overnight turn into heavy losses within hours. Confidence evaporates fast. Panic spreads from one sector to another, dragging down even assets with solid fundamentals. This is how a market crash begins: not always from one single big event, but from a sudden shift in sentiment, tightening liquidity and forced liquidation.
Many ordinary traders get trapped in this wave. They held on, hoping for a quick rebound, only to watch their capital shrink day by day. The market no longer rewards bold bets; it punishes overconfidence and high leverage. The old playbook no longer works.
No one can tell exactly how deep this downturn will go. Sometimes the market stabilizes after a sharp correction; sometimes it slides into a full-blown crisis that lasts for months. The only certainty is that risk is everywhere now.
For those who survive this cycle, the lesson is clear: markets do not only go up. Greed fuels the rally, and fear fuels the crash. When the financial tide turns, capital preservation matters far more than chasing quick profits.
Do you want a shorter social media version, or a more aggressive trading-journal style?
#BTC
#ETH
#SNDK
#XAU
#SOXL
For months, the market was lifted by optimism, hype and cheap leverage. Investors chased rallies, piled into high-flying growth trades and believed the uptrend would last forever. Few prepared for the moment liquidity would vanish. Now the tide has reversed.
Risk assets are selling off sharply. Margin calls keep coming. Positions that looked profitable overnight turn into heavy losses within hours. Confidence evaporates fast. Panic spreads from one sector to another, dragging down even assets with solid fundamentals. This is how a market crash begins: not always from one single big event, but from a sudden shift in sentiment, tightening liquidity and forced liquidation.
Many ordinary traders get trapped in this wave. They held on, hoping for a quick rebound, only to watch their capital shrink day by day. The market no longer rewards bold bets; it punishes overconfidence and high leverage. The old playbook no longer works.
No one can tell exactly how deep this downturn will go. Sometimes the market stabilizes after a sharp correction; sometimes it slides into a full-blown crisis that lasts for months. The only certainty is that risk is everywhere now.
For those who survive this cycle, the lesson is clear: markets do not only go up. Greed fuels the rally, and fear fuels the crash. When the financial tide turns, capital preservation matters far more than chasing quick profits.
Do you want a shorter social media version, or a more aggressive trading-journal style?
#BTC
#ETH
#SNDK
#XAU
#SOXL
Mr DDD
·
--
🚀 Spot Trading: Small Steps, Big Opportunities!
In crypto, you don't need to chase every pump to make progress. Sometimes the smartest move is to spot a promising token, do your research, and stay patient. 📈
💎 Spot trading is about buying real crypto assets and managing your own strategy.
🔥 No leverage, no unnecessary pressure—just smart entries and disciplined decisions.
🧠 Research the project, understand the market, and never invest emotionally.
The best traders don't chase hype. They follow a strategy and let patience do its work.
Stay focused. Trade smart. Build for the long term. 💪
#Binance #SpotTrading #Crypto #Bitcoin #Altcoins #Web3 #CryptoTrading #DYOR
In crypto, you don't need to chase every pump to make progress. Sometimes the smartest move is to spot a promising token, do your research, and stay patient. 📈
💎 Spot trading is about buying real crypto assets and managing your own strategy.
🔥 No leverage, no unnecessary pressure—just smart entries and disciplined decisions.
🧠 Research the project, understand the market, and never invest emotionally.
The best traders don't chase hype. They follow a strategy and let patience do its work.
Stay focused. Trade smart. Build for the long term. 💪
#Binance #SpotTrading #Crypto #Bitcoin #Altcoins #Web3 #CryptoTrading #DYOR

sanim12i
·
--
Bullish🚀 The Future of Crypto Is Full of Opportunities!
The crypto market is constantly evolving, bringing new opportunities for investors and traders. 🔥
Stay focused, keep learning, do your own research, and never stop building your knowledge. Success in crypto requires patience, discipline, and smart decisions.
Let's grow together with Binance! 💛
#Binance #Bitcoin #BNB #web3兼职 #CryptoCommunity
The crypto market is constantly evolving, bringing new opportunities for investors and traders. 🔥
Stay focused, keep learning, do your own research, and never stop building your knowledge. Success in crypto requires patience, discipline, and smart decisions.
Let's grow together with Binance! 💛
#Binance #Bitcoin #BNB #web3兼职 #CryptoCommunity
江阳ETH
·
--
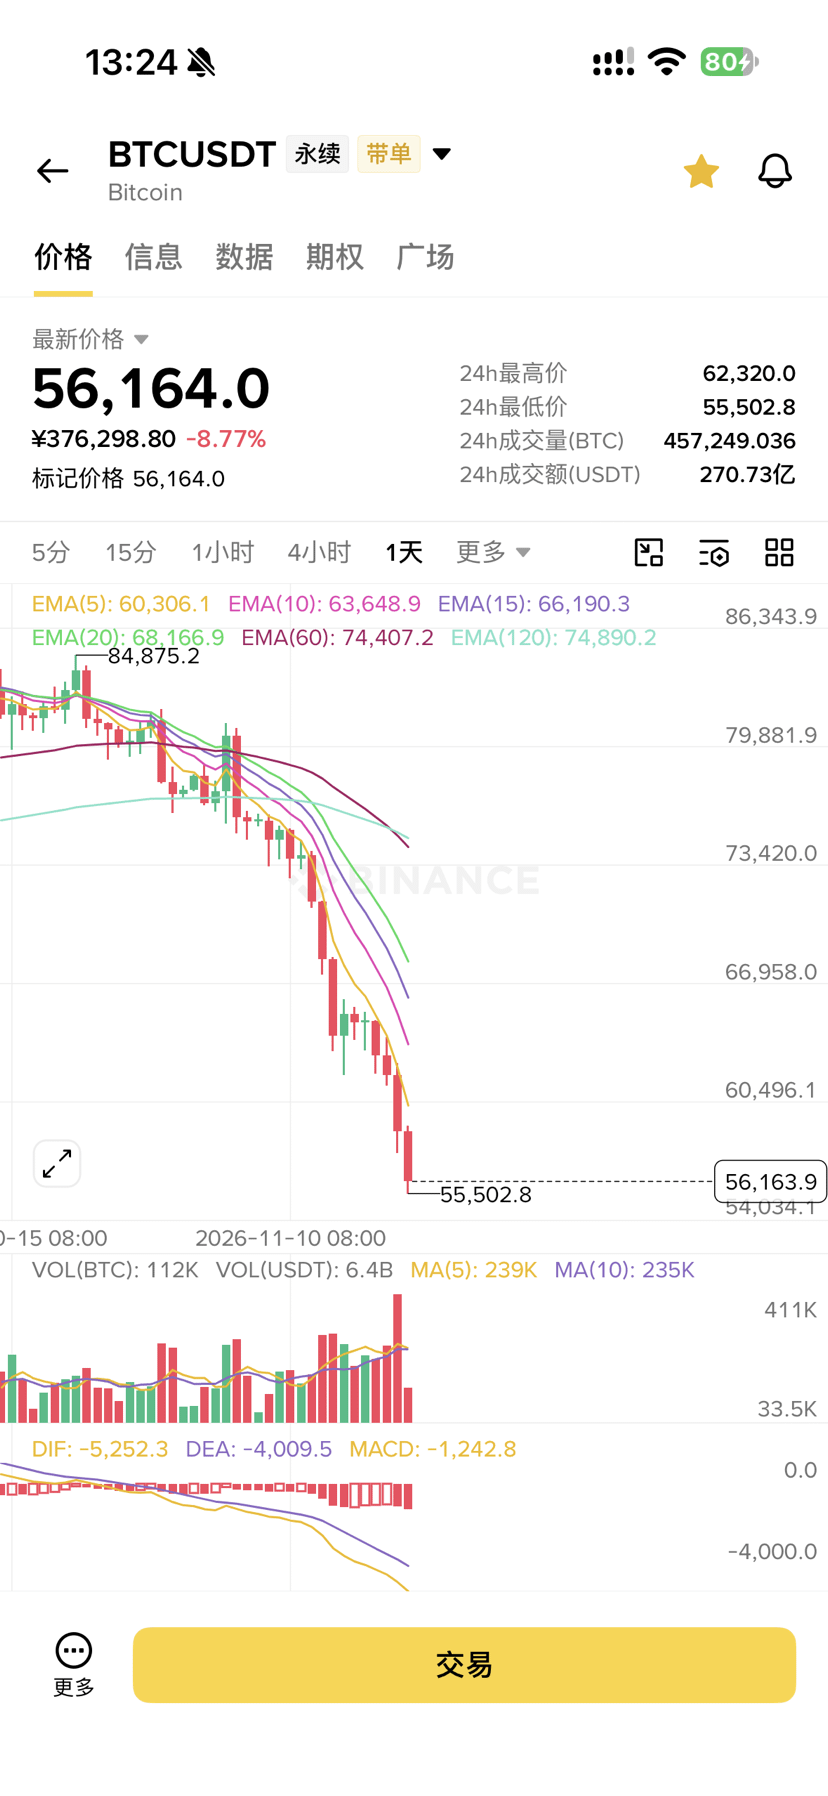
#比特币跌破6万美元,短期能否企稳反弹?
$BTC
$BTC

Zaitsev-plus1
·
--
$USDT 👉follow please go go go
Bitroot铄鸿
·
--
A faint fragrance sinks into the buds, quietly guarding tranquility, blooming with the wind, and gently tinting the mountain pavilion!
Faint scent lies deep in buds, keeping peace; blooming with wind, it sweetens mountain pavilions!
Faint scent lies deep in buds, keeping peace; blooming with wind, it sweetens mountain pavilions!


乐天eth
·
--
#BTC 🚀Fans claim BTC🧧Forward and share
颜驰Bit
·
--
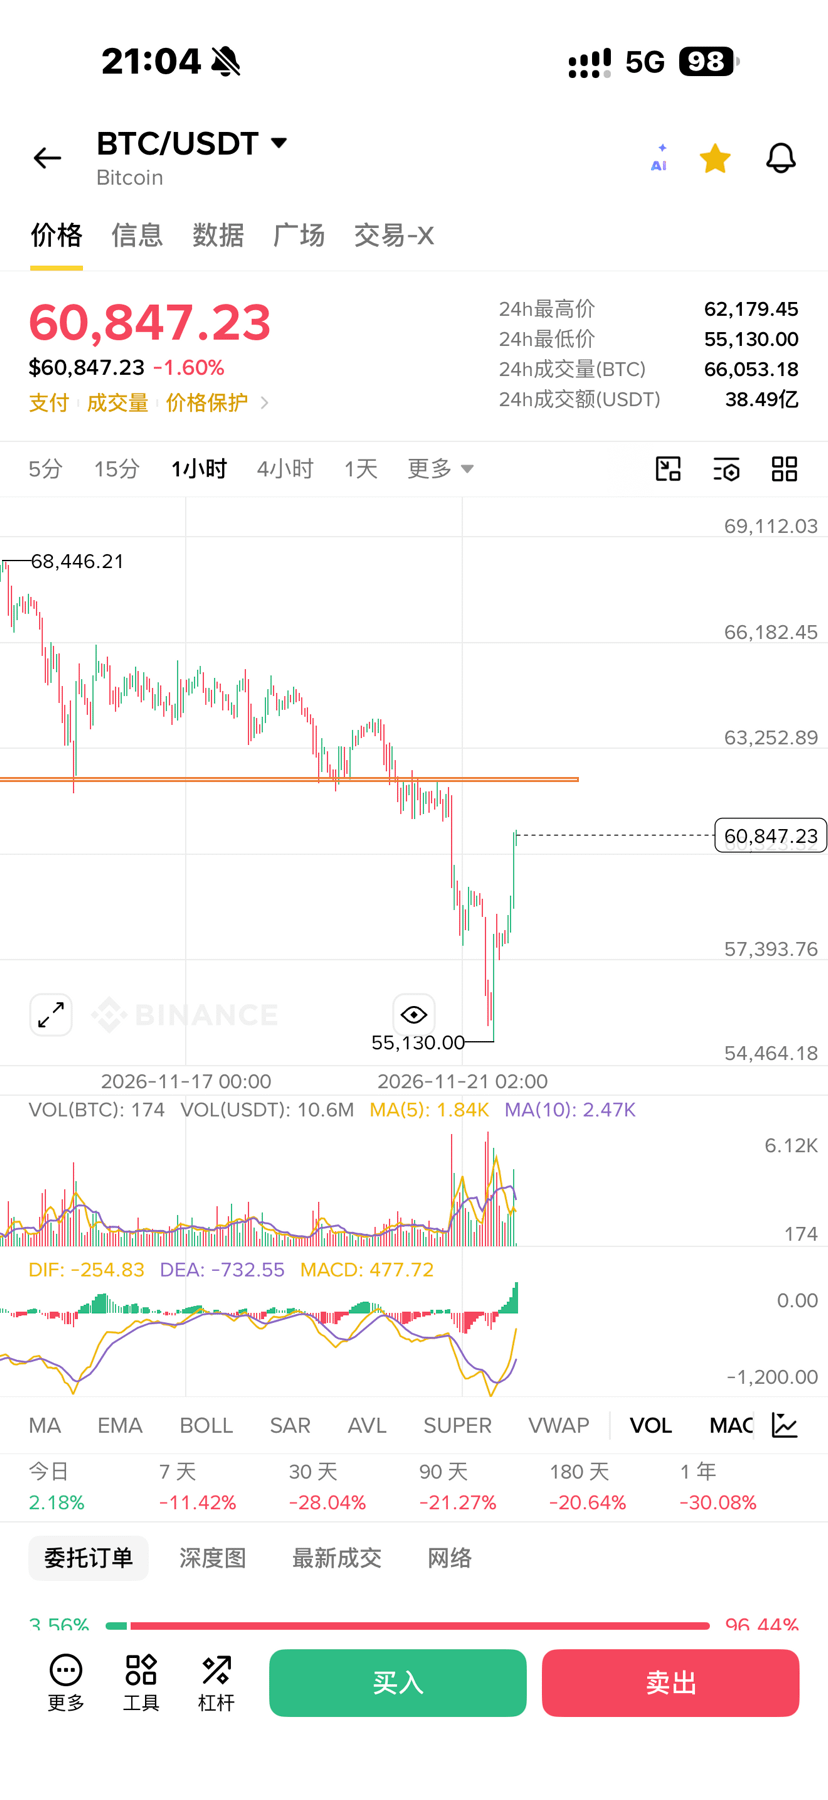
Stuck above 62,000+
If there's a chance, definitely reduce your position first. My average entry price is actually 60,291.
I’ve already taken 80% of the profits from that bounce just now.
The fact that it came back up at all is already a blessing from Buddha, so let’s take a moment to cool off and look at things objectively. Futures trading is mostly about human nature—and overcoming it. This move has really taught me a lot; I still have plenty to learn and practice.
All right, I’m going back to resting. Wishing everyone a big wave of good luck!
If there's a chance, definitely reduce your position first. My average entry price is actually 60,291.
I’ve already taken 80% of the profits from that bounce just now.
The fact that it came back up at all is already a blessing from Buddha, so let’s take a moment to cool off and look at things objectively. Futures trading is mostly about human nature—and overcoming it. This move has really taught me a lot; I still have plenty to learn and practice.
All right, I’m going back to resting. Wishing everyone a big wave of good luck!

泽栩191
·
--
Spend a little while quietly scrolling on my phone.


和成宝宝888
·
--
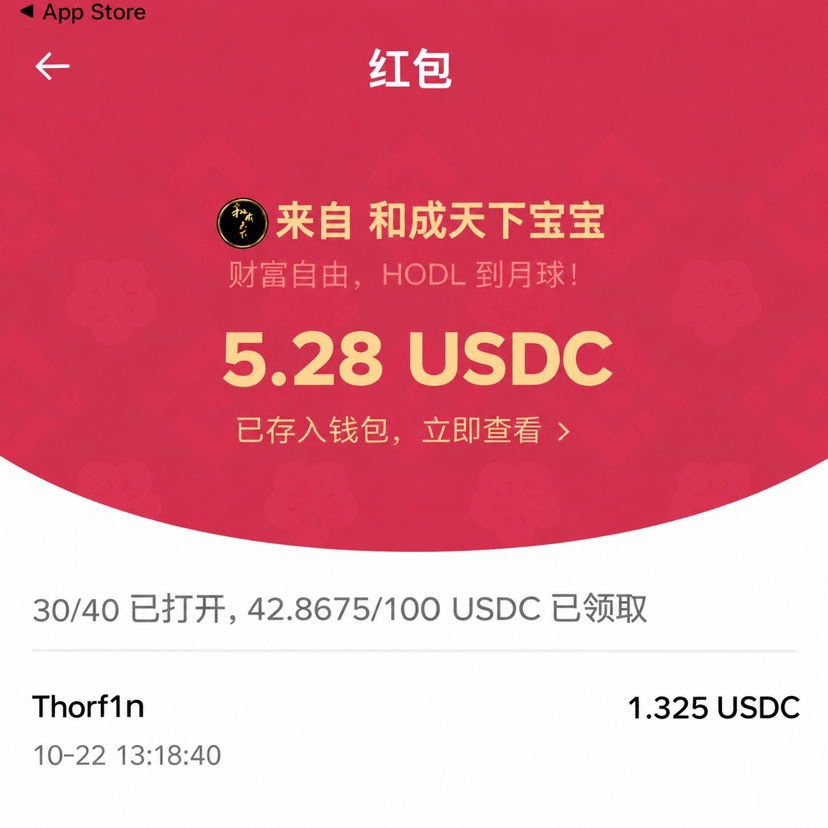
领取红包 👈🧧
Reply to this post: sol
🧧🧧🧧🧧
Join the group chat and send red envelopes every day
$SOL 🧧🌹
Reply to this post: sol
🧧🧧🧧🧧
Join the group chat and send red envelopes every day
$SOL 🧧🌹
Zaitsev-plus1
·
--
$USDT 👉follow please go go go

Moisa16
·
--
Big Red Envelope 🧧

bape社区-菜园儿
·
--
Growth is painful, but we can’t turn away from it. When opportunity comes, seize it! 🤟🤟🤟
May you hold on to your investments and live to see them bloom.
May you stay calm in bear markets, avoid chasing highs in bull markets, and reap rewards over the long term.
May you hold on to your investments and live to see them bloom.
May you stay calm in bear markets, avoid chasing highs in bull markets, and reap rewards over the long term.


Elena神话MUA
·
--
#币安崛起 BINRISE
Setting out from Binance Life, we journey toward Binance’s future and ultimately toward its rise.
This is not a solitary journey, but a shared pursuit by kindred spirits.
The industry has its ups and downs; once the excitement fades, silence returns.
Rooted in consensus and grounded in candor, we resonate across the globe and move steadily forward.
Those who share our path will come from far and wide. Side by side, we’ll witness the growth and brilliance that belong to us all.
Setting out from Binance Life, we journey toward Binance’s future and ultimately toward its rise.
This is not a solitary journey, but a shared pursuit by kindred spirits.
The industry has its ups and downs; once the excitement fades, silence returns.
Rooted in consensus and grounded in candor, we resonate across the globe and move steadily forward.
Those who share our path will come from far and wide. Side by side, we’ll witness the growth and brilliance that belong to us all.


北辰1688
·
--
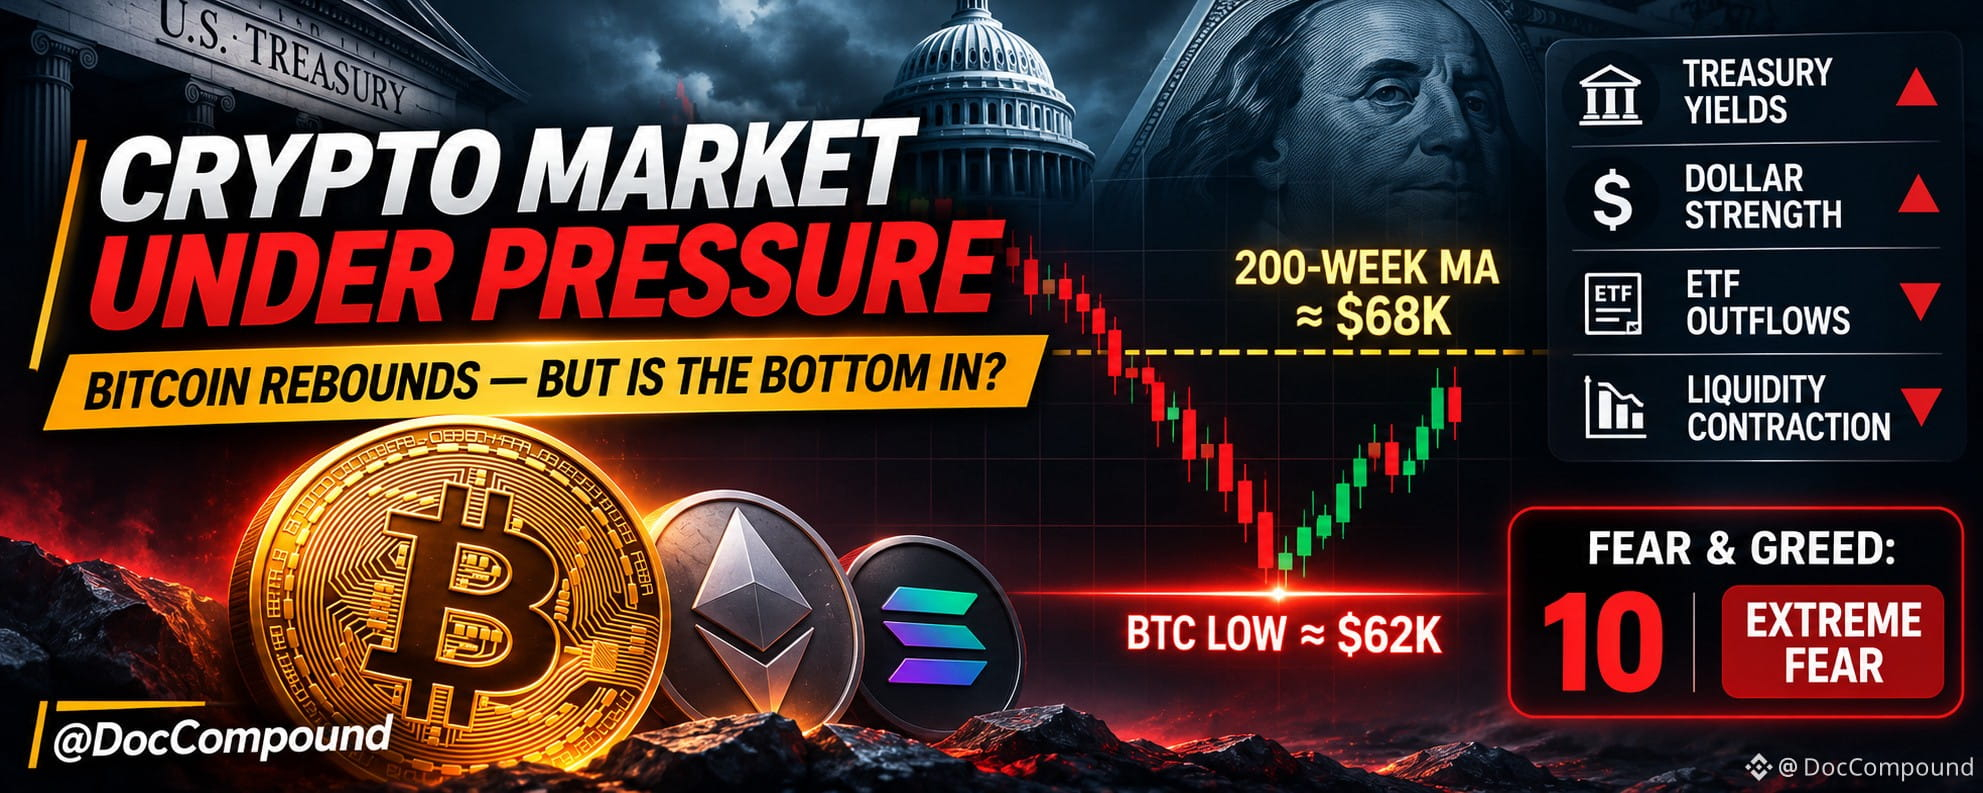
Bullish#本周财报与宏观事件密集,市场再迎波动考验 Good morning, everyone! Follow, share, and claim 🧧🧧🧧$BTC

Quoted content has been removed
Log in to explore more content