
分析师老马
124 Posts

分析师老马
Report
Block User
趋势交易玩家 致力于打造自己的交易体系 谐波交易&价格行为实践者
Occasional Trader
2.6 Years
54 Following
135 Followers
66 Liked
Posts
All
Quotes
·
--
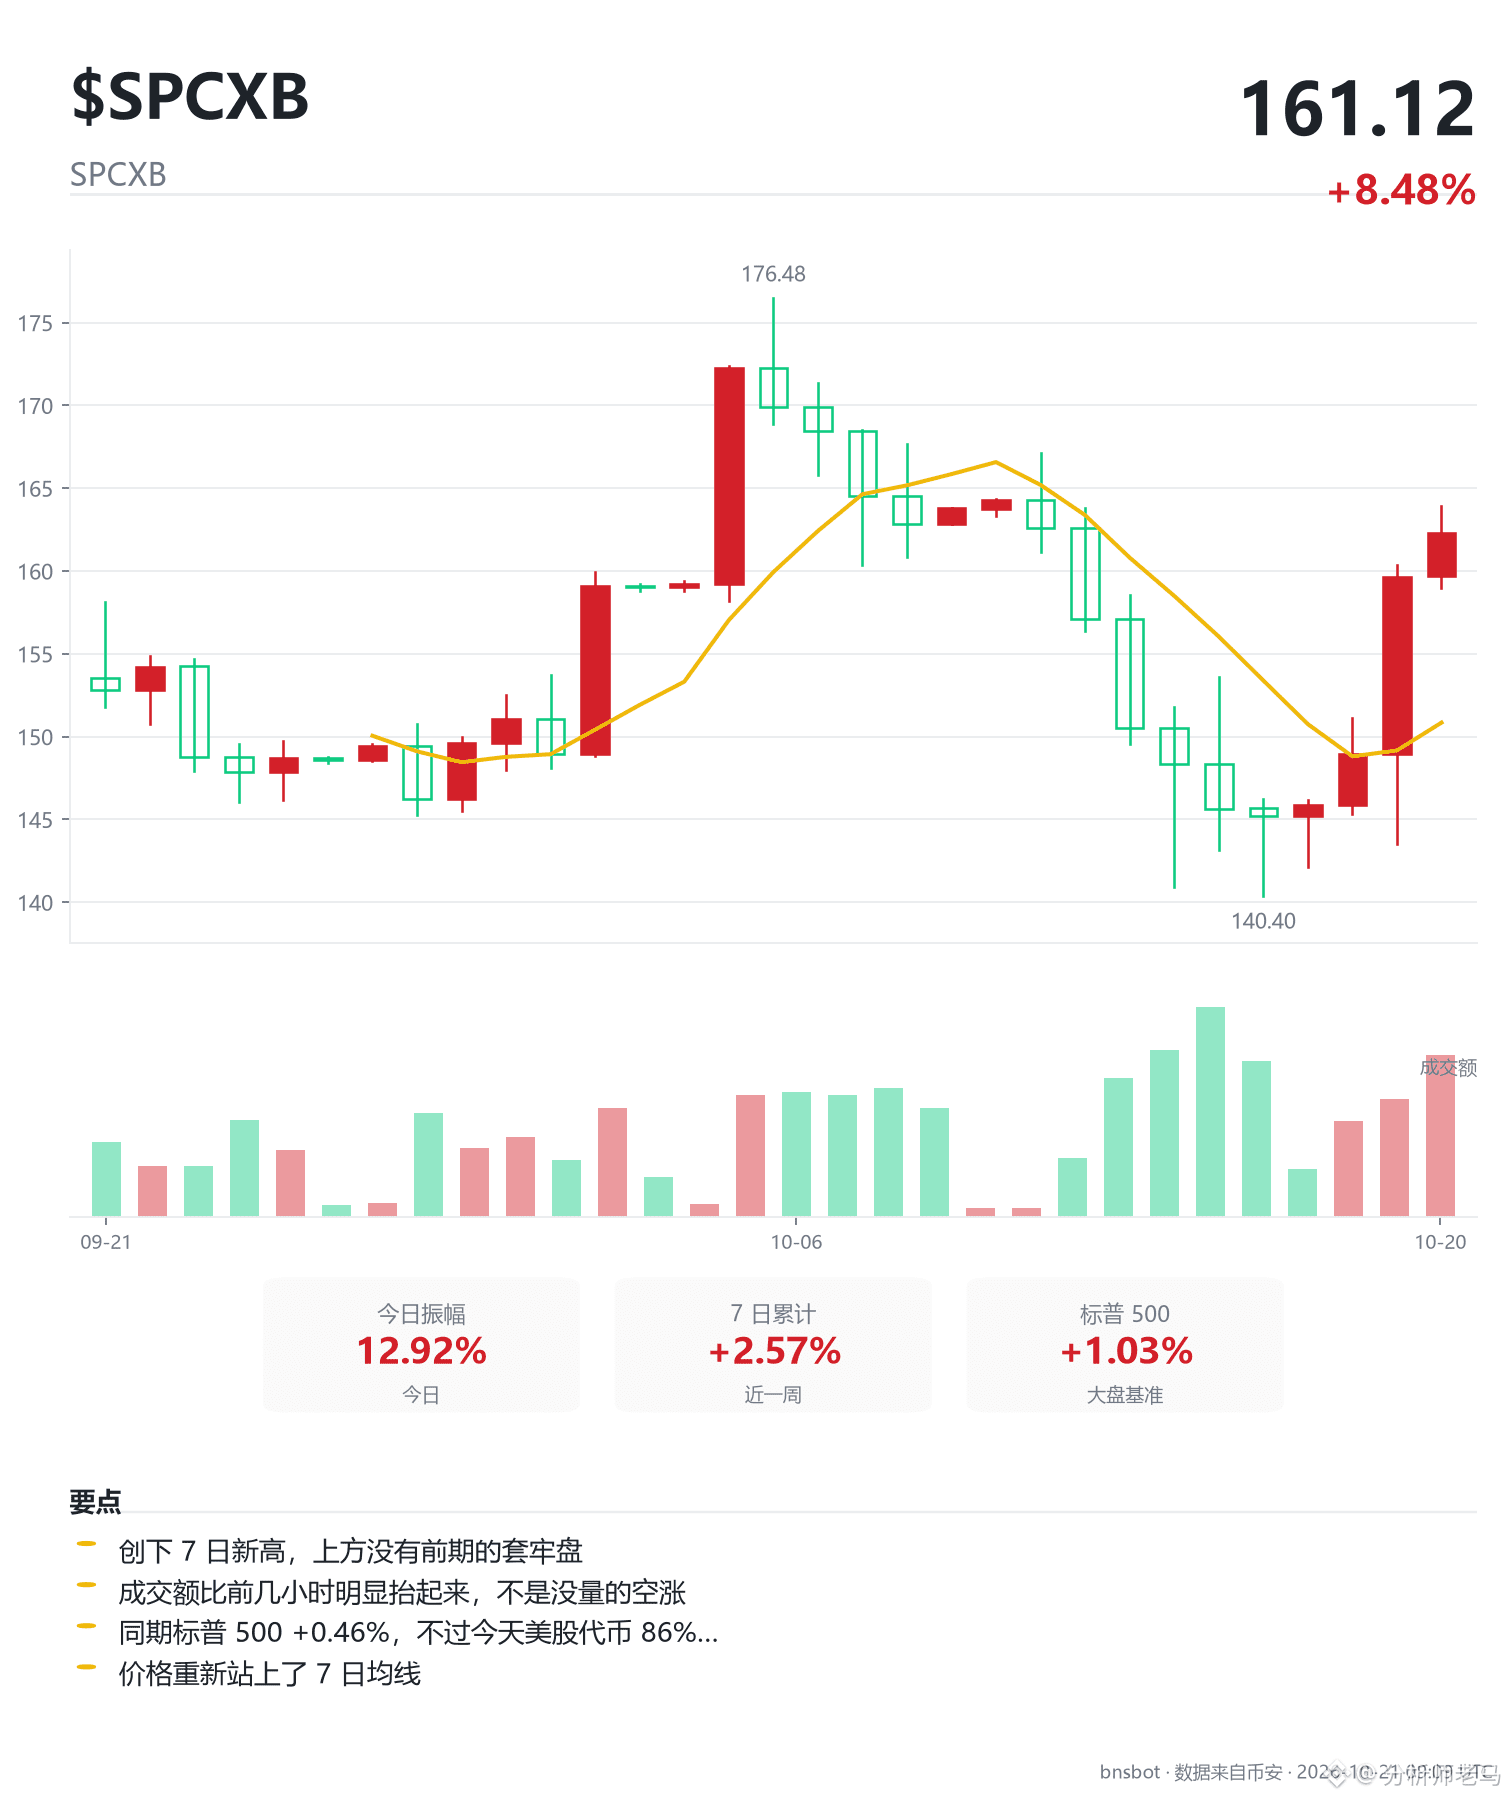
Behind the 10.51% intraday gain: sellers are in more of a hurry, and this SPCXB candle is intriguing
First, relative strength—this is the most important thing to watch today. Over 7 days, SPCXB is up 3.29%, while the benchmark is down 1.08%, a 4.37-point outperformance. Over 30 days, it’s up 9.24% versus the benchmark’s 0.9%, an 8.34-point gap. Rising along with a broad rally isn’t much of an achievement; gaining ground even as the benchmark moves the other way shows that money is flowing this way. That said, the 7-day gain of 3.29% is well below the 30-day gain of 9.24%. The strength is fading, so don’t mistake last month’s performance for the current picture.
But today’s candle looks a little hollow. The price rose 10.51%, while volume was only 0.63 times the recent average—there’s less money coming in, and this isn’t a move backed by a surge of real buying. On the 4-hour chart, the volume ratio did expand to 2.88 times, but that volume came as price retested support at 160.38. Heavy volume on a pullback confirms that selling pressure is real; it shouldn’t be used as evidence of a breakout. The 30-minute RSI is already at 68.5, and the 1-hour RSI is at 76.7, so the short-term picture is hot.
We also need to be clear about the levels. The current price is 162.25, already 8.8% above the 7-day moving average. Chasing at that distance means one pullback could wipe out the paper gains. The first hurdle overhead is the round-number level at 170, just 4.78% away, and it’s also a weekly-chart resistance level, so it carries weight. Beyond that is the swing high at 176.48. Below, the swing low at 160.38 lines up with the weekly 160 level, just 1.15% below the current price. The risk/reward works out favorably: 4.78% upside versus 1.15% downside—risk one to make four, with a clear stop level.
The problem is the stop’s absolute distance. This asset’s average daily volatility is 4.64%; using a three-times multiple puts the stop at 139.66, or 13.92% below the current price—more than the 8% this strategy allows. The weekly trend is up, with a 7.7% gain over the past 8 weeks. For the longer-term trend, it has only been listed for 131 days, so we can’t yet calculate a cost basis over a period of five months or more; we have to fall back to the weekly chart. But the entry level and stop distance don’t line up: following the rules would mean taking on too much risk, so this is a pass.
So the conclusion is: the bias is bullish, but don’t act yet. Wait for a move above 170—that would count as a genuine breakout through the current resistance. If it falls below 139.66, admit the trade thesis was wrong. In between, just watch.
$SPCXB $BTC $SPY
Behind the 10.51% intraday gain: sellers are in more of a hurry, and this SPCXB candle is intriguing
First, relative strength—this is the most important thing to watch today. Over 7 days, SPCXB is up 3.29%, while the benchmark is down 1.08%, a 4.37-point outperformance. Over 30 days, it’s up 9.24% versus the benchmark’s 0.9%, an 8.34-point gap. Rising along with a broad rally isn’t much of an achievement; gaining ground even as the benchmark moves the other way shows that money is flowing this way. That said, the 7-day gain of 3.29% is well below the 30-day gain of 9.24%. The strength is fading, so don’t mistake last month’s performance for the current picture.
But today’s candle looks a little hollow. The price rose 10.51%, while volume was only 0.63 times the recent average—there’s less money coming in, and this isn’t a move backed by a surge of real buying. On the 4-hour chart, the volume ratio did expand to 2.88 times, but that volume came as price retested support at 160.38. Heavy volume on a pullback confirms that selling pressure is real; it shouldn’t be used as evidence of a breakout. The 30-minute RSI is already at 68.5, and the 1-hour RSI is at 76.7, so the short-term picture is hot.
We also need to be clear about the levels. The current price is 162.25, already 8.8% above the 7-day moving average. Chasing at that distance means one pullback could wipe out the paper gains. The first hurdle overhead is the round-number level at 170, just 4.78% away, and it’s also a weekly-chart resistance level, so it carries weight. Beyond that is the swing high at 176.48. Below, the swing low at 160.38 lines up with the weekly 160 level, just 1.15% below the current price. The risk/reward works out favorably: 4.78% upside versus 1.15% downside—risk one to make four, with a clear stop level.
The problem is the stop’s absolute distance. This asset’s average daily volatility is 4.64%; using a three-times multiple puts the stop at 139.66, or 13.92% below the current price—more than the 8% this strategy allows. The weekly trend is up, with a 7.7% gain over the past 8 weeks. For the longer-term trend, it has only been listed for 131 days, so we can’t yet calculate a cost basis over a period of five months or more; we have to fall back to the weekly chart. But the entry level and stop distance don’t line up: following the rules would mean taking on too much risk, so this is a pass.
So the conclusion is: the bias is bullish, but don’t act yet. Wait for a move above 170—that would count as a genuine breakout through the current resistance. If it falls below 139.66, admit the trade thesis was wrong. In between, just watch.
$SPCXB $BTC $SPY
First, relative strength—this is the most important thing to watch today. Over 7 days, SPCXB is up 3.29%, while the benchmark is down 1.08%, a 4.37-point outperformance. Over 30 days, it’s up 9.24% versus the benchmark’s 0.9%, an 8.34-point gap. Rising along with a broad rally isn’t much of an achievement; gaining ground even as the benchmark moves the other way shows that money is flowing this way. That said, the 7-day gain of 3.29% is well below the 30-day gain of 9.24%. The strength is fading, so don’t mistake last month’s performance for the current picture.
But today’s candle looks a little hollow. The price rose 10.51%, while volume was only 0.63 times the recent average—there’s less money coming in, and this isn’t a move backed by a surge of real buying. On the 4-hour chart, the volume ratio did expand to 2.88 times, but that volume came as price retested support at 160.38. Heavy volume on a pullback confirms that selling pressure is real; it shouldn’t be used as evidence of a breakout. The 30-minute RSI is already at 68.5, and the 1-hour RSI is at 76.7, so the short-term picture is hot.
We also need to be clear about the levels. The current price is 162.25, already 8.8% above the 7-day moving average. Chasing at that distance means one pullback could wipe out the paper gains. The first hurdle overhead is the round-number level at 170, just 4.78% away, and it’s also a weekly-chart resistance level, so it carries weight. Beyond that is the swing high at 176.48. Below, the swing low at 160.38 lines up with the weekly 160 level, just 1.15% below the current price. The risk/reward works out favorably: 4.78% upside versus 1.15% downside—risk one to make four, with a clear stop level.
The problem is the stop’s absolute distance. This asset’s average daily volatility is 4.64%; using a three-times multiple puts the stop at 139.66, or 13.92% below the current price—more than the 8% this strategy allows. The weekly trend is up, with a 7.7% gain over the past 8 weeks. For the longer-term trend, it has only been listed for 131 days, so we can’t yet calculate a cost basis over a period of five months or more; we have to fall back to the weekly chart. But the entry level and stop distance don’t line up: following the rules would mean taking on too much risk, so this is a pass.
So the conclusion is: the bias is bullish, but don’t act yet. Wait for a move above 170—that would count as a genuine breakout through the current resistance. If it falls below 139.66, admit the trade thesis was wrong. In between, just watch.
$SPCXB $BTC $SPY
3
247
·
--
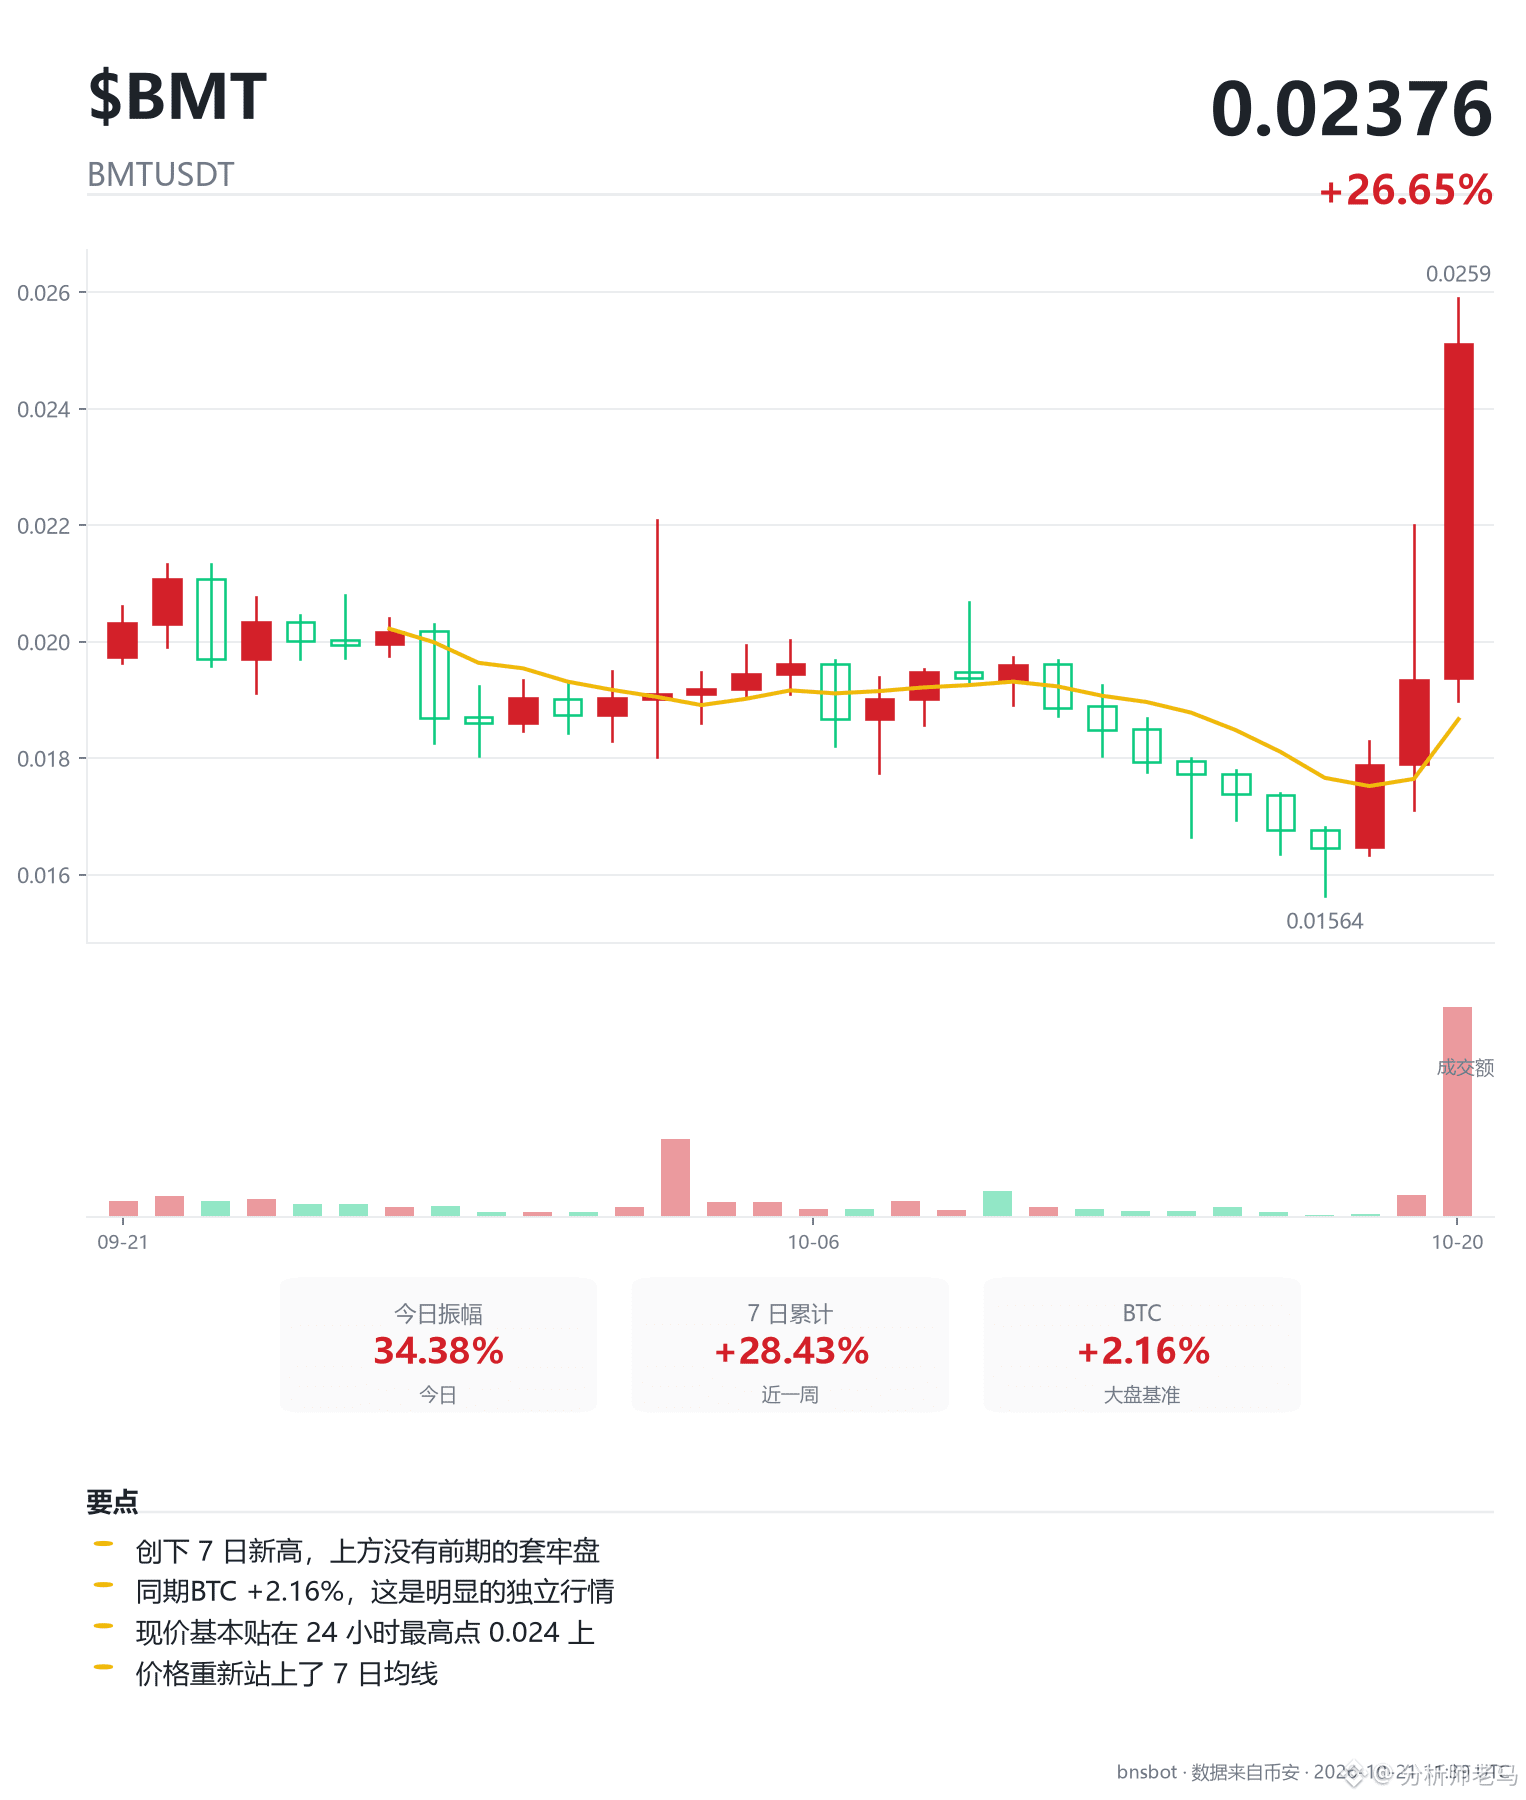
Funding rate annualized at -488.1% — why are shorts in $BMT paying up?
Let’s put that number into perspective: short sellers have to pay nearly 4.9 times their principal in funding fees over a year. Even if they hold for just one day, they’re paying a toll for this trade. Longs, on the other hand, are getting paid. So the split—with 60.2% of accounts long and 39.8% short—isn’t just sentiment; real money is leaning one way.
And money really is flowing in. There’s 4.08 million USDT tied up in the contracts—not a huge market, but open interest has risen 78% in seven days and another 20.66% in the past four hours. Crucially, the price has also risen 36% over the same period. Rising open interest alongside a rising price points to new longs entering, not a hollow rally fueled by short covering. This rally has real support behind it.
But even with that support, the price is now at an awkward level to trade.
The current price is 0.02523, just 3.05% below the first resistance at 0.026, while its average daily move is 6%. In other words, there’s less than half an ATR of upside. The risk/reward ratio looks like 3.35, but there isn’t even room to place a stop-loss. Even closer is the round-number level at 0.025 below, just 0.9% away. The room on either side has been squeezed into a narrow gap. At a time like this, you’re likely to get stopped out at either end.
Look at its recent price action: just a day ago, it surged above 0.02068, spiked to 0.022, then fell back to close at 0.01935—a textbook false breakout. Anyone who bought above 0.02068 is still underwater. The price has climbed back up now, but this same level has already caught traders out once.
The price is also extremely stretched: 43% above its 7-day average and 34.6% above its 25-day average. This isn’t just “strong price action”—it’s “too far from cost basis.” A single pullback could give back a chunk of those gains. Meanwhile, the weekly trend, longer-term cost basis, and 3-day trend are all still pointing up, while the daily moving averages are bearishly aligned. The bigger picture is bullish; in the short term, this is a consolidation after a sharp rally, not a trend reversal.
So the conclusion is clear: the bias is bullish, but it’s not a good time to buy. The first target offers only 3.05% upside, leaving little after fees and slippage. You’d need at least 4% upside for a trade to be worthwhile. If you do trade it, wait for a high-volume move that holds above 0.026—that would confirm a genuine breakout and open up more room. If it falls below 0.02067, admit the trade was wrong. That’s a three-ATR level, not an arbitrary stop.
$BMT $BNB
Funding rate annualized at -488.1% — why are shorts in $BMT paying up?
Let’s put that number into perspective: short sellers have to pay nearly 4.9 times their principal in funding fees over a year. Even if they hold for just one day, they’re paying a toll for this trade. Longs, on the other hand, are getting paid. So the split—with 60.2% of accounts long and 39.8% short—isn’t just sentiment; real money is leaning one way.
And money really is flowing in. There’s 4.08 million USDT tied up in the contracts—not a huge market, but open interest has risen 78% in seven days and another 20.66% in the past four hours. Crucially, the price has also risen 36% over the same period. Rising open interest alongside a rising price points to new longs entering, not a hollow rally fueled by short covering. This rally has real support behind it.
But even with that support, the price is now at an awkward level to trade.
The current price is 0.02523, just 3.05% below the first resistance at 0.026, while its average daily move is 6%. In other words, there’s less than half an ATR of upside. The risk/reward ratio looks like 3.35, but there isn’t even room to place a stop-loss. Even closer is the round-number level at 0.025 below, just 0.9% away. The room on either side has been squeezed into a narrow gap. At a time like this, you’re likely to get stopped out at either end.
Look at its recent price action: just a day ago, it surged above 0.02068, spiked to 0.022, then fell back to close at 0.01935—a textbook false breakout. Anyone who bought above 0.02068 is still underwater. The price has climbed back up now, but this same level has already caught traders out once.
The price is also extremely stretched: 43% above its 7-day average and 34.6% above its 25-day average. This isn’t just “strong price action”—it’s “too far from cost basis.” A single pullback could give back a chunk of those gains. Meanwhile, the weekly trend, longer-term cost basis, and 3-day trend are all still pointing up, while the daily moving averages are bearishly aligned. The bigger picture is bullish; in the short term, this is a consolidation after a sharp rally, not a trend reversal.
So the conclusion is clear: the bias is bullish, but it’s not a good time to buy. The first target offers only 3.05% upside, leaving little after fees and slippage. You’d need at least 4% upside for a trade to be worthwhile. If you do trade it, wait for a high-volume move that holds above 0.026—that would confirm a genuine breakout and open up more room. If it falls below 0.02067, admit the trade was wrong. That’s a three-ATR level, not an arbitrary stop.
$BMT $BNB
Let’s put that number into perspective: short sellers have to pay nearly 4.9 times their principal in funding fees over a year. Even if they hold for just one day, they’re paying a toll for this trade. Longs, on the other hand, are getting paid. So the split—with 60.2% of accounts long and 39.8% short—isn’t just sentiment; real money is leaning one way.
And money really is flowing in. There’s 4.08 million USDT tied up in the contracts—not a huge market, but open interest has risen 78% in seven days and another 20.66% in the past four hours. Crucially, the price has also risen 36% over the same period. Rising open interest alongside a rising price points to new longs entering, not a hollow rally fueled by short covering. This rally has real support behind it.
But even with that support, the price is now at an awkward level to trade.
The current price is 0.02523, just 3.05% below the first resistance at 0.026, while its average daily move is 6%. In other words, there’s less than half an ATR of upside. The risk/reward ratio looks like 3.35, but there isn’t even room to place a stop-loss. Even closer is the round-number level at 0.025 below, just 0.9% away. The room on either side has been squeezed into a narrow gap. At a time like this, you’re likely to get stopped out at either end.
Look at its recent price action: just a day ago, it surged above 0.02068, spiked to 0.022, then fell back to close at 0.01935—a textbook false breakout. Anyone who bought above 0.02068 is still underwater. The price has climbed back up now, but this same level has already caught traders out once.
The price is also extremely stretched: 43% above its 7-day average and 34.6% above its 25-day average. This isn’t just “strong price action”—it’s “too far from cost basis.” A single pullback could give back a chunk of those gains. Meanwhile, the weekly trend, longer-term cost basis, and 3-day trend are all still pointing up, while the daily moving averages are bearishly aligned. The bigger picture is bullish; in the short term, this is a consolidation after a sharp rally, not a trend reversal.
So the conclusion is clear: the bias is bullish, but it’s not a good time to buy. The first target offers only 3.05% upside, leaving little after fees and slippage. You’d need at least 4% upside for a trade to be worthwhile. If you do trade it, wait for a high-volume move that holds above 0.026—that would confirm a genuine breakout and open up more room. If it falls below 0.02067, admit the trade was wrong. That’s a three-ATR level, not an arbitrary stop.
$BMT $BNB
311
·
--
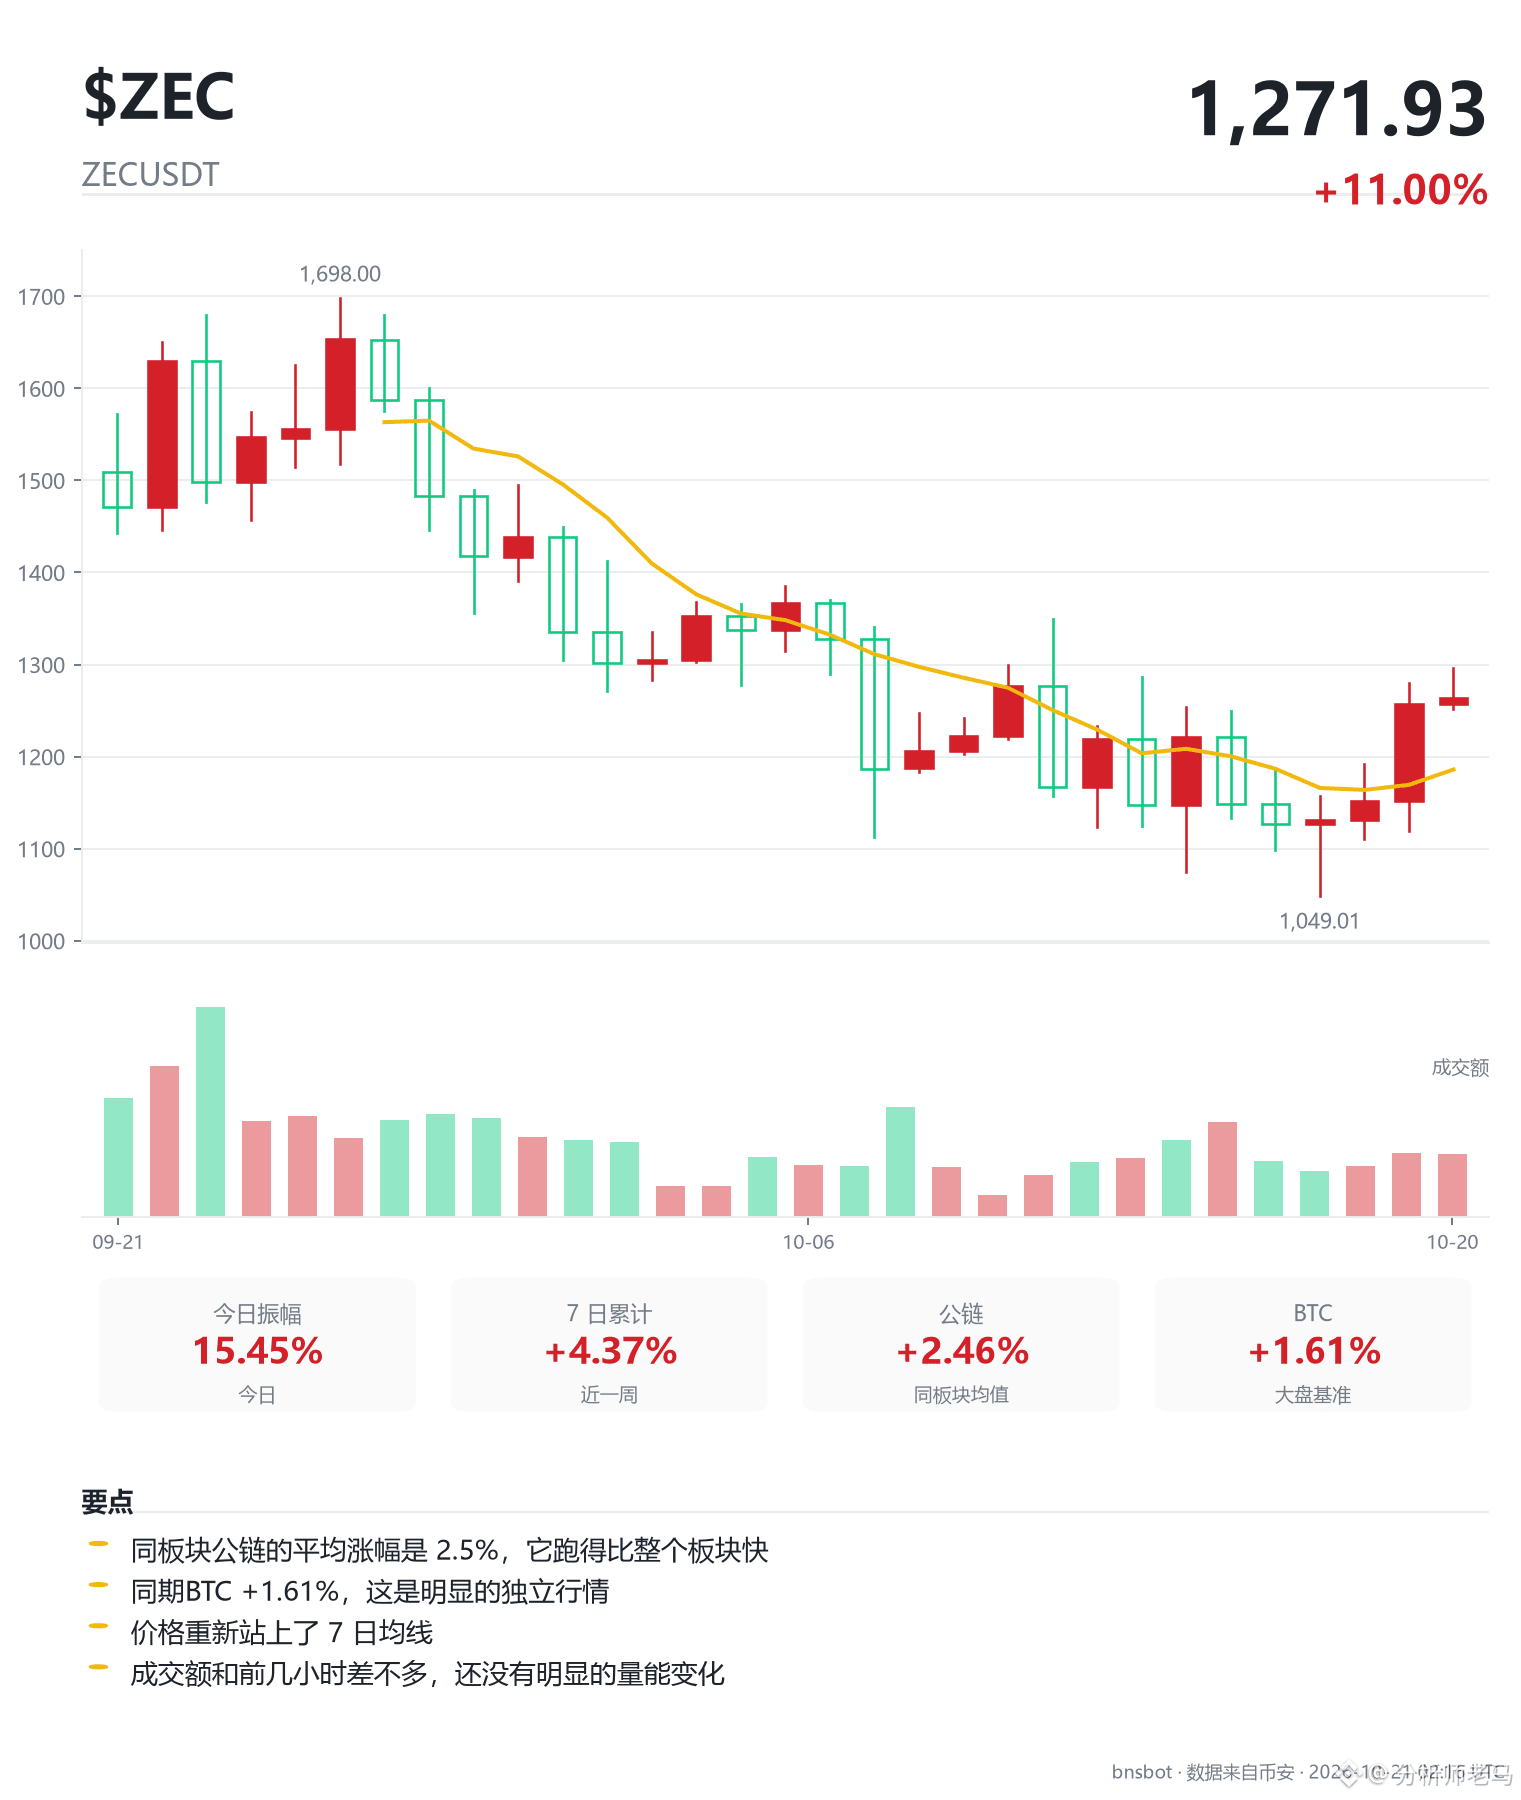
$ZEC: Moving averages are tangled, direction is unclear — entering now is a gamble, not a trade
First, look at the money. There are 598 million USDT tied up in futures—a massive amount. Over the past 7 days, open interest has risen 6.16%, while the price climbed 3.62% over the same period. Rising open interest alongside rising prices means new longs are entering; this rally has money backing it, rather than being a false pump caused by short covering. The funding rate is still negative at -4.7%, so longs don’t have to pay—they actually get paid. Sounds pretty favorable, but don’t rush to place a trade based on that today.
The problem is the price’s position. The current price is 1262.76, just 0.47% below the overhead resistance at 1268.69, while its normal daily volatility is 9.69%. It would take a 0.47% move up to reach resistance, but a 4.97% drop to reach support at 1200. That gives a risk-reward ratio of just 0.09. Betting a full day’s worth of volatility on a breakout of less than half a percent doesn’t add up.
The longer-term picture is still intact: the current price is 68% above the average cost of 751 over the past 5 to 6 months, and the weekly chart is up 32.4% over eight weeks. The broader trend is upward. But on the daily chart, price is weaving back and forth between the moving averages. On the 1h and 30m charts, it’s already above the moving averages, and the RSI is 67, so the short-term picture is a little overheated. Chasing the move now means buying at the most expensive point before a breakout has even been confirmed.
And the quality of this rally isn’t particularly strong. The aggressive buy ratio is 0.508 over 7 days and 0.51 over 24 hours—basically a 50/50 split, with nobody rushing to sweep the order book. The volume ratio is 1.32: volume is up, but not dramatically. So the price has risen, but momentum hasn’t kept up. It looks more like price is grinding below resistance.
If you’re truly bullish, wait for it to break above 1296.02 on strong volume and hold there. That would mean it has genuinely cleared the wall at 1268.69. Until it holds above that level, the bias is bullish, but keep your hands off the trade. A drop below 895.59 would be the point at which this thesis is completely invalidated; that level is 29% below the current price, leaving plenty of room for price to swing around in between.
$ZEC $BTC
$ZEC : Moving averages are tangled, direction is unclear — entering now is a gamble, not a trade
First, look at the money. There are 598 million USDT tied up in futures—a massive amount. Over the past 7 days, open interest has risen 6.16%, while the price climbed 3.62% over the same period. Rising open interest alongside rising prices means new longs are entering; this rally has money backing it, rather than being a false pump caused by short covering. The funding rate is still negative at -4.7%, so longs don’t have to pay—they actually get paid. Sounds pretty favorable, but don’t rush to place a trade based on that today.
The problem is the price’s position. The current price is 1262.76, just 0.47% below the overhead resistance at 1268.69, while its normal daily volatility is 9.69%. It would take a 0.47% move up to reach resistance, but a 4.97% drop to reach support at 1200. That gives a risk-reward ratio of just 0.09. Betting a full day’s worth of volatility on a breakout of less than half a percent doesn’t add up.
The longer-term picture is still intact: the current price is 68% above the average cost of 751 over the past 5 to 6 months, and the weekly chart is up 32.4% over eight weeks. The broader trend is upward. But on the daily chart, price is weaving back and forth between the moving averages. On the 1h and 30m charts, it’s already above the moving averages, and the RSI is 67, so the short-term picture is a little overheated. Chasing the move now means buying at the most expensive point before a breakout has even been confirmed.
And the quality of this rally isn’t particularly strong. The aggressive buy ratio is 0.508 over 7 days and 0.51 over 24 hours—basically a 50/50 split, with nobody rushing to sweep the order book. The volume ratio is 1.32: volume is up, but not dramatically. So the price has risen, but momentum hasn’t kept up. It looks more like price is grinding below resistance.
If you’re truly bullish, wait for it to break above 1296.02 on strong volume and hold there. That would mean it has genuinely cleared the wall at 1268.69. Until it holds above that level, the bias is bullish, but keep your hands off the trade. A drop below 895.59 would be the point at which this thesis is completely invalidated; that level is 29% below the current price, leaving plenty of room for price to swing around in between.
$ZEC $BTC
First, look at the money. There are 598 million USDT tied up in futures—a massive amount. Over the past 7 days, open interest has risen 6.16%, while the price climbed 3.62% over the same period. Rising open interest alongside rising prices means new longs are entering; this rally has money backing it, rather than being a false pump caused by short covering. The funding rate is still negative at -4.7%, so longs don’t have to pay—they actually get paid. Sounds pretty favorable, but don’t rush to place a trade based on that today.
The problem is the price’s position. The current price is 1262.76, just 0.47% below the overhead resistance at 1268.69, while its normal daily volatility is 9.69%. It would take a 0.47% move up to reach resistance, but a 4.97% drop to reach support at 1200. That gives a risk-reward ratio of just 0.09. Betting a full day’s worth of volatility on a breakout of less than half a percent doesn’t add up.
The longer-term picture is still intact: the current price is 68% above the average cost of 751 over the past 5 to 6 months, and the weekly chart is up 32.4% over eight weeks. The broader trend is upward. But on the daily chart, price is weaving back and forth between the moving averages. On the 1h and 30m charts, it’s already above the moving averages, and the RSI is 67, so the short-term picture is a little overheated. Chasing the move now means buying at the most expensive point before a breakout has even been confirmed.
And the quality of this rally isn’t particularly strong. The aggressive buy ratio is 0.508 over 7 days and 0.51 over 24 hours—basically a 50/50 split, with nobody rushing to sweep the order book. The volume ratio is 1.32: volume is up, but not dramatically. So the price has risen, but momentum hasn’t kept up. It looks more like price is grinding below resistance.
If you’re truly bullish, wait for it to break above 1296.02 on strong volume and hold there. That would mean it has genuinely cleared the wall at 1268.69. Until it holds above that level, the bias is bullish, but keep your hands off the trade. A drop below 895.59 would be the point at which this thesis is completely invalidated; that level is 29% below the current price, leaving plenty of room for price to swing around in between.
$ZEC $BTC
58
·
--
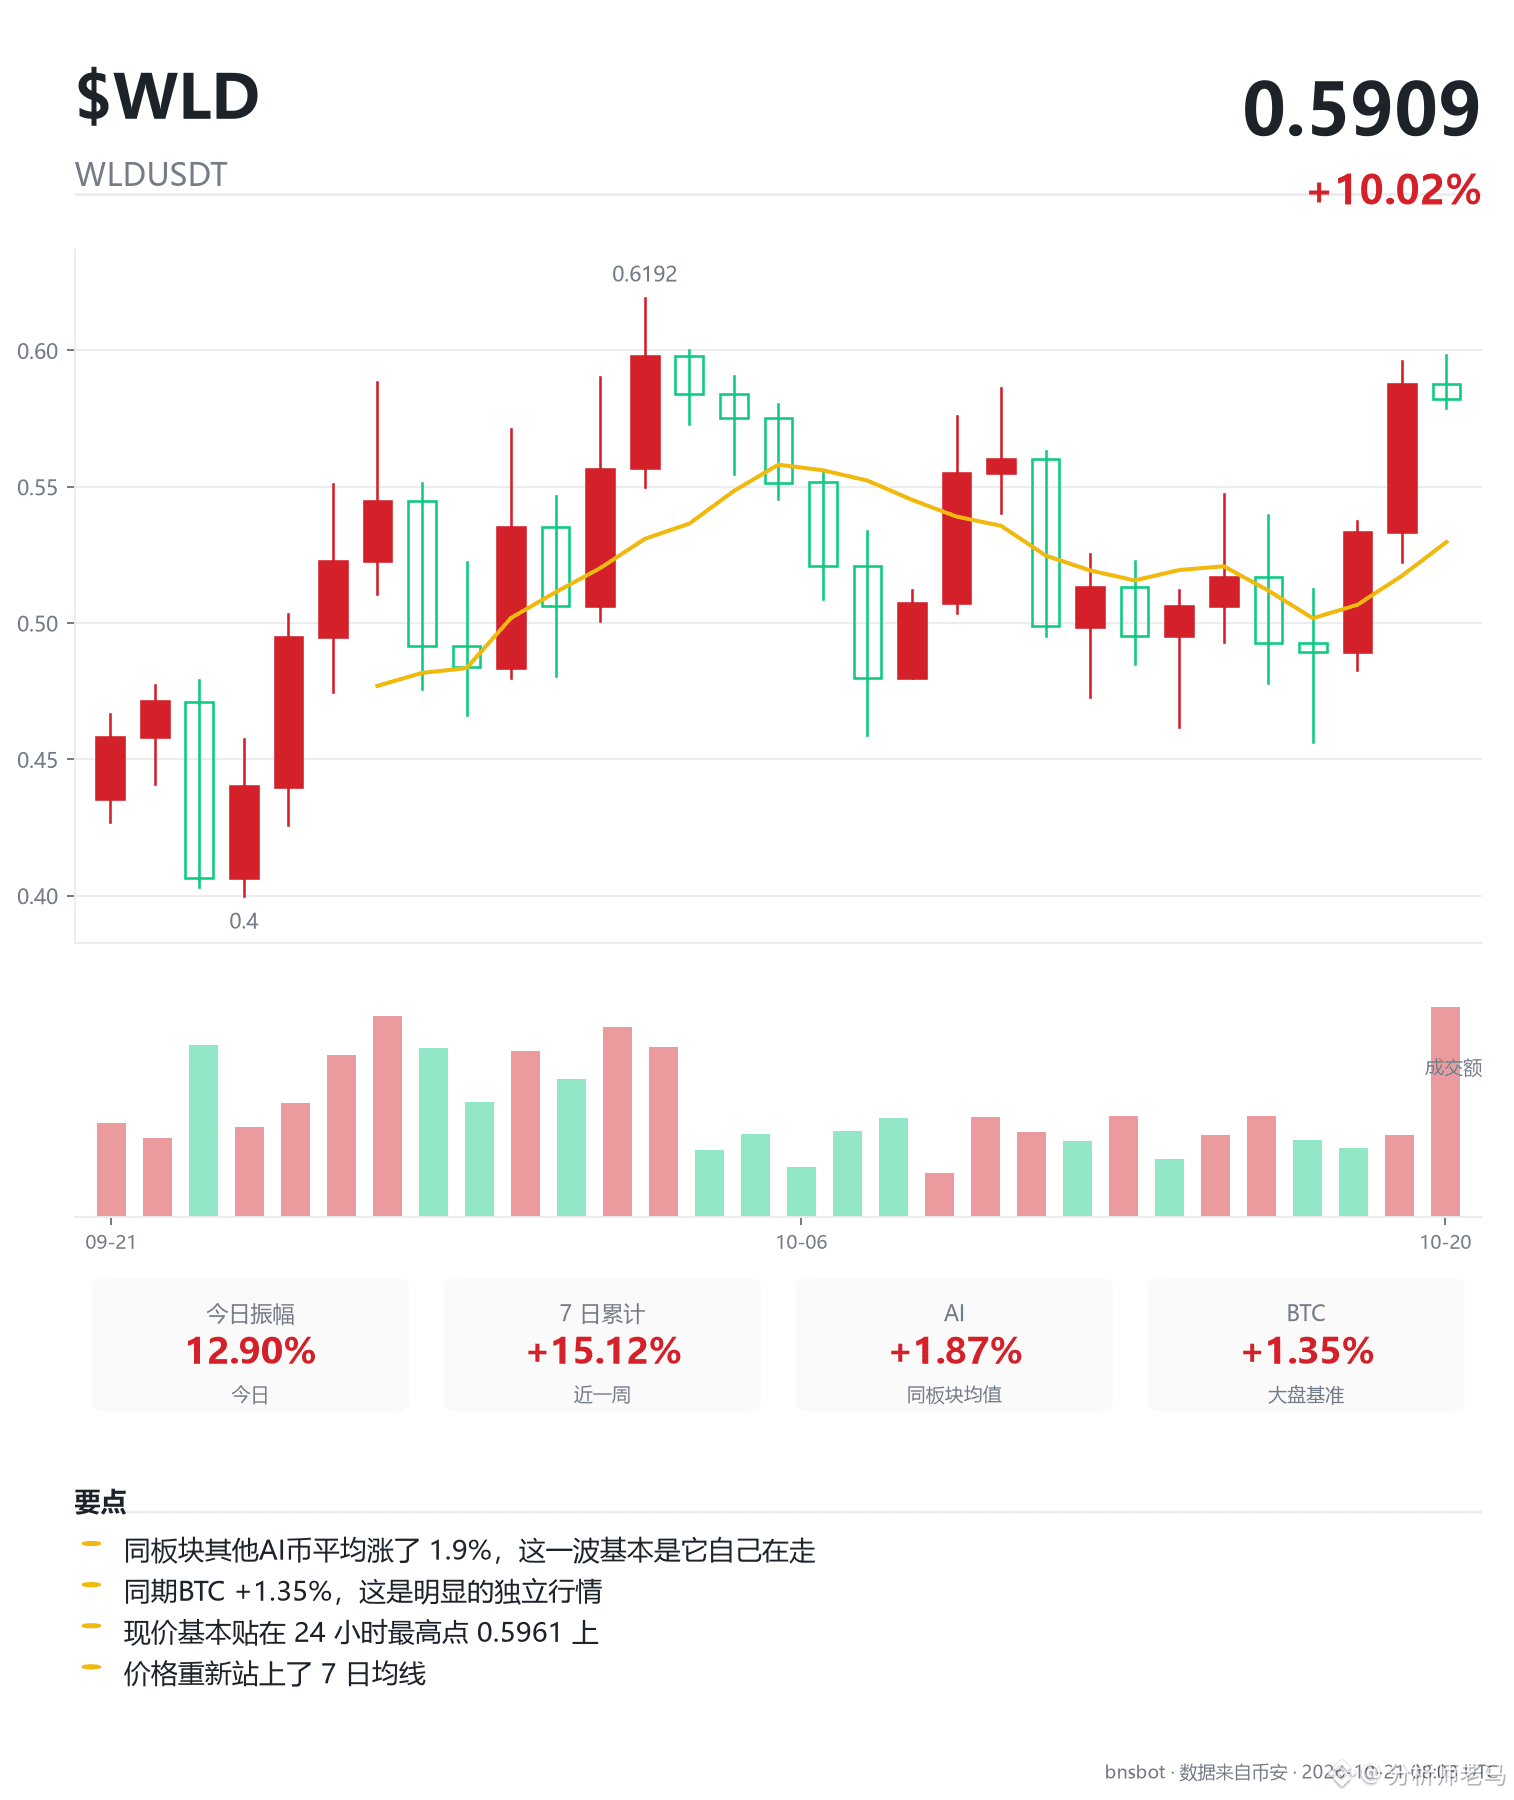
$WLD has a bullish bias, but is this a good entry point?
First, the levels: the current price is 0.583. The nearest resistance above is 0.5873, just 0.74% away, while support below at 0.58 is only 0.51% away. Its normal daily volatility is 9.98%—betting a full day’s volatility for less than 1% of upside gives you a risk/reward ratio of just 0.02. Chasing it here isn’t trading the trend; it’s providing exit liquidity for someone else.
The trend itself is still intact. The current price is 42% above the average cost over the past five to six months, the weekly chart is up 19.9% over the past eight weeks, and the 4h, 12h, and 3d charts are all aligned bullishly. All four timeframes point in the same direction, so there’s no need to guess the trend. But in terms of timing, the price is already 12.7% above its 7-day average. It’s overheated in the short term, and one pullback could shake out anyone who chased the rally.
The bigger concern is momentum. It’s up 8.5% today, but volume is only 0.51 times normal. Price is rising while volume is falling, so there’s less money behind the move. Near resistance at 0.5873, the 4h volume ratio is only 0.96. Pushing into resistance on declining volume raises the odds of a false breakout. Looking back, just three candles ago it dipped below 0.462 and then recovered, forming a false breakdown at the bottom.
So yes, the bias is bullish—but don’t enter just yet. Wait for it to break above 0.5873 on strong volume and hold there before considering further upside. The second target is 0.6, and the third is 0.6192. If it falls back toward 0.55, the risk/reward may actually be more attractive—the price level with the heaviest trading volume is right there at 0.514. Only admit you’re wrong if it breaks below 0.408. That’s three times the daily volatility away, so don’t set your stop-loss tighter than a day’s normal range.
$WLD
$WLD has a bullish bias, but is this a good entry point?
First, the levels: the current price is 0.583. The nearest resistance above is 0.5873, just 0.74% away, while support below at 0.58 is only 0.51% away. Its normal daily volatility is 9.98%—betting a full day’s volatility for less than 1% of upside gives you a risk/reward ratio of just 0.02. Chasing it here isn’t trading the trend; it’s providing exit liquidity for someone else.
The trend itself is still intact. The current price is 42% above the average cost over the past five to six months, the weekly chart is up 19.9% over the past eight weeks, and the 4h, 12h, and 3d charts are all aligned bullishly. All four timeframes point in the same direction, so there’s no need to guess the trend. But in terms of timing, the price is already 12.7% above its 7-day average. It’s overheated in the short term, and one pullback could shake out anyone who chased the rally.
The bigger concern is momentum. It’s up 8.5% today, but volume is only 0.51 times normal. Price is rising while volume is falling, so there’s less money behind the move. Near resistance at 0.5873, the 4h volume ratio is only 0.96. Pushing into resistance on declining volume raises the odds of a false breakout. Looking back, just three candles ago it dipped below 0.462 and then recovered, forming a false breakdown at the bottom.
So yes, the bias is bullish—but don’t enter just yet. Wait for it to break above 0.5873 on strong volume and hold there before considering further upside. The second target is 0.6, and the third is 0.6192. If it falls back toward 0.55, the risk/reward may actually be more attractive—the price level with the heaviest trading volume is right there at 0.514. Only admit you’re wrong if it breaks below 0.408. That’s three times the daily volatility away, so don’t set your stop-loss tighter than a day’s normal range.
$WLD
First, the levels: the current price is 0.583. The nearest resistance above is 0.5873, just 0.74% away, while support below at 0.58 is only 0.51% away. Its normal daily volatility is 9.98%—betting a full day’s volatility for less than 1% of upside gives you a risk/reward ratio of just 0.02. Chasing it here isn’t trading the trend; it’s providing exit liquidity for someone else.
The trend itself is still intact. The current price is 42% above the average cost over the past five to six months, the weekly chart is up 19.9% over the past eight weeks, and the 4h, 12h, and 3d charts are all aligned bullishly. All four timeframes point in the same direction, so there’s no need to guess the trend. But in terms of timing, the price is already 12.7% above its 7-day average. It’s overheated in the short term, and one pullback could shake out anyone who chased the rally.
The bigger concern is momentum. It’s up 8.5% today, but volume is only 0.51 times normal. Price is rising while volume is falling, so there’s less money behind the move. Near resistance at 0.5873, the 4h volume ratio is only 0.96. Pushing into resistance on declining volume raises the odds of a false breakout. Looking back, just three candles ago it dipped below 0.462 and then recovered, forming a false breakdown at the bottom.
So yes, the bias is bullish—but don’t enter just yet. Wait for it to break above 0.5873 on strong volume and hold there before considering further upside. The second target is 0.6, and the third is 0.6192. If it falls back toward 0.55, the risk/reward may actually be more attractive—the price level with the heaviest trading volume is right there at 0.514. Only admit you’re wrong if it breaks below 0.408. That’s three times the daily volatility away, so don’t set your stop-loss tighter than a day’s normal range.
$WLD
376
·
--
The most striking thing about NEAR today isn’t that it fell 5.16%, but that even as it fell this far, money kept flowing into short positions in the futures market. Open interest rose 2.14% over the past 7 days, while the price fell 7.6% over the same period, with no increase in volume—this is new shorts entering, not old longs exiting. There are 249 million USDT tied up in futures, a substantial amount, but the modest increase over 7 days suggests trend-following capital hasn’t really arrived yet. So this decline may not be over.
But it wouldn’t be right to say the trend has reversed. The current price is 4.705, which is 88% above the average cost of 2.5 over the past 5–6 months. Both MA144 and MA169 are providing support below, and this cost band itself is moving upward. The weekly chart is up 148.8% over the past 8 weeks, so the direction is upward. The long-term trend sets the direction, and the short-term trend sets the pace—the broader trend still favors the bulls; this current move is a pullback, not a reversal.
The problem is the pace. The 1h and 4h charts are both bearishly aligned, with price below the moving averages. On the 4h chart, price is still 4.62% below the medium-term cost level. The daily moving averages are tangled; the price fell 10.6% today, and the volume ratio is only 0.55, meaning it’s a low-volume decline. The direction on the 12h and 3d charts is unclear. The 3d moving averages are still bullishly aligned, but price is already 40.27% above the cost level—an extreme deviation. At this point, both bulls and bears are in a tough spot.
What really makes it hard to act is the price level. The first resistance overhead is the round-number level of 4.8, just 2.02% above the current price. The first support below is 4.555, 3.19% away. A normal day’s price swing is 12.37%—betting on a 2.02% breakout using a full day’s range gives a reward-to-risk ratio of just 0.63, with upside of less than a quarter of a day’s typical movement. It’s like standing with your back against the wall.
More concerning, 4.8 has just seen a false breakout. Price surged to 5.595, briefly spiked to 6 intraday, then pulled back, closing at 5.093. Anyone who chased the breakout is now trapped above. And during that move, price climbed from 5.54 to 6 while RSI fell from 65 to 56—a bearish divergence, showing that the upward momentum was fading. A divergence doesn’t mean a drop is imminent, though; it only counts once price itself breaks down.
$NEAR
The most striking thing about NEAR today isn’t that it fell 5.16%, but that even as it fell this far, money kept flowing into short positions in the futures market. Open interest rose 2.14% over the past 7 days, while the price fell 7.6% over the same period, with no increase in volume—this is new shorts entering, not old longs exiting. There are 249 million USDT tied up in futures, a substantial amount, but the modest increase over 7 days suggests trend-following capital hasn’t really arrived yet. So this decline may not be over.
But it wouldn’t be right to say the trend has reversed. The current price is 4.705, which is 88% above the average cost of 2.5 over the past 5–6 months. Both MA144 and MA169 are providing support below, and this cost band itself is moving upward. The weekly chart is up 148.8% over the past 8 weeks, so the direction is upward. The long-term trend sets the direction, and the short-term trend sets the pace—the broader trend still favors the bulls; this current move is a pullback, not a reversal.
The problem is the pace. The 1h and 4h charts are both bearishly aligned, with price below the moving averages. On the 4h chart, price is still 4.62% below the medium-term cost level. The daily moving averages are tangled; the price fell 10.6% today, and the volume ratio is only 0.55, meaning it’s a low-volume decline. The direction on the 12h and 3d charts is unclear. The 3d moving averages are still bullishly aligned, but price is already 40.27% above the cost level—an extreme deviation. At this point, both bulls and bears are in a tough spot.
What really makes it hard to act is the price level. The first resistance overhead is the round-number level of 4.8, just 2.02% above the current price. The first support below is 4.555, 3.19% away. A normal day’s price swing is 12.37%—betting on a 2.02% breakout using a full day’s range gives a reward-to-risk ratio of just 0.63, with upside of less than a quarter of a day’s typical movement. It’s like standing with your back against the wall.
More concerning, 4.8 has just seen a false breakout. Price surged to 5.595, briefly spiked to 6 intraday, then pulled back, closing at 5.093. Anyone who chased the breakout is now trapped above. And during that move, price climbed from 5.54 to 6 while RSI fell from 65 to 56—a bearish divergence, showing that the upward momentum was fading. A divergence doesn’t mean a drop is imminent, though; it only counts once price itself breaks down.
$NEAR
But it wouldn’t be right to say the trend has reversed. The current price is 4.705, which is 88% above the average cost of 2.5 over the past 5–6 months. Both MA144 and MA169 are providing support below, and this cost band itself is moving upward. The weekly chart is up 148.8% over the past 8 weeks, so the direction is upward. The long-term trend sets the direction, and the short-term trend sets the pace—the broader trend still favors the bulls; this current move is a pullback, not a reversal.
The problem is the pace. The 1h and 4h charts are both bearishly aligned, with price below the moving averages. On the 4h chart, price is still 4.62% below the medium-term cost level. The daily moving averages are tangled; the price fell 10.6% today, and the volume ratio is only 0.55, meaning it’s a low-volume decline. The direction on the 12h and 3d charts is unclear. The 3d moving averages are still bullishly aligned, but price is already 40.27% above the cost level—an extreme deviation. At this point, both bulls and bears are in a tough spot.
What really makes it hard to act is the price level. The first resistance overhead is the round-number level of 4.8, just 2.02% above the current price. The first support below is 4.555, 3.19% away. A normal day’s price swing is 12.37%—betting on a 2.02% breakout using a full day’s range gives a reward-to-risk ratio of just 0.63, with upside of less than a quarter of a day’s typical movement. It’s like standing with your back against the wall.
More concerning, 4.8 has just seen a false breakout. Price surged to 5.595, briefly spiked to 6 intraday, then pulled back, closing at 5.093. Anyone who chased the breakout is now trapped above. And during that move, price climbed from 5.54 to 6 while RSI fell from 65 to 56—a bearish divergence, showing that the upward momentum was fading. A divergence doesn’t mean a drop is imminent, though; it only counts once price itself breaks down.
$NEAR
38
·
--
SOXLB took a hard hit today: down 7.7% in 24 hours and 24.9% over the week, sliding from a high near 130 to around 94. But the really striking thing isn’t the drop—it’s where it’s sitting now: just 0.8% below the first resistance at 95 and only 0.27% above the first support at 94, while its average daily volatility is 13.9%. In other words, its normal daily range is squeezed into a narrow band of less than 1.1%. It’s pinned against the wall, with something in the way in both directions.
So don’t rush to ask, “Can I short it?” The bias is indeed bearish: the weekly trend is down, with an 8-week decline of 21.2%; the daily chart is also bearish and choppy, and all three timeframes point down. In conditions like these, trading with the trend gives you the most room for error. The 12-hour chart is bearish too, with price below the moving averages and 20% below the medium-term cost basis. But being right about the direction doesn’t mean you can enter now. Support at 94 is just 0.27% below; only a break below it would open up room to fall. And the risk/reward on this trade works out to just 0.08—you’d be risking more than ten times what you could gain. That’s what the data says: bearish bias, stay on the sidelines.
The bigger problem is that it hasn’t given short sellers a decent rebound to sell into. This move fell from 204 to 85.95, a 58% drop, and has rebounded only 7% so far—not even reaching 131, the 38.2% retracement level. The bears haven’t faced resistance, but you also haven’t been given a chance to enter at a higher price; traders are crowded down near the lows. The 4-hour volume ratio is just 0.49. A low-volume rebound is weak to begin with, so don’t chase it if it tests 95 on low volume—false breakouts are common.
The volume profile also highlights how awkward this price level is: the biggest cluster of positions is around 122.9, nearly 30% above the current price, leaving a vacuum overhead. Below, there’s another cluster of positions around 91.6 acting as a cushion. The current price is wedged between support at 94 and resistance at 95, with both levels having just been tested.
If you do trade it, don’t wait for it to “feel like it’s found a floor”—wait for a level you can verify: a break below 90 would open up room to fall, and that’s when a short would make sense. Conversely, if it moves back above 133.49, admit the trade idea is wrong. The stop-loss level based on 3 times the daily ATR is 41% away in either direction—that kind of distance shows just how unsuitable the current price is for a trade; there’s no reasonable place to put a stop. The low circulating supply and large amount of tokens still locked up are longer-term overhangs, but they’re not the focus for a short-term trade.
In short: the bias is bearish, but don’t enter now. Wait for a break below 90, and don’t gamble in this 1% gap. $SOXLB
SOXLB took a hard hit today: down 7.7% in 24 hours and 24.9% over the week, sliding from a high near 130 to around 94. But the really striking thing isn’t the drop—it’s where it’s sitting now: just 0.8% below the first resistance at 95 and only 0.27% above the first support at 94, while its average daily volatility is 13.9%. In other words, its normal daily range is squeezed into a narrow band of less than 1.1%. It’s pinned against the wall, with something in the way in both directions.
So don’t rush to ask, “Can I short it?” The bias is indeed bearish: the weekly trend is down, with an 8-week decline of 21.2%; the daily chart is also bearish and choppy, and all three timeframes point down. In conditions like these, trading with the trend gives you the most room for error. The 12-hour chart is bearish too, with price below the moving averages and 20% below the medium-term cost basis. But being right about the direction doesn’t mean you can enter now. Support at 94 is just 0.27% below; only a break below it would open up room to fall. And the risk/reward on this trade works out to just 0.08—you’d be risking more than ten times what you could gain. That’s what the data says: bearish bias, stay on the sidelines.
The bigger problem is that it hasn’t given short sellers a decent rebound to sell into. This move fell from 204 to 85.95, a 58% drop, and has rebounded only 7% so far—not even reaching 131, the 38.2% retracement level. The bears haven’t faced resistance, but you also haven’t been given a chance to enter at a higher price; traders are crowded down near the lows. The 4-hour volume ratio is just 0.49. A low-volume rebound is weak to begin with, so don’t chase it if it tests 95 on low volume—false breakouts are common.
The volume profile also highlights how awkward this price level is: the biggest cluster of positions is around 122.9, nearly 30% above the current price, leaving a vacuum overhead. Below, there’s another cluster of positions around 91.6 acting as a cushion. The current price is wedged between support at 94 and resistance at 95, with both levels having just been tested.
If you do trade it, don’t wait for it to “feel like it’s found a floor”—wait for a level you can verify: a break below 90 would open up room to fall, and that’s when a short would make sense. Conversely, if it moves back above 133.49, admit the trade idea is wrong. The stop-loss level based on 3 times the daily ATR is 41% away in either direction—that kind of distance shows just how unsuitable the current price is for a trade; there’s no reasonable place to put a stop. The low circulating supply and large amount of tokens still locked up are longer-term overhangs, but they’re not the focus for a short-term trade.
In short: the bias is bearish, but don’t enter now. Wait for a break below 90, and don’t gamble in this 1% gap. $SOXLB
So don’t rush to ask, “Can I short it?” The bias is indeed bearish: the weekly trend is down, with an 8-week decline of 21.2%; the daily chart is also bearish and choppy, and all three timeframes point down. In conditions like these, trading with the trend gives you the most room for error. The 12-hour chart is bearish too, with price below the moving averages and 20% below the medium-term cost basis. But being right about the direction doesn’t mean you can enter now. Support at 94 is just 0.27% below; only a break below it would open up room to fall. And the risk/reward on this trade works out to just 0.08—you’d be risking more than ten times what you could gain. That’s what the data says: bearish bias, stay on the sidelines.
The bigger problem is that it hasn’t given short sellers a decent rebound to sell into. This move fell from 204 to 85.95, a 58% drop, and has rebounded only 7% so far—not even reaching 131, the 38.2% retracement level. The bears haven’t faced resistance, but you also haven’t been given a chance to enter at a higher price; traders are crowded down near the lows. The 4-hour volume ratio is just 0.49. A low-volume rebound is weak to begin with, so don’t chase it if it tests 95 on low volume—false breakouts are common.
The volume profile also highlights how awkward this price level is: the biggest cluster of positions is around 122.9, nearly 30% above the current price, leaving a vacuum overhead. Below, there’s another cluster of positions around 91.6 acting as a cushion. The current price is wedged between support at 94 and resistance at 95, with both levels having just been tested.
If you do trade it, don’t wait for it to “feel like it’s found a floor”—wait for a level you can verify: a break below 90 would open up room to fall, and that’s when a short would make sense. Conversely, if it moves back above 133.49, admit the trade idea is wrong. The stop-loss level based on 3 times the daily ATR is 41% away in either direction—that kind of distance shows just how unsuitable the current price is for a trade; there’s no reasonable place to put a stop. The low circulating supply and large amount of tokens still locked up are longer-term overhangs, but they’re not the focus for a short-term trade.
In short: the bias is bearish, but don’t enter now. Wait for a break below 90, and don’t gamble in this 1% gap. $SOXLB
58
·
--
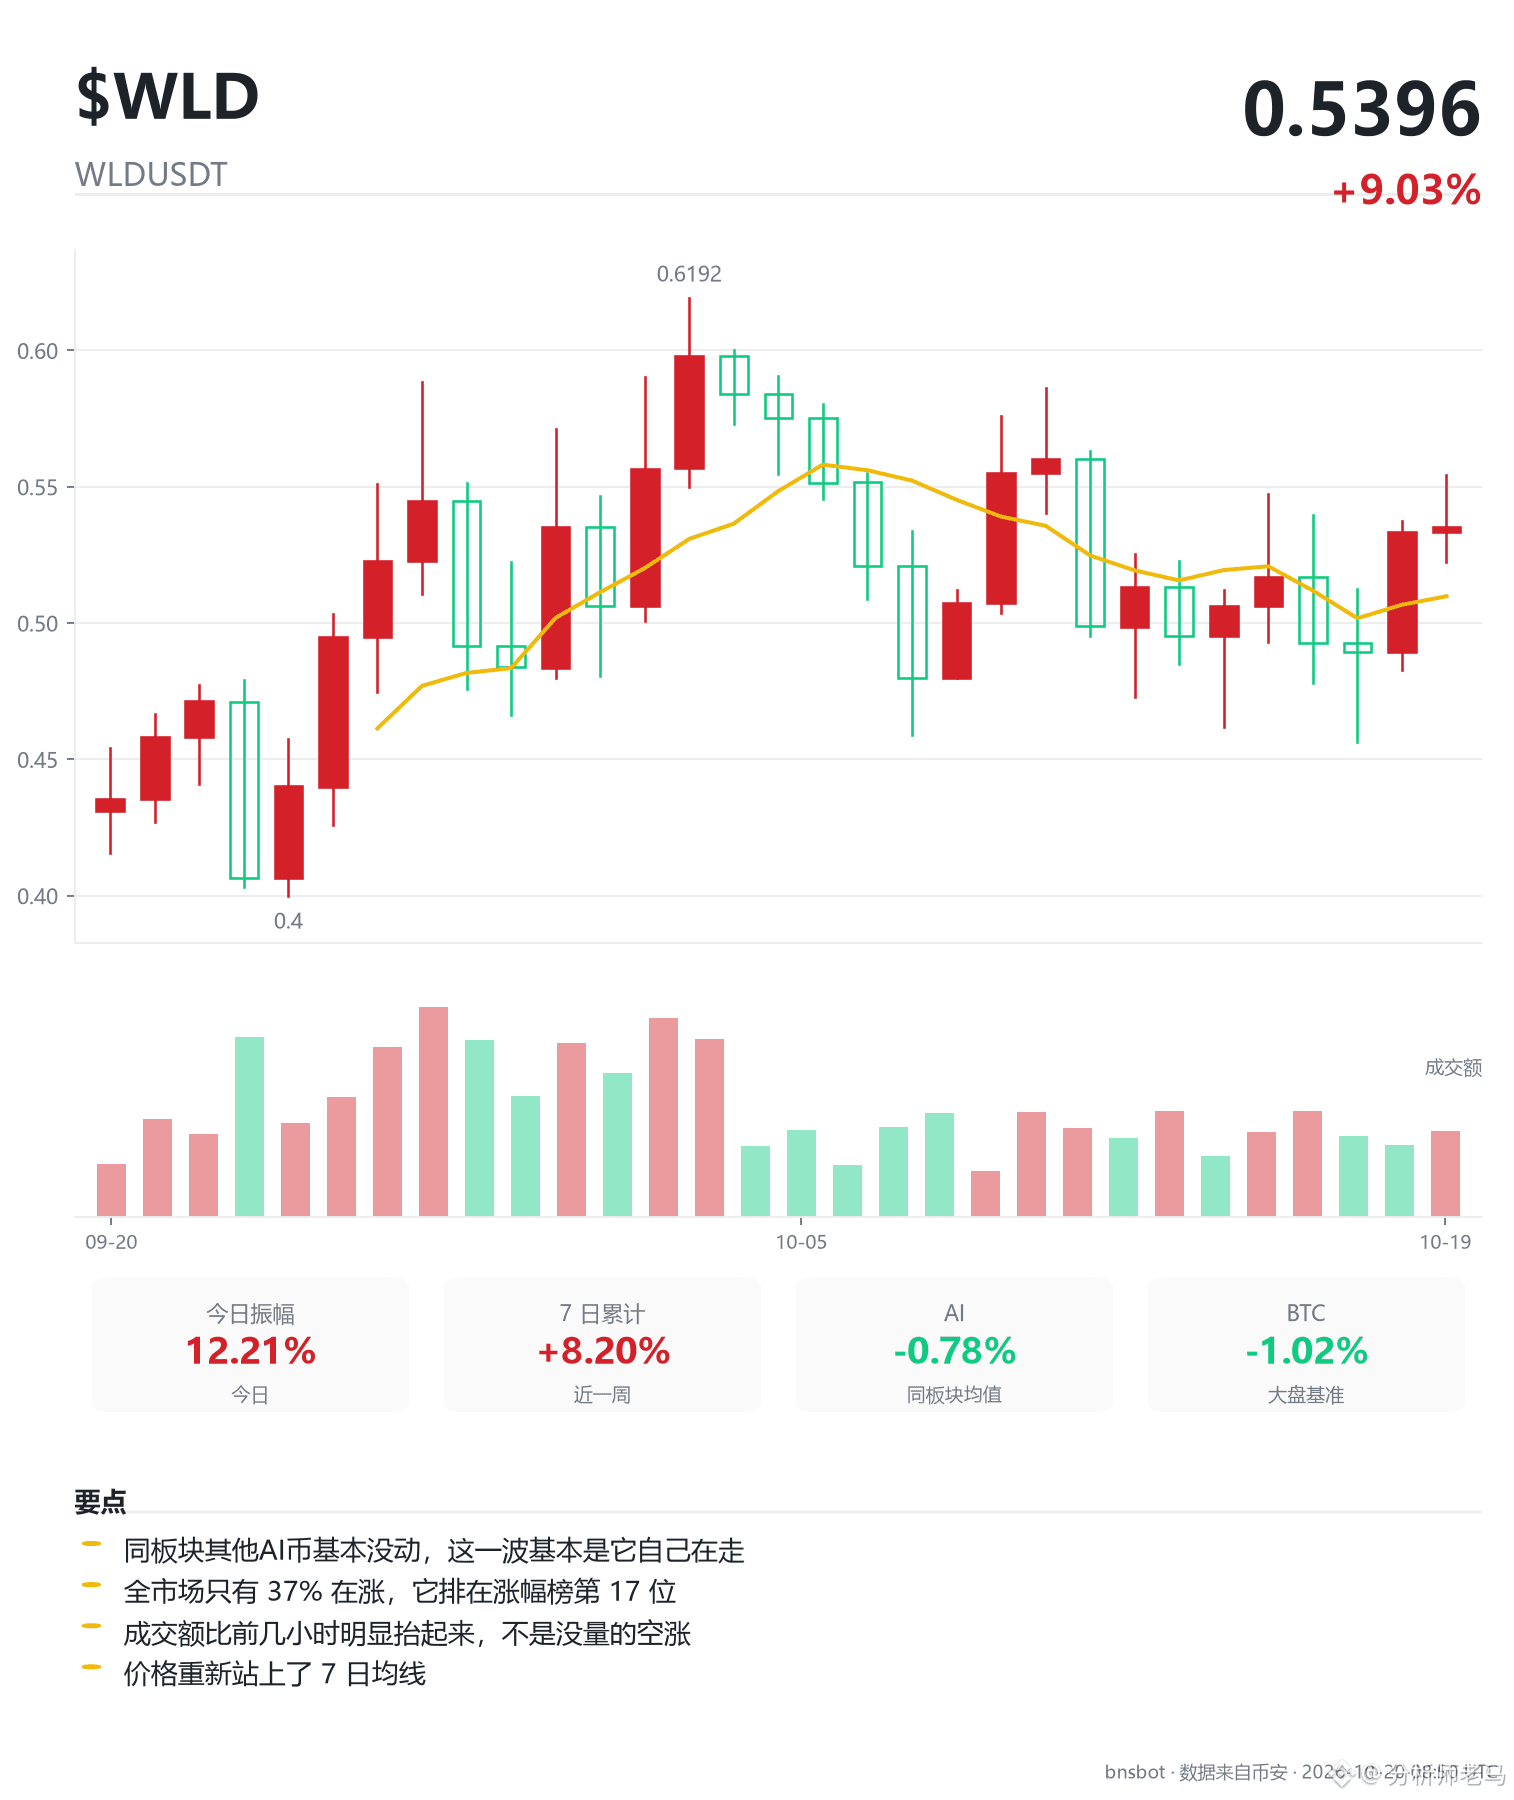
Just 1.1% away from support at 0.5300, $WLD needs to make a choice
Where could this trade really go wrong? If it falls below 0.36686901, admit the trade is wrong and exit. That’s the stop-loss level based on 3 times the daily volatility, 31.54% below the current price. It sounds absurdly far away, but that’s just how WLD is behaving right now—it moves an average of 10.51% a day, and volatility has expanded to 1.69 times its previous level. Set the stop too tight, and you’ll just get shaken out for no reason, then watch it move in the original direction.
So why still lean bullish for now? There’s 114 million USDT tied up in futures, and open interest rose 13.19% over 7 days while the price gained 7.46% over the same period. New money is flowing in alongside the rally, so this move has real capital behind it—it’s not just a short-covering pop that quickly fades. Over the past 8 weeks, the weekly chart is up 19.9%, and the current price is still 31.6% above the average cost over the past 5–6 months. The long-term trend remains intact.
But being right about the direction doesn’t mean you can buy right now. The current price is just 0.77% below 0.54, while support at 0.53 is only 1.1% lower—and a normal daily move is 10.5%. Betting on a breakout of less than 0.8% over the course of a whole day isn’t a good trade. There’s too little room here, and nowhere sensible to place a stop-loss.
So what you should be watching now isn’t an entry point, but two levels: above, holding firmly above 0.55 would confirm a genuine breakout through the 0.54 barrier. That’s a momentum-chasing approach: lower odds, but with more room to run. Below, a decisive break under 0.53 would weaken the short-term structure. For anyone already holding, that’s a level to reduce exposure—not add to it. The short-term moving averages are still tangled, and neither the 1h nor the 4h chart has established a clear direction. There’s no need to rush.
$WLD
Just 1.1% away from support at 0.5300, $WLD needs to make a choice
Where could this trade really go wrong? If it falls below 0.36686901, admit the trade is wrong and exit. That’s the stop-loss level based on 3 times the daily volatility, 31.54% below the current price. It sounds absurdly far away, but that’s just how WLD is behaving right now—it moves an average of 10.51% a day, and volatility has expanded to 1.69 times its previous level. Set the stop too tight, and you’ll just get shaken out for no reason, then watch it move in the original direction.
So why still lean bullish for now? There’s 114 million USDT tied up in futures, and open interest rose 13.19% over 7 days while the price gained 7.46% over the same period. New money is flowing in alongside the rally, so this move has real capital behind it—it’s not just a short-covering pop that quickly fades. Over the past 8 weeks, the weekly chart is up 19.9%, and the current price is still 31.6% above the average cost over the past 5–6 months. The long-term trend remains intact.
But being right about the direction doesn’t mean you can buy right now. The current price is just 0.77% below 0.54, while support at 0.53 is only 1.1% lower—and a normal daily move is 10.5%. Betting on a breakout of less than 0.8% over the course of a whole day isn’t a good trade. There’s too little room here, and nowhere sensible to place a stop-loss.
So what you should be watching now isn’t an entry point, but two levels: above, holding firmly above 0.55 would confirm a genuine breakout through the 0.54 barrier. That’s a momentum-chasing approach: lower odds, but with more room to run. Below, a decisive break under 0.53 would weaken the short-term structure. For anyone already holding, that’s a level to reduce exposure—not add to it. The short-term moving averages are still tangled, and neither the 1h nor the 4h chart has established a clear direction. There’s no need to rush.
$WLD
Where could this trade really go wrong? If it falls below 0.36686901, admit the trade is wrong and exit. That’s the stop-loss level based on 3 times the daily volatility, 31.54% below the current price. It sounds absurdly far away, but that’s just how WLD is behaving right now—it moves an average of 10.51% a day, and volatility has expanded to 1.69 times its previous level. Set the stop too tight, and you’ll just get shaken out for no reason, then watch it move in the original direction.
So why still lean bullish for now? There’s 114 million USDT tied up in futures, and open interest rose 13.19% over 7 days while the price gained 7.46% over the same period. New money is flowing in alongside the rally, so this move has real capital behind it—it’s not just a short-covering pop that quickly fades. Over the past 8 weeks, the weekly chart is up 19.9%, and the current price is still 31.6% above the average cost over the past 5–6 months. The long-term trend remains intact.
But being right about the direction doesn’t mean you can buy right now. The current price is just 0.77% below 0.54, while support at 0.53 is only 1.1% lower—and a normal daily move is 10.5%. Betting on a breakout of less than 0.8% over the course of a whole day isn’t a good trade. There’s too little room here, and nowhere sensible to place a stop-loss.
So what you should be watching now isn’t an entry point, but two levels: above, holding firmly above 0.55 would confirm a genuine breakout through the 0.54 barrier. That’s a momentum-chasing approach: lower odds, but with more room to run. Below, a decisive break under 0.53 would weaken the short-term structure. For anyone already holding, that’s a level to reduce exposure—not add to it. The short-term moving averages are still tangled, and neither the 1h nor the 4h chart has established a clear direction. There’s no need to rush.
$WLD
47
·
--
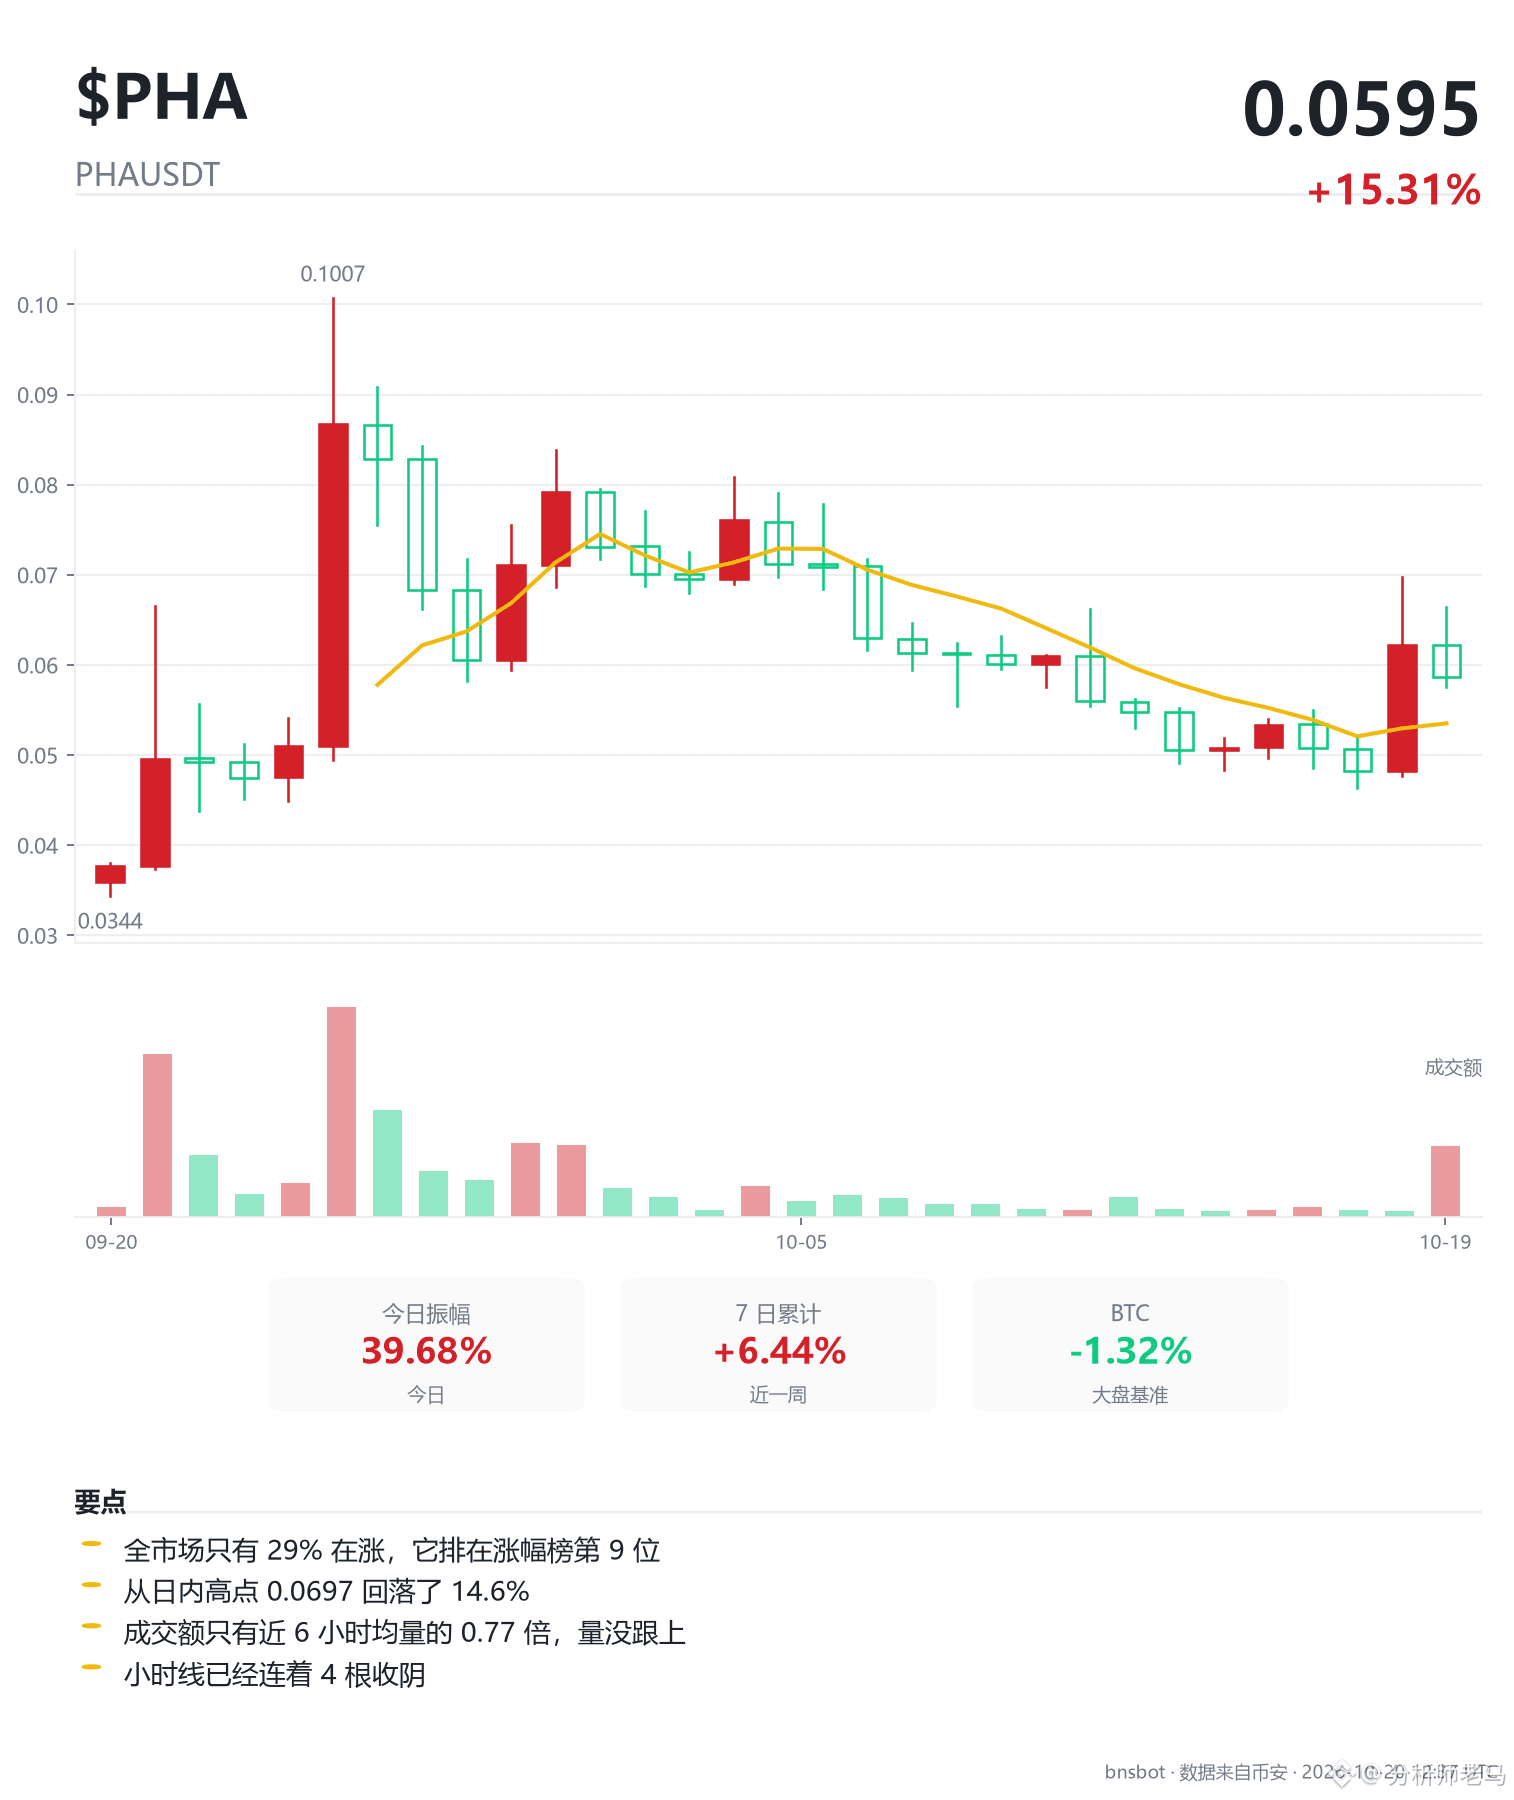
$PHA is leaning bullish, but is this a worthwhile entry now?
First, what would invalidate the setup: this leg rose from 0.0192 to 0.1007. If it pulls back below 0.050333, the bulls will have lost their momentum, and we’ll need to reassess. Further down, the stop-loss for a long position is at 0.02862321, set based on three times the daily volatility. A break below that level means admitting the trade is wrong. Both levels are still a long way off for now; the question is whether the stretch in between is worth trading.
The longer-term picture is firmly on the bulls’ side. The current price is 68.9% above the average cost over the past 5–6 months of 0.03475, and the weekly chart has gained 92% over the past 8 weeks. The long-term and weekly trends point in the same direction, so there’s no need to guess the overall bias. But the daily chart is tangled, with price moving back and forth between moving averages. At this timeframe, there’s no clear direction—just a rhythm to follow. So this isn’t a trend-advancing phase; it’s a consolidation phase.
Positioning is what matters most during consolidation. Overhead, 0.059 is a round-number level and a weekly-chart level, just 0.51% above the current price. The first support below is 0.0582, 0.85% away. That leaves 0.51% of upside, but price would need to fall 0.85% to reach support—and normal daily volatility is 17.08%. Betting a full day’s worth of volatility for a half-point breakout doesn’t add up. That’s why it’s not time to enter—not because the direction is wrong, but because there’s no room to place a stop-loss.
Today’s gain looks weak, too. The price is up 16.5%, but trading volume is only 0.55 times the recent average. Price is rising on falling volume, meaning less money is driving it higher. The 4-hour volume ratio is 1.79 times, which looks like a high-volume breakout above 0.059. But the 12-hour volume ratio of 14.36 times came from an earlier move, not fresh buying today. Price is already 10.8% above its 7-day average, so it’s overheated in the short term; a single pullback could knock out anyone who chased the move.
Funding is the one genuinely strong point in this batch of data. Open interest is at 6.46 million USDT, so the market is relatively small. Open interest rose 25.24% over 7 days while price gained 5.01% over the same period. Price is rising as capital flows in, which suggests new longs are opening positions rather than shorts covering. Open interest has multiplied 1.12 times over 30 days, so leverage is building quickly. That’s both fuel and a risk: a reversal could trigger a cascade of liquidations. Over the past 7 days, aggressive buying accounted for 52.9% of activity, giving buyers a slight edge, but not an overwhelming one.
The relative strength is real. Over 7 days, PHA outperformed BTC by 5.39 percentage points, and over 30 days by 63 points. But the gains were just 5.01% over 7 days versus 63.51% over 30 days, so the outperformance is narrowing. Don’t mistake last month’s performance for strength in the present.
$PHA is leaning bullish, but is this a worthwhile entry now?
First, what would invalidate the setup: this leg rose from 0.0192 to 0.1007. If it pulls back below 0.050333, the bulls will have lost their momentum, and we’ll need to reassess. Further down, the stop-loss for a long position is at 0.02862321, set based on three times the daily volatility. A break below that level means admitting the trade is wrong. Both levels are still a long way off for now; the question is whether the stretch in between is worth trading.
The longer-term picture is firmly on the bulls’ side. The current price is 68.9% above the average cost over the past 5–6 months of 0.03475, and the weekly chart has gained 92% over the past 8 weeks. The long-term and weekly trends point in the same direction, so there’s no need to guess the overall bias. But the daily chart is tangled, with price moving back and forth between moving averages. At this timeframe, there’s no clear direction—just a rhythm to follow. So this isn’t a trend-advancing phase; it’s a consolidation phase.
Positioning is what matters most during consolidation. Overhead, 0.059 is a round-number level and a weekly-chart level, just 0.51% above the current price. The first support below is 0.0582, 0.85% away. That leaves 0.51% of upside, but price would need to fall 0.85% to reach support—and normal daily volatility is 17.08%. Betting a full day’s worth of volatility for a half-point breakout doesn’t add up. That’s why it’s not time to enter—not because the direction is wrong, but because there’s no room to place a stop-loss.
Today’s gain looks weak, too. The price is up 16.5%, but trading volume is only 0.55 times the recent average. Price is rising on falling volume, meaning less money is driving it higher. The 4-hour volume ratio is 1.79 times, which looks like a high-volume breakout above 0.059. But the 12-hour volume ratio of 14.36 times came from an earlier move, not fresh buying today. Price is already 10.8% above its 7-day average, so it’s overheated in the short term; a single pullback could knock out anyone who chased the move.
Funding is the one genuinely strong point in this batch of data. Open interest is at 6.46 million USDT, so the market is relatively small. Open interest rose 25.24% over 7 days while price gained 5.01% over the same period. Price is rising as capital flows in, which suggests new longs are opening positions rather than shorts covering. Open interest has multiplied 1.12 times over 30 days, so leverage is building quickly. That’s both fuel and a risk: a reversal could trigger a cascade of liquidations. Over the past 7 days, aggressive buying accounted for 52.9% of activity, giving buyers a slight edge, but not an overwhelming one.
The relative strength is real. Over 7 days, PHA outperformed BTC by 5.39 percentage points, and over 30 days by 63 points. But the gains were just 5.01% over 7 days versus 63.51% over 30 days, so the outperformance is narrowing. Don’t mistake last month’s performance for strength in the present.
First, what would invalidate the setup: this leg rose from 0.0192 to 0.1007. If it pulls back below 0.050333, the bulls will have lost their momentum, and we’ll need to reassess. Further down, the stop-loss for a long position is at 0.02862321, set based on three times the daily volatility. A break below that level means admitting the trade is wrong. Both levels are still a long way off for now; the question is whether the stretch in between is worth trading.
The longer-term picture is firmly on the bulls’ side. The current price is 68.9% above the average cost over the past 5–6 months of 0.03475, and the weekly chart has gained 92% over the past 8 weeks. The long-term and weekly trends point in the same direction, so there’s no need to guess the overall bias. But the daily chart is tangled, with price moving back and forth between moving averages. At this timeframe, there’s no clear direction—just a rhythm to follow. So this isn’t a trend-advancing phase; it’s a consolidation phase.
Positioning is what matters most during consolidation. Overhead, 0.059 is a round-number level and a weekly-chart level, just 0.51% above the current price. The first support below is 0.0582, 0.85% away. That leaves 0.51% of upside, but price would need to fall 0.85% to reach support—and normal daily volatility is 17.08%. Betting a full day’s worth of volatility for a half-point breakout doesn’t add up. That’s why it’s not time to enter—not because the direction is wrong, but because there’s no room to place a stop-loss.
Today’s gain looks weak, too. The price is up 16.5%, but trading volume is only 0.55 times the recent average. Price is rising on falling volume, meaning less money is driving it higher. The 4-hour volume ratio is 1.79 times, which looks like a high-volume breakout above 0.059. But the 12-hour volume ratio of 14.36 times came from an earlier move, not fresh buying today. Price is already 10.8% above its 7-day average, so it’s overheated in the short term; a single pullback could knock out anyone who chased the move.
Funding is the one genuinely strong point in this batch of data. Open interest is at 6.46 million USDT, so the market is relatively small. Open interest rose 25.24% over 7 days while price gained 5.01% over the same period. Price is rising as capital flows in, which suggests new longs are opening positions rather than shorts covering. Open interest has multiplied 1.12 times over 30 days, so leverage is building quickly. That’s both fuel and a risk: a reversal could trigger a cascade of liquidations. Over the past 7 days, aggressive buying accounted for 52.9% of activity, giving buyers a slight edge, but not an overwhelming one.
The relative strength is real. Over 7 days, PHA outperformed BTC by 5.39 percentage points, and over 30 days by 63 points. But the gains were just 5.01% over 7 days versus 63.51% over 30 days, so the outperformance is narrowing. Don’t mistake last month’s performance for strength in the present.
64
·
--
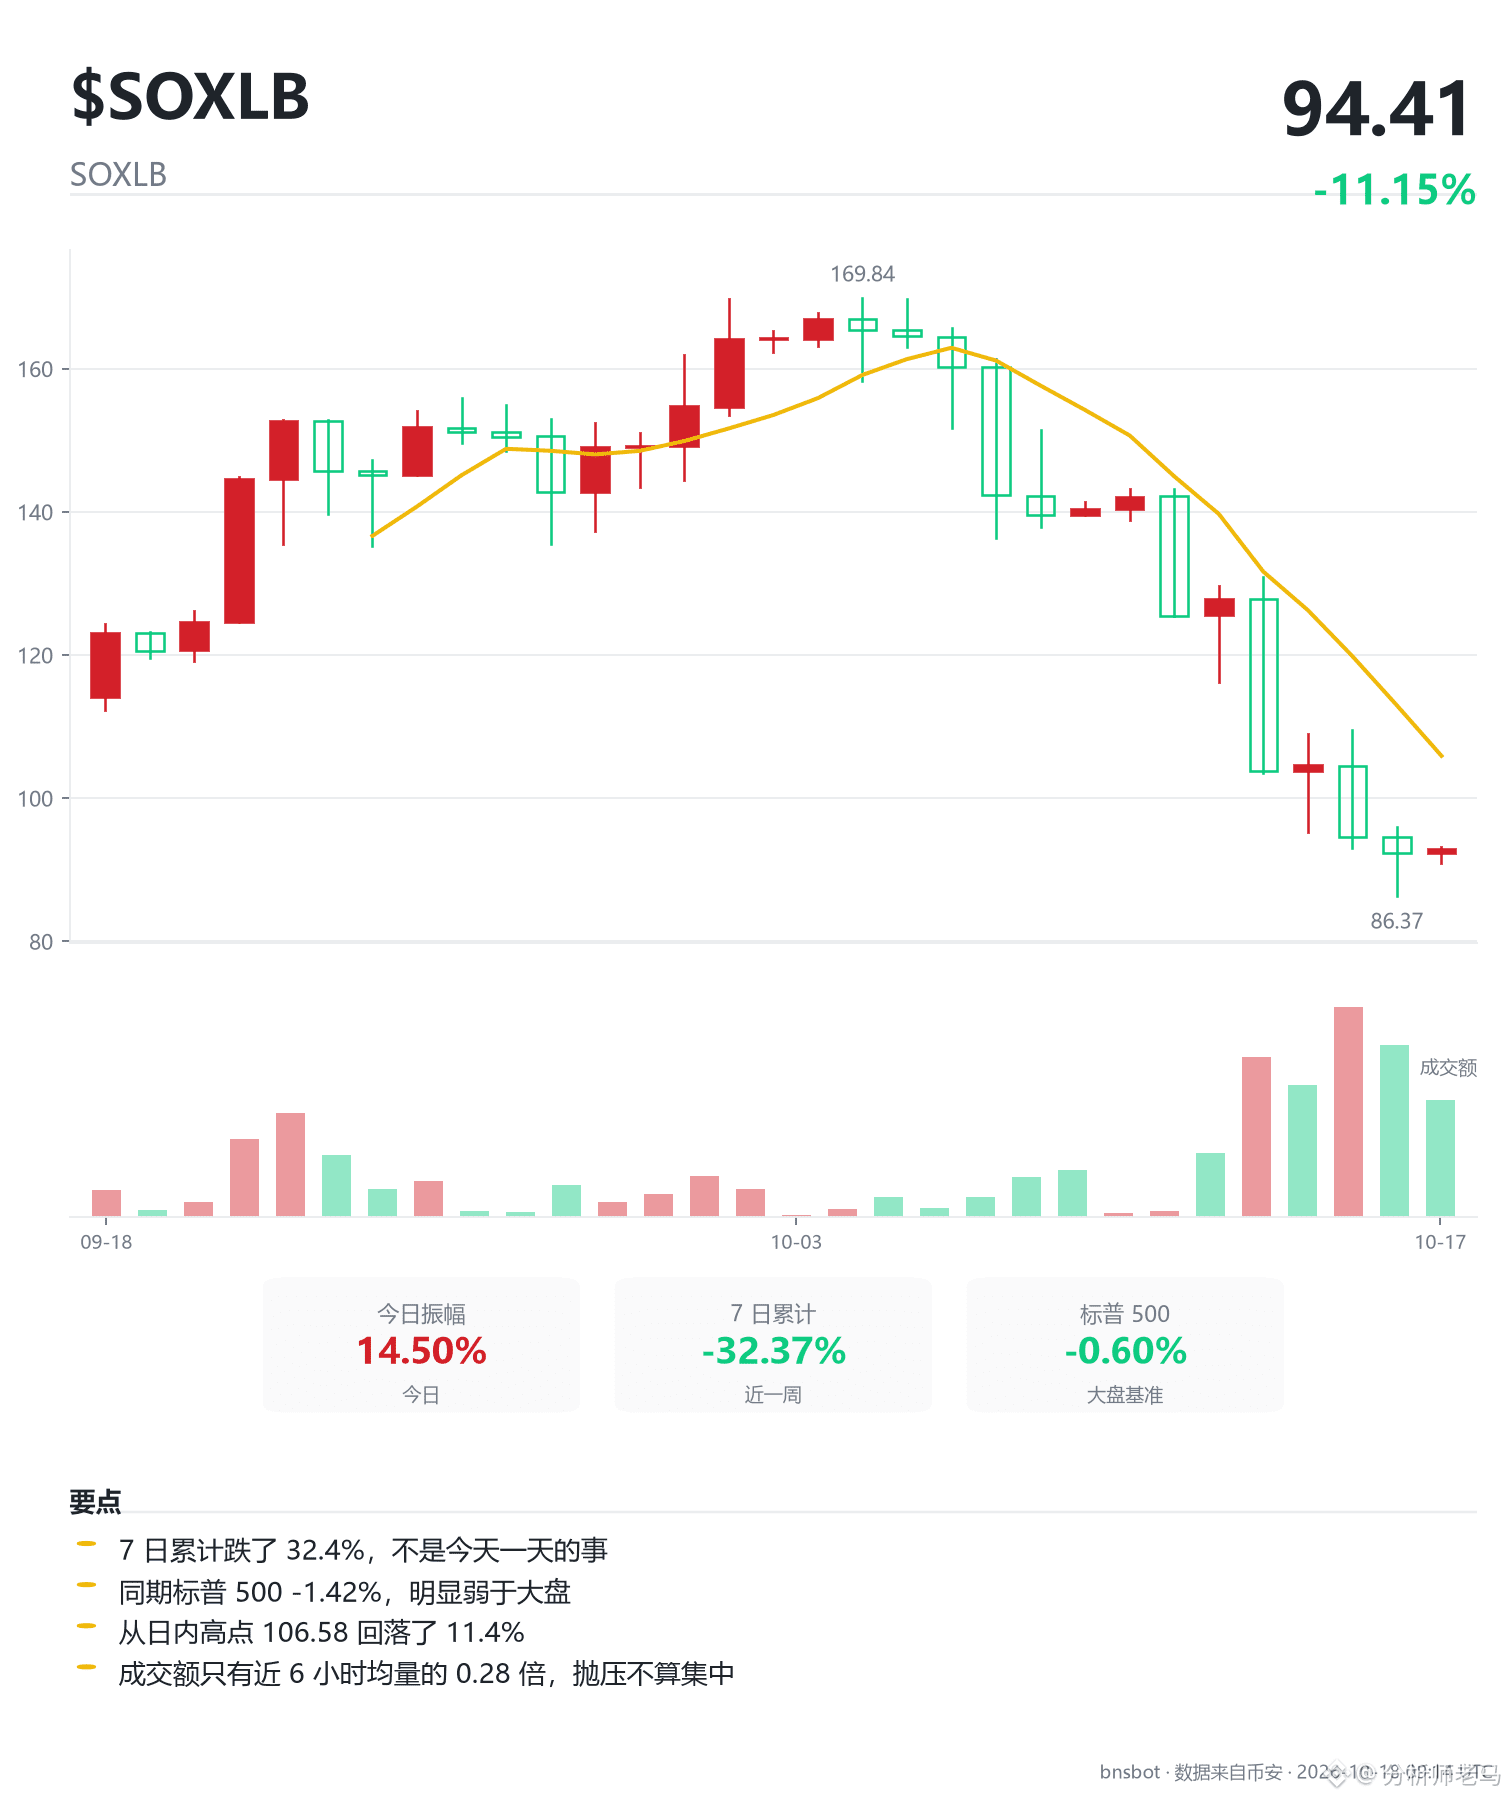
SOXLB: Moving averages are tangled and all acting as resistance; a rebound near them is likely to get knocked back down
Down 33.93% in a week, including a 27.41% single-day drop on 3.36x volume—that’s price falling as volume rises, so the selling pressure is real, not a shakeout. At the same time, SPY barely moved. SOXLB underperformed by 32.61 percentage points over 7 days; this isn’t the market’s fault—it’s breaking down on its own. At 92.79, it’s still 17.8% below its 7-day moving average. It’s oversold, but that only means the odds of a rebound and recovery are building; it doesn’t mean it’s time to buy.
The real problem is the price levels: 93 above is a psychological round number and a weekly-chart hurdle, just 0.23% above the current price; 92 below is only 0.85% away. The upside is less than a quarter of the average daily move, which is 14.84%. Betting on a 0.23% breakout while taking on a full day’s volatility gives odds of just 0.27. The numbers simply don’t add up.
First, let’s be clear about what would invalidate this view: if it breaks above 93 on 4-hour volume and closes above it, the assessment above no longer applies. The 4-hour volume ratio is already 1.92x, so if real money is pushing it higher, this becomes a breakout-entry setup. Place the stop below 93; if it falls back below, that’s a false breakout. Conversely, a decisive break below 92 would immediately weaken the short-term structure. If you’re holding, reduce here—don’t wait.
For now, the conclusion is to take no directional view. It has only been listed for 103 days, so cost-basis zones covering more than five months can’t be calculated. The weekly chart has moved just -2.0% over nearly 8 weeks—essentially sideways. Only the daily and 12-hour charts are pointing in a direction, and one piece of evidence isn’t enough to establish a trend. What’s more, after falling from 204.46 to 85.95—a 58% drop—it has rebounded just 6% so far and hasn’t even reached 131. The bears have yet to face any meaningful resistance. Wait for the longer-term or weekly chart to signal a direction before taking action. $SOXLB
SOXLB: Moving averages are tangled and all acting as resistance; a rebound near them is likely to get knocked back down
Down 33.93% in a week, including a 27.41% single-day drop on 3.36x volume—that’s price falling as volume rises, so the selling pressure is real, not a shakeout. At the same time, SPY barely moved. SOXLB underperformed by 32.61 percentage points over 7 days; this isn’t the market’s fault—it’s breaking down on its own. At 92.79, it’s still 17.8% below its 7-day moving average. It’s oversold, but that only means the odds of a rebound and recovery are building; it doesn’t mean it’s time to buy.
The real problem is the price levels: 93 above is a psychological round number and a weekly-chart hurdle, just 0.23% above the current price; 92 below is only 0.85% away. The upside is less than a quarter of the average daily move, which is 14.84%. Betting on a 0.23% breakout while taking on a full day’s volatility gives odds of just 0.27. The numbers simply don’t add up.
First, let’s be clear about what would invalidate this view: if it breaks above 93 on 4-hour volume and closes above it, the assessment above no longer applies. The 4-hour volume ratio is already 1.92x, so if real money is pushing it higher, this becomes a breakout-entry setup. Place the stop below 93; if it falls back below, that’s a false breakout. Conversely, a decisive break below 92 would immediately weaken the short-term structure. If you’re holding, reduce here—don’t wait.
For now, the conclusion is to take no directional view. It has only been listed for 103 days, so cost-basis zones covering more than five months can’t be calculated. The weekly chart has moved just -2.0% over nearly 8 weeks—essentially sideways. Only the daily and 12-hour charts are pointing in a direction, and one piece of evidence isn’t enough to establish a trend. What’s more, after falling from 204.46 to 85.95—a 58% drop—it has rebounded just 6% so far and hasn’t even reached 131. The bears have yet to face any meaningful resistance. Wait for the longer-term or weekly chart to signal a direction before taking action. $SOXLB
Down 33.93% in a week, including a 27.41% single-day drop on 3.36x volume—that’s price falling as volume rises, so the selling pressure is real, not a shakeout. At the same time, SPY barely moved. SOXLB underperformed by 32.61 percentage points over 7 days; this isn’t the market’s fault—it’s breaking down on its own. At 92.79, it’s still 17.8% below its 7-day moving average. It’s oversold, but that only means the odds of a rebound and recovery are building; it doesn’t mean it’s time to buy.
The real problem is the price levels: 93 above is a psychological round number and a weekly-chart hurdle, just 0.23% above the current price; 92 below is only 0.85% away. The upside is less than a quarter of the average daily move, which is 14.84%. Betting on a 0.23% breakout while taking on a full day’s volatility gives odds of just 0.27. The numbers simply don’t add up.
First, let’s be clear about what would invalidate this view: if it breaks above 93 on 4-hour volume and closes above it, the assessment above no longer applies. The 4-hour volume ratio is already 1.92x, so if real money is pushing it higher, this becomes a breakout-entry setup. Place the stop below 93; if it falls back below, that’s a false breakout. Conversely, a decisive break below 92 would immediately weaken the short-term structure. If you’re holding, reduce here—don’t wait.
For now, the conclusion is to take no directional view. It has only been listed for 103 days, so cost-basis zones covering more than five months can’t be calculated. The weekly chart has moved just -2.0% over nearly 8 weeks—essentially sideways. Only the daily and 12-hour charts are pointing in a direction, and one piece of evidence isn’t enough to establish a trend. What’s more, after falling from 204.46 to 85.95—a 58% drop—it has rebounded just 6% so far and hasn’t even reached 131. The bears have yet to face any meaningful resistance. Wait for the longer-term or weekly chart to signal a direction before taking action. $SOXLB
11
·
--
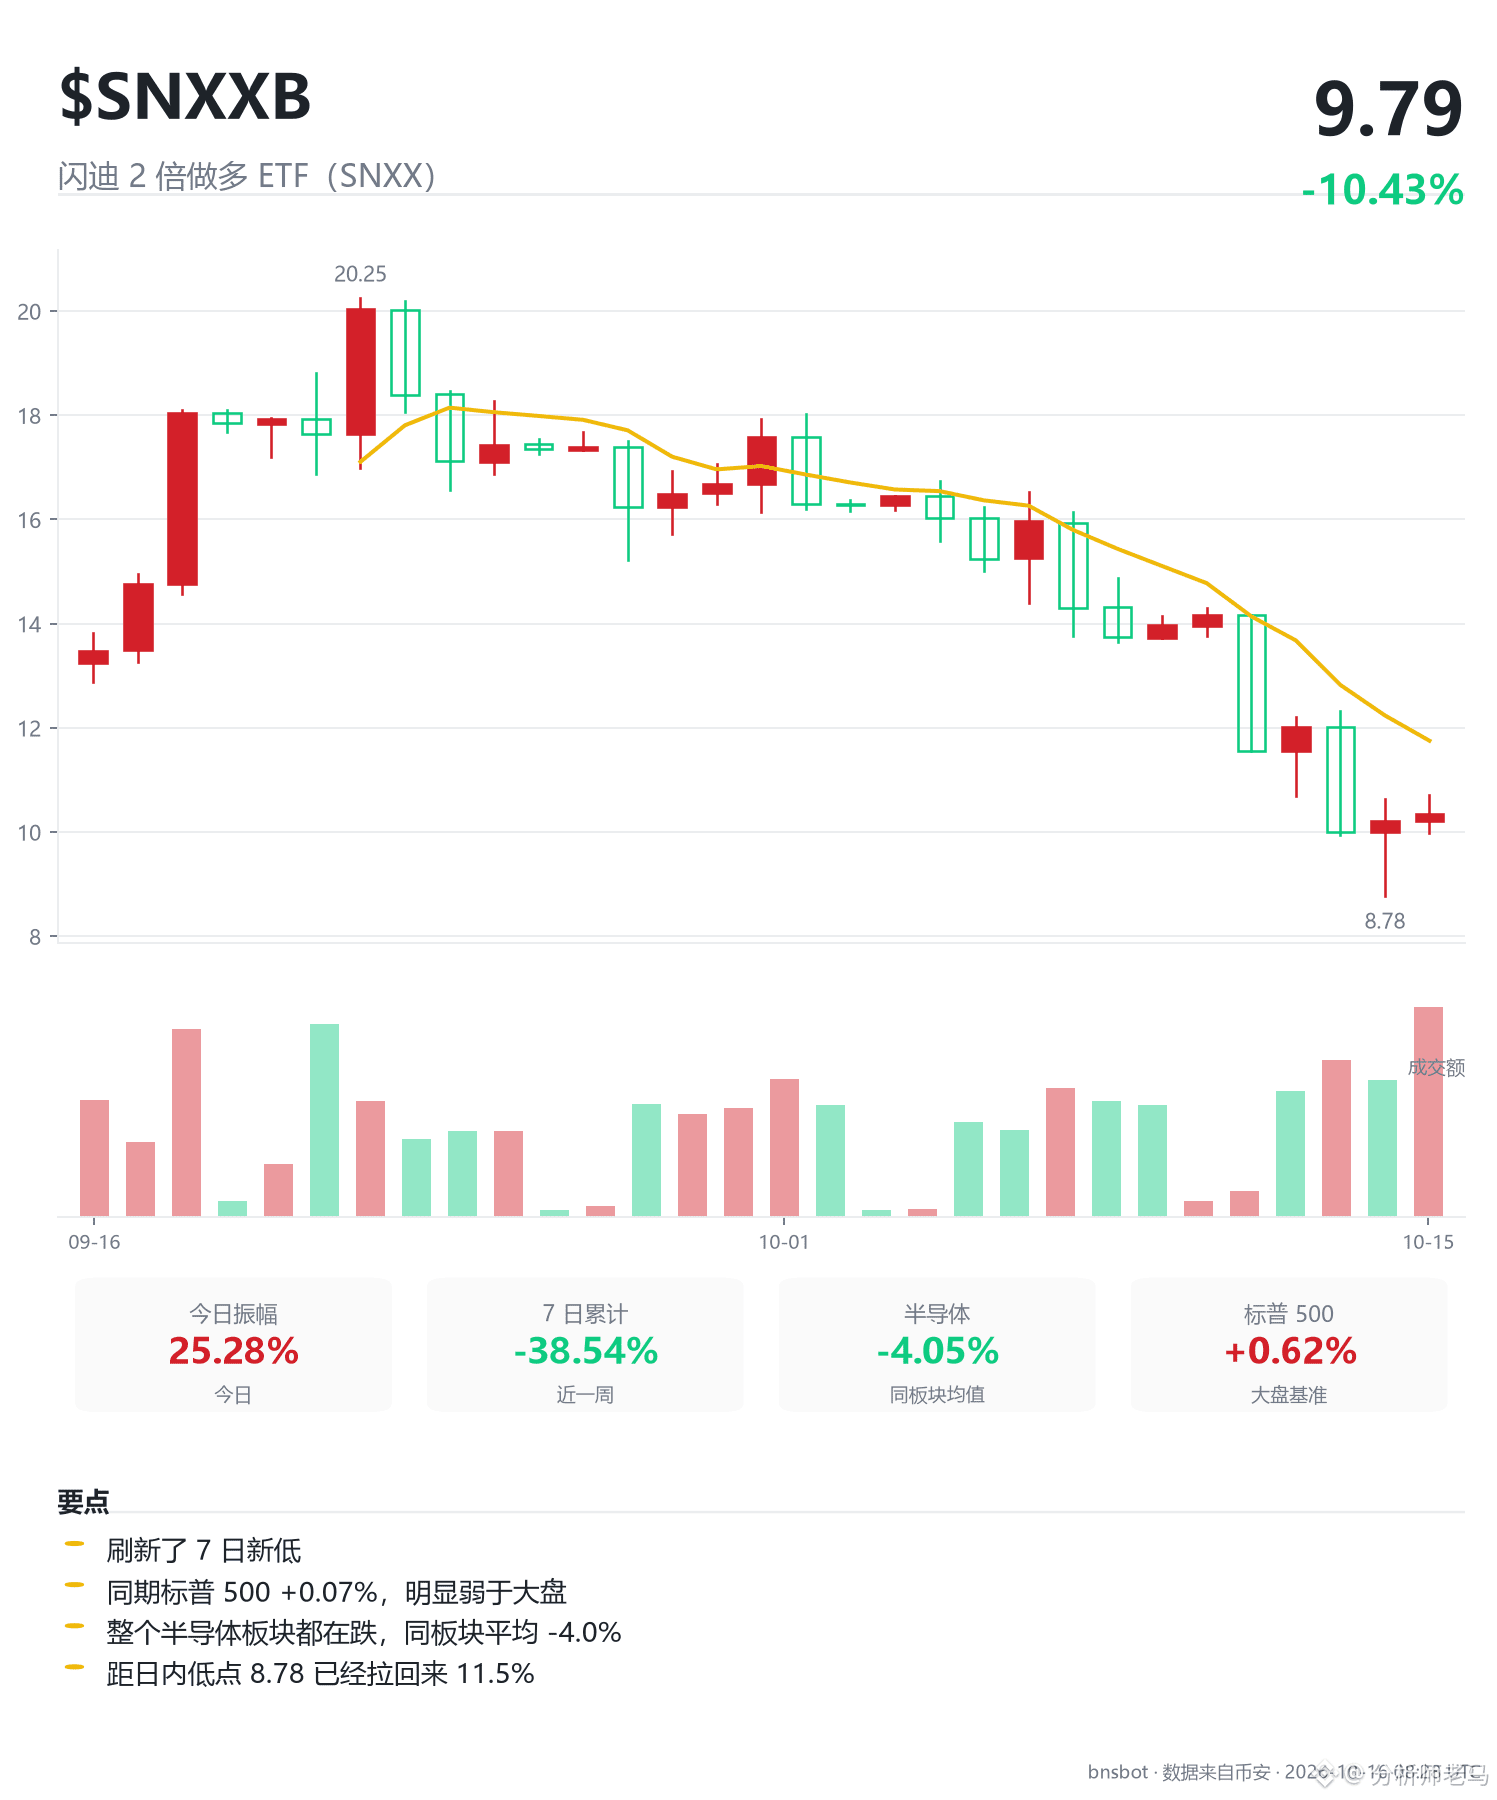
It’s fallen this much—so why can’t we buy the dip?
This 2x leveraged long ETF on SanDisk is down 27.79% in a week and 40.68% in 30 days. Bitcoin barely moved over the same period (-0.02%), widening the gap to 35 percentage points. It’s not falling with the broader market—it’s getting hit on its own.
But today’s move is interesting: it’s trading at 10.34, up 7.15% on the day, outperforming the semiconductor sector average by 4.83 percentage points. Arm is up 6.24%, Micron 4.96%, and SanDisk itself 3.42%—this ETF is out in front. Does it sound like a reversal is coming?
I don’t think so. It’s up, sure, but volume is just 0.32 times its usual level. Price is rising on falling volume, meaning there’s less money behind the move. What’s more, it’s now sitting right at the round-number level of 11, with its 4-hour relative volume at 0.45 times normal. Pushing up against resistance on shrinking volume—this kind of breakout is usually a fakeout.
The structure is even more concerning. The weekly trend is down, the daily chart is bearish, and the 12-hour chart is also below its moving averages. All three timeframes are aligned in a bearish direction. The daily price is 32.28% below its medium-term cost basis, and the 12-hour price is 25.72% below it—an extreme divergence. RSI is just 30.2, so it’s oversold, but oversold doesn’t mean it has to go up. This is a weak rebound within a downtrend: after plunging from 20.32 to 6.21, a 69% drop, it has now rebounded just 29%—not even enough to reach the 38.2% retracement level at 11.6.
The first hurdle above is 11, followed by 11.64. Both are confluence levels across multiple timeframes, and the current price is just 6.4% below the first. Below, 10 is support, just 3.3% away. That’s 6.38% upside versus 3.29% downside, but its normal daily volatility is 16.9%—the range is so tight there’s barely room for a stop-loss. Long or short, you could easily get stopped out for no good reason.
What about shorting it? With a stop-loss based on 3x volatility, it would need to be set at 15.57—that’s 50.65% above the current price. A stop that wide isn’t something you can fix just by adjusting your position size.
So the bias is bearish, but I’m staying out for now. The 10 level is the trigger: only a decisive break below it would open up room to the downside. If it gets back above 15.57, the bearish thesis is invalidated.
$SNXX
$SNXXB
It’s fallen this much—so why can’t we buy the dip?
This 2x leveraged long ETF on SanDisk is down 27.79% in a week and 40.68% in 30 days. Bitcoin barely moved over the same period (-0.02%), widening the gap to 35 percentage points. It’s not falling with the broader market—it’s getting hit on its own.
But today’s move is interesting: it’s trading at 10.34, up 7.15% on the day, outperforming the semiconductor sector average by 4.83 percentage points. Arm is up 6.24%, Micron 4.96%, and SanDisk itself 3.42%—this ETF is out in front. Does it sound like a reversal is coming?
I don’t think so. It’s up, sure, but volume is just 0.32 times its usual level. Price is rising on falling volume, meaning there’s less money behind the move. What’s more, it’s now sitting right at the round-number level of 11, with its 4-hour relative volume at 0.45 times normal. Pushing up against resistance on shrinking volume—this kind of breakout is usually a fakeout.
The structure is even more concerning. The weekly trend is down, the daily chart is bearish, and the 12-hour chart is also below its moving averages. All three timeframes are aligned in a bearish direction. The daily price is 32.28% below its medium-term cost basis, and the 12-hour price is 25.72% below it—an extreme divergence. RSI is just 30.2, so it’s oversold, but oversold doesn’t mean it has to go up. This is a weak rebound within a downtrend: after plunging from 20.32 to 6.21, a 69% drop, it has now rebounded just 29%—not even enough to reach the 38.2% retracement level at 11.6.
The first hurdle above is 11, followed by 11.64. Both are confluence levels across multiple timeframes, and the current price is just 6.4% below the first. Below, 10 is support, just 3.3% away. That’s 6.38% upside versus 3.29% downside, but its normal daily volatility is 16.9%—the range is so tight there’s barely room for a stop-loss. Long or short, you could easily get stopped out for no good reason.
What about shorting it? With a stop-loss based on 3x volatility, it would need to be set at 15.57—that’s 50.65% above the current price. A stop that wide isn’t something you can fix just by adjusting your position size.
So the bias is bearish, but I’m staying out for now. The 10 level is the trigger: only a decisive break below it would open up room to the downside. If it gets back above 15.57, the bearish thesis is invalidated.
$SNXX
$SNXXB
This 2x leveraged long ETF on SanDisk is down 27.79% in a week and 40.68% in 30 days. Bitcoin barely moved over the same period (-0.02%), widening the gap to 35 percentage points. It’s not falling with the broader market—it’s getting hit on its own.
But today’s move is interesting: it’s trading at 10.34, up 7.15% on the day, outperforming the semiconductor sector average by 4.83 percentage points. Arm is up 6.24%, Micron 4.96%, and SanDisk itself 3.42%—this ETF is out in front. Does it sound like a reversal is coming?
I don’t think so. It’s up, sure, but volume is just 0.32 times its usual level. Price is rising on falling volume, meaning there’s less money behind the move. What’s more, it’s now sitting right at the round-number level of 11, with its 4-hour relative volume at 0.45 times normal. Pushing up against resistance on shrinking volume—this kind of breakout is usually a fakeout.
The structure is even more concerning. The weekly trend is down, the daily chart is bearish, and the 12-hour chart is also below its moving averages. All three timeframes are aligned in a bearish direction. The daily price is 32.28% below its medium-term cost basis, and the 12-hour price is 25.72% below it—an extreme divergence. RSI is just 30.2, so it’s oversold, but oversold doesn’t mean it has to go up. This is a weak rebound within a downtrend: after plunging from 20.32 to 6.21, a 69% drop, it has now rebounded just 29%—not even enough to reach the 38.2% retracement level at 11.6.
The first hurdle above is 11, followed by 11.64. Both are confluence levels across multiple timeframes, and the current price is just 6.4% below the first. Below, 10 is support, just 3.3% away. That’s 6.38% upside versus 3.29% downside, but its normal daily volatility is 16.9%—the range is so tight there’s barely room for a stop-loss. Long or short, you could easily get stopped out for no good reason.
What about shorting it? With a stop-loss based on 3x volatility, it would need to be set at 15.57—that’s 50.65% above the current price. A stop that wide isn’t something you can fix just by adjusting your position size.
So the bias is bearish, but I’m staying out for now. The 10 level is the trigger: only a decisive break below it would open up room to the downside. If it gets back above 15.57, the bearish thesis is invalidated.
$SNXX
$SNXXB
9
·
--
Just 3.52% away from support at 1,200.00—$ZEC needs to make a choice
First, one unusual detail: the price rose 13.97% in 24 hours, but trading volume was only 0.62 times its usual level. Price is up while volume is down, which means less money is pushing it higher.
So who bought this rally? Open interest tells the story: 565 million USDT is tied up in futures—a huge amount—but open interest fell 8.46% over the past 7 days while the price rose 4.77%. Price up, open interest down: that’s shorts closing, not new money going long. A rally driven by shorts covering can easily give back its gains. What’s more, aggressive buying accounted for only 51.9% over the past seven days. The bulls simply haven’t taken over.
The broader direction hasn’t turned bad. The current price of 1,243.73 is 70% above the 5–6 month average cost of 728, with the MA144 providing support at 760. The weekly chart is up 162.5% over eight weeks. The long-term, weekly, and 1h timeframes all lean in the same bullish direction. But the daily moving averages are tangled, and the 4h and 12h charts are still in a bearish alignment—that’s a classic case of “the big-picture trend is up, but the short-term rhythm is still being sorted out.” Longer timeframes set the direction; the timeframes from 12h to weekly set the pace. For today and tomorrow, watch the 1h and 4h charts. Don’t use the weekly outlook to gloss over what’s happening right now.
The problem is the price level. The first resistance above is 1,268.69, just 2.01% from the current price; the first support below is the 1,200 round-number level, 3.52% away. A normal day’s move is 10.49%. There’s a wall 2% above, while you have to fall 3.5% to reach the floor. That makes the risk/reward ratio 0.57—you’re risking twice as much as you could gain. Even worse, the 4h volume ratio is only 0.55. A low-volume push into 1,268.69 is prone to false breakouts. Anyone chasing here would be betting a full day’s worth of volatility on a 2-point breakout. It’s not worth it.
Yesterday left one loose end: the price dipped to 1,075 intraday, then rallied back to close at 1,221.4, above 1,112.77. That long lower wick was a false breakdown; the price recovered after being knocked down. This also explains the current retracement: after rising from 451.75 to 1,698, it has now given back only 36% of the move, remaining in shallow-retracement territory. The uptrend is still intact.
So the trading plan is bullish, but don’t act yet—stay on the sidelines. The reason is that price is sitting right by a key level, with less than a quarter of a day’s normal movement in upside potential, and there’s no sensible place to put a stop-loss. For a long trade, a stop based on three times the daily range would need to be at 852, 31.47% below the current price. That’s not a meaningful risk distance. The level to wait for is a sustained break above 1,268.69. Only then would the current resistance have truly been cleared. At that point, the first target would be 1,296.02, followed by the next round-number level at 1,300.
Just 3.52% away from support at 1,200.00—$ZEC needs to make a choice
First, one unusual detail: the price rose 13.97% in 24 hours, but trading volume was only 0.62 times its usual level. Price is up while volume is down, which means less money is pushing it higher.
So who bought this rally? Open interest tells the story: 565 million USDT is tied up in futures—a huge amount—but open interest fell 8.46% over the past 7 days while the price rose 4.77%. Price up, open interest down: that’s shorts closing, not new money going long. A rally driven by shorts covering can easily give back its gains. What’s more, aggressive buying accounted for only 51.9% over the past seven days. The bulls simply haven’t taken over.
The broader direction hasn’t turned bad. The current price of 1,243.73 is 70% above the 5–6 month average cost of 728, with the MA144 providing support at 760. The weekly chart is up 162.5% over eight weeks. The long-term, weekly, and 1h timeframes all lean in the same bullish direction. But the daily moving averages are tangled, and the 4h and 12h charts are still in a bearish alignment—that’s a classic case of “the big-picture trend is up, but the short-term rhythm is still being sorted out.” Longer timeframes set the direction; the timeframes from 12h to weekly set the pace. For today and tomorrow, watch the 1h and 4h charts. Don’t use the weekly outlook to gloss over what’s happening right now.
The problem is the price level. The first resistance above is 1,268.69, just 2.01% from the current price; the first support below is the 1,200 round-number level, 3.52% away. A normal day’s move is 10.49%. There’s a wall 2% above, while you have to fall 3.5% to reach the floor. That makes the risk/reward ratio 0.57—you’re risking twice as much as you could gain. Even worse, the 4h volume ratio is only 0.55. A low-volume push into 1,268.69 is prone to false breakouts. Anyone chasing here would be betting a full day’s worth of volatility on a 2-point breakout. It’s not worth it.
Yesterday left one loose end: the price dipped to 1,075 intraday, then rallied back to close at 1,221.4, above 1,112.77. That long lower wick was a false breakdown; the price recovered after being knocked down. This also explains the current retracement: after rising from 451.75 to 1,698, it has now given back only 36% of the move, remaining in shallow-retracement territory. The uptrend is still intact.
So the trading plan is bullish, but don’t act yet—stay on the sidelines. The reason is that price is sitting right by a key level, with less than a quarter of a day’s normal movement in upside potential, and there’s no sensible place to put a stop-loss. For a long trade, a stop based on three times the daily range would need to be at 852, 31.47% below the current price. That’s not a meaningful risk distance. The level to wait for is a sustained break above 1,268.69. Only then would the current resistance have truly been cleared. At that point, the first target would be 1,296.02, followed by the next round-number level at 1,300.
First, one unusual detail: the price rose 13.97% in 24 hours, but trading volume was only 0.62 times its usual level. Price is up while volume is down, which means less money is pushing it higher.
So who bought this rally? Open interest tells the story: 565 million USDT is tied up in futures—a huge amount—but open interest fell 8.46% over the past 7 days while the price rose 4.77%. Price up, open interest down: that’s shorts closing, not new money going long. A rally driven by shorts covering can easily give back its gains. What’s more, aggressive buying accounted for only 51.9% over the past seven days. The bulls simply haven’t taken over.
The broader direction hasn’t turned bad. The current price of 1,243.73 is 70% above the 5–6 month average cost of 728, with the MA144 providing support at 760. The weekly chart is up 162.5% over eight weeks. The long-term, weekly, and 1h timeframes all lean in the same bullish direction. But the daily moving averages are tangled, and the 4h and 12h charts are still in a bearish alignment—that’s a classic case of “the big-picture trend is up, but the short-term rhythm is still being sorted out.” Longer timeframes set the direction; the timeframes from 12h to weekly set the pace. For today and tomorrow, watch the 1h and 4h charts. Don’t use the weekly outlook to gloss over what’s happening right now.
The problem is the price level. The first resistance above is 1,268.69, just 2.01% from the current price; the first support below is the 1,200 round-number level, 3.52% away. A normal day’s move is 10.49%. There’s a wall 2% above, while you have to fall 3.5% to reach the floor. That makes the risk/reward ratio 0.57—you’re risking twice as much as you could gain. Even worse, the 4h volume ratio is only 0.55. A low-volume push into 1,268.69 is prone to false breakouts. Anyone chasing here would be betting a full day’s worth of volatility on a 2-point breakout. It’s not worth it.
Yesterday left one loose end: the price dipped to 1,075 intraday, then rallied back to close at 1,221.4, above 1,112.77. That long lower wick was a false breakdown; the price recovered after being knocked down. This also explains the current retracement: after rising from 451.75 to 1,698, it has now given back only 36% of the move, remaining in shallow-retracement territory. The uptrend is still intact.
So the trading plan is bullish, but don’t act yet—stay on the sidelines. The reason is that price is sitting right by a key level, with less than a quarter of a day’s normal movement in upside potential, and there’s no sensible place to put a stop-loss. For a long trade, a stop based on three times the daily range would need to be at 852, 31.47% below the current price. That’s not a meaningful risk distance. The level to wait for is a sustained break above 1,268.69. Only then would the current resistance have truly been cleared. At that point, the first target would be 1,296.02, followed by the next round-number level at 1,300.
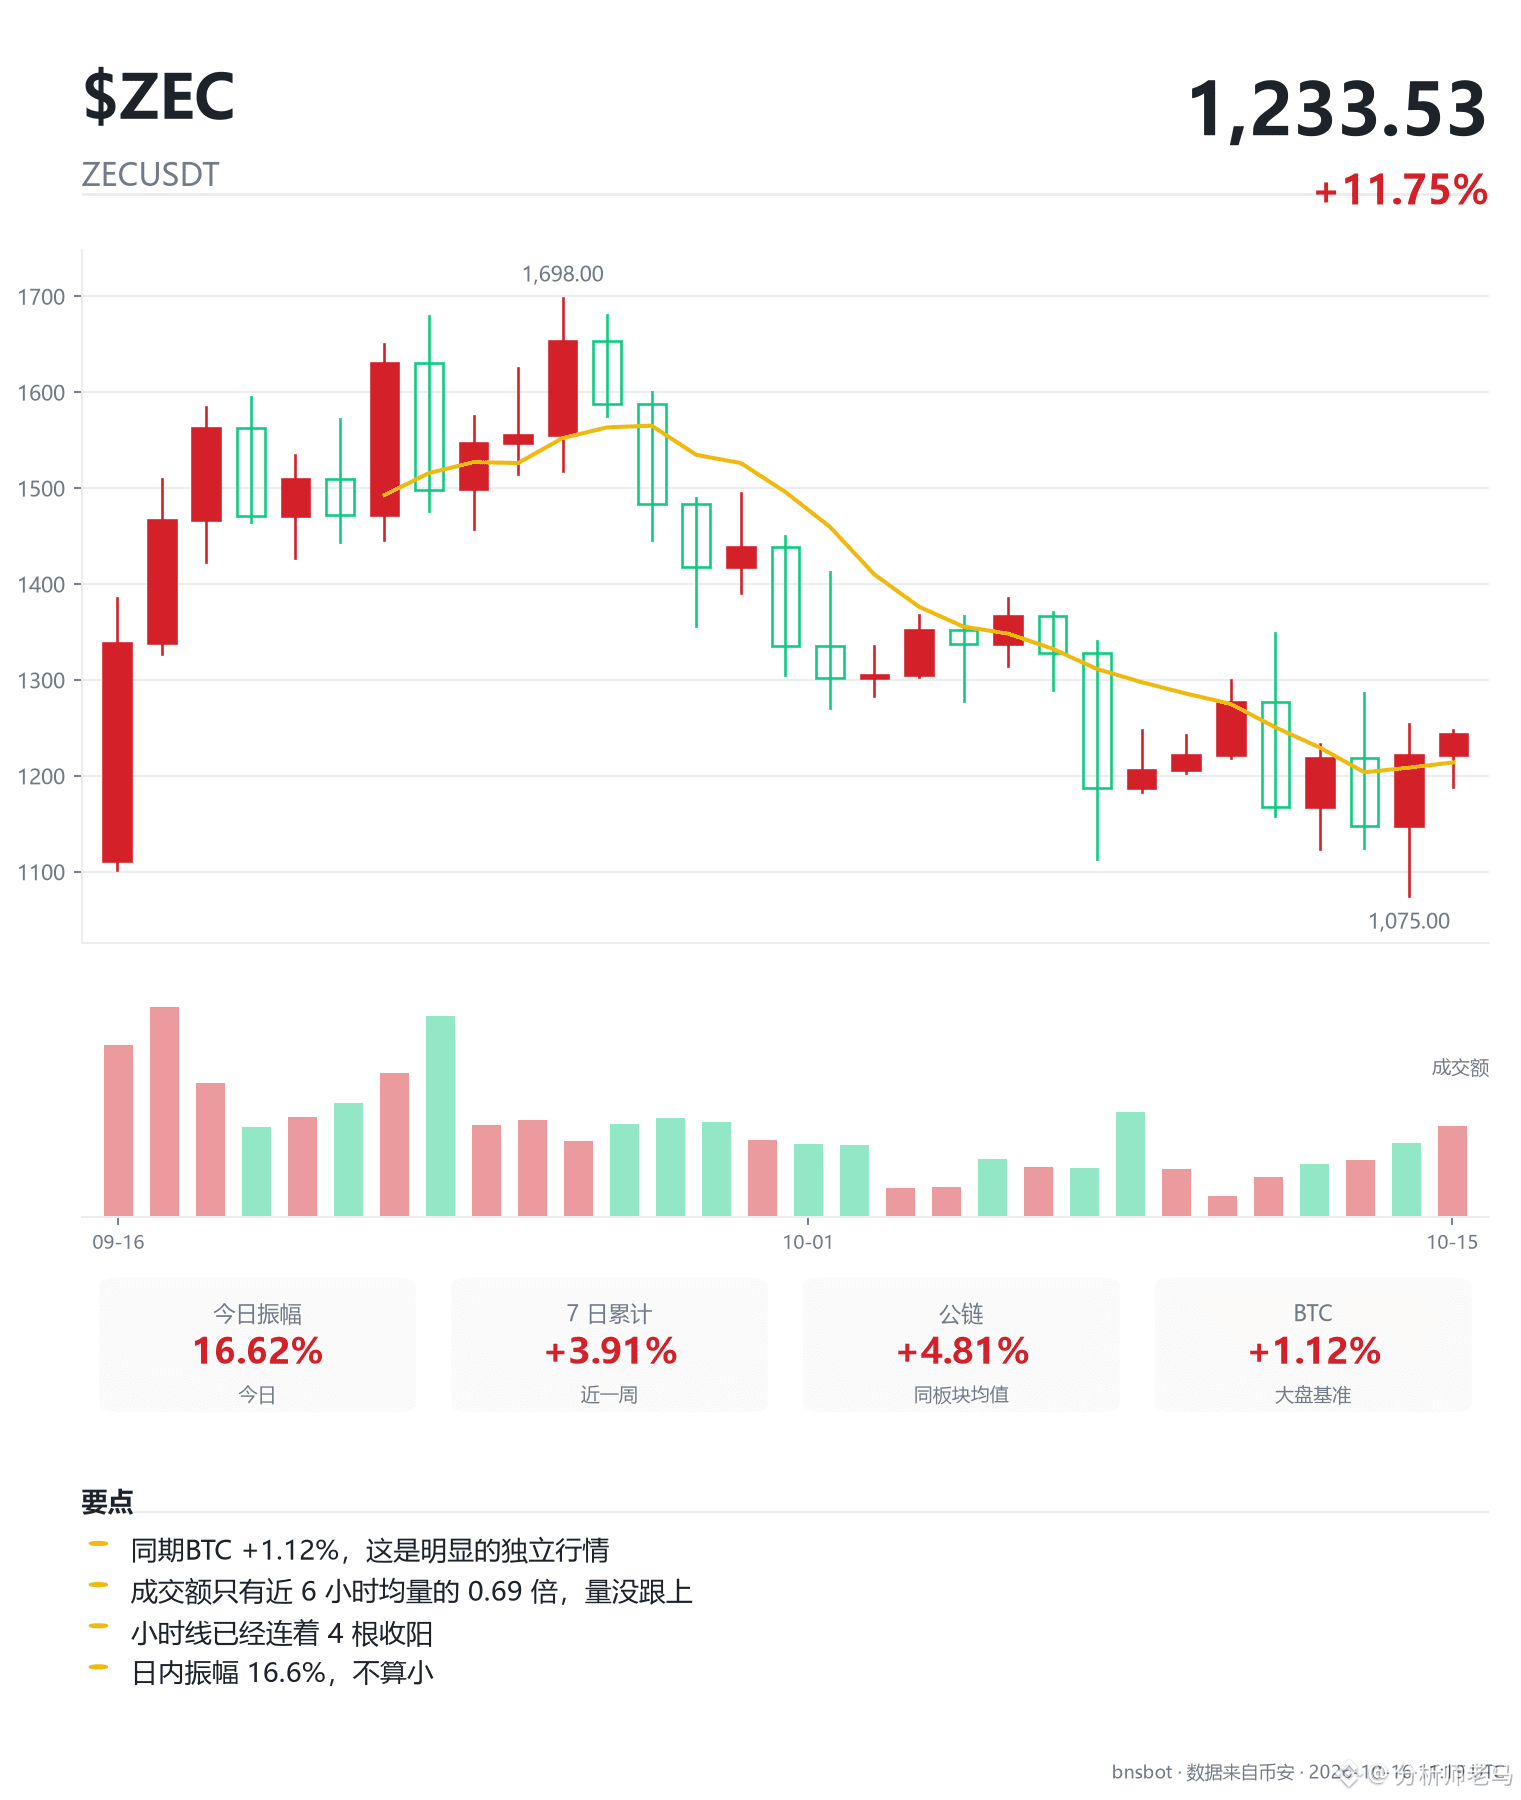
4
·
--
SOXSB: Moving averages are tangled, but price is holding up. A short-term long may work, but don’t call it a trend.
It’s up 34% this week—and gained 34% in a single day. That looks impressive, but don’t rush to call it a trend. The weekly chart is down 15.9% over the past eight weeks, so the direction is still downward. The daily chart, meanwhile, is bullish. When timeframes conflict, first work out which one sets the direction and which one sets the timing. There isn’t enough data on the longer timeframe to calculate the cost basis over five months or more, so that timeframe has to be discarded. Step down one level and follow the weekly chart: down. This daily rally is a pullback against the trend, not a reversal. Let the 1h and 4h charts guide the timing.
So, is a short-term long trade viable? The 1h moving averages are in a bullish alignment, have just formed a golden cross, and price is above them. The 4h chart is also in a bullish alignment. But volume has weakened the signal for today and tomorrow: the 4h volume ratio is 0.36, and full-day volume is just 0.28 times normal—volume is drying up. A push higher on declining volume makes the directional signal less convincing.
The real issue is the price level. The first resistance above is 45.68, just 0.64% above the current price, while the normal daily range is 7.7%. That leaves less than a quarter of a day’s typical range to the upside—price is right up against a wall. A drop of just 0.86% would hit the key round-number level of 45. Risking a full day’s range for a 0.64% breakout doesn’t make sense. So the bias is bearish, and it’s not time to enter: wait for a decisive break below 45 to open up room to the downside. Looking back, price plunged from 77.35 to 28.5, a 63% decline. It has now rebounded only 35% and hasn’t even reached the 38.2% retracement level at 47.16—the bears haven’t faced meaningful resistance yet.
If you’re bullish, the key thing to watch is a high-volume move that holds above 45.68. Only then is there room to run; a low-volume push higher is a prime setup for a false breakout. If you do hold a position, your stop would need to be more than 23% away; otherwise, the 7.7% average daily range could easily stop you out.
One more thing stands out: price is already 18.5% above its 7-day average, making it severely overbought in the short term. It has outperformed the S&P 500 by 49.6 points over 7 days, but is lagging by 12.9 points over 30 days—the strength is fading. Don’t mistake this week’s explosive move for a solid foundation right now.
$SOXSB
SOXSB: Moving averages are tangled, but price is holding up. A short-term long may work, but don’t call it a trend.
It’s up 34% this week—and gained 34% in a single day. That looks impressive, but don’t rush to call it a trend. The weekly chart is down 15.9% over the past eight weeks, so the direction is still downward. The daily chart, meanwhile, is bullish. When timeframes conflict, first work out which one sets the direction and which one sets the timing. There isn’t enough data on the longer timeframe to calculate the cost basis over five months or more, so that timeframe has to be discarded. Step down one level and follow the weekly chart: down. This daily rally is a pullback against the trend, not a reversal. Let the 1h and 4h charts guide the timing.
So, is a short-term long trade viable? The 1h moving averages are in a bullish alignment, have just formed a golden cross, and price is above them. The 4h chart is also in a bullish alignment. But volume has weakened the signal for today and tomorrow: the 4h volume ratio is 0.36, and full-day volume is just 0.28 times normal—volume is drying up. A push higher on declining volume makes the directional signal less convincing.
The real issue is the price level. The first resistance above is 45.68, just 0.64% above the current price, while the normal daily range is 7.7%. That leaves less than a quarter of a day’s typical range to the upside—price is right up against a wall. A drop of just 0.86% would hit the key round-number level of 45. Risking a full day’s range for a 0.64% breakout doesn’t make sense. So the bias is bearish, and it’s not time to enter: wait for a decisive break below 45 to open up room to the downside. Looking back, price plunged from 77.35 to 28.5, a 63% decline. It has now rebounded only 35% and hasn’t even reached the 38.2% retracement level at 47.16—the bears haven’t faced meaningful resistance yet.
If you’re bullish, the key thing to watch is a high-volume move that holds above 45.68. Only then is there room to run; a low-volume push higher is a prime setup for a false breakout. If you do hold a position, your stop would need to be more than 23% away; otherwise, the 7.7% average daily range could easily stop you out.
One more thing stands out: price is already 18.5% above its 7-day average, making it severely overbought in the short term. It has outperformed the S&P 500 by 49.6 points over 7 days, but is lagging by 12.9 points over 30 days—the strength is fading. Don’t mistake this week’s explosive move for a solid foundation right now.
$SOXSB
It’s up 34% this week—and gained 34% in a single day. That looks impressive, but don’t rush to call it a trend. The weekly chart is down 15.9% over the past eight weeks, so the direction is still downward. The daily chart, meanwhile, is bullish. When timeframes conflict, first work out which one sets the direction and which one sets the timing. There isn’t enough data on the longer timeframe to calculate the cost basis over five months or more, so that timeframe has to be discarded. Step down one level and follow the weekly chart: down. This daily rally is a pullback against the trend, not a reversal. Let the 1h and 4h charts guide the timing.
So, is a short-term long trade viable? The 1h moving averages are in a bullish alignment, have just formed a golden cross, and price is above them. The 4h chart is also in a bullish alignment. But volume has weakened the signal for today and tomorrow: the 4h volume ratio is 0.36, and full-day volume is just 0.28 times normal—volume is drying up. A push higher on declining volume makes the directional signal less convincing.
The real issue is the price level. The first resistance above is 45.68, just 0.64% above the current price, while the normal daily range is 7.7%. That leaves less than a quarter of a day’s typical range to the upside—price is right up against a wall. A drop of just 0.86% would hit the key round-number level of 45. Risking a full day’s range for a 0.64% breakout doesn’t make sense. So the bias is bearish, and it’s not time to enter: wait for a decisive break below 45 to open up room to the downside. Looking back, price plunged from 77.35 to 28.5, a 63% decline. It has now rebounded only 35% and hasn’t even reached the 38.2% retracement level at 47.16—the bears haven’t faced meaningful resistance yet.
If you’re bullish, the key thing to watch is a high-volume move that holds above 45.68. Only then is there room to run; a low-volume push higher is a prime setup for a false breakout. If you do hold a position, your stop would need to be more than 23% away; otherwise, the 7.7% average daily range could easily stop you out.
One more thing stands out: price is already 18.5% above its 7-day average, making it severely overbought in the short term. It has outperformed the S&P 500 by 49.6 points over 7 days, but is lagging by 12.9 points over 30 days—the strength is fading. Don’t mistake this week’s explosive move for a solid foundation right now.
$SOXSB
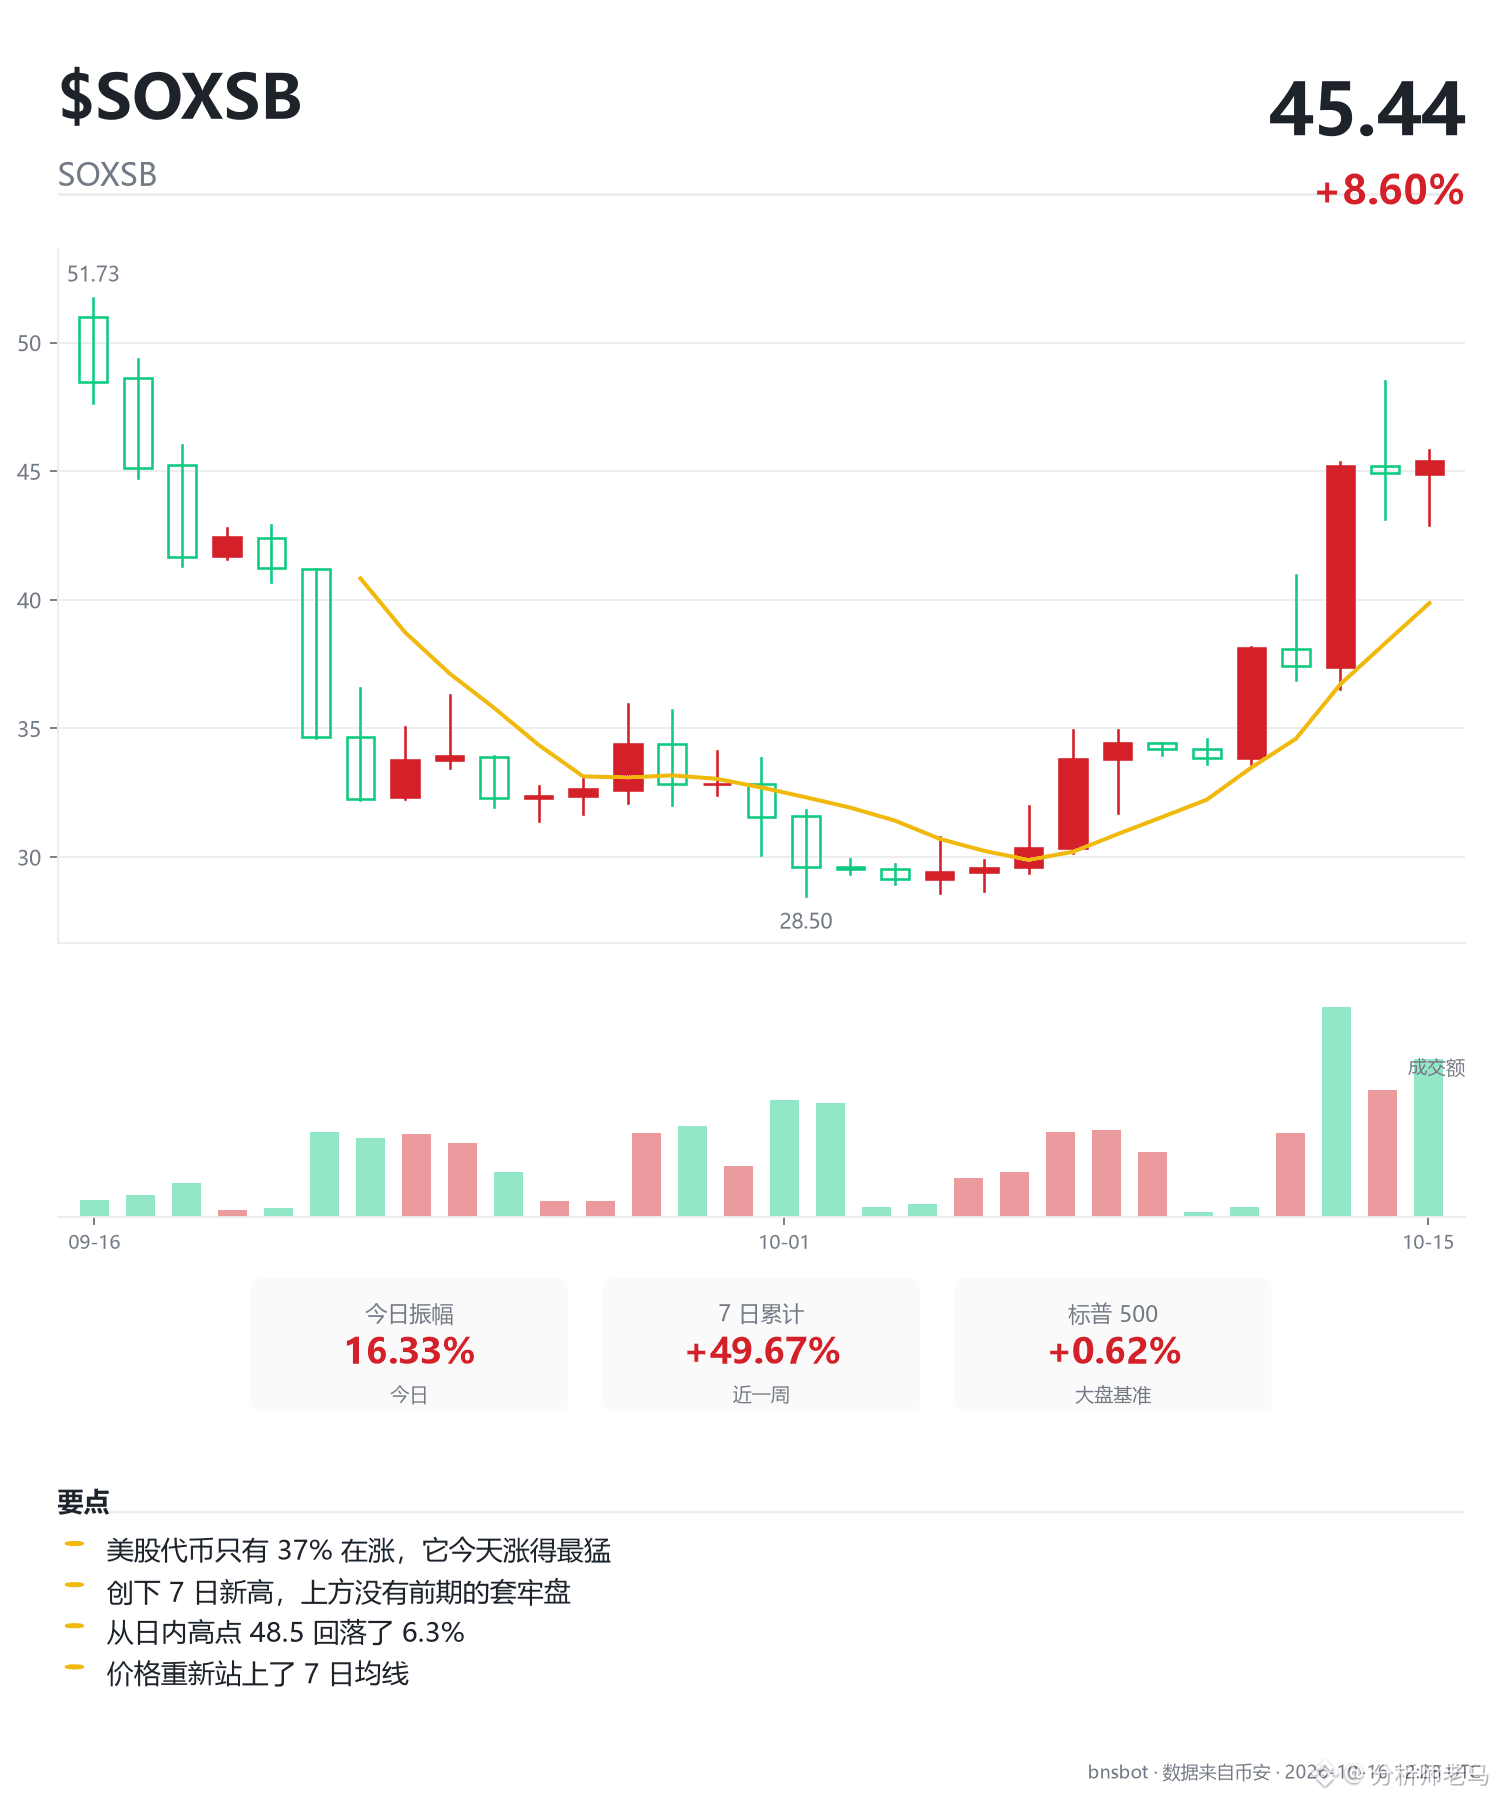
4
·
--
SOXLB hasn’t given either bulls or bears an edge. Let it find its own direction.
It’s down 26% in a week, already 17% below its 7-day average, and its RSI has fallen to 30. By every measure, it’s been one of the hardest-hit. Yet today it rose 1.8%, reaching a high of 109.48 and closing at 104.79. A bounce like this after such a steep decline shows that there are buyers stepping in at these levels.
But there aren’t many. 24-hour volume was just 0.37x its usual level—so low that the move has lost almost all its conviction. Price is moving up while volume falls. That makes for a weak bounce, not a rush of serious buying; it looks more like the price rebounding on its own after the selling stopped, with no one stepping in to keep selling.
The position is even more awkward. 106.04 overhead is the first resistance, just 1.19% above the current price, while its normal daily range is 13%. It only needs to rise 1.19% to hit resistance, but would need to fall 4.57% to reach the support around 100. That puts the reward-to-risk ratio at 0.26: the risk is four times the potential reward. Going long here means betting a full day’s worth of price movement on a breakout of less than 1.2%—not worth it. The 4h volume ratio is 0.59, and a low-volume push into a key level is exactly where false breakouts tend to happen.
Below, 100 and 99.25 form a cluster of support. The 99.25 swing low has been tested twice and also lines up with the weekly chart, making it more significant than an ordinary level. A decisive break below it would change the short-term structure; anyone holding here should consider reducing their position. Further down is 85.95, the extreme low from this decline.
On the longer timeframes, it has only been listed for 101 days, so there isn’t enough data to calculate a cost basis over five months or longer. Neither the longer-term nor weekly chart offers a clear direction. The 3d, 12h, and 1h charts are all tangled, and the only timeframes showing real movement are the daily and 4h charts—and both lean bearish. In other words, the directional signal is isolated: one timeframe says bearish, and one more agrees, but that’s not enough to support a complete thesis. This isn’t “bulls and bears disagreeing”; it’s more like only one leg is moving.
Fund-flow metrics don’t apply here—this is a tokenized U.S. stock, with no funding rate, open interest, or long/short ratio. The only useful comparison is its relative strength versus the S&P 500: it has underperformed by 36 points over 7 days and 16 points over 30 days. It’s not just drifting with the market; it’s selling off on its own.
So I’m not calling a direction this time. It’s not that the bears don’t have the advantage; it’s that there’s no room for a sensible stop at this level. For a long, a stop based on twice the daily range would be around 77.5, 26% below the current price, while the first upside target is only 1.19% away. The risk/reward simply doesn’t work. Shorting is just as awkward, since a rebound could sweep you out at any time. The price is too congested and the odds are too poor. Trading here would just be handing money to the market.
$SOXLB
SOXLB hasn’t given either bulls or bears an edge. Let it find its own direction.
It’s down 26% in a week, already 17% below its 7-day average, and its RSI has fallen to 30. By every measure, it’s been one of the hardest-hit. Yet today it rose 1.8%, reaching a high of 109.48 and closing at 104.79. A bounce like this after such a steep decline shows that there are buyers stepping in at these levels.
But there aren’t many. 24-hour volume was just 0.37x its usual level—so low that the move has lost almost all its conviction. Price is moving up while volume falls. That makes for a weak bounce, not a rush of serious buying; it looks more like the price rebounding on its own after the selling stopped, with no one stepping in to keep selling.
The position is even more awkward. 106.04 overhead is the first resistance, just 1.19% above the current price, while its normal daily range is 13%. It only needs to rise 1.19% to hit resistance, but would need to fall 4.57% to reach the support around 100. That puts the reward-to-risk ratio at 0.26: the risk is four times the potential reward. Going long here means betting a full day’s worth of price movement on a breakout of less than 1.2%—not worth it. The 4h volume ratio is 0.59, and a low-volume push into a key level is exactly where false breakouts tend to happen.
Below, 100 and 99.25 form a cluster of support. The 99.25 swing low has been tested twice and also lines up with the weekly chart, making it more significant than an ordinary level. A decisive break below it would change the short-term structure; anyone holding here should consider reducing their position. Further down is 85.95, the extreme low from this decline.
On the longer timeframes, it has only been listed for 101 days, so there isn’t enough data to calculate a cost basis over five months or longer. Neither the longer-term nor weekly chart offers a clear direction. The 3d, 12h, and 1h charts are all tangled, and the only timeframes showing real movement are the daily and 4h charts—and both lean bearish. In other words, the directional signal is isolated: one timeframe says bearish, and one more agrees, but that’s not enough to support a complete thesis. This isn’t “bulls and bears disagreeing”; it’s more like only one leg is moving.
Fund-flow metrics don’t apply here—this is a tokenized U.S. stock, with no funding rate, open interest, or long/short ratio. The only useful comparison is its relative strength versus the S&P 500: it has underperformed by 36 points over 7 days and 16 points over 30 days. It’s not just drifting with the market; it’s selling off on its own.
So I’m not calling a direction this time. It’s not that the bears don’t have the advantage; it’s that there’s no room for a sensible stop at this level. For a long, a stop based on twice the daily range would be around 77.5, 26% below the current price, while the first upside target is only 1.19% away. The risk/reward simply doesn’t work. Shorting is just as awkward, since a rebound could sweep you out at any time. The price is too congested and the odds are too poor. Trading here would just be handing money to the market.
$SOXLB
It’s down 26% in a week, already 17% below its 7-day average, and its RSI has fallen to 30. By every measure, it’s been one of the hardest-hit. Yet today it rose 1.8%, reaching a high of 109.48 and closing at 104.79. A bounce like this after such a steep decline shows that there are buyers stepping in at these levels.
But there aren’t many. 24-hour volume was just 0.37x its usual level—so low that the move has lost almost all its conviction. Price is moving up while volume falls. That makes for a weak bounce, not a rush of serious buying; it looks more like the price rebounding on its own after the selling stopped, with no one stepping in to keep selling.
The position is even more awkward. 106.04 overhead is the first resistance, just 1.19% above the current price, while its normal daily range is 13%. It only needs to rise 1.19% to hit resistance, but would need to fall 4.57% to reach the support around 100. That puts the reward-to-risk ratio at 0.26: the risk is four times the potential reward. Going long here means betting a full day’s worth of price movement on a breakout of less than 1.2%—not worth it. The 4h volume ratio is 0.59, and a low-volume push into a key level is exactly where false breakouts tend to happen.
Below, 100 and 99.25 form a cluster of support. The 99.25 swing low has been tested twice and also lines up with the weekly chart, making it more significant than an ordinary level. A decisive break below it would change the short-term structure; anyone holding here should consider reducing their position. Further down is 85.95, the extreme low from this decline.
On the longer timeframes, it has only been listed for 101 days, so there isn’t enough data to calculate a cost basis over five months or longer. Neither the longer-term nor weekly chart offers a clear direction. The 3d, 12h, and 1h charts are all tangled, and the only timeframes showing real movement are the daily and 4h charts—and both lean bearish. In other words, the directional signal is isolated: one timeframe says bearish, and one more agrees, but that’s not enough to support a complete thesis. This isn’t “bulls and bears disagreeing”; it’s more like only one leg is moving.
Fund-flow metrics don’t apply here—this is a tokenized U.S. stock, with no funding rate, open interest, or long/short ratio. The only useful comparison is its relative strength versus the S&P 500: it has underperformed by 36 points over 7 days and 16 points over 30 days. It’s not just drifting with the market; it’s selling off on its own.
So I’m not calling a direction this time. It’s not that the bears don’t have the advantage; it’s that there’s no room for a sensible stop at this level. For a long, a stop based on twice the daily range would be around 77.5, 26% below the current price, while the first upside target is only 1.19% away. The risk/reward simply doesn’t work. Shorting is just as awkward, since a rebound could sweep you out at any time. The price is too congested and the odds are too poor. Trading here would just be handing money to the market.
$SOXLB
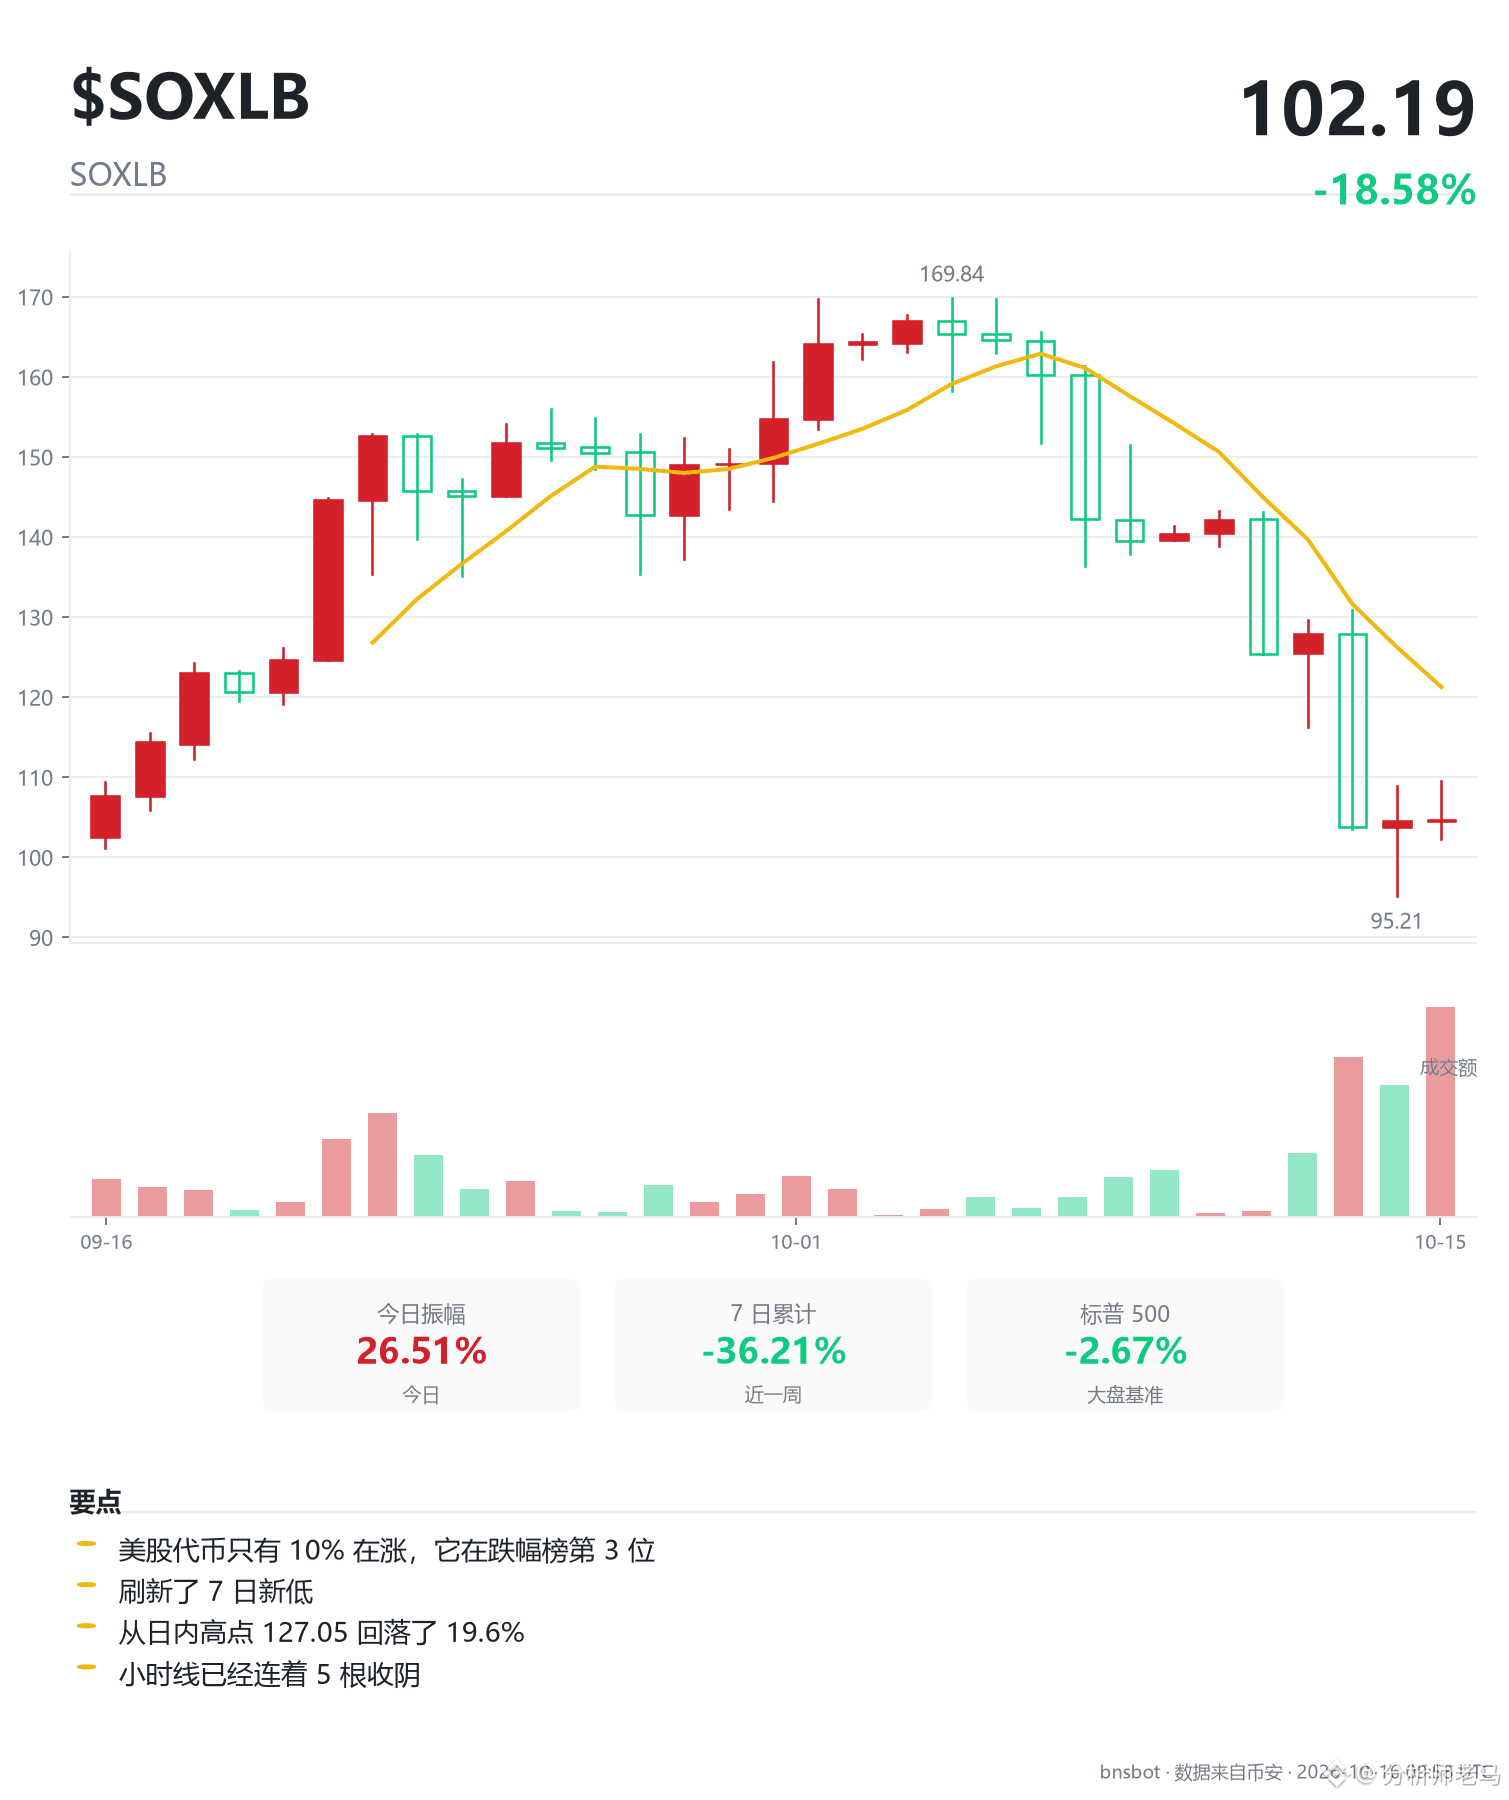
12
·
--
【Learn to Read Candlestick Charts · Lesson 7】Bearish Engulfing: One Bearish Candle Swallows the Whole Thing
Prices are climbing along nicely, then suddenly one day the market opens higher and falls throughout the session. A long bearish candle completely swallows the previous day’s bullish candle. Buyers can’t get in, while sellers are lining up to get out.
That’s a bearish engulfing pattern—the mirror image of the bullish engulfing pattern we covered last time. It appears after an uptrend: the previous day’s candle is bullish, with buyers in control; today, a larger bearish candle completely engulfs yesterday’s real body. The message is simple: the buying momentum has run out, and sellers have taken over.
It’s easier to see on the chart. ① The previous day, prices were still rising and buyers were in charge. ② Today’s bearish candle opens and closes in a way that completely covers yesterday’s bullish candle. Selling pressure has hit all at once, clearly overpowering the buyers. But the pattern alone isn’t enough—you also need to consider where it appears. It carries more weight when it forms near a clear resistance level and is accompanied by higher volume.
What should you do when you see one? If you’re already in a position, your first move should be to tighten your stop-loss, not close everything. Let the market decide whether the position stays open. If you’re flat, avoid chasing prices higher near this level; don’t immediately flip to a short position. Neither move is about predicting what comes next—it’s about putting your defenses in place first.
Here’s where people most often learn an expensive lesson: they mistake a bearish engulfing pattern during an uptrend for a market top and sell everything. In a trend, an engulfing pattern is often just a shakeout, scaring out less committed holders before prices continue higher. To judge whether the trend is truly weakening, watch to see whether price breaks below the pattern’s low. Until then, it’s a suspect, not a criminal.
#engulfing
【Learn to Read Candlestick Charts · Lesson 7】Bearish Engulfing: One Bearish Candle Swallows the Whole Thing
Prices are climbing along nicely, then suddenly one day the market opens higher and falls throughout the session. A long bearish candle completely swallows the previous day’s bullish candle. Buyers can’t get in, while sellers are lining up to get out.
That’s a bearish engulfing pattern—the mirror image of the bullish engulfing pattern we covered last time. It appears after an uptrend: the previous day’s candle is bullish, with buyers in control; today, a larger bearish candle completely engulfs yesterday’s real body. The message is simple: the buying momentum has run out, and sellers have taken over.
It’s easier to see on the chart. ① The previous day, prices were still rising and buyers were in charge. ② Today’s bearish candle opens and closes in a way that completely covers yesterday’s bullish candle. Selling pressure has hit all at once, clearly overpowering the buyers. But the pattern alone isn’t enough—you also need to consider where it appears. It carries more weight when it forms near a clear resistance level and is accompanied by higher volume.
What should you do when you see one? If you’re already in a position, your first move should be to tighten your stop-loss, not close everything. Let the market decide whether the position stays open. If you’re flat, avoid chasing prices higher near this level; don’t immediately flip to a short position. Neither move is about predicting what comes next—it’s about putting your defenses in place first.
Here’s where people most often learn an expensive lesson: they mistake a bearish engulfing pattern during an uptrend for a market top and sell everything. In a trend, an engulfing pattern is often just a shakeout, scaring out less committed holders before prices continue higher. To judge whether the trend is truly weakening, watch to see whether price breaks below the pattern’s low. Until then, it’s a suspect, not a criminal.
#engulfing
Prices are climbing along nicely, then suddenly one day the market opens higher and falls throughout the session. A long bearish candle completely swallows the previous day’s bullish candle. Buyers can’t get in, while sellers are lining up to get out.
That’s a bearish engulfing pattern—the mirror image of the bullish engulfing pattern we covered last time. It appears after an uptrend: the previous day’s candle is bullish, with buyers in control; today, a larger bearish candle completely engulfs yesterday’s real body. The message is simple: the buying momentum has run out, and sellers have taken over.
It’s easier to see on the chart. ① The previous day, prices were still rising and buyers were in charge. ② Today’s bearish candle opens and closes in a way that completely covers yesterday’s bullish candle. Selling pressure has hit all at once, clearly overpowering the buyers. But the pattern alone isn’t enough—you also need to consider where it appears. It carries more weight when it forms near a clear resistance level and is accompanied by higher volume.
What should you do when you see one? If you’re already in a position, your first move should be to tighten your stop-loss, not close everything. Let the market decide whether the position stays open. If you’re flat, avoid chasing prices higher near this level; don’t immediately flip to a short position. Neither move is about predicting what comes next—it’s about putting your defenses in place first.
Here’s where people most often learn an expensive lesson: they mistake a bearish engulfing pattern during an uptrend for a market top and sell everything. In a trend, an engulfing pattern is often just a shakeout, scaring out less committed holders before prices continue higher. To judge whether the trend is truly weakening, watch to see whether price breaks below the pattern’s low. Until then, it’s a suspect, not a criminal.
#engulfing
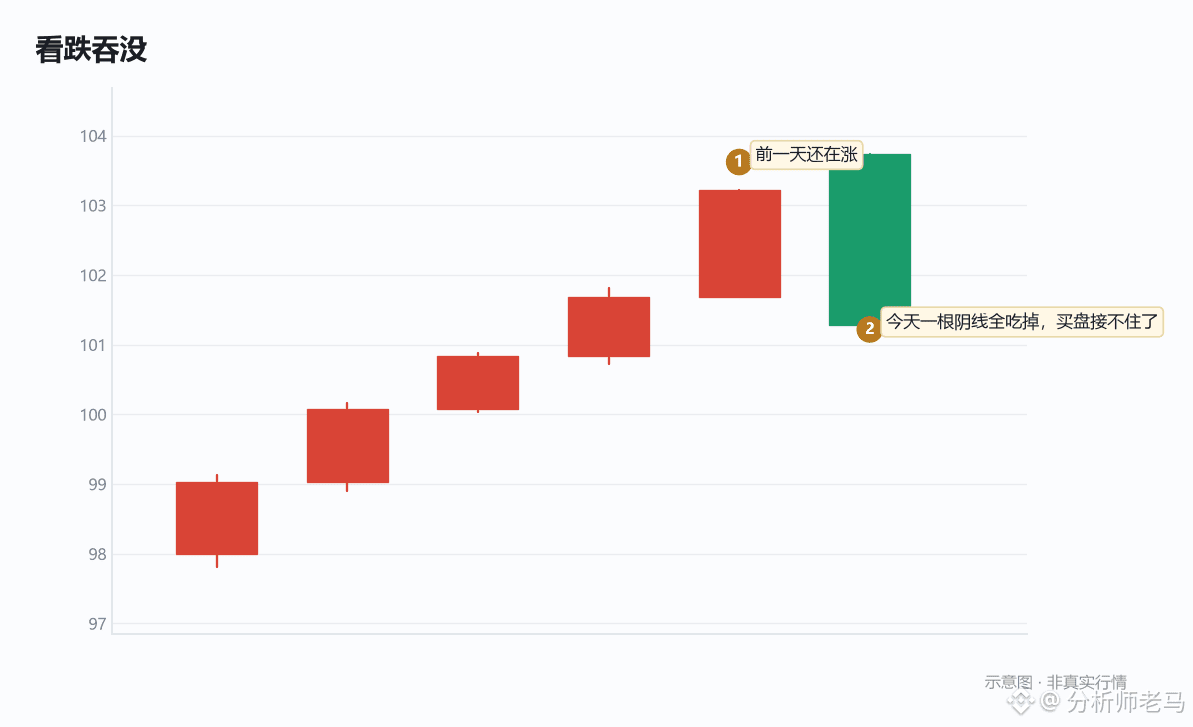
1
·
--
AAOIB down 9.92% intraday—the price is falling, yet aggressive buying is dominating
This is a little interesting. The price has dropped nearly 10%, but aggressive buys still account for 56.3% of trading volume, or 51.9% over the past seven days. Money is flowing in to buy the dip, not being dumped. Yet the price has still fallen all the way from 88.6 to 74.43, down 30.71% in a week and 26.7% over eight weeks. The fact that more people are buying suggests some are betting on a rebound, but those bets haven’t paid off yet.
First, let’s be clear about the trend: the weekly chart is pointing down, and the daily chart shows a bearish moving-average alignment. These two timeframes agree, so the main bias is bearish—there’s no need to guess. The token has only been listed for 94 days, so we can’t calculate a cost basis for periods longer than five months; that long-term column is blank. So we step down one level and use the weekly chart as our guide. Since the weekly trend is down, we need to look at the 12h, daily, 3d, and weekly timeframes for the rhythm. The 3d candle is down 34.43%, with a volume ratio of 2.45—the selling pressure is very real. The 4h chart is also below its moving averages, with a volume ratio of just 0.77 and an RSI of 20.6. The drop is sharp, but there’s no one stepping in to buy.
What’s really making it hard to act is the price level. The current price is 76.17. Above it, 77 is a round-number level, just 1.09% away; below it, 76 is also a round-number level, just 0.22% away. And this token’s normal daily volatility is 12.04%. Betting on a 1.09% breakout using a full day’s worth of volatility gives you a reward-to-risk ratio of just 0.02. However you calculate it, the trade isn’t worth it. That’s why the trade_plan says to wait and see—the bias is bearish, but this isn’t the time to act. It’s not because the direction is unclear; it’s because there’s no room to place a stop-loss, and the potential upside is barely worth mentioning.
Now, two details to note. First, six candles ago, the price surged above 112, briefly spiked to 123 intraday, then fell back to close at 107.9. It broke above a key level but closed back below it—that was a false breakout, and anyone who chased that candle is still stuck in the trade. Second, the heavy trading zone above is around 137.6, with the value area high at 139.38. The current price is 80% below that level. There’s little overhead supply from trapped buyers, but that doesn’t mean the price can rise; it only means that if it does rise, it won’t immediately hit a wall. First, it has to go up.
So what would make it actionable? A break below 75. Once there’s more room to fall, we can look toward the round-number level at 70, and the reward-to-risk ratio may then be worth discussing. Conversely, if the price moves back above 103.69, admit the trade idea was wrong and exit—that’s a level three times the daily volatility away. If you’re eager to buy the dip, think this through first: a break below 76 would weaken the short-term structure. That’s a level to reduce your position, not add to it.
$AAOIB
AAOIB down 9.92% intraday—the price is falling, yet aggressive buying is dominating
This is a little interesting. The price has dropped nearly 10%, but aggressive buys still account for 56.3% of trading volume, or 51.9% over the past seven days. Money is flowing in to buy the dip, not being dumped. Yet the price has still fallen all the way from 88.6 to 74.43, down 30.71% in a week and 26.7% over eight weeks. The fact that more people are buying suggests some are betting on a rebound, but those bets haven’t paid off yet.
First, let’s be clear about the trend: the weekly chart is pointing down, and the daily chart shows a bearish moving-average alignment. These two timeframes agree, so the main bias is bearish—there’s no need to guess. The token has only been listed for 94 days, so we can’t calculate a cost basis for periods longer than five months; that long-term column is blank. So we step down one level and use the weekly chart as our guide. Since the weekly trend is down, we need to look at the 12h, daily, 3d, and weekly timeframes for the rhythm. The 3d candle is down 34.43%, with a volume ratio of 2.45—the selling pressure is very real. The 4h chart is also below its moving averages, with a volume ratio of just 0.77 and an RSI of 20.6. The drop is sharp, but there’s no one stepping in to buy.
What’s really making it hard to act is the price level. The current price is 76.17. Above it, 77 is a round-number level, just 1.09% away; below it, 76 is also a round-number level, just 0.22% away. And this token’s normal daily volatility is 12.04%. Betting on a 1.09% breakout using a full day’s worth of volatility gives you a reward-to-risk ratio of just 0.02. However you calculate it, the trade isn’t worth it. That’s why the trade_plan says to wait and see—the bias is bearish, but this isn’t the time to act. It’s not because the direction is unclear; it’s because there’s no room to place a stop-loss, and the potential upside is barely worth mentioning.
Now, two details to note. First, six candles ago, the price surged above 112, briefly spiked to 123 intraday, then fell back to close at 107.9. It broke above a key level but closed back below it—that was a false breakout, and anyone who chased that candle is still stuck in the trade. Second, the heavy trading zone above is around 137.6, with the value area high at 139.38. The current price is 80% below that level. There’s little overhead supply from trapped buyers, but that doesn’t mean the price can rise; it only means that if it does rise, it won’t immediately hit a wall. First, it has to go up.
So what would make it actionable? A break below 75. Once there’s more room to fall, we can look toward the round-number level at 70, and the reward-to-risk ratio may then be worth discussing. Conversely, if the price moves back above 103.69, admit the trade idea was wrong and exit—that’s a level three times the daily volatility away. If you’re eager to buy the dip, think this through first: a break below 76 would weaken the short-term structure. That’s a level to reduce your position, not add to it.
$AAOIB
This is a little interesting. The price has dropped nearly 10%, but aggressive buys still account for 56.3% of trading volume, or 51.9% over the past seven days. Money is flowing in to buy the dip, not being dumped. Yet the price has still fallen all the way from 88.6 to 74.43, down 30.71% in a week and 26.7% over eight weeks. The fact that more people are buying suggests some are betting on a rebound, but those bets haven’t paid off yet.
First, let’s be clear about the trend: the weekly chart is pointing down, and the daily chart shows a bearish moving-average alignment. These two timeframes agree, so the main bias is bearish—there’s no need to guess. The token has only been listed for 94 days, so we can’t calculate a cost basis for periods longer than five months; that long-term column is blank. So we step down one level and use the weekly chart as our guide. Since the weekly trend is down, we need to look at the 12h, daily, 3d, and weekly timeframes for the rhythm. The 3d candle is down 34.43%, with a volume ratio of 2.45—the selling pressure is very real. The 4h chart is also below its moving averages, with a volume ratio of just 0.77 and an RSI of 20.6. The drop is sharp, but there’s no one stepping in to buy.
What’s really making it hard to act is the price level. The current price is 76.17. Above it, 77 is a round-number level, just 1.09% away; below it, 76 is also a round-number level, just 0.22% away. And this token’s normal daily volatility is 12.04%. Betting on a 1.09% breakout using a full day’s worth of volatility gives you a reward-to-risk ratio of just 0.02. However you calculate it, the trade isn’t worth it. That’s why the trade_plan says to wait and see—the bias is bearish, but this isn’t the time to act. It’s not because the direction is unclear; it’s because there’s no room to place a stop-loss, and the potential upside is barely worth mentioning.
Now, two details to note. First, six candles ago, the price surged above 112, briefly spiked to 123 intraday, then fell back to close at 107.9. It broke above a key level but closed back below it—that was a false breakout, and anyone who chased that candle is still stuck in the trade. Second, the heavy trading zone above is around 137.6, with the value area high at 139.38. The current price is 80% below that level. There’s little overhead supply from trapped buyers, but that doesn’t mean the price can rise; it only means that if it does rise, it won’t immediately hit a wall. First, it has to go up.
So what would make it actionable? A break below 75. Once there’s more room to fall, we can look toward the round-number level at 70, and the reward-to-risk ratio may then be worth discussing. Conversely, if the price moves back above 103.69, admit the trade idea was wrong and exit—that’s a level three times the daily volatility away. If you’re eager to buy the dip, think this through first: a break below 76 would weaken the short-term structure. That’s a level to reduce your position, not add to it.
$AAOIB
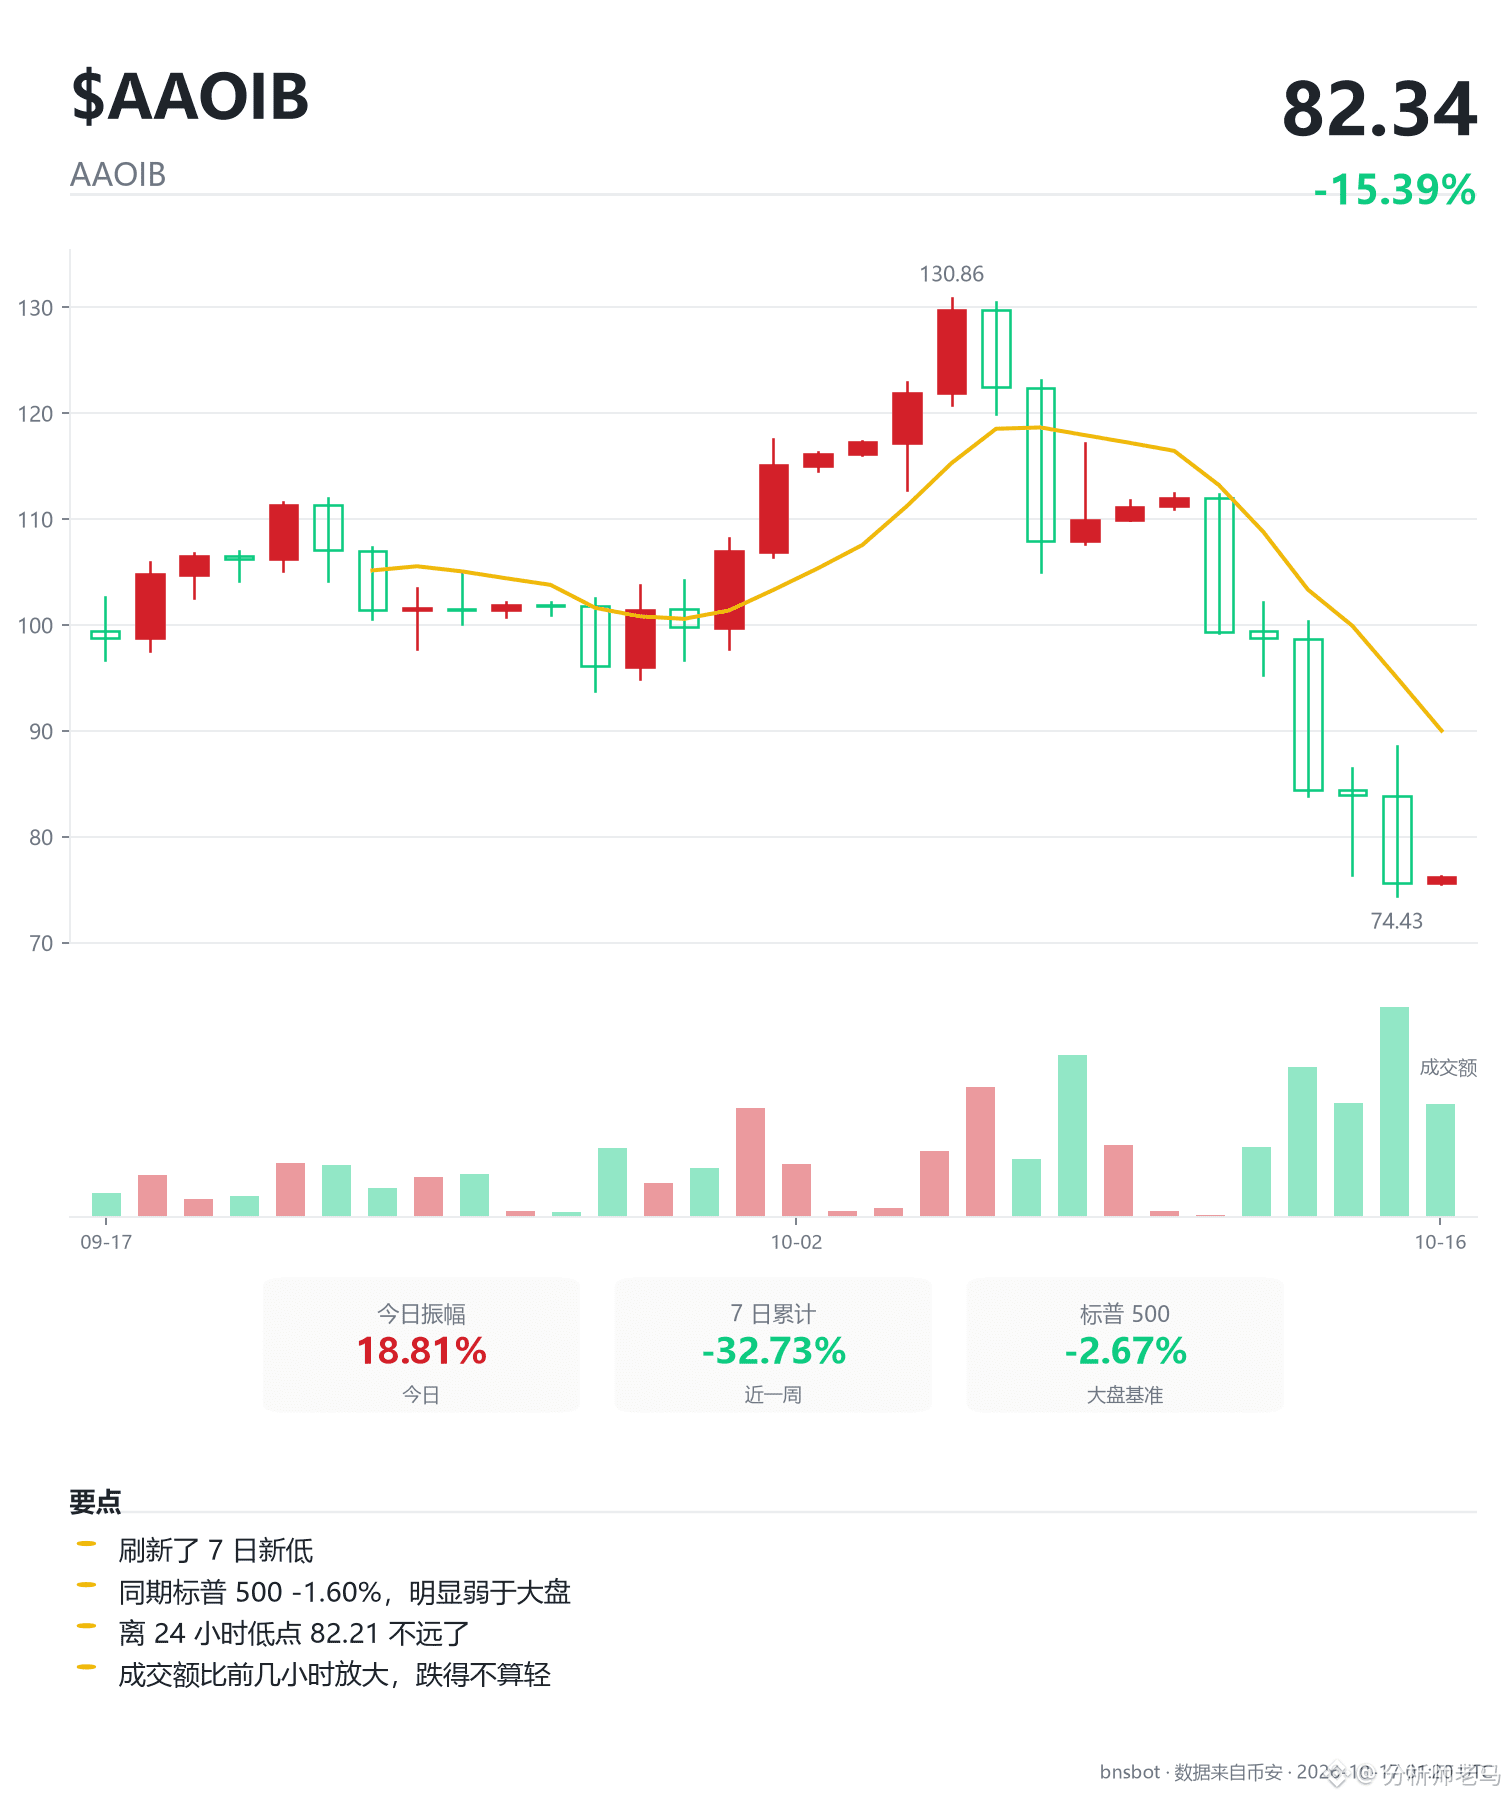
113
·
--
Direxion Daily South Korea Bull 3X Shares (KORU): Bearish alignment, trend clearly pointing down
How sharp has this drop been? Down 17.3% over 8 weeks and 40.38% in one week. It’s now at 10.66, just a hair above this week’s low of 10.07. The weekly trend is down, the daily chart is bearishly aligned, and the 12h chart points the same way—all three timeframes are fully in sync, so there’s no need to guess the direction.
But what’s even more unusual today is the volume. The 4h volume ratio is only 0.66, and 24-hour volume is just 0.27 times normal. Active buying accounts for 50.9% over 24 hours and 55% over seven days—the buyers haven’t left, but no one is really putting money behind the move either. Prices are falling as volume dries up. This decline lacks buyers stepping in, not panic.
The setup is awkward, too. It’s only 3.19% up to the round-number level of 11, but 6.19% down to 10, while its normal daily volatility is 20.65%. Risking a full day’s worth of volatility to capture a 3% move doesn’t make sense. An RSI of 22.4 signals deeply oversold conditions, and the price is already 25.4% below its 7-day average. A bounce could come at any time, but that would be a recovery, not a reversal—from 25.73 to 10.07, it fell 61%, and it has bounced back only 4% so far. That’s a weak rebound.
There’s no support from the sector, either. Comparable index ETFs are down an average of 3.87% today, while KORU is down 9.58%—underperforming the sector by 7.2 percentage points. This is a stock making its own move, so don’t use the broader market as an excuse.
So at this level, the bearish direction is right, but don’t act yet. What are we waiting for? A decisive break below 10 would open up more downside. If it gets back above 17.26, admit the trade is wrong and exit. Don’t get involved while it’s stuck in this narrow range.
$KORU
$KORUB
Direxion Daily South Korea Bull 3X Shares (KORU): Bearish alignment, trend clearly pointing down
How sharp has this drop been? Down 17.3% over 8 weeks and 40.38% in one week. It’s now at 10.66, just a hair above this week’s low of 10.07. The weekly trend is down, the daily chart is bearishly aligned, and the 12h chart points the same way—all three timeframes are fully in sync, so there’s no need to guess the direction.
But what’s even more unusual today is the volume. The 4h volume ratio is only 0.66, and 24-hour volume is just 0.27 times normal. Active buying accounts for 50.9% over 24 hours and 55% over seven days—the buyers haven’t left, but no one is really putting money behind the move either. Prices are falling as volume dries up. This decline lacks buyers stepping in, not panic.
The setup is awkward, too. It’s only 3.19% up to the round-number level of 11, but 6.19% down to 10, while its normal daily volatility is 20.65%. Risking a full day’s worth of volatility to capture a 3% move doesn’t make sense. An RSI of 22.4 signals deeply oversold conditions, and the price is already 25.4% below its 7-day average. A bounce could come at any time, but that would be a recovery, not a reversal—from 25.73 to 10.07, it fell 61%, and it has bounced back only 4% so far. That’s a weak rebound.
There’s no support from the sector, either. Comparable index ETFs are down an average of 3.87% today, while KORU is down 9.58%—underperforming the sector by 7.2 percentage points. This is a stock making its own move, so don’t use the broader market as an excuse.
So at this level, the bearish direction is right, but don’t act yet. What are we waiting for? A decisive break below 10 would open up more downside. If it gets back above 17.26, admit the trade is wrong and exit. Don’t get involved while it’s stuck in this narrow range.
$KORU
$KORUB
How sharp has this drop been? Down 17.3% over 8 weeks and 40.38% in one week. It’s now at 10.66, just a hair above this week’s low of 10.07. The weekly trend is down, the daily chart is bearishly aligned, and the 12h chart points the same way—all three timeframes are fully in sync, so there’s no need to guess the direction.
But what’s even more unusual today is the volume. The 4h volume ratio is only 0.66, and 24-hour volume is just 0.27 times normal. Active buying accounts for 50.9% over 24 hours and 55% over seven days—the buyers haven’t left, but no one is really putting money behind the move either. Prices are falling as volume dries up. This decline lacks buyers stepping in, not panic.
The setup is awkward, too. It’s only 3.19% up to the round-number level of 11, but 6.19% down to 10, while its normal daily volatility is 20.65%. Risking a full day’s worth of volatility to capture a 3% move doesn’t make sense. An RSI of 22.4 signals deeply oversold conditions, and the price is already 25.4% below its 7-day average. A bounce could come at any time, but that would be a recovery, not a reversal—from 25.73 to 10.07, it fell 61%, and it has bounced back only 4% so far. That’s a weak rebound.
There’s no support from the sector, either. Comparable index ETFs are down an average of 3.87% today, while KORU is down 9.58%—underperforming the sector by 7.2 percentage points. This is a stock making its own move, so don’t use the broader market as an excuse.
So at this level, the bearish direction is right, but don’t act yet. What are we waiting for? A decisive break below 10 would open up more downside. If it gets back above 17.26, admit the trade is wrong and exit. Don’t get involved while it’s stuck in this narrow range.
$KORU
$KORUB
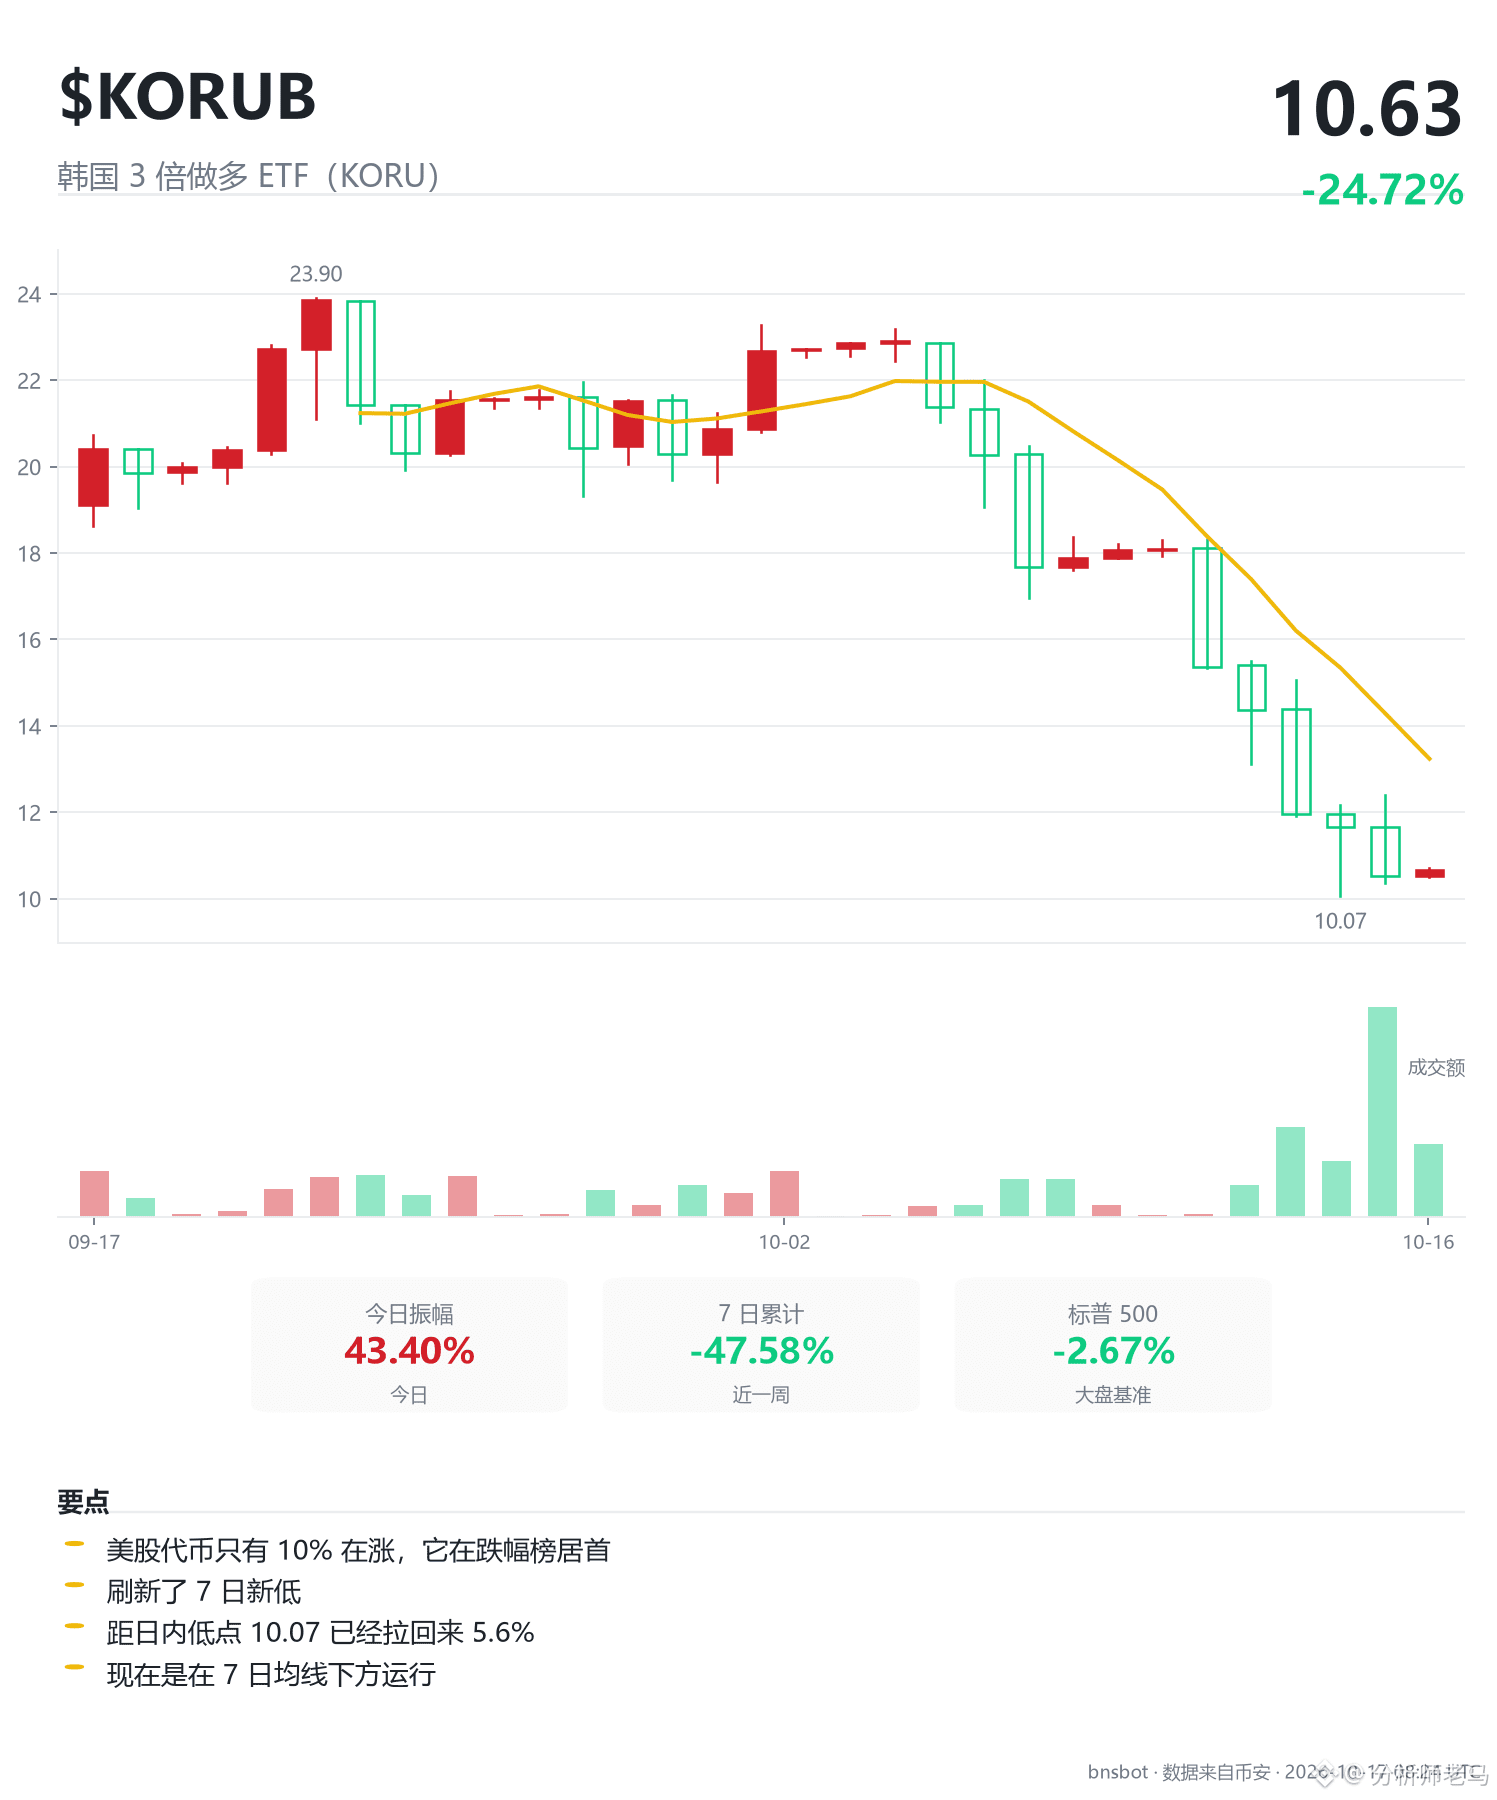
8
·
--
Only 0.17% separates the price from support at 0.0710, so $STRK needs to make a choice
First, the critical level: if it falls below 0.0620, the momentum behind this move comes into question. It would take a drop to 0.0285 for the overall direction to be definitively wrong. Why set the invalidation level so low? Because the average daily fluctuation is 20%. Setting a stop-loss any tighter would just be giving money away.
The current bullish case isn’t based on guesswork. The price is 95% above the average cost of 0.0365 over the past 5–6 months, with the MA144 still providing support below. The weekly chart is up 424.8% over the past 8 weeks, and the trend is upward; the 3-day chart is also aligned bullishly. With the long-term, weekly, and 3-day trends all pointing in the same direction, there’s no need to second-guess the overall trend. For momentum, look at the 12h, daily, and 3d charts—they’re all crossing their moving averages without a clear direction. The daily price is still 17.5% above the medium-term cost basis, leaving it suspended above without firm footing. The 4h and 1h charts are aligned bearishly, with price moving under the moving averages. That’s a pullback, not a reversal of the trend.
The real obstacle is the price level. It’s just 1.24% up to 0.072 and 0.17% down to 0.071, while a normal daily fluctuation is 20%. The upside is less than a fraction of a day’s usual movement—you’re practically standing against a wall. Chasing the price here means betting a full day’s range for a 1.24% gain. The risk-reward simply doesn’t add up. The 4h volume ratio is only 0.39, with volume drying up as price presses against resistance—the perfect conditions for a false breakout. So a bullish overall trend and holding off for now are two sides of the same coin.
The derivatives data is worth a look too: open interest is at 29.19 million USDT, and has risen 7.35% over 7 days, suggesting money is systematically entering the market. But the price fell 2.68% over the same period. Price down, open interest up—that means new shorts are coming in, and this downturn may not be over. The 7-day taker buy ratio is 0.502, while the long-to-short account ratio is 49.6 to 50.4. Neither side has a clear advantage. With volume fading on the decline and new shorts entering, there’s no reason to rush in and buy the dip.
So when is it time to act? Price needs to hold above 0.072, and break above it on rising volume, for resistance to count as truly broken. Any move up on declining volume should be treated as a fakeout. If it holds above 0.072, the next target is 0.08. If it drops below 0.071, the short-term structure turns weak, and anyone holding should consider reducing their position there. One more thing to note: the price is already 21.5% below its 7-day average. The short-term drop is overextended, and the chance of a corrective rebound is building—but “a rebound is possible” does not mean “buy now.” Don’t confuse the two.
$STRK
Only 0.17% separates the price from support at 0.0710, so $STRK needs to make a choice
First, the critical level: if it falls below 0.0620, the momentum behind this move comes into question. It would take a drop to 0.0285 for the overall direction to be definitively wrong. Why set the invalidation level so low? Because the average daily fluctuation is 20%. Setting a stop-loss any tighter would just be giving money away.
The current bullish case isn’t based on guesswork. The price is 95% above the average cost of 0.0365 over the past 5–6 months, with the MA144 still providing support below. The weekly chart is up 424.8% over the past 8 weeks, and the trend is upward; the 3-day chart is also aligned bullishly. With the long-term, weekly, and 3-day trends all pointing in the same direction, there’s no need to second-guess the overall trend. For momentum, look at the 12h, daily, and 3d charts—they’re all crossing their moving averages without a clear direction. The daily price is still 17.5% above the medium-term cost basis, leaving it suspended above without firm footing. The 4h and 1h charts are aligned bearishly, with price moving under the moving averages. That’s a pullback, not a reversal of the trend.
The real obstacle is the price level. It’s just 1.24% up to 0.072 and 0.17% down to 0.071, while a normal daily fluctuation is 20%. The upside is less than a fraction of a day’s usual movement—you’re practically standing against a wall. Chasing the price here means betting a full day’s range for a 1.24% gain. The risk-reward simply doesn’t add up. The 4h volume ratio is only 0.39, with volume drying up as price presses against resistance—the perfect conditions for a false breakout. So a bullish overall trend and holding off for now are two sides of the same coin.
The derivatives data is worth a look too: open interest is at 29.19 million USDT, and has risen 7.35% over 7 days, suggesting money is systematically entering the market. But the price fell 2.68% over the same period. Price down, open interest up—that means new shorts are coming in, and this downturn may not be over. The 7-day taker buy ratio is 0.502, while the long-to-short account ratio is 49.6 to 50.4. Neither side has a clear advantage. With volume fading on the decline and new shorts entering, there’s no reason to rush in and buy the dip.
So when is it time to act? Price needs to hold above 0.072, and break above it on rising volume, for resistance to count as truly broken. Any move up on declining volume should be treated as a fakeout. If it holds above 0.072, the next target is 0.08. If it drops below 0.071, the short-term structure turns weak, and anyone holding should consider reducing their position there. One more thing to note: the price is already 21.5% below its 7-day average. The short-term drop is overextended, and the chance of a corrective rebound is building—but “a rebound is possible” does not mean “buy now.” Don’t confuse the two.
$STRK
First, the critical level: if it falls below 0.0620, the momentum behind this move comes into question. It would take a drop to 0.0285 for the overall direction to be definitively wrong. Why set the invalidation level so low? Because the average daily fluctuation is 20%. Setting a stop-loss any tighter would just be giving money away.
The current bullish case isn’t based on guesswork. The price is 95% above the average cost of 0.0365 over the past 5–6 months, with the MA144 still providing support below. The weekly chart is up 424.8% over the past 8 weeks, and the trend is upward; the 3-day chart is also aligned bullishly. With the long-term, weekly, and 3-day trends all pointing in the same direction, there’s no need to second-guess the overall trend. For momentum, look at the 12h, daily, and 3d charts—they’re all crossing their moving averages without a clear direction. The daily price is still 17.5% above the medium-term cost basis, leaving it suspended above without firm footing. The 4h and 1h charts are aligned bearishly, with price moving under the moving averages. That’s a pullback, not a reversal of the trend.
The real obstacle is the price level. It’s just 1.24% up to 0.072 and 0.17% down to 0.071, while a normal daily fluctuation is 20%. The upside is less than a fraction of a day’s usual movement—you’re practically standing against a wall. Chasing the price here means betting a full day’s range for a 1.24% gain. The risk-reward simply doesn’t add up. The 4h volume ratio is only 0.39, with volume drying up as price presses against resistance—the perfect conditions for a false breakout. So a bullish overall trend and holding off for now are two sides of the same coin.
The derivatives data is worth a look too: open interest is at 29.19 million USDT, and has risen 7.35% over 7 days, suggesting money is systematically entering the market. But the price fell 2.68% over the same period. Price down, open interest up—that means new shorts are coming in, and this downturn may not be over. The 7-day taker buy ratio is 0.502, while the long-to-short account ratio is 49.6 to 50.4. Neither side has a clear advantage. With volume fading on the decline and new shorts entering, there’s no reason to rush in and buy the dip.
So when is it time to act? Price needs to hold above 0.072, and break above it on rising volume, for resistance to count as truly broken. Any move up on declining volume should be treated as a fakeout. If it holds above 0.072, the next target is 0.08. If it drops below 0.071, the short-term structure turns weak, and anyone holding should consider reducing their position there. One more thing to note: the price is already 21.5% below its 7-day average. The short-term drop is overextended, and the chance of a corrective rebound is building—but “a rebound is possible” does not mean “buy now.” Don’t confuse the two.
$STRK
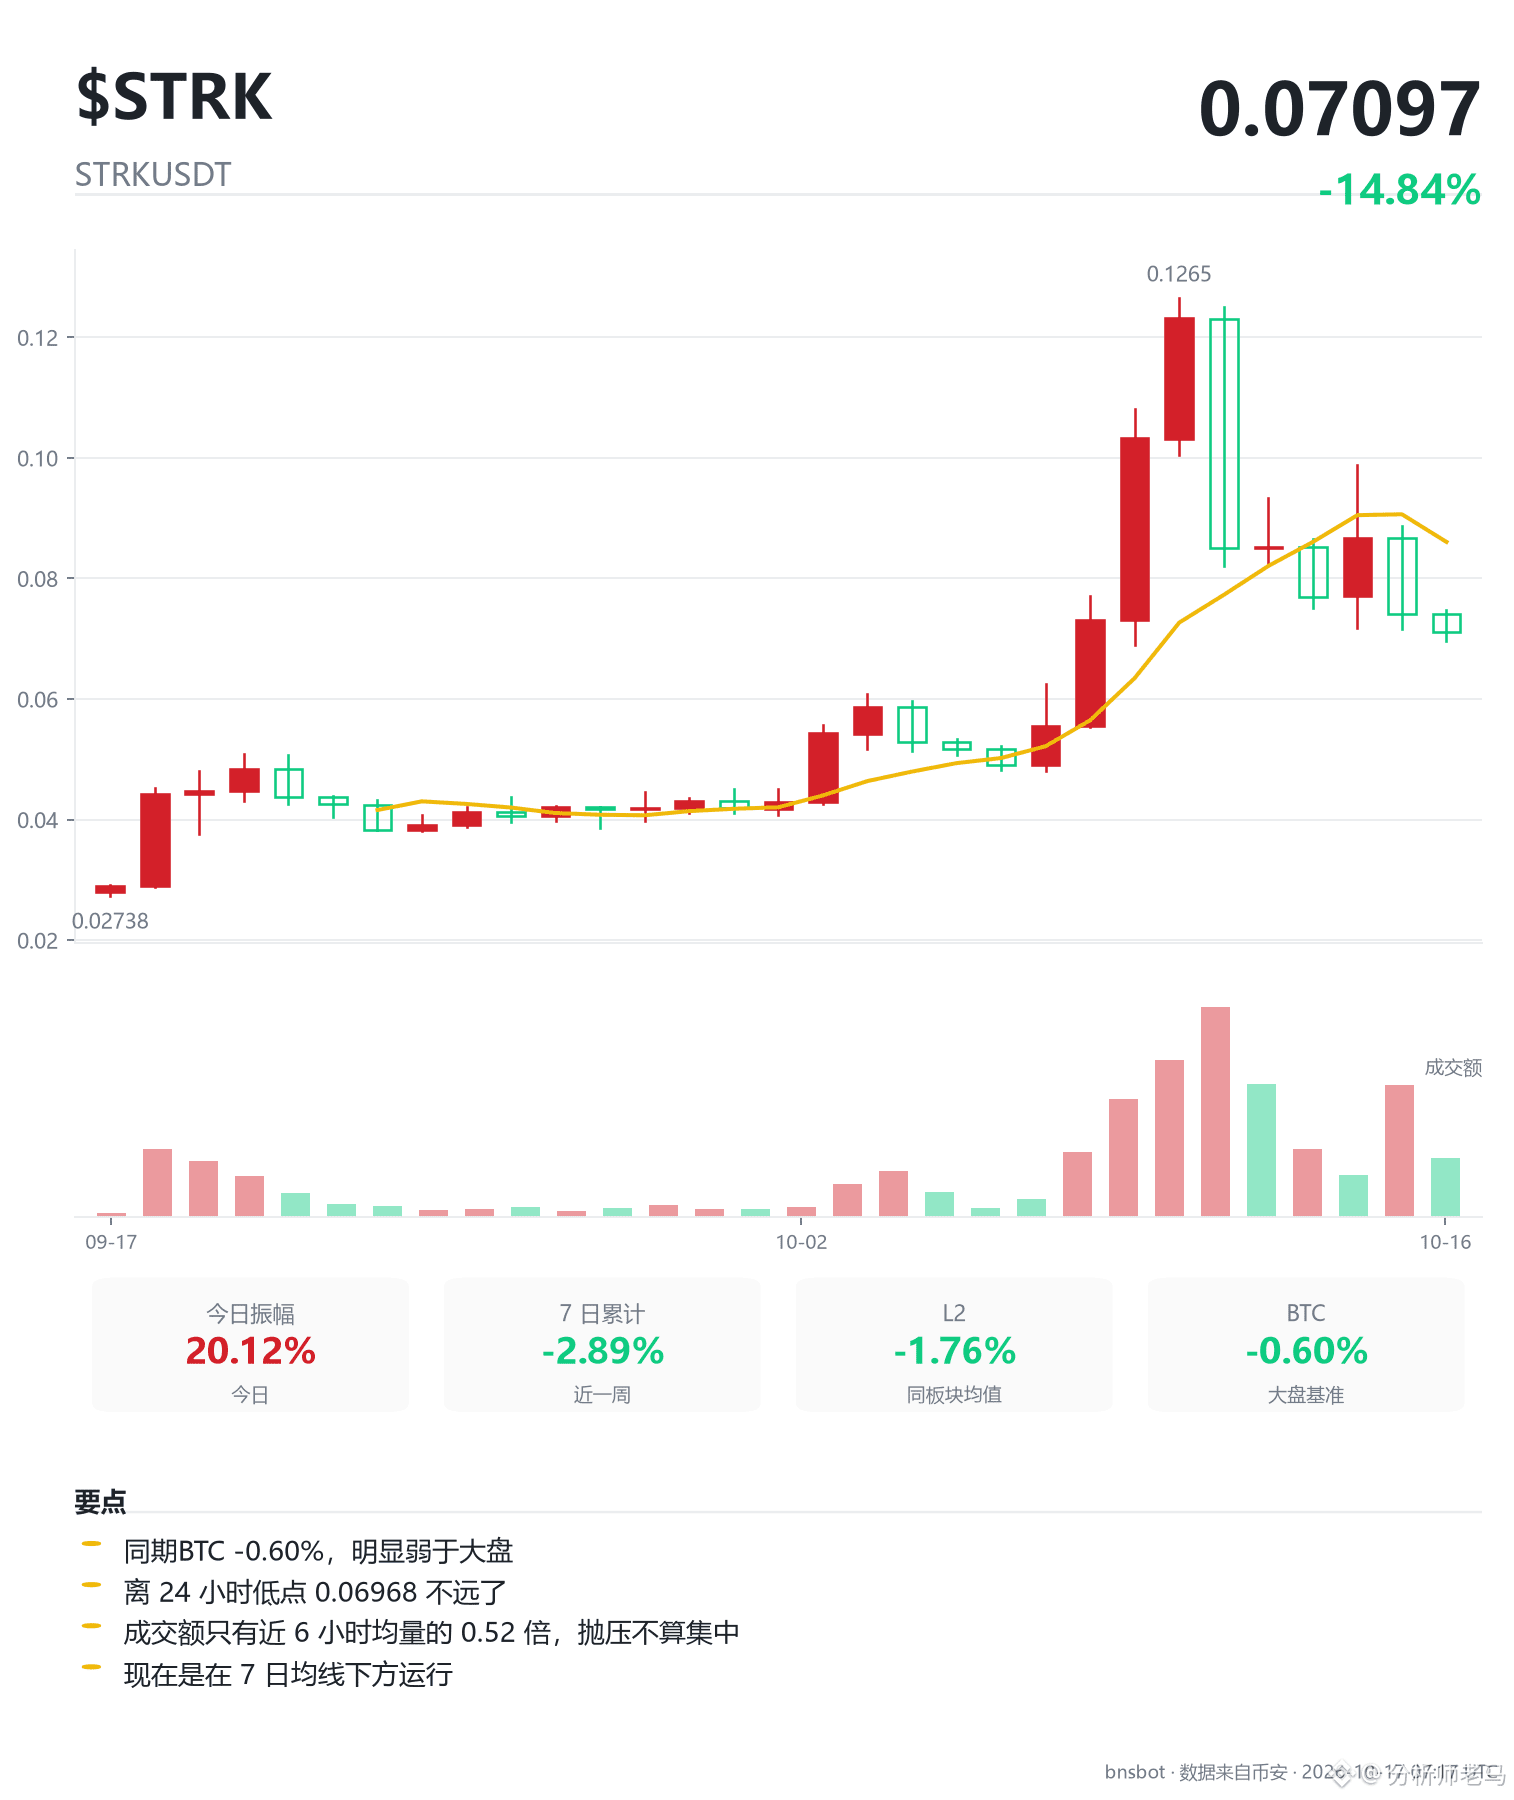
8
·
--
Only 3.32% separates price from the 0.002300 support, and $ZIL needs to make a choice
Let’s start with the most unusual signal: open interest rose 98.85% over seven days while the price fell 31.85%. That’s not longs holding the line—it’s new money coming in to short, adding to positions all the way down and pushing the price lower. There are 4.77 million USDT tied up in the contracts. It’s not a huge market, but the direction is clear: price down, open interest up means new shorts are building positions.
So today’s 11% red candle isn’t a low-volume slide. Trading volume was 1.55 times the recent average. Price down, volume up: the selling pressure is real. The 1h and 4h charts are both in bearish alignment, and on the 4h chart, price is already 22.67% below the medium-term cost basis, with RSI at just 23.3. That’s a steep drop, but a steep drop doesn’t mean it’s over.
The interesting part is the price level. Above, 0.0024 is a round-number mark and a weekly-chart hurdle, just 0.88% from the current price. Below, 0.0023 is also a confluence level across timeframes, only 3.32% away. Meanwhile, a normal day’s price range is 13.57%. In other words, there’s 0.88% of upside and 3.32% of downside risk from here, for a risk/reward ratio of 0.27. Betting a full day’s worth of volatility on a breakout of less than 1% isn’t worth it. Stay close to the wall, but don’t rush to reach out.
On the longer-term charts, the current price is 24.8% below the average cost of 0.00316 over the past five to six months, and the MA144 is also overhead. The medium- and long-term structure is bearish. The only thing going against that trend is the weekly chart, which is still up 64.8% over the past eight weeks. But one weekly candle outweighs seven daily candles. Until it turns, treat this move as a countertrend rally within the bigger picture.
So the bias is bearish, but it’s not time to act yet. The reason is simple: price is right next to a key level, and the risk/reward doesn’t add up. What should you wait for? A confirmed break below 0.0023—that’s when the downside really opens up. The first target would be 0.002, followed by the structural low at 0.002186. Conversely, if price gets back above 0.00334742, the bearish thesis is invalidated; admit the mistake and exit.
One more thing not to overlook: the annualized funding rate is -83.9%, so shorts are paying a hefty price to hold this position. The longer you stay in, the more it costs. If you want to ride this short, make sure you account for the cost of time—don’t get the risk/reward right only to lose on funding.
$ZIL
Only 3.32% separates price from the 0.002300 support, and $ZIL needs to make a choice
Let’s start with the most unusual signal: open interest rose 98.85% over seven days while the price fell 31.85%. That’s not longs holding the line—it’s new money coming in to short, adding to positions all the way down and pushing the price lower. There are 4.77 million USDT tied up in the contracts. It’s not a huge market, but the direction is clear: price down, open interest up means new shorts are building positions.
So today’s 11% red candle isn’t a low-volume slide. Trading volume was 1.55 times the recent average. Price down, volume up: the selling pressure is real. The 1h and 4h charts are both in bearish alignment, and on the 4h chart, price is already 22.67% below the medium-term cost basis, with RSI at just 23.3. That’s a steep drop, but a steep drop doesn’t mean it’s over.
The interesting part is the price level. Above, 0.0024 is a round-number mark and a weekly-chart hurdle, just 0.88% from the current price. Below, 0.0023 is also a confluence level across timeframes, only 3.32% away. Meanwhile, a normal day’s price range is 13.57%. In other words, there’s 0.88% of upside and 3.32% of downside risk from here, for a risk/reward ratio of 0.27. Betting a full day’s worth of volatility on a breakout of less than 1% isn’t worth it. Stay close to the wall, but don’t rush to reach out.
On the longer-term charts, the current price is 24.8% below the average cost of 0.00316 over the past five to six months, and the MA144 is also overhead. The medium- and long-term structure is bearish. The only thing going against that trend is the weekly chart, which is still up 64.8% over the past eight weeks. But one weekly candle outweighs seven daily candles. Until it turns, treat this move as a countertrend rally within the bigger picture.
So the bias is bearish, but it’s not time to act yet. The reason is simple: price is right next to a key level, and the risk/reward doesn’t add up. What should you wait for? A confirmed break below 0.0023—that’s when the downside really opens up. The first target would be 0.002, followed by the structural low at 0.002186. Conversely, if price gets back above 0.00334742, the bearish thesis is invalidated; admit the mistake and exit.
One more thing not to overlook: the annualized funding rate is -83.9%, so shorts are paying a hefty price to hold this position. The longer you stay in, the more it costs. If you want to ride this short, make sure you account for the cost of time—don’t get the risk/reward right only to lose on funding.
$ZIL
Let’s start with the most unusual signal: open interest rose 98.85% over seven days while the price fell 31.85%. That’s not longs holding the line—it’s new money coming in to short, adding to positions all the way down and pushing the price lower. There are 4.77 million USDT tied up in the contracts. It’s not a huge market, but the direction is clear: price down, open interest up means new shorts are building positions.
So today’s 11% red candle isn’t a low-volume slide. Trading volume was 1.55 times the recent average. Price down, volume up: the selling pressure is real. The 1h and 4h charts are both in bearish alignment, and on the 4h chart, price is already 22.67% below the medium-term cost basis, with RSI at just 23.3. That’s a steep drop, but a steep drop doesn’t mean it’s over.
The interesting part is the price level. Above, 0.0024 is a round-number mark and a weekly-chart hurdle, just 0.88% from the current price. Below, 0.0023 is also a confluence level across timeframes, only 3.32% away. Meanwhile, a normal day’s price range is 13.57%. In other words, there’s 0.88% of upside and 3.32% of downside risk from here, for a risk/reward ratio of 0.27. Betting a full day’s worth of volatility on a breakout of less than 1% isn’t worth it. Stay close to the wall, but don’t rush to reach out.
On the longer-term charts, the current price is 24.8% below the average cost of 0.00316 over the past five to six months, and the MA144 is also overhead. The medium- and long-term structure is bearish. The only thing going against that trend is the weekly chart, which is still up 64.8% over the past eight weeks. But one weekly candle outweighs seven daily candles. Until it turns, treat this move as a countertrend rally within the bigger picture.
So the bias is bearish, but it’s not time to act yet. The reason is simple: price is right next to a key level, and the risk/reward doesn’t add up. What should you wait for? A confirmed break below 0.0023—that’s when the downside really opens up. The first target would be 0.002, followed by the structural low at 0.002186. Conversely, if price gets back above 0.00334742, the bearish thesis is invalidated; admit the mistake and exit.
One more thing not to overlook: the annualized funding rate is -83.9%, so shorts are paying a hefty price to hold this position. The longer you stay in, the more it costs. If you want to ride this short, make sure you account for the cost of time—don’t get the risk/reward right only to lose on funding.
$ZIL
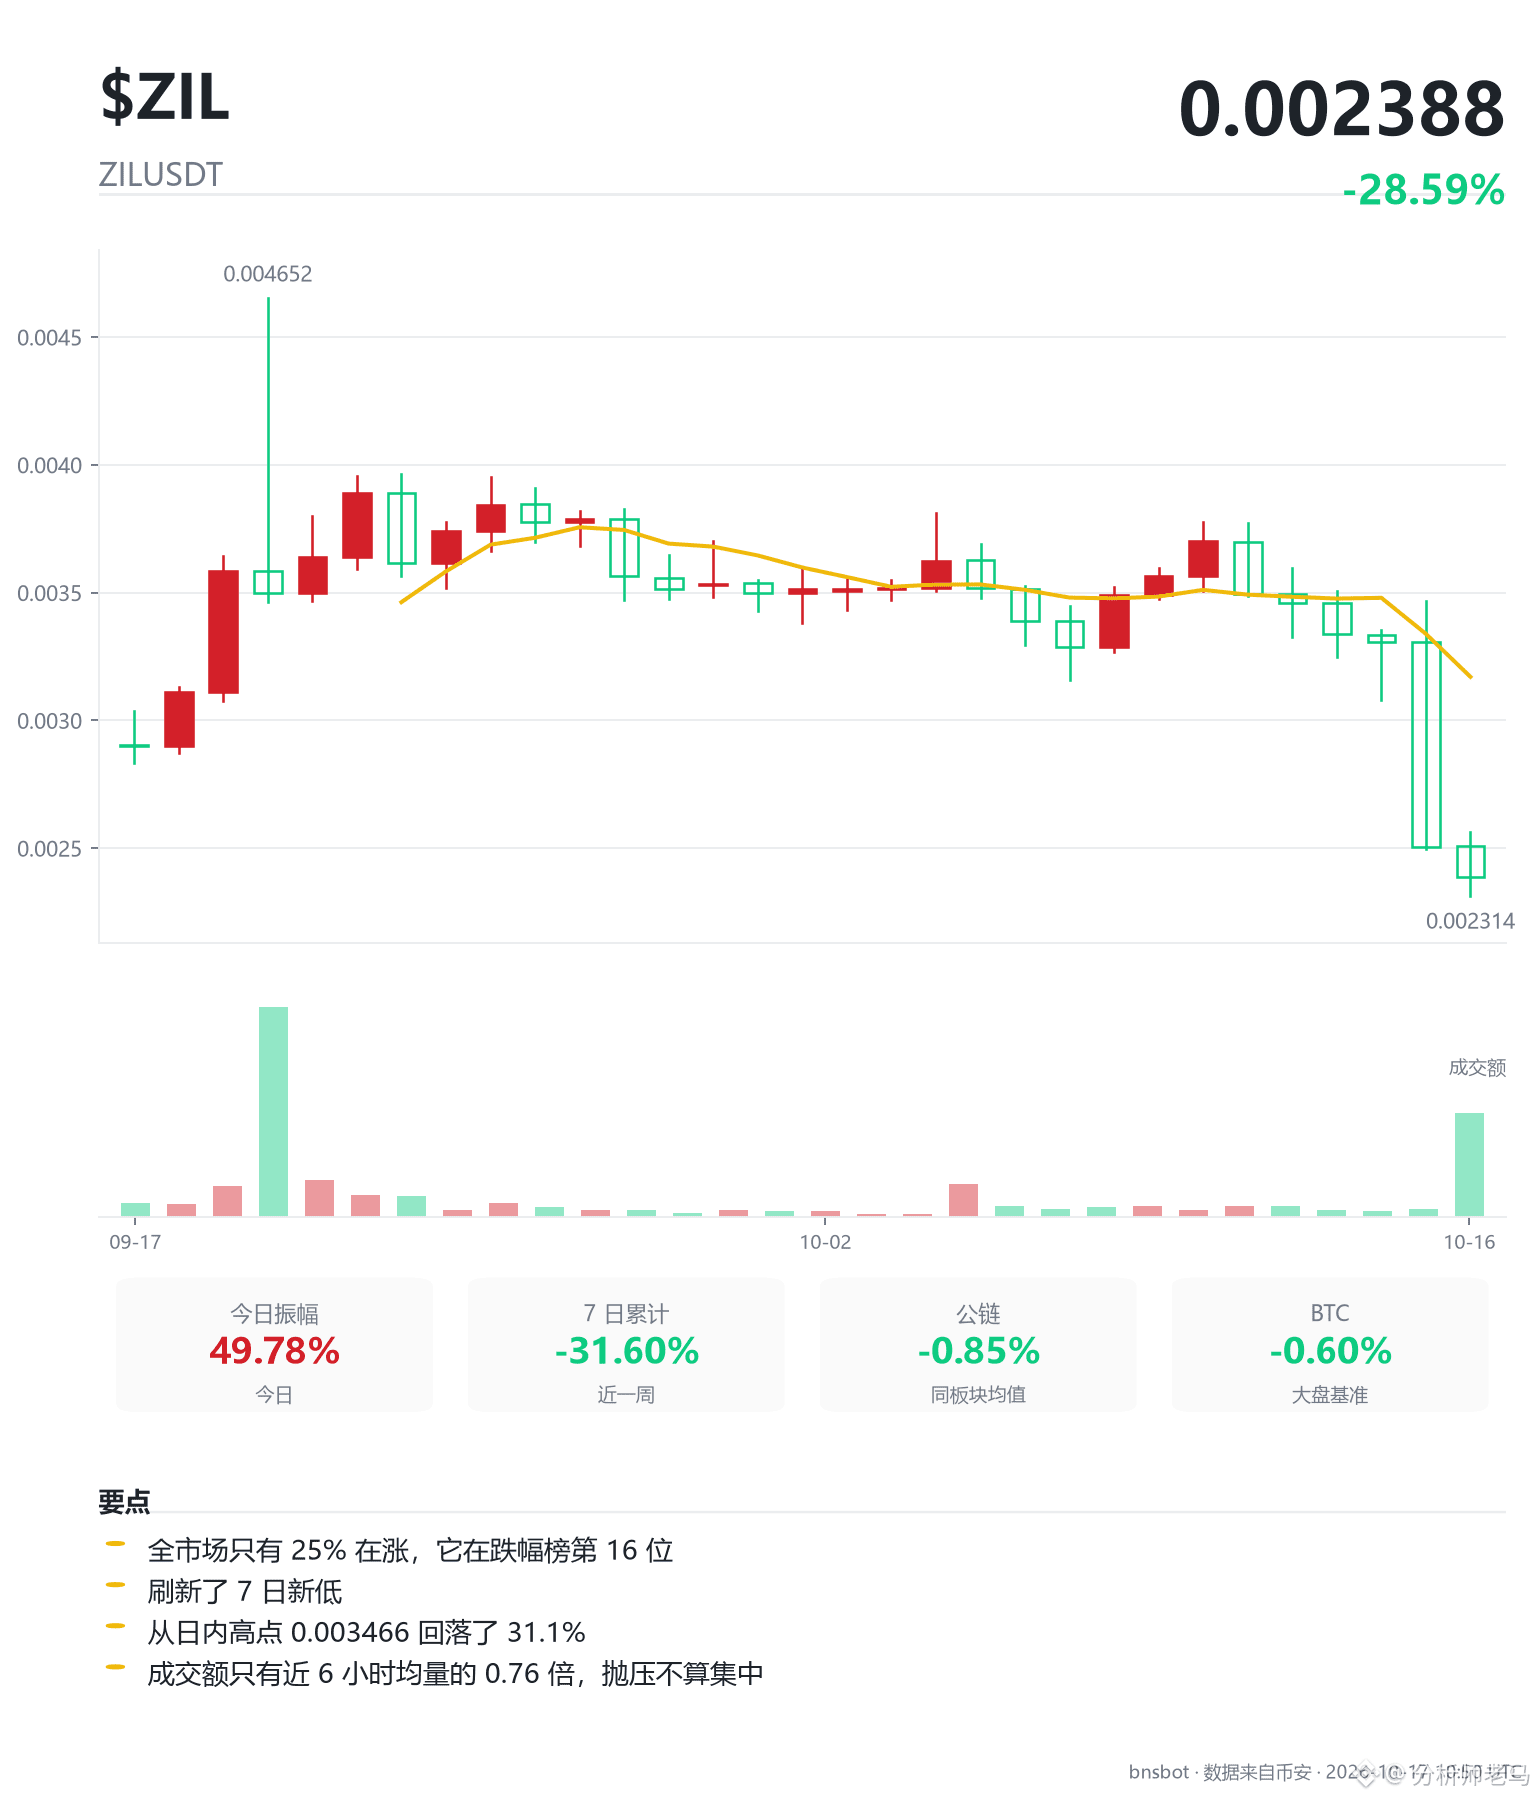
32
·
--
$EPIC Bears have the upper hand, and selling rallies into resistance is the more profitable play
First, let’s look at what would prove this view wrong: the price reclaiming 0.4725. This is the invalidation level, based on 3 times the daily volatility. It’s 80% above the current price, while the average daily move is 26.9%—so for the price to get there, it would have to keep pushing higher in one direction for several days. Until it reaches that level, the bearish framework remains valid. The current price is 0.2613, 42.4% below the average cost of 0.4533 over the past five to six months. This long-term band is overhead, and the daily and 3-day charts are also aligned bearishly.
What’s more telling is where the money is going. Open interest has risen 54.43% over the past 7 days, while the price has fallen 43.77% over the same period—and it’s been a low-volume decline. Price down, open interest up: that means fresh money is entering short positions, not that longs are exiting. There are 3.54 million U in the contracts. The market is small, so its explosive potential is limited, but the direction is clear. Meanwhile, open interest fell 13.79% over the past 4 hours, indicating that some positions were just closed. That shows bears aren’t holding on blindly; some are taking profits. The 7-day taker buy ratio is 0.511, essentially a 50/50 split, with no sign of aggressive accumulation by bulls.
But there’s one problem: you can’t chase shorts here. The price is just 3.33% away from 0.27 to the upside, and 0.5% away from 0.26 to the downside, while a normal daily move is 26.9%. Betting on a 3.33% move using an entire day’s volatility doesn’t offer a favorable risk-reward. 0.27 is also a key level on both the weekly and daily charts. The 4-hour volume ratio is only 0.64, and the price is hovering near resistance on low volume—a setup prone to false breakouts. So the bias is bearish, but this isn’t a good level to act on today.
So what should you wait for? A break below 0.25. 0.25 is a round-number level; once it breaks, the downside truly opens up. The second target is below 0.25. Note that 0.26 is right underfoot: a decisive break below this level would immediately weaken the short-term structure, making it a point to reduce positions if you’re holding. Conversely, if the price bounces, 0.27 to 0.279 is a dense supply zone where many holders are underwater. The price with the highest trading volume is 0.3387, and the current price is below it—any move up runs straight into selling pressure. A rally toward 0.27 could actually offer bears a better entry.
There’s one more thing not to overlook: the weekly chart is up 26.8% over the past 8 weeks, pointing upward and conflicting with the long-term and daily charts. One weekly candle outweighs seven daily candles, so until the weekly trend turns, it’s safer to view this decline as a countertrend move within the broader direction. Don’t mistake a bounce for a trend reversal. The price fell from 1.29 to 0.2113, a drop of 84%, and has now bounced just 5%. This is a weak recovery, and the bears have yet to meet any meaningful resistance.
$EPIC
$EPIC Bears have the upper hand, and selling rallies into resistance is the more profitable play
First, let’s look at what would prove this view wrong: the price reclaiming 0.4725. This is the invalidation level, based on 3 times the daily volatility. It’s 80% above the current price, while the average daily move is 26.9%—so for the price to get there, it would have to keep pushing higher in one direction for several days. Until it reaches that level, the bearish framework remains valid. The current price is 0.2613, 42.4% below the average cost of 0.4533 over the past five to six months. This long-term band is overhead, and the daily and 3-day charts are also aligned bearishly.
What’s more telling is where the money is going. Open interest has risen 54.43% over the past 7 days, while the price has fallen 43.77% over the same period—and it’s been a low-volume decline. Price down, open interest up: that means fresh money is entering short positions, not that longs are exiting. There are 3.54 million U in the contracts. The market is small, so its explosive potential is limited, but the direction is clear. Meanwhile, open interest fell 13.79% over the past 4 hours, indicating that some positions were just closed. That shows bears aren’t holding on blindly; some are taking profits. The 7-day taker buy ratio is 0.511, essentially a 50/50 split, with no sign of aggressive accumulation by bulls.
But there’s one problem: you can’t chase shorts here. The price is just 3.33% away from 0.27 to the upside, and 0.5% away from 0.26 to the downside, while a normal daily move is 26.9%. Betting on a 3.33% move using an entire day’s volatility doesn’t offer a favorable risk-reward. 0.27 is also a key level on both the weekly and daily charts. The 4-hour volume ratio is only 0.64, and the price is hovering near resistance on low volume—a setup prone to false breakouts. So the bias is bearish, but this isn’t a good level to act on today.
So what should you wait for? A break below 0.25. 0.25 is a round-number level; once it breaks, the downside truly opens up. The second target is below 0.25. Note that 0.26 is right underfoot: a decisive break below this level would immediately weaken the short-term structure, making it a point to reduce positions if you’re holding. Conversely, if the price bounces, 0.27 to 0.279 is a dense supply zone where many holders are underwater. The price with the highest trading volume is 0.3387, and the current price is below it—any move up runs straight into selling pressure. A rally toward 0.27 could actually offer bears a better entry.
There’s one more thing not to overlook: the weekly chart is up 26.8% over the past 8 weeks, pointing upward and conflicting with the long-term and daily charts. One weekly candle outweighs seven daily candles, so until the weekly trend turns, it’s safer to view this decline as a countertrend move within the broader direction. Don’t mistake a bounce for a trend reversal. The price fell from 1.29 to 0.2113, a drop of 84%, and has now bounced just 5%. This is a weak recovery, and the bears have yet to meet any meaningful resistance.
$EPIC
First, let’s look at what would prove this view wrong: the price reclaiming 0.4725. This is the invalidation level, based on 3 times the daily volatility. It’s 80% above the current price, while the average daily move is 26.9%—so for the price to get there, it would have to keep pushing higher in one direction for several days. Until it reaches that level, the bearish framework remains valid. The current price is 0.2613, 42.4% below the average cost of 0.4533 over the past five to six months. This long-term band is overhead, and the daily and 3-day charts are also aligned bearishly.
What’s more telling is where the money is going. Open interest has risen 54.43% over the past 7 days, while the price has fallen 43.77% over the same period—and it’s been a low-volume decline. Price down, open interest up: that means fresh money is entering short positions, not that longs are exiting. There are 3.54 million U in the contracts. The market is small, so its explosive potential is limited, but the direction is clear. Meanwhile, open interest fell 13.79% over the past 4 hours, indicating that some positions were just closed. That shows bears aren’t holding on blindly; some are taking profits. The 7-day taker buy ratio is 0.511, essentially a 50/50 split, with no sign of aggressive accumulation by bulls.
But there’s one problem: you can’t chase shorts here. The price is just 3.33% away from 0.27 to the upside, and 0.5% away from 0.26 to the downside, while a normal daily move is 26.9%. Betting on a 3.33% move using an entire day’s volatility doesn’t offer a favorable risk-reward. 0.27 is also a key level on both the weekly and daily charts. The 4-hour volume ratio is only 0.64, and the price is hovering near resistance on low volume—a setup prone to false breakouts. So the bias is bearish, but this isn’t a good level to act on today.
So what should you wait for? A break below 0.25. 0.25 is a round-number level; once it breaks, the downside truly opens up. The second target is below 0.25. Note that 0.26 is right underfoot: a decisive break below this level would immediately weaken the short-term structure, making it a point to reduce positions if you’re holding. Conversely, if the price bounces, 0.27 to 0.279 is a dense supply zone where many holders are underwater. The price with the highest trading volume is 0.3387, and the current price is below it—any move up runs straight into selling pressure. A rally toward 0.27 could actually offer bears a better entry.
There’s one more thing not to overlook: the weekly chart is up 26.8% over the past 8 weeks, pointing upward and conflicting with the long-term and daily charts. One weekly candle outweighs seven daily candles, so until the weekly trend turns, it’s safer to view this decline as a countertrend move within the broader direction. Don’t mistake a bounce for a trend reversal. The price fell from 1.29 to 0.2113, a drop of 84%, and has now bounced just 5%. This is a weak recovery, and the bears have yet to meet any meaningful resistance.
$EPIC
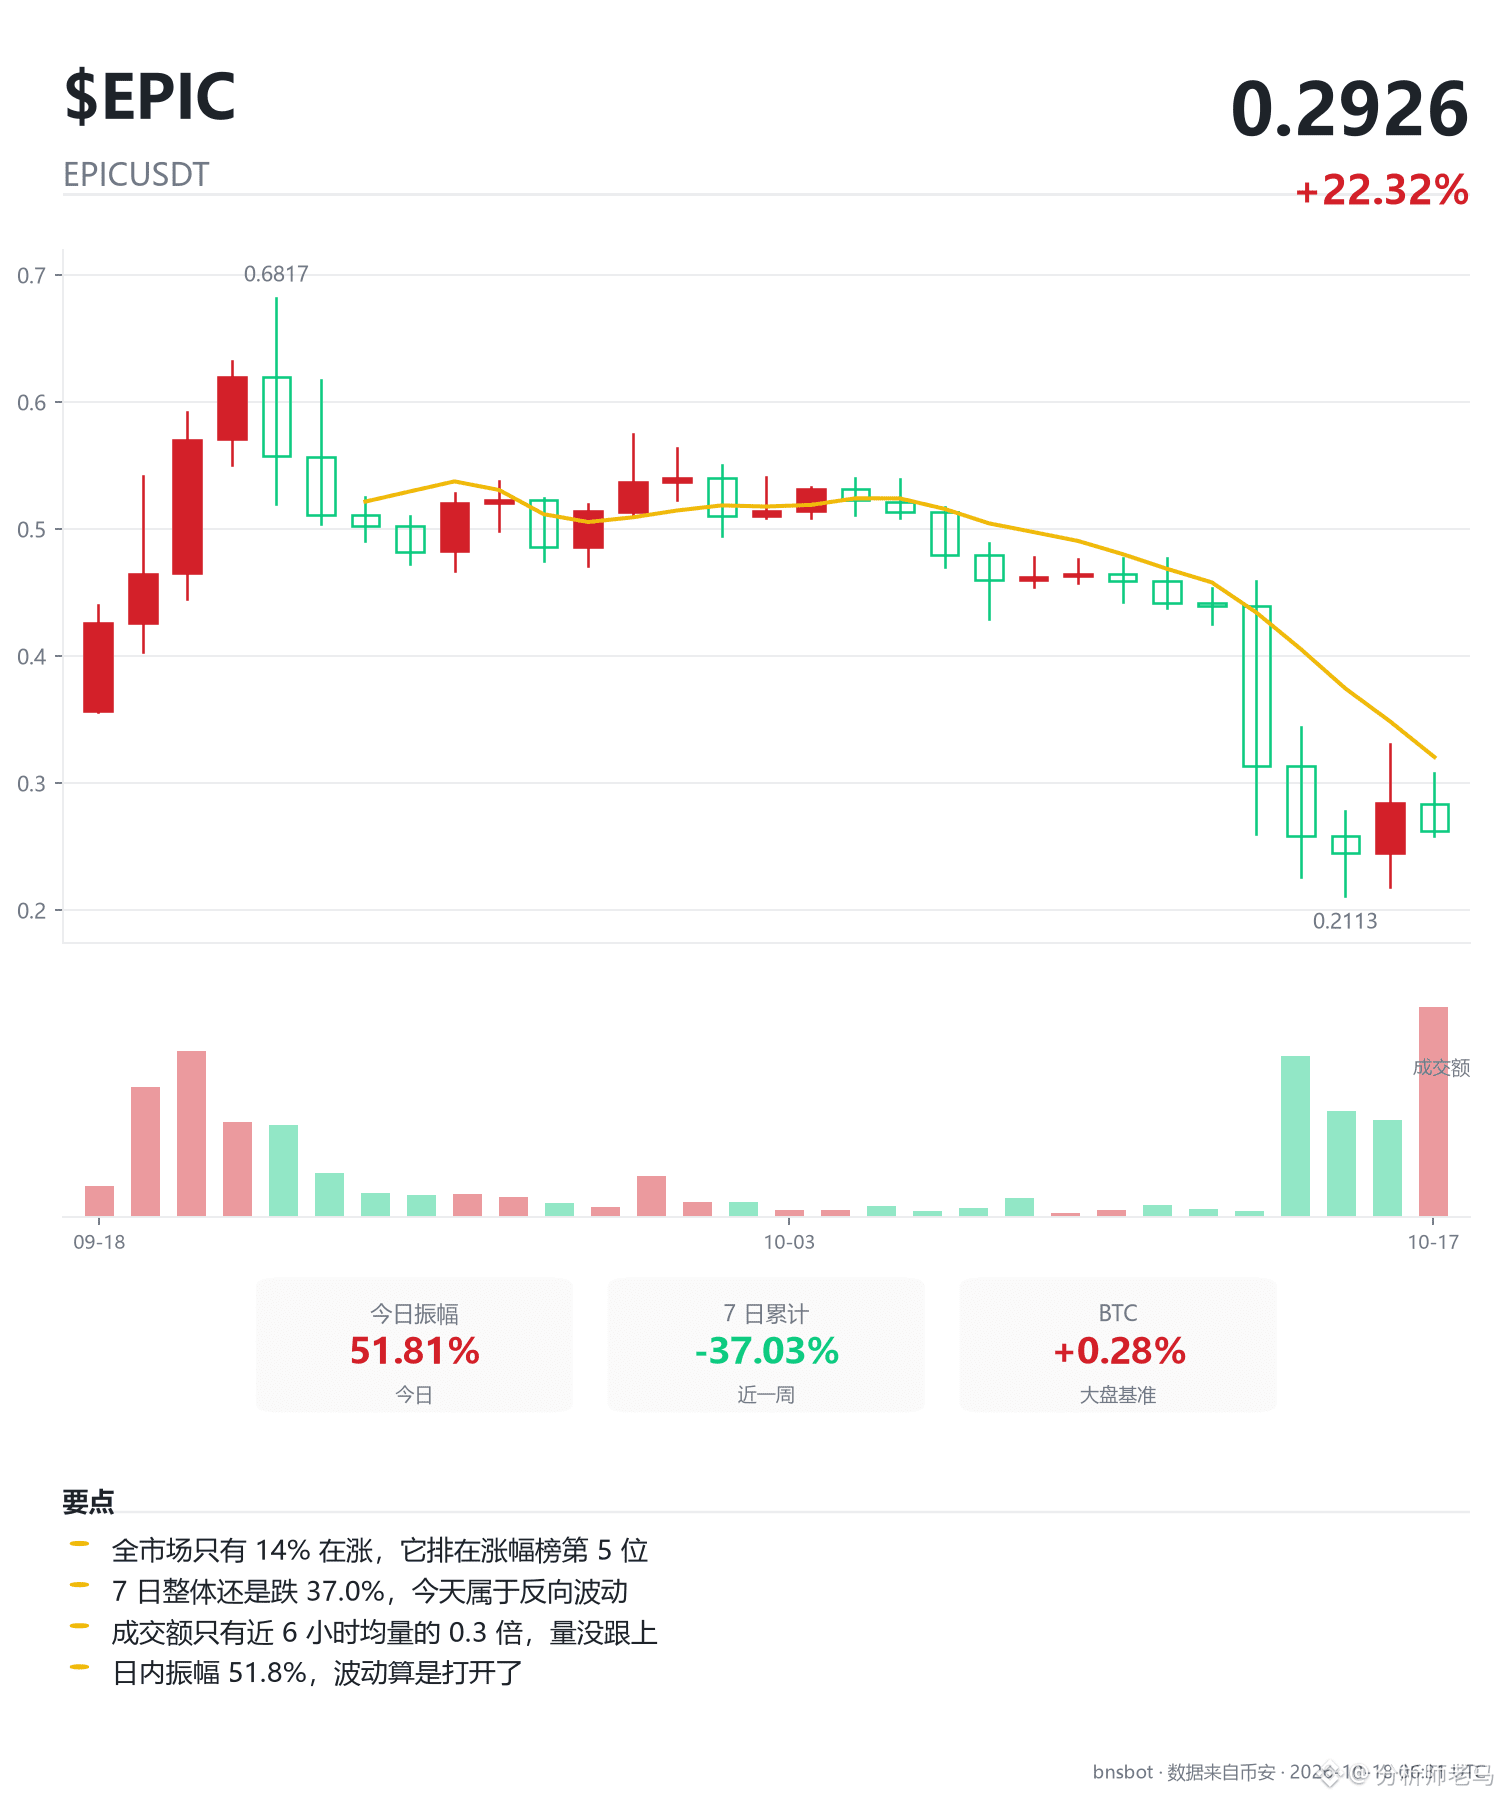
3
·
--
Korea 3x Long ETF (KORU): Bearish alignment, clearly bearish trend
But the most striking thing today isn’t the drop—it’s that 4-hour candle with volume at 3.06 times normal. Price is below the moving averages, yet volume has swelled to three times its usual level. That means someone is stepping in to buy the dip, but buyers haven’t won yet. Over the past eight weeks, the weekly chart is down 17.3%; all the daily moving averages are pressing downward, so bears are in control of the overall direction. On the 12-hour chart, price is already 35.5% below the intermediate-term cost basis; on the 4-hour chart, it’s 8.7% below. These three timeframes set the pace, not the direction. And the pace is simply too fast on the downside.
Just how fast? Price is 20.7% below its 7-day average, and the RSI is 22.1. Trying to catch a bounce here is a countertrend move—not impossible, but it calls for a small position. Price plunged from 25.73 to 9.75, a 62% drop, and has now recovered just 4%. It hasn’t even reached the first rebound level at 15.85, which shows that bears have yet to meet any meaningful resistance.
The problem is the risk/reward. Above, 11 is both a round-number level and a weekly-chart hurdle, 5.16% away from the current price. Below, 10.4 is the weekly extreme low left behind ten days ago; further down, 10 is a round-number level, 4.4% from the current price. But this asset’s average daily move is 20.3%, so the room above and below combined isn’t even enough to fit a stop-loss. A 1.17 risk/reward ratio looks passable, but in practice you’d be betting on a five-point move against a single day’s volatility. Long or short, you could get stopped out for no good reason.
So the bias is bearish, but don’t trade it just yet. If you’re going to wait, wait for a decisive break below 10—that’s when the downside opens up. If it gets back above 16.84, this trade thesis is wrong. The sector isn’t helping either: all three comparable ETFs are falling. The Korea ETF itself is down 0.84%, and it’s 1.28 percentage points weaker than the sector average, so this isn’t just about the broader market.
$KORU
$KORUB
Korea 3x Long ETF (KORU): Bearish alignment, clearly bearish trend
But the most striking thing today isn’t the drop—it’s that 4-hour candle with volume at 3.06 times normal. Price is below the moving averages, yet volume has swelled to three times its usual level. That means someone is stepping in to buy the dip, but buyers haven’t won yet. Over the past eight weeks, the weekly chart is down 17.3%; all the daily moving averages are pressing downward, so bears are in control of the overall direction. On the 12-hour chart, price is already 35.5% below the intermediate-term cost basis; on the 4-hour chart, it’s 8.7% below. These three timeframes set the pace, not the direction. And the pace is simply too fast on the downside.
Just how fast? Price is 20.7% below its 7-day average, and the RSI is 22.1. Trying to catch a bounce here is a countertrend move—not impossible, but it calls for a small position. Price plunged from 25.73 to 9.75, a 62% drop, and has now recovered just 4%. It hasn’t even reached the first rebound level at 15.85, which shows that bears have yet to meet any meaningful resistance.
The problem is the risk/reward. Above, 11 is both a round-number level and a weekly-chart hurdle, 5.16% away from the current price. Below, 10.4 is the weekly extreme low left behind ten days ago; further down, 10 is a round-number level, 4.4% from the current price. But this asset’s average daily move is 20.3%, so the room above and below combined isn’t even enough to fit a stop-loss. A 1.17 risk/reward ratio looks passable, but in practice you’d be betting on a five-point move against a single day’s volatility. Long or short, you could get stopped out for no good reason.
So the bias is bearish, but don’t trade it just yet. If you’re going to wait, wait for a decisive break below 10—that’s when the downside opens up. If it gets back above 16.84, this trade thesis is wrong. The sector isn’t helping either: all three comparable ETFs are falling. The Korea ETF itself is down 0.84%, and it’s 1.28 percentage points weaker than the sector average, so this isn’t just about the broader market.
$KORU
$KORUB
But the most striking thing today isn’t the drop—it’s that 4-hour candle with volume at 3.06 times normal. Price is below the moving averages, yet volume has swelled to three times its usual level. That means someone is stepping in to buy the dip, but buyers haven’t won yet. Over the past eight weeks, the weekly chart is down 17.3%; all the daily moving averages are pressing downward, so bears are in control of the overall direction. On the 12-hour chart, price is already 35.5% below the intermediate-term cost basis; on the 4-hour chart, it’s 8.7% below. These three timeframes set the pace, not the direction. And the pace is simply too fast on the downside.
Just how fast? Price is 20.7% below its 7-day average, and the RSI is 22.1. Trying to catch a bounce here is a countertrend move—not impossible, but it calls for a small position. Price plunged from 25.73 to 9.75, a 62% drop, and has now recovered just 4%. It hasn’t even reached the first rebound level at 15.85, which shows that bears have yet to meet any meaningful resistance.
The problem is the risk/reward. Above, 11 is both a round-number level and a weekly-chart hurdle, 5.16% away from the current price. Below, 10.4 is the weekly extreme low left behind ten days ago; further down, 10 is a round-number level, 4.4% from the current price. But this asset’s average daily move is 20.3%, so the room above and below combined isn’t even enough to fit a stop-loss. A 1.17 risk/reward ratio looks passable, but in practice you’d be betting on a five-point move against a single day’s volatility. Long or short, you could get stopped out for no good reason.
So the bias is bearish, but don’t trade it just yet. If you’re going to wait, wait for a decisive break below 10—that’s when the downside opens up. If it gets back above 16.84, this trade thesis is wrong. The sector isn’t helping either: all three comparable ETFs are falling. The Korea ETF itself is down 0.84%, and it’s 1.28 percentage points weaker than the sector average, so this isn’t just about the broader market.
$KORU
$KORUB
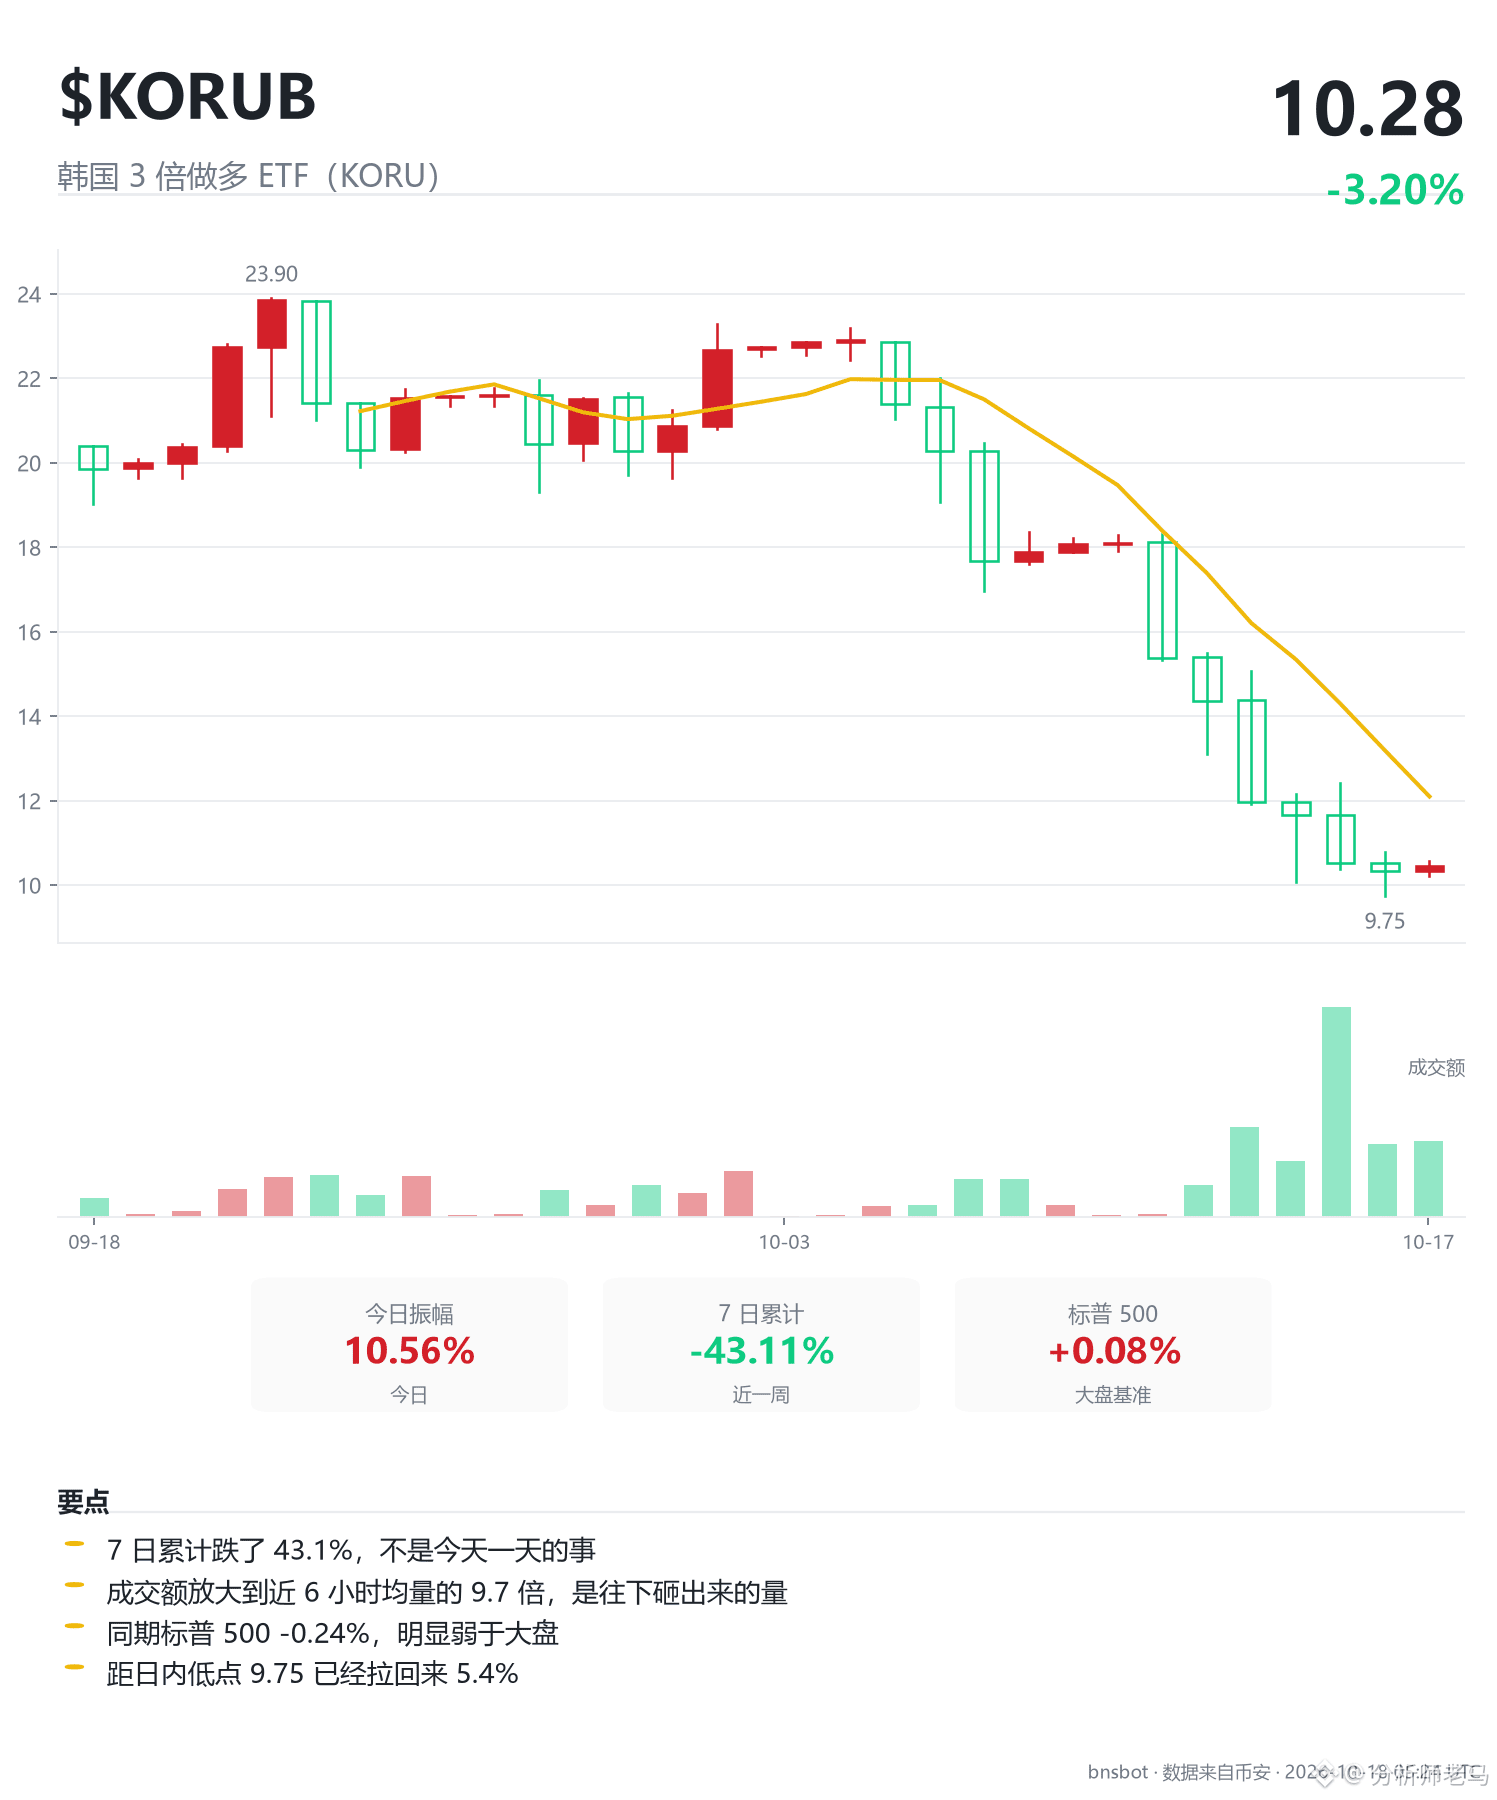
5
Log in to explore more content
Join global crypto users on Binance Square
⚡️ Get latest and useful information about crypto.
💬 Trusted by the world’s largest crypto exchange.
👍 Discover real insights from verified creators.
Email / Phone number
Trending Topics
BTCReboundsAbove$60KAmidWhaleDipBuying
60,513 views
302 Discussing
Abraxas Capital, Other Whales Buy the BTC Dip as Bitcoin Briefly Reclaims $60,000
Binance News
·33 Likes
·66.4k views
SolanaSets2027RoadmapToDoubleComputeCapacity
45,056 views
861 Discussing
CaliforniaNvidiaProbeExaminesPotentialCriminalViolations
11,909 views
116 Discussing