
Junze
93 Posts

Junze
Report
Block User
Stick to the fundamentals while taking calculated risks to secure gains.
Open Trade
Occasional Trader
1.8 Years
1 Following
27 Followers
29 Liked
Posts
Portfolio
·
--
Odd one on the board: $ENSO, funding at -1.259%
Scrolled the futures board and this number made me look twice:
Price +3.9% on the day, top traders' long/short at 1.34.
What it means: Negative funding means shorts are paying longs to hold. Shorts are the crowded side here, and if price pushes up, forced short covering can make the move sharper.
Which side do you think is more crowded on ENSO right now?
No view on direction, just flagging the positioning.
#Futures #CryptoTrading $ENSO
Odd one on the board: $ENSO , funding at -1.259%
Scrolled the futures board and this number made me look twice:
Price +3.9% on the day, top traders' long/short at 1.34.
What it means: Negative funding means shorts are paying longs to hold. Shorts are the crowded side here, and if price pushes up, forced short covering can make the move sharper.
Which side do you think is more crowded on ENSO right now?
No view on direction, just flagging the positioning.
#Futures #CryptoTrading $ENSO
Scrolled the futures board and this number made me look twice:
Price +3.9% on the day, top traders' long/short at 1.34.
What it means: Negative funding means shorts are paying longs to hold. Shorts are the crowded side here, and if price pushes up, forced short covering can make the move sharper.
Which side do you think is more crowded on ENSO right now?
No view on direction, just flagging the positioning.
#Futures #CryptoTrading $ENSO
74
·
--
Open interest +30.1% in 1h to 12.0M, funding at -2.000% on $KERNEL
Most of the board is quiet, but this one is worth a second look:
Price +43.1% on the day, top traders' long/short at 1.07.
What it means: Negative funding means shorts are paying longs to hold. Shorts are the crowded side here, and if price pushes up, forced short covering can make the move sharper.
Would you sit this one out or trade it small?
Boring advice, but low leverage is how you survive setups like this.
#Futures #CryptoTrading $KERNEL
Open interest +30.1% in 1h to 12.0M, funding at -2.000% on $KERNEL
Most of the board is quiet, but this one is worth a second look:
Price +43.1% on the day, top traders' long/short at 1.07.
What it means: Negative funding means shorts are paying longs to hold. Shorts are the crowded side here, and if price pushes up, forced short covering can make the move sharper.
Would you sit this one out or trade it small?
Boring advice, but low leverage is how you survive setups like this.
#Futures #CryptoTrading $KERNEL
Most of the board is quiet, but this one is worth a second look:
Price +43.1% on the day, top traders' long/short at 1.07.
What it means: Negative funding means shorts are paying longs to hold. Shorts are the crowded side here, and if price pushes up, forced short covering can make the move sharper.
Would you sit this one out or trade it small?
Boring advice, but low leverage is how you survive setups like this.
#Futures #CryptoTrading $KERNEL
61
·
--
Funding at -0.659% on $IRYS
Most of the board is quiet, but this one is worth a second look:
Price +31.8% on the day, top traders' long/short at 1.29.
What it means: Negative funding means shorts are paying longs to hold. Shorts are the crowded side here, and if price pushes up, forced short covering can make the move sharper.
Funding or open interest, which one do you trust more in setups like this?
Data's just data. Still, I'd keep leverage low around this one.
#Futures #CryptoTrading $IRYS
Funding at -0.659% on $IRYS
Most of the board is quiet, but this one is worth a second look:
Price +31.8% on the day, top traders' long/short at 1.29.
What it means: Negative funding means shorts are paying longs to hold. Shorts are the crowded side here, and if price pushes up, forced short covering can make the move sharper.
Funding or open interest, which one do you trust more in setups like this?
Data's just data. Still, I'd keep leverage low around this one.
#Futures #CryptoTrading $IRYS
Most of the board is quiet, but this one is worth a second look:
Price +31.8% on the day, top traders' long/short at 1.29.
What it means: Negative funding means shorts are paying longs to hold. Shorts are the crowded side here, and if price pushes up, forced short covering can make the move sharper.
Funding or open interest, which one do you trust more in setups like this?
Data's just data. Still, I'd keep leverage low around this one.
#Futures #CryptoTrading $IRYS
73
·
--
👀 Odd one on the board: $RARE, funding at -1.153%
Scrolled the futures board and this number made me look twice:
Price +96.1% on the day, top traders' long/short at 1.01.
What it means: Negative funding means shorts are paying longs to hold. Shorts are the crowded side here, and if price pushes up, forced short covering can make the move sharper.
Funding or open interest, which one do you trust more in setups like this?
Boring advice, but low leverage is how you survive setups like this.
#Futures #CryptoTrading $RARE
👀 Odd one on the board: $RARE , funding at -1.153%
Scrolled the futures board and this number made me look twice:
Price +96.1% on the day, top traders' long/short at 1.01.
What it means: Negative funding means shorts are paying longs to hold. Shorts are the crowded side here, and if price pushes up, forced short covering can make the move sharper.
Funding or open interest, which one do you trust more in setups like this?
Boring advice, but low leverage is how you survive setups like this.
#Futures #CryptoTrading $RARE
Scrolled the futures board and this number made me look twice:
Price +96.1% on the day, top traders' long/short at 1.01.
What it means: Negative funding means shorts are paying longs to hold. Shorts are the crowded side here, and if price pushes up, forced short covering can make the move sharper.
Funding or open interest, which one do you trust more in setups like this?
Boring advice, but low leverage is how you survive setups like this.
#Futures #CryptoTrading $RARE
29
·
--
Watching $SKR. Open interest -8.4% in 1h to 8.8M, funding at -1.679%
One perp on the board is doing something odd:
Price +15.8% on the day, top traders' long/short at 1.16.
What it means: Negative funding means shorts are paying longs to hold. Shorts are the crowded side here, and if price pushes up, forced short covering can make the move sharper.
Funding or open interest, which one do you trust more in setups like this?
No view on direction, just flagging the positioning.
#Futures #CryptoTrading $SKR
Watching $SKR . Open interest -8.4% in 1h to 8.8M, funding at -1.679%
One perp on the board is doing something odd:
Price +15.8% on the day, top traders' long/short at 1.16.
What it means: Negative funding means shorts are paying longs to hold. Shorts are the crowded side here, and if price pushes up, forced short covering can make the move sharper.
Funding or open interest, which one do you trust more in setups like this?
No view on direction, just flagging the positioning.
#Futures #CryptoTrading $SKR
One perp on the board is doing something odd:
Price +15.8% on the day, top traders' long/short at 1.16.
What it means: Negative funding means shorts are paying longs to hold. Shorts are the crowded side here, and if price pushes up, forced short covering can make the move sharper.
Funding or open interest, which one do you trust more in setups like this?
No view on direction, just flagging the positioning.
#Futures #CryptoTrading $SKR
40
·
--
Odd one on the board: $RARE, funding at -0.565%
One perp on the board is doing something odd:
Price +61.2% on the day, top traders' long/short at 1.07.
What it means: Negative funding means shorts are paying longs to hold. Shorts are the crowded side here, and if price pushes up, forced short covering can make the move sharper.
Would you sit this one out or trade it small?
No view on direction, just flagging the positioning.
#Futures #CryptoTrading $RARE
Odd one on the board: $RARE , funding at -0.565%
One perp on the board is doing something odd:
Price +61.2% on the day, top traders' long/short at 1.07.
What it means: Negative funding means shorts are paying longs to hold. Shorts are the crowded side here, and if price pushes up, forced short covering can make the move sharper.
Would you sit this one out or trade it small?
No view on direction, just flagging the positioning.
#Futures #CryptoTrading $RARE
One perp on the board is doing something odd:
Price +61.2% on the day, top traders' long/short at 1.07.
What it means: Negative funding means shorts are paying longs to hold. Shorts are the crowded side here, and if price pushes up, forced short covering can make the move sharper.
Would you sit this one out or trade it small?
No view on direction, just flagging the positioning.
#Futures #CryptoTrading $RARE
48
·
--
Odd one on the board: $KAVA, funding at -0.619%
One perp on the board is doing something odd:
Price +9.4% on the day, top traders' long/short at 1.42.
What it means: Negative funding means shorts are paying longs to hold. Shorts are the crowded side here, and if price pushes up, forced short covering can make the move sharper.
Would you sit this one out or trade it small?
No view on direction, just flagging the positioning.
#Futures #CryptoTrading $KAVA
Odd one on the board: $KAVA , funding at -0.619%
One perp on the board is doing something odd:
Price +9.4% on the day, top traders' long/short at 1.42.
What it means: Negative funding means shorts are paying longs to hold. Shorts are the crowded side here, and if price pushes up, forced short covering can make the move sharper.
Would you sit this one out or trade it small?
No view on direction, just flagging the positioning.
#Futures #CryptoTrading $KAVA
One perp on the board is doing something odd:
Price +9.4% on the day, top traders' long/short at 1.42.
What it means: Negative funding means shorts are paying longs to hold. Shorts are the crowded side here, and if price pushes up, forced short covering can make the move sharper.
Would you sit this one out or trade it small?
No view on direction, just flagging the positioning.
#Futures #CryptoTrading $KAVA
75
·
--
⚡ $ASTER positioning check: open interest -30.7% in 1h to 272.1M, 6.3M liquidated in 1h (mostly longs)
Ran my usual scan of the perps and this one stood out:
Price +4.9% on the day, top traders' long/short at 2.48.
What it means: Open interest dropping this fast means positions are being closed or wiped out. Leverage is flushing, which can calm things down or thin out liquidity.
Funding or open interest, which one do you trust more in setups like this?
Boring advice, but low leverage is how you survive setups like this.
#Futures #CryptoTrading $ASTER
⚡ $ASTER positioning check: open interest -30.7% in 1h to 272.1M, 6.3M liquidated in 1h (mostly longs)
Ran my usual scan of the perps and this one stood out:
Price +4.9% on the day, top traders' long/short at 2.48.
What it means: Open interest dropping this fast means positions are being closed or wiped out. Leverage is flushing, which can calm things down or thin out liquidity.
Funding or open interest, which one do you trust more in setups like this?
Boring advice, but low leverage is how you survive setups like this.
#Futures #CryptoTrading $ASTER
Ran my usual scan of the perps and this one stood out:
Price +4.9% on the day, top traders' long/short at 2.48.
What it means: Open interest dropping this fast means positions are being closed or wiped out. Leverage is flushing, which can calm things down or thin out liquidity.
Funding or open interest, which one do you trust more in setups like this?
Boring advice, but low leverage is how you survive setups like this.
#Futures #CryptoTrading $ASTER
50
·
--
$SOPH: funding at -0.247%
One perp on the board is doing something odd:
Price -44.6% on the day, top traders' long/short at 1.35.
What it means: Negative funding means shorts are paying longs to hold. Shorts are the crowded side here, and if price pushes up, forced short covering can make the move sharper.
Anyone watching SOPH? Does this match what you see on the chart?
Boring advice, but low leverage is how you survive setups like this.
#Futures #CryptoTrading $SOPH
$SOPH : funding at -0.247%
One perp on the board is doing something odd:
Price -44.6% on the day, top traders' long/short at 1.35.
What it means: Negative funding means shorts are paying longs to hold. Shorts are the crowded side here, and if price pushes up, forced short covering can make the move sharper.
Anyone watching SOPH? Does this match what you see on the chart?
Boring advice, but low leverage is how you survive setups like this.
#Futures #CryptoTrading $SOPH
One perp on the board is doing something odd:
Price -44.6% on the day, top traders' long/short at 1.35.
What it means: Negative funding means shorts are paying longs to hold. Shorts are the crowded side here, and if price pushes up, forced short covering can make the move sharper.
Anyone watching SOPH? Does this match what you see on the chart?
Boring advice, but low leverage is how you survive setups like this.
#Futures #CryptoTrading $SOPH
59
·
--
$SOPH positioning check: open interest -15.3% in 1h to 13.2M, funding at -0.549%
Ran my usual scan of the perps and this one stood out:
Price -32.3% on the day, top traders' long/short at 1.49.
What it means: Negative funding means shorts are paying longs to hold. Shorts are the crowded side here, and if price pushes up, forced short covering can make the move sharper.
Would you sit this one out or trade it small?
Data's just data. Still, I'd keep leverage low around this one.
#Futures #CryptoTrading $SOPH
$SOPH positioning check: open interest -15.3% in 1h to 13.2M, funding at -0.549%
Ran my usual scan of the perps and this one stood out:
Price -32.3% on the day, top traders' long/short at 1.49.
What it means: Negative funding means shorts are paying longs to hold. Shorts are the crowded side here, and if price pushes up, forced short covering can make the move sharper.
Would you sit this one out or trade it small?
Data's just data. Still, I'd keep leverage low around this one.
#Futures #CryptoTrading $SOPH
Ran my usual scan of the perps and this one stood out:
Price -32.3% on the day, top traders' long/short at 1.49.
What it means: Negative funding means shorts are paying longs to hold. Shorts are the crowded side here, and if price pushes up, forced short covering can make the move sharper.
Would you sit this one out or trade it small?
Data's just data. Still, I'd keep leverage low around this one.
#Futures #CryptoTrading $SOPH
56
·
--
Odd one on the board: $BTW, funding at -2.000%
Most of the board is quiet, but this one is worth a second look:
Price -20.3% on the day, top traders' long/short at 0.71.
What it means: Negative funding means shorts are paying longs to hold. Shorts are the crowded side here, and if price pushes up, forced short covering can make the move sharper.
Anyone watching BTW? Does this match what you see on the chart?
Not a call either way, just the numbers. Size carefully.
#Futures #CryptoTrading $BTW
Odd one on the board: $BTW , funding at -2.000%
Most of the board is quiet, but this one is worth a second look:
Price -20.3% on the day, top traders' long/short at 0.71.
What it means: Negative funding means shorts are paying longs to hold. Shorts are the crowded side here, and if price pushes up, forced short covering can make the move sharper.
Anyone watching BTW? Does this match what you see on the chart?
Not a call either way, just the numbers. Size carefully.
#Futures #CryptoTrading $BTW
Most of the board is quiet, but this one is worth a second look:
Price -20.3% on the day, top traders' long/short at 0.71.
What it means: Negative funding means shorts are paying longs to hold. Shorts are the crowded side here, and if price pushes up, forced short covering can make the move sharper.
Anyone watching BTW? Does this match what you see on the chart?
Not a call either way, just the numbers. Size carefully.
#Futures #CryptoTrading $BTW
44
·
--
📈 $BERA perps: open interest -9.7% in 1h to 18.0M, funding at -0.931%
Scrolled the futures board and this number made me look twice:
Price +11.7% on the day, top traders' long/short at 1.38.
What it means: Negative funding means shorts are paying longs to hold. Shorts are the crowded side here, and if price pushes up, forced short covering can make the move sharper.
Would you sit this one out or trade it small?
No view on direction, just flagging the positioning.
#Futures #CryptoTrading $BERA
📈 $BERA perps: open interest -9.7% in 1h to 18.0M, funding at -0.931%
Scrolled the futures board and this number made me look twice:
Price +11.7% on the day, top traders' long/short at 1.38.
What it means: Negative funding means shorts are paying longs to hold. Shorts are the crowded side here, and if price pushes up, forced short covering can make the move sharper.
Would you sit this one out or trade it small?
No view on direction, just flagging the positioning.
#Futures #CryptoTrading $BERA
Scrolled the futures board and this number made me look twice:
Price +11.7% on the day, top traders' long/short at 1.38.
What it means: Negative funding means shorts are paying longs to hold. Shorts are the crowded side here, and if price pushes up, forced short covering can make the move sharper.
Would you sit this one out or trade it small?
No view on direction, just flagging the positioning.
#Futures #CryptoTrading $BERA
62
·
--
Watching $SOL. 15.3M liquidated in 1h (mostly longs)
Scrolled the futures board and this number made me look twice:
Price -5.2% on the day, top traders' long/short at 2.25.
What it means: A liquidation spike like this shows one side got caught offside. These flushes often reset positioning.
Which side do you think is more crowded on SOL right now?
No view on direction, just flagging the positioning.
#Futures #CryptoTrading $SOL
Watching $SOL . 15.3M liquidated in 1h (mostly longs)
Scrolled the futures board and this number made me look twice:
Price -5.2% on the day, top traders' long/short at 2.25.
What it means: A liquidation spike like this shows one side got caught offside. These flushes often reset positioning.
Which side do you think is more crowded on SOL right now?
No view on direction, just flagging the positioning.
#Futures #CryptoTrading $SOL
Scrolled the futures board and this number made me look twice:
Price -5.2% on the day, top traders' long/short at 2.25.
What it means: A liquidation spike like this shows one side got caught offside. These flushes often reset positioning.
Which side do you think is more crowded on SOL right now?
No view on direction, just flagging the positioning.
#Futures #CryptoTrading $SOL
67
·
--
👀 Funding at -0.920% on $BARD
Most of the board is quiet, but this one is worth a second look:
Price +13.7% on the day, top traders' long/short at 0.96.
What it means: Negative funding means shorts are paying longs to hold. Shorts are the crowded side here, and if price pushes up, forced short covering can make the move sharper.
Would you sit this one out or trade it small?
No view on direction, just flagging the positioning.
#Futures #CryptoTrading $BARD
👀 Funding at -0.920% on $BARD
Most of the board is quiet, but this one is worth a second look:
Price +13.7% on the day, top traders' long/short at 0.96.
What it means: Negative funding means shorts are paying longs to hold. Shorts are the crowded side here, and if price pushes up, forced short covering can make the move sharper.
Would you sit this one out or trade it small?
No view on direction, just flagging the positioning.
#Futures #CryptoTrading $BARD
Most of the board is quiet, but this one is worth a second look:
Price +13.7% on the day, top traders' long/short at 0.96.
What it means: Negative funding means shorts are paying longs to hold. Shorts are the crowded side here, and if price pushes up, forced short covering can make the move sharper.
Would you sit this one out or trade it small?
No view on direction, just flagging the positioning.
#Futures #CryptoTrading $BARD
1
·
--
Odd one on the board: $BARD, open interest -12.0% in 1h to 22.5M, funding at -1.100%
Ran my usual scan of the perps and this one stood out:
Price +1.3% on the day, top traders' long/short at 0.97.
What it means: Negative funding means shorts are paying longs to hold. Shorts are the crowded side here, and if price pushes up, forced short covering can make the move sharper.
Funding or open interest, which one do you trust more in setups like this?
Not a call either way, just the numbers. Size carefully.
#Futures #CryptoTrading $BARD
Odd one on the board: $BARD , open interest -12.0% in 1h to 22.5M, funding at -1.100%
Ran my usual scan of the perps and this one stood out:
Price +1.3% on the day, top traders' long/short at 0.97.
What it means: Negative funding means shorts are paying longs to hold. Shorts are the crowded side here, and if price pushes up, forced short covering can make the move sharper.
Funding or open interest, which one do you trust more in setups like this?
Not a call either way, just the numbers. Size carefully.
#Futures #CryptoTrading $BARD
Ran my usual scan of the perps and this one stood out:
Price +1.3% on the day, top traders' long/short at 0.97.
What it means: Negative funding means shorts are paying longs to hold. Shorts are the crowded side here, and if price pushes up, forced short covering can make the move sharper.
Funding or open interest, which one do you trust more in setups like this?
Not a call either way, just the numbers. Size carefully.
#Futures #CryptoTrading $BARD
4
·
--
$BARD positioning check: funding at -1.753%
Most of the board is quiet, but this one is worth a second look:
Price +82.7% on the day, top traders' long/short at 0.90.
What it means: Negative funding means shorts are paying longs to hold. Shorts are the crowded side here, and if price pushes up, forced short covering can make the move sharper.
Which side do you think is more crowded on BARD right now?
No view on direction, just flagging the positioning.
#Futures #CryptoTrading $BARD
$BARD positioning check: funding at -1.753%
Most of the board is quiet, but this one is worth a second look:
Price +82.7% on the day, top traders' long/short at 0.90.
What it means: Negative funding means shorts are paying longs to hold. Shorts are the crowded side here, and if price pushes up, forced short covering can make the move sharper.
Which side do you think is more crowded on BARD right now?
No view on direction, just flagging the positioning.
#Futures #CryptoTrading $BARD
Most of the board is quiet, but this one is worth a second look:
Price +82.7% on the day, top traders' long/short at 0.90.
What it means: Negative funding means shorts are paying longs to hold. Shorts are the crowded side here, and if price pushes up, forced short covering can make the move sharper.
Which side do you think is more crowded on BARD right now?
No view on direction, just flagging the positioning.
#Futures #CryptoTrading $BARD
26
·
--
Watching $BARD. Funding at -1.914%
One perp on the board is doing something odd:
Price +92.3% on the day, top traders' long/short at 0.90.
What it means: Negative funding means shorts are paying longs to hold. Shorts are the crowded side here, and if price pushes up, forced short covering can make the move sharper.
Anyone watching BARD? Does this match what you see on the chart?
No view on direction, just flagging the positioning.
#Futures #CryptoTrading $BARD
Watching $BARD . Funding at -1.914%
One perp on the board is doing something odd:
Price +92.3% on the day, top traders' long/short at 0.90.
What it means: Negative funding means shorts are paying longs to hold. Shorts are the crowded side here, and if price pushes up, forced short covering can make the move sharper.
Anyone watching BARD? Does this match what you see on the chart?
No view on direction, just flagging the positioning.
#Futures #CryptoTrading $BARD
One perp on the board is doing something odd:
Price +92.3% on the day, top traders' long/short at 0.90.
What it means: Negative funding means shorts are paying longs to hold. Shorts are the crowded side here, and if price pushes up, forced short covering can make the move sharper.
Anyone watching BARD? Does this match what you see on the chart?
No view on direction, just flagging the positioning.
#Futures #CryptoTrading $BARD
30
·
--
$BARD positioning check: funding at -1.952%
Scrolled the futures board and this number made me look twice:
Price +63.3% on the day, top traders' long/short at 0.90.
What it means: Negative funding means shorts are paying longs to hold. Shorts are the crowded side here, and if price pushes up, forced short covering can make the move sharper.
Funding or open interest, which one do you trust more in setups like this?
Data's just data. Still, I'd keep leverage low around this one.
#Futures #CryptoTrading $BARD
$BARD positioning check: funding at -1.952%
Scrolled the futures board and this number made me look twice:
Price +63.3% on the day, top traders' long/short at 0.90.
What it means: Negative funding means shorts are paying longs to hold. Shorts are the crowded side here, and if price pushes up, forced short covering can make the move sharper.
Funding or open interest, which one do you trust more in setups like this?
Data's just data. Still, I'd keep leverage low around this one.
#Futures #CryptoTrading $BARD
Scrolled the futures board and this number made me look twice:
Price +63.3% on the day, top traders' long/short at 0.90.
What it means: Negative funding means shorts are paying longs to hold. Shorts are the crowded side here, and if price pushes up, forced short covering can make the move sharper.
Funding or open interest, which one do you trust more in setups like this?
Data's just data. Still, I'd keep leverage low around this one.
#Futures #CryptoTrading $BARD
47
·
--
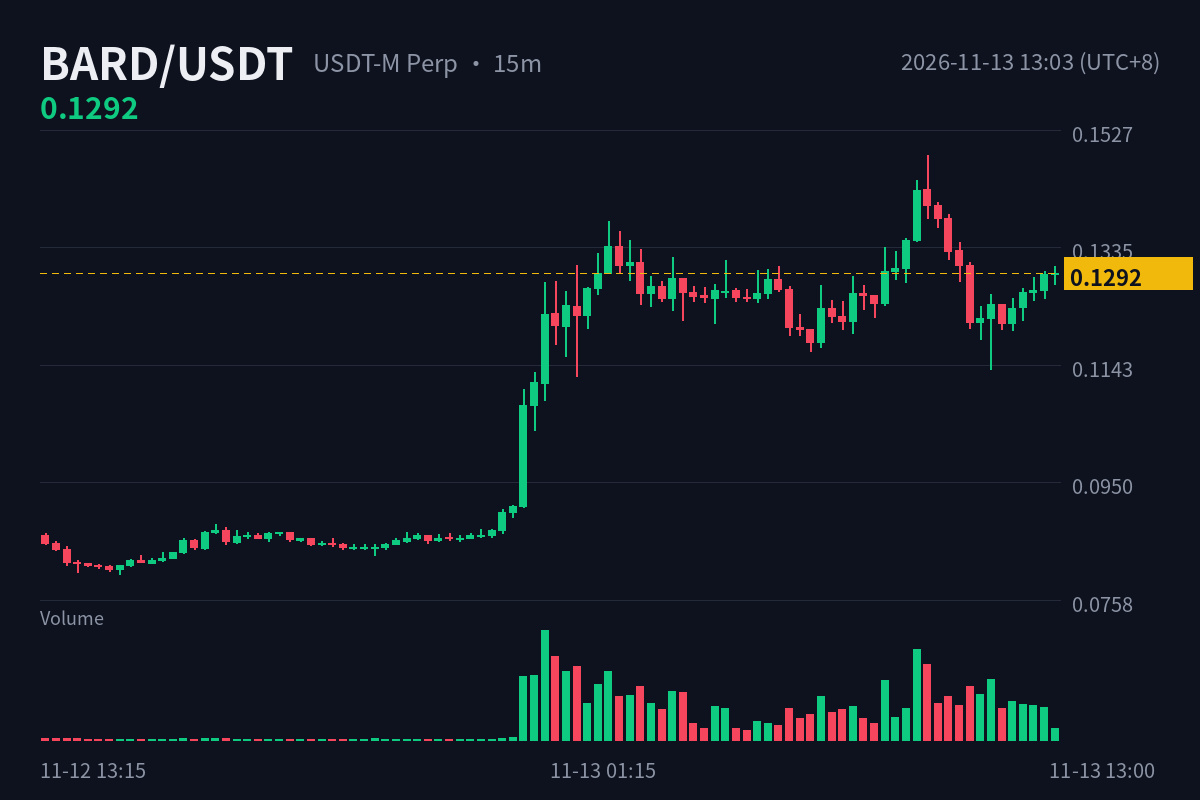
🚨 $BARD: open interest +12.4% in 1h to 22.3M, funding at -1.652%
Ran my usual scan of the perps and this one stood out:
Price +47.4% on the day, top traders' long/short at 0.93.
What it means: Negative funding means shorts are paying longs to hold. Shorts are the crowded side here, and if price pushes up, forced short covering can make the move sharper.
Which side do you think is more crowded on BARD right now?
No view on direction, just flagging the positioning.
#Futures #CryptoTrading $BARD
🚨 $BARD : open interest +12.4% in 1h to 22.3M, funding at -1.652%
Ran my usual scan of the perps and this one stood out:
Price +47.4% on the day, top traders' long/short at 0.93.
What it means: Negative funding means shorts are paying longs to hold. Shorts are the crowded side here, and if price pushes up, forced short covering can make the move sharper.
Which side do you think is more crowded on BARD right now?
No view on direction, just flagging the positioning.
#Futures #CryptoTrading $BARD
Ran my usual scan of the perps and this one stood out:
Price +47.4% on the day, top traders' long/short at 0.93.
What it means: Negative funding means shorts are paying longs to hold. Shorts are the crowded side here, and if price pushes up, forced short covering can make the move sharper.
Which side do you think is more crowded on BARD right now?
No view on direction, just flagging the positioning.
#Futures #CryptoTrading $BARD
56
·
--
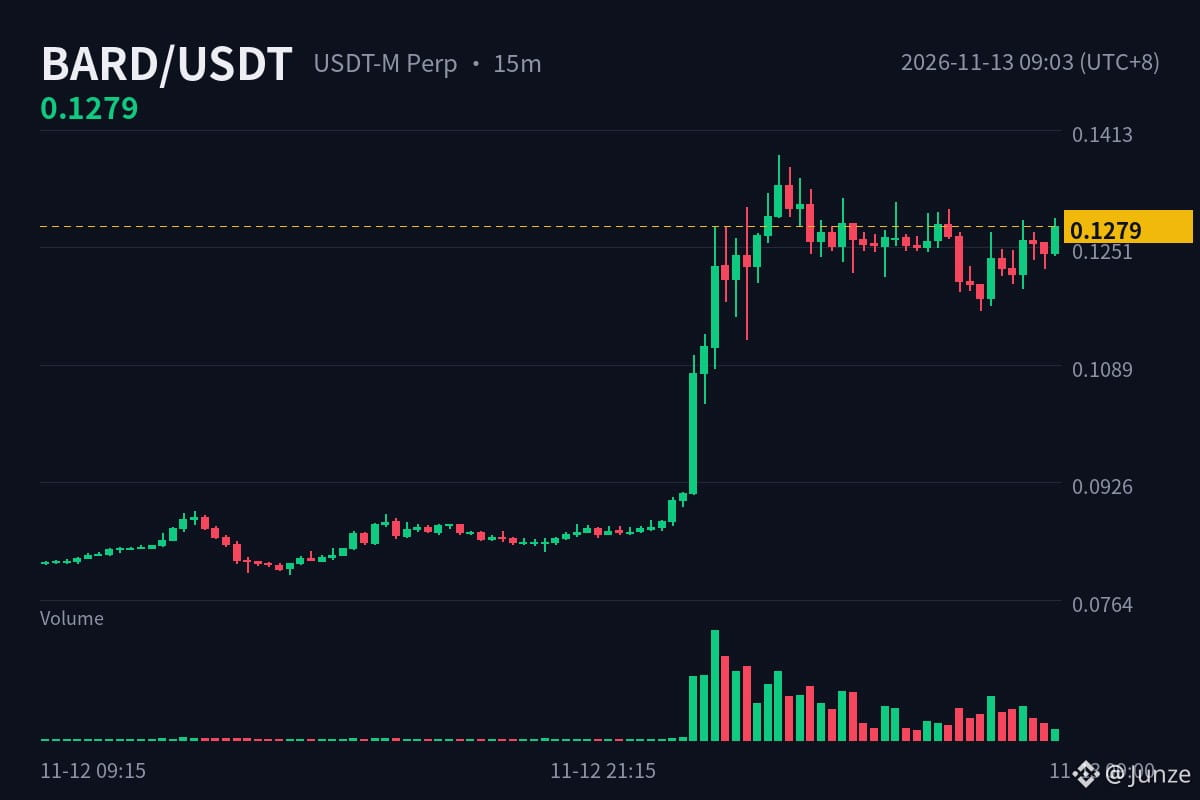
🚨 $BARD: open interest +8.2% in 1h to 20.1M, funding at -0.757%
Scrolled the futures board and this number made me look twice:
Price +56.2% on the day, top traders' long/short at 0.88.
What it means: Negative funding means shorts are paying longs to hold. Shorts are the crowded side here, and if price pushes up, forced short covering can make the move sharper.
Would you sit this one out or trade it small?
No view on direction, just flagging the positioning.
#Futures #CryptoTrading $BARD
🚨 $BARD : open interest +8.2% in 1h to 20.1M, funding at -0.757%
Scrolled the futures board and this number made me look twice:
Price +56.2% on the day, top traders' long/short at 0.88.
What it means: Negative funding means shorts are paying longs to hold. Shorts are the crowded side here, and if price pushes up, forced short covering can make the move sharper.
Would you sit this one out or trade it small?
No view on direction, just flagging the positioning.
#Futures #CryptoTrading $BARD
Scrolled the futures board and this number made me look twice:
Price +56.2% on the day, top traders' long/short at 0.88.
What it means: Negative funding means shorts are paying longs to hold. Shorts are the crowded side here, and if price pushes up, forced short covering can make the move sharper.
Would you sit this one out or trade it small?
No view on direction, just flagging the positioning.
#Futures #CryptoTrading $BARD
75
Log in to explore more content
Join global crypto users on Binance Square
⚡️ Get latest and useful information about crypto.
💬 Trusted by the world’s largest crypto exchange.
👍 Discover real insights from verified creators.
Email / Phone number
Trending Topics
BTCReboundsAbove$60KAmidWhaleDipBuying
26,901 views
170 Discussing
Abraxas Capital, Other Whales Buy the BTC Dip as Bitcoin Briefly Reclaims $60,000
Binance News
·29 Likes
·43.4k views
SolanaSets2027RoadmapToDoubleComputeCapacity
10,232 views
344 Discussing
CaliforniaNvidiaProbeExaminesPotentialCriminalViolations
3,908 views
52 Discussing