
MT - Research Notes
384 Posts

MT - Research Notes
Report
Block User
My research notes on crypto & money. 9 years as investor, CM & builder.
Learn to make, manage & master your own money.
Crypto 60% · Money 35% · Shitposts 5%

BNB Holder
Frequent Trader
8.9 Years
7 Following
516 Followers
562 Liked
Posts
All
Quotes
Videos
PINNED
·
--
Bullish
Verified
Unpopular opinion: I'm not withdrawing. My coins stay on Binance!
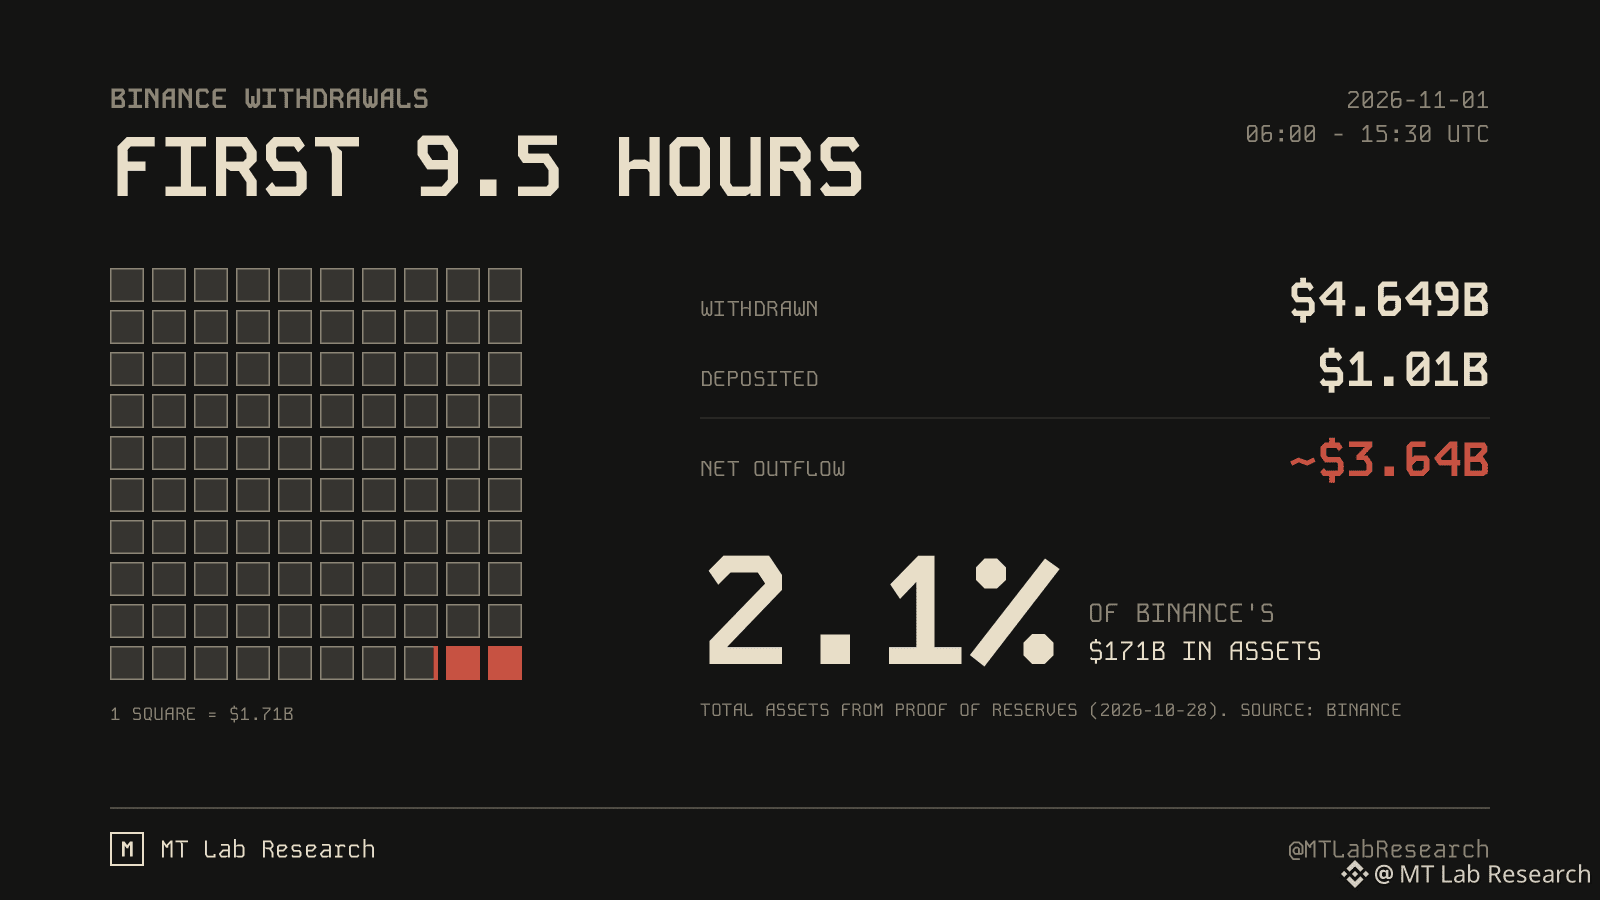
$4.65B left in the first 9.5 hours after reopening. Sounds scary, until you see the size: the net outflow was $3.64B, about 2.1% of Binance's $171B in assets.
The numbers from Binance (Nov 1, 06:00 to 15:30 UTC):
- Withdrawals: $4.649B
- Deposits: $1.01B
- Net outflow: ~$3.64B
- Share of $171B total assets: 2.1%
All 15 networks were open by 12:36 UTC. After the first spike, withdrawals are slowing down.
Why I stay:
1. Even after past hacks, Binance is still the top-tier CEX (centralized exchange) for me, and the custodial wallet I trust most. Nothing is 100% safe, though.
2. After seeing how the team handled this hack, my trust in them, especially @CZ and @heyi , is still high.
3. I need a balance on Binance to keep earning Alpha Points (Binance's score for Alpha airdrops, partly based on your account balance).
4. Yi He also hinted that a community rewards campaign is coming soon.
This is my personal choice, not advice. If self-custody helps you sleep better, that's a fair answer too.
Your money, your call. Stay or withdraw?
#BinanceProcesses$4.65BWithdrawals
$BTC $BNB $ETH
{future}(ETHUSDT)
{future}(BNBUSDT)
{future}(BTCUSDT)
Unpopular opinion: I'm not withdrawing. My coins stay on Binance!
$4.65B left in the first 9.5 hours after reopening. Sounds scary, until you see the size: the net outflow was $3.64B, about 2.1% of Binance's $171B in assets.
The numbers from Binance (Nov 1, 06:00 to 15:30 UTC):
- Withdrawals: $4.649B
- Deposits: $1.01B
- Net outflow: ~$3.64B
- Share of $171B total assets: 2.1%
All 15 networks were open by 12:36 UTC. After the first spike, withdrawals are slowing down.
Why I stay:
1. Even after past hacks, Binance is still the top-tier CEX (centralized exchange) for me, and the custodial wallet I trust most. Nothing is 100% safe, though.
2. After seeing how the team handled this hack, my trust in them, especially @CZ and @Yi He , is still high.
3. I need a balance on Binance to keep earning Alpha Points (Binance's score for Alpha airdrops, partly based on your account balance).
4. Yi He also hinted that a community rewards campaign is coming soon.
This is my personal choice, not advice. If self-custody helps you sleep better, that's a fair answer too.
Your money, your call. Stay or withdraw?
#BinanceProcesses$4.65BWithdrawals
$BTC $BNB $ETH
$4.65B left in the first 9.5 hours after reopening. Sounds scary, until you see the size: the net outflow was $3.64B, about 2.1% of Binance's $171B in assets.
The numbers from Binance (Nov 1, 06:00 to 15:30 UTC):
- Withdrawals: $4.649B
- Deposits: $1.01B
- Net outflow: ~$3.64B
- Share of $171B total assets: 2.1%
All 15 networks were open by 12:36 UTC. After the first spike, withdrawals are slowing down.
Why I stay:
1. Even after past hacks, Binance is still the top-tier CEX (centralized exchange) for me, and the custodial wallet I trust most. Nothing is 100% safe, though.
2. After seeing how the team handled this hack, my trust in them, especially @CZ and @Yi He , is still high.
3. I need a balance on Binance to keep earning Alpha Points (Binance's score for Alpha airdrops, partly based on your account balance).
4. Yi He also hinted that a community rewards campaign is coming soon.
This is my personal choice, not advice. If self-custody helps you sleep better, that's a fair answer too.
Your money, your call. Stay or withdraw?
#BinanceProcesses$4.65BWithdrawals
$BTC $BNB $ETH
59
9
107
139.4k
PINNED
·
--
Bullish
Hello, I’m MT.
[One of my recent posts](https://app.binance.com/uni-qr/cpos/383640305501275?l=en&r=RSZIOD4B&uc=web_square_share_link&uco=1KBv2xzJL43lh1Oalg09UA&us=copylink) reached 138.7k views, with 106 likes, 59 comments and 9 shares. I didn’t expect that. It also brought me my first 127 followers here.
Thank you for supporting me! ❤
I know these are small numbers, and a view isn’t a follower. I see this as a starting point: a place to learn crypto and money together, in public.
A bit about me: 9 years as an investor, community manager and builder in crypto. Here I share my research notes on crypto and money, plus a few shitposts.
What you’ll find:
- How I research projects and opportunities
- What I did with my own money, wins and losses
- Lessons on how to make, manage and keep your money
- The right money mindset: the psychology and philosophy of money management. It’s the foundation before you can earn anything, especially in this volatile, uncertain, complex and ambiguous universe
I’d love to connect with:
- web3 builders and project teams
- investors and active players
- creators
- friends on Square growing financially and personally
Now it’s your turn. Say hi and introduce yourself: what are you learning or building right now? I promise to read and reply to every comment.
All my notes are for education and information only. Not financial advice.
Keep your money first. Make money second.
– MT
Hello, I’m MT.
One of my recent posts reached 138.7k views, with 106 likes, 59 comments and 9 shares. I didn’t expect that. It also brought me my first 127 followers here.
Thank you for supporting me! ❤
I know these are small numbers, and a view isn’t a follower. I see this as a starting point: a place to learn crypto and money together, in public.
A bit about me: 9 years as an investor, community manager and builder in crypto. Here I share my research notes on crypto and money, plus a few shitposts.
What you’ll find:
- How I research projects and opportunities
- What I did with my own money, wins and losses
- Lessons on how to make, manage and keep your money
- The right money mindset: the psychology and philosophy of money management. It’s the foundation before you can earn anything, especially in this volatile, uncertain, complex and ambiguous universe
I’d love to connect with:
- web3 builders and project teams
- investors and active players
- creators
- friends on Square growing financially and personally
Now it’s your turn. Say hi and introduce yourself: what are you learning or building right now? I promise to read and reply to every comment.
All my notes are for education and information only. Not financial advice.
Keep your money first. Make money second.
– MT
One of my recent posts reached 138.7k views, with 106 likes, 59 comments and 9 shares. I didn’t expect that. It also brought me my first 127 followers here.
Thank you for supporting me! ❤
I know these are small numbers, and a view isn’t a follower. I see this as a starting point: a place to learn crypto and money together, in public.
A bit about me: 9 years as an investor, community manager and builder in crypto. Here I share my research notes on crypto and money, plus a few shitposts.
What you’ll find:
- How I research projects and opportunities
- What I did with my own money, wins and losses
- Lessons on how to make, manage and keep your money
- The right money mindset: the psychology and philosophy of money management. It’s the foundation before you can earn anything, especially in this volatile, uncertain, complex and ambiguous universe
I’d love to connect with:
- web3 builders and project teams
- investors and active players
- creators
- friends on Square growing financially and personally
Now it’s your turn. Say hi and introduce yourself: what are you learning or building right now? I promise to read and reply to every comment.
All my notes are for education and information only. Not financial advice.
Keep your money first. Make money second.
– MT

1
195
·
--
Bullish
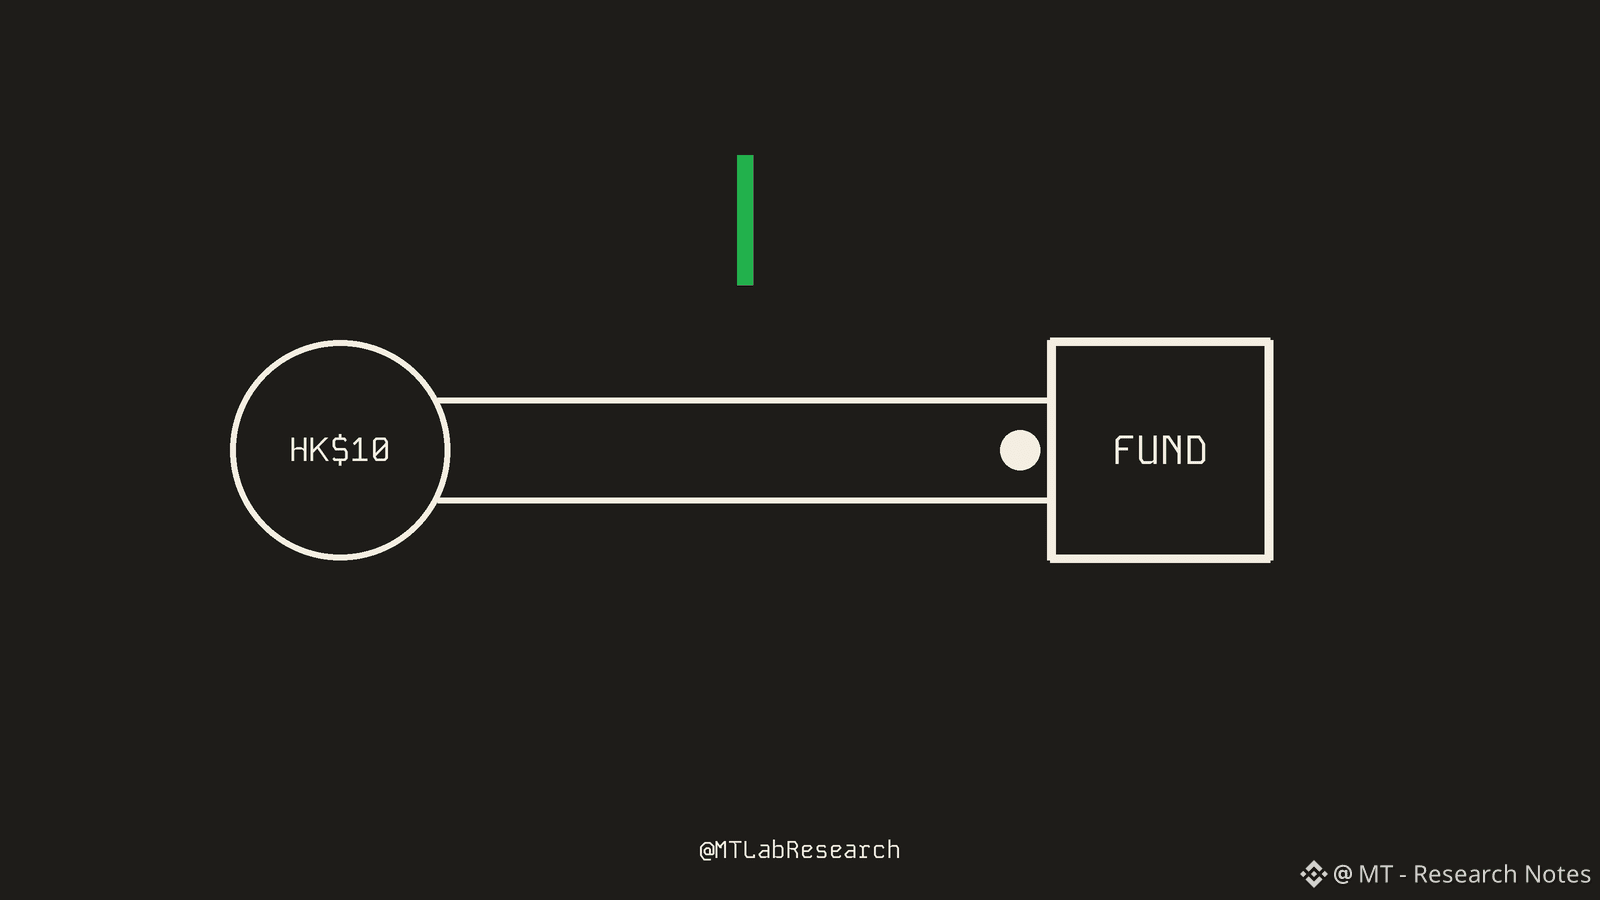
BlackRock opened a cash fund to Hong Kong retail from just HK$10.
Yes, it is live, and the stablecoin link is the real story. It already started on 16 Nov!
What it is? A Hong Kong dollar money market fund. Think of a cash parking spot run by BlackRock that holds short-term government bills and bank deposits and aims to keep a steady price. Units come in normal and tokenised (on-chain) form, and BlackRock says digital cash like the regulated stablecoin HKDAP can be used to subscribe and redeem.
The timeline, per BlackRock's own pages:
> 10 Sep 2026: authorisation announced.
> 16 Nov 2026: fund inception, prospectus dated, first offer period opens.
> 20 Nov 2026: BlackRock's page shows a price of HK$10.0000 per unit.
Who can get in?
- Retail (D classes): HK$10 to start, HK$1 after that.
- Institutions (I class): HK$10 million, and not offered to the Hong Kong public.
- Tokenised units: for now retail can only buy them through eligible distributors. I could not confirm that a normal person can pay with HKDAP today.
Before you celebrate, the steady HK$10.0000 price is an aim. The market-value price on 20 Nov was HK$9.9997. It is not a bank deposit and not guaranteed, and BlackRock warns that tokenised units add smart contract risk and lost private keys are on you.
In my opinion the bigger signal is the plumbing: stablecoins becoming a door in and out of regulated cash funds, not just a trading chip. It is the first commercial use of HKDAP and the 4th currency in BlackRock's tokenised cash fund family (per Ledger Insights).
Cash in a bank or in a token, where would you park yours?
Experience, not financial advice.
#BlackRockLaunchesHKDollarDigitalLiquidityFund
BlackRock opened a cash fund to Hong Kong retail from just HK$10.
Yes, it is live, and the stablecoin link is the real story. It already started on 16 Nov!
What it is? A Hong Kong dollar money market fund. Think of a cash parking spot run by BlackRock that holds short-term government bills and bank deposits and aims to keep a steady price. Units come in normal and tokenised (on-chain) form, and BlackRock says digital cash like the regulated stablecoin HKDAP can be used to subscribe and redeem.
The timeline, per BlackRock's own pages:
> 10 Sep 2026: authorisation announced.
> 16 Nov 2026: fund inception, prospectus dated, first offer period opens.
> 20 Nov 2026: BlackRock's page shows a price of HK$10.0000 per unit.
Who can get in?
- Retail (D classes): HK$10 to start, HK$1 after that.
- Institutions (I class): HK$10 million, and not offered to the Hong Kong public.
- Tokenised units: for now retail can only buy them through eligible distributors. I could not confirm that a normal person can pay with HKDAP today.
Before you celebrate, the steady HK$10.0000 price is an aim. The market-value price on 20 Nov was HK$9.9997. It is not a bank deposit and not guaranteed, and BlackRock warns that tokenised units add smart contract risk and lost private keys are on you.
In my opinion the bigger signal is the plumbing: stablecoins becoming a door in and out of regulated cash funds, not just a trading chip. It is the first commercial use of HKDAP and the 4th currency in BlackRock's tokenised cash fund family (per Ledger Insights).
Cash in a bank or in a token, where would you park yours?
Experience, not financial advice.
#BlackRockLaunchesHKDollarDigitalLiquidityFund
Yes, it is live, and the stablecoin link is the real story. It already started on 16 Nov!
What it is? A Hong Kong dollar money market fund. Think of a cash parking spot run by BlackRock that holds short-term government bills and bank deposits and aims to keep a steady price. Units come in normal and tokenised (on-chain) form, and BlackRock says digital cash like the regulated stablecoin HKDAP can be used to subscribe and redeem.
The timeline, per BlackRock's own pages:
> 10 Sep 2026: authorisation announced.
> 16 Nov 2026: fund inception, prospectus dated, first offer period opens.
> 20 Nov 2026: BlackRock's page shows a price of HK$10.0000 per unit.
Who can get in?
- Retail (D classes): HK$10 to start, HK$1 after that.
- Institutions (I class): HK$10 million, and not offered to the Hong Kong public.
- Tokenised units: for now retail can only buy them through eligible distributors. I could not confirm that a normal person can pay with HKDAP today.
Before you celebrate, the steady HK$10.0000 price is an aim. The market-value price on 20 Nov was HK$9.9997. It is not a bank deposit and not guaranteed, and BlackRock warns that tokenised units add smart contract risk and lost private keys are on you.
In my opinion the bigger signal is the plumbing: stablecoins becoming a door in and out of regulated cash funds, not just a trading chip. It is the first commercial use of HKDAP and the 4th currency in BlackRock's tokenised cash fund family (per Ledger Insights).
Cash in a bank or in a token, where would you park yours?
Experience, not financial advice.
#BlackRockLaunchesHKDollarDigitalLiquidityFund
BLKUS-2.33%
2
3
1.5k
·
--
Bullish
Verified
Solana just promised a road twice as wide. Who is going to drive on it?
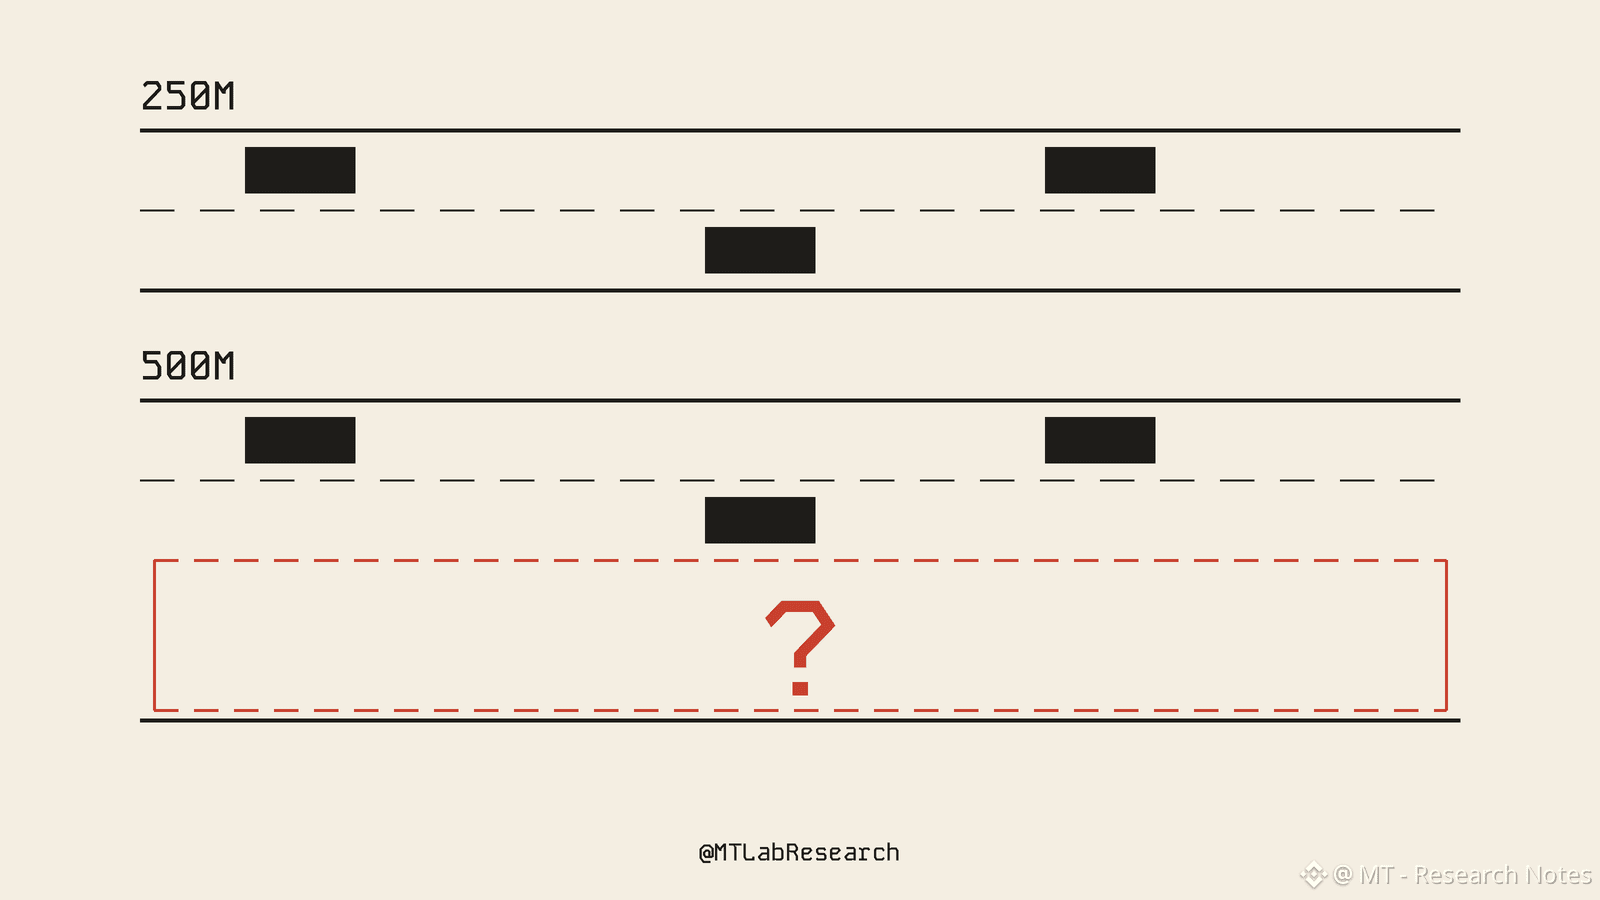
Anza, the team behind Solana's main validator software, unveiled its 2027 plan at Breakpoint in London. The headline: double the network's capacity from about 250 million to 500 million compute units per second, and make token transfers use about 80% less of it (per Crypto Briefing and BeInCrypto). A compute unit is just how Solana counts the work a transaction does. Think lanes on a highway.
Before anyone prices that in, three things worth checking:
1. It is a target, not a launch. The main capacity goal sits at the end of 2027, and no activation dates have been given for the individual upgrades.
2. Capacity is not demand. In July, Solana already lifted its block limit from 60M to 100M compute units. In the year before, only about 1 block in 9 came close to full, per the Solana Foundation, and it said traffic is mostly not limited by block execution time. So the road was already wide, and mostly roomy.
3. Cheaper only matters if people show up. An 80% cut on token transfers frees space, but someone still has to fill it.
So what has to be true for this to matter to the SOL story?
> If apps and users arrive and fill the new space, a wider road has a point.
> If the road stays mostly empty, doubling it is nice engineering and little else.
> If validators upgrade slowly or dates slip, it stays a slide in a deck.
The roadmap itself does not say which one plays out.
A habit worth keeping with any roadmap: split what is promised, what is shipped, and what needs demand.
What do you most expect on Solana in 2027? $SOL
{future}(SOLUSDT)
Experience, not financial advice.
#solanasets2027roadmaptodoublecomputecapacity
Solana just promised a road twice as wide. Who is going to drive on it?
Anza, the team behind Solana's main validator software, unveiled its 2027 plan at Breakpoint in London. The headline: double the network's capacity from about 250 million to 500 million compute units per second, and make token transfers use about 80% less of it (per Crypto Briefing and BeInCrypto). A compute unit is just how Solana counts the work a transaction does. Think lanes on a highway.
Before anyone prices that in, three things worth checking:
1. It is a target, not a launch. The main capacity goal sits at the end of 2027, and no activation dates have been given for the individual upgrades.
2. Capacity is not demand. In July, Solana already lifted its block limit from 60M to 100M compute units. In the year before, only about 1 block in 9 came close to full, per the Solana Foundation, and it said traffic is mostly not limited by block execution time. So the road was already wide, and mostly roomy.
3. Cheaper only matters if people show up. An 80% cut on token transfers frees space, but someone still has to fill it.
So what has to be true for this to matter to the SOL story?
> If apps and users arrive and fill the new space, a wider road has a point.
> If the road stays mostly empty, doubling it is nice engineering and little else.
> If validators upgrade slowly or dates slip, it stays a slide in a deck.
The roadmap itself does not say which one plays out.
A habit worth keeping with any roadmap: split what is promised, what is shipped, and what needs demand.
What do you most expect on Solana in 2027? $SOL
Experience, not financial advice.
#solanasets2027roadmaptodoublecomputecapacity
Anza, the team behind Solana's main validator software, unveiled its 2027 plan at Breakpoint in London. The headline: double the network's capacity from about 250 million to 500 million compute units per second, and make token transfers use about 80% less of it (per Crypto Briefing and BeInCrypto). A compute unit is just how Solana counts the work a transaction does. Think lanes on a highway.
Before anyone prices that in, three things worth checking:
1. It is a target, not a launch. The main capacity goal sits at the end of 2027, and no activation dates have been given for the individual upgrades.
2. Capacity is not demand. In July, Solana already lifted its block limit from 60M to 100M compute units. In the year before, only about 1 block in 9 came close to full, per the Solana Foundation, and it said traffic is mostly not limited by block execution time. So the road was already wide, and mostly roomy.
3. Cheaper only matters if people show up. An 80% cut on token transfers frees space, but someone still has to fill it.
So what has to be true for this to matter to the SOL story?
> If apps and users arrive and fill the new space, a wider road has a point.
> If the road stays mostly empty, doubling it is nice engineering and little else.
> If validators upgrade slowly or dates slip, it stays a slide in a deck.
The roadmap itself does not say which one plays out.
A habit worth keeping with any roadmap: split what is promised, what is shipped, and what needs demand.
What do you most expect on Solana in 2027? $SOL
Experience, not financial advice.
#solanasets2027roadmaptodoublecomputecapacity
4
4
3.6k
·
--
Bearish
California just said "criminal" about Nvidia. What does that actually mean?
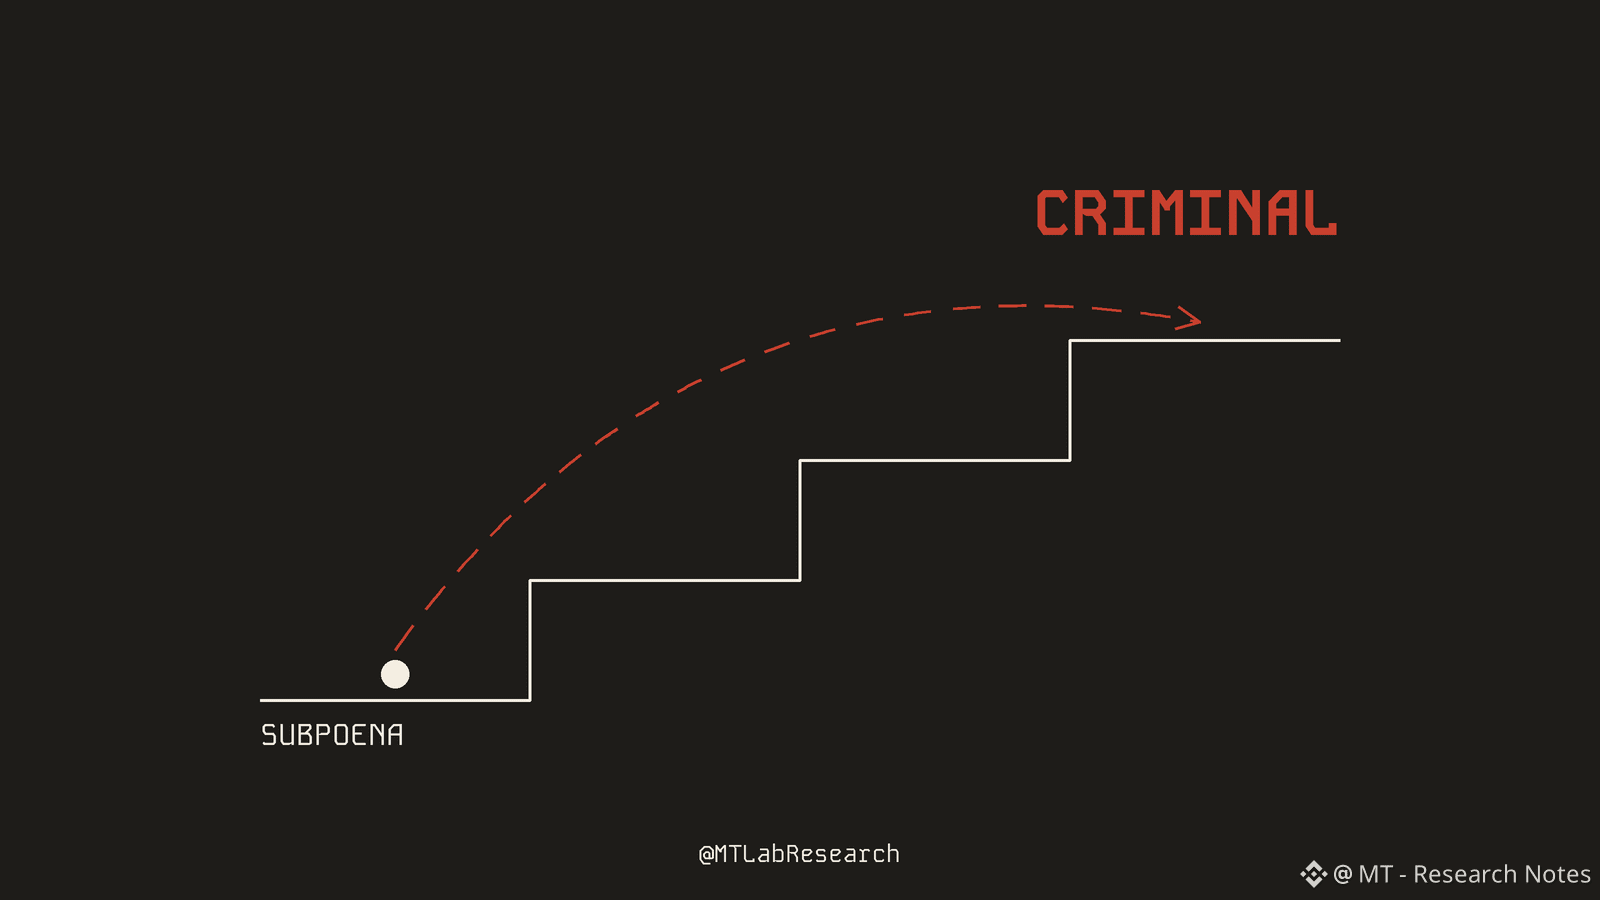
Short answer: it is early. On Nov 19, California's attorney general sent Nvidia an investigative subpoena, a legal demand for documents and answers. A day later he said, per Bloomberg, the probe covers possible violations of state criminal law. He also said it is preliminary and no conclusions have been reached.
What is being checked?
- did advanced chips or confidential information reach China?
- did Nvidia or its former CEO Jensen Huang mislead investors or the public about it?
Charges, if any, depend on the facts, when people knew, and what they intended. If wrongdoing is proven, reported remedies include a court order to stop and paying back the money. I found no Nvidia response in the reports.
Why a crypto reader should care? Markets don't wait for the facts. When Huang resigned on Nov 12, BTC slipped below $72,000, AI tokens like NEAR, Bittensor and Render fell 7% to 12%, and about $720 million of positions were liquidated in 24 hours, mostly bets on higher prices (Coinglass). That was a headline, not a verdict.
A probe usually climbs in steps (in my experience):
- subpoena and documents (we are here)
- findings
- a lawsuit or charges
- an outcome
Each step needs new facts. Trade the word instead of the step and you are trading a story.
- Read the stage, not the adjective.
- Borrowed money turns a headline into a liquidation. What must be true for your position to survive a 10% day?
- AI tokens have often moved with Nvidia news. Check what yours really depends on.
Which scares you faster, subpoena, probe or charge?
Experience, not financial advice.
#CaliforniaNvidiaProbeExaminesPotentialCriminalViolations
California just said "criminal" about Nvidia. What does that actually mean?
Short answer: it is early. On Nov 19, California's attorney general sent Nvidia an investigative subpoena, a legal demand for documents and answers. A day later he said, per Bloomberg, the probe covers possible violations of state criminal law. He also said it is preliminary and no conclusions have been reached.
What is being checked?
- did advanced chips or confidential information reach China?
- did Nvidia or its former CEO Jensen Huang mislead investors or the public about it?
Charges, if any, depend on the facts, when people knew, and what they intended. If wrongdoing is proven, reported remedies include a court order to stop and paying back the money. I found no Nvidia response in the reports.
Why a crypto reader should care? Markets don't wait for the facts. When Huang resigned on Nov 12, BTC slipped below $72,000, AI tokens like NEAR, Bittensor and Render fell 7% to 12%, and about $720 million of positions were liquidated in 24 hours, mostly bets on higher prices (Coinglass). That was a headline, not a verdict.
A probe usually climbs in steps (in my experience):
- subpoena and documents (we are here)
- findings
- a lawsuit or charges
- an outcome
Each step needs new facts. Trade the word instead of the step and you are trading a story.
- Read the stage, not the adjective.
- Borrowed money turns a headline into a liquidation. What must be true for your position to survive a 10% day?
- AI tokens have often moved with Nvidia news. Check what yours really depends on.
Which scares you faster, subpoena, probe or charge?
Experience, not financial advice.
#CaliforniaNvidiaProbeExaminesPotentialCriminalViolations
Short answer: it is early. On Nov 19, California's attorney general sent Nvidia an investigative subpoena, a legal demand for documents and answers. A day later he said, per Bloomberg, the probe covers possible violations of state criminal law. He also said it is preliminary and no conclusions have been reached.
What is being checked?
- did advanced chips or confidential information reach China?
- did Nvidia or its former CEO Jensen Huang mislead investors or the public about it?
Charges, if any, depend on the facts, when people knew, and what they intended. If wrongdoing is proven, reported remedies include a court order to stop and paying back the money. I found no Nvidia response in the reports.
Why a crypto reader should care? Markets don't wait for the facts. When Huang resigned on Nov 12, BTC slipped below $72,000, AI tokens like NEAR, Bittensor and Render fell 7% to 12%, and about $720 million of positions were liquidated in 24 hours, mostly bets on higher prices (Coinglass). That was a headline, not a verdict.
A probe usually climbs in steps (in my experience):
- subpoena and documents (we are here)
- findings
- a lawsuit or charges
- an outcome
Each step needs new facts. Trade the word instead of the step and you are trading a story.
- Read the stage, not the adjective.
- Borrowed money turns a headline into a liquidation. What must be true for your position to survive a 10% day?
- AI tokens have often moved with Nvidia news. Check what yours really depends on.
Which scares you faster, subpoena, probe or charge?
Experience, not financial advice.
#CaliforniaNvidiaProbeExaminesPotentialCriminalViolations
2
1
8
10.7k
·
--
Bearish
A whale pulled $1B of BTC off exchanges at $59K. Is that a buy?
On-chain tracker Lookonchain says Abraxas Capital, a London hedge fund, withdrew 17,597 BTC (about $1.04B) from Binance and Kraken while BTC traded under $60,000, at an average of about $59,206. Some analysts read it as the buyer behind the weekend bounce. That's the headline version.
Here's what a newbie can misread. A withdrawal is a move, not a receipt. Trackers see coins leave an exchange. They don't see the trade, the price paid or the plan behind it. Even the reports repeating Lookonchain's data say the read rests on withdrawal records and can't confirm the real size or cost.
The plan matters. Abraxas is best known for market-neutral funds, which hold a long and an offsetting short so price direction doesn't matter. If this BTC sits against a short somewhere, it isn't a bet on higher prices. Lookonchain did report on Nov 16 that the firm's Hyperliquid shorts had shrunk to about $70M, so a plain bet is possible too. Nobody outside the firm knows.
The size is real. By my math, $1.04B is about 30% of the $3.6B that left US Bitcoin ETFs this month. But it is one firm's coins moving, not a verdict from the whole market.
Before copying any whale, ask 3 things:
1. Is it a bet on higher prices, or hedged?
2. Is it proof of a trade, or just coins moving?
3. Its entry was about $59,206 and you don't know its exit. Does the plan work at your size and timing?
A whale's withdrawal tells you where the coins went. It doesn't tell you why.
Do you follow whale trackers, or ignore them? $BTC
{future}(BTCUSDT)
Experience, not financial advice.
#BTCReboundsAbove$60KAmidWhaleDipBuying
A whale pulled $1B of BTC off exchanges at $59K. Is that a buy?
On-chain tracker Lookonchain says Abraxas Capital, a London hedge fund, withdrew 17,597 BTC (about $1.04B) from Binance and Kraken while BTC traded under $60,000, at an average of about $59,206. Some analysts read it as the buyer behind the weekend bounce. That's the headline version.
Here's what a newbie can misread. A withdrawal is a move, not a receipt. Trackers see coins leave an exchange. They don't see the trade, the price paid or the plan behind it. Even the reports repeating Lookonchain's data say the read rests on withdrawal records and can't confirm the real size or cost.
The plan matters. Abraxas is best known for market-neutral funds, which hold a long and an offsetting short so price direction doesn't matter. If this BTC sits against a short somewhere, it isn't a bet on higher prices. Lookonchain did report on Nov 16 that the firm's Hyperliquid shorts had shrunk to about $70M, so a plain bet is possible too. Nobody outside the firm knows.
The size is real. By my math, $1.04B is about 30% of the $3.6B that left US Bitcoin ETFs this month. But it is one firm's coins moving, not a verdict from the whole market.
Before copying any whale, ask 3 things:
1. Is it a bet on higher prices, or hedged?
2. Is it proof of a trade, or just coins moving?
3. Its entry was about $59,206 and you don't know its exit. Does the plan work at your size and timing?
A whale's withdrawal tells you where the coins went. It doesn't tell you why.
Do you follow whale trackers, or ignore them? $BTC
Experience, not financial advice.
#BTCReboundsAbove$60KAmidWhaleDipBuying
On-chain tracker Lookonchain says Abraxas Capital, a London hedge fund, withdrew 17,597 BTC (about $1.04B) from Binance and Kraken while BTC traded under $60,000, at an average of about $59,206. Some analysts read it as the buyer behind the weekend bounce. That's the headline version.
Here's what a newbie can misread. A withdrawal is a move, not a receipt. Trackers see coins leave an exchange. They don't see the trade, the price paid or the plan behind it. Even the reports repeating Lookonchain's data say the read rests on withdrawal records and can't confirm the real size or cost.
The plan matters. Abraxas is best known for market-neutral funds, which hold a long and an offsetting short so price direction doesn't matter. If this BTC sits against a short somewhere, it isn't a bet on higher prices. Lookonchain did report on Nov 16 that the firm's Hyperliquid shorts had shrunk to about $70M, so a plain bet is possible too. Nobody outside the firm knows.
The size is real. By my math, $1.04B is about 30% of the $3.6B that left US Bitcoin ETFs this month. But it is one firm's coins moving, not a verdict from the whole market.
Before copying any whale, ask 3 things:
1. Is it a bet on higher prices, or hedged?
2. Is it proof of a trade, or just coins moving?
3. Its entry was about $59,206 and you don't know its exit. Does the plan work at your size and timing?
A whale's withdrawal tells you where the coins went. It doesn't tell you why.
Do you follow whale trackers, or ignore them? $BTC
Experience, not financial advice.
#BTCReboundsAbove$60KAmidWhaleDipBuying
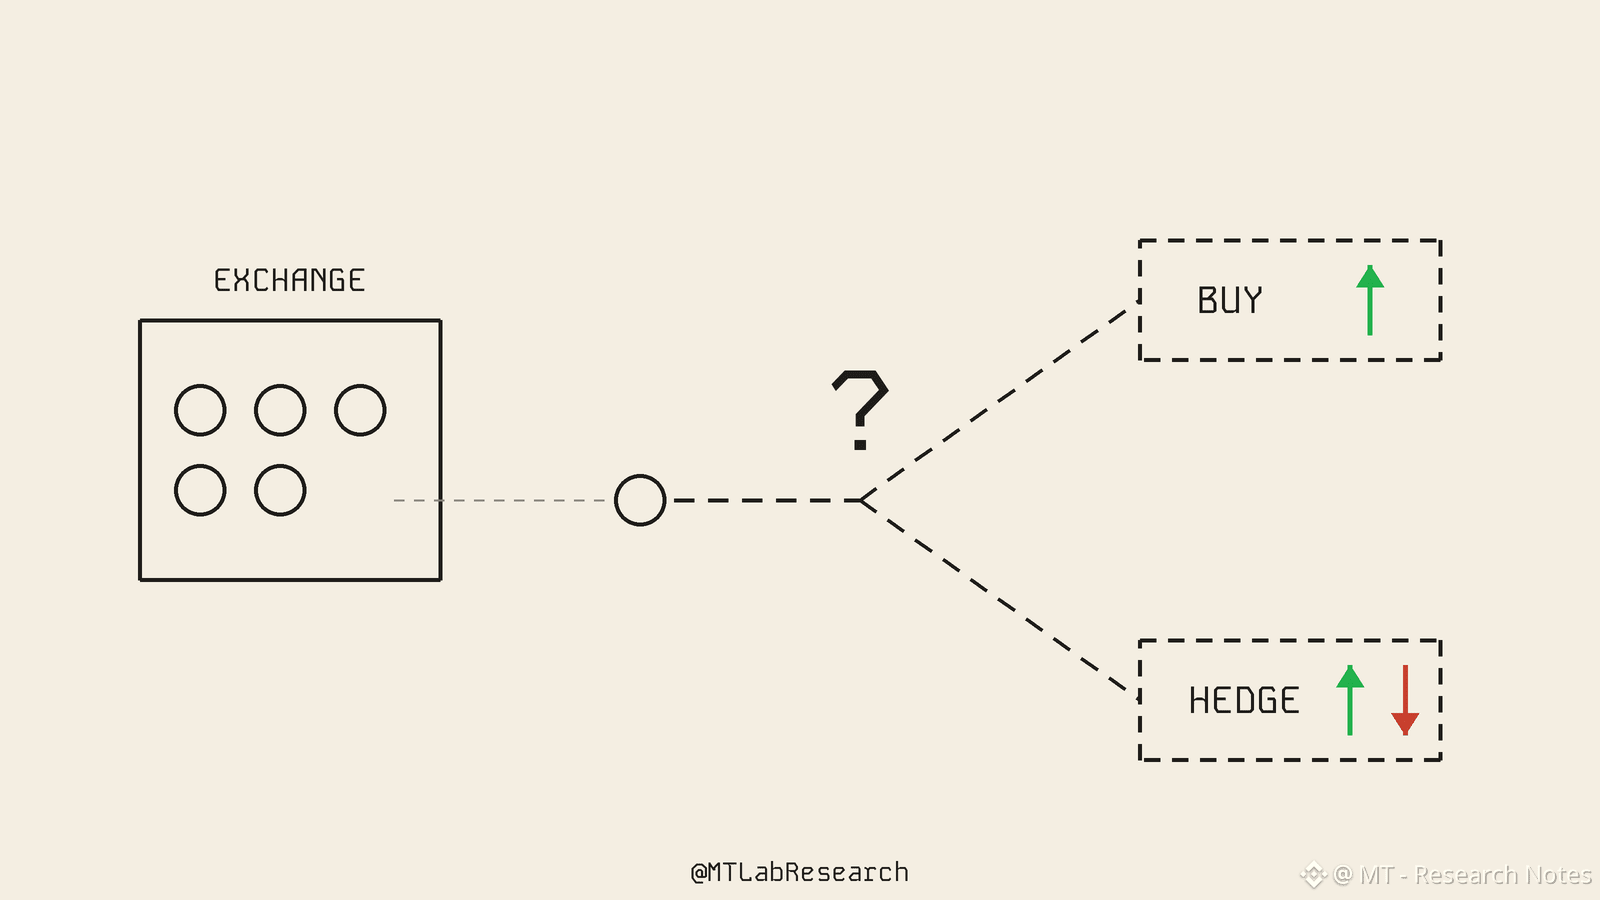
MT - Research Notes
·
--
BearishBTC bounced 9% while Wall Street was closed. So who was buying?
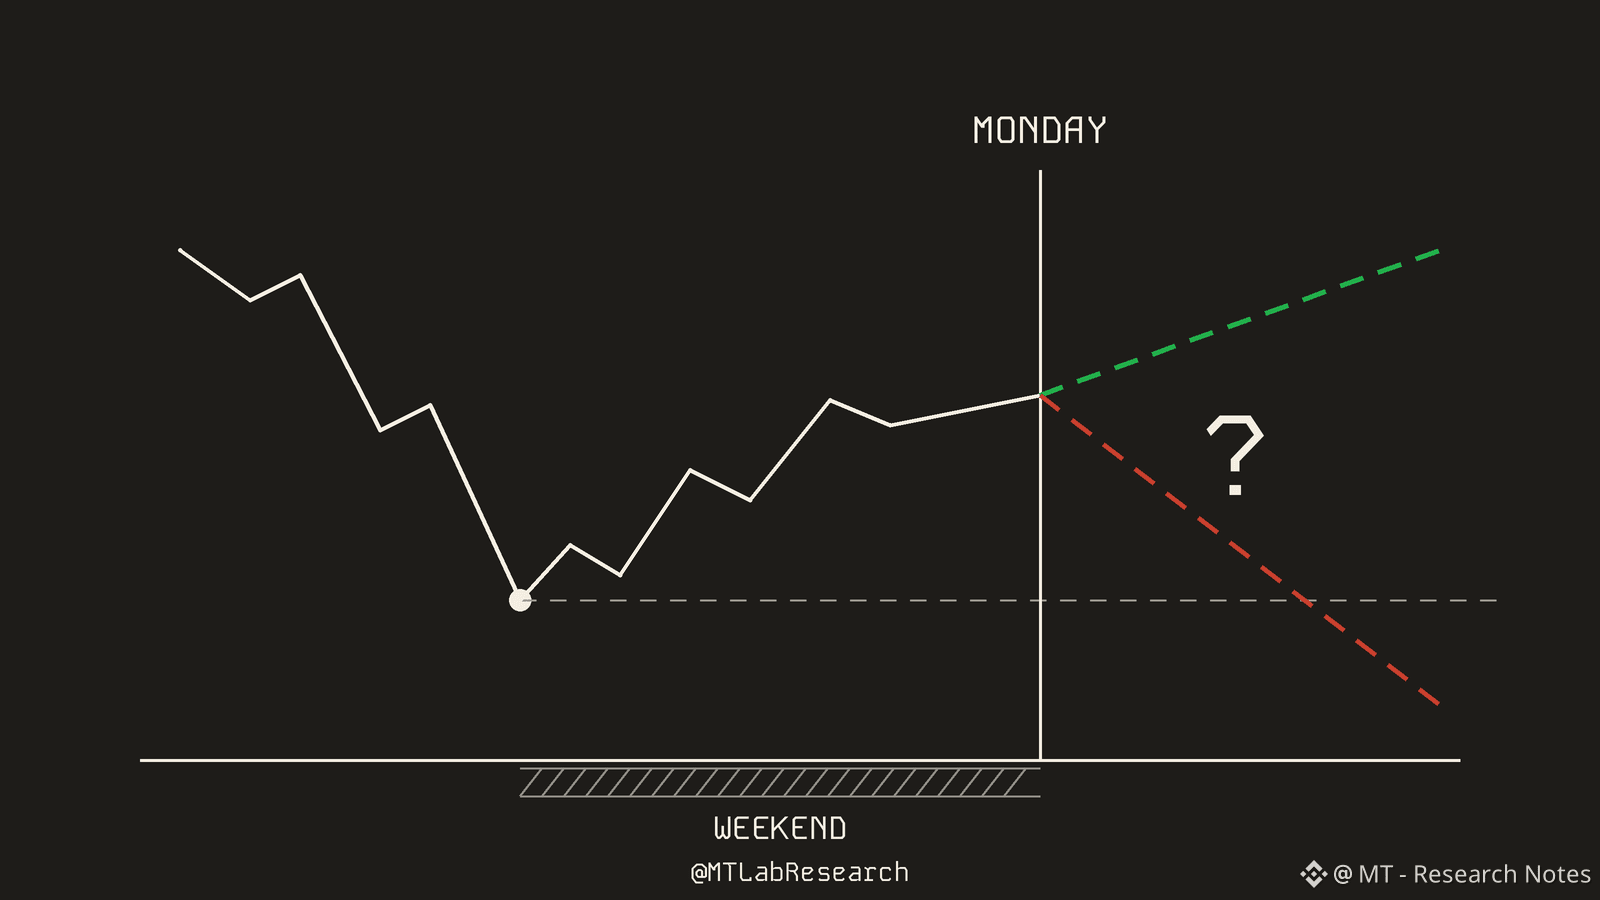
BTC fell to about $55,100 early Saturday (UTC), its lowest price since September 2024, then climbed back above $60,000 within hours. Billions in leveraged bets were wiped out on the way down, mostly bets on higher prices. Sentiment still reads Extreme Fear.
Here's what a green candle can hide. US Bitcoin ETFs (funds that let Wall Street buy BTC through a normal brokerage account) don't trade on weekends. So the bounce did not come from them.
Part of it may be forced sellers simply running out. Glassnode says the selloff cleared the largest cluster of liquidations it was tracking (via CoinDesk). When that stops, price can snap back without anyone new deciding to buy.
Nobody can see yet who actually bought. Candidates: shorts closing, dip buyers, or sellers simply stopping.
Meanwhile the big buyers have been walking out. BlackRock's IBIT, the largest of these funds, lost a record $541M on Nov 19. US spot Bitcoin ETFs are down roughly $3.5B this month, per Farside data. And the Nasdaq fell more than 4% on Friday.
That is why Monday matters more than the bounce. Monday's US open is at 14:30 UTC, and ETF flow numbers land after the close.
Here's a simple way to read it:
- Flows flat or positive and stocks calm: the weekend low has a better chance to hold
- Outflows keep running and stocks slide: a bounce built on a quiet weekend can fade fast
- Mixed signals: expect chop, not a clean answer
A bounce shows who stopped selling. Only Monday shows who started buying.
Do you plan to buy before the open, wait for it, or sit out? $BTC
Experience, not financial advice.
#CanBTCReboundAfterFallingBelow60K?
BTC fell to about $55,100 early Saturday (UTC), its lowest price since September 2024, then climbed back above $60,000 within hours. Billions in leveraged bets were wiped out on the way down, mostly bets on higher prices. Sentiment still reads Extreme Fear.
Here's what a green candle can hide. US Bitcoin ETFs (funds that let Wall Street buy BTC through a normal brokerage account) don't trade on weekends. So the bounce did not come from them.
Part of it may be forced sellers simply running out. Glassnode says the selloff cleared the largest cluster of liquidations it was tracking (via CoinDesk). When that stops, price can snap back without anyone new deciding to buy.
Nobody can see yet who actually bought. Candidates: shorts closing, dip buyers, or sellers simply stopping.
Meanwhile the big buyers have been walking out. BlackRock's IBIT, the largest of these funds, lost a record $541M on Nov 19. US spot Bitcoin ETFs are down roughly $3.5B this month, per Farside data. And the Nasdaq fell more than 4% on Friday.
That is why Monday matters more than the bounce. Monday's US open is at 14:30 UTC, and ETF flow numbers land after the close.
Here's a simple way to read it:
- Flows flat or positive and stocks calm: the weekend low has a better chance to hold
- Outflows keep running and stocks slide: a bounce built on a quiet weekend can fade fast
- Mixed signals: expect chop, not a clean answer
A bounce shows who stopped selling. Only Monday shows who started buying.
Do you plan to buy before the open, wait for it, or sit out? $BTC
Experience, not financial advice.
#CanBTCReboundAfterFallingBelow60K?
2
1
3
1.3k
·
--
Bearish
BTC bounced 9% while Wall Street was closed. So who was buying?
BTC fell to about $55,100 early Saturday (UTC), its lowest price since September 2024, then climbed back above $60,000 within hours. Billions in leveraged bets were wiped out on the way down, mostly bets on higher prices. Sentiment still reads Extreme Fear.
Here's what a green candle can hide. US Bitcoin ETFs (funds that let Wall Street buy BTC through a normal brokerage account) don't trade on weekends. So the bounce did not come from them.
Part of it may be forced sellers simply running out. Glassnode says the selloff cleared the largest cluster of liquidations it was tracking (via CoinDesk). When that stops, price can snap back without anyone new deciding to buy.
Nobody can see yet who actually bought. Candidates: shorts closing, dip buyers, or sellers simply stopping.
Meanwhile the big buyers have been walking out. BlackRock's IBIT, the largest of these funds, lost a record $541M on Nov 19. US spot Bitcoin ETFs are down roughly $3.5B this month, per Farside data. And the Nasdaq fell more than 4% on Friday.
That is why Monday matters more than the bounce. Monday's US open is at 14:30 UTC, and ETF flow numbers land after the close.
Here's a simple way to read it:
- Flows flat or positive and stocks calm: the weekend low has a better chance to hold
- Outflows keep running and stocks slide: a bounce built on a quiet weekend can fade fast
- Mixed signals: expect chop, not a clean answer
A bounce shows who stopped selling. Only Monday shows who started buying.
Do you plan to buy before the open, wait for it, or sit out? $BTC
{future}(BTCUSDT)
Experience, not financial advice.
#CanBTCReboundAfterFallingBelow60K?
BTC bounced 9% while Wall Street was closed. So who was buying?
BTC fell to about $55,100 early Saturday (UTC), its lowest price since September 2024, then climbed back above $60,000 within hours. Billions in leveraged bets were wiped out on the way down, mostly bets on higher prices. Sentiment still reads Extreme Fear.
Here's what a green candle can hide. US Bitcoin ETFs (funds that let Wall Street buy BTC through a normal brokerage account) don't trade on weekends. So the bounce did not come from them.
Part of it may be forced sellers simply running out. Glassnode says the selloff cleared the largest cluster of liquidations it was tracking (via CoinDesk). When that stops, price can snap back without anyone new deciding to buy.
Nobody can see yet who actually bought. Candidates: shorts closing, dip buyers, or sellers simply stopping.
Meanwhile the big buyers have been walking out. BlackRock's IBIT, the largest of these funds, lost a record $541M on Nov 19. US spot Bitcoin ETFs are down roughly $3.5B this month, per Farside data. And the Nasdaq fell more than 4% on Friday.
That is why Monday matters more than the bounce. Monday's US open is at 14:30 UTC, and ETF flow numbers land after the close.
Here's a simple way to read it:
- Flows flat or positive and stocks calm: the weekend low has a better chance to hold
- Outflows keep running and stocks slide: a bounce built on a quiet weekend can fade fast
- Mixed signals: expect chop, not a clean answer
A bounce shows who stopped selling. Only Monday shows who started buying.
Do you plan to buy before the open, wait for it, or sit out? $BTC
Experience, not financial advice.
#CanBTCReboundAfterFallingBelow60K?
BTC fell to about $55,100 early Saturday (UTC), its lowest price since September 2024, then climbed back above $60,000 within hours. Billions in leveraged bets were wiped out on the way down, mostly bets on higher prices. Sentiment still reads Extreme Fear.
Here's what a green candle can hide. US Bitcoin ETFs (funds that let Wall Street buy BTC through a normal brokerage account) don't trade on weekends. So the bounce did not come from them.
Part of it may be forced sellers simply running out. Glassnode says the selloff cleared the largest cluster of liquidations it was tracking (via CoinDesk). When that stops, price can snap back without anyone new deciding to buy.
Nobody can see yet who actually bought. Candidates: shorts closing, dip buyers, or sellers simply stopping.
Meanwhile the big buyers have been walking out. BlackRock's IBIT, the largest of these funds, lost a record $541M on Nov 19. US spot Bitcoin ETFs are down roughly $3.5B this month, per Farside data. And the Nasdaq fell more than 4% on Friday.
That is why Monday matters more than the bounce. Monday's US open is at 14:30 UTC, and ETF flow numbers land after the close.
Here's a simple way to read it:
- Flows flat or positive and stocks calm: the weekend low has a better chance to hold
- Outflows keep running and stocks slide: a bounce built on a quiet weekend can fade fast
- Mixed signals: expect chop, not a clean answer
A bounce shows who stopped selling. Only Monday shows who started buying.
Do you plan to buy before the open, wait for it, or sit out? $BTC
Experience, not financial advice.
#CanBTCReboundAfterFallingBelow60K?
4
1
4
4.9k
·
--
Bullish
Last time the fear index hit 5, BTC bottomed at $60K. This week it hit $55K.
> On Nov 19, BlackRock's IBIT fund (a way to own Bitcoin through a normal stock account) lost $541M in one day. That is its biggest single-day outflow since launch in Jan 2024, per Farside data. US Bitcoin ETFs together are down about $3.47B for November so far.
> Over the same stretch, Strategy, Saylor's company, kept filing buys: 485 BTC (about $33M) in the week to Nov 15, at roughly $68.9K each. Small next to $541M, but it is a real buyer in a company filing, not a tweet.
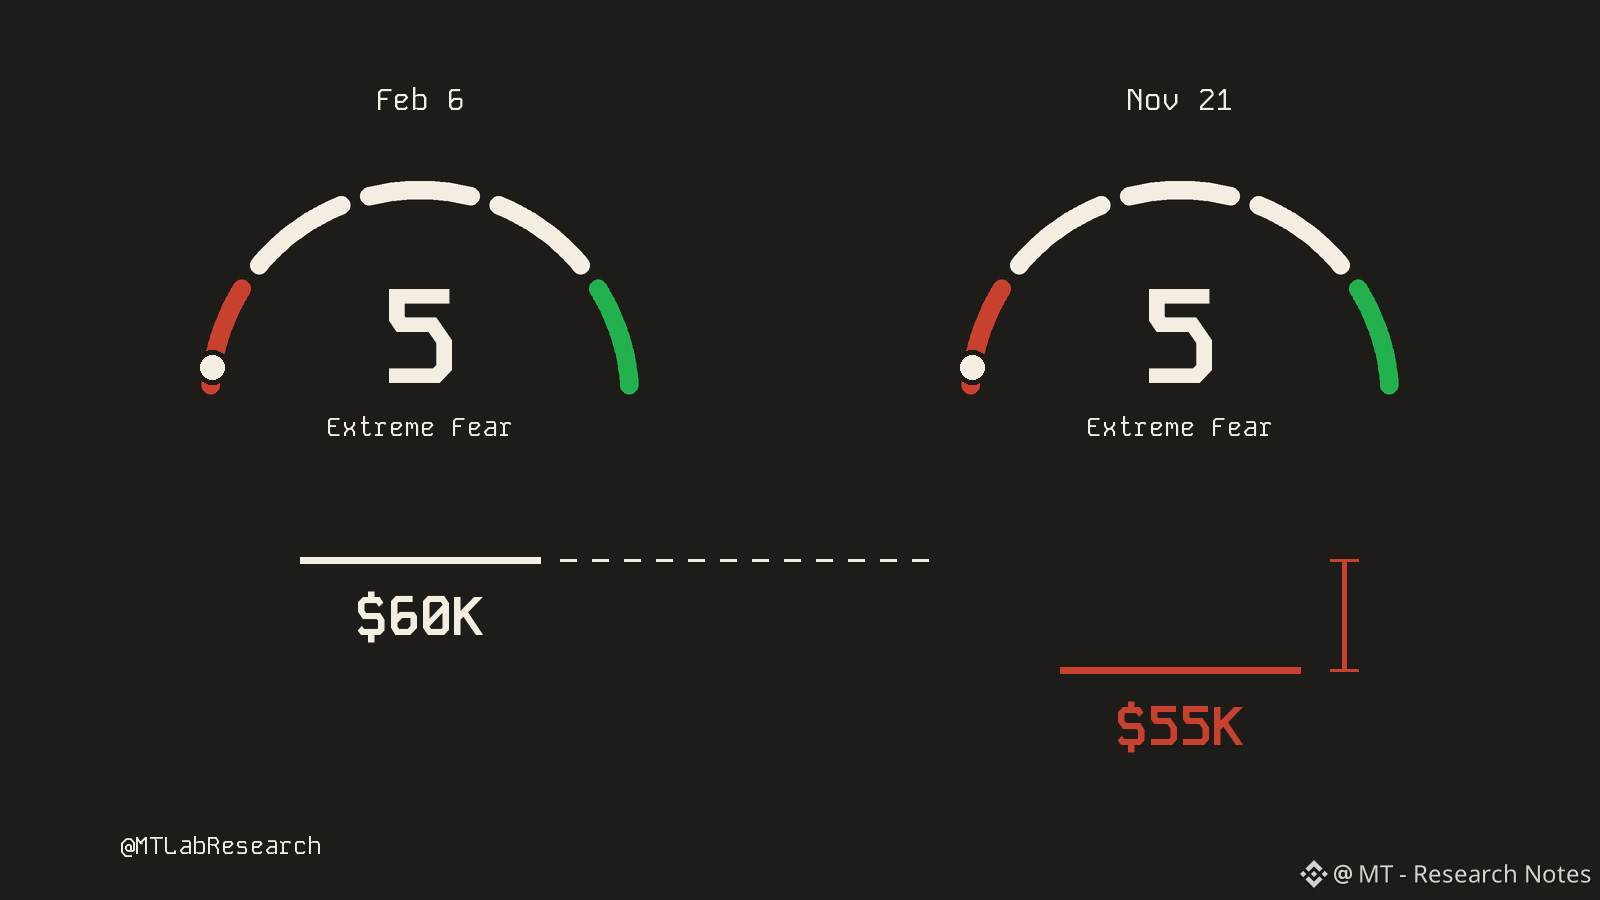
> Then came the dump. Early on Nov 21 (UTC), BTC fell to about $55.1K, its lowest since Sep 2024, as roughly $2.5B of leveraged bets were force-closed in 24 hours (about 90% of them longs, bets on a rise). It bounced to about $60K. The Fear & Greed Index, a 0-100 mood gauge where 0 is pure panic, was reported at 5 that day, level with its all-time low from February.
The crowd line is "extreme fear = buy". Here is what one tally found (Blockchain Reporter): across 25 earlier episodes with the index at 10 or lower, BTC was higher 90 days later in 14 and lower in 11. The median gain was only about 1.4%. The episodes overlap, so treat it as a rough guide, not a rule. Fear tells you how loud the crowd is. It does not tell you where the floor is.
What we can watch more in addition to the Fear & Greed Index?
- If ETF flows turn positive for several days, sellers may be tiring. If outflows keep coming, the pressure is still on.
- If BTC holds above the July low near $57.7K, buyers are defending it. If it slips under, the bounce was only a pause.
- If filings keep showing buyers like Strategy while ETF money leaves, that split is the story. Filings are facts. Hints are not.
Is this time different, or is $55K just the next stop? $BTC
{future}(BTCUSDT)
Experience, not financial advice.
#CanBTCReboundAfterFallingBelow60K?
Last time the fear index hit 5, BTC bottomed at $60K. This week it hit $55K.
> On Nov 19, BlackRock's IBIT fund (a way to own Bitcoin through a normal stock account) lost $541M in one day. That is its biggest single-day outflow since launch in Jan 2024, per Farside data. US Bitcoin ETFs together are down about $3.47B for November so far.
> Over the same stretch, Strategy, Saylor's company, kept filing buys: 485 BTC (about $33M) in the week to Nov 15, at roughly $68.9K each. Small next to $541M, but it is a real buyer in a company filing, not a tweet.
> Then came the dump. Early on Nov 21 (UTC), BTC fell to about $55.1K, its lowest since Sep 2024, as roughly $2.5B of leveraged bets were force-closed in 24 hours (about 90% of them longs, bets on a rise). It bounced to about $60K. The Fear & Greed Index, a 0-100 mood gauge where 0 is pure panic, was reported at 5 that day, level with its all-time low from February.
The crowd line is "extreme fear = buy". Here is what one tally found (Blockchain Reporter): across 25 earlier episodes with the index at 10 or lower, BTC was higher 90 days later in 14 and lower in 11. The median gain was only about 1.4%. The episodes overlap, so treat it as a rough guide, not a rule. Fear tells you how loud the crowd is. It does not tell you where the floor is.
What we can watch more in addition to the Fear & Greed Index?
- If ETF flows turn positive for several days, sellers may be tiring. If outflows keep coming, the pressure is still on.
- If BTC holds above the July low near $57.7K, buyers are defending it. If it slips under, the bounce was only a pause.
- If filings keep showing buyers like Strategy while ETF money leaves, that split is the story. Filings are facts. Hints are not.
Is this time different, or is $55K just the next stop? $BTC
Experience, not financial advice.
#CanBTCReboundAfterFallingBelow60K?
> On Nov 19, BlackRock's IBIT fund (a way to own Bitcoin through a normal stock account) lost $541M in one day. That is its biggest single-day outflow since launch in Jan 2024, per Farside data. US Bitcoin ETFs together are down about $3.47B for November so far.
> Over the same stretch, Strategy, Saylor's company, kept filing buys: 485 BTC (about $33M) in the week to Nov 15, at roughly $68.9K each. Small next to $541M, but it is a real buyer in a company filing, not a tweet.
> Then came the dump. Early on Nov 21 (UTC), BTC fell to about $55.1K, its lowest since Sep 2024, as roughly $2.5B of leveraged bets were force-closed in 24 hours (about 90% of them longs, bets on a rise). It bounced to about $60K. The Fear & Greed Index, a 0-100 mood gauge where 0 is pure panic, was reported at 5 that day, level with its all-time low from February.
The crowd line is "extreme fear = buy". Here is what one tally found (Blockchain Reporter): across 25 earlier episodes with the index at 10 or lower, BTC was higher 90 days later in 14 and lower in 11. The median gain was only about 1.4%. The episodes overlap, so treat it as a rough guide, not a rule. Fear tells you how loud the crowd is. It does not tell you where the floor is.
What we can watch more in addition to the Fear & Greed Index?
- If ETF flows turn positive for several days, sellers may be tiring. If outflows keep coming, the pressure is still on.
- If BTC holds above the July low near $57.7K, buyers are defending it. If it slips under, the bounce was only a pause.
- If filings keep showing buyers like Strategy while ETF money leaves, that split is the story. Filings are facts. Hints are not.
Is this time different, or is $55K just the next stop? $BTC
Experience, not financial advice.
#CanBTCReboundAfterFallingBelow60K?
9
4
4.1k
·
--
Bearish
Verified
Nvidia lost about $2.7 trillion in 45 days, more than the whole crypto market is worth!
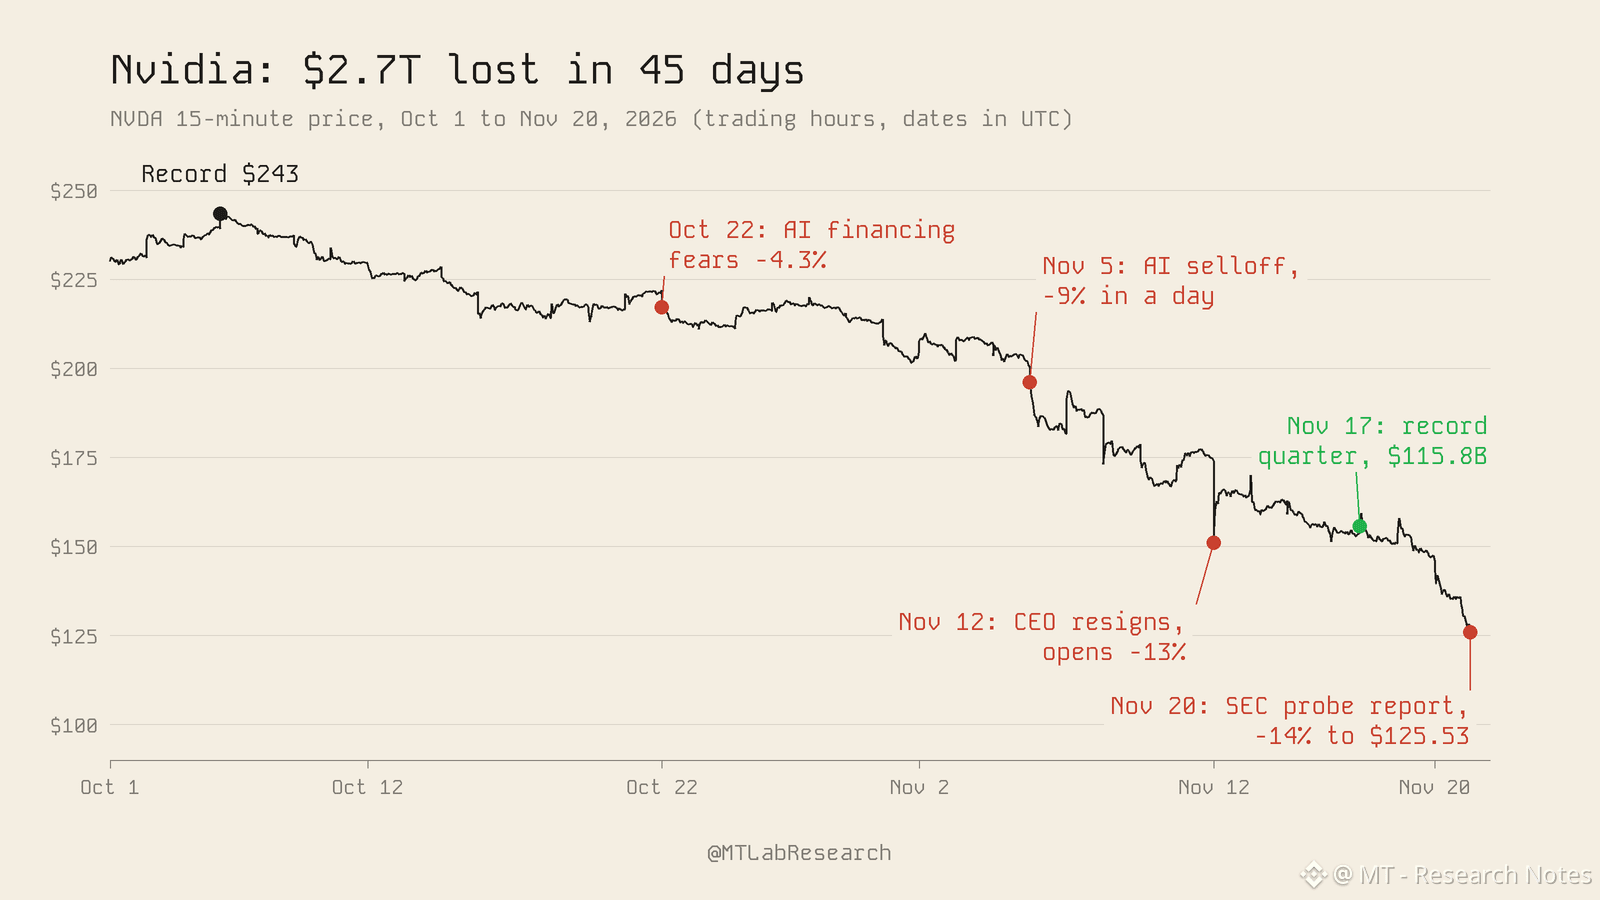
Since its Oct 6 record, the stock is down nearly half, to $125.53 on Nov 20. In the middle of it, Nvidia posted the biggest quarter in its history. Investors stopped asking how much it sells and started asking who is in charge and what is in the books.
> Oct 6: a record high near $243, a market value of about $5.7 trillion.
> Oct 22 to Nov 5: the first fear was who pays for AI. Shares fell about 4% on Oct 22 and again on Oct 30, then 9% on Nov 5. Analysts pointed at Nvidia backing customers who buy its chips (circular financing).
> Nov 12: CEO Jensen Huang resigned after a board probe into reports about his private life. The stock opened about 13% lower. CFO Colette Kress became interim CEO.
> Nov 17: sales of $115.8 billion, up 103%, and a $130 billion forecast. The same day, the Wall Street Journal reported an SEC probe into whether Nvidia's disclosures misled investors.
> Nov 18: the stock fell 2.9% after the chairman said Huang will not return and no successor was named.
> Nov 20: Reuters reported SEC staff are examining potential accounting issues. Shares fell 14%, a record one-week loss of about $900 billion and the worst week since 2008. Open questions: Singapore, which booked about $104 billion of 2025 sales (Financial Times), and customers paying slower. An investigation is not an accusation.
What 45 days of Nvidia candles showed?
- Record numbers do not stop a sale once the question changes
- Fear stacked on fear, each headline hitting a stock already down
- A probe is a question, and the price trades it before any answer
Great numbers, shaky trust, which one moves the price more?
Experience, not financial advice.
#NvidiaLoses$2.7TrillionInMonthAndAHalf
Nvidia lost about $2.7 trillion in 45 days, more than the whole crypto market is worth!
Since its Oct 6 record, the stock is down nearly half, to $125.53 on Nov 20. In the middle of it, Nvidia posted the biggest quarter in its history. Investors stopped asking how much it sells and started asking who is in charge and what is in the books.
> Oct 6: a record high near $243, a market value of about $5.7 trillion.
> Oct 22 to Nov 5: the first fear was who pays for AI. Shares fell about 4% on Oct 22 and again on Oct 30, then 9% on Nov 5. Analysts pointed at Nvidia backing customers who buy its chips (circular financing).
> Nov 12: CEO Jensen Huang resigned after a board probe into reports about his private life. The stock opened about 13% lower. CFO Colette Kress became interim CEO.
> Nov 17: sales of $115.8 billion, up 103%, and a $130 billion forecast. The same day, the Wall Street Journal reported an SEC probe into whether Nvidia's disclosures misled investors.
> Nov 18: the stock fell 2.9% after the chairman said Huang will not return and no successor was named.
> Nov 20: Reuters reported SEC staff are examining potential accounting issues. Shares fell 14%, a record one-week loss of about $900 billion and the worst week since 2008. Open questions: Singapore, which booked about $104 billion of 2025 sales (Financial Times), and customers paying slower. An investigation is not an accusation.
What 45 days of Nvidia candles showed?
- Record numbers do not stop a sale once the question changes
- Fear stacked on fear, each headline hitting a stock already down
- A probe is a question, and the price trades it before any answer
Great numbers, shaky trust, which one moves the price more?
Experience, not financial advice.
#NvidiaLoses$2.7TrillionInMonthAndAHalf
Since its Oct 6 record, the stock is down nearly half, to $125.53 on Nov 20. In the middle of it, Nvidia posted the biggest quarter in its history. Investors stopped asking how much it sells and started asking who is in charge and what is in the books.
> Oct 6: a record high near $243, a market value of about $5.7 trillion.
> Oct 22 to Nov 5: the first fear was who pays for AI. Shares fell about 4% on Oct 22 and again on Oct 30, then 9% on Nov 5. Analysts pointed at Nvidia backing customers who buy its chips (circular financing).
> Nov 12: CEO Jensen Huang resigned after a board probe into reports about his private life. The stock opened about 13% lower. CFO Colette Kress became interim CEO.
> Nov 17: sales of $115.8 billion, up 103%, and a $130 billion forecast. The same day, the Wall Street Journal reported an SEC probe into whether Nvidia's disclosures misled investors.
> Nov 18: the stock fell 2.9% after the chairman said Huang will not return and no successor was named.
> Nov 20: Reuters reported SEC staff are examining potential accounting issues. Shares fell 14%, a record one-week loss of about $900 billion and the worst week since 2008. Open questions: Singapore, which booked about $104 billion of 2025 sales (Financial Times), and customers paying slower. An investigation is not an accusation.
What 45 days of Nvidia candles showed?
- Record numbers do not stop a sale once the question changes
- Fear stacked on fear, each headline hitting a stock already down
- A probe is a question, and the price trades it before any answer
Great numbers, shaky trust, which one moves the price more?
Experience, not financial advice.
#NvidiaLoses$2.7TrillionInMonthAndAHalf
MT - Research Notes
·
--
BearishNvidia's story: revenue up 106%, CEO out, stock down a third from its high in 5 weeks!
The market first feared who pays for AI, then who runs Nvidia. On Nov 12, CEO Jensen Huang resigned and the stock opened about 13% lower.
> Oct 6: a record near $243. Foxconn, which builds AI servers, had just reported 47% revenue growth, and Nvidia was worth about $5.7 trillion.
> Oct 22 and Oct 30: the fear changed from "will AI sell?" to "who pays for it all?". Shares fell about 4% on each day. Reports said Nvidia may guarantee loans for a data center Anthropic would use, part of about $165B in commitments, many to its own customers (a circle: Nvidia funds buyers, who return as orders).
> Nov 5: down about 9% to $181.60, the lowest since April. Investors doubted planned data center spending would happen, plus midterm election jitters.
> Nov 8: Huang told staff he was unfaithful to his wife. Reports said US intelligence suspected the woman of working for China. The board opened an independent probe and said it saw no sign that secrets or national security were compromised. Nov 9: the stock opened about 7% lower and closed down about 4%.
> Nov 10: another 5.5% drop on rate worries. Nov 11: a 3% bounce after CoreWeave's results. That evening the Wall Street Journal reported the board was preparing to remove Huang.
> Nov 12: the board announced his exit, effective immediately. CFO Colette Kress is interim CEO. Pre-market the stock was about 10% lower, around $156, and it opened near $151.
Then came the worry: no known successor. One investor warned the stock could become "uninvestable" without one.
Next: earnings on Nov 17. Last quarter's sales were $96.2B, up 106%, and Nvidia guided to $108B.
What the Nvidia chart teaches:
- Price can fall before the numbers do
- Key-person risk is priced when the answer is unknown
- A founder and a revenue line are two separate bets
Founder or numbers: which one do you trust more in a $4 trillion company?
Experience, not financial advice.
#CanNVDAReigniteAIRally #EarningsSeason #HuangExitNvidiaStrategyInFocus
The market first feared who pays for AI, then who runs Nvidia. On Nov 12, CEO Jensen Huang resigned and the stock opened about 13% lower.
> Oct 6: a record near $243. Foxconn, which builds AI servers, had just reported 47% revenue growth, and Nvidia was worth about $5.7 trillion.
> Oct 22 and Oct 30: the fear changed from "will AI sell?" to "who pays for it all?". Shares fell about 4% on each day. Reports said Nvidia may guarantee loans for a data center Anthropic would use, part of about $165B in commitments, many to its own customers (a circle: Nvidia funds buyers, who return as orders).
> Nov 5: down about 9% to $181.60, the lowest since April. Investors doubted planned data center spending would happen, plus midterm election jitters.
> Nov 8: Huang told staff he was unfaithful to his wife. Reports said US intelligence suspected the woman of working for China. The board opened an independent probe and said it saw no sign that secrets or national security were compromised. Nov 9: the stock opened about 7% lower and closed down about 4%.
> Nov 10: another 5.5% drop on rate worries. Nov 11: a 3% bounce after CoreWeave's results. That evening the Wall Street Journal reported the board was preparing to remove Huang.
> Nov 12: the board announced his exit, effective immediately. CFO Colette Kress is interim CEO. Pre-market the stock was about 10% lower, around $156, and it opened near $151.
Then came the worry: no known successor. One investor warned the stock could become "uninvestable" without one.
Next: earnings on Nov 17. Last quarter's sales were $96.2B, up 106%, and Nvidia guided to $108B.
What the Nvidia chart teaches:
- Price can fall before the numbers do
- Key-person risk is priced when the answer is unknown
- A founder and a revenue line are two separate bets
Founder or numbers: which one do you trust more in a $4 trillion company?
Experience, not financial advice.
#CanNVDAReigniteAIRally #EarningsSeason #HuangExitNvidiaStrategyInFocus
3
3
1.4k
·
--
Bearish
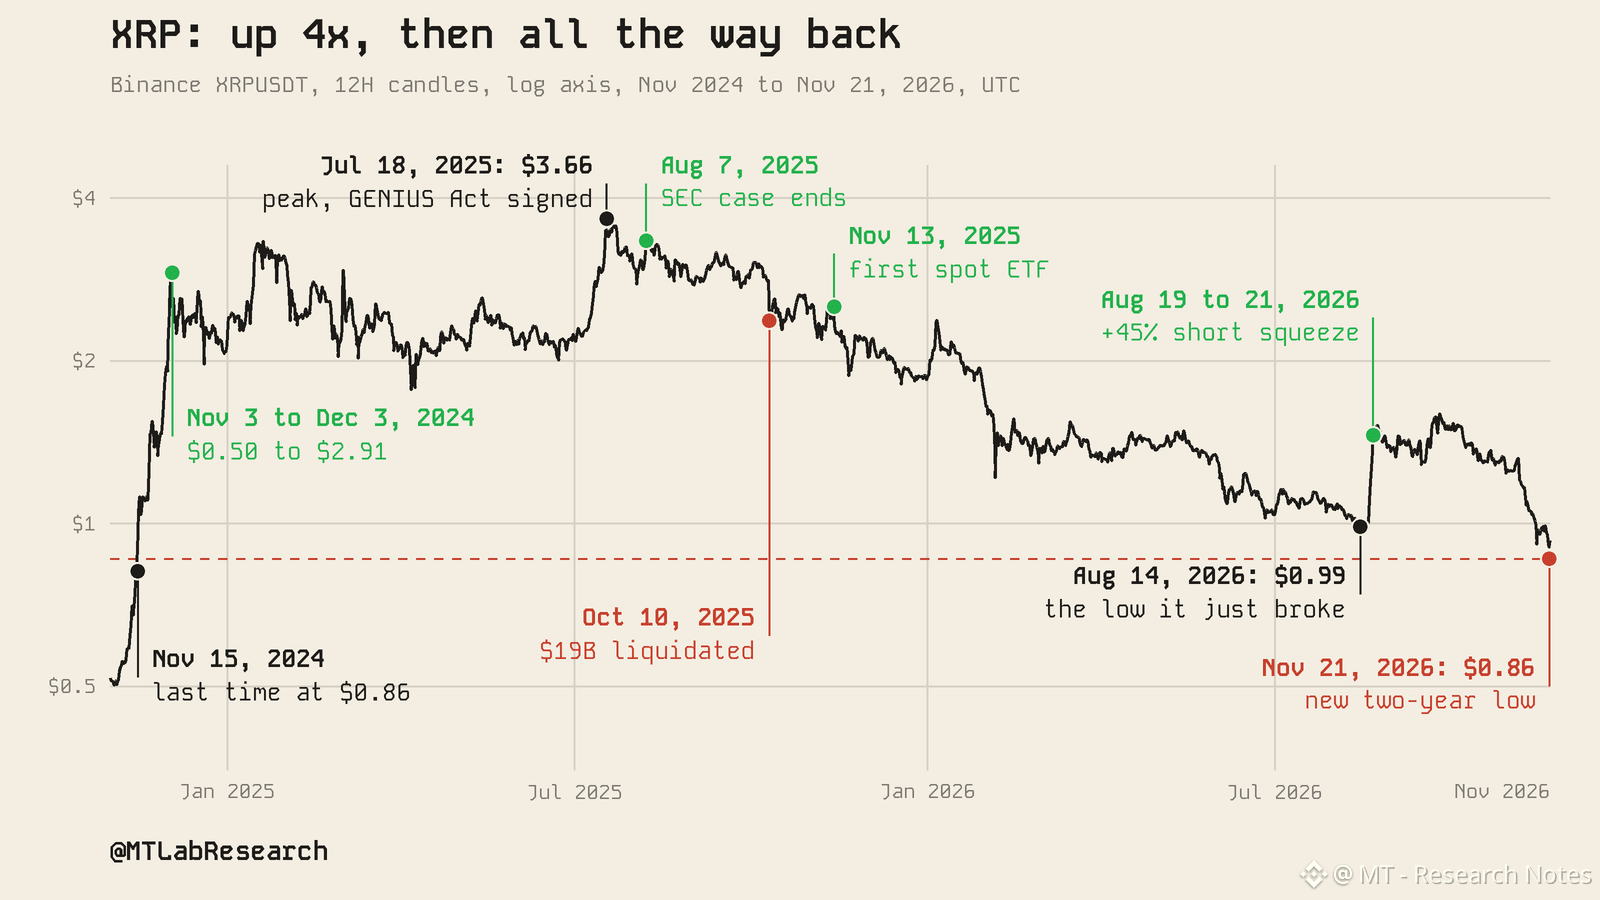
XRP rose 4x, then gave all of it back. It's at $0.86, a price last seen on Nov 15, 2024.
XRP hit $0.86 on Nov 21, 2026, a new two-year low. The old one was $0.99 on Aug 14, 2026. Here is the round trip, dates in UTC:
> Nov 3 to Dec 3, 2024: XRP goes from about $0.50 to $2.91. Trump wins the election on Nov 5, and on Nov 21 SEC chair Gary Gensler says he will leave. Buyers bet on friendlier rules.
> Jul 18, 2025: the peak, $3.66, as the GENIUS Act, the first US stablecoin law, is signed. Aug 7: the SEC and Ripple end their case.
> Oct 10, 2025: after Trump threatens 100% tariffs on China, about $19B of leveraged bets are liquidated (force-closed by the exchange, adding selling). XRP wicks from $2.84 to $1.25.
> Nov 13, 2025: the first US spot XRP ETF launches with about $250M of inflows, and XRP closes 7% below its open. From there the line slides to about $1 by June 2026.
> Aug 19 to 21, 2026: shorts (bets on a falling price) get squeezed after the Treasury doubles bond buybacks. Over $3.3B of shorts close and XRP rises 45%, $1.01 to $1.45. It fades.
> Sep 15, 2026: the Senate vote to advance the CLARITY Act (crypto market rules) fails 49 to 50. XRP drops about 10%.
> Nov 2026: XRP ETFs have had no net inflow since Oct 29. On Nov 14 the price breaks $0.99 and hits $0.89, then $0.86 on Nov 21, when about 94% of the XRP futures liquidated are longs.
Two years, three kinds of buyers:
1. Headline buyers came for laws and ETFs.
2. Leveraged traders came for speed, and speed cuts both ways.
3. Shorts and longs took turns being forced out.
What two years on one chart showed?
- A price that rises on headlines can fall when the headlines stop.
- Past lows only hold while someone is buying them.
- Ask who is forced to act at each turn.
Where were you on Nov 15, 2024? Buying, watching or doubting? $XRP
{future}(XRPUSDT)
Experience, not financial advice.
#XRPDropsToTwoYearLowNear87Cents
XRP rose 4x, then gave all of it back. It's at $0.86, a price last seen on Nov 15, 2024.
XRP hit $0.86 on Nov 21, 2026, a new two-year low. The old one was $0.99 on Aug 14, 2026. Here is the round trip, dates in UTC:
> Nov 3 to Dec 3, 2024: XRP goes from about $0.50 to $2.91. Trump wins the election on Nov 5, and on Nov 21 SEC chair Gary Gensler says he will leave. Buyers bet on friendlier rules.
> Jul 18, 2025: the peak, $3.66, as the GENIUS Act, the first US stablecoin law, is signed. Aug 7: the SEC and Ripple end their case.
> Oct 10, 2025: after Trump threatens 100% tariffs on China, about $19B of leveraged bets are liquidated (force-closed by the exchange, adding selling). XRP wicks from $2.84 to $1.25.
> Nov 13, 2025: the first US spot XRP ETF launches with about $250M of inflows, and XRP closes 7% below its open. From there the line slides to about $1 by June 2026.
> Aug 19 to 21, 2026: shorts (bets on a falling price) get squeezed after the Treasury doubles bond buybacks. Over $3.3B of shorts close and XRP rises 45%, $1.01 to $1.45. It fades.
> Sep 15, 2026: the Senate vote to advance the CLARITY Act (crypto market rules) fails 49 to 50. XRP drops about 10%.
> Nov 2026: XRP ETFs have had no net inflow since Oct 29. On Nov 14 the price breaks $0.99 and hits $0.89, then $0.86 on Nov 21, when about 94% of the XRP futures liquidated are longs.
Two years, three kinds of buyers:
1. Headline buyers came for laws and ETFs.
2. Leveraged traders came for speed, and speed cuts both ways.
3. Shorts and longs took turns being forced out.
What two years on one chart showed?
- A price that rises on headlines can fall when the headlines stop.
- Past lows only hold while someone is buying them.
- Ask who is forced to act at each turn.
Where were you on Nov 15, 2024? Buying, watching or doubting? $XRP
Experience, not financial advice.
#XRPDropsToTwoYearLowNear87Cents
XRP hit $0.86 on Nov 21, 2026, a new two-year low. The old one was $0.99 on Aug 14, 2026. Here is the round trip, dates in UTC:
> Nov 3 to Dec 3, 2024: XRP goes from about $0.50 to $2.91. Trump wins the election on Nov 5, and on Nov 21 SEC chair Gary Gensler says he will leave. Buyers bet on friendlier rules.
> Jul 18, 2025: the peak, $3.66, as the GENIUS Act, the first US stablecoin law, is signed. Aug 7: the SEC and Ripple end their case.
> Oct 10, 2025: after Trump threatens 100% tariffs on China, about $19B of leveraged bets are liquidated (force-closed by the exchange, adding selling). XRP wicks from $2.84 to $1.25.
> Nov 13, 2025: the first US spot XRP ETF launches with about $250M of inflows, and XRP closes 7% below its open. From there the line slides to about $1 by June 2026.
> Aug 19 to 21, 2026: shorts (bets on a falling price) get squeezed after the Treasury doubles bond buybacks. Over $3.3B of shorts close and XRP rises 45%, $1.01 to $1.45. It fades.
> Sep 15, 2026: the Senate vote to advance the CLARITY Act (crypto market rules) fails 49 to 50. XRP drops about 10%.
> Nov 2026: XRP ETFs have had no net inflow since Oct 29. On Nov 14 the price breaks $0.99 and hits $0.89, then $0.86 on Nov 21, when about 94% of the XRP futures liquidated are longs.
Two years, three kinds of buyers:
1. Headline buyers came for laws and ETFs.
2. Leveraged traders came for speed, and speed cuts both ways.
3. Shorts and longs took turns being forced out.
What two years on one chart showed?
- A price that rises on headlines can fall when the headlines stop.
- Past lows only hold while someone is buying them.
- Ask who is forced to act at each turn.
Where were you on Nov 15, 2024? Buying, watching or doubting? $XRP
Experience, not financial advice.
#XRPDropsToTwoYearLowNear87Cents
MT - Research Notes
·
--
BearishBought XRP the day the first US spot ETF launched? You're down about 59%!
XRP touched $0.89 on Nov 14, 2026, its lowest since Nov 2024. Nearly every headline holders waited for came true, yet the price gave most of it back. Dates in UTC:
> Nov 2024: Trump wins the election on Nov 5; on Nov 21 SEC chair Gary Gensler says he will leave. XRP goes from $0.49 on Nov 3 to $2.91 on Dec 3.
> Jul 18, 2025: the peak, $3.66, as the GENIUS Act, the first US stablecoin law, is signed.
> Aug 7: the SEC and Ripple end their case.
> Oct 10, 2025: after Trump threatens 100% tariffs on China, about $19B of leveraged bets are liquidated (force-closed by the exchange, adding selling). XRP wicks from $2.84 to $1.25.
> Nov 13, 2025: the first US spot XRP ETF launches with about $250M of inflows, and XRP closes 7% below its open. The fund takes coins in-kind: holders deposit them instead of buying on exchanges.
> Aug 19 to 21, 2026: the Treasury doubles its bond buybacks, yields fall, and shorts get squeezed. A short is a bet on a falling price, so a rise forces shorts to buy back, pushing it higher. Over $3.3B of shorts closed and XRP rose 45%, from $1.01 to $1.45.
> Sep 15, 2026: the Senate vote to advance the CLARITY Act (crypto market rules) fails 49 to 50, 60 needed. XRP drops about 10%.
> Nov 4 to 14, 2026: $1.34 slides to $0.89. On Nov 14, 94% of liquidated positions were longs (bets on a rising price), so the drop forced more selling. XRP ETFs lost $19.13M in the week of Nov 9 to 13, the most since March.
Everyone had a reason:
- Headline buyers expected laws and ETFs to bring a flood of new money.
- Leveraged longs borrowed to amplify gains, so falling prices closed them out.
- August shorts bet on drift, then had to buy back higher.
What this chart teaches me:
- Good news does not buy coins. New money does.
- Leverage speeds the climb and the fall.
- Ask who is forced to act: longs, shorts, ETF deposits.
Is $XRP good to buy now?
Experience, not financial advice.
#XRPFallsTo$0.89LowestSinceNovember2024
XRP touched $0.89 on Nov 14, 2026, its lowest since Nov 2024. Nearly every headline holders waited for came true, yet the price gave most of it back. Dates in UTC:
> Nov 2024: Trump wins the election on Nov 5; on Nov 21 SEC chair Gary Gensler says he will leave. XRP goes from $0.49 on Nov 3 to $2.91 on Dec 3.
> Jul 18, 2025: the peak, $3.66, as the GENIUS Act, the first US stablecoin law, is signed.
> Aug 7: the SEC and Ripple end their case.
> Oct 10, 2025: after Trump threatens 100% tariffs on China, about $19B of leveraged bets are liquidated (force-closed by the exchange, adding selling). XRP wicks from $2.84 to $1.25.
> Nov 13, 2025: the first US spot XRP ETF launches with about $250M of inflows, and XRP closes 7% below its open. The fund takes coins in-kind: holders deposit them instead of buying on exchanges.
> Aug 19 to 21, 2026: the Treasury doubles its bond buybacks, yields fall, and shorts get squeezed. A short is a bet on a falling price, so a rise forces shorts to buy back, pushing it higher. Over $3.3B of shorts closed and XRP rose 45%, from $1.01 to $1.45.
> Sep 15, 2026: the Senate vote to advance the CLARITY Act (crypto market rules) fails 49 to 50, 60 needed. XRP drops about 10%.
> Nov 4 to 14, 2026: $1.34 slides to $0.89. On Nov 14, 94% of liquidated positions were longs (bets on a rising price), so the drop forced more selling. XRP ETFs lost $19.13M in the week of Nov 9 to 13, the most since March.
Everyone had a reason:
- Headline buyers expected laws and ETFs to bring a flood of new money.
- Leveraged longs borrowed to amplify gains, so falling prices closed them out.
- August shorts bet on drift, then had to buy back higher.
What this chart teaches me:
- Good news does not buy coins. New money does.
- Leverage speeds the climb and the fall.
- Ask who is forced to act: longs, shorts, ETF deposits.
Is $XRP good to buy now?
Experience, not financial advice.
#XRPFallsTo$0.89LowestSinceNovember2024
4
4
1.3k
Verified
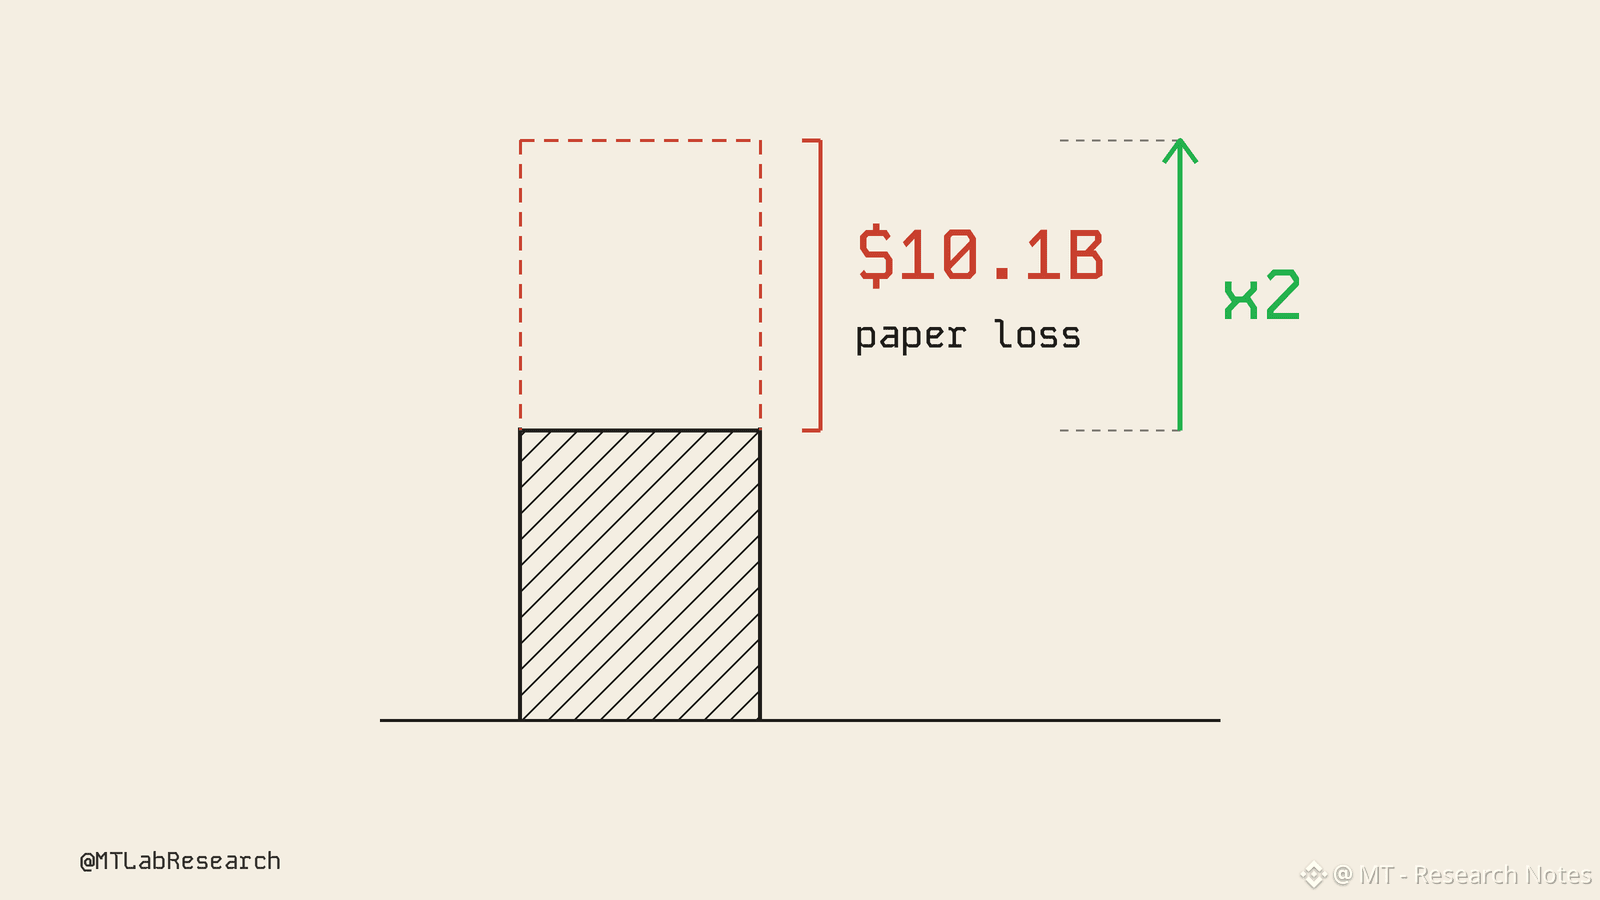
Bitmine is down $10.1B on ETH. Why is it still buying more?
That is a "paper loss" (unrealized): about $20.2B paid, now worth about half, per trackers on Nov 20. Nobody has lost that cash yet. It turns real only if Bitmine sells below its cost.
Bitmine (ticker BMNR) is the biggest public company that holds Ether (ETH), the coin of the Ethereum network. Per its own Nov 16 update, it holds about 6.08 million ETH, close to 5% of all ETH in existence. ETH is near $1,650 now. Its accounts mark the coins to market every quarter, per CoinDesk, so the gap shows up on paper even if no coin is sold.
Why keep buying? Its stated goal is to own 5% of all ETH, which it calls the "Alchemy of 5%", and its Nov 16 update says it is 99% of the way there. Chairman Tom Lee also keeps saying a crypto bull market is underway. That is the company's reason, not proof it is right.
By my math, the gap closes only if ETH roughly doubles, from about $1,650 to about $3,300, the average price trackers say Bitmine paid.
Why the headline numbers differ? This month the same loss showed up as $8.8B, $9.6B, $9.7B and $10.1B. Each one uses a different ETH price and a different guess at Bitmine's average cost (about $3,200 to $3,350). Per CryptoSlate, its latest release gives no updated cost.
The buying itself is small next to the hole. Its holdings grew by about 7,650 ETH in the latest weekly update, roughly $14M, about 0.1% of the stack, by my math.
- A paper loss is a distance, not cash gone. It moves every day with the price.
- Behind any loss headline, check which price day and which cost it uses.
- Buying more only moves an average a little unless the buy is big next to what is already held.
Do you think Bitmine can recover? $ETH
{future}(ETHUSDT)
Experience, not financial advice.
#BitMineFaces$10.1BUnrealizedETHLoss
Bitmine is down $10.1B on ETH. Why is it still buying more?
That is a "paper loss" (unrealized): about $20.2B paid, now worth about half, per trackers on Nov 20. Nobody has lost that cash yet. It turns real only if Bitmine sells below its cost.
Bitmine (ticker BMNR) is the biggest public company that holds Ether (ETH), the coin of the Ethereum network. Per its own Nov 16 update, it holds about 6.08 million ETH, close to 5% of all ETH in existence. ETH is near $1,650 now. Its accounts mark the coins to market every quarter, per CoinDesk, so the gap shows up on paper even if no coin is sold.
Why keep buying? Its stated goal is to own 5% of all ETH, which it calls the "Alchemy of 5%", and its Nov 16 update says it is 99% of the way there. Chairman Tom Lee also keeps saying a crypto bull market is underway. That is the company's reason, not proof it is right.
By my math, the gap closes only if ETH roughly doubles, from about $1,650 to about $3,300, the average price trackers say Bitmine paid.
Why the headline numbers differ? This month the same loss showed up as $8.8B, $9.6B, $9.7B and $10.1B. Each one uses a different ETH price and a different guess at Bitmine's average cost (about $3,200 to $3,350). Per CryptoSlate, its latest release gives no updated cost.
The buying itself is small next to the hole. Its holdings grew by about 7,650 ETH in the latest weekly update, roughly $14M, about 0.1% of the stack, by my math.
- A paper loss is a distance, not cash gone. It moves every day with the price.
- Behind any loss headline, check which price day and which cost it uses.
- Buying more only moves an average a little unless the buy is big next to what is already held.
Do you think Bitmine can recover? $ETH
Experience, not financial advice.
#BitMineFaces$10.1BUnrealizedETHLoss
That is a "paper loss" (unrealized): about $20.2B paid, now worth about half, per trackers on Nov 20. Nobody has lost that cash yet. It turns real only if Bitmine sells below its cost.
Bitmine (ticker BMNR) is the biggest public company that holds Ether (ETH), the coin of the Ethereum network. Per its own Nov 16 update, it holds about 6.08 million ETH, close to 5% of all ETH in existence. ETH is near $1,650 now. Its accounts mark the coins to market every quarter, per CoinDesk, so the gap shows up on paper even if no coin is sold.
Why keep buying? Its stated goal is to own 5% of all ETH, which it calls the "Alchemy of 5%", and its Nov 16 update says it is 99% of the way there. Chairman Tom Lee also keeps saying a crypto bull market is underway. That is the company's reason, not proof it is right.
By my math, the gap closes only if ETH roughly doubles, from about $1,650 to about $3,300, the average price trackers say Bitmine paid.
Why the headline numbers differ? This month the same loss showed up as $8.8B, $9.6B, $9.7B and $10.1B. Each one uses a different ETH price and a different guess at Bitmine's average cost (about $3,200 to $3,350). Per CryptoSlate, its latest release gives no updated cost.
The buying itself is small next to the hole. Its holdings grew by about 7,650 ETH in the latest weekly update, roughly $14M, about 0.1% of the stack, by my math.
- A paper loss is a distance, not cash gone. It moves every day with the price.
- Behind any loss headline, check which price day and which cost it uses.
- Buying more only moves an average a little unless the buy is big next to what is already held.
Do you think Bitmine can recover? $ETH
Experience, not financial advice.
#BitMineFaces$10.1BUnrealizedETHLoss
4
4
4.5k
·
--
Bearish
Verified
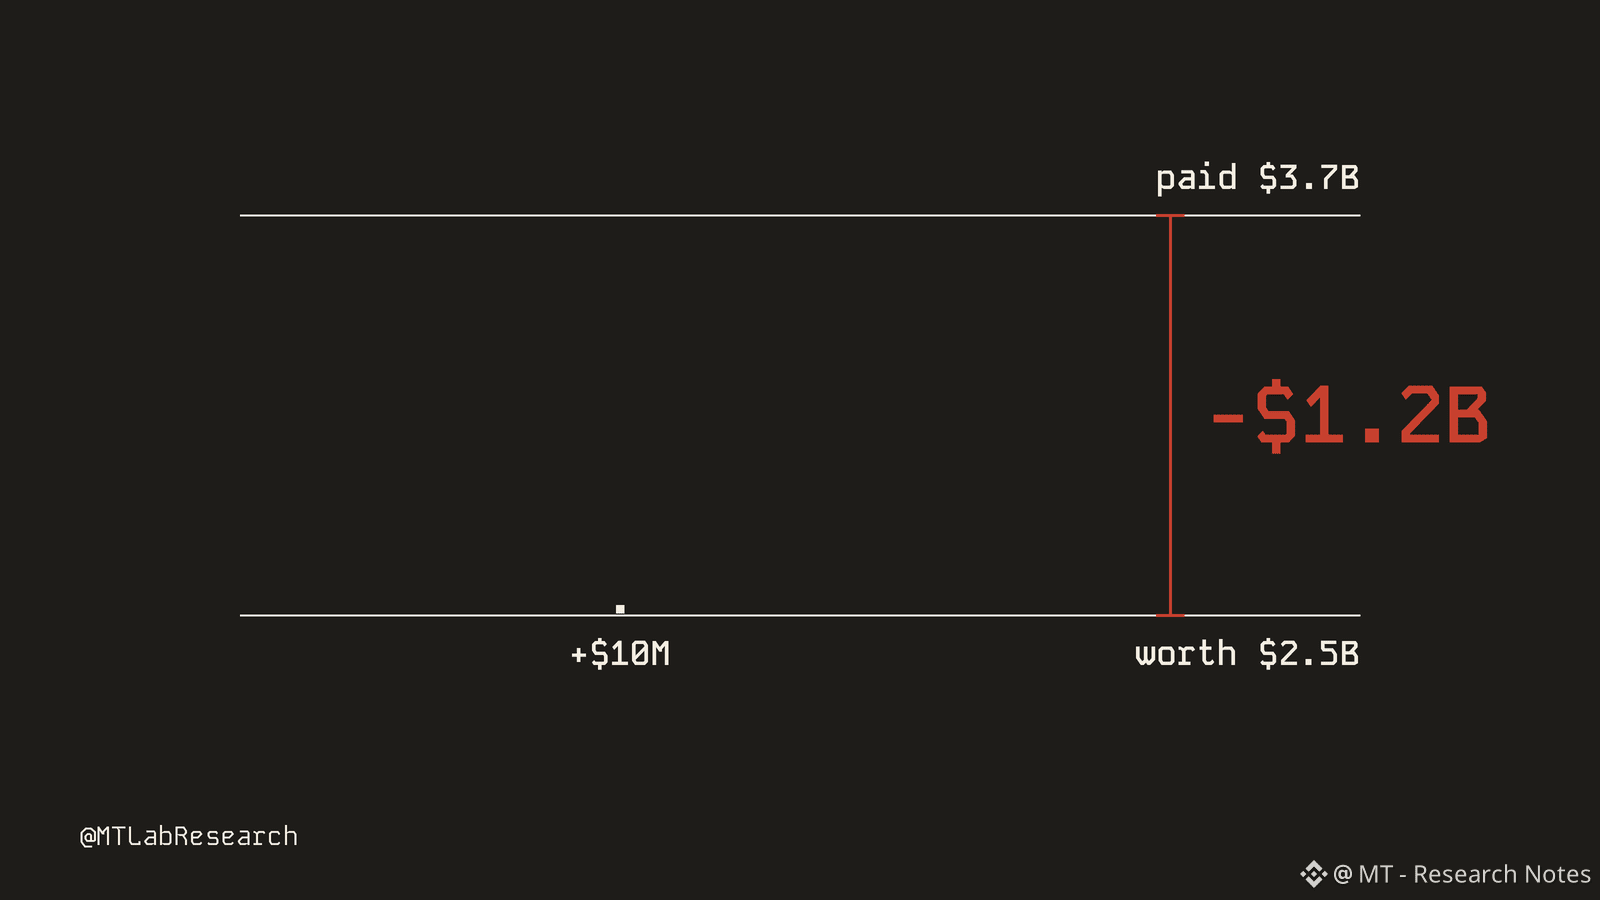
This company is down more than $1B on BTC. It just bought the dip $10M more!
Twenty One (ticker XXI) holds BTC as its main asset. On Nov 20 it said it bought 172.25 BTC for $10M in cash, at about $58,054 each. By my math its 43,841 BTC cost about $3.7B and are worth about $2.5B at that price, a paper loss near $1.2B. This buy covers under 1% of that hole.
Look at the two buys this week:
- Nov 16: 154.32 BTC for $10M, about $64,801 each
- Nov 20: 172.25 BTC for $10M, about $58,054 each
Same money, 4 days apart. BTC dropped about 10% in between, so the second $10M bought 17.93 more coins.
So is $58K a good price?
- The cost comes from its Sept 30 filing (reported by Bitcoin Magazine): about $3.69B, roughly $85K per coin. BTC would need to rise about 46% from $58,054 just to get back there.
- Two $10M buys trim that average by only about $176 per coin. A dip buy moves your average only when it is big next to what you already hold.
- The cash is finite. It had $102.8M at Sept 30, so $20M in one week is about a fifth of that, if nothing else changed. How much is left now is not disclosed.
- About 16,116 BTC is pledged to back its debt, so those coins are not free to use.
What nobody knows yet? Whether more buys follow, or where the next cash comes from. One company's timing says nothing about your entry.
Did you buy the dip this time? $BTC
{future}(BTCUSDT)
Experience, not financial advice.
#twentyonecapitaladds172.25btc
This company is down more than $1B on BTC. It just bought the dip $10M more!
Twenty One (ticker XXI) holds BTC as its main asset. On Nov 20 it said it bought 172.25 BTC for $10M in cash, at about $58,054 each. By my math its 43,841 BTC cost about $3.7B and are worth about $2.5B at that price, a paper loss near $1.2B. This buy covers under 1% of that hole.
Look at the two buys this week:
- Nov 16: 154.32 BTC for $10M, about $64,801 each
- Nov 20: 172.25 BTC for $10M, about $58,054 each
Same money, 4 days apart. BTC dropped about 10% in between, so the second $10M bought 17.93 more coins.
So is $58K a good price?
- The cost comes from its Sept 30 filing (reported by Bitcoin Magazine): about $3.69B, roughly $85K per coin. BTC would need to rise about 46% from $58,054 just to get back there.
- Two $10M buys trim that average by only about $176 per coin. A dip buy moves your average only when it is big next to what you already hold.
- The cash is finite. It had $102.8M at Sept 30, so $20M in one week is about a fifth of that, if nothing else changed. How much is left now is not disclosed.
- About 16,116 BTC is pledged to back its debt, so those coins are not free to use.
What nobody knows yet? Whether more buys follow, or where the next cash comes from. One company's timing says nothing about your entry.
Did you buy the dip this time? $BTC
Experience, not financial advice.
#twentyonecapitaladds172.25btc
Twenty One (ticker XXI) holds BTC as its main asset. On Nov 20 it said it bought 172.25 BTC for $10M in cash, at about $58,054 each. By my math its 43,841 BTC cost about $3.7B and are worth about $2.5B at that price, a paper loss near $1.2B. This buy covers under 1% of that hole.
Look at the two buys this week:
- Nov 16: 154.32 BTC for $10M, about $64,801 each
- Nov 20: 172.25 BTC for $10M, about $58,054 each
Same money, 4 days apart. BTC dropped about 10% in between, so the second $10M bought 17.93 more coins.
So is $58K a good price?
- The cost comes from its Sept 30 filing (reported by Bitcoin Magazine): about $3.69B, roughly $85K per coin. BTC would need to rise about 46% from $58,054 just to get back there.
- Two $10M buys trim that average by only about $176 per coin. A dip buy moves your average only when it is big next to what you already hold.
- The cash is finite. It had $102.8M at Sept 30, so $20M in one week is about a fifth of that, if nothing else changed. How much is left now is not disclosed.
- About 16,116 BTC is pledged to back its debt, so those coins are not free to use.
What nobody knows yet? Whether more buys follow, or where the next cash comes from. One company's timing says nothing about your entry.
Did you buy the dip this time? $BTC
Experience, not financial advice.
#twentyonecapitaladds172.25btc
2
10.4k
·
--
Bearish
After every Binance user was repaid after hack, BNB still fell more than on the day it lost $6.3B.
BNB broke below 540 USDT on Nov 20 (UTC), down about 8% in 24 hours. The hack day cost 8%. The slide since the repayment is bigger, and it came from somewhere else.
> Oct 28: BNB tops at 762.20 after climbing from about 715 in two weeks.
> Oct 29: At 20:05 UTC attackers start draining Binance hot wallets on ten blockchains. About $6.3B leaves in roughly 20 minutes. BNB drops from 731.70 to 680 in one 30-minute candle, on 15x its usual volume, and closes the day down 8%.
> Oct 30 to Nov 1: Binance says it will cover every loss. The FBI names North Korea's TraderTraitor group. Withdrawals reopen in phases from Nov 1. BNB holds between about 681 and 723 until Nov 4.
> Nov 4: Binance says 98% is replaced. BNB spikes to 723, then closes 4% lower the next day.
> Nov 12: Binance says every affected customer is made whole, with more than $6.34B of its own funds. BNB keeps falling. Hotter US inflation, bets on a December Fed rate hike, ETF outflows and leveraged selling hit the whole market. BNB loses 600 on Nov 14.
> Nov 20: Bitcoin drops under $60,000 for the first time since July as an AI stock sell-off spreads into crypto. BNB loses 540 and touches 530.00 at 19:30 UTC.
Everyone had their own stories:
- Binance: calm users first, repay everyone, chase the money in court.
- Hack-day sellers: the loss size was unknown, so selling first felt safer.
- November sellers: reacting to rates, ETF flows and margin calls, not to Binance.
Three things this chart showed:
1. A shock is priced in minutes. The hack printed in one candle, and good news moved price for hours, not weeks.
2. Fixing the cause does not fix the chart. Binance was whole by Nov 12, the market was not.
3. BNB is one company's token, yet it trades with the whole market. Check Bitcoin and ETF flows before blaming a headline.
Which scared you more, the hack or the market? $BNB
{future}(BNBUSDT)
Experience, not financial advice.
#BNBDropsBelow540USDTWith8.46%DailyDecline
After every Binance user was repaid after hack, BNB still fell more than on the day it lost $6.3B.
BNB broke below 540 USDT on Nov 20 (UTC), down about 8% in 24 hours. The hack day cost 8%. The slide since the repayment is bigger, and it came from somewhere else.
> Oct 28: BNB tops at 762.20 after climbing from about 715 in two weeks.
> Oct 29: At 20:05 UTC attackers start draining Binance hot wallets on ten blockchains. About $6.3B leaves in roughly 20 minutes. BNB drops from 731.70 to 680 in one 30-minute candle, on 15x its usual volume, and closes the day down 8%.
> Oct 30 to Nov 1: Binance says it will cover every loss. The FBI names North Korea's TraderTraitor group. Withdrawals reopen in phases from Nov 1. BNB holds between about 681 and 723 until Nov 4.
> Nov 4: Binance says 98% is replaced. BNB spikes to 723, then closes 4% lower the next day.
> Nov 12: Binance says every affected customer is made whole, with more than $6.34B of its own funds. BNB keeps falling. Hotter US inflation, bets on a December Fed rate hike, ETF outflows and leveraged selling hit the whole market. BNB loses 600 on Nov 14.
> Nov 20: Bitcoin drops under $60,000 for the first time since July as an AI stock sell-off spreads into crypto. BNB loses 540 and touches 530.00 at 19:30 UTC.
Everyone had their own stories:
- Binance: calm users first, repay everyone, chase the money in court.
- Hack-day sellers: the loss size was unknown, so selling first felt safer.
- November sellers: reacting to rates, ETF flows and margin calls, not to Binance.
Three things this chart showed:
1. A shock is priced in minutes. The hack printed in one candle, and good news moved price for hours, not weeks.
2. Fixing the cause does not fix the chart. Binance was whole by Nov 12, the market was not.
3. BNB is one company's token, yet it trades with the whole market. Check Bitcoin and ETF flows before blaming a headline.
Which scared you more, the hack or the market? $BNB
Experience, not financial advice.
#BNBDropsBelow540USDTWith8.46%DailyDecline
BNB broke below 540 USDT on Nov 20 (UTC), down about 8% in 24 hours. The hack day cost 8%. The slide since the repayment is bigger, and it came from somewhere else.
> Oct 28: BNB tops at 762.20 after climbing from about 715 in two weeks.
> Oct 29: At 20:05 UTC attackers start draining Binance hot wallets on ten blockchains. About $6.3B leaves in roughly 20 minutes. BNB drops from 731.70 to 680 in one 30-minute candle, on 15x its usual volume, and closes the day down 8%.
> Oct 30 to Nov 1: Binance says it will cover every loss. The FBI names North Korea's TraderTraitor group. Withdrawals reopen in phases from Nov 1. BNB holds between about 681 and 723 until Nov 4.
> Nov 4: Binance says 98% is replaced. BNB spikes to 723, then closes 4% lower the next day.
> Nov 12: Binance says every affected customer is made whole, with more than $6.34B of its own funds. BNB keeps falling. Hotter US inflation, bets on a December Fed rate hike, ETF outflows and leveraged selling hit the whole market. BNB loses 600 on Nov 14.
> Nov 20: Bitcoin drops under $60,000 for the first time since July as an AI stock sell-off spreads into crypto. BNB loses 540 and touches 530.00 at 19:30 UTC.
Everyone had their own stories:
- Binance: calm users first, repay everyone, chase the money in court.
- Hack-day sellers: the loss size was unknown, so selling first felt safer.
- November sellers: reacting to rates, ETF flows and margin calls, not to Binance.
Three things this chart showed:
1. A shock is priced in minutes. The hack printed in one candle, and good news moved price for hours, not weeks.
2. Fixing the cause does not fix the chart. Binance was whole by Nov 12, the market was not.
3. BNB is one company's token, yet it trades with the whole market. Check Bitcoin and ETF flows before blaming a headline.
Which scared you more, the hack or the market? $BNB
Experience, not financial advice.
#BNBDropsBelow540USDTWith8.46%DailyDecline
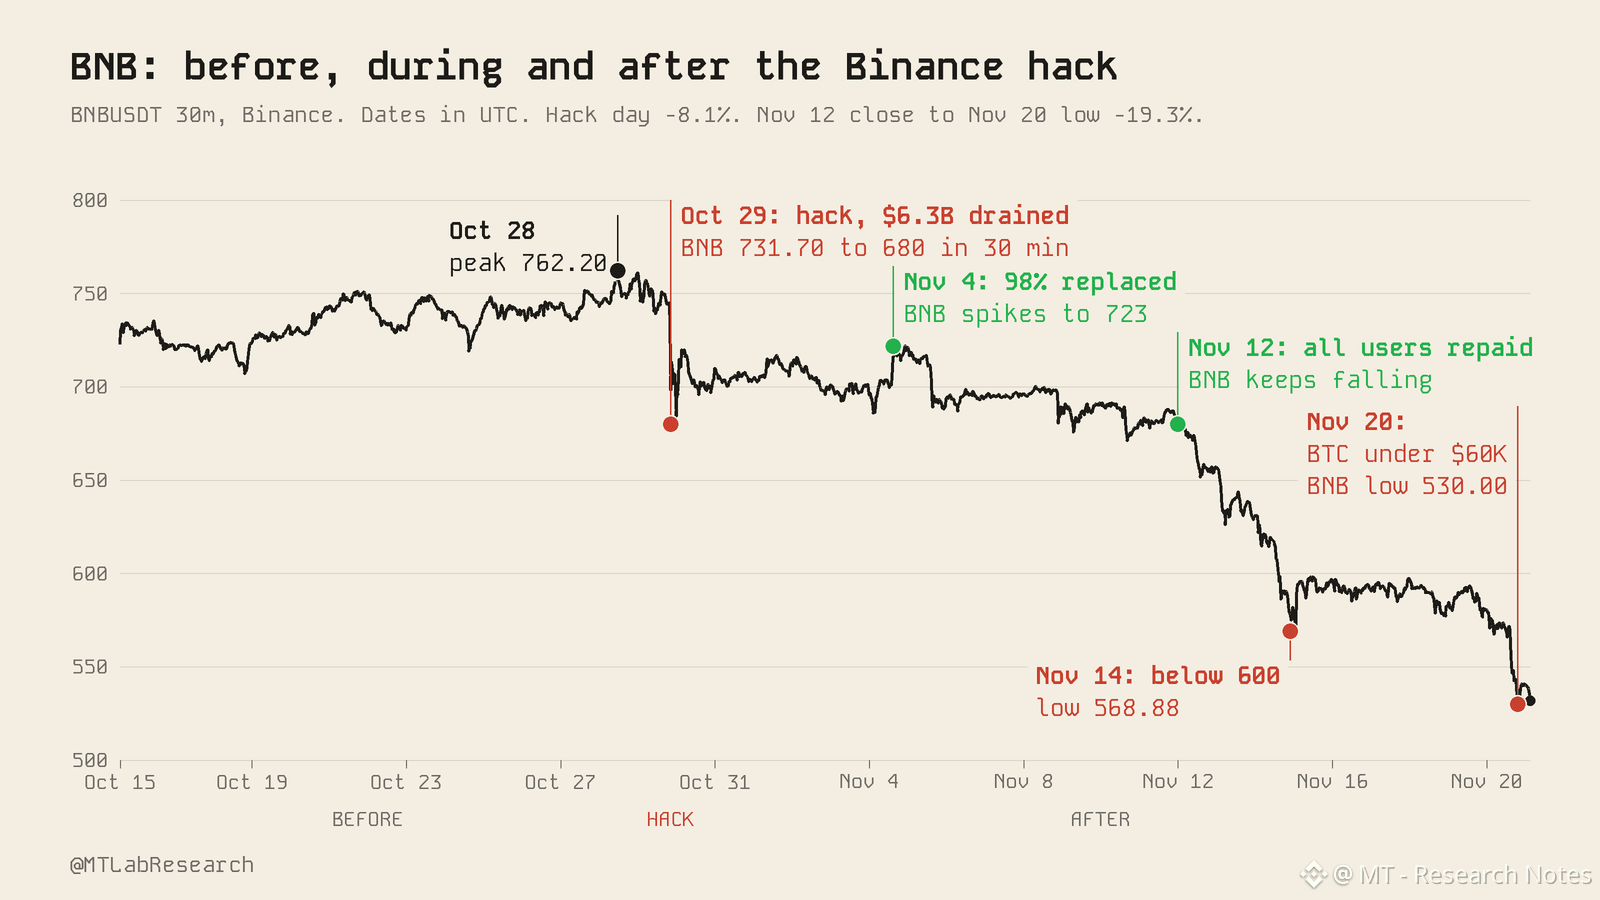
3
2
7
20.4k
·
--
Bearish
Verified
Anyone who bought the open of Anthropic's IPO paid $111.50. A day later it touched $83.05.
Anthropic (ticker ANT) sold its shares to the public at $83. By day 2 the stock was 5 cents above that price, a line traders watch as a floor.
> Nov 18, 2026: Anthropic priced the IPO at $83, above its $70 to $78 range, and raised $81B, a record IPO.
> Nov 19: An opening auction (the exchange collects orders and sets one price for the first trade) delayed ANT until 16:48 UTC. First trade: $111.50, up 34%, peak about $115. Binance's ANTUSDT perp (price exposure, no shares) had sat near $104 hours earlier.
> Then the air came out. Under $100 by 17:05 UTC, low $92.72 at 18:18 UTC, close $97.17. Per Vanda Research data, retail sold other AI stocks, AMD first, to buy ANT, and funds waiting in Nasdaq 100 futures moved that cash into it. The buying was borrowed from the rest of the AI trade.
> Nov 20: ANT opened near $90. The whole AI trade was falling. The Nasdaq lost about 5%, Nvidia fell about 12% after Reuters reported an SEC probe of its accounting, and Broadcom fell about 12%. The low came near 17:45 UTC at $83.05, then ANT bounced 6% to close at $88.30.
The banks' cushion was thinner too. Their greenshoe (an option on 147M extra shares at $83) lets them buy shares back to prop up a falling price, but they exercised it in full, so that buyer was likely gone.
Same stock, four different games:
- Anthropic and its co-founders: sold at $83, wanted the biggest check
- Banks: wanted a calm first week above $83
- Day one buyers: wanted the pop, many funded by selling other AI stocks
- Insiders: up to 315M shares sellable now, about 303M more on Dec 15
Three things the first two days showed:
1. An IPO price is where the bankers' clients bought, not a floor the market owes you
2. A pop funded by selling other stocks depends on the whole market
3. Check the calendar of shares that can be sold before the hype
Which price is good for Anthropic, do you think?
Experience, not financial advice.
#AnthropicPlungesTowardIPOPriceonDay2
Anyone who bought the open of Anthropic's IPO paid $111.50. A day later it touched $83.05.
Anthropic (ticker ANT) sold its shares to the public at $83. By day 2 the stock was 5 cents above that price, a line traders watch as a floor.
> Nov 18, 2026: Anthropic priced the IPO at $83, above its $70 to $78 range, and raised $81B, a record IPO.
> Nov 19: An opening auction (the exchange collects orders and sets one price for the first trade) delayed ANT until 16:48 UTC. First trade: $111.50, up 34%, peak about $115. Binance's ANTUSDT perp (price exposure, no shares) had sat near $104 hours earlier.
> Then the air came out. Under $100 by 17:05 UTC, low $92.72 at 18:18 UTC, close $97.17. Per Vanda Research data, retail sold other AI stocks, AMD first, to buy ANT, and funds waiting in Nasdaq 100 futures moved that cash into it. The buying was borrowed from the rest of the AI trade.
> Nov 20: ANT opened near $90. The whole AI trade was falling. The Nasdaq lost about 5%, Nvidia fell about 12% after Reuters reported an SEC probe of its accounting, and Broadcom fell about 12%. The low came near 17:45 UTC at $83.05, then ANT bounced 6% to close at $88.30.
The banks' cushion was thinner too. Their greenshoe (an option on 147M extra shares at $83) lets them buy shares back to prop up a falling price, but they exercised it in full, so that buyer was likely gone.
Same stock, four different games:
- Anthropic and its co-founders: sold at $83, wanted the biggest check
- Banks: wanted a calm first week above $83
- Day one buyers: wanted the pop, many funded by selling other AI stocks
- Insiders: up to 315M shares sellable now, about 303M more on Dec 15
Three things the first two days showed:
1. An IPO price is where the bankers' clients bought, not a floor the market owes you
2. A pop funded by selling other stocks depends on the whole market
3. Check the calendar of shares that can be sold before the hype
Which price is good for Anthropic, do you think?
Experience, not financial advice.
#AnthropicPlungesTowardIPOPriceonDay2
Anthropic (ticker ANT) sold its shares to the public at $83. By day 2 the stock was 5 cents above that price, a line traders watch as a floor.
> Nov 18, 2026: Anthropic priced the IPO at $83, above its $70 to $78 range, and raised $81B, a record IPO.
> Nov 19: An opening auction (the exchange collects orders and sets one price for the first trade) delayed ANT until 16:48 UTC. First trade: $111.50, up 34%, peak about $115. Binance's ANTUSDT perp (price exposure, no shares) had sat near $104 hours earlier.
> Then the air came out. Under $100 by 17:05 UTC, low $92.72 at 18:18 UTC, close $97.17. Per Vanda Research data, retail sold other AI stocks, AMD first, to buy ANT, and funds waiting in Nasdaq 100 futures moved that cash into it. The buying was borrowed from the rest of the AI trade.
> Nov 20: ANT opened near $90. The whole AI trade was falling. The Nasdaq lost about 5%, Nvidia fell about 12% after Reuters reported an SEC probe of its accounting, and Broadcom fell about 12%. The low came near 17:45 UTC at $83.05, then ANT bounced 6% to close at $88.30.
The banks' cushion was thinner too. Their greenshoe (an option on 147M extra shares at $83) lets them buy shares back to prop up a falling price, but they exercised it in full, so that buyer was likely gone.
Same stock, four different games:
- Anthropic and its co-founders: sold at $83, wanted the biggest check
- Banks: wanted a calm first week above $83
- Day one buyers: wanted the pop, many funded by selling other AI stocks
- Insiders: up to 315M shares sellable now, about 303M more on Dec 15
Three things the first two days showed:
1. An IPO price is where the bankers' clients bought, not a floor the market owes you
2. A pop funded by selling other stocks depends on the whole market
3. Check the calendar of shares that can be sold before the hype
Which price is good for Anthropic, do you think?
Experience, not financial advice.
#AnthropicPlungesTowardIPOPriceonDay2
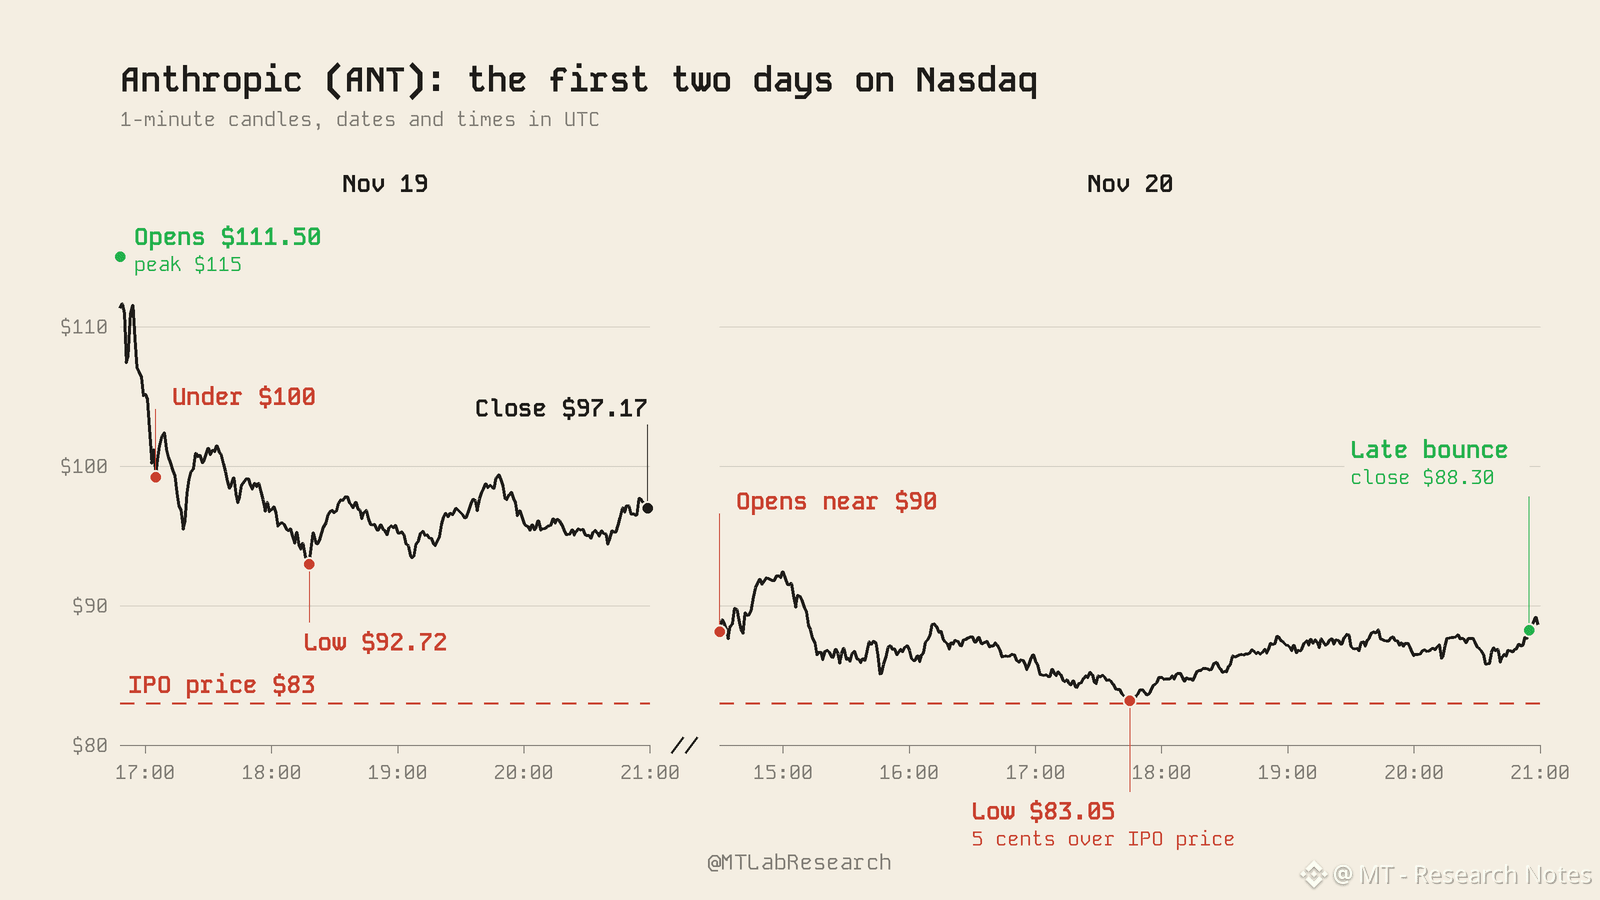
7
4
12.5k
·
--
Bearish
Verified
BTC is just 2% above its 2026 low. Last time, it bounced 40%. Will this time be different?
On Friday BTC slipped below $60,000 for the first time since early July, to about $59,000. The 2026 low, about $57,750 from July 1, is only about 2% under that. Last time BTC touched that area, it climbed about 40% in two months.
The case for a bounce
In July, buyers stepped in right at that low. Money also came back into the US funds that let people buy BTC through a normal brokerage account: about $3.5 billion in August alone. BTC reached roughly $80,000 by early September.
The case against a bounce
This time the money is leaving. On Thursday BlackRock's BTC fund (IBIT) lost a record $541 million in a single day. Stocks are sliding too: Nvidia is about 42% below its October peak and Korea's Kospi fell more than 5% on Friday, and BTC is moving with them. Traders still expect the Fed to raise rates again on Dec 9. CoinShares' head of research calls this a continuation of the bear market, and expects BTC to trade between $60K and $90K through much of 2027.
Why one price matters? Lots of traders remember the 2026 low, so lots of buy and sell orders cluster around it. A line everyone watches tends to move the price when it breaks or holds.
What I plan to watch:
- If BTC holds the 2026 low and the funds go back to net inflows, it starts to look like July again.
- If stocks keep falling and the outflows continue, a bounce has no fuel.
- If BTC closes a day below about $57,750, the 2026 floor is gone and any plan built on it needs a rewrite.
Pick your line before the move, not during it.
Are you bullish or bearish this time? $BTC
{future}(BTCUSDT)
Experience, not financial advice.
#CanBTCReboundAfterFallingBelow60K?
BTC is just 2% above its 2026 low. Last time, it bounced 40%. Will this time be different?
On Friday BTC slipped below $60,000 for the first time since early July, to about $59,000. The 2026 low, about $57,750 from July 1, is only about 2% under that. Last time BTC touched that area, it climbed about 40% in two months.
The case for a bounce
In July, buyers stepped in right at that low. Money also came back into the US funds that let people buy BTC through a normal brokerage account: about $3.5 billion in August alone. BTC reached roughly $80,000 by early September.
The case against a bounce
This time the money is leaving. On Thursday BlackRock's BTC fund (IBIT) lost a record $541 million in a single day. Stocks are sliding too: Nvidia is about 42% below its October peak and Korea's Kospi fell more than 5% on Friday, and BTC is moving with them. Traders still expect the Fed to raise rates again on Dec 9. CoinShares' head of research calls this a continuation of the bear market, and expects BTC to trade between $60K and $90K through much of 2027.
Why one price matters? Lots of traders remember the 2026 low, so lots of buy and sell orders cluster around it. A line everyone watches tends to move the price when it breaks or holds.
What I plan to watch:
- If BTC holds the 2026 low and the funds go back to net inflows, it starts to look like July again.
- If stocks keep falling and the outflows continue, a bounce has no fuel.
- If BTC closes a day below about $57,750, the 2026 floor is gone and any plan built on it needs a rewrite.
Pick your line before the move, not during it.
Are you bullish or bearish this time? $BTC
Experience, not financial advice.
#CanBTCReboundAfterFallingBelow60K?
On Friday BTC slipped below $60,000 for the first time since early July, to about $59,000. The 2026 low, about $57,750 from July 1, is only about 2% under that. Last time BTC touched that area, it climbed about 40% in two months.
The case for a bounce
In July, buyers stepped in right at that low. Money also came back into the US funds that let people buy BTC through a normal brokerage account: about $3.5 billion in August alone. BTC reached roughly $80,000 by early September.
The case against a bounce
This time the money is leaving. On Thursday BlackRock's BTC fund (IBIT) lost a record $541 million in a single day. Stocks are sliding too: Nvidia is about 42% below its October peak and Korea's Kospi fell more than 5% on Friday, and BTC is moving with them. Traders still expect the Fed to raise rates again on Dec 9. CoinShares' head of research calls this a continuation of the bear market, and expects BTC to trade between $60K and $90K through much of 2027.
Why one price matters? Lots of traders remember the 2026 low, so lots of buy and sell orders cluster around it. A line everyone watches tends to move the price when it breaks or holds.
What I plan to watch:
- If BTC holds the 2026 low and the funds go back to net inflows, it starts to look like July again.
- If stocks keep falling and the outflows continue, a bounce has no fuel.
- If BTC closes a day below about $57,750, the 2026 floor is gone and any plan built on it needs a rewrite.
Pick your line before the move, not during it.
Are you bullish or bearish this time? $BTC
Experience, not financial advice.
#CanBTCReboundAfterFallingBelow60K?
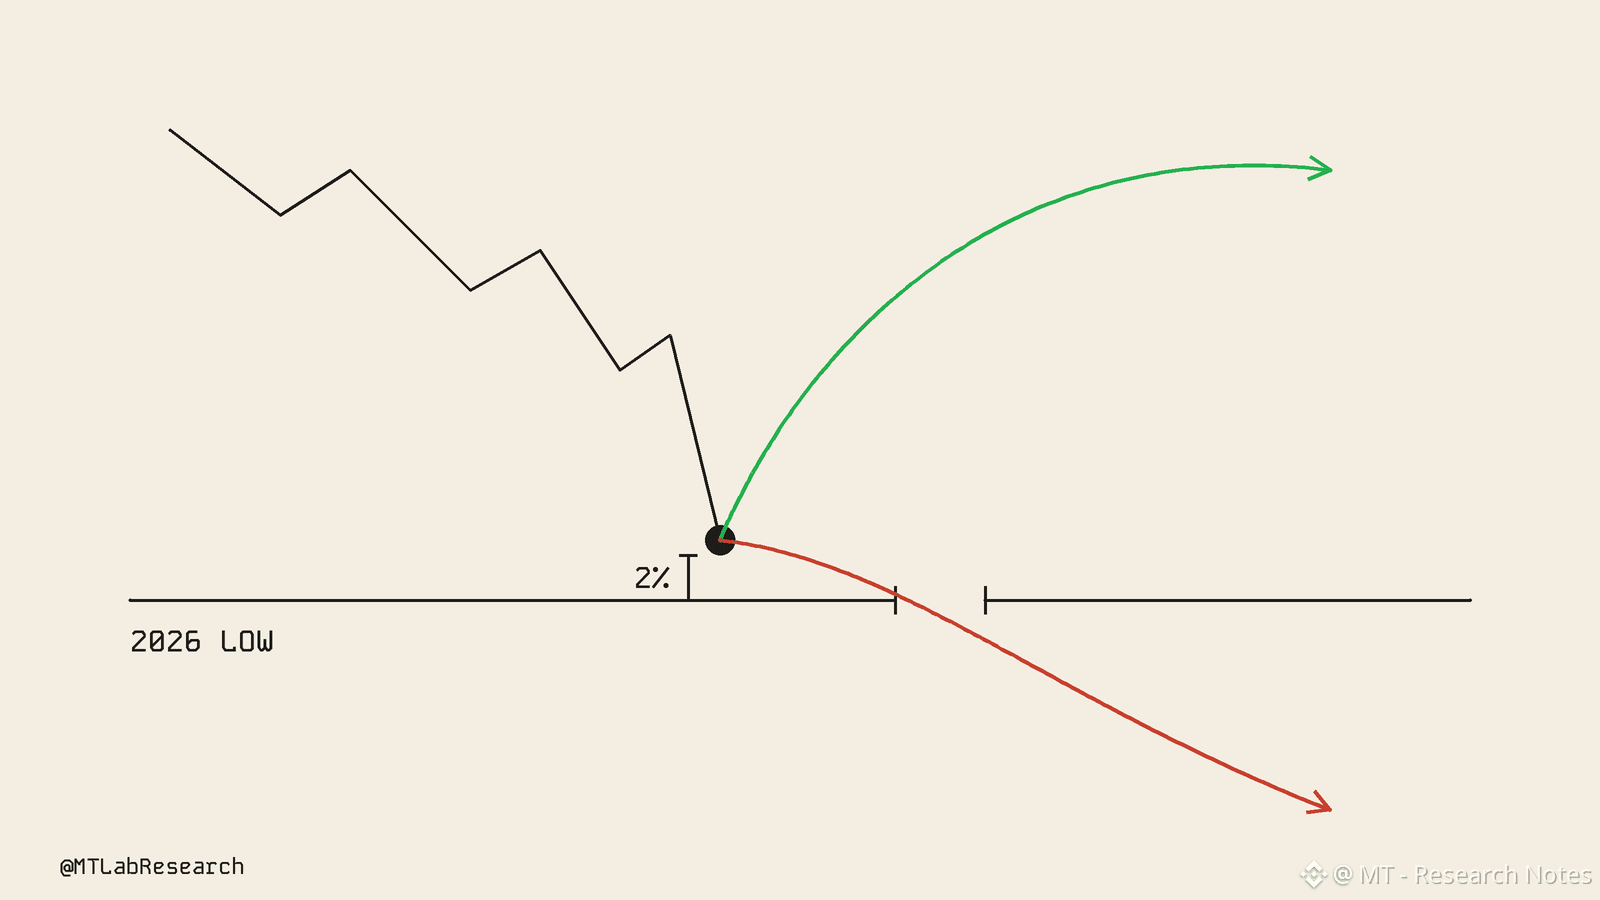
13
8
7.3k
·
--
Bearish
World stocks fell 7 days straight. Bitcoin is flat. Good news? Look closer.
Bitcoin isn't acting like a safe haven. Last week US stocks rose and BTC fell about 9%. This week stocks slide and BTC just sits there. Calm today is not the same as safe.
The broad world stock index (MSCI ACWI) fell for a 7th session in a row, the longest streak since 2023, per Bloomberg. Asia is on track for its worst week since March 2020. Chipmakers are down about 35% from their June peak. Even Anthropic's blockbuster stock debut (up 17% on day one) could not stop it: the shares slid on Friday.
A haven is where scared money runs to hide. This week that was Treasuries and the yen. Gold even slipped under $3,600. BTC? Up less than 1%, near $61,700. That is a pause, not a rush to safety.
Now rewind a week. The S&P 500 gained about 2.5% while BTC dropped nearly 9% by Friday, then slid to about $62,000 over the weekend, its lowest since July. The reported causes were crypto-only: roughly $2 billion pulled out of US spot Bitcoin ETFs, and about $2 billion of leveraged bets wiped out in 24 hours. BTC now sits roughly half off its all-time high.
So does Bitcoin follow stocks? For much of 2026 it did. Lately it doesn't. It runs on its own engine, and that engine can hurt you while the stock screen looks calm.
Three questions worth asking before you call anything a haven:
1. Who buys it when everyone else is selling? This week the buyers went to Treasuries and the yen, not BTC.
2. Is it falling because of the market, or because of its own holders (fund outflows, leverage)? The second kind can keep going on a quiet day.
3. How far can my pile fall before I am forced to sell at a bad moment?
One strategist says technical selling may need to run its course before a bottom forms. Nobody knows when. A flat day is not a signal.
What's your criteria for a real haven?
Experience, not financial advice. $BTC
{future}(BTCUSDT)
#GlobalStocksFaceLongestLosingStreakSince2023
World stocks fell 7 days straight. Bitcoin is flat. Good news? Look closer.
Bitcoin isn't acting like a safe haven. Last week US stocks rose and BTC fell about 9%. This week stocks slide and BTC just sits there. Calm today is not the same as safe.
The broad world stock index (MSCI ACWI) fell for a 7th session in a row, the longest streak since 2023, per Bloomberg. Asia is on track for its worst week since March 2020. Chipmakers are down about 35% from their June peak. Even Anthropic's blockbuster stock debut (up 17% on day one) could not stop it: the shares slid on Friday.
A haven is where scared money runs to hide. This week that was Treasuries and the yen. Gold even slipped under $3,600. BTC? Up less than 1%, near $61,700. That is a pause, not a rush to safety.
Now rewind a week. The S&P 500 gained about 2.5% while BTC dropped nearly 9% by Friday, then slid to about $62,000 over the weekend, its lowest since July. The reported causes were crypto-only: roughly $2 billion pulled out of US spot Bitcoin ETFs, and about $2 billion of leveraged bets wiped out in 24 hours. BTC now sits roughly half off its all-time high.
So does Bitcoin follow stocks? For much of 2026 it did. Lately it doesn't. It runs on its own engine, and that engine can hurt you while the stock screen looks calm.
Three questions worth asking before you call anything a haven:
1. Who buys it when everyone else is selling? This week the buyers went to Treasuries and the yen, not BTC.
2. Is it falling because of the market, or because of its own holders (fund outflows, leverage)? The second kind can keep going on a quiet day.
3. How far can my pile fall before I am forced to sell at a bad moment?
One strategist says technical selling may need to run its course before a bottom forms. Nobody knows when. A flat day is not a signal.
What's your criteria for a real haven?
Experience, not financial advice. $BTC
#GlobalStocksFaceLongestLosingStreakSince2023
Bitcoin isn't acting like a safe haven. Last week US stocks rose and BTC fell about 9%. This week stocks slide and BTC just sits there. Calm today is not the same as safe.
The broad world stock index (MSCI ACWI) fell for a 7th session in a row, the longest streak since 2023, per Bloomberg. Asia is on track for its worst week since March 2020. Chipmakers are down about 35% from their June peak. Even Anthropic's blockbuster stock debut (up 17% on day one) could not stop it: the shares slid on Friday.
A haven is where scared money runs to hide. This week that was Treasuries and the yen. Gold even slipped under $3,600. BTC? Up less than 1%, near $61,700. That is a pause, not a rush to safety.
Now rewind a week. The S&P 500 gained about 2.5% while BTC dropped nearly 9% by Friday, then slid to about $62,000 over the weekend, its lowest since July. The reported causes were crypto-only: roughly $2 billion pulled out of US spot Bitcoin ETFs, and about $2 billion of leveraged bets wiped out in 24 hours. BTC now sits roughly half off its all-time high.
So does Bitcoin follow stocks? For much of 2026 it did. Lately it doesn't. It runs on its own engine, and that engine can hurt you while the stock screen looks calm.
Three questions worth asking before you call anything a haven:
1. Who buys it when everyone else is selling? This week the buyers went to Treasuries and the yen, not BTC.
2. Is it falling because of the market, or because of its own holders (fund outflows, leverage)? The second kind can keep going on a quiet day.
3. How far can my pile fall before I am forced to sell at a bad moment?
One strategist says technical selling may need to run its course before a bottom forms. Nobody knows when. A flat day is not a signal.
What's your criteria for a real haven?
Experience, not financial advice. $BTC
#GlobalStocksFaceLongestLosingStreakSince2023
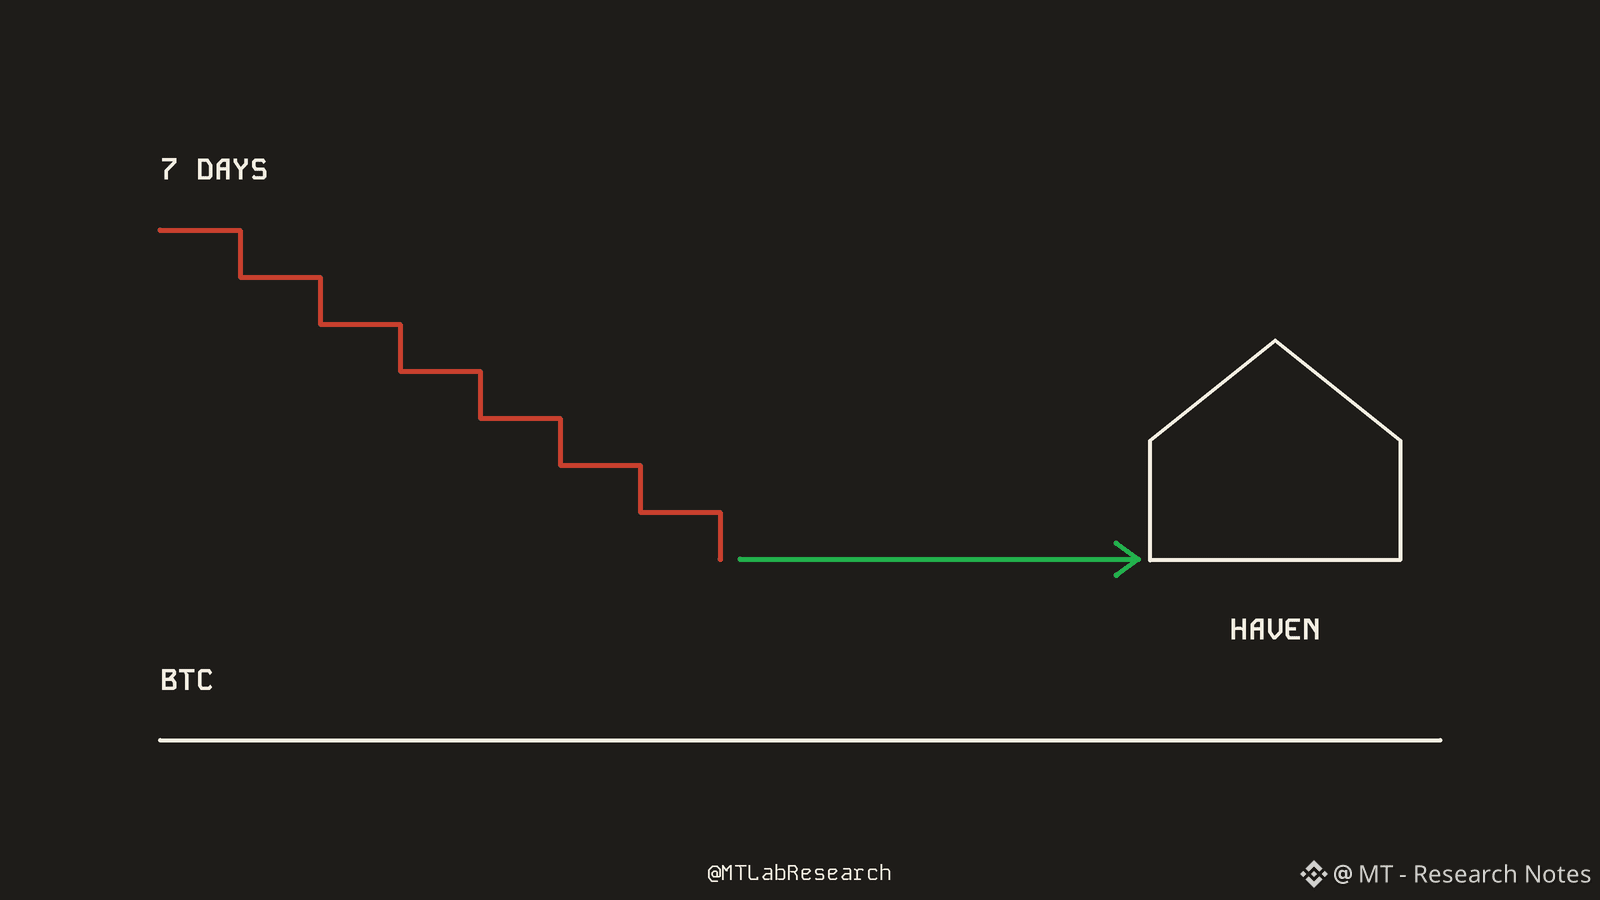
1
335
·
--
Bullish
Hong Kong just wrote the rules for 4 more crypto services. Are they law yet?
Short answer: Not yet. On Nov 20 Hong Kong published a bill (a draft law) to license 4 crypto services: dealing, custody, advice and management. Lawmakers first see it on Dec 2.
In plain words, anyone doing these in Hong Kong would need a licence from, or to register with, the SFC, its market regulator (per PANews, citing the government):
- Dealing: buying and selling crypto for clients
- Custody: holding clients' crypto keys
- Advice: telling clients what to buy
- Management: running clients' money for them
Banks and e-wallet (stored value) licensees that offer any of these would have to register with the SFC too.
Here is what a newbie can misread. "Published" is not "passed". Dec 2 is only the first reading, the day the bill is formally introduced. Lawmakers still debate and vote, and I found no start date in the reports.
Why it is still news? Hong Kong already licenses crypto trading platforms and stablecoin issuers, with the first two stablecoin licences granted in April. This bill fills in the services around them, after two rounds of public consultation.
Reported but not confirmed in what I read: no grace period. Firms already operating would not be treated as licensed while the SFC reviews them. Exemptions and penalties are not in the reports I found. An earlier consultation also said firms marketing to Hong Kong from abroad could be covered, so check the final text.
Three habits I would keep when reading a newly introduced crypto rule:
1. Find the stage: consultation, bill, passed, in force. Only the last one changes the rules
2. Read the verbs: "proposes" and "published" are not "approved"
3. A licence puts a firm under a regulator. It does not make a coin safe or push a price anywhere
How good is the crypto regulation in your country?
Experience, not financial advice.
#HongKongProposesSFCLicensingForFourVirtualAssetServices
Hong Kong just wrote the rules for 4 more crypto services. Are they law yet?
Short answer: Not yet. On Nov 20 Hong Kong published a bill (a draft law) to license 4 crypto services: dealing, custody, advice and management. Lawmakers first see it on Dec 2.
In plain words, anyone doing these in Hong Kong would need a licence from, or to register with, the SFC, its market regulator (per PANews, citing the government):
- Dealing: buying and selling crypto for clients
- Custody: holding clients' crypto keys
- Advice: telling clients what to buy
- Management: running clients' money for them
Banks and e-wallet (stored value) licensees that offer any of these would have to register with the SFC too.
Here is what a newbie can misread. "Published" is not "passed". Dec 2 is only the first reading, the day the bill is formally introduced. Lawmakers still debate and vote, and I found no start date in the reports.
Why it is still news? Hong Kong already licenses crypto trading platforms and stablecoin issuers, with the first two stablecoin licences granted in April. This bill fills in the services around them, after two rounds of public consultation.
Reported but not confirmed in what I read: no grace period. Firms already operating would not be treated as licensed while the SFC reviews them. Exemptions and penalties are not in the reports I found. An earlier consultation also said firms marketing to Hong Kong from abroad could be covered, so check the final text.
Three habits I would keep when reading a newly introduced crypto rule:
1. Find the stage: consultation, bill, passed, in force. Only the last one changes the rules
2. Read the verbs: "proposes" and "published" are not "approved"
3. A licence puts a firm under a regulator. It does not make a coin safe or push a price anywhere
How good is the crypto regulation in your country?
Experience, not financial advice.
#HongKongProposesSFCLicensingForFourVirtualAssetServices
Short answer: Not yet. On Nov 20 Hong Kong published a bill (a draft law) to license 4 crypto services: dealing, custody, advice and management. Lawmakers first see it on Dec 2.
In plain words, anyone doing these in Hong Kong would need a licence from, or to register with, the SFC, its market regulator (per PANews, citing the government):
- Dealing: buying and selling crypto for clients
- Custody: holding clients' crypto keys
- Advice: telling clients what to buy
- Management: running clients' money for them
Banks and e-wallet (stored value) licensees that offer any of these would have to register with the SFC too.
Here is what a newbie can misread. "Published" is not "passed". Dec 2 is only the first reading, the day the bill is formally introduced. Lawmakers still debate and vote, and I found no start date in the reports.
Why it is still news? Hong Kong already licenses crypto trading platforms and stablecoin issuers, with the first two stablecoin licences granted in April. This bill fills in the services around them, after two rounds of public consultation.
Reported but not confirmed in what I read: no grace period. Firms already operating would not be treated as licensed while the SFC reviews them. Exemptions and penalties are not in the reports I found. An earlier consultation also said firms marketing to Hong Kong from abroad could be covered, so check the final text.
Three habits I would keep when reading a newly introduced crypto rule:
1. Find the stage: consultation, bill, passed, in force. Only the last one changes the rules
2. Read the verbs: "proposes" and "published" are not "approved"
3. A licence puts a firm under a regulator. It does not make a coin safe or push a price anywhere
How good is the crypto regulation in your country?
Experience, not financial advice.
#HongKongProposesSFCLicensingForFourVirtualAssetServices
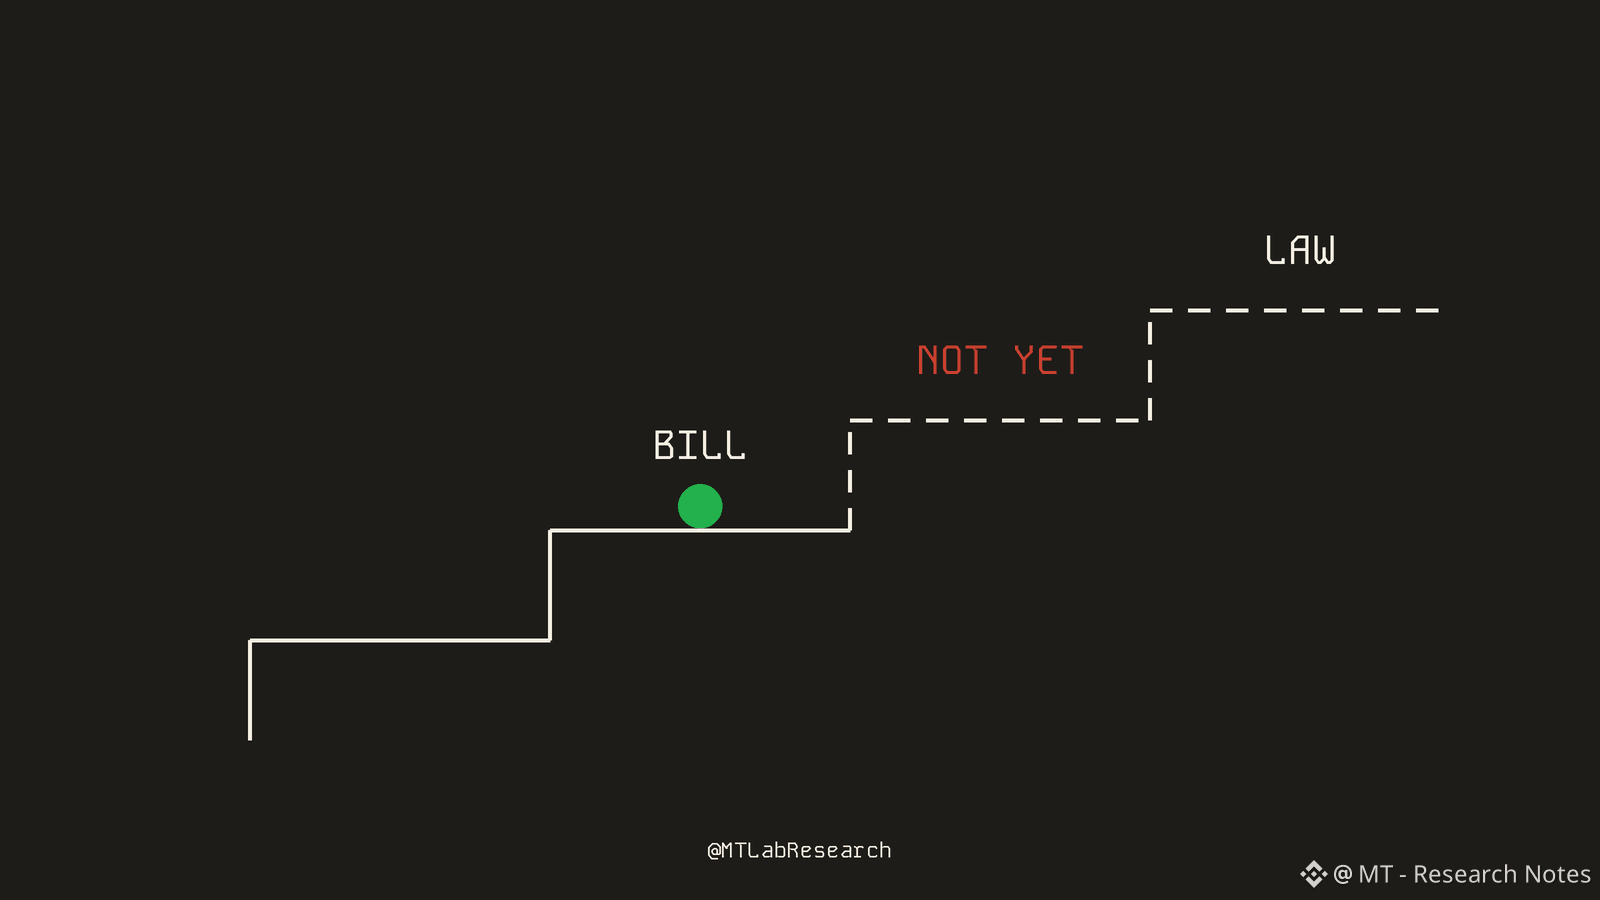
2
2
748
·
--
Bearish
A record $541M just left BlackRock's Bitcoin ETF! Is that why $BTC is sinking?
Check the days before blaming it. On Nov 6, US Bitcoin ETFs lost about $412M and Bitcoin dipped just 0.3%. Its biggest daily drop from Oct 28 to Nov 15 hit on a Saturday, when ETFs were closed.
The new record: on Nov 19, investors pulled $541M out of BlackRock's iShares Bitcoin Trust (IBIT), a fund that holds real Bitcoin and trades like a stock. It beat the old record of $528.3M from Jan 30 by only about $13M. All 12 US spot Bitcoin ETFs lost $582M that day and IBIT was about 93% of it (per Bloomberg and CoinGraph). In November alone, about $2.94B has left IBIT.
Scary headline... so here is the size. By my math, $541M is about 8,700 $BTC at roughly $62K, around 1.1% of the ~780K $BTC IBIT held on Nov 18 (per TFTC data).
Now about the days! All US Bitcoin ETFs together vs Bitcoin's daily close in UTC (RoboForex's tally).
- Nov 5: ETFs lost $430M, BTC fell 5.55%
- Nov 6: ETFs lost $412M, BTC dipped 0.30%
- Nov 11: ETFs lost about $300M, BTC rose 0.29%
- Nov 14, a Saturday, ETFs closed: BTC fell 6.03%
On the record day itself, IBIT's share price slipped only 0.8%.
So does the selling cause the drop, or the drop cause the selling? Both can be true. When shares are cashed in, the fund sells real BTC to pay out, so outflows can push the price. But stocks and crypto were also falling together on rate hike bets on Nov 18 (per FXStreet), so flows may be a symptom, not the cause.
What nobody knows yet: who cashed out and why. The data shows the money left, not the reason. And BlackRock is not deciding to sell: its clients are cashing in.
3 habits I would keep:
1. Read a record in percent, not only dollars
2 Check the same day's price before blaming flows
3. Ask what the data cannot tell you
Which do you check first, flows or price?
{future}(BTCUSDT)
Experience, not financial advice.
#BlackRockBitcoinETFRecordsLargestDailyOutflow
A record $541M just left BlackRock's Bitcoin ETF! Is that why $BTC is sinking?
Check the days before blaming it. On Nov 6, US Bitcoin ETFs lost about $412M and Bitcoin dipped just 0.3%. Its biggest daily drop from Oct 28 to Nov 15 hit on a Saturday, when ETFs were closed.
The new record: on Nov 19, investors pulled $541M out of BlackRock's iShares Bitcoin Trust (IBIT), a fund that holds real Bitcoin and trades like a stock. It beat the old record of $528.3M from Jan 30 by only about $13M. All 12 US spot Bitcoin ETFs lost $582M that day and IBIT was about 93% of it (per Bloomberg and CoinGraph). In November alone, about $2.94B has left IBIT.
Scary headline... so here is the size. By my math, $541M is about 8,700 $BTC at roughly $62K, around 1.1% of the ~780K $BTC IBIT held on Nov 18 (per TFTC data).
Now about the days! All US Bitcoin ETFs together vs Bitcoin's daily close in UTC (RoboForex's tally).
- Nov 5: ETFs lost $430M, BTC fell 5.55%
- Nov 6: ETFs lost $412M, BTC dipped 0.30%
- Nov 11: ETFs lost about $300M, BTC rose 0.29%
- Nov 14, a Saturday, ETFs closed: BTC fell 6.03%
On the record day itself, IBIT's share price slipped only 0.8%.
So does the selling cause the drop, or the drop cause the selling? Both can be true. When shares are cashed in, the fund sells real BTC to pay out, so outflows can push the price. But stocks and crypto were also falling together on rate hike bets on Nov 18 (per FXStreet), so flows may be a symptom, not the cause.
What nobody knows yet: who cashed out and why. The data shows the money left, not the reason. And BlackRock is not deciding to sell: its clients are cashing in.
3 habits I would keep:
1. Read a record in percent, not only dollars
2 Check the same day's price before blaming flows
3. Ask what the data cannot tell you
Which do you check first, flows or price?
Experience, not financial advice.
#BlackRockBitcoinETFRecordsLargestDailyOutflow
Check the days before blaming it. On Nov 6, US Bitcoin ETFs lost about $412M and Bitcoin dipped just 0.3%. Its biggest daily drop from Oct 28 to Nov 15 hit on a Saturday, when ETFs were closed.
The new record: on Nov 19, investors pulled $541M out of BlackRock's iShares Bitcoin Trust (IBIT), a fund that holds real Bitcoin and trades like a stock. It beat the old record of $528.3M from Jan 30 by only about $13M. All 12 US spot Bitcoin ETFs lost $582M that day and IBIT was about 93% of it (per Bloomberg and CoinGraph). In November alone, about $2.94B has left IBIT.
Scary headline... so here is the size. By my math, $541M is about 8,700 $BTC at roughly $62K, around 1.1% of the ~780K $BTC IBIT held on Nov 18 (per TFTC data).
Now about the days! All US Bitcoin ETFs together vs Bitcoin's daily close in UTC (RoboForex's tally).
- Nov 5: ETFs lost $430M, BTC fell 5.55%
- Nov 6: ETFs lost $412M, BTC dipped 0.30%
- Nov 11: ETFs lost about $300M, BTC rose 0.29%
- Nov 14, a Saturday, ETFs closed: BTC fell 6.03%
On the record day itself, IBIT's share price slipped only 0.8%.
So does the selling cause the drop, or the drop cause the selling? Both can be true. When shares are cashed in, the fund sells real BTC to pay out, so outflows can push the price. But stocks and crypto were also falling together on rate hike bets on Nov 18 (per FXStreet), so flows may be a symptom, not the cause.
What nobody knows yet: who cashed out and why. The data shows the money left, not the reason. And BlackRock is not deciding to sell: its clients are cashing in.
3 habits I would keep:
1. Read a record in percent, not only dollars
2 Check the same day's price before blaming flows
3. Ask what the data cannot tell you
Which do you check first, flows or price?
Experience, not financial advice.
#BlackRockBitcoinETFRecordsLargestDailyOutflow
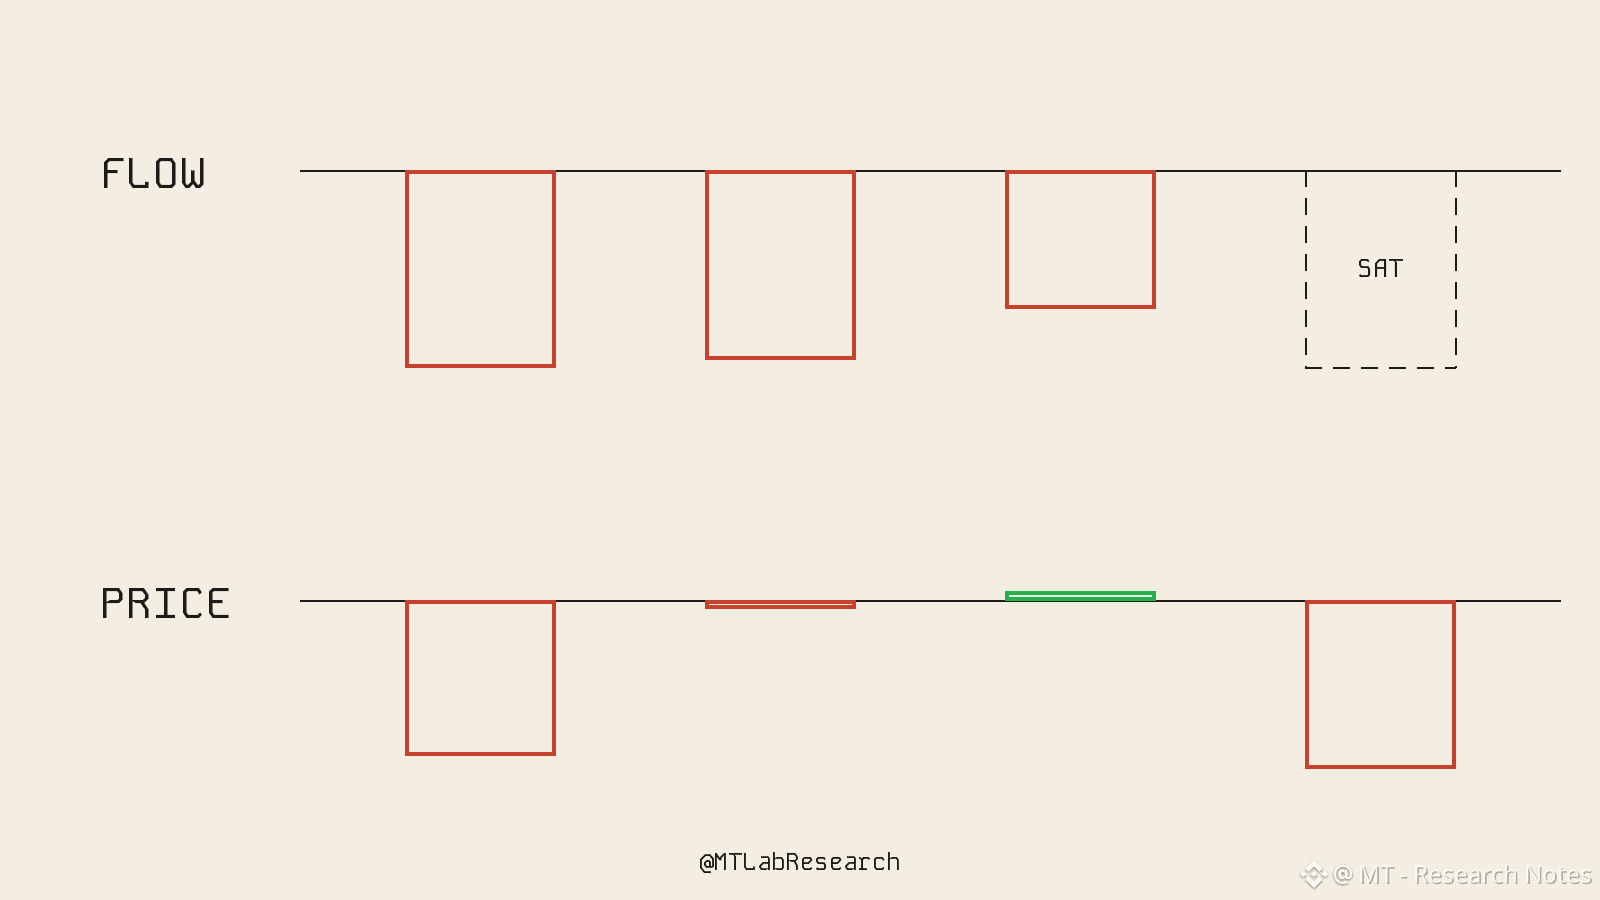
MT - Research Notes
·
--
BearishAnthropic's stock is now worth about as much as all of Bitcoin! Did it just eat BTC?
Not so fast. Bitcoin hit $61,381 at 21:32 UTC, its lowest since July, and $528M of leveraged bets were wiped out in 24 hours (CoinGlass). Three suspects. Only two have data.
Let's begin with the scene. Anthropic (ticker ANT) closed its first day as a public company at $97.17, about $1.27T in value (Forbes), roughly Bitcoin's own size. About 80% of the wiped-out bets were longs (bets on a rising price), and 113,000+ traders were hit.
Suspect 1, the Fed. Hot inflation data pushed the odds of a rate hike on Dec 9 above 80%, per CME FedWatch via RTTNews. Pricier borrowing hits risky assets first. Backed by data.
Suspect 2, the ETFs. US spot Bitcoin ETFs saw seven straight sessions of outflows as of Nov 15 (CryptoSlate). Real money leaving. Backed by data.
Suspect 3, Anthropic. The idea is that investors sold BTC to raise cash for the IPO. The CEOs of Strive and Xapo Bank floated it. It is a theory. Nobody has shown the money moving from one to the other.
What made it ugly is leverage. When a leveraged long runs low on collateral, the exchange force-sells it. That sale pushes the price lower and triggers the next one, whatever started it.
It spread to stocks. Strategy (MSTR), the biggest corporate Bitcoin holder, fell about 5% to $85.72 after hours, and its mNAV slipped to 0.97x (Binance report). mNAV is the company's market value divided by the value of the Bitcoin it holds. Below 1x, the stock is worth less than its coins.
Two scenarios may happen:
1. If hike odds fade and ETF outflows stop, suspects 1 and 2 lose steam.
2. If BTC keeps sliding while ANT trades calmly, suspect 3 loses weight.
Which factor do you blame for the $BTC downtrend?
Experience, not financial advice.
#BTCBelow$62KAmidHikeFearsAndShiftToAnthropic
Not so fast. Bitcoin hit $61,381 at 21:32 UTC, its lowest since July, and $528M of leveraged bets were wiped out in 24 hours (CoinGlass). Three suspects. Only two have data.
Let's begin with the scene. Anthropic (ticker ANT) closed its first day as a public company at $97.17, about $1.27T in value (Forbes), roughly Bitcoin's own size. About 80% of the wiped-out bets were longs (bets on a rising price), and 113,000+ traders were hit.
Suspect 1, the Fed. Hot inflation data pushed the odds of a rate hike on Dec 9 above 80%, per CME FedWatch via RTTNews. Pricier borrowing hits risky assets first. Backed by data.
Suspect 2, the ETFs. US spot Bitcoin ETFs saw seven straight sessions of outflows as of Nov 15 (CryptoSlate). Real money leaving. Backed by data.
Suspect 3, Anthropic. The idea is that investors sold BTC to raise cash for the IPO. The CEOs of Strive and Xapo Bank floated it. It is a theory. Nobody has shown the money moving from one to the other.
What made it ugly is leverage. When a leveraged long runs low on collateral, the exchange force-sells it. That sale pushes the price lower and triggers the next one, whatever started it.
It spread to stocks. Strategy (MSTR), the biggest corporate Bitcoin holder, fell about 5% to $85.72 after hours, and its mNAV slipped to 0.97x (Binance report). mNAV is the company's market value divided by the value of the Bitcoin it holds. Below 1x, the stock is worth less than its coins.
Two scenarios may happen:
1. If hike odds fade and ETF outflows stop, suspects 1 and 2 lose steam.
2. If BTC keeps sliding while ANT trades calmly, suspect 3 loses weight.
Which factor do you blame for the $BTC downtrend?
Experience, not financial advice.
#BTCBelow$62KAmidHikeFearsAndShiftToAnthropic
BTC+1.93%
IBITETF-4.95%
2
3.3k
·
--
Bearish
Anthropic's stock is now worth about as much as all of Bitcoin! Did it just eat BTC?
Not so fast. Bitcoin hit $61,381 at 21:32 UTC, its lowest since July, and $528M of leveraged bets were wiped out in 24 hours (CoinGlass). Three suspects. Only two have data.
Let's begin with the scene. Anthropic (ticker ANT) closed its first day as a public company at $97.17, about $1.27T in value (Forbes), roughly Bitcoin's own size. About 80% of the wiped-out bets were longs (bets on a rising price), and 113,000+ traders were hit.
Suspect 1, the Fed. Hot inflation data pushed the odds of a rate hike on Dec 9 above 80%, per CME FedWatch via RTTNews. Pricier borrowing hits risky assets first. Backed by data.
Suspect 2, the ETFs. US spot Bitcoin ETFs saw seven straight sessions of outflows as of Nov 15 (CryptoSlate). Real money leaving. Backed by data.
Suspect 3, Anthropic. The idea is that investors sold BTC to raise cash for the IPO. The CEOs of Strive and Xapo Bank floated it. It is a theory. Nobody has shown the money moving from one to the other.
What made it ugly is leverage. When a leveraged long runs low on collateral, the exchange force-sells it. That sale pushes the price lower and triggers the next one, whatever started it.
It spread to stocks. Strategy (MSTR), the biggest corporate Bitcoin holder, fell about 5% to $85.72 after hours, and its mNAV slipped to 0.97x (Binance report). mNAV is the company's market value divided by the value of the Bitcoin it holds. Below 1x, the stock is worth less than its coins.
Two scenarios may happen:
1. If hike odds fade and ETF outflows stop, suspects 1 and 2 lose steam.
2. If BTC keeps sliding while ANT trades calmly, suspect 3 loses weight.
Which factor do you blame for the $BTC downtrend?
{future}(BTCUSDT)
Experience, not financial advice.
#BTCBelow$62KAmidHikeFearsAndShiftToAnthropic
Anthropic's stock is now worth about as much as all of Bitcoin! Did it just eat BTC?
Not so fast. Bitcoin hit $61,381 at 21:32 UTC, its lowest since July, and $528M of leveraged bets were wiped out in 24 hours (CoinGlass). Three suspects. Only two have data.
Let's begin with the scene. Anthropic (ticker ANT) closed its first day as a public company at $97.17, about $1.27T in value (Forbes), roughly Bitcoin's own size. About 80% of the wiped-out bets were longs (bets on a rising price), and 113,000+ traders were hit.
Suspect 1, the Fed. Hot inflation data pushed the odds of a rate hike on Dec 9 above 80%, per CME FedWatch via RTTNews. Pricier borrowing hits risky assets first. Backed by data.
Suspect 2, the ETFs. US spot Bitcoin ETFs saw seven straight sessions of outflows as of Nov 15 (CryptoSlate). Real money leaving. Backed by data.
Suspect 3, Anthropic. The idea is that investors sold BTC to raise cash for the IPO. The CEOs of Strive and Xapo Bank floated it. It is a theory. Nobody has shown the money moving from one to the other.
What made it ugly is leverage. When a leveraged long runs low on collateral, the exchange force-sells it. That sale pushes the price lower and triggers the next one, whatever started it.
It spread to stocks. Strategy (MSTR), the biggest corporate Bitcoin holder, fell about 5% to $85.72 after hours, and its mNAV slipped to 0.97x (Binance report). mNAV is the company's market value divided by the value of the Bitcoin it holds. Below 1x, the stock is worth less than its coins.
Two scenarios may happen:
1. If hike odds fade and ETF outflows stop, suspects 1 and 2 lose steam.
2. If BTC keeps sliding while ANT trades calmly, suspect 3 loses weight.
Which factor do you blame for the $BTC downtrend?
Experience, not financial advice.
#BTCBelow$62KAmidHikeFearsAndShiftToAnthropic
Not so fast. Bitcoin hit $61,381 at 21:32 UTC, its lowest since July, and $528M of leveraged bets were wiped out in 24 hours (CoinGlass). Three suspects. Only two have data.
Let's begin with the scene. Anthropic (ticker ANT) closed its first day as a public company at $97.17, about $1.27T in value (Forbes), roughly Bitcoin's own size. About 80% of the wiped-out bets were longs (bets on a rising price), and 113,000+ traders were hit.
Suspect 1, the Fed. Hot inflation data pushed the odds of a rate hike on Dec 9 above 80%, per CME FedWatch via RTTNews. Pricier borrowing hits risky assets first. Backed by data.
Suspect 2, the ETFs. US spot Bitcoin ETFs saw seven straight sessions of outflows as of Nov 15 (CryptoSlate). Real money leaving. Backed by data.
Suspect 3, Anthropic. The idea is that investors sold BTC to raise cash for the IPO. The CEOs of Strive and Xapo Bank floated it. It is a theory. Nobody has shown the money moving from one to the other.
What made it ugly is leverage. When a leveraged long runs low on collateral, the exchange force-sells it. That sale pushes the price lower and triggers the next one, whatever started it.
It spread to stocks. Strategy (MSTR), the biggest corporate Bitcoin holder, fell about 5% to $85.72 after hours, and its mNAV slipped to 0.97x (Binance report). mNAV is the company's market value divided by the value of the Bitcoin it holds. Below 1x, the stock is worth less than its coins.
Two scenarios may happen:
1. If hike odds fade and ETF outflows stop, suspects 1 and 2 lose steam.
2. If BTC keeps sliding while ANT trades calmly, suspect 3 loses weight.
Which factor do you blame for the $BTC downtrend?
Experience, not financial advice.
#BTCBelow$62KAmidHikeFearsAndShiftToAnthropic
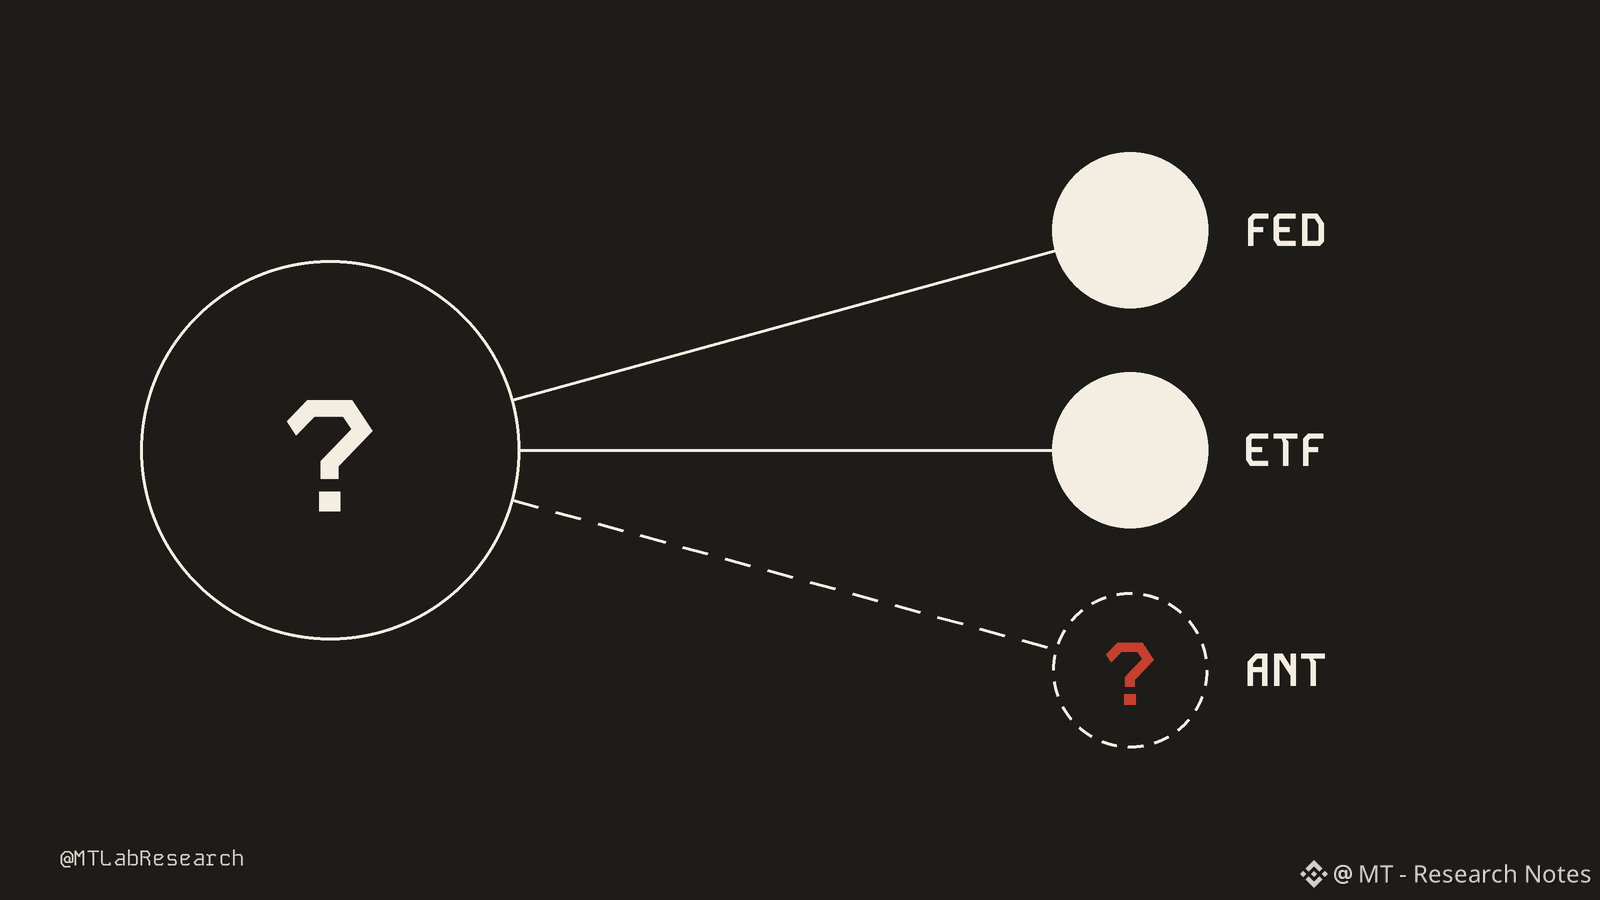
6
1
12
26.8k
Radar #9 PROFIT: a $100 ticket made 6%. A $20K ticket made 0.25%.
Quick recap: on Nov 18, Binance Wallet let users apply for tokenized Anthropic stock at the $83 IPO price, plus a 5% fee. The 500M USDC pool filled within hours. Radar #9 rated it Tier A, Join, because the downside looked capped.
Then the allocation came in, far short of what users committed. So Binance:
- Refunded every USDC. All 500,002,764 USDC is back, in two batches
- Airdropped the roughly 2,957 tokenized shares it did get, free, pro rata
- Added $1M of ANTB (Binance's tokenized Anthropic share): 6 USDC to every user first, the rest pro rata
By my math, 2,957 shares at $83 is about $245K of stock against $500M of orders. A fill of about 0.05%. My Radar #9 article simulated 5% to 30%. Off by at least 100x.
What a $20K ticket got, by my math:
- About 0.12 shares, worth about $11 at the first-day close
- About $34-38 of ANTB
- Total: about $45-50, or 0.23-0.25% in 2-3 days
Is that good? At 10% APY, the same $20K on Binance Earn makes about $10-16 in 2-3 days. So Radar #9 paid roughly 3-5x more, about 28-46% a year if you annualize it. But it's a one-off, not a yield you can repeat.
Why did small tickets win? The 6 USDC minimum is the same for everyone. On $100 it's 6%. On $20K it's a rounding error.
Meanwhile ANT opened at $111.50, 34% above $83, and closed day one at $97.17, up 17% (per CNBC and Bloomberg). Almost nobody on the crypto side held it.
What Radar #9 taught me?
- The fill was the whole game. "Oversubscribed" on Wall Street can shrink the crypto slice to almost nothing
- Capped downside worked: a refund plus free shares beat every loss case in my grid
- Always compare a campaign with the boring option. This one beat Earn, but only by about $35
Right about the risk. Wrong about the fill.
How much did you earned?
Experience, not financial advice.
#IsAnthropic’s$1.5TMarketCapJustified?
Radar #9 PROFIT: a $100 ticket made 6%. A $20K ticket made 0.25%.
Quick recap: on Nov 18, Binance Wallet let users apply for tokenized Anthropic stock at the $83 IPO price, plus a 5% fee. The 500M USDC pool filled within hours. Radar #9 rated it Tier A, Join, because the downside looked capped.
Then the allocation came in, far short of what users committed. So Binance:
- Refunded every USDC. All 500,002,764 USDC is back, in two batches
- Airdropped the roughly 2,957 tokenized shares it did get, free, pro rata
- Added $1M of ANTB (Binance's tokenized Anthropic share): 6 USDC to every user first, the rest pro rata
By my math, 2,957 shares at $83 is about $245K of stock against $500M of orders. A fill of about 0.05%. My Radar #9 article simulated 5% to 30%. Off by at least 100x.
What a $20K ticket got, by my math:
- About 0.12 shares, worth about $11 at the first-day close
- About $34-38 of ANTB
- Total: about $45-50, or 0.23-0.25% in 2-3 days
Is that good? At 10% APY, the same $20K on Binance Earn makes about $10-16 in 2-3 days. So Radar #9 paid roughly 3-5x more, about 28-46% a year if you annualize it. But it's a one-off, not a yield you can repeat.
Why did small tickets win? The 6 USDC minimum is the same for everyone. On $100 it's 6%. On $20K it's a rounding error.
Meanwhile ANT opened at $111.50, 34% above $83, and closed day one at $97.17, up 17% (per CNBC and Bloomberg). Almost nobody on the crypto side held it.
What Radar #9 taught me?
- The fill was the whole game. "Oversubscribed" on Wall Street can shrink the crypto slice to almost nothing
- Capped downside worked: a refund plus free shares beat every loss case in my grid
- Always compare a campaign with the boring option. This one beat Earn, but only by about $35
Right about the risk. Wrong about the fill.
How much did you earned?
Experience, not financial advice.
#IsAnthropic’s$1.5TMarketCapJustified?
Quick recap: on Nov 18, Binance Wallet let users apply for tokenized Anthropic stock at the $83 IPO price, plus a 5% fee. The 500M USDC pool filled within hours. Radar #9 rated it Tier A, Join, because the downside looked capped.
Then the allocation came in, far short of what users committed. So Binance:
- Refunded every USDC. All 500,002,764 USDC is back, in two batches
- Airdropped the roughly 2,957 tokenized shares it did get, free, pro rata
- Added $1M of ANTB (Binance's tokenized Anthropic share): 6 USDC to every user first, the rest pro rata
By my math, 2,957 shares at $83 is about $245K of stock against $500M of orders. A fill of about 0.05%. My Radar #9 article simulated 5% to 30%. Off by at least 100x.
What a $20K ticket got, by my math:
- About 0.12 shares, worth about $11 at the first-day close
- About $34-38 of ANTB
- Total: about $45-50, or 0.23-0.25% in 2-3 days
Is that good? At 10% APY, the same $20K on Binance Earn makes about $10-16 in 2-3 days. So Radar #9 paid roughly 3-5x more, about 28-46% a year if you annualize it. But it's a one-off, not a yield you can repeat.
Why did small tickets win? The 6 USDC minimum is the same for everyone. On $100 it's 6%. On $20K it's a rounding error.
Meanwhile ANT opened at $111.50, 34% above $83, and closed day one at $97.17, up 17% (per CNBC and Bloomberg). Almost nobody on the crypto side held it.
What Radar #9 taught me?
- The fill was the whole game. "Oversubscribed" on Wall Street can shrink the crypto slice to almost nothing
- Capped downside worked: a refund plus free shares beat every loss case in my grid
- Always compare a campaign with the boring option. This one beat Earn, but only by about $35
Right about the risk. Wrong about the fill.
How much did you earned?
Experience, not financial advice.
#IsAnthropic’s$1.5TMarketCapJustified?
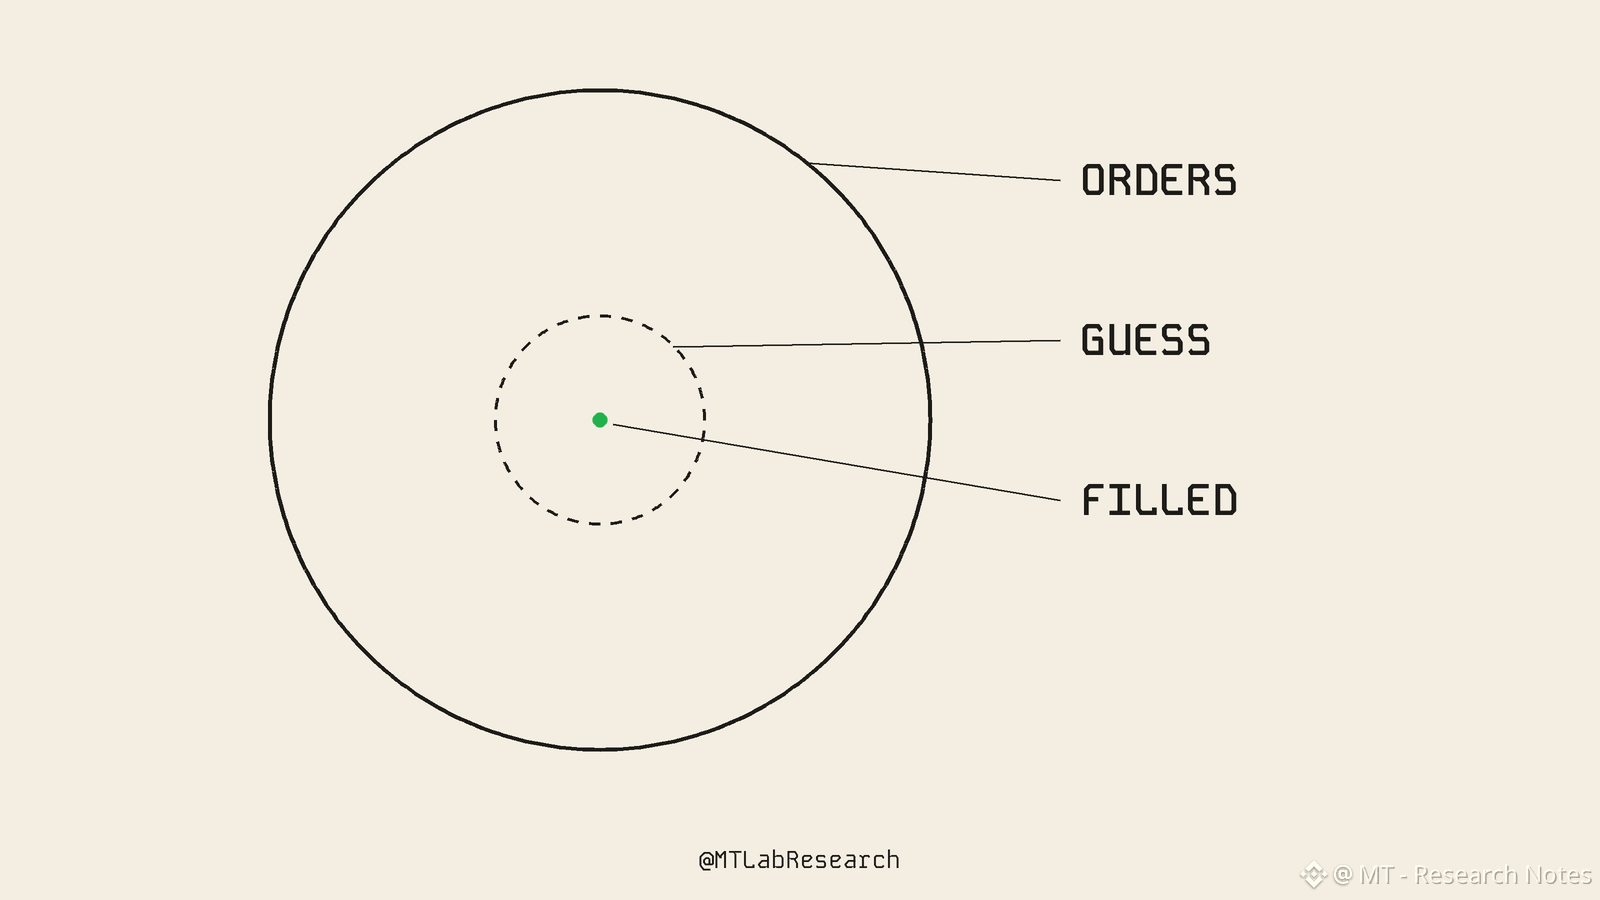
MT - Research Notes
·
--
BullishRadar #9 update: Anthropic's IPO price is $83. Can you actually buy it there?
$83 was the IPO price for investors who got shares from the banks. Everyone else pays the first trade on Nasdaq, set by an opening auction where buy and sell orders meet. Bloomberg says gray market trading points to an open about 20% to 26% above $83. By my math, that's about $100 to $105 a share.
Binance Stocks now takes ANT orders, from 10:05 UTC on Nov 19. Per Binance's notice:
- Whole shares and limit orders only before the first trade. No market orders.
- Your order waits in a queue until ANT actually opens. That's not expected at the usual 14:30 UTC, because big IPOs can take hours to find a first price.
- Pending limit orders stay live, even through a trading halt.
- Your shares are held by US broker Alpaca, not by Binance. It's a real share, not a token.
- Some regions can't use it, and brokers can cap or reject buy orders.
A limit order is your seatbelt. It says "this much, and not a cent more." Set it high just to get in, and you can get filled at the top of the first-minute rush.
Subscribers on Binance Wallet locked their price yesterday: $83 plus the 5% fee = $87.15 per ANTx token, if they got a fill. Someone buying at a $100 open pays about 15% more than that, before the stock has done anything. That gap is the cost of buying the hype instead of the allocation.
Before you set a limit, ask yourself:
- What's the most I'd pay, from my own math, not the group chat?
- If it opens above my limit, am I fine missing it?
- Can I sit through a 20% swing either way on day one?
Some levels for us to watch:
- If ANT opens near $100 and holds, the gray market was right
- If it opens hot and fades, the late buyers paid for the early sellers' pop
- If it opens below $87.15, even Binance wallet subscribers are under water after the fee
What will be the max price you are willing to pay for ANT?
Experience, not financial advice.
#AnthropicToDebutAfter$83IPOPricing
$83 was the IPO price for investors who got shares from the banks. Everyone else pays the first trade on Nasdaq, set by an opening auction where buy and sell orders meet. Bloomberg says gray market trading points to an open about 20% to 26% above $83. By my math, that's about $100 to $105 a share.
Binance Stocks now takes ANT orders, from 10:05 UTC on Nov 19. Per Binance's notice:
- Whole shares and limit orders only before the first trade. No market orders.
- Your order waits in a queue until ANT actually opens. That's not expected at the usual 14:30 UTC, because big IPOs can take hours to find a first price.
- Pending limit orders stay live, even through a trading halt.
- Your shares are held by US broker Alpaca, not by Binance. It's a real share, not a token.
- Some regions can't use it, and brokers can cap or reject buy orders.
A limit order is your seatbelt. It says "this much, and not a cent more." Set it high just to get in, and you can get filled at the top of the first-minute rush.
Subscribers on Binance Wallet locked their price yesterday: $83 plus the 5% fee = $87.15 per ANTx token, if they got a fill. Someone buying at a $100 open pays about 15% more than that, before the stock has done anything. That gap is the cost of buying the hype instead of the allocation.
Before you set a limit, ask yourself:
- What's the most I'd pay, from my own math, not the group chat?
- If it opens above my limit, am I fine missing it?
- Can I sit through a 20% swing either way on day one?
Some levels for us to watch:
- If ANT opens near $100 and holds, the gray market was right
- If it opens hot and fades, the late buyers paid for the early sellers' pop
- If it opens below $87.15, even Binance wallet subscribers are under water after the fee
What will be the max price you are willing to pay for ANT?
Experience, not financial advice.
#AnthropicToDebutAfter$83IPOPricing
2
1
644
Log in to explore more content
Join global crypto users on Binance Square
⚡️ Get latest and useful information about crypto.
💬 Trusted by the world’s largest crypto exchange.
👍 Discover real insights from verified creators.
Email / Phone number
Trending Topics
BTCReboundsAbove$60KAmidWhaleDipBuying
95,087 views
407 Discussing
Abraxas Capital, Other Whales Buy the BTC Dip as Bitcoin Briefly Reclaims $60,000
Binance News
·37 Likes
·85.3k views
SolanaSets2027RoadmapToDoubleComputeCapacity
78,246 views
1,172 Discussing
CaliforniaNvidiaProbeExaminesPotentialCriminalViolations
21,476 views
169 Discussing