
Nmads_Ray
247 Posts

Nmads_Ray
Report
Block User
Open Trade
High-Frequency Trader
1.9 Years
59 Following
73 Followers
106 Liked
Posts
Portfolio
·
--
According to reports, Bitcoin News posted on X that hackers are carrying out a new type of attack targeting Bitcoin mining infrastructure amid the $BTC price drop over the weekend. A full report will be published in tomorrow’s briefing. That’s all that can be confirmed for now. The scale of the damage, the method of attack, and whether any major mining pools were affected have not been disclosed. But the timing is worth considering: news of an attack on mining infrastructure and a sharp price drop landed on the same weekend, making it easy for the market to link the two and interpret them as “hash rate or security issues providing a reason for the decline,” even though no causal connection has been confirmed.
As of 06:21, $BTC is trading at 65202, up 1.9% over the past 24 hours after rebounding from 62006. But it is down 12.9% over seven days and 20.1% over 30 days. The daily RSI14 is just 24, and the price remains below all three daily moving averages—MA7, MA25, and MA99—with a 16.3% gap to MA99. A rebound from this position looks more like a technical recovery after being oversold than a trend reversal—after such a steep, rapid drop, it’s normal for some traders to buy the dip. $BCH and $LTC, in the same sector, have largely moved in sync this time: both are up over the past 24 hours (BCH +4.7%, LTC +3.1%). Their daily RSI14 readings are also around 28 and 29, and both are at the 14% mark of their 30-day ranges. All three coins have risen and fallen together in this move, with no divergence, suggesting the rebound is a sector-wide sentiment recovery rather than an independent rally in BTC. On the trending list, $BTC’s social buzz exceeds 8.5 million, sentiment is labeled negative, and community discussions are focused on topics like “breaking below 63,000” and “330 billion wiped out in a week”—signs that panic has not truly subsided.
If further details confirm that the attack on mining infrastructure did affect hash rate, the news could add fresh downside pressure. If it turns out to be only a small, localized incident, the market will probably absorb it within a few days, and it won’t affect the broader trend. Given the combination of an oversold RSI and moving averages all aligned bearishly, I lean toward a period of consolidation and recovery first, rather than an immediate reversal higher. Whether the price can reclaim the daily MA7 at 70329 will be the real signal. If it breaks below the 24-hour low of 62006, then my view will have been wrong.
#比特币挖矿遭攻击 #BTC
According to reports, Bitcoin News posted on X that hackers are carrying out a new type of attack targeting Bitcoin mining infrastructure amid the $BTC price drop over the weekend. A full report will be published in tomorrow’s briefing. That’s all that can be confirmed for now. The scale of the damage, the method of attack, and whether any major mining pools were affected have not been disclosed. But the timing is worth considering: news of an attack on mining infrastructure and a sharp price drop landed on the same weekend, making it easy for the market to link the two and interpret them as “hash rate or security issues providing a reason for the decline,” even though no causal connection has been confirmed.
As of 06:21, $BTC is trading at 65202, up 1.9% over the past 24 hours after rebounding from 62006. But it is down 12.9% over seven days and 20.1% over 30 days. The daily RSI14 is just 24, and the price remains below all three daily moving averages—MA7, MA25, and MA99—with a 16.3% gap to MA99. A rebound from this position looks more like a technical recovery after being oversold than a trend reversal—after such a steep, rapid drop, it’s normal for some traders to buy the dip. $BCH and $LTC , in the same sector, have largely moved in sync this time: both are up over the past 24 hours (BCH +4.7%, LTC +3.1%). Their daily RSI14 readings are also around 28 and 29, and both are at the 14% mark of their 30-day ranges. All three coins have risen and fallen together in this move, with no divergence, suggesting the rebound is a sector-wide sentiment recovery rather than an independent rally in BTC. On the trending list, $BTC ’s social buzz exceeds 8.5 million, sentiment is labeled negative, and community discussions are focused on topics like “breaking below 63,000” and “330 billion wiped out in a week”—signs that panic has not truly subsided.
If further details confirm that the attack on mining infrastructure did affect hash rate, the news could add fresh downside pressure. If it turns out to be only a small, localized incident, the market will probably absorb it within a few days, and it won’t affect the broader trend. Given the combination of an oversold RSI and moving averages all aligned bearishly, I lean toward a period of consolidation and recovery first, rather than an immediate reversal higher. Whether the price can reclaim the daily MA7 at 70329 will be the real signal. If it breaks below the 24-hour low of 62006, then my view will have been wrong.
#比特币挖矿遭攻击 #BTC
As of 06:21, $BTC is trading at 65202, up 1.9% over the past 24 hours after rebounding from 62006. But it is down 12.9% over seven days and 20.1% over 30 days. The daily RSI14 is just 24, and the price remains below all three daily moving averages—MA7, MA25, and MA99—with a 16.3% gap to MA99. A rebound from this position looks more like a technical recovery after being oversold than a trend reversal—after such a steep, rapid drop, it’s normal for some traders to buy the dip. $BCH and $LTC , in the same sector, have largely moved in sync this time: both are up over the past 24 hours (BCH +4.7%, LTC +3.1%). Their daily RSI14 readings are also around 28 and 29, and both are at the 14% mark of their 30-day ranges. All three coins have risen and fallen together in this move, with no divergence, suggesting the rebound is a sector-wide sentiment recovery rather than an independent rally in BTC. On the trending list, $BTC ’s social buzz exceeds 8.5 million, sentiment is labeled negative, and community discussions are focused on topics like “breaking below 63,000” and “330 billion wiped out in a week”—signs that panic has not truly subsided.
If further details confirm that the attack on mining infrastructure did affect hash rate, the news could add fresh downside pressure. If it turns out to be only a small, localized incident, the market will probably absorb it within a few days, and it won’t affect the broader trend. Given the combination of an oversold RSI and moving averages all aligned bearishly, I lean toward a period of consolidation and recovery first, rather than an immediate reversal higher. Whether the price can reclaim the daily MA7 at 70329 will be the real signal. If it breaks below the 24-hour low of 62006, then my view will have been wrong.
#比特币挖矿遭攻击 #BTC
168
·
--
According to reports, Binance Futures will adjust the contract size of the ANTHROPICUSDT pre-market perpetual contract at 16:30 on November 17, and change its ticker to ANTUSDT at the same time. The process is expected to be completed by 19:00. At 16:15, all strategy bots will be forcibly terminated, positions will be closed automatically, and bot positions cannot be restored after the adjustment. My core view is this: with “new” assets like pre-market contracts, the supposedly stable positions held by bots can be forcibly liquidated and wiped out at any time due to rule changes, regardless of whether the market is rising or falling. This is a structural risk that you can’t avoid just by correctly predicting market direction.
The process is clearer when broken down: between 16:30 and 19:00, trading and settlement for this contract will be suspended, and all open take-profit and stop-loss orders will be canceled. Regular manually held positions won’t be wiped out like bot positions; unrealized profits and losses will first be settled, and positions will be restored once the adjustment is complete. Bot positions and regular positions face very different outcomes in this adjustment. I’ve made a similar mistake myself in the past: for convenience, I entrusted all my funds to an automated strategy, didn’t notice an announcement about a ticker or rule change, and by the time I realized what had happened, my positions were already gone. The lesson this time is straightforward: for any pre-market contract whose ticker could still change, check announcements regularly for planned adjustments, renamings, or changes in contract size. Don’t just set it up and leave it unattended.
Back to the market: the token that has really been making the hot lists these past two days is $ASTER, down 14.0% over 24 hours, with a current price of 0.5336. Some community members say holders have taken heavy losses, and there are also unverified rumors involving market makers and the founder. $AVAX, in the same sector, fell 3.7% over the same period to 7.204—far less than $ASTER. That suggests this isn’t a synchronized crash across the whole sector; $ASTER has been hit on its own. The daily RSI14 for both tokens is around 30. Over the 30-day range, $ASTER is at just the 22nd percentile and $AVAX at the 14th; both are hovering near recent lows, but $ASTER is falling much faster. Its current 4-hour price is still 12.2% below the moving average, with no recovery in sight.
I lean toward $ASTER remaining weak in the short term, and I won’t readily call a reversal until there are signs that it has bottomed. Its rapid decline, combined with surging volume (24-hour trading volume is 3.5 times the average daily volume of the previous seven days), looks more like panic selling than a shakeout. If $ASTER can reclaim its 4-hour moving average and stop making new lows in this move, then my view will have been wrong. Meanwhile, $BTC itself is down 1.9%, and the total market cap is down 5.1%, with overall sentiment deteriorating. In this environment, it’s even more important to pay attention to risks related to rules and announcements, rather than focusing only on candlestick charts.
#ANT上市前合约调整 #Altcoins fall across the board
According to reports, Binance Futures will adjust the contract size of the ANTHROPICUSDT pre-market perpetual contract at 16:30 on November 17, and change its ticker to ANTUSDT at the same time. The process is expected to be completed by 19:00. At 16:15, all strategy bots will be forcibly terminated, positions will be closed automatically, and bot positions cannot be restored after the adjustment. My core view is this: with “new” assets like pre-market contracts, the supposedly stable positions held by bots can be forcibly liquidated and wiped out at any time due to rule changes, regardless of whether the market is rising or falling. This is a structural risk that you can’t avoid just by correctly predicting market direction.
The process is clearer when broken down: between 16:30 and 19:00, trading and settlement for this contract will be suspended, and all open take-profit and stop-loss orders will be canceled. Regular manually held positions won’t be wiped out like bot positions; unrealized profits and losses will first be settled, and positions will be restored once the adjustment is complete. Bot positions and regular positions face very different outcomes in this adjustment. I’ve made a similar mistake myself in the past: for convenience, I entrusted all my funds to an automated strategy, didn’t notice an announcement about a ticker or rule change, and by the time I realized what had happened, my positions were already gone. The lesson this time is straightforward: for any pre-market contract whose ticker could still change, check announcements regularly for planned adjustments, renamings, or changes in contract size. Don’t just set it up and leave it unattended.
Back to the market: the token that has really been making the hot lists these past two days is $ASTER , down 14.0% over 24 hours, with a current price of 0.5336. Some community members say holders have taken heavy losses, and there are also unverified rumors involving market makers and the founder. $AVAX , in the same sector, fell 3.7% over the same period to 7.204—far less than $ASTER . That suggests this isn’t a synchronized crash across the whole sector; $ASTER has been hit on its own. The daily RSI14 for both tokens is around 30. Over the 30-day range, $ASTER is at just the 22nd percentile and $AVAX at the 14th; both are hovering near recent lows, but $ASTER is falling much faster. Its current 4-hour price is still 12.2% below the moving average, with no recovery in sight.
I lean toward $ASTER remaining weak in the short term, and I won’t readily call a reversal until there are signs that it has bottomed. Its rapid decline, combined with surging volume (24-hour trading volume is 3.5 times the average daily volume of the previous seven days), looks more like panic selling than a shakeout. If $ASTER can reclaim its 4-hour moving average and stop making new lows in this move, then my view will have been wrong. Meanwhile, $BTC itself is down 1.9%, and the total market cap is down 5.1%, with overall sentiment deteriorating. In this environment, it’s even more important to pay attention to risks related to rules and announcements, rather than focusing only on candlestick charts.
#ANT上市前合约调整 #Altcoins fall across the board
The process is clearer when broken down: between 16:30 and 19:00, trading and settlement for this contract will be suspended, and all open take-profit and stop-loss orders will be canceled. Regular manually held positions won’t be wiped out like bot positions; unrealized profits and losses will first be settled, and positions will be restored once the adjustment is complete. Bot positions and regular positions face very different outcomes in this adjustment. I’ve made a similar mistake myself in the past: for convenience, I entrusted all my funds to an automated strategy, didn’t notice an announcement about a ticker or rule change, and by the time I realized what had happened, my positions were already gone. The lesson this time is straightforward: for any pre-market contract whose ticker could still change, check announcements regularly for planned adjustments, renamings, or changes in contract size. Don’t just set it up and leave it unattended.
Back to the market: the token that has really been making the hot lists these past two days is $ASTER , down 14.0% over 24 hours, with a current price of 0.5336. Some community members say holders have taken heavy losses, and there are also unverified rumors involving market makers and the founder. $AVAX , in the same sector, fell 3.7% over the same period to 7.204—far less than $ASTER . That suggests this isn’t a synchronized crash across the whole sector; $ASTER has been hit on its own. The daily RSI14 for both tokens is around 30. Over the 30-day range, $ASTER is at just the 22nd percentile and $AVAX at the 14th; both are hovering near recent lows, but $ASTER is falling much faster. Its current 4-hour price is still 12.2% below the moving average, with no recovery in sight.
I lean toward $ASTER remaining weak in the short term, and I won’t readily call a reversal until there are signs that it has bottomed. Its rapid decline, combined with surging volume (24-hour trading volume is 3.5 times the average daily volume of the previous seven days), looks more like panic selling than a shakeout. If $ASTER can reclaim its 4-hour moving average and stop making new lows in this move, then my view will have been wrong. Meanwhile, $BTC itself is down 1.9%, and the total market cap is down 5.1%, with overall sentiment deteriorating. In this environment, it’s even more important to pay attention to risks related to rules and announcements, rather than focusing only on candlestick charts.
#ANT上市前合约调整 #Altcoins fall across the board
16
·
--
$ZEC is trending tonight, with over 230,000 in 24-hour buzz, but sentiment is labeled as leaning negative. That contrast itself is worth thinking about: the price is rising, while the discussion is bearish, which suggests this rebound is probably not a reversal.
As of 20:43, $ZEC is trading at 923.8, up 3.6% over 24 hours. It looks like the decline may have paused, but looking at a longer timeframe tells a different story: it's down 23.9% over 7 days and 19.6% over 30 days. The current price is still below the daily MA7, MA25, and MA99, by 5.6%, 21.0%, and 16.2%, respectively. Its 30-day range is 801.5 to 1398, and the current price sits just within the bottom 20% of that range. In this kind of setup, a one-day rebound looks more like a technical recovery after a sharp decline than a trend reversal.
The daily RSI14 is currently 35—not overbought, but not deep into oversold territory either. That suggests bearish pressure hasn't fully run its course, and the market hasn't reached an extreme where a bounce is “due,” so this bullish candle is not very convincing on its own. Some people in the community are saying that whales are adding short positions and watching $800 as a key liquidation level. It's hard to know whether that discussion is accurate, but at least it shows that some market participants are positioning for a further drop, rather than trying to buy the bottom.
When I see a coin surging on the trending list while sentiment remains negative, I usually look at the moving-average setup first, rather than just the 24-hour change. No matter how big the gain is, if the price is still below the MA25 and MA99, I treat it as a rebound, not a reversal. I've learned that the hard way: I once saw a single green 24-hour candle and thought the price had stabilized, but the moving-average resistance hadn't gone away, and the price got knocked right back down.
My take is that $ZEC will likely remain choppy with a downside bias for a while. For now, I'd look to the area around the MA7 at 978.9 as the potential rebound limit; we'll see whether it can break through and hold above it. If it later breaks above the MA25 at 1170 on strong volume, or firmly gets above today's high of 930.5 without falling back, then my bearish-leaning view will be wrong, and I'll admit it.
#ZEC #Cryptocurrency
$ZEC is trending tonight, with over 230,000 in 24-hour buzz, but sentiment is labeled as leaning negative. That contrast itself is worth thinking about: the price is rising, while the discussion is bearish, which suggests this rebound is probably not a reversal.
As of 20:43, $ZEC is trading at 923.8, up 3.6% over 24 hours. It looks like the decline may have paused, but looking at a longer timeframe tells a different story: it's down 23.9% over 7 days and 19.6% over 30 days. The current price is still below the daily MA7, MA25, and MA99, by 5.6%, 21.0%, and 16.2%, respectively. Its 30-day range is 801.5 to 1398, and the current price sits just within the bottom 20% of that range. In this kind of setup, a one-day rebound looks more like a technical recovery after a sharp decline than a trend reversal.
The daily RSI14 is currently 35—not overbought, but not deep into oversold territory either. That suggests bearish pressure hasn't fully run its course, and the market hasn't reached an extreme where a bounce is “due,” so this bullish candle is not very convincing on its own. Some people in the community are saying that whales are adding short positions and watching $800 as a key liquidation level. It's hard to know whether that discussion is accurate, but at least it shows that some market participants are positioning for a further drop, rather than trying to buy the bottom.
When I see a coin surging on the trending list while sentiment remains negative, I usually look at the moving-average setup first, rather than just the 24-hour change. No matter how big the gain is, if the price is still below the MA25 and MA99, I treat it as a rebound, not a reversal. I've learned that the hard way: I once saw a single green 24-hour candle and thought the price had stabilized, but the moving-average resistance hadn't gone away, and the price got knocked right back down.
My take is that $ZEC will likely remain choppy with a downside bias for a while. For now, I'd look to the area around the MA7 at 978.9 as the potential rebound limit; we'll see whether it can break through and hold above it. If it later breaks above the MA25 at 1170 on strong volume, or firmly gets above today's high of 930.5 without falling back, then my bearish-leaning view will be wrong, and I'll admit it.
#ZEC #Cryptocurrency
As of 20:43, $ZEC is trading at 923.8, up 3.6% over 24 hours. It looks like the decline may have paused, but looking at a longer timeframe tells a different story: it's down 23.9% over 7 days and 19.6% over 30 days. The current price is still below the daily MA7, MA25, and MA99, by 5.6%, 21.0%, and 16.2%, respectively. Its 30-day range is 801.5 to 1398, and the current price sits just within the bottom 20% of that range. In this kind of setup, a one-day rebound looks more like a technical recovery after a sharp decline than a trend reversal.
The daily RSI14 is currently 35—not overbought, but not deep into oversold territory either. That suggests bearish pressure hasn't fully run its course, and the market hasn't reached an extreme where a bounce is “due,” so this bullish candle is not very convincing on its own. Some people in the community are saying that whales are adding short positions and watching $800 as a key liquidation level. It's hard to know whether that discussion is accurate, but at least it shows that some market participants are positioning for a further drop, rather than trying to buy the bottom.
When I see a coin surging on the trending list while sentiment remains negative, I usually look at the moving-average setup first, rather than just the 24-hour change. No matter how big the gain is, if the price is still below the MA25 and MA99, I treat it as a rebound, not a reversal. I've learned that the hard way: I once saw a single green 24-hour candle and thought the price had stabilized, but the moving-average resistance hadn't gone away, and the price got knocked right back down.
My take is that $ZEC will likely remain choppy with a downside bias for a while. For now, I'd look to the area around the MA7 at 978.9 as the potential rebound limit; we'll see whether it can break through and hold above it. If it later breaks above the MA25 at 1170 on strong volume, or firmly gets above today's high of 930.5 without falling back, then my bearish-leaning view will be wrong, and I'll admit it.
#ZEC #Cryptocurrency
487
·
--
Reports say market maker B2C2 is selling $LINK in batches, and at a faster pace than before. Its addresses are now almost completely cleared out, with only around 1,445 tokens left, worth about $13,000. During the sharp drop that same day, it also transferred altcoins such as $BNB, MORPHO, PEPE, and ONDO to OKX, Binance, and Coinbase, apparently to sell. My core take is that a market maker actively reducing its inventory to almost zero is a signal worth watching more closely than retail sentiment indicators. When a market maker is willing to give up the spread to reduce exposure, it often means its outlook for short-term liquidity and volatility is negative. These moves generally come before price action, rather than following it.
But there’s a pitfall I should keep in mind: transferring tokens to an exchange doesn’t necessarily mean they’ll all be sold. It could also be a wallet transfer, a hedge, or an adjustment related to other products. Directly interpreting “transferred to an exchange” as a “bearish signal” can lead to overreading the situation. I’ve learned that the hard way before—seeing a large transfer and jumping to conclusions, only to find out later that it was just funds being moved around. So this kind of news should only be treated as something to watch, not as a definitive conclusion.
Back to the market: $BNB is currently at 596.5, down 3.6% over 24 hours, 12.9% over 7 days, and 17.3% over 30 days. On the daily chart, it’s below the MA7, MA25, and MA99, while RSI14 is just 26, close to oversold territory. $LINK, in the same sector, is currently at 9.232, down 4.3% over 24 hours and 25.2% over 30 days—a steeper decline than BNB. Both are moving down in the same direction, but LINK is falling harder. This suggests that market makers and capital are applying broad pressure to altcoins in this sell-off, with the sector differing in the scale of declines, not their direction. The trending topics include narratives around BNB Chain asset reserves, real estate tokenization, and lending vaults. Sentiment is positive, but prices haven’t followed suit, further confirming that technical factors and selling pressure are still driving the short-term trend, and narratives aren’t enough to support the market for now.
As of 17:52, I expect BNB to remain weak and choppy in the near term. Trading volume at 1.8 times the average of the past 7 days suggests selling pressure hasn’t eased significantly, and an RSI of 26 is still not at an extreme level where a rebound is likely. If the price can stabilize and move back above the MA7, I’ll need to revise my view. But if it breaks below this 24-hour period’s low of 566, then my directional call was wrong.
#B2C2减仓LINK #ExchangeToken
Reports say market maker B2C2 is selling $LINK in batches, and at a faster pace than before. Its addresses are now almost completely cleared out, with only around 1,445 tokens left, worth about $13,000. During the sharp drop that same day, it also transferred altcoins such as $BNB , MORPHO, PEPE, and ONDO to OKX, Binance, and Coinbase, apparently to sell. My core take is that a market maker actively reducing its inventory to almost zero is a signal worth watching more closely than retail sentiment indicators. When a market maker is willing to give up the spread to reduce exposure, it often means its outlook for short-term liquidity and volatility is negative. These moves generally come before price action, rather than following it.
But there’s a pitfall I should keep in mind: transferring tokens to an exchange doesn’t necessarily mean they’ll all be sold. It could also be a wallet transfer, a hedge, or an adjustment related to other products. Directly interpreting “transferred to an exchange” as a “bearish signal” can lead to overreading the situation. I’ve learned that the hard way before—seeing a large transfer and jumping to conclusions, only to find out later that it was just funds being moved around. So this kind of news should only be treated as something to watch, not as a definitive conclusion.
Back to the market: $BNB is currently at 596.5, down 3.6% over 24 hours, 12.9% over 7 days, and 17.3% over 30 days. On the daily chart, it’s below the MA7, MA25, and MA99, while RSI14 is just 26, close to oversold territory. $LINK , in the same sector, is currently at 9.232, down 4.3% over 24 hours and 25.2% over 30 days—a steeper decline than BNB. Both are moving down in the same direction, but LINK is falling harder. This suggests that market makers and capital are applying broad pressure to altcoins in this sell-off, with the sector differing in the scale of declines, not their direction. The trending topics include narratives around BNB Chain asset reserves, real estate tokenization, and lending vaults. Sentiment is positive, but prices haven’t followed suit, further confirming that technical factors and selling pressure are still driving the short-term trend, and narratives aren’t enough to support the market for now.
As of 17:52, I expect BNB to remain weak and choppy in the near term. Trading volume at 1.8 times the average of the past 7 days suggests selling pressure hasn’t eased significantly, and an RSI of 26 is still not at an extreme level where a rebound is likely. If the price can stabilize and move back above the MA7, I’ll need to revise my view. But if it breaks below this 24-hour period’s low of 566, then my directional call was wrong.
#B2C2减仓LINK #ExchangeToken
But there’s a pitfall I should keep in mind: transferring tokens to an exchange doesn’t necessarily mean they’ll all be sold. It could also be a wallet transfer, a hedge, or an adjustment related to other products. Directly interpreting “transferred to an exchange” as a “bearish signal” can lead to overreading the situation. I’ve learned that the hard way before—seeing a large transfer and jumping to conclusions, only to find out later that it was just funds being moved around. So this kind of news should only be treated as something to watch, not as a definitive conclusion.
Back to the market: $BNB is currently at 596.5, down 3.6% over 24 hours, 12.9% over 7 days, and 17.3% over 30 days. On the daily chart, it’s below the MA7, MA25, and MA99, while RSI14 is just 26, close to oversold territory. $LINK , in the same sector, is currently at 9.232, down 4.3% over 24 hours and 25.2% over 30 days—a steeper decline than BNB. Both are moving down in the same direction, but LINK is falling harder. This suggests that market makers and capital are applying broad pressure to altcoins in this sell-off, with the sector differing in the scale of declines, not their direction. The trending topics include narratives around BNB Chain asset reserves, real estate tokenization, and lending vaults. Sentiment is positive, but prices haven’t followed suit, further confirming that technical factors and selling pressure are still driving the short-term trend, and narratives aren’t enough to support the market for now.
As of 17:52, I expect BNB to remain weak and choppy in the near term. Trading volume at 1.8 times the average of the past 7 days suggests selling pressure hasn’t eased significantly, and an RSI of 26 is still not at an extreme level where a rebound is likely. If the price can stabilize and move back above the MA7, I’ll need to revise my view. But if it breaks below this 24-hour period’s low of 566, then my directional call was wrong.
#B2C2减仓LINK #ExchangeToken
1.1k
·
--
$BNB has fallen to around 594.8 this time. There’s been a lot of discussion about it on the trending list, but what’s really worth examining is its relationship with $BTC: the two have moved almost in lockstep, with neither showing noticeably more resilience. This suggests that BNB’s decline is mainly due to systemic selling pressure from the broader market, rather than some problem specific to exchange tokens.
One of the simplest ways to tell whether a coin is facing systemic risk or has a problem of its own is to compare it with another coin in the same sector and see whether they’re moving in the same direction. BNB is down 3.8% over 24 hours, while BTC is down 3.2%. Their 7-day and 30-day declines are also broadly in sync (BNB is down 13.2% and 17.6%, while BTC is down 13.4% and 20.6%), showing a high degree of directional alignment. As long as this relationship holds, don’t treat BNB as an isolated event and look for a reason unique to it. The broader market’s sentiment is most likely driving the move.
Looking at the technicals, BNB’s daily RSI14 is now at 26, while BTC’s is at 22. Both are in traditionally oversold territory (below 30). There’s a common trap here: people see the RSI drop below 30 and assume the bottom is in, then try to buy the dip or even use high leverage to bet on a rebound. But an asset can stay oversold for a long time, especially when the moving averages are clearly bearishly aligned. BNB’s current price is 7.8% below the MA7, 14.6% below the MA25, and 16.6% below the MA99. All three moving averages are above the price. In this kind of setup, a low RSI doesn’t mean a rebound is imminent. The price is more likely to make a new low, enter a lower range, and then spend some time moving sideways.
I once ran a simulation using SOL’s 1-second candles: every 10 seconds, I opened one long and one short position at the same time, used 1,000x leverage, and held them for 5 minutes. The result was that 42% of the trades hit the liquidation level first. Before fees, the expected return was basically zero; after fees, every trade was negative. Adding a take-profit made the expected return even worse. The lesson I took from this is that during extreme volatility, getting the direction right isn’t even the first hurdle—the biggest risk is getting taken out by the volatility itself. The same principle applies now, with both BNB and BTC fluctuating in oversold territory: there’s nothing wrong with betting on a rebound, but at levels like these, high leverage is more likely to get stopped out by a sudden wick. It has little to do with whether your market call is right.
The data shows BNB’s 30-day range is 566.0 to 762.2, and its current price of 594.8 is only 15% of the way up from the bottom of that range. Trading volume has also risen to 1.8 times the average daily volume of the previous seven days, indicating a high-volume decline rather than a slow drift down on low volume. I’m inclined to think BNB will remain weak for a while. An oversold RSI alone isn’t a reason to expect an immediate reversal. If BNB reclaims the MA7 around 645 on strong volume, I’ll have to admit this bearish view was wrong. If it continues to break below this cycle’s low of 566, that would confirm the current view.
#BNB #RSI超卖 #Bitcoin
$BNB has fallen to around 594.8 this time. There’s been a lot of discussion about it on the trending list, but what’s really worth examining is its relationship with $BTC : the two have moved almost in lockstep, with neither showing noticeably more resilience. This suggests that BNB’s decline is mainly due to systemic selling pressure from the broader market, rather than some problem specific to exchange tokens.
One of the simplest ways to tell whether a coin is facing systemic risk or has a problem of its own is to compare it with another coin in the same sector and see whether they’re moving in the same direction. BNB is down 3.8% over 24 hours, while BTC is down 3.2%. Their 7-day and 30-day declines are also broadly in sync (BNB is down 13.2% and 17.6%, while BTC is down 13.4% and 20.6%), showing a high degree of directional alignment. As long as this relationship holds, don’t treat BNB as an isolated event and look for a reason unique to it. The broader market’s sentiment is most likely driving the move.
Looking at the technicals, BNB’s daily RSI14 is now at 26, while BTC’s is at 22. Both are in traditionally oversold territory (below 30). There’s a common trap here: people see the RSI drop below 30 and assume the bottom is in, then try to buy the dip or even use high leverage to bet on a rebound. But an asset can stay oversold for a long time, especially when the moving averages are clearly bearishly aligned. BNB’s current price is 7.8% below the MA7, 14.6% below the MA25, and 16.6% below the MA99. All three moving averages are above the price. In this kind of setup, a low RSI doesn’t mean a rebound is imminent. The price is more likely to make a new low, enter a lower range, and then spend some time moving sideways.
I once ran a simulation using SOL’s 1-second candles: every 10 seconds, I opened one long and one short position at the same time, used 1,000x leverage, and held them for 5 minutes. The result was that 42% of the trades hit the liquidation level first. Before fees, the expected return was basically zero; after fees, every trade was negative. Adding a take-profit made the expected return even worse. The lesson I took from this is that during extreme volatility, getting the direction right isn’t even the first hurdle—the biggest risk is getting taken out by the volatility itself. The same principle applies now, with both BNB and BTC fluctuating in oversold territory: there’s nothing wrong with betting on a rebound, but at levels like these, high leverage is more likely to get stopped out by a sudden wick. It has little to do with whether your market call is right.
The data shows BNB’s 30-day range is 566.0 to 762.2, and its current price of 594.8 is only 15% of the way up from the bottom of that range. Trading volume has also risen to 1.8 times the average daily volume of the previous seven days, indicating a high-volume decline rather than a slow drift down on low volume. I’m inclined to think BNB will remain weak for a while. An oversold RSI alone isn’t a reason to expect an immediate reversal. If BNB reclaims the MA7 around 645 on strong volume, I’ll have to admit this bearish view was wrong. If it continues to break below this cycle’s low of 566, that would confirm the current view.
#BNB #RSI超卖 #Bitcoin
One of the simplest ways to tell whether a coin is facing systemic risk or has a problem of its own is to compare it with another coin in the same sector and see whether they’re moving in the same direction. BNB is down 3.8% over 24 hours, while BTC is down 3.2%. Their 7-day and 30-day declines are also broadly in sync (BNB is down 13.2% and 17.6%, while BTC is down 13.4% and 20.6%), showing a high degree of directional alignment. As long as this relationship holds, don’t treat BNB as an isolated event and look for a reason unique to it. The broader market’s sentiment is most likely driving the move.
Looking at the technicals, BNB’s daily RSI14 is now at 26, while BTC’s is at 22. Both are in traditionally oversold territory (below 30). There’s a common trap here: people see the RSI drop below 30 and assume the bottom is in, then try to buy the dip or even use high leverage to bet on a rebound. But an asset can stay oversold for a long time, especially when the moving averages are clearly bearishly aligned. BNB’s current price is 7.8% below the MA7, 14.6% below the MA25, and 16.6% below the MA99. All three moving averages are above the price. In this kind of setup, a low RSI doesn’t mean a rebound is imminent. The price is more likely to make a new low, enter a lower range, and then spend some time moving sideways.
I once ran a simulation using SOL’s 1-second candles: every 10 seconds, I opened one long and one short position at the same time, used 1,000x leverage, and held them for 5 minutes. The result was that 42% of the trades hit the liquidation level first. Before fees, the expected return was basically zero; after fees, every trade was negative. Adding a take-profit made the expected return even worse. The lesson I took from this is that during extreme volatility, getting the direction right isn’t even the first hurdle—the biggest risk is getting taken out by the volatility itself. The same principle applies now, with both BNB and BTC fluctuating in oversold territory: there’s nothing wrong with betting on a rebound, but at levels like these, high leverage is more likely to get stopped out by a sudden wick. It has little to do with whether your market call is right.
The data shows BNB’s 30-day range is 566.0 to 762.2, and its current price of 594.8 is only 15% of the way up from the bottom of that range. Trading volume has also risen to 1.8 times the average daily volume of the previous seven days, indicating a high-volume decline rather than a slow drift down on low volume. I’m inclined to think BNB will remain weak for a while. An oversold RSI alone isn’t a reason to expect an immediate reversal. If BNB reclaims the MA7 around 645 on strong volume, I’ll have to admit this bearish view was wrong. If it continues to break below this cycle’s low of 566, that would confirm the current view.
#BNB #RSI超卖 #Bitcoin
245
·
--
$DOGE fell 7.4% over the past 24 hours, and in the process sent itself trending. What’s worth thinking about here isn’t the size of the drop, but how we should tell whether this is really a bottoming signal. Fellow meme coins $SHIB and $PEPE fell 6.9% and 8.8%, respectively. All three coins are down within a similar range, suggesting this is a sector-wide sell-off rather than bad news specific to any one coin. It’s important to establish that first; otherwise, it’s easy to waste time speculating about news affecting just one coin.
I learned this lesson the hard way while running quantitative tests, and I now apply the same logic when looking at the market. At the time, using the same strategy with the default shared parameters, all 18 nearby parameter sets produced positive out-of-sample results, making the strategy look very robust. But after switching to adjusted shared parameters, only 61% of the 900 parameter sets were positive, and the median Sharpe ratio was just 0.13. The takeaway is that a strategy that only looks good with one set of parameters can’t be trusted. The surrounding parameter sets must also perform reasonably well to show that the pattern is real, rather than a one-off lucky guess.
Applying this logic to DOGE now, we shouldn’t judge whether the oversold signal is reliable based on DOGE alone. DOGE’s daily RSI(14) is 23. Looking at that one number, it might seem to have fallen far enough, but SHIB is at 26 and PEPE at 38. These three “neighbors” are all pointing in the same direction and sitting in relatively low territory, which lends support to the oversold assessment rather than leaving DOGE as a lone outlier. Conversely, if one day DOGE were the only one showing oversold conditions while SHIB and PEPE had normal RSI readings, I’d be more inclined to wonder whether something else was going on with DOGE itself, and would be extra cautious.
My current view is that DOGE will likely move sideways first. The price has already fallen to 11% of its 30-day range, while trading volume has expanded to 2.1 times the average for the previous seven days. This suggests that leveraged positions and panic selling are being flushed out in this area, making it less likely that the price will keep falling at the same pace in the short term. But all three moving averages are still overhead, so the trend hasn’t truly reversed. I wouldn’t call the outlook bullish; I’d only say to watch for stabilization. If the price breaks below this 24-hour period’s low of 0.05543 and continues falling, that would show my assessment—that the “neighboring data supports the oversold signal”—was wrong, and I’d own that.
$DOGE fell 7.4% over the past 24 hours, and in the process sent itself trending. What’s worth thinking about here isn’t the size of the drop, but how we should tell whether this is really a bottoming signal. Fellow meme coins $SHIB and $PEPE fell 6.9% and 8.8%, respectively. All three coins are down within a similar range, suggesting this is a sector-wide sell-off rather than bad news specific to any one coin. It’s important to establish that first; otherwise, it’s easy to waste time speculating about news affecting just one coin.
I learned this lesson the hard way while running quantitative tests, and I now apply the same logic when looking at the market. At the time, using the same strategy with the default shared parameters, all 18 nearby parameter sets produced positive out-of-sample results, making the strategy look very robust. But after switching to adjusted shared parameters, only 61% of the 900 parameter sets were positive, and the median Sharpe ratio was just 0.13. The takeaway is that a strategy that only looks good with one set of parameters can’t be trusted. The surrounding parameter sets must also perform reasonably well to show that the pattern is real, rather than a one-off lucky guess.
Applying this logic to DOGE now, we shouldn’t judge whether the oversold signal is reliable based on DOGE alone. DOGE’s daily RSI(14) is 23. Looking at that one number, it might seem to have fallen far enough, but SHIB is at 26 and PEPE at 38. These three “neighbors” are all pointing in the same direction and sitting in relatively low territory, which lends support to the oversold assessment rather than leaving DOGE as a lone outlier. Conversely, if one day DOGE were the only one showing oversold conditions while SHIB and PEPE had normal RSI readings, I’d be more inclined to wonder whether something else was going on with DOGE itself, and would be extra cautious.
My current view is that DOGE will likely move sideways first. The price has already fallen to 11% of its 30-day range, while trading volume has expanded to 2.1 times the average for the previous seven days. This suggests that leveraged positions and panic selling are being flushed out in this area, making it less likely that the price will keep falling at the same pace in the short term. But all three moving averages are still overhead, so the trend hasn’t truly reversed. I wouldn’t call the outlook bullish; I’d only say to watch for stabilization. If the price breaks below this 24-hour period’s low of 0.05543 and continues falling, that would show my assessment—that the “neighboring data supports the oversold signal”—was wrong, and I’d own that.
I learned this lesson the hard way while running quantitative tests, and I now apply the same logic when looking at the market. At the time, using the same strategy with the default shared parameters, all 18 nearby parameter sets produced positive out-of-sample results, making the strategy look very robust. But after switching to adjusted shared parameters, only 61% of the 900 parameter sets were positive, and the median Sharpe ratio was just 0.13. The takeaway is that a strategy that only looks good with one set of parameters can’t be trusted. The surrounding parameter sets must also perform reasonably well to show that the pattern is real, rather than a one-off lucky guess.
Applying this logic to DOGE now, we shouldn’t judge whether the oversold signal is reliable based on DOGE alone. DOGE’s daily RSI(14) is 23. Looking at that one number, it might seem to have fallen far enough, but SHIB is at 26 and PEPE at 38. These three “neighbors” are all pointing in the same direction and sitting in relatively low territory, which lends support to the oversold assessment rather than leaving DOGE as a lone outlier. Conversely, if one day DOGE were the only one showing oversold conditions while SHIB and PEPE had normal RSI readings, I’d be more inclined to wonder whether something else was going on with DOGE itself, and would be extra cautious.
My current view is that DOGE will likely move sideways first. The price has already fallen to 11% of its 30-day range, while trading volume has expanded to 2.1 times the average for the previous seven days. This suggests that leveraged positions and panic selling are being flushed out in this area, making it less likely that the price will keep falling at the same pace in the short term. But all three moving averages are still overhead, so the trend hasn’t truly reversed. I wouldn’t call the outlook bullish; I’d only say to watch for stabilization. If the price breaks below this 24-hour period’s low of 0.05543 and continues falling, that would show my assessment—that the “neighboring data supports the oversold signal”—was wrong, and I’d own that.
805
·
--
According to reports, Unocoin detected that 3 of its more than 20 operational hot wallets had been compromised, with estimated losses of around $200,000. The company said it would fully cover users’ losses. My take: this incident once again shows that security at the exchange level is never a question of “whether to take it seriously,” but rather “how much exposure is sitting in hot wallets.” Only 3 of more than 20 hot wallets were affected, which isn’t an especially alarming proportion. But the fact that 3 could be breached suggests there are likely systemic flaws in access controls and monitoring, rather than this being an isolated accident. Full compensation is the right way to handle the crisis and can help maintain user trust, but compensation itself does nothing to address the attack vector. Without disclosure of the specific method used, outsiders can’t tell whether this was phishing, poor private-key management, or a system vulnerability—and that is the biggest uncertainty. When assessing a platform’s security in the future, I’ll pay attention to one more factor: the number of its hot wallets and their share of total assets. The lower that share, the smaller the actual impact of any single incident on users.
This incident isn’t directly bearish for payment-focused assets like $XRP, but given the current market environment, sentiment is clearly spreading from one asset to another. $XRP is currently at 0.9530, down 7.2% over 24 hours and already below the psychological $1 level. On the daily chart, the price is below the MA7, MA25, and MA99, and sits in the bottom 2% of its 30-day range—almost scraping along the floor. The daily RSI14 is just 18, putting it in fairly extreme oversold territory. $XLM, in the same sector, is moving in near lockstep, also down 9.0% over 24 hours, with an RSI14 of 27. The two have risen and fallen together this time, with no divergence, suggesting this decline is driven more by broad market weakness than by any specific problem with XRP. The community is discussing weekly net outflows from spot $XRP ETFs, and sentiment is negative, while attention is rising. This combination of “falling prices but high interest” usually signals growing disagreement.
Taking these signals together, I lean toward $XRP remaining weak for a while: all the moving averages are acting as resistance, ETF funds are flowing out, and broader market sentiment is poor, so the foundation for a rebound isn’t strong enough. But with the RSI14 down to 18, a short-term technical bounce wouldn’t be surprising. If it does bounce and moves back above the MA7, I’ll have to admit my bearish view was wrong. Returning to the incident mentioned at the start, news about hot wallets being hacked won’t determine the direction of coin prices in the short term, but it does remind me of one thing: when choosing a platform for long-term crypto holdings, its security record and ability to compensate users deserve as much scrutiny as the market itself.
#交易所热钱包安全 #Cryptocurrency market
According to reports, Unocoin detected that 3 of its more than 20 operational hot wallets had been compromised, with estimated losses of around $200,000. The company said it would fully cover users’ losses. My take: this incident once again shows that security at the exchange level is never a question of “whether to take it seriously,” but rather “how much exposure is sitting in hot wallets.” Only 3 of more than 20 hot wallets were affected, which isn’t an especially alarming proportion. But the fact that 3 could be breached suggests there are likely systemic flaws in access controls and monitoring, rather than this being an isolated accident. Full compensation is the right way to handle the crisis and can help maintain user trust, but compensation itself does nothing to address the attack vector. Without disclosure of the specific method used, outsiders can’t tell whether this was phishing, poor private-key management, or a system vulnerability—and that is the biggest uncertainty. When assessing a platform’s security in the future, I’ll pay attention to one more factor: the number of its hot wallets and their share of total assets. The lower that share, the smaller the actual impact of any single incident on users.
This incident isn’t directly bearish for payment-focused assets like $XRP , but given the current market environment, sentiment is clearly spreading from one asset to another. $XRP is currently at 0.9530, down 7.2% over 24 hours and already below the psychological $1 level. On the daily chart, the price is below the MA7, MA25, and MA99, and sits in the bottom 2% of its 30-day range—almost scraping along the floor. The daily RSI14 is just 18, putting it in fairly extreme oversold territory. $XLM , in the same sector, is moving in near lockstep, also down 9.0% over 24 hours, with an RSI14 of 27. The two have risen and fallen together this time, with no divergence, suggesting this decline is driven more by broad market weakness than by any specific problem with XRP. The community is discussing weekly net outflows from spot $XRP ETFs, and sentiment is negative, while attention is rising. This combination of “falling prices but high interest” usually signals growing disagreement.
Taking these signals together, I lean toward $XRP remaining weak for a while: all the moving averages are acting as resistance, ETF funds are flowing out, and broader market sentiment is poor, so the foundation for a rebound isn’t strong enough. But with the RSI14 down to 18, a short-term technical bounce wouldn’t be surprising. If it does bounce and moves back above the MA7, I’ll have to admit my bearish view was wrong. Returning to the incident mentioned at the start, news about hot wallets being hacked won’t determine the direction of coin prices in the short term, but it does remind me of one thing: when choosing a platform for long-term crypto holdings, its security record and ability to compensate users deserve as much scrutiny as the market itself.
#交易所热钱包安全 #Cryptocurrency market
This incident isn’t directly bearish for payment-focused assets like $XRP , but given the current market environment, sentiment is clearly spreading from one asset to another. $XRP is currently at 0.9530, down 7.2% over 24 hours and already below the psychological $1 level. On the daily chart, the price is below the MA7, MA25, and MA99, and sits in the bottom 2% of its 30-day range—almost scraping along the floor. The daily RSI14 is just 18, putting it in fairly extreme oversold territory. $XLM , in the same sector, is moving in near lockstep, also down 9.0% over 24 hours, with an RSI14 of 27. The two have risen and fallen together this time, with no divergence, suggesting this decline is driven more by broad market weakness than by any specific problem with XRP. The community is discussing weekly net outflows from spot $XRP ETFs, and sentiment is negative, while attention is rising. This combination of “falling prices but high interest” usually signals growing disagreement.
Taking these signals together, I lean toward $XRP remaining weak for a while: all the moving averages are acting as resistance, ETF funds are flowing out, and broader market sentiment is poor, so the foundation for a rebound isn’t strong enough. But with the RSI14 down to 18, a short-term technical bounce wouldn’t be surprising. If it does bounce and moves back above the MA7, I’ll have to admit my bearish view was wrong. Returning to the incident mentioned at the start, news about hot wallets being hacked won’t determine the direction of coin prices in the short term, but it does remind me of one thing: when choosing a platform for long-term crypto holdings, its security record and ability to compensate users deserve as much scrutiny as the market itself.
#交易所热钱包安全 #Cryptocurrency market
371
·
--
As of 22:02, $DOGE is down 6.1% today and has also made the trending list, with 24-hour popularity of 109,800. Sentiment is leaning negative, so this combination is worth unpacking. First, the current price is 0.06195, still at the very bottom of its 30-day range (0.06166 to 0.08380), just 1% above the lower bound. The daily RSI14 is at 23, close to the oversold threshold. But that number alone isn’t enough to say the trend is about to reverse, because all three moving averages—MA7, MA25, and MA99—are above the current price by 7.3%, 15.9%, and 24.6%, respectively. This is a textbook bearish alignment. Until price gets back above at least one of them, oversold just means the price has fallen fast, not that it can’t fall further.
It’s more interesting to compare it with $PEPE in the same sector. The two coins moved in the same direction today: PEPE fell 7.7%, an even steeper drop than DOGE’s. But looking at the 30-day period, PEPE is still up 2.7%, and its current price is at the 23% mark of its 30-day range, well above DOGE’s 1%. Its daily RSI14 is also at 42, which isn’t particularly weak. In other words, today’s move was a correlated sell-off driven by overall market sentiment. Moving up and down together only shows that sentiment across the sector is aligned; it doesn’t mean the two assets have the same structure. That’s the trap in correlated market moves: focusing only on who’s up or down over 24 hours can lump genuinely deteriorating coins together with those dragged down by sentiment. Comparing their positions in the 30-day range and their moving-average alignments is what helps distinguish coins that are truly falling from those simply following the move.
Some people in the community are discussing how DogeOS is about to launch on mainnet, saying the audits have all passed and more than 100 builders are already working on it. But this news hasn’t shown up in the price at all so far. The current price is still hovering near its 30-day low. When the fundamental narrative and the price action are disconnected, I’m more inclined to trust the price action.
My view is bearish, for the reasons above: the moving averages are bearishly aligned, the price is at the bottom of its range, and social sentiment is negative. All three signals point in the same direction. If it later rebounds and holds above MA7, around 0.0668, I’ll admit this view was wrong.
As of 22:02, $DOGE is down 6.1% today and has also made the trending list, with 24-hour popularity of 109,800. Sentiment is leaning negative, so this combination is worth unpacking. First, the current price is 0.06195, still at the very bottom of its 30-day range (0.06166 to 0.08380), just 1% above the lower bound. The daily RSI14 is at 23, close to the oversold threshold. But that number alone isn’t enough to say the trend is about to reverse, because all three moving averages—MA7, MA25, and MA99—are above the current price by 7.3%, 15.9%, and 24.6%, respectively. This is a textbook bearish alignment. Until price gets back above at least one of them, oversold just means the price has fallen fast, not that it can’t fall further.
It’s more interesting to compare it with $PEPE in the same sector. The two coins moved in the same direction today: PEPE fell 7.7%, an even steeper drop than DOGE’s. But looking at the 30-day period, PEPE is still up 2.7%, and its current price is at the 23% mark of its 30-day range, well above DOGE’s 1%. Its daily RSI14 is also at 42, which isn’t particularly weak. In other words, today’s move was a correlated sell-off driven by overall market sentiment. Moving up and down together only shows that sentiment across the sector is aligned; it doesn’t mean the two assets have the same structure. That’s the trap in correlated market moves: focusing only on who’s up or down over 24 hours can lump genuinely deteriorating coins together with those dragged down by sentiment. Comparing their positions in the 30-day range and their moving-average alignments is what helps distinguish coins that are truly falling from those simply following the move.
Some people in the community are discussing how DogeOS is about to launch on mainnet, saying the audits have all passed and more than 100 builders are already working on it. But this news hasn’t shown up in the price at all so far. The current price is still hovering near its 30-day low. When the fundamental narrative and the price action are disconnected, I’m more inclined to trust the price action.
My view is bearish, for the reasons above: the moving averages are bearishly aligned, the price is at the bottom of its range, and social sentiment is negative. All three signals point in the same direction. If it later rebounds and holds above MA7, around 0.0668, I’ll admit this view was wrong.
It’s more interesting to compare it with $PEPE in the same sector. The two coins moved in the same direction today: PEPE fell 7.7%, an even steeper drop than DOGE’s. But looking at the 30-day period, PEPE is still up 2.7%, and its current price is at the 23% mark of its 30-day range, well above DOGE’s 1%. Its daily RSI14 is also at 42, which isn’t particularly weak. In other words, today’s move was a correlated sell-off driven by overall market sentiment. Moving up and down together only shows that sentiment across the sector is aligned; it doesn’t mean the two assets have the same structure. That’s the trap in correlated market moves: focusing only on who’s up or down over 24 hours can lump genuinely deteriorating coins together with those dragged down by sentiment. Comparing their positions in the 30-day range and their moving-average alignments is what helps distinguish coins that are truly falling from those simply following the move.
Some people in the community are discussing how DogeOS is about to launch on mainnet, saying the audits have all passed and more than 100 builders are already working on it. But this news hasn’t shown up in the price at all so far. The current price is still hovering near its 30-day low. When the fundamental narrative and the price action are disconnected, I’m more inclined to trust the price action.
My view is bearish, for the reasons above: the moving averages are bearishly aligned, the price is at the bottom of its range, and social sentiment is negative. All three signals point in the same direction. If it later rebounds and holds above MA7, around 0.0668, I’ll admit this view was wrong.
1.8k
·
--
$UNI fell 11.2% over the past 24 hours to a current price of 5.265, making it the worst performer in the DeFi sector today. But looking at $HYPE and $ENA alongside it, all three tokens are currently sitting at the 1st percentile of their respective 30-day ranges. In other words, all three are near their lowest levels of the past month. This isn’t a problem unique to UNI; the entire sector was pushed down by the same force at the same time. The broader market fell 6.6% over the past 24 hours, while Bitcoin dropped 4.1% over the same period. UNI’s decline was nearly twice the market’s, showing that its beta has been significantly amplified in this move. When risk appetite contracts, volatile altcoins are the first assets investors cut.
The chart structure supports this view: UNI’s daily MA7 is at 6.252 and MA25 at 6.852, both well above the current price by double-digit percentages. RSI14 is just 30, near oversold territory but not yet at an extreme. On the 4-hour chart, UNI has fallen another 9.8% over the past 24 hours, indicating that the short-term decline is still accelerating, with no signs of stabilization. More importantly, trading volume is 36.7 million USDT over 24 hours, just 0.9 times the daily average over the past 7 days. A decline this steep without a surge in volume suggests this move is driven more by passive selling of existing holdings than by concentrated panic selling. The real washout may not be over yet.
Here’s a practical way to assess sector rotation: when a token drops sharply on its own, don’t rush to look for a problem specific to that token. Pull up two or three other tokens in the same sector and see whether they’re also sitting at the same percentile of their 30-day ranges. If they’re all near the bottom, that points to systemic risk, and there’s little value in fixating on that token’s narrative or tokenomics. It’s worth digging into token-specific issues only when that token alone is at the bottom while others are still in the middle of their ranges.
I lean toward UNI remaining weak in the short term. RSI shows no clear divergence, volume hasn’t produced a signal that the decline is ending, and the gap between MA7 and MA25 is still widening. If UNI can reclaim the 24-hour high of 5.961 on strong volume, I’ll consider this sell-off to be over—and that would mean my call was wrong.
#UNI down about 11% in 24 hours
$UNI fell 11.2% over the past 24 hours to a current price of 5.265, making it the worst performer in the DeFi sector today. But looking at $HYPE and $ENA alongside it, all three tokens are currently sitting at the 1st percentile of their respective 30-day ranges. In other words, all three are near their lowest levels of the past month. This isn’t a problem unique to UNI; the entire sector was pushed down by the same force at the same time. The broader market fell 6.6% over the past 24 hours, while Bitcoin dropped 4.1% over the same period. UNI’s decline was nearly twice the market’s, showing that its beta has been significantly amplified in this move. When risk appetite contracts, volatile altcoins are the first assets investors cut.
The chart structure supports this view: UNI’s daily MA7 is at 6.252 and MA25 at 6.852, both well above the current price by double-digit percentages. RSI14 is just 30, near oversold territory but not yet at an extreme. On the 4-hour chart, UNI has fallen another 9.8% over the past 24 hours, indicating that the short-term decline is still accelerating, with no signs of stabilization. More importantly, trading volume is 36.7 million USDT over 24 hours, just 0.9 times the daily average over the past 7 days. A decline this steep without a surge in volume suggests this move is driven more by passive selling of existing holdings than by concentrated panic selling. The real washout may not be over yet.
Here’s a practical way to assess sector rotation: when a token drops sharply on its own, don’t rush to look for a problem specific to that token. Pull up two or three other tokens in the same sector and see whether they’re also sitting at the same percentile of their 30-day ranges. If they’re all near the bottom, that points to systemic risk, and there’s little value in fixating on that token’s narrative or tokenomics. It’s worth digging into token-specific issues only when that token alone is at the bottom while others are still in the middle of their ranges.
I lean toward UNI remaining weak in the short term. RSI shows no clear divergence, volume hasn’t produced a signal that the decline is ending, and the gap between MA7 and MA25 is still widening. If UNI can reclaim the 24-hour high of 5.961 on strong volume, I’ll consider this sell-off to be over—and that would mean my call was wrong.
#UNI down about 11% in 24 hours
The chart structure supports this view: UNI’s daily MA7 is at 6.252 and MA25 at 6.852, both well above the current price by double-digit percentages. RSI14 is just 30, near oversold territory but not yet at an extreme. On the 4-hour chart, UNI has fallen another 9.8% over the past 24 hours, indicating that the short-term decline is still accelerating, with no signs of stabilization. More importantly, trading volume is 36.7 million USDT over 24 hours, just 0.9 times the daily average over the past 7 days. A decline this steep without a surge in volume suggests this move is driven more by passive selling of existing holdings than by concentrated panic selling. The real washout may not be over yet.
Here’s a practical way to assess sector rotation: when a token drops sharply on its own, don’t rush to look for a problem specific to that token. Pull up two or three other tokens in the same sector and see whether they’re also sitting at the same percentile of their 30-day ranges. If they’re all near the bottom, that points to systemic risk, and there’s little value in fixating on that token’s narrative or tokenomics. It’s worth digging into token-specific issues only when that token alone is at the bottom while others are still in the middle of their ranges.
I lean toward UNI remaining weak in the short term. RSI shows no clear divergence, volume hasn’t produced a signal that the decline is ending, and the gap between MA7 and MA25 is still widening. If UNI can reclaim the 24-hour high of 5.961 on strong volume, I’ll consider this sell-off to be over—and that would mean my call was wrong.
#UNI down about 11% in 24 hours
1.8k
·
--
According to Checkmate, this Bitcoin sell-off has pushed the mean reversion index down to Q18, even below the Q20 deep value zone. But long-term holders have barely budged—and that’s the most important thing to watch in this downturn: the selling is coming from new money that bought near the $80,000 highs. Selling volume has surged from $420 million to $850 million, and more than 80% of it is from those new investors who bought near the top and can no longer stomach their paper losses, not from longtime players heading for the exits.
What does this tell us? This is the fourth capitulation-style sell-off since the all-time high, suggesting the market has been taught this lesson repeatedly: panic comes quickly, but the big players haven’t let go. Most long-term holders are still in profit, and the fact that they aren’t selling is a signal in itself: the bottom structure hasn’t been broken. What’s being flushed out is short-term supply, not confirmation of a trend reversal. But there’s uncertainty here, too: historically, the mean reversion index entering the deep value zone doesn’t mean a rebound is imminent. It just means prices are cheap—and they can get cheaper, especially with selling volume still expanding this time, which suggests selling pressure hasn’t been fully exhausted.
Looking at the market, as of 17:22, $BTC is at 67056, down 2.6% over 24 hours and 18.5% over 30 days. Its price is at just the 3rd percentile of its 30-day range, and the daily RSI14 is only 23. It really does look deeply oversold, in line with the on-chain Q18 reading. $LTC has fallen even harder, down 21.3% over 30 days. Its price is also near the bottom of its 30-day range, at the 2nd percentile, and its RSI14 is 30. Its price action is broadly in sync with $BTC, with no divergence, suggesting this sell-off is sector-wide rather than an issue specific to one coin. Some in the community say about $500 million in long positions have been liquidated in this move. Sentiment is negative, and we may be about to see a sixth consecutive weekly red candle. There’s plenty of discussion, too.
My view is that $BTC remains weak in the short term. The MA7, MA25, and MA99 are all well above the price, with no clear signs of a bottom, so I wouldn’t rush to call this the bottom. But taken together, the fact that long-term holders aren’t selling and the index has entered the deep value zone lead me to see this as a period of supply being flushed out rather than a collapse in the trend. In the medium term, I’m more inclined to expect gradual stabilization than a continued one-way decline. If $BTC goes on to make a new low for this cycle and long-term holders start selling noticeably, that would mean my assessment is wrong, and I’d need to reassess.
#比特币深度价值区 #BTC
According to Checkmate, this Bitcoin sell-off has pushed the mean reversion index down to Q18, even below the Q20 deep value zone. But long-term holders have barely budged—and that’s the most important thing to watch in this downturn: the selling is coming from new money that bought near the $80,000 highs. Selling volume has surged from $420 million to $850 million, and more than 80% of it is from those new investors who bought near the top and can no longer stomach their paper losses, not from longtime players heading for the exits.
What does this tell us? This is the fourth capitulation-style sell-off since the all-time high, suggesting the market has been taught this lesson repeatedly: panic comes quickly, but the big players haven’t let go. Most long-term holders are still in profit, and the fact that they aren’t selling is a signal in itself: the bottom structure hasn’t been broken. What’s being flushed out is short-term supply, not confirmation of a trend reversal. But there’s uncertainty here, too: historically, the mean reversion index entering the deep value zone doesn’t mean a rebound is imminent. It just means prices are cheap—and they can get cheaper, especially with selling volume still expanding this time, which suggests selling pressure hasn’t been fully exhausted.
Looking at the market, as of 17:22, $BTC is at 67056, down 2.6% over 24 hours and 18.5% over 30 days. Its price is at just the 3rd percentile of its 30-day range, and the daily RSI14 is only 23. It really does look deeply oversold, in line with the on-chain Q18 reading. $LTC has fallen even harder, down 21.3% over 30 days. Its price is also near the bottom of its 30-day range, at the 2nd percentile, and its RSI14 is 30. Its price action is broadly in sync with $BTC , with no divergence, suggesting this sell-off is sector-wide rather than an issue specific to one coin. Some in the community say about $500 million in long positions have been liquidated in this move. Sentiment is negative, and we may be about to see a sixth consecutive weekly red candle. There’s plenty of discussion, too.
My view is that $BTC remains weak in the short term. The MA7, MA25, and MA99 are all well above the price, with no clear signs of a bottom, so I wouldn’t rush to call this the bottom. But taken together, the fact that long-term holders aren’t selling and the index has entered the deep value zone lead me to see this as a period of supply being flushed out rather than a collapse in the trend. In the medium term, I’m more inclined to expect gradual stabilization than a continued one-way decline. If $BTC goes on to make a new low for this cycle and long-term holders start selling noticeably, that would mean my assessment is wrong, and I’d need to reassess.
#比特币深度价值区 #BTC
What does this tell us? This is the fourth capitulation-style sell-off since the all-time high, suggesting the market has been taught this lesson repeatedly: panic comes quickly, but the big players haven’t let go. Most long-term holders are still in profit, and the fact that they aren’t selling is a signal in itself: the bottom structure hasn’t been broken. What’s being flushed out is short-term supply, not confirmation of a trend reversal. But there’s uncertainty here, too: historically, the mean reversion index entering the deep value zone doesn’t mean a rebound is imminent. It just means prices are cheap—and they can get cheaper, especially with selling volume still expanding this time, which suggests selling pressure hasn’t been fully exhausted.
Looking at the market, as of 17:22, $BTC is at 67056, down 2.6% over 24 hours and 18.5% over 30 days. Its price is at just the 3rd percentile of its 30-day range, and the daily RSI14 is only 23. It really does look deeply oversold, in line with the on-chain Q18 reading. $LTC has fallen even harder, down 21.3% over 30 days. Its price is also near the bottom of its 30-day range, at the 2nd percentile, and its RSI14 is 30. Its price action is broadly in sync with $BTC , with no divergence, suggesting this sell-off is sector-wide rather than an issue specific to one coin. Some in the community say about $500 million in long positions have been liquidated in this move. Sentiment is negative, and we may be about to see a sixth consecutive weekly red candle. There’s plenty of discussion, too.
My view is that $BTC remains weak in the short term. The MA7, MA25, and MA99 are all well above the price, with no clear signs of a bottom, so I wouldn’t rush to call this the bottom. But taken together, the fact that long-term holders aren’t selling and the index has entered the deep value zone lead me to see this as a period of supply being flushed out rather than a collapse in the trend. In the medium term, I’m more inclined to expect gradual stabilization than a continued one-way decline. If $BTC goes on to make a new low for this cycle and long-term holders start selling noticeably, that would mean my assessment is wrong, and I’d need to reassess.
#比特币深度价值区 #BTC
255
·
--
The most striking thing about $SOL today isn’t its losses—it’s that it’s also trending, with sentiment leaning negative. It’s currently at 75.70, down 5.1% over 24 hours. That’s not even the most alarming part: the daily RSI14 has plunged to 18, it’s down 15.7% over 7 days and 28.2% over 30 days, and its current price ranks in just the bottom 2% of its 30-day range of 74.85 to 109.2. In other words, it has dipped back toward last month’s lows. Trading volume is 280 million USDT, 1.7 times the 7-day daily average, which shows this isn’t a slow decline on falling volume—there’s real money selling and capitulating. There are also reports circulating in the community that a SOL whale’s $9 million position was liquidated. I can’t judge whether that’s true, but at the very least, it suggests there was a relatively concentrated wave of liquidations driving the price down to this level.
The divergence becomes clearer when you look at the same sector. $ETH is down 1.6%, with RSI14 also at 23. It’s likewise below its moving averages across all timeframes and down 22% over 30 days. It’s moving in the same direction as SOL, just at a slightly gentler slope, which suggests this sell-off is a broad Layer 1 sector move rather than a problem unique to SOL. But $TRX is different: it’s up 0.7% over 24 hours, its RSI14 is at 40, and it’s down just 5.9% over 30 days. Its current price is still at the 18th percentile of its 30-day range, making it much more resilient than SOL and ETH. This shows that capital is also differentiating within the sector: higher-volatility coins with heavier leveraged exposure (SOL and ETH) are being hit harder by liquidations, while the less volatile TRX is facing fewer forced liquidations and has fallen less.
As for my outlook, I think SOL will first enter a consolidation phase to look for support, rather than immediately reversing upward. The reason is that RSI14 at 18 is already in extremely oversold territory, and combined with the price being near its 30-day low after a high-volume sell-off, this is a level where we could see a technical pause and choppy trading rather than continued one-way acceleration downward. But I don’t think this marks the start of a reversal: all the moving averages are still overhead, and there’s no talk of a trend shift until the trend improves. If the price breaks below this cycle’s low of 74.85, then my view is wrong—the decline is continuing, not consolidating.
The most striking thing about $SOL today isn’t its losses—it’s that it’s also trending, with sentiment leaning negative. It’s currently at 75.70, down 5.1% over 24 hours. That’s not even the most alarming part: the daily RSI14 has plunged to 18, it’s down 15.7% over 7 days and 28.2% over 30 days, and its current price ranks in just the bottom 2% of its 30-day range of 74.85 to 109.2. In other words, it has dipped back toward last month’s lows. Trading volume is 280 million USDT, 1.7 times the 7-day daily average, which shows this isn’t a slow decline on falling volume—there’s real money selling and capitulating. There are also reports circulating in the community that a SOL whale’s $9 million position was liquidated. I can’t judge whether that’s true, but at the very least, it suggests there was a relatively concentrated wave of liquidations driving the price down to this level.
The divergence becomes clearer when you look at the same sector. $ETH is down 1.6%, with RSI14 also at 23. It’s likewise below its moving averages across all timeframes and down 22% over 30 days. It’s moving in the same direction as SOL, just at a slightly gentler slope, which suggests this sell-off is a broad Layer 1 sector move rather than a problem unique to SOL. But $TRX is different: it’s up 0.7% over 24 hours, its RSI14 is at 40, and it’s down just 5.9% over 30 days. Its current price is still at the 18th percentile of its 30-day range, making it much more resilient than SOL and ETH. This shows that capital is also differentiating within the sector: higher-volatility coins with heavier leveraged exposure (SOL and ETH) are being hit harder by liquidations, while the less volatile TRX is facing fewer forced liquidations and has fallen less.
As for my outlook, I think SOL will first enter a consolidation phase to look for support, rather than immediately reversing upward. The reason is that RSI14 at 18 is already in extremely oversold territory, and combined with the price being near its 30-day low after a high-volume sell-off, this is a level where we could see a technical pause and choppy trading rather than continued one-way acceleration downward. But I don’t think this marks the start of a reversal: all the moving averages are still overhead, and there’s no talk of a trend shift until the trend improves. If the price breaks below this cycle’s low of 74.85, then my view is wrong—the decline is continuing, not consolidating.
The divergence becomes clearer when you look at the same sector. $ETH is down 1.6%, with RSI14 also at 23. It’s likewise below its moving averages across all timeframes and down 22% over 30 days. It’s moving in the same direction as SOL, just at a slightly gentler slope, which suggests this sell-off is a broad Layer 1 sector move rather than a problem unique to SOL. But $TRX is different: it’s up 0.7% over 24 hours, its RSI14 is at 40, and it’s down just 5.9% over 30 days. Its current price is still at the 18th percentile of its 30-day range, making it much more resilient than SOL and ETH. This shows that capital is also differentiating within the sector: higher-volatility coins with heavier leveraged exposure (SOL and ETH) are being hit harder by liquidations, while the less volatile TRX is facing fewer forced liquidations and has fallen less.
As for my outlook, I think SOL will first enter a consolidation phase to look for support, rather than immediately reversing upward. The reason is that RSI14 at 18 is already in extremely oversold territory, and combined with the price being near its 30-day low after a high-volume sell-off, this is a level where we could see a technical pause and choppy trading rather than continued one-way acceleration downward. But I don’t think this marks the start of a reversal: all the moving averages are still overhead, and there’s no talk of a trend shift until the trend improves. If the price breaks below this cycle’s low of 74.85, then my view is wrong—the decline is continuing, not consolidating.
481
·
--
The most noteworthy thing about this latest downturn isn’t the size of the drop itself, but the clash between prices and fundamental data. According to reports, Hyperliquid protocol revenue reached $190.9 million in the third quarter, a new record for any single quarter in 2026. The timing coincides with a 5.8% drop in the crypto market’s total capitalization over 24 hours and a 3.9% decline in $BTC. My take is that this downturn looks more like a concentrated flush-out of leverage and sentiment than a contraction in genuine on-chain demand. Protocol revenue is still hitting new highs, which suggests people are still spending where it counts. Prices are down, not usage.
As of 09:35, $BTC is trading at 68322, down 3.9% over 24 hours, 9.9% over 7 days, and 16.9% over 30 days. Its daily RSI14 is just 25, clearly in oversold territory. $BNB has followed an almost identical path, down 3.7% over 24 hours and 13.5% over 30 days, with an RSI14 of 27. Its moves in sync with $BTC suggest this sell-off is systemic rather than a problem isolated to one sector. $LTC, meanwhile, is more interesting: it’s down just 1.4% over 24 hours and is actually up 2.8% over the past 4 hours. Its position within the 30-day range is also relatively higher. Looking at all three together, $LTC’s resilience and rebound suggest the market isn’t uniformly selling off across the board; some buyers are already testing the waters.
Also, according to reports, Japanese-listed company ASIAN STAR plans to distribute 8 million yen worth of $BNB to shareholders and push ahead with real estate tokenization. This kind of genuine demand from businesses is separate from the panic among traders. It won’t offset price moves in the short term, but it shows that not all market participants are heading for the exits amid the community’s widely shared concerns about “six consecutive bearish weekly candles.” Sentiment in the community is indeed rather negative, with some saying there have been large liquidations over the past 24 hours and that longs have taken a serious beating.
Overall, I lean toward further choppy weakness in the short term, but I don’t think the sell-off will continue without a floor. At an RSI14 of 25, history suggests repeated swings are more likely than a straight-line plunge to new lows. The fact that protocol revenue and corporate accumulation—two types of “slow money” data—haven’t deteriorated is the main basis for my view. If $BTC breaks below this cycle’s 30-day low of 67568 and continues to accelerate downward, then I’m wrong, and the sell-off is more severe than I expected.
#Hyperliquid营收创纪录 #CryptoMarketSentiment
The most noteworthy thing about this latest downturn isn’t the size of the drop itself, but the clash between prices and fundamental data. According to reports, Hyperliquid protocol revenue reached $190.9 million in the third quarter, a new record for any single quarter in 2026. The timing coincides with a 5.8% drop in the crypto market’s total capitalization over 24 hours and a 3.9% decline in $BTC . My take is that this downturn looks more like a concentrated flush-out of leverage and sentiment than a contraction in genuine on-chain demand. Protocol revenue is still hitting new highs, which suggests people are still spending where it counts. Prices are down, not usage.
As of 09:35, $BTC is trading at 68322, down 3.9% over 24 hours, 9.9% over 7 days, and 16.9% over 30 days. Its daily RSI14 is just 25, clearly in oversold territory. $BNB has followed an almost identical path, down 3.7% over 24 hours and 13.5% over 30 days, with an RSI14 of 27. Its moves in sync with $BTC suggest this sell-off is systemic rather than a problem isolated to one sector. $LTC , meanwhile, is more interesting: it’s down just 1.4% over 24 hours and is actually up 2.8% over the past 4 hours. Its position within the 30-day range is also relatively higher. Looking at all three together, $LTC ’s resilience and rebound suggest the market isn’t uniformly selling off across the board; some buyers are already testing the waters.
Also, according to reports, Japanese-listed company ASIAN STAR plans to distribute 8 million yen worth of $BNB to shareholders and push ahead with real estate tokenization. This kind of genuine demand from businesses is separate from the panic among traders. It won’t offset price moves in the short term, but it shows that not all market participants are heading for the exits amid the community’s widely shared concerns about “six consecutive bearish weekly candles.” Sentiment in the community is indeed rather negative, with some saying there have been large liquidations over the past 24 hours and that longs have taken a serious beating.
Overall, I lean toward further choppy weakness in the short term, but I don’t think the sell-off will continue without a floor. At an RSI14 of 25, history suggests repeated swings are more likely than a straight-line plunge to new lows. The fact that protocol revenue and corporate accumulation—two types of “slow money” data—haven’t deteriorated is the main basis for my view. If $BTC breaks below this cycle’s 30-day low of 67568 and continues to accelerate downward, then I’m wrong, and the sell-off is more severe than I expected.
#Hyperliquid营收创纪录 #CryptoMarketSentiment
As of 09:35, $BTC is trading at 68322, down 3.9% over 24 hours, 9.9% over 7 days, and 16.9% over 30 days. Its daily RSI14 is just 25, clearly in oversold territory. $BNB has followed an almost identical path, down 3.7% over 24 hours and 13.5% over 30 days, with an RSI14 of 27. Its moves in sync with $BTC suggest this sell-off is systemic rather than a problem isolated to one sector. $LTC , meanwhile, is more interesting: it’s down just 1.4% over 24 hours and is actually up 2.8% over the past 4 hours. Its position within the 30-day range is also relatively higher. Looking at all three together, $LTC ’s resilience and rebound suggest the market isn’t uniformly selling off across the board; some buyers are already testing the waters.
Also, according to reports, Japanese-listed company ASIAN STAR plans to distribute 8 million yen worth of $BNB to shareholders and push ahead with real estate tokenization. This kind of genuine demand from businesses is separate from the panic among traders. It won’t offset price moves in the short term, but it shows that not all market participants are heading for the exits amid the community’s widely shared concerns about “six consecutive bearish weekly candles.” Sentiment in the community is indeed rather negative, with some saying there have been large liquidations over the past 24 hours and that longs have taken a serious beating.
Overall, I lean toward further choppy weakness in the short term, but I don’t think the sell-off will continue without a floor. At an RSI14 of 25, history suggests repeated swings are more likely than a straight-line plunge to new lows. The fact that protocol revenue and corporate accumulation—two types of “slow money” data—haven’t deteriorated is the main basis for my view. If $BTC breaks below this cycle’s 30-day low of 67568 and continues to accelerate downward, then I’m wrong, and the sell-off is more severe than I expected.
#Hyperliquid营收创纪录 #CryptoMarketSentiment
632
·
--
RSI14 being oversold is the best entry point for discussing $DOGE today, because the data gives us a textbook example.
As of 07:05, $DOGE is trading at 0.06390, down 3.7% over 24 hours, and its daily RSI14 has fallen to 26. What does that number mean? RSI14 measures the relative strength of gains and losses over the past 14 trading days. A reading below 30 is usually classified as oversold, meaning downward momentum has become quite extreme. It doesn’t mean a reversal is imminent; it means the odds of the price continuing to plunge at the same rate are declining. A comparison with $PEPE in the same sector makes the contrast clear: PEPE’s RSI14 is 45, in neutral territory. It’s still up 8.1% over 30 days, and sits at the 34th percentile of its 30-day range—nothing like DOGE, which is down 21.9% over 30 days and sits at just the 4th percentile of its range. That’s divergence: both are in the Meme sector, but DOGE has fallen much harder this time around, while PEPE has held on to some of its recent gains.
The easiest trap to fall into here is seeing an oversold RSI and treating it as a “buy-the-dip signal,” immediately assuming a rebound is coming. But oversold describes the state of sentiment and momentum; it’s not a timetable, and it doesn’t mean the price can’t keep making new lows. RSI can stay in oversold territory for a long time, especially when the current price is 6.2%, 14.2%, and 22.3% below the daily MA7, MA25, and MA99, respectively. The moving averages are all sloping downward, which is a classic bearish trend structure. Oversold only tells us that this leg down has been sharp; it doesn’t mean the trend has turned. Another pitfall is looking at just one time frame: on the 4-hour chart, the current price is also 4.1% below the 4h MA20, and the six 4-hour candles over the past 24 hours are down a combined 3.9%. The short-term and daily directions are aligned, with no divergence signal, which makes the oversold reading less useful as a reference.
Given the 30-day range of 0.06301–0.08380, the current price is indeed at the 4th percentile, a relatively deep level in this correction. Trading volume is also 1.3 times the average daily volume of the previous seven days, indicating that market participation is increasing as the price falls—it’s not a low-volume drift downward. My view is that the short-term outlook is weak. The oversold RSI is more of a warning that volatility could increase and the pace of the decline may not be sustainable, rather than a signal of a directional reversal. If the price later breaks below 0.06301, the 30-day low, then my assessment that “the outlook is weak, but the decline may slow” will have been wrong.
RSI14 being oversold is the best entry point for discussing $DOGE today, because the data gives us a textbook example.
As of 07:05, $DOGE is trading at 0.06390, down 3.7% over 24 hours, and its daily RSI14 has fallen to 26. What does that number mean? RSI14 measures the relative strength of gains and losses over the past 14 trading days. A reading below 30 is usually classified as oversold, meaning downward momentum has become quite extreme. It doesn’t mean a reversal is imminent; it means the odds of the price continuing to plunge at the same rate are declining. A comparison with $PEPE in the same sector makes the contrast clear: PEPE’s RSI14 is 45, in neutral territory. It’s still up 8.1% over 30 days, and sits at the 34th percentile of its 30-day range—nothing like DOGE, which is down 21.9% over 30 days and sits at just the 4th percentile of its range. That’s divergence: both are in the Meme sector, but DOGE has fallen much harder this time around, while PEPE has held on to some of its recent gains.
The easiest trap to fall into here is seeing an oversold RSI and treating it as a “buy-the-dip signal,” immediately assuming a rebound is coming. But oversold describes the state of sentiment and momentum; it’s not a timetable, and it doesn’t mean the price can’t keep making new lows. RSI can stay in oversold territory for a long time, especially when the current price is 6.2%, 14.2%, and 22.3% below the daily MA7, MA25, and MA99, respectively. The moving averages are all sloping downward, which is a classic bearish trend structure. Oversold only tells us that this leg down has been sharp; it doesn’t mean the trend has turned. Another pitfall is looking at just one time frame: on the 4-hour chart, the current price is also 4.1% below the 4h MA20, and the six 4-hour candles over the past 24 hours are down a combined 3.9%. The short-term and daily directions are aligned, with no divergence signal, which makes the oversold reading less useful as a reference.
Given the 30-day range of 0.06301–0.08380, the current price is indeed at the 4th percentile, a relatively deep level in this correction. Trading volume is also 1.3 times the average daily volume of the previous seven days, indicating that market participation is increasing as the price falls—it’s not a low-volume drift downward. My view is that the short-term outlook is weak. The oversold RSI is more of a warning that volatility could increase and the pace of the decline may not be sustainable, rather than a signal of a directional reversal. If the price later breaks below 0.06301, the 30-day low, then my assessment that “the outlook is weak, but the decline may slow” will have been wrong.
As of 07:05, $DOGE is trading at 0.06390, down 3.7% over 24 hours, and its daily RSI14 has fallen to 26. What does that number mean? RSI14 measures the relative strength of gains and losses over the past 14 trading days. A reading below 30 is usually classified as oversold, meaning downward momentum has become quite extreme. It doesn’t mean a reversal is imminent; it means the odds of the price continuing to plunge at the same rate are declining. A comparison with $PEPE in the same sector makes the contrast clear: PEPE’s RSI14 is 45, in neutral territory. It’s still up 8.1% over 30 days, and sits at the 34th percentile of its 30-day range—nothing like DOGE, which is down 21.9% over 30 days and sits at just the 4th percentile of its range. That’s divergence: both are in the Meme sector, but DOGE has fallen much harder this time around, while PEPE has held on to some of its recent gains.
The easiest trap to fall into here is seeing an oversold RSI and treating it as a “buy-the-dip signal,” immediately assuming a rebound is coming. But oversold describes the state of sentiment and momentum; it’s not a timetable, and it doesn’t mean the price can’t keep making new lows. RSI can stay in oversold territory for a long time, especially when the current price is 6.2%, 14.2%, and 22.3% below the daily MA7, MA25, and MA99, respectively. The moving averages are all sloping downward, which is a classic bearish trend structure. Oversold only tells us that this leg down has been sharp; it doesn’t mean the trend has turned. Another pitfall is looking at just one time frame: on the 4-hour chart, the current price is also 4.1% below the 4h MA20, and the six 4-hour candles over the past 24 hours are down a combined 3.9%. The short-term and daily directions are aligned, with no divergence signal, which makes the oversold reading less useful as a reference.
Given the 30-day range of 0.06301–0.08380, the current price is indeed at the 4th percentile, a relatively deep level in this correction. Trading volume is also 1.3 times the average daily volume of the previous seven days, indicating that market participation is increasing as the price falls—it’s not a low-volume drift downward. My view is that the short-term outlook is weak. The oversold RSI is more of a warning that volatility could increase and the pace of the decline may not be sustainable, rather than a signal of a directional reversal. If the price later breaks below 0.06301, the 30-day low, then my assessment that “the outlook is weak, but the decline may slow” will have been wrong.
628
·
--
Let’s start with the social buzz ranking for $ZEC . As of 02:15, its 24-hour buzz was just over 190,000, but sentiment was mostly negative. The community was discussing the sharp volatility after a big rally, a treasury rewards voting proposal, and claims that a certain KOL had proposed a 45% short position. These claims can’t be verified, but high buzz and poor sentiment—a mismatch in itself—is a signal: the market’s risk tolerance is declining.
There’s been a lot of discussion these past few days about accounts being frozen, and I run into this issue myself pretty often. Here’s how I understand the core logic: what gets frozen is never a particular sum of money; it’s the account as an entity. Many people challenge this when appealing: why not just flag and freeze the problematic U and leave all my other money alone? But the unit targeted by legal documents or risk-control systems is the account, not a particular transaction. Judicial freezes generally go through LERS or international judicial assistance, and are commonly renewed every six months. You can’t move your assets until the assisting agency lifts the freeze. Platform risk-control freezes—for things like rapid deposits and withdrawals or money-mule activity—go through KYT and AML systems. They typically ask you to provide proof of the source of funds, and if your documents are complete, the review can take anywhere from a few days to a week. Issuer blacklists involve Tether and Circle working with exchanges to flag accounts, commonly in connection with the on-chain trail of a hack. They target accounts associated with addresses flagged on-chain. These three processes are different, but they have one thing in common: once an account is identified as problematic, the freeze applies to the account itself, not just a few transactions in it. That’s the fundamental reason why people appealing a freeze and the other party often seem to be “talking past each other.”
My view is that account compliance checks will only get stricter for a while, not more lenient. The overall market is down 5.8% over 24 hours, and $BTC is down 4.3%. In this broadly pressured environment, platforms and users will only become more sensitive to abnormal fund flows. Here’s where my view could be wrong: if the turnaround time for judicial assistance and platform risk-control reviews drops significantly, and appeals become more efficient, that would indicate this is just temporary friction, not a long-term trend. I’d take back my view.
Back to $ZEC: it’s currently at 944.2, down 28.6% over 7 days and 17.7% over 30 days. The price is below all three daily moving averages—MA7, MA25, and MA99. It’s at just the 12th percentile of its 30-day range of 880.5 to 1398, and the daily RSI14 is 33, not yet at extremely oversold levels. On the 4-hour chart, the current price is 4.0% below MA20, and it’s still down 1.2% over the past 24 hours. Trading volume is 1.2 times the 7-day average, which suggests selling pressure is still being absorbed; this isn’t a slow decline on falling volume. I lean toward continued short-term weakness and choppy trading. I won’t be quick to call a reversal until I see signs of a bottom. If it breaks below this cycle’s low of 880.5, that would mean my view was wrong.
#账户冻结逻辑 #RiskControlCompliance
Let’s start with the social buzz ranking for $ZEC . As of 02:15, its 24-hour buzz was just over 190,000, but sentiment was mostly negative. The community was discussing the sharp volatility after a big rally, a treasury rewards voting proposal, and claims that a certain KOL had proposed a 45% short position. These claims can’t be verified, but high buzz and poor sentiment—a mismatch in itself—is a signal: the market’s risk tolerance is declining.
There’s been a lot of discussion these past few days about accounts being frozen, and I run into this issue myself pretty often. Here’s how I understand the core logic: what gets frozen is never a particular sum of money; it’s the account as an entity. Many people challenge this when appealing: why not just flag and freeze the problematic U and leave all my other money alone? But the unit targeted by legal documents or risk-control systems is the account, not a particular transaction. Judicial freezes generally go through LERS or international judicial assistance, and are commonly renewed every six months. You can’t move your assets until the assisting agency lifts the freeze. Platform risk-control freezes—for things like rapid deposits and withdrawals or money-mule activity—go through KYT and AML systems. They typically ask you to provide proof of the source of funds, and if your documents are complete, the review can take anywhere from a few days to a week. Issuer blacklists involve Tether and Circle working with exchanges to flag accounts, commonly in connection with the on-chain trail of a hack. They target accounts associated with addresses flagged on-chain. These three processes are different, but they have one thing in common: once an account is identified as problematic, the freeze applies to the account itself, not just a few transactions in it. That’s the fundamental reason why people appealing a freeze and the other party often seem to be “talking past each other.”
My view is that account compliance checks will only get stricter for a while, not more lenient. The overall market is down 5.8% over 24 hours, and $BTC is down 4.3%. In this broadly pressured environment, platforms and users will only become more sensitive to abnormal fund flows. Here’s where my view could be wrong: if the turnaround time for judicial assistance and platform risk-control reviews drops significantly, and appeals become more efficient, that would indicate this is just temporary friction, not a long-term trend. I’d take back my view.
Back to $ZEC : it’s currently at 944.2, down 28.6% over 7 days and 17.7% over 30 days. The price is below all three daily moving averages—MA7, MA25, and MA99. It’s at just the 12th percentile of its 30-day range of 880.5 to 1398, and the daily RSI14 is 33, not yet at extremely oversold levels. On the 4-hour chart, the current price is 4.0% below MA20, and it’s still down 1.2% over the past 24 hours. Trading volume is 1.2 times the 7-day average, which suggests selling pressure is still being absorbed; this isn’t a slow decline on falling volume. I lean toward continued short-term weakness and choppy trading. I won’t be quick to call a reversal until I see signs of a bottom. If it breaks below this cycle’s low of 880.5, that would mean my view was wrong.
#账户冻结逻辑 #RiskControlCompliance
There’s been a lot of discussion these past few days about accounts being frozen, and I run into this issue myself pretty often. Here’s how I understand the core logic: what gets frozen is never a particular sum of money; it’s the account as an entity. Many people challenge this when appealing: why not just flag and freeze the problematic U and leave all my other money alone? But the unit targeted by legal documents or risk-control systems is the account, not a particular transaction. Judicial freezes generally go through LERS or international judicial assistance, and are commonly renewed every six months. You can’t move your assets until the assisting agency lifts the freeze. Platform risk-control freezes—for things like rapid deposits and withdrawals or money-mule activity—go through KYT and AML systems. They typically ask you to provide proof of the source of funds, and if your documents are complete, the review can take anywhere from a few days to a week. Issuer blacklists involve Tether and Circle working with exchanges to flag accounts, commonly in connection with the on-chain trail of a hack. They target accounts associated with addresses flagged on-chain. These three processes are different, but they have one thing in common: once an account is identified as problematic, the freeze applies to the account itself, not just a few transactions in it. That’s the fundamental reason why people appealing a freeze and the other party often seem to be “talking past each other.”
My view is that account compliance checks will only get stricter for a while, not more lenient. The overall market is down 5.8% over 24 hours, and $BTC is down 4.3%. In this broadly pressured environment, platforms and users will only become more sensitive to abnormal fund flows. Here’s where my view could be wrong: if the turnaround time for judicial assistance and platform risk-control reviews drops significantly, and appeals become more efficient, that would indicate this is just temporary friction, not a long-term trend. I’d take back my view.
Back to $ZEC : it’s currently at 944.2, down 28.6% over 7 days and 17.7% over 30 days. The price is below all three daily moving averages—MA7, MA25, and MA99. It’s at just the 12th percentile of its 30-day range of 880.5 to 1398, and the daily RSI14 is 33, not yet at extremely oversold levels. On the 4-hour chart, the current price is 4.0% below MA20, and it’s still down 1.2% over the past 24 hours. Trading volume is 1.2 times the 7-day average, which suggests selling pressure is still being absorbed; this isn’t a slow decline on falling volume. I lean toward continued short-term weakness and choppy trading. I won’t be quick to call a reversal until I see signs of a bottom. If it breaks below this cycle’s low of 880.5, that would mean my view was wrong.
#账户冻结逻辑 #RiskControlCompliance
421
·
--
The key takeaway from $SPCXB’s current price action is simple: the broader market and $BTC are getting hammered, but $SPCXB is holding up much better than $BTC. That divergence is worth a closer look.
First, the numbers. This move in $BTC has been brutal: down 3.9% over 24 hours, with the daily RSI14 plunging to 25 and the price falling below the 6% level of its 30-day range of 67568–84898. It’s now below all three daily moving averages—MA7, MA25, and MA99—and sits 11.9% below the lowest one, MA99. There’s also talk in the community of $500 million in liquidations and a possible sixth consecutive weekly red candle. Sentiment is clearly negative. Now look at $SPCXB. It’s also down over the same period, by 4.1% in 24 hours, so at first glance it’s actually fallen slightly more than $BTC. But zoom out and the picture is completely different: it’s still up 1.5% over 7 days, and down only 8.8% over 30 days—much milder than $BTC’s 15.9% 30-day decline. Its current price is still at the 37% mark of its 30-day range of 120.5–166.2 (with a midpoint of 137.3), unlike $BTC, which is pinned near the bottom at 6%. And $SPCXB’s daily RSI14 is 46, close to neutral—not at all like $BTC’s clearly oversold reading of 25.
What does this tell us? This $BTC sell-off is a classic panic-driven leverage flush, dragging broader market sentiment down with it. $SPCXB looks more like it’s being pulled down by market sentiment, while its fundamentals (judging by its relative strength over 7 and 30 days) aren’t actually that weak. One other detail is volume: $SPCXB , with 24-hour trading volume at 58.66 million USDT, or 2.0 times the average daily volume over the previous 7 days. That suggests real money is participating in the sell-off; this isn’t a decline on low volume. The short-term pressure is real, so don’t assume it’s safe just because the RSI isn’t at an extreme.
My view is that $SPCXB is more likely to consolidate for a while before choosing a direction, rather than continuing to plunge alongside $BTC. The reason is the relative-strength gap mentioned above: its 30-day decline is only a little over half that of the market leader, and its RSI is still in neutral territory, not oversold. From this level, there’s usually limited room for further catch-up losses; more likely, it follows the market down for a bit and then finds support and consolidates. But if $SPCXB breaks below the 30-day range low near 120.5, or if its RSI14 also slides into the kind of oversold territory in the low 20s that $BTC is in, that would suggest money is truly exiting this coin on a broad scale—and my call would be wrong.
The key takeaway from $SPCXB ’s current price action is simple: the broader market and $BTC are getting hammered, but $SPCXB is holding up much better than $BTC . That divergence is worth a closer look.
First, the numbers. This move in $BTC has been brutal: down 3.9% over 24 hours, with the daily RSI14 plunging to 25 and the price falling below the 6% level of its 30-day range of 67568–84898. It’s now below all three daily moving averages—MA7, MA25, and MA99—and sits 11.9% below the lowest one, MA99. There’s also talk in the community of $500 million in liquidations and a possible sixth consecutive weekly red candle. Sentiment is clearly negative. Now look at $SPCXB . It’s also down over the same period, by 4.1% in 24 hours, so at first glance it’s actually fallen slightly more than $BTC . But zoom out and the picture is completely different: it’s still up 1.5% over 7 days, and down only 8.8% over 30 days—much milder than $BTC ’s 15.9% 30-day decline. Its current price is still at the 37% mark of its 30-day range of 120.5–166.2 (with a midpoint of 137.3), unlike $BTC , which is pinned near the bottom at 6%. And $SPCXB ’s daily RSI14 is 46, close to neutral—not at all like $BTC ’s clearly oversold reading of 25.
What does this tell us? This $BTC sell-off is a classic panic-driven leverage flush, dragging broader market sentiment down with it. $SPCXB looks more like it’s being pulled down by market sentiment, while its fundamentals (judging by its relative strength over 7 and 30 days) aren’t actually that weak. One other detail is volume: $SPCXB , with 24-hour trading volume at 58.66 million USDT, or 2.0 times the average daily volume over the previous 7 days. That suggests real money is participating in the sell-off; this isn’t a decline on low volume. The short-term pressure is real, so don’t assume it’s safe just because the RSI isn’t at an extreme.
My view is that $SPCXB is more likely to consolidate for a while before choosing a direction, rather than continuing to plunge alongside $BTC . The reason is the relative-strength gap mentioned above: its 30-day decline is only a little over half that of the market leader, and its RSI is still in neutral territory, not oversold. From this level, there’s usually limited room for further catch-up losses; more likely, it follows the market down for a bit and then finds support and consolidates. But if $SPCXB breaks below the 30-day range low near 120.5, or if its RSI14 also slides into the kind of oversold territory in the low 20s that $BTC is in, that would suggest money is truly exiting this coin on a broad scale—and my call would be wrong.
First, the numbers. This move in $BTC has been brutal: down 3.9% over 24 hours, with the daily RSI14 plunging to 25 and the price falling below the 6% level of its 30-day range of 67568–84898. It’s now below all three daily moving averages—MA7, MA25, and MA99—and sits 11.9% below the lowest one, MA99. There’s also talk in the community of $500 million in liquidations and a possible sixth consecutive weekly red candle. Sentiment is clearly negative. Now look at $SPCXB . It’s also down over the same period, by 4.1% in 24 hours, so at first glance it’s actually fallen slightly more than $BTC . But zoom out and the picture is completely different: it’s still up 1.5% over 7 days, and down only 8.8% over 30 days—much milder than $BTC ’s 15.9% 30-day decline. Its current price is still at the 37% mark of its 30-day range of 120.5–166.2 (with a midpoint of 137.3), unlike $BTC , which is pinned near the bottom at 6%. And $SPCXB ’s daily RSI14 is 46, close to neutral—not at all like $BTC ’s clearly oversold reading of 25.
What does this tell us? This $BTC sell-off is a classic panic-driven leverage flush, dragging broader market sentiment down with it. $SPCXB looks more like it’s being pulled down by market sentiment, while its fundamentals (judging by its relative strength over 7 and 30 days) aren’t actually that weak. One other detail is volume: $SPCXB , with 24-hour trading volume at 58.66 million USDT, or 2.0 times the average daily volume over the previous 7 days. That suggests real money is participating in the sell-off; this isn’t a decline on low volume. The short-term pressure is real, so don’t assume it’s safe just because the RSI isn’t at an extreme.
My view is that $SPCXB is more likely to consolidate for a while before choosing a direction, rather than continuing to plunge alongside $BTC . The reason is the relative-strength gap mentioned above: its 30-day decline is only a little over half that of the market leader, and its RSI is still in neutral territory, not oversold. From this level, there’s usually limited room for further catch-up losses; more likely, it follows the market down for a bit and then finds support and consolidates. But if $SPCXB breaks below the 30-day range low near 120.5, or if its RSI14 also slides into the kind of oversold territory in the low 20s that $BTC is in, that would suggest money is truly exiting this coin on a broad scale—and my call would be wrong.
402
·
--
$AGT Let me show you my trading points for this round. I generally don't chase the first wave or sell at the very end. Overall, my trading strategy has been fairly stable so far.
$AGT Let me show you my trading points for this round. I generally don't chase the first wave or sell at the very end. Overall, my trading strategy has been fairly stable so far.
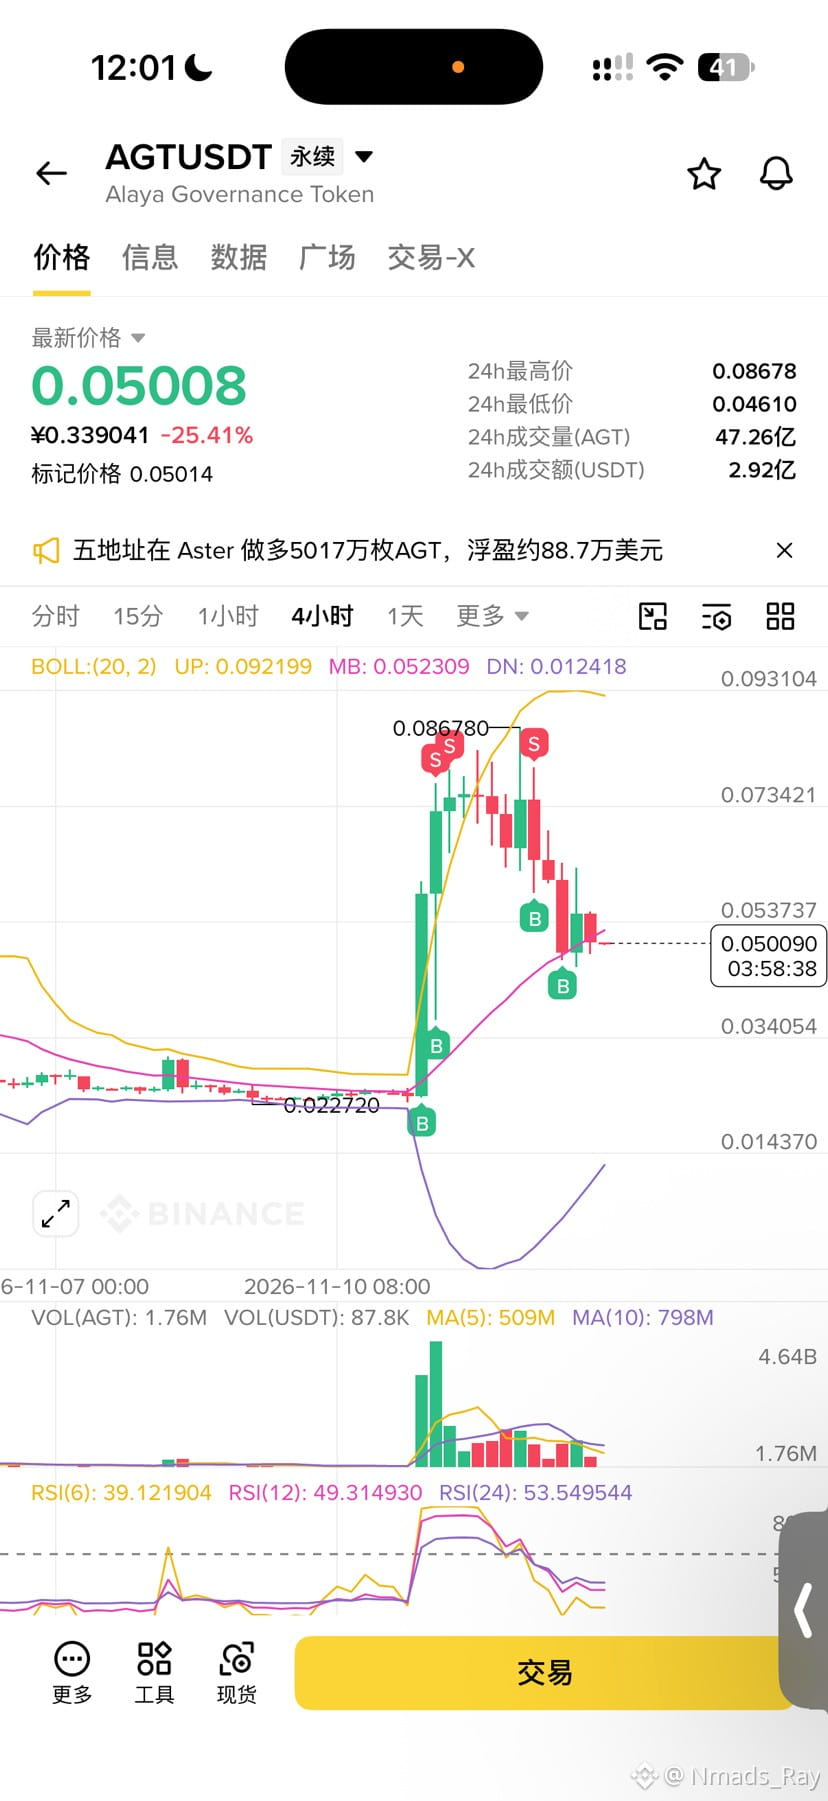
1
301
·
--
$BARDUSDT Please use your own judgment
{future}(BARDUSDT)
$BARDUSDT Please use your own judgment
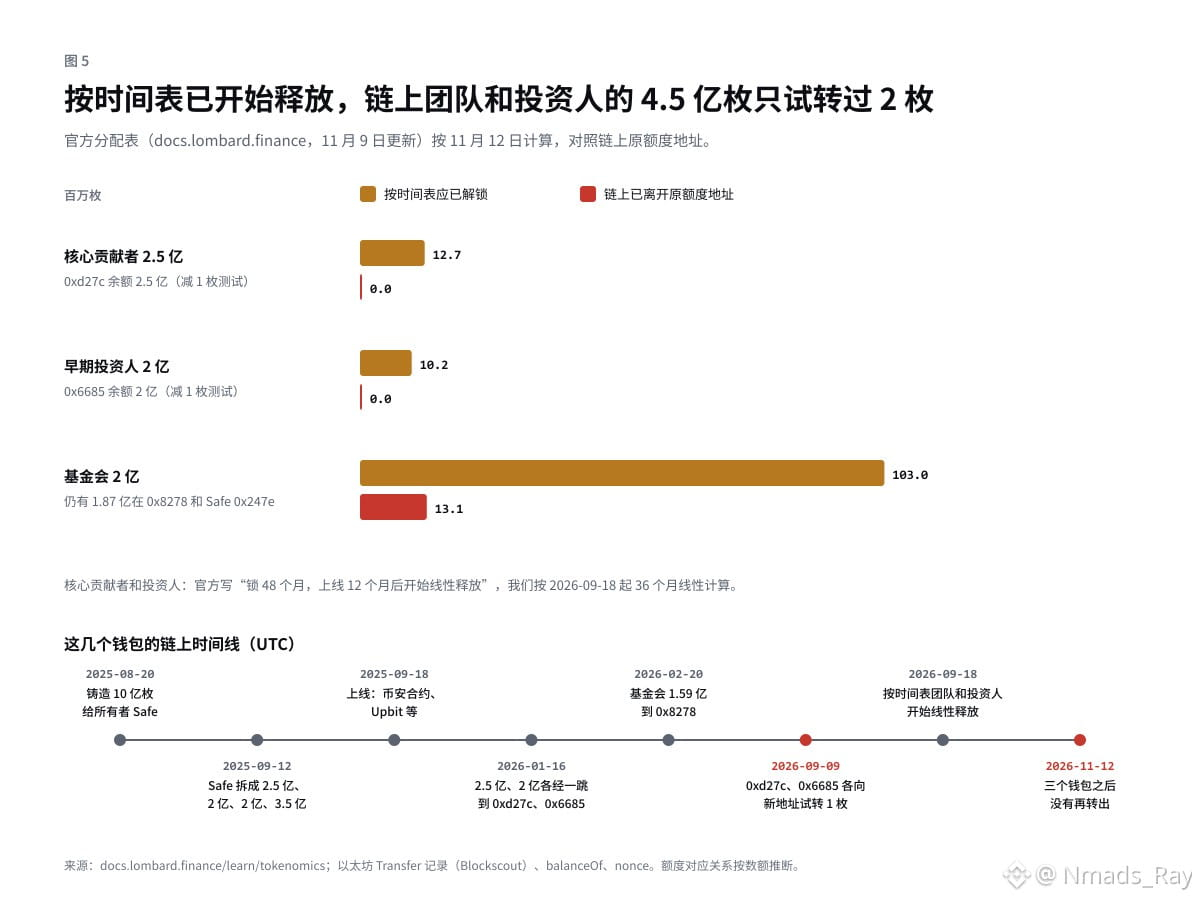
122
·
--
$GRAM is now falling along with the broader market, down 7.1% over 24 hours. $BTC is also down 6.1% over the same period, so this looks more like a systemic, market-wide sell-off than a standalone negative catalyst. According to reports, the widely discussed view is that the market has reached an extreme in the short term, with no liquidation zones below. I think this points to a change in the structure driving the decline: a few days ago, sell-offs could still be amplified by cascading liquidations, but now there are no longer dense clusters of forced liquidations below to act as a cushion. This means two things: first, if the price does break below its current level, there will be no support from liquidation clusters underneath, so the drop could be sharper and face less resistance; second, most of the selling pressure from forced liquidations has already been cleared, so the next move will depend more on the willingness of sellers to act, rather than on a one-way liquidation-driven acceleration downward.
The data show just how extreme things have become: $BTC's daily RSI14 is already at 25. Its 30-day range is 67568 to 84898, and the current price is at the 8th percentile of that range, close to the lower bound. It is down 9.1% over seven days, more than its 24-hour decline, indicating that this sell-off has built up over several days rather than erupting suddenly today. $GRAM is different: it is actually up 4.6% over seven days, down 15.2% over 30 days, and its daily RSI14 is at 45. It is at the 39th percentile of its 30-day range, which suggests that $GRAM itself has not fallen as deeply as the market-wide downturn. Today's 7.1% decline is more of a sympathy sell-off driven by market sentiment, not a problem with its own token supply.
My view is that $GRAM is more likely to trade sideways for a while, and I wouldn't rush to call a one-way move. The reason is that the current price is still 4.2% above the daily MA7, and RSI14 is in neutral territory. Unlike $BTC, it has not reached an extreme short-term level; it looks more like it is fluctuating and recovering along with broader market sentiment. If $GRAM breaks below this cycle's low of 1.118, that would show my assessment was wrong and that the sympathy sell-off has gone deeper than I expected.
Social interest in $BTC is high, and sentiment is leaning positive. The community is discussing news related to payments and custody, which is somewhat disconnected from the extreme short-term conditions in the price. I think this mismatch between expectations and price action is also worth keeping an eye on.
#清算区域清空 #BTC oversold
$GRAM is now falling along with the broader market, down 7.1% over 24 hours. $BTC is also down 6.1% over the same period, so this looks more like a systemic, market-wide sell-off than a standalone negative catalyst. According to reports, the widely discussed view is that the market has reached an extreme in the short term, with no liquidation zones below. I think this points to a change in the structure driving the decline: a few days ago, sell-offs could still be amplified by cascading liquidations, but now there are no longer dense clusters of forced liquidations below to act as a cushion. This means two things: first, if the price does break below its current level, there will be no support from liquidation clusters underneath, so the drop could be sharper and face less resistance; second, most of the selling pressure from forced liquidations has already been cleared, so the next move will depend more on the willingness of sellers to act, rather than on a one-way liquidation-driven acceleration downward.
The data show just how extreme things have become: $BTC 's daily RSI14 is already at 25. Its 30-day range is 67568 to 84898, and the current price is at the 8th percentile of that range, close to the lower bound. It is down 9.1% over seven days, more than its 24-hour decline, indicating that this sell-off has built up over several days rather than erupting suddenly today. $GRAM is different: it is actually up 4.6% over seven days, down 15.2% over 30 days, and its daily RSI14 is at 45. It is at the 39th percentile of its 30-day range, which suggests that $GRAM itself has not fallen as deeply as the market-wide downturn. Today's 7.1% decline is more of a sympathy sell-off driven by market sentiment, not a problem with its own token supply.
My view is that $GRAM is more likely to trade sideways for a while, and I wouldn't rush to call a one-way move. The reason is that the current price is still 4.2% above the daily MA7, and RSI14 is in neutral territory. Unlike $BTC , it has not reached an extreme short-term level; it looks more like it is fluctuating and recovering along with broader market sentiment. If $GRAM breaks below this cycle's low of 1.118, that would show my assessment was wrong and that the sympathy sell-off has gone deeper than I expected.
Social interest in $BTC is high, and sentiment is leaning positive. The community is discussing news related to payments and custody, which is somewhat disconnected from the extreme short-term conditions in the price. I think this mismatch between expectations and price action is also worth keeping an eye on.
#清算区域清空 #BTC oversold
The data show just how extreme things have become: $BTC 's daily RSI14 is already at 25. Its 30-day range is 67568 to 84898, and the current price is at the 8th percentile of that range, close to the lower bound. It is down 9.1% over seven days, more than its 24-hour decline, indicating that this sell-off has built up over several days rather than erupting suddenly today. $GRAM is different: it is actually up 4.6% over seven days, down 15.2% over 30 days, and its daily RSI14 is at 45. It is at the 39th percentile of its 30-day range, which suggests that $GRAM itself has not fallen as deeply as the market-wide downturn. Today's 7.1% decline is more of a sympathy sell-off driven by market sentiment, not a problem with its own token supply.
My view is that $GRAM is more likely to trade sideways for a while, and I wouldn't rush to call a one-way move. The reason is that the current price is still 4.2% above the daily MA7, and RSI14 is in neutral territory. Unlike $BTC , it has not reached an extreme short-term level; it looks more like it is fluctuating and recovering along with broader market sentiment. If $GRAM breaks below this cycle's low of 1.118, that would show my assessment was wrong and that the sympathy sell-off has gone deeper than I expected.
Social interest in $BTC is high, and sentiment is leaning positive. The community is discussing news related to payments and custody, which is somewhat disconnected from the extreme short-term conditions in the price. I think this mismatch between expectations and price action is also worth keeping an eye on.
#清算区域清空 #BTC oversold
254
·
--
$DOGE’s pullback this time is among the more severe ones in the Meme sector. It’s currently at 0.06373, down 4.9% in 24 hours, but what really tells the story is its position relative to the moving averages: the daily price has fallen below MA7, MA25, and MA99, trailing them by 6.4%, 14.4%, and 22.5%, respectively. And within its 30-day range of 0.06301 to 0.08380, the current price is only 3% above the bottom—almost hugging this cycle’s low. The daily RSI14 has already reached 25, a level that usually indicates extreme short-term selling pressure. But extreme conditions don’t mean an immediate reversal; it looks more like the downtrend is still following its momentum.
A comparison with $PEPE in the same sector highlights the divergence. $PEPE is down 2.8% over 24 hours and 11% over 7 days, seemingly moving in the same direction as DOGE, but its position is completely different: PEPE is still at the 35% level of its 30-day range, its daily RSI14 is 46—not particularly weak—and its price remains 11.6% above MA99. It’s actually up 8.8% over 30 days. In other words, amid this market-wide plunge, PEPE is only pulling back from relatively high levels, while DOGE is continuing to break down and make new recent lows. This divergence suggests investors are also making distinctions within the Meme sector: DOGE is clearly facing heavier selling, and its trading volume has risen to 1.7 times the average of the previous 7 days. That points to substantial selling, not a low-volume drift downward.
Based on these points, I lean toward DOGE remaining weak for a while. At least until signs of stabilization emerge, it shouldn’t be casually considered a buying-the-dip opportunity. If the 30-day low of 0.06301 is decisively broken, there could be further downside. But if DOGE stabilizes before PEPE and gets back above the 4h MA20, then my bearish view will have been wrong.
#DOGE #PEPE #Meme
$DOGE ’s pullback this time is among the more severe ones in the Meme sector. It’s currently at 0.06373, down 4.9% in 24 hours, but what really tells the story is its position relative to the moving averages: the daily price has fallen below MA7, MA25, and MA99, trailing them by 6.4%, 14.4%, and 22.5%, respectively. And within its 30-day range of 0.06301 to 0.08380, the current price is only 3% above the bottom—almost hugging this cycle’s low. The daily RSI14 has already reached 25, a level that usually indicates extreme short-term selling pressure. But extreme conditions don’t mean an immediate reversal; it looks more like the downtrend is still following its momentum.
A comparison with $PEPE in the same sector highlights the divergence. $PEPE is down 2.8% over 24 hours and 11% over 7 days, seemingly moving in the same direction as DOGE, but its position is completely different: PEPE is still at the 35% level of its 30-day range, its daily RSI14 is 46—not particularly weak—and its price remains 11.6% above MA99. It’s actually up 8.8% over 30 days. In other words, amid this market-wide plunge, PEPE is only pulling back from relatively high levels, while DOGE is continuing to break down and make new recent lows. This divergence suggests investors are also making distinctions within the Meme sector: DOGE is clearly facing heavier selling, and its trading volume has risen to 1.7 times the average of the previous 7 days. That points to substantial selling, not a low-volume drift downward.
Based on these points, I lean toward DOGE remaining weak for a while. At least until signs of stabilization emerge, it shouldn’t be casually considered a buying-the-dip opportunity. If the 30-day low of 0.06301 is decisively broken, there could be further downside. But if DOGE stabilizes before PEPE and gets back above the 4h MA20, then my bearish view will have been wrong.
#DOGE #PEPE #Meme
A comparison with $PEPE in the same sector highlights the divergence. $PEPE is down 2.8% over 24 hours and 11% over 7 days, seemingly moving in the same direction as DOGE, but its position is completely different: PEPE is still at the 35% level of its 30-day range, its daily RSI14 is 46—not particularly weak—and its price remains 11.6% above MA99. It’s actually up 8.8% over 30 days. In other words, amid this market-wide plunge, PEPE is only pulling back from relatively high levels, while DOGE is continuing to break down and make new recent lows. This divergence suggests investors are also making distinctions within the Meme sector: DOGE is clearly facing heavier selling, and its trading volume has risen to 1.7 times the average of the previous 7 days. That points to substantial selling, not a low-volume drift downward.
Based on these points, I lean toward DOGE remaining weak for a while. At least until signs of stabilization emerge, it shouldn’t be casually considered a buying-the-dip opportunity. If the 30-day low of 0.06301 is decisively broken, there could be further downside. But if DOGE stabilizes before PEPE and gets back above the 4h MA20, then my bearish view will have been wrong.
#DOGE #PEPE #Meme
1.2k
Log in to explore more content
Join global crypto users on Binance Square
⚡️ Get latest and useful information about crypto.
💬 Trusted by the world’s largest crypto exchange.
👍 Discover real insights from verified creators.
Email / Phone number
Trending Topics
CryptoSelloffTriggersMultipleWhaleLiquidations
213,718 views
1,895 Discussing
Crypto Liquidations Top $2B in 24 Hours as 329,000 Traders Are Wiped Out
Binance News
·40 Likes
·59.1k views
USSpotXRPETFsSeeLargestWeeklyOutflowIn8Months
182,077 views
1,615 Discussing
WillFOMCMinutesReinforceRateHikeExpectations?
59,445 views
801 Discussing