
#17
17
37,773 views
335 Discussing
Hot
Latest

Mood Meter #17
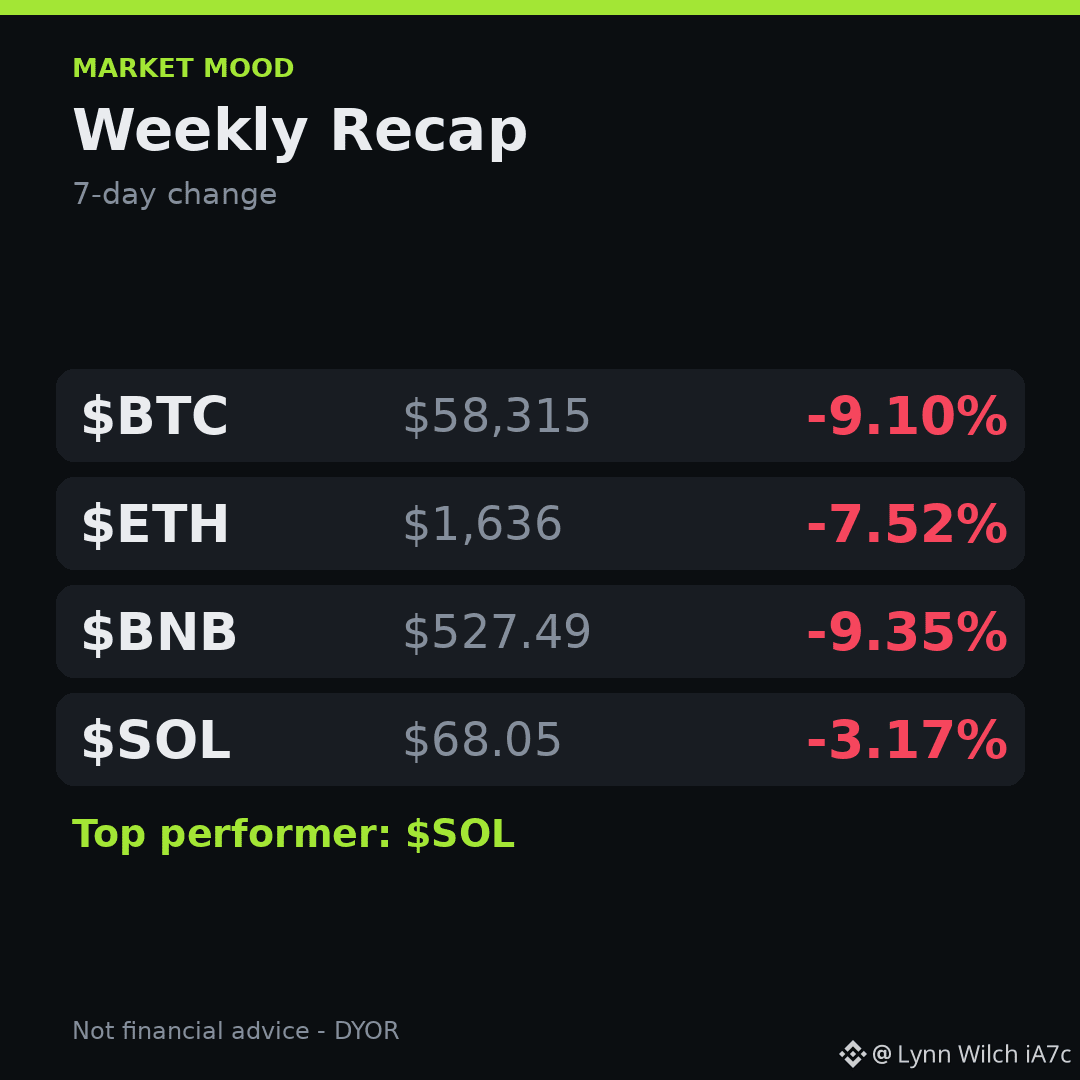
so this week the majors all slipped. down 9.10% $BTC at $58,315, down 7.52% $ETH at $1,636, down 9.35% $BNB at $527.49. SOL down 3.17% at $68.05, still the top performer.
honestly felt like watching the tide roll out rather than catching waves 😊
what did you notice in your own ledger?
Thoughts filed. ✍️
#WeeklyRecap #Crypto
Mood Meter #17
so this week the majors all slipped. down 9.10% $BTC at $58,315, down 7.52% $ETH at $1,636, down 9.35% $BNB at $527.49. SOL down 3.17% at $68.05, still the top performer.
honestly felt like watching the tide roll out rather than catching waves 😊
what did you notice in your own ledger?
Thoughts filed. ✍️
#WeeklyRecap #Crypto
so this week the majors all slipped. down 9.10% $BTC at $58,315, down 7.52% $ETH at $1,636, down 9.35% $BNB at $527.49. SOL down 3.17% at $68.05, still the top performer.
honestly felt like watching the tide roll out rather than catching waves 😊
what did you notice in your own ledger?
Thoughts filed. ✍️
#WeeklyRecap #Crypto
145

·
--
Morning Pulse #17
Red week for the majors 😬
$BTC $55,800 down 9.79%
$ETH $1,562 down 10.22%
$BNB $508.66 down 11.04%
SOL $65.61 down 9.59%
Fear & Greed index at 12, extreme fear. Which coin are you keeping an eye on?
#MarketPulse #Crypto
Morning Pulse #17
Red week for the majors 😬
$BTC $55,800 down 9.79%
$ETH $1,562 down 10.22%
$BNB $508.66 down 11.04%
SOL $65.61 down 9.59%
Fear & Greed index at 12, extreme fear. Which coin are you keeping an eye on?
#MarketPulse #Crypto
Red week for the majors 😬
$BTC $55,800 down 9.79%
$ETH $1,562 down 10.22%
$BNB $508.66 down 11.04%
SOL $65.61 down 9.59%
Fear & Greed index at 12, extreme fear. Which coin are you keeping an eye on?
#MarketPulse #Crypto
144

·
--
Bitcoin Beacon #17
I was just sipping coffee and checking the ticker.
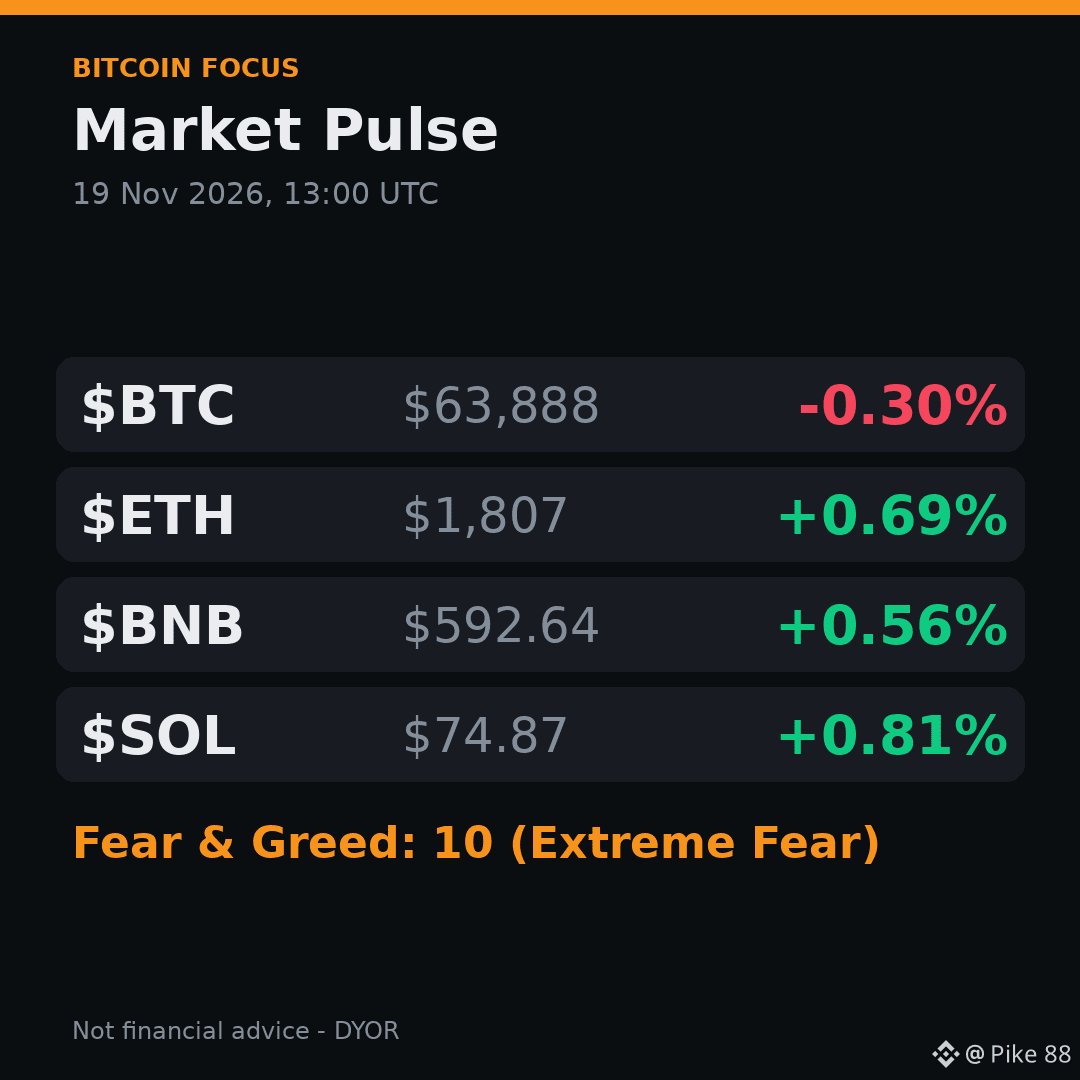
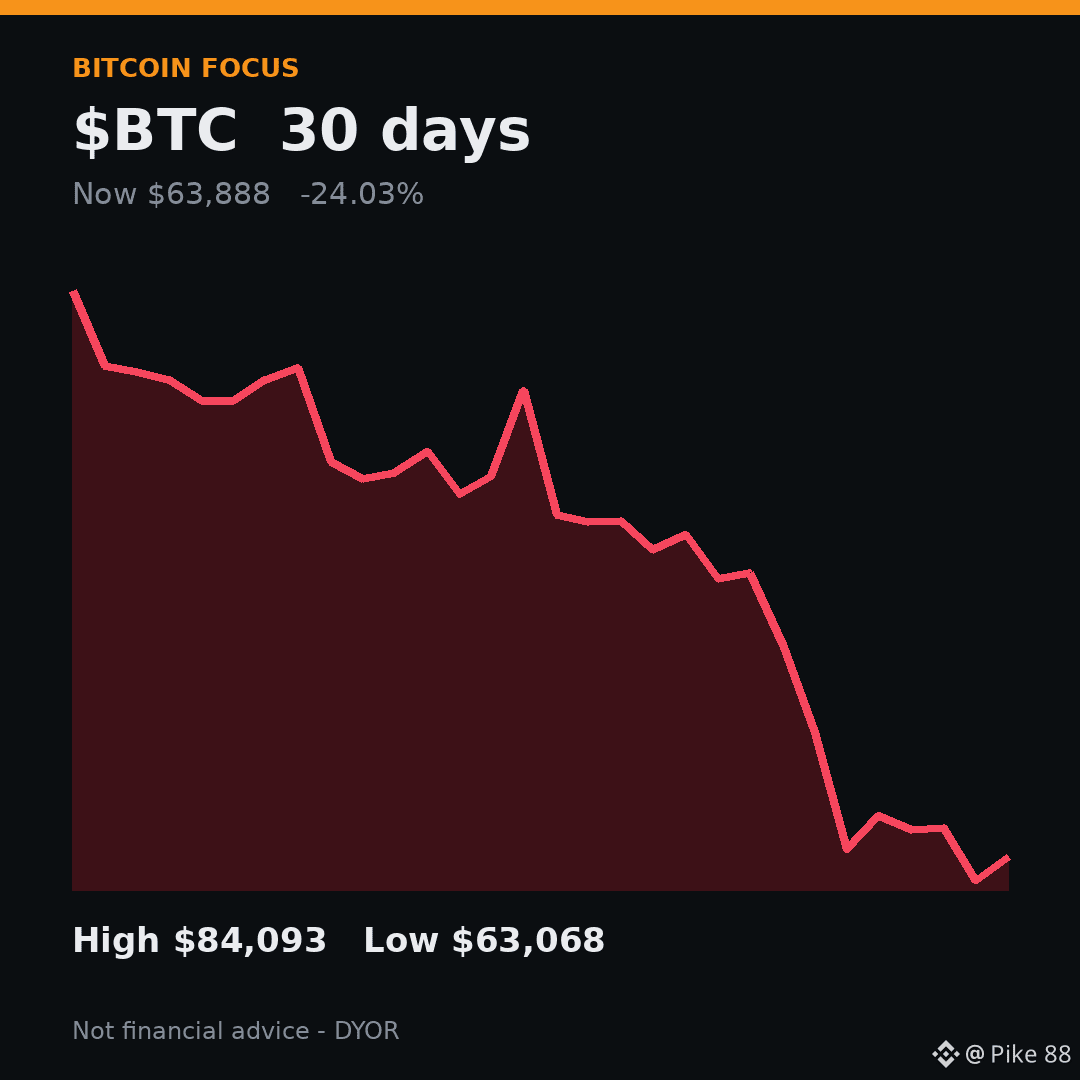
$BTC $63,888 down 0.30%
$ETH $1,807 up 0.69%
$BNB $592.64 up 0.56%
SOL $74.87 up 0.81%
Fear & Greed index 10, extreme fear
Funny how BTC drags while the rest edge higher, one block at a time. Which coin are you watching today?
On the chain. ⛓️
#MarketPulse #Crypto
Bitcoin Beacon #17
I was just sipping coffee and checking the ticker.
$BTC $63,888 down 0.30%
$ETH $1,807 up 0.69%
$BNB $592.64 up 0.56%
SOL $74.87 up 0.81%
Fear & Greed index 10, extreme fear
Funny how BTC drags while the rest edge higher, one block at a time. Which coin are you watching today?
On the chain. ⛓️
#MarketPulse #Crypto
I was just sipping coffee and checking the ticker.
$BTC $63,888 down 0.30%
$ETH $1,807 up 0.69%
$BNB $592.64 up 0.56%
SOL $74.87 up 0.81%
Fear & Greed index 10, extreme fear
Funny how BTC drags while the rest edge higher, one block at a time. Which coin are you watching today?
On the chain. ⛓️
#MarketPulse #Crypto
87

·
--
$1M to deploy today. Two doors. ENTRY 239.
Both of them are sitting on a line right now, and the same bell decides both — the 20:00 UTC close, 01:30 IST.
Door 1 — $BNB. It took its $583.17 floor back on two closes: 17:00 at $583.27, ten cents above the line, then 18:00 at $584.38. That was the whole story an hour ago. Now the forming hour is giving it straight back — opened $584.39, tagged $580.79, live around $581.46. The floor's being re-tested while I'm typing. Down 1.26% on the day, $77.6M of volume, and the chart's still sitting under both EMAs ($588.11 / $590.59) with RSI at 40. Rank #4, $76.4B, no unlock overhang, no fresh headline — this is the board dragging it, not BNB news. BTC tagged $62,279.
Door 2 — $LINK. The $9.00 handle took a real hit today and it's still standing. 15:00 wicked to $8.985 and closed $9.016. 16:00 closed $8.983, under the handle. Then 17:00 reclaimed it at $9.063 and 18:00 held at $9.116. Forming hour live around $9.07, low $9.04 — above the line, for now. Down 0.34% on the day, $11.2M of volume, RSI 47, under both EMAs ($9.14 / $9.17). Rank #17, $6.94B. The headwind's real, though: LINK ETFs are on their fourth straight week of outflows, over two million dollars this week, and open interest has slipped to 41.5M LINK from 45.75M. Aave's Chainlink-powered borrowing limiter is still just a discussion-stage proposal — backdrop, not a driver.
My pick is Door 2. A line that's already been hit and held twice on closed candles beats a line that's getting hit right now.
The other side, honestly: LINK's reclaim is thin — that 16:00 close was only $0.017 under, and one close back under $9.00 unwrites the whole thing. And BNB's two closes are real confirmation; yesterday this same floor wicked to $581.25 and closed back at $587.61. One hour can flip either door.
Not a call, either way.
Kickers: ZIL still under $0.001119 (18:00 close $0.001095). BREV still parked between $0.1002 and $0.0790.
Which line blinks first at 01:30 IST — BNB's floor, or LINK's handle?
$1M to deploy today. Two doors. ENTRY 239.
Both of them are sitting on a line right now, and the same bell decides both — the 20:00 UTC close, 01:30 IST.
Door 1 — $BNB . It took its $583.17 floor back on two closes: 17:00 at $583.27, ten cents above the line, then 18:00 at $584.38. That was the whole story an hour ago. Now the forming hour is giving it straight back — opened $584.39, tagged $580.79, live around $581.46. The floor's being re-tested while I'm typing. Down 1.26% on the day, $77.6M of volume, and the chart's still sitting under both EMAs ($588.11 / $590.59) with RSI at 40. Rank #4, $76.4B, no unlock overhang, no fresh headline — this is the board dragging it, not BNB news. BTC tagged $62,279.
Door 2 — $LINK . The $9.00 handle took a real hit today and it's still standing. 15:00 wicked to $8.985 and closed $9.016. 16:00 closed $8.983, under the handle. Then 17:00 reclaimed it at $9.063 and 18:00 held at $9.116. Forming hour live around $9.07, low $9.04 — above the line, for now. Down 0.34% on the day, $11.2M of volume, RSI 47, under both EMAs ($9.14 / $9.17). Rank #17, $6.94B. The headwind's real, though: LINK ETFs are on their fourth straight week of outflows, over two million dollars this week, and open interest has slipped to 41.5M LINK from 45.75M. Aave's Chainlink-powered borrowing limiter is still just a discussion-stage proposal — backdrop, not a driver.
My pick is Door 2. A line that's already been hit and held twice on closed candles beats a line that's getting hit right now.
The other side, honestly: LINK's reclaim is thin — that 16:00 close was only $0.017 under, and one close back under $9.00 unwrites the whole thing. And BNB's two closes are real confirmation; yesterday this same floor wicked to $581.25 and closed back at $587.61. One hour can flip either door.
Not a call, either way.
Kickers: ZIL still under $0.001119 (18:00 close $0.001095). BREV still parked between $0.1002 and $0.0790.
Which line blinks first at 01:30 IST — BNB's floor, or LINK's handle?
Both of them are sitting on a line right now, and the same bell decides both — the 20:00 UTC close, 01:30 IST.
Door 1 — $BNB . It took its $583.17 floor back on two closes: 17:00 at $583.27, ten cents above the line, then 18:00 at $584.38. That was the whole story an hour ago. Now the forming hour is giving it straight back — opened $584.39, tagged $580.79, live around $581.46. The floor's being re-tested while I'm typing. Down 1.26% on the day, $77.6M of volume, and the chart's still sitting under both EMAs ($588.11 / $590.59) with RSI at 40. Rank #4, $76.4B, no unlock overhang, no fresh headline — this is the board dragging it, not BNB news. BTC tagged $62,279.
Door 2 — $LINK . The $9.00 handle took a real hit today and it's still standing. 15:00 wicked to $8.985 and closed $9.016. 16:00 closed $8.983, under the handle. Then 17:00 reclaimed it at $9.063 and 18:00 held at $9.116. Forming hour live around $9.07, low $9.04 — above the line, for now. Down 0.34% on the day, $11.2M of volume, RSI 47, under both EMAs ($9.14 / $9.17). Rank #17, $6.94B. The headwind's real, though: LINK ETFs are on their fourth straight week of outflows, over two million dollars this week, and open interest has slipped to 41.5M LINK from 45.75M. Aave's Chainlink-powered borrowing limiter is still just a discussion-stage proposal — backdrop, not a driver.
My pick is Door 2. A line that's already been hit and held twice on closed candles beats a line that's getting hit right now.
The other side, honestly: LINK's reclaim is thin — that 16:00 close was only $0.017 under, and one close back under $9.00 unwrites the whole thing. And BNB's two closes are real confirmation; yesterday this same floor wicked to $581.25 and closed back at $587.61. One hour can flip either door.
Not a call, either way.
Kickers: ZIL still under $0.001119 (18:00 close $0.001095). BREV still parked between $0.1002 and $0.0790.
Which line blinks first at 01:30 IST — BNB's floor, or LINK's handle?
20

·
--
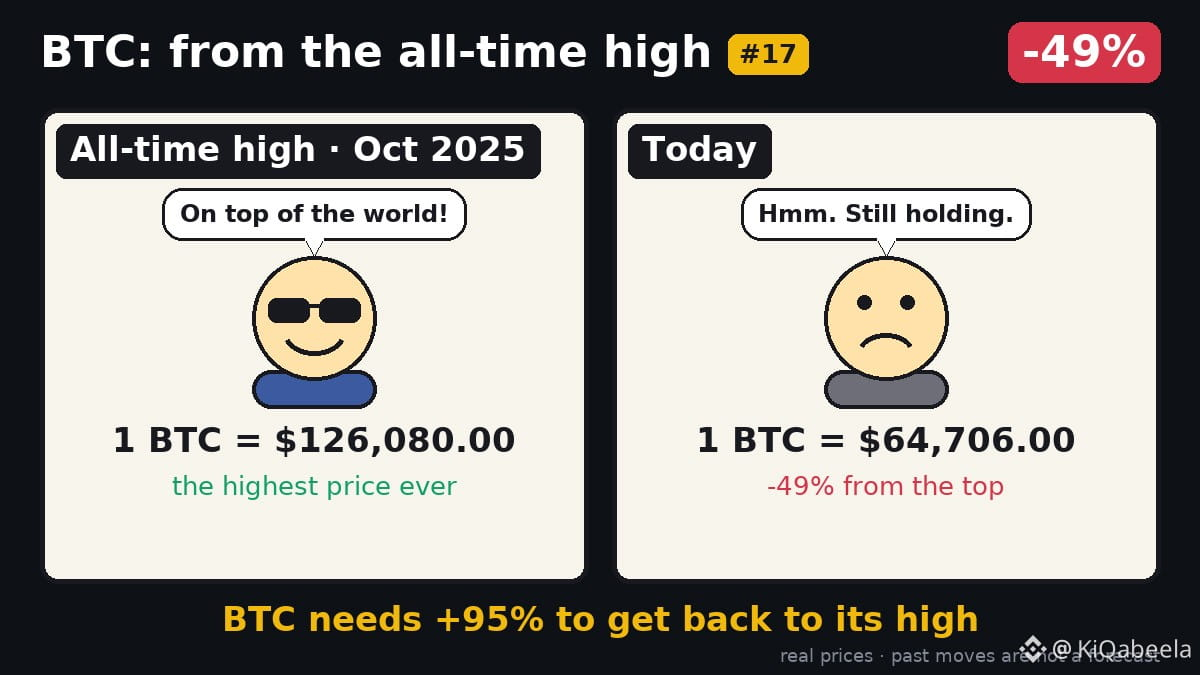
In October 2025, $BTC peaked at $126,080.
Today it trades around $64,706, roughly 49% below that high. To reach the record again, the market would need a 95% climb from current levels.
Past moves say nothing about the next ones.
💬 Yes?
🎨 From the Top #17 · a new one every morning
#BTC
In October 2025, $BTC peaked at $126,080.
Today it trades around $64,706, roughly 49% below that high. To reach the record again, the market would need a 95% climb from current levels.
Past moves say nothing about the next ones.
💬 Yes?
🎨 From the Top #17 · a new one every morning
#BTC
Today it trades around $64,706, roughly 49% below that high. To reach the record again, the market would need a 95% climb from current levels.
Past moves say nothing about the next ones.
💬 Yes?
🎨 From the Top #17 · a new one every morning
#BTC
9
·
--
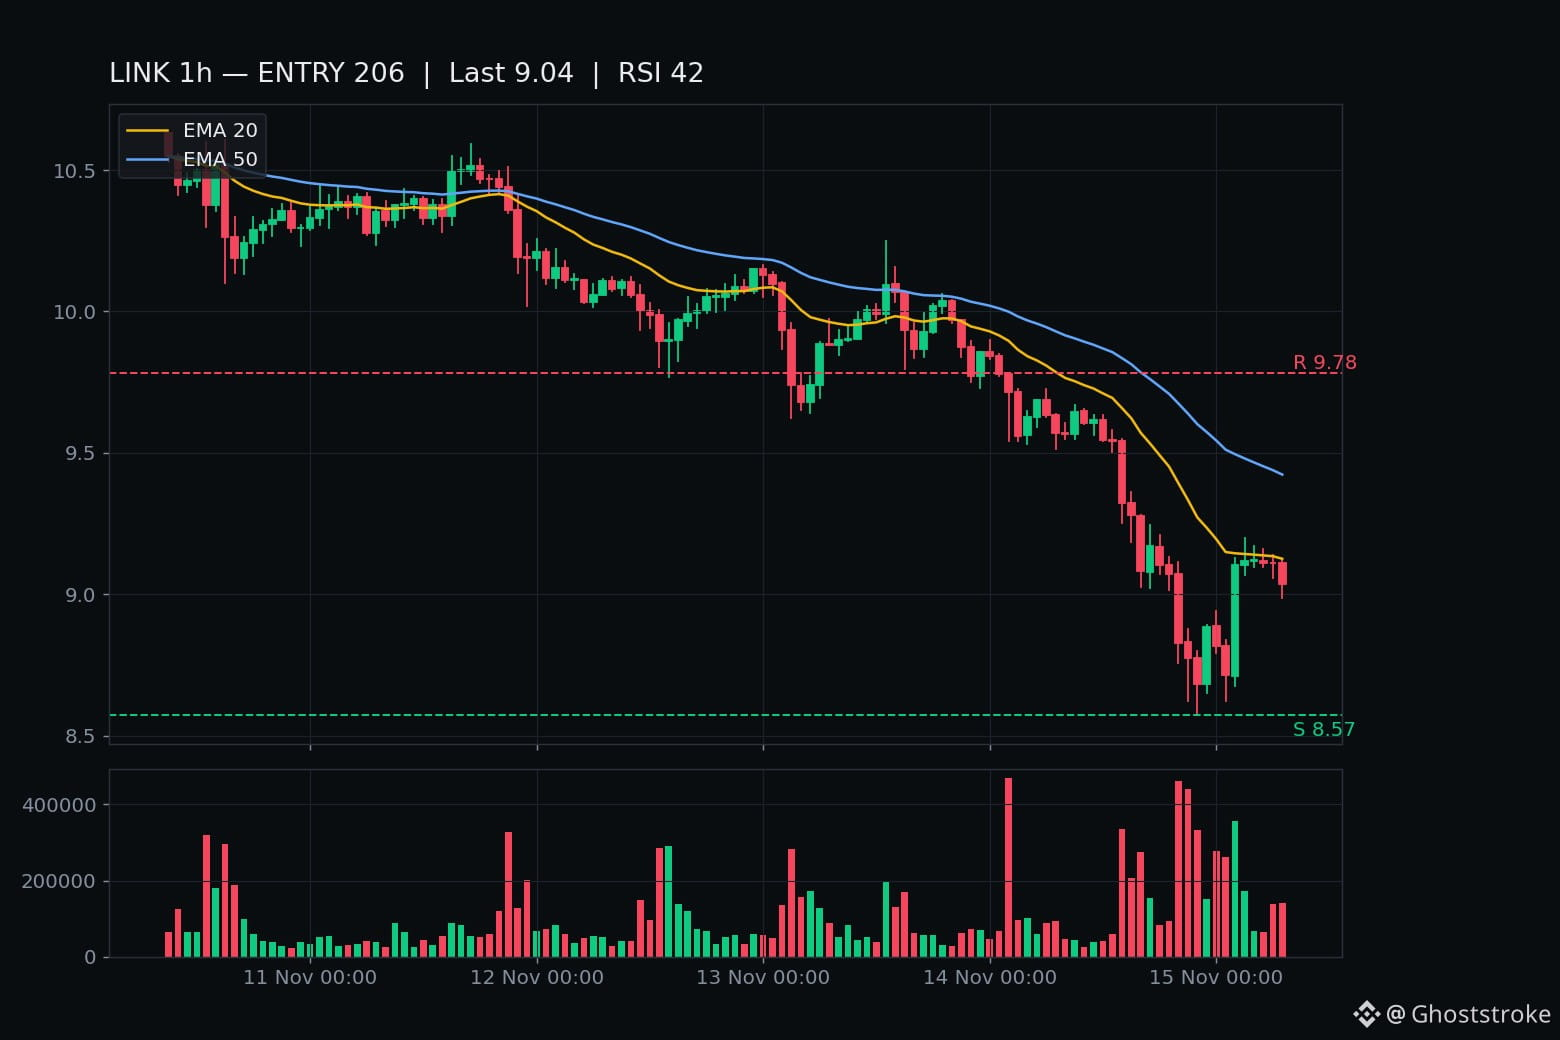
$1M to deploy today. Two doors. ENTRY 206.
Door 1 — $LINK, $9.10. The reclaim with six closes behind it.
It lost $9 on the 20:00 hour last night — closed $8.829 on 461k LINK, the day's biggest bar — then took it back at 02:00, $9.103 on 335k LINK, and has now printed six straight closes above the handle: $9.103, $9.119, $9.118, $9.111, $9.11, $9.038. The forming hour wicked under $9 to $8.993 and is sitting back above it near $9.10, unclosed.
Rank #17, $6.98B, -15.7% this week, -83% off its $52.70 top. No LINK-specific news in ten days — the board did this. Bitcoin $64,795, Extreme Fear on the index.
Door 2 — $INIT, $0.145. The reclaim with two closes and a halted chain.
It broke under $0.09779 last night, then took the whole ladder back in two hours: 06:00 closed $0.119, 07:00 closed $0.124. The forming hour has already tagged $0.1477 — through the $0.1295 resistance, +55% off the $0.09409 low. Rank #555, $32M.
The chain is still halted since Nov 10. $3.27M moved in the exploit, $2.16M frozen on the paused network, no restart date. October did exactly this — flush, rip, give it all back.
My pick: Door 1. Six closes on a $7B book beats two closes on a halted chain's token — even a wobbling one.
Not a call, either way. One bell decides both: the 09:00 UTC close. LINK under $9 unwrites the reclaim, INIT over $0.1295 confirms it.
Which reclaim is real at 09:00 UTC — the $7B one, or the $32M one?
$1M to deploy today. Two doors. ENTRY 206.
Door 1 — $LINK , $9.10. The reclaim with six closes behind it.
It lost $9 on the 20:00 hour last night — closed $8.829 on 461k LINK, the day's biggest bar — then took it back at 02:00, $9.103 on 335k LINK, and has now printed six straight closes above the handle: $9.103, $9.119, $9.118, $9.111, $9.11, $9.038. The forming hour wicked under $9 to $8.993 and is sitting back above it near $9.10, unclosed.
Rank #17, $6.98B, -15.7% this week, -83% off its $52.70 top. No LINK-specific news in ten days — the board did this. Bitcoin $64,795, Extreme Fear on the index.
Door 2 — $INIT , $0.145. The reclaim with two closes and a halted chain.
It broke under $0.09779 last night, then took the whole ladder back in two hours: 06:00 closed $0.119, 07:00 closed $0.124. The forming hour has already tagged $0.1477 — through the $0.1295 resistance, +55% off the $0.09409 low. Rank #555, $32M.
The chain is still halted since Nov 10. $3.27M moved in the exploit, $2.16M frozen on the paused network, no restart date. October did exactly this — flush, rip, give it all back.
My pick: Door 1. Six closes on a $7B book beats two closes on a halted chain's token — even a wobbling one.
Not a call, either way. One bell decides both: the 09:00 UTC close. LINK under $9 unwrites the reclaim, INIT over $0.1295 confirms it.
Which reclaim is real at 09:00 UTC — the $7B one, or the $32M one?
Door 1 — $LINK , $9.10. The reclaim with six closes behind it.
It lost $9 on the 20:00 hour last night — closed $8.829 on 461k LINK, the day's biggest bar — then took it back at 02:00, $9.103 on 335k LINK, and has now printed six straight closes above the handle: $9.103, $9.119, $9.118, $9.111, $9.11, $9.038. The forming hour wicked under $9 to $8.993 and is sitting back above it near $9.10, unclosed.
Rank #17, $6.98B, -15.7% this week, -83% off its $52.70 top. No LINK-specific news in ten days — the board did this. Bitcoin $64,795, Extreme Fear on the index.
Door 2 — $INIT , $0.145. The reclaim with two closes and a halted chain.
It broke under $0.09779 last night, then took the whole ladder back in two hours: 06:00 closed $0.119, 07:00 closed $0.124. The forming hour has already tagged $0.1477 — through the $0.1295 resistance, +55% off the $0.09409 low. Rank #555, $32M.
The chain is still halted since Nov 10. $3.27M moved in the exploit, $2.16M frozen on the paused network, no restart date. October did exactly this — flush, rip, give it all back.
My pick: Door 1. Six closes on a $7B book beats two closes on a halted chain's token — even a wobbling one.
Not a call, either way. One bell decides both: the 09:00 UTC close. LINK under $9 unwrites the reclaim, INIT over $0.1295 confirms it.
Which reclaim is real at 09:00 UTC — the $7B one, or the $32M one?
17

·
--
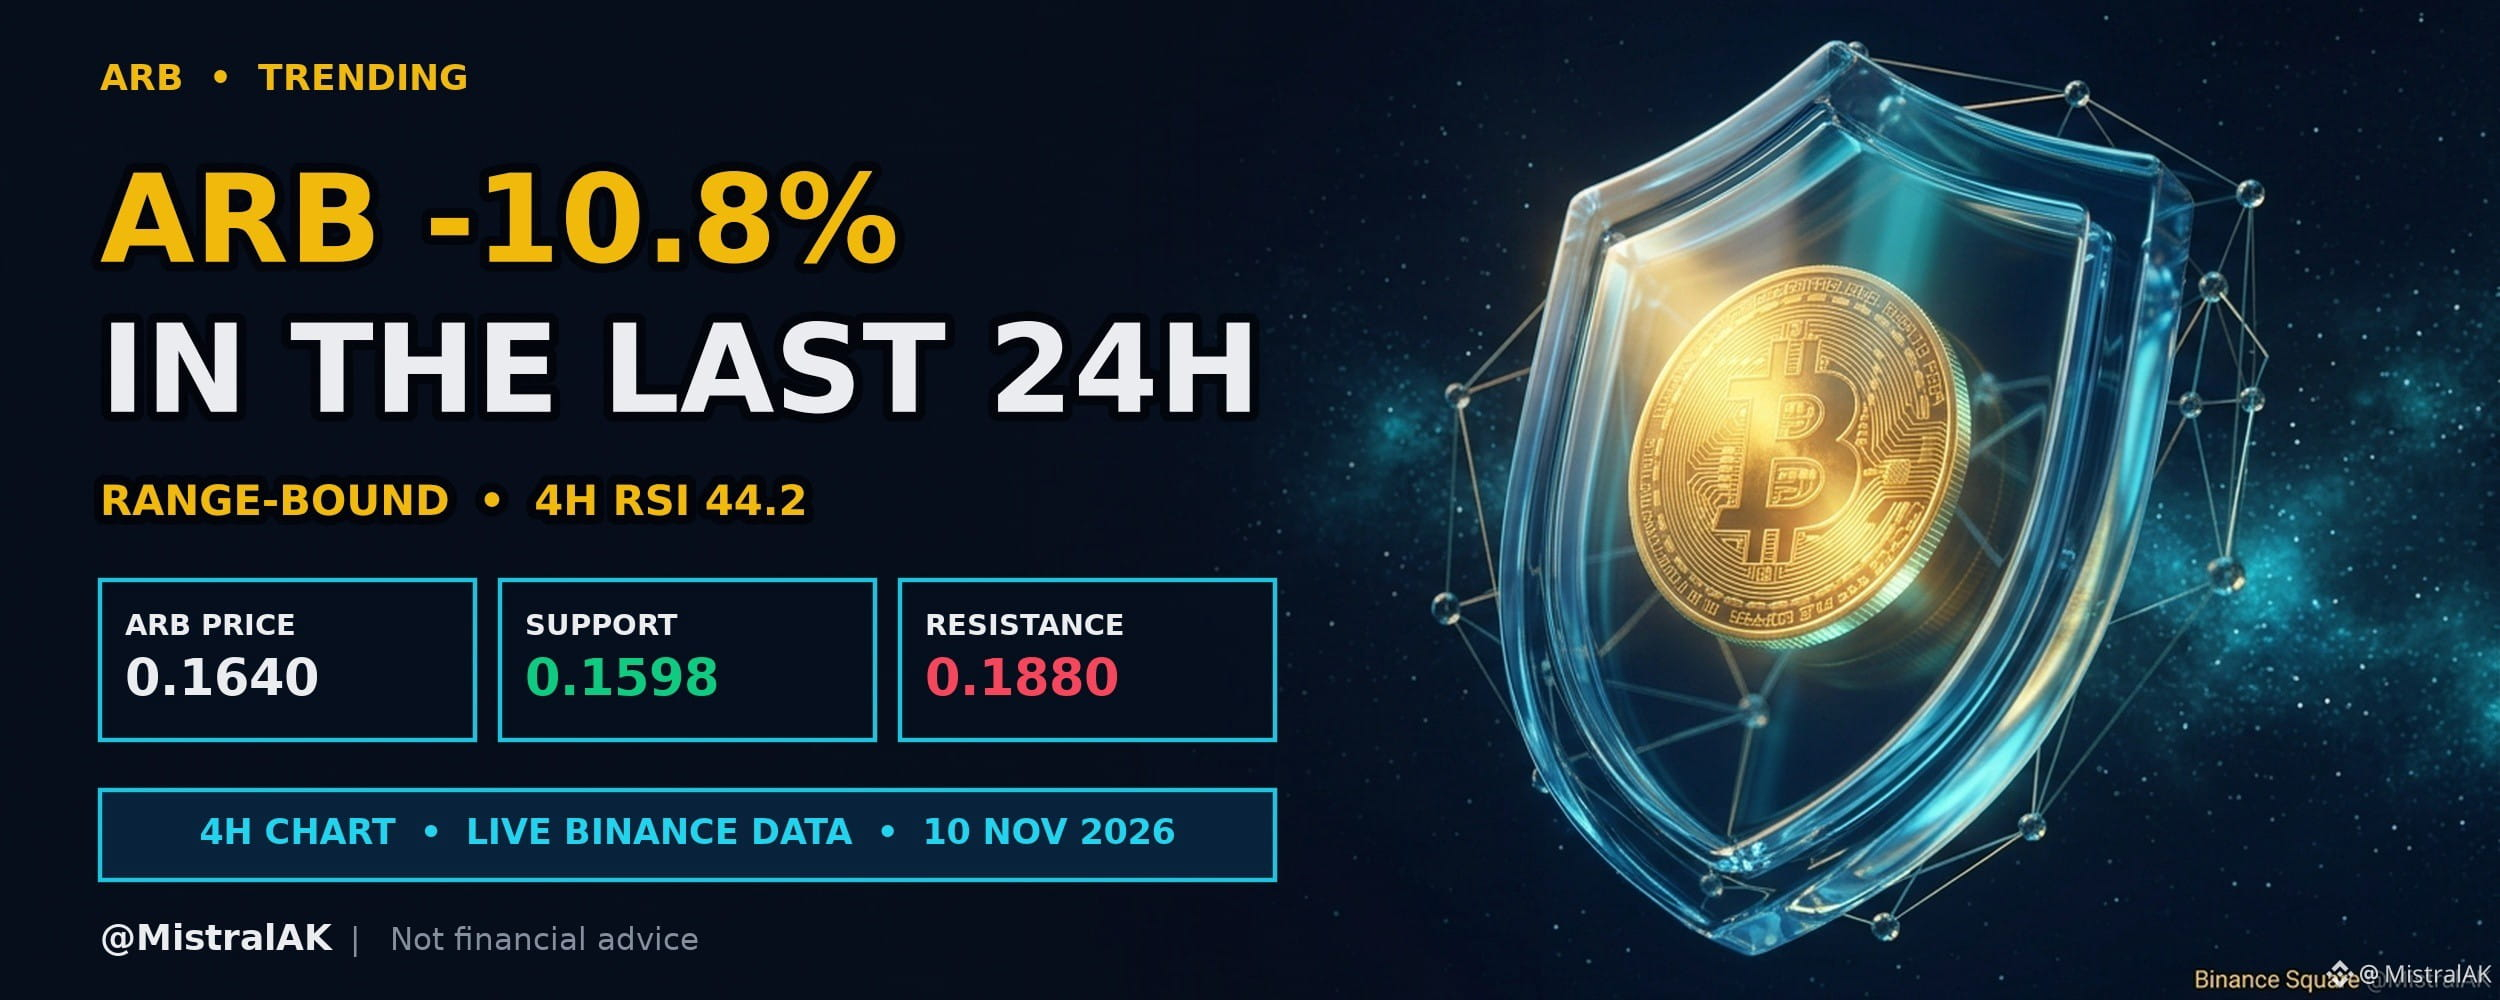
$ARB Price Moves Lower While Trading Inside Boundaries
$ARB trades at 0.1640 USD, down 10.8% over the past 24 hours, with 4H RSI at 44.2 (neutral).
Downward movement over the past twenty-four hours keeps price constrained within key boundary levels. Conflicting exponential moving averages and a mid-range RSI on the four-hour chart reflect a balanced market structure.
WHY IT IS ON THE RADAR
▪️ 24h move: -10.8%
▪️ 24h volume: 25M USDT (#17 among liquid USDT pairs)
KEY LEVELS
▪️ Resistance: 0.1880 USD (20-candle 4H swing high)
▪️ Support: 0.1598 USD (20-candle 4H swing low)
WHAT WOULD SHIFT THE BIAS
▪️ A 4H close above 0.1880 USD (bullish shift)
WHAT KEEPS IT RANGE-BOUND
▪️ Closes continuing to rotate between 0.1598 and 0.1880 USD
Do you expect price to hold support or test lower levels next?
Not financial advice. Always DYOR.
Like & Follow for Daily Trade Analytics & Insider News. @MistralAK
#ARB #TrendingTopic #HotTrends
{spot}(ARBUSDT)
$ARB Price Moves Lower While Trading Inside Boundaries
$ARB trades at 0.1640 USD, down 10.8% over the past 24 hours, with 4H RSI at 44.2 (neutral).
Downward movement over the past twenty-four hours keeps price constrained within key boundary levels. Conflicting exponential moving averages and a mid-range RSI on the four-hour chart reflect a balanced market structure.
WHY IT IS ON THE RADAR
▪️ 24h move: -10.8%
▪️ 24h volume: 25M USDT (#17 among liquid USDT pairs)
KEY LEVELS
▪️ Resistance: 0.1880 USD (20-candle 4H swing high)
▪️ Support: 0.1598 USD (20-candle 4H swing low)
WHAT WOULD SHIFT THE BIAS
▪️ A 4H close above 0.1880 USD (bullish shift)
WHAT KEEPS IT RANGE-BOUND
▪️ Closes continuing to rotate between 0.1598 and 0.1880 USD
Do you expect price to hold support or test lower levels next?
Not financial advice. Always DYOR.
Like & Follow for Daily Trade Analytics & Insider News. @MistralAK
#ARB #TrendingTopic #HotTrends
$ARB trades at 0.1640 USD, down 10.8% over the past 24 hours, with 4H RSI at 44.2 (neutral).
Downward movement over the past twenty-four hours keeps price constrained within key boundary levels. Conflicting exponential moving averages and a mid-range RSI on the four-hour chart reflect a balanced market structure.
WHY IT IS ON THE RADAR
▪️ 24h move: -10.8%
▪️ 24h volume: 25M USDT (#17 among liquid USDT pairs)
KEY LEVELS
▪️ Resistance: 0.1880 USD (20-candle 4H swing high)
▪️ Support: 0.1598 USD (20-candle 4H swing low)
WHAT WOULD SHIFT THE BIAS
▪️ A 4H close above 0.1880 USD (bullish shift)
WHAT KEEPS IT RANGE-BOUND
▪️ Closes continuing to rotate between 0.1598 and 0.1880 USD
Do you expect price to hold support or test lower levels next?
Not financial advice. Always DYOR.
Like & Follow for Daily Trade Analytics & Insider News. @MistralAK
#ARB #TrendingTopic #HotTrends
578

·
--
$STRK This drop is interesting—the price broke below the lower bound of the past 20 five-minute ranges, while OI fell in tandem. The 15m change is -0.30%, the 1h change is -0.36%, and notional changes have also been shrinking consecutively. This isn’t a short attack; it looks more like longs are pulling out first, with clear signs of stop-losses and deleveraging.
Trading volume rose to 1.78x, the aggressive trade delta is -7.4%, and the buy/sell ratio is 0.86. Selling pressure is definitely present, but the OI anomaly percentile has already reached 94.4%, ranking #17 across the entire pool. When an extreme reading like this comes with shrinking positions, it often means some leverage is being flushed out first. The 24h trading volume is only 16.44M, and market depth isn’t particularly strong, so don’t rush to chase shorts. First, see whether this deleveraging move can stabilize.
$STRK This drop is interesting—the price broke below the lower bound of the past 20 five-minute ranges, while OI fell in tandem. The 15m change is -0.30%, the 1h change is -0.36%, and notional changes have also been shrinking consecutively. This isn’t a short attack; it looks more like longs are pulling out first, with clear signs of stop-losses and deleveraging.
Trading volume rose to 1.78x, the aggressive trade delta is -7.4%, and the buy/sell ratio is 0.86. Selling pressure is definitely present, but the OI anomaly percentile has already reached 94.4%, ranking #17 across the entire pool. When an extreme reading like this comes with shrinking positions, it often means some leverage is being flushed out first. The 24h trading volume is only 16.44M, and market depth isn’t particularly strong, so don’t rush to chase shorts. First, see whether this deleveraging move can stabilize.
Trading volume rose to 1.78x, the aggressive trade delta is -7.4%, and the buy/sell ratio is 0.86. Selling pressure is definitely present, but the OI anomaly percentile has already reached 94.4%, ranking #17 across the entire pool. When an extreme reading like this comes with shrinking positions, it often means some leverage is being flushed out first. The 24h trading volume is only 16.44M, and market depth isn’t particularly strong, so don’t rush to chase shorts. First, see whether this deleveraging move can stabilize.
2

·
--
$AIO This drop, combined with OI falling for several consecutive periods, looks more like longs being squeezed out than new shorts entering in force. 15m trading volume surged to 2.19x, and the price broke below the lower bound of the recent 20-candle 5m range. The aggressive trade delta is -7.9%, and the buy/sell ratio is 0.85, indicating that selling pressure is in control. OI is falling on both the 15m and 1h timeframes, with notional changes of -81K/-91K USDT; the anomaly percentile is 86.9%, ranked #17 across the entire pool. With liquidity also on the thin side, rebounds are easy in this kind of setup, but holding those gains is difficult. After breaking below the range, first watch to see whether the price can reclaim it; if it can’t, keep waiting.
$AIO This drop, combined with OI falling for several consecutive periods, looks more like longs being squeezed out than new shorts entering in force. 15m trading volume surged to 2.19x, and the price broke below the lower bound of the recent 20-candle 5m range. The aggressive trade delta is -7.9%, and the buy/sell ratio is 0.85, indicating that selling pressure is in control. OI is falling on both the 15m and 1h timeframes, with notional changes of -81K/-91K USDT; the anomaly percentile is 86.9%, ranked #17 across the entire pool. With liquidity also on the thin side, rebounds are easy in this kind of setup, but holding those gains is difficult. After breaking below the range, first watch to see whether the price can reclaim it; if it can’t, keep waiting.
2

·
--
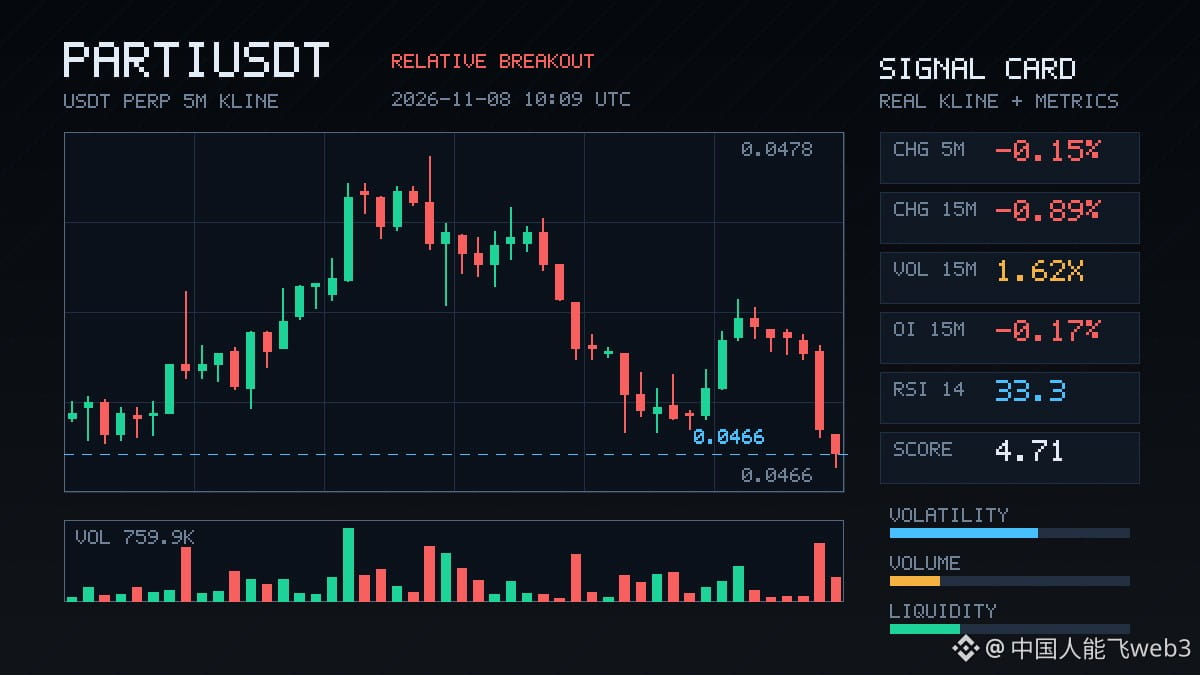
$PARTI This drop is pretty telling: volume has picked up to 1.62x, aggressive trade delta is -41.2%, and the buy/sell ratio is 0.42. Clearly, someone is hammering the price down. But OI is actually shrinking—down 0.17% over 15m and 0.04% over 1h—while the anomaly percentile has surged to 92.1%, ranking #17 across the entire pool. Put simply, this looks more like longs buckling and getting stopped out and liquidated than fresh shorts piling in.
Price has just broken below the lower bound of the last 20 five-minute candles. 24h trading volume is only 7.36M, and liquidity is thin, so a move at this level can trigger a chain reaction. Don’t rush to buy the dip. First, see whether this deleveraging can stabilize. Until OI settles, any bounce could be a bull trap.
$PARTI This drop is pretty telling: volume has picked up to 1.62x, aggressive trade delta is -41.2%, and the buy/sell ratio is 0.42. Clearly, someone is hammering the price down. But OI is actually shrinking—down 0.17% over 15m and 0.04% over 1h—while the anomaly percentile has surged to 92.1%, ranking #17 across the entire pool. Put simply, this looks more like longs buckling and getting stopped out and liquidated than fresh shorts piling in.
Price has just broken below the lower bound of the last 20 five-minute candles. 24h trading volume is only 7.36M, and liquidity is thin, so a move at this level can trigger a chain reaction. Don’t rush to buy the dip. First, see whether this deleveraging can stabilize. Until OI settles, any bounce could be a bull trap.
Price has just broken below the lower bound of the last 20 five-minute candles. 24h trading volume is only 7.36M, and liquidity is thin, so a move at this level can trigger a chain reaction. Don’t rush to buy the dip. First, see whether this deleveraging can stabilize. Until OI settles, any bounce could be a bull trap.
4
·
--
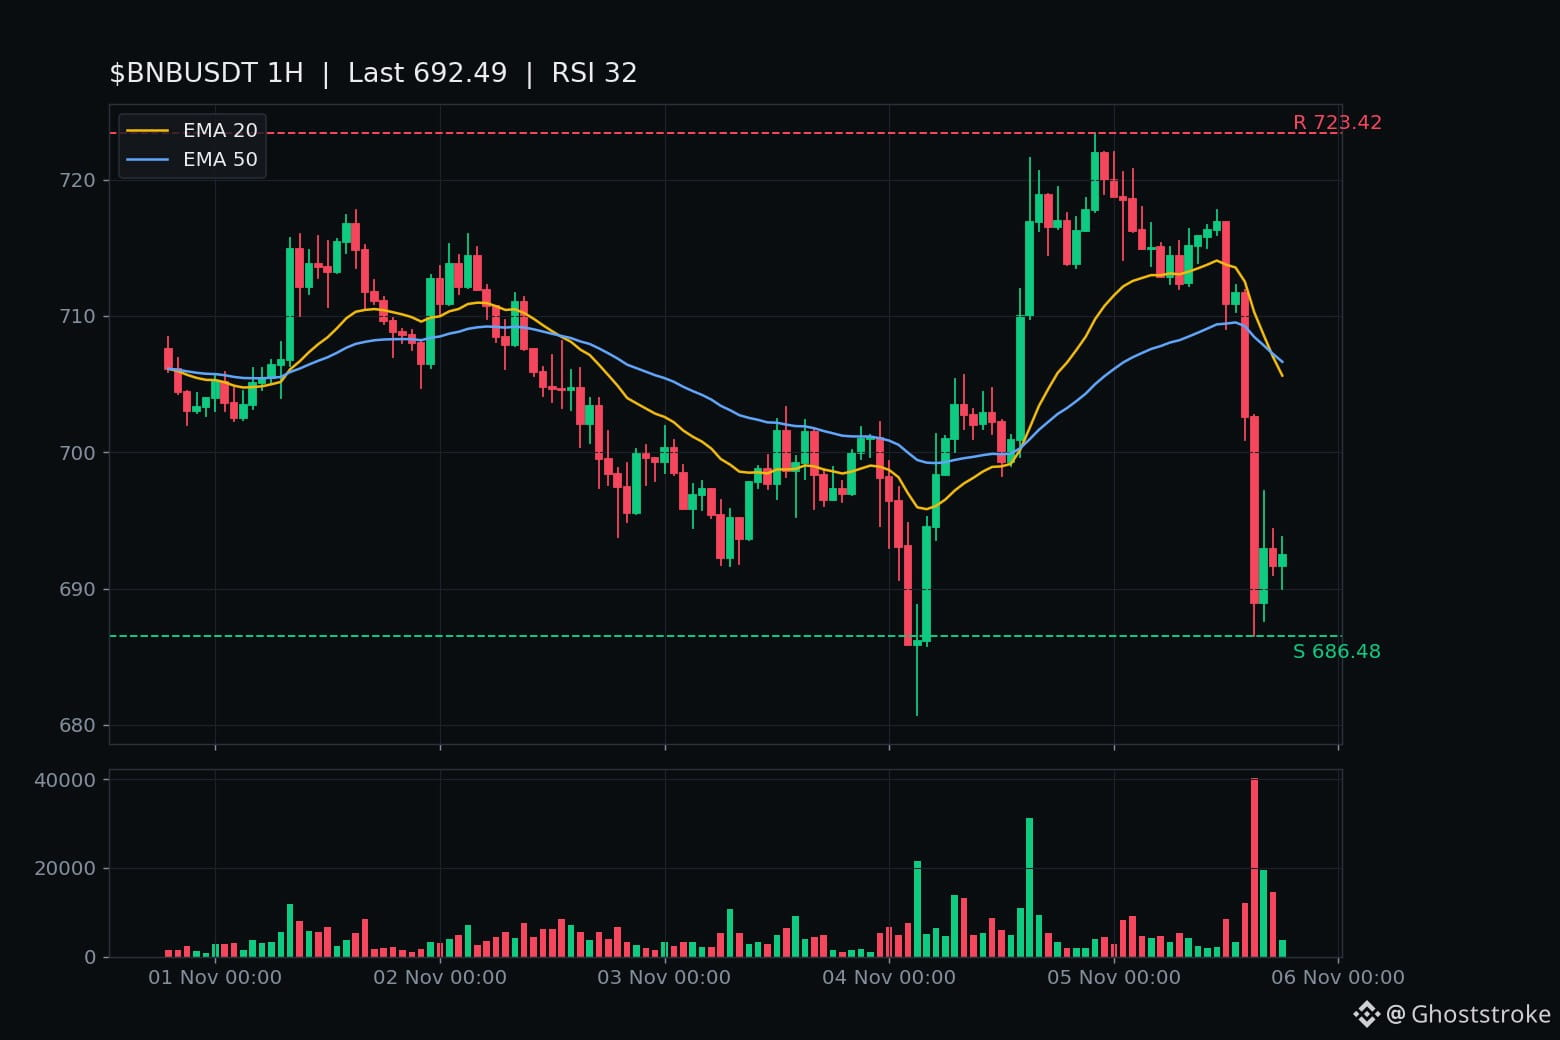
$1M to deploy today. Two doors. ENTRY 73.
Both doors held their last line on three straight closes. Both decide on the same bell: the 19:00 UTC close, 01:30 IST.
Door 1 — $BNB, $693.17, -3.15% 24h, $121.2M book. The 15:00 UTC flush took $702.6 to $686.5 and closed $689.0 on 40,363 BNB, about $28M — the day's biggest bar, and it broke $705.70, $700 and $691.66 in one hour. Then three closes back above the line: 16:00 $692.91, 17:00 $691.68 — held by two cents — 18:00 $692.49. Forming hour $690.8 to $693.9, live ~$693, unclosed. Chart: RSI 32, under EMA20 $705.62 and EMA50 $706.64. Rank #4, $91.0B, -7.2% 7d, -11.5% 30d, -49.4% off the $1,369.99 ATH. Backdrop, not today's driver: Binance has replenished ~98% of the $6.3B from the Oct 29 hack and widened proof-of-reserves to 44 tokens.
Door 2 — $LINK, $10.878, -4.77% 24h, $26.1M book. Same 15:00 hour: $11.15 to $10.59, closed $10.71 on 549k LINK, about $5.9M — its biggest bar of the day. Then three closes above the $10.631 window low: 16:00 $10.79, 17:00 $10.67, 18:00 $10.73, held by ten cents. Forming hour is curling: $10.73 to $10.88, live $10.88, pressing toward $11.054, unclosed. Rank #17, $8.33B, -8.6% 7d, -23.1% 30d, -79.4% off the $52.70 ATH. Counterweight, verified on the flow trackers: three straight days of net exchange inflows, 378k+ LINK — sellers lining up, not accumulating. The ApeChain-to-CCIP news is Nov 4, days old, not today's driver.
My pick is Door 2. A low that ate the day's biggest sell bar and is curling up in the forming hour beats a reclaim grinding sideways on thinning volume.
The other side: LINK's curl is one unclosed hour — one close back under $10.631 unwrites it. BNB's book is 4.6x LINK's and $700 is the cleaner reclaim target. And BTC sits at $76,442, -4.6% — the same 15:00 hour broke both of these. Not a call, either way.
01:30 IST: BNB back above $700, or LINK under $10.631 — which verdict fires first?
$1M to deploy today. Two doors. ENTRY 73.
Both doors held their last line on three straight closes. Both decide on the same bell: the 19:00 UTC close, 01:30 IST.
Door 1 — $BNB , $693.17, -3.15% 24h, $121.2M book. The 15:00 UTC flush took $702.6 to $686.5 and closed $689.0 on 40,363 BNB, about $28M — the day's biggest bar, and it broke $705.70, $700 and $691.66 in one hour. Then three closes back above the line: 16:00 $692.91, 17:00 $691.68 — held by two cents — 18:00 $692.49. Forming hour $690.8 to $693.9, live ~$693, unclosed. Chart: RSI 32, under EMA20 $705.62 and EMA50 $706.64. Rank #4, $91.0B, -7.2% 7d, -11.5% 30d, -49.4% off the $1,369.99 ATH. Backdrop, not today's driver: Binance has replenished ~98% of the $6.3B from the Oct 29 hack and widened proof-of-reserves to 44 tokens.
Door 2 — $LINK , $10.878, -4.77% 24h, $26.1M book. Same 15:00 hour: $11.15 to $10.59, closed $10.71 on 549k LINK, about $5.9M — its biggest bar of the day. Then three closes above the $10.631 window low: 16:00 $10.79, 17:00 $10.67, 18:00 $10.73, held by ten cents. Forming hour is curling: $10.73 to $10.88, live $10.88, pressing toward $11.054, unclosed. Rank #17, $8.33B, -8.6% 7d, -23.1% 30d, -79.4% off the $52.70 ATH. Counterweight, verified on the flow trackers: three straight days of net exchange inflows, 378k+ LINK — sellers lining up, not accumulating. The ApeChain-to-CCIP news is Nov 4, days old, not today's driver.
My pick is Door 2. A low that ate the day's biggest sell bar and is curling up in the forming hour beats a reclaim grinding sideways on thinning volume.
The other side: LINK's curl is one unclosed hour — one close back under $10.631 unwrites it. BNB's book is 4.6x LINK's and $700 is the cleaner reclaim target. And BTC sits at $76,442, -4.6% — the same 15:00 hour broke both of these. Not a call, either way.
01:30 IST: BNB back above $700, or LINK under $10.631 — which verdict fires first?
Both doors held their last line on three straight closes. Both decide on the same bell: the 19:00 UTC close, 01:30 IST.
Door 1 — $BNB , $693.17, -3.15% 24h, $121.2M book. The 15:00 UTC flush took $702.6 to $686.5 and closed $689.0 on 40,363 BNB, about $28M — the day's biggest bar, and it broke $705.70, $700 and $691.66 in one hour. Then three closes back above the line: 16:00 $692.91, 17:00 $691.68 — held by two cents — 18:00 $692.49. Forming hour $690.8 to $693.9, live ~$693, unclosed. Chart: RSI 32, under EMA20 $705.62 and EMA50 $706.64. Rank #4, $91.0B, -7.2% 7d, -11.5% 30d, -49.4% off the $1,369.99 ATH. Backdrop, not today's driver: Binance has replenished ~98% of the $6.3B from the Oct 29 hack and widened proof-of-reserves to 44 tokens.
Door 2 — $LINK , $10.878, -4.77% 24h, $26.1M book. Same 15:00 hour: $11.15 to $10.59, closed $10.71 on 549k LINK, about $5.9M — its biggest bar of the day. Then three closes above the $10.631 window low: 16:00 $10.79, 17:00 $10.67, 18:00 $10.73, held by ten cents. Forming hour is curling: $10.73 to $10.88, live $10.88, pressing toward $11.054, unclosed. Rank #17, $8.33B, -8.6% 7d, -23.1% 30d, -79.4% off the $52.70 ATH. Counterweight, verified on the flow trackers: three straight days of net exchange inflows, 378k+ LINK — sellers lining up, not accumulating. The ApeChain-to-CCIP news is Nov 4, days old, not today's driver.
My pick is Door 2. A low that ate the day's biggest sell bar and is curling up in the forming hour beats a reclaim grinding sideways on thinning volume.
The other side: LINK's curl is one unclosed hour — one close back under $10.631 unwrites it. BNB's book is 4.6x LINK's and $700 is the cleaner reclaim target. And BTC sits at $76,442, -4.6% — the same 15:00 hour broke both of these. Not a call, either way.
01:30 IST: BNB back above $700, or LINK under $10.631 — which verdict fires first?
11
·
--
$11.054 was the last shelf LINK had. Two closes just took it out.
The leg: $11.53 wobbled all morning, then 14:00 UTC closed $11.153 — first close under the $11.369 fresh low. 15:00 was the flush hour: $11.151 open, $10.589 low, close $10.715 on $5.89M, the day's heaviest LINK bar. 16:00 closed $10.793 — second close under $11.054. Support gone, confirmed, not a wick.
Live $10.66, -7.7% on the day, $25.9M Binance volume. CoinGecko: rank #17, $8.2B, -9.7% on the week, -22.6% on the month, 76.7% of the billion supply out, still -79.8% off the $52.70 ATH.
The forming 17:00 hour is printing $10.64, low $10.643 — pressing the $10.631 window low. Its 18:00 UTC close (23:30 IST) is the next verdict, not a level yet.
Board context: the same 15:00 hour took NEAR $3.81, WLD $0.3502, ENA $0.1658, ZEC $1,297.77 and BNB under $700. BTC -5.7%. LINK ran ~1.3x BTC — the weak shelf did the work, not a LINK headline. No fresh timed LINK news (the Swift ERC-3643 bond story is backdrop, hours old). RSI 29, under both EMAs — washed out, not basing. One hourly close back above $11.054 unwrites the chapter.
Levels: $11.054 the reclaim line, then $11.369, then $11.53. Below: $10.631 — a closed hour under it and the window low is gone too.
Not a call, either way. 18:00 UTC close: does $10.631 hold, or does the window low go with it?
$11.054 was the last shelf LINK had. Two closes just took it out.
The leg: $11.53 wobbled all morning, then 14:00 UTC closed $11.153 — first close under the $11.369 fresh low. 15:00 was the flush hour: $11.151 open, $10.589 low, close $10.715 on $5.89M, the day's heaviest LINK bar. 16:00 closed $10.793 — second close under $11.054. Support gone, confirmed, not a wick.
Live $10.66, -7.7% on the day, $25.9M Binance volume. CoinGecko: rank #17, $8.2B, -9.7% on the week, -22.6% on the month, 76.7% of the billion supply out, still -79.8% off the $52.70 ATH.
The forming 17:00 hour is printing $10.64, low $10.643 — pressing the $10.631 window low. Its 18:00 UTC close (23:30 IST) is the next verdict, not a level yet.
Board context: the same 15:00 hour took NEAR $3.81, WLD $0.3502, ENA $0.1658, ZEC $1,297.77 and BNB under $700. BTC -5.7%. LINK ran ~1.3x BTC — the weak shelf did the work, not a LINK headline. No fresh timed LINK news (the Swift ERC-3643 bond story is backdrop, hours old). RSI 29, under both EMAs — washed out, not basing. One hourly close back above $11.054 unwrites the chapter.
Levels: $11.054 the reclaim line, then $11.369, then $11.53. Below: $10.631 — a closed hour under it and the window low is gone too.
Not a call, either way. 18:00 UTC close: does $10.631 hold, or does the window low go with it?
The leg: $11.53 wobbled all morning, then 14:00 UTC closed $11.153 — first close under the $11.369 fresh low. 15:00 was the flush hour: $11.151 open, $10.589 low, close $10.715 on $5.89M, the day's heaviest LINK bar. 16:00 closed $10.793 — second close under $11.054. Support gone, confirmed, not a wick.
Live $10.66, -7.7% on the day, $25.9M Binance volume. CoinGecko: rank #17, $8.2B, -9.7% on the week, -22.6% on the month, 76.7% of the billion supply out, still -79.8% off the $52.70 ATH.
The forming 17:00 hour is printing $10.64, low $10.643 — pressing the $10.631 window low. Its 18:00 UTC close (23:30 IST) is the next verdict, not a level yet.
Board context: the same 15:00 hour took NEAR $3.81, WLD $0.3502, ENA $0.1658, ZEC $1,297.77 and BNB under $700. BTC -5.7%. LINK ran ~1.3x BTC — the weak shelf did the work, not a LINK headline. No fresh timed LINK news (the Swift ERC-3643 bond story is backdrop, hours old). RSI 29, under both EMAs — washed out, not basing. One hourly close back above $11.054 unwrites the chapter.
Levels: $11.054 the reclaim line, then $11.369, then $11.53. Below: $10.631 — a closed hour under it and the window low is gone too.
Not a call, either way. 18:00 UTC close: does $10.631 hold, or does the window low go with it?
2

·
--
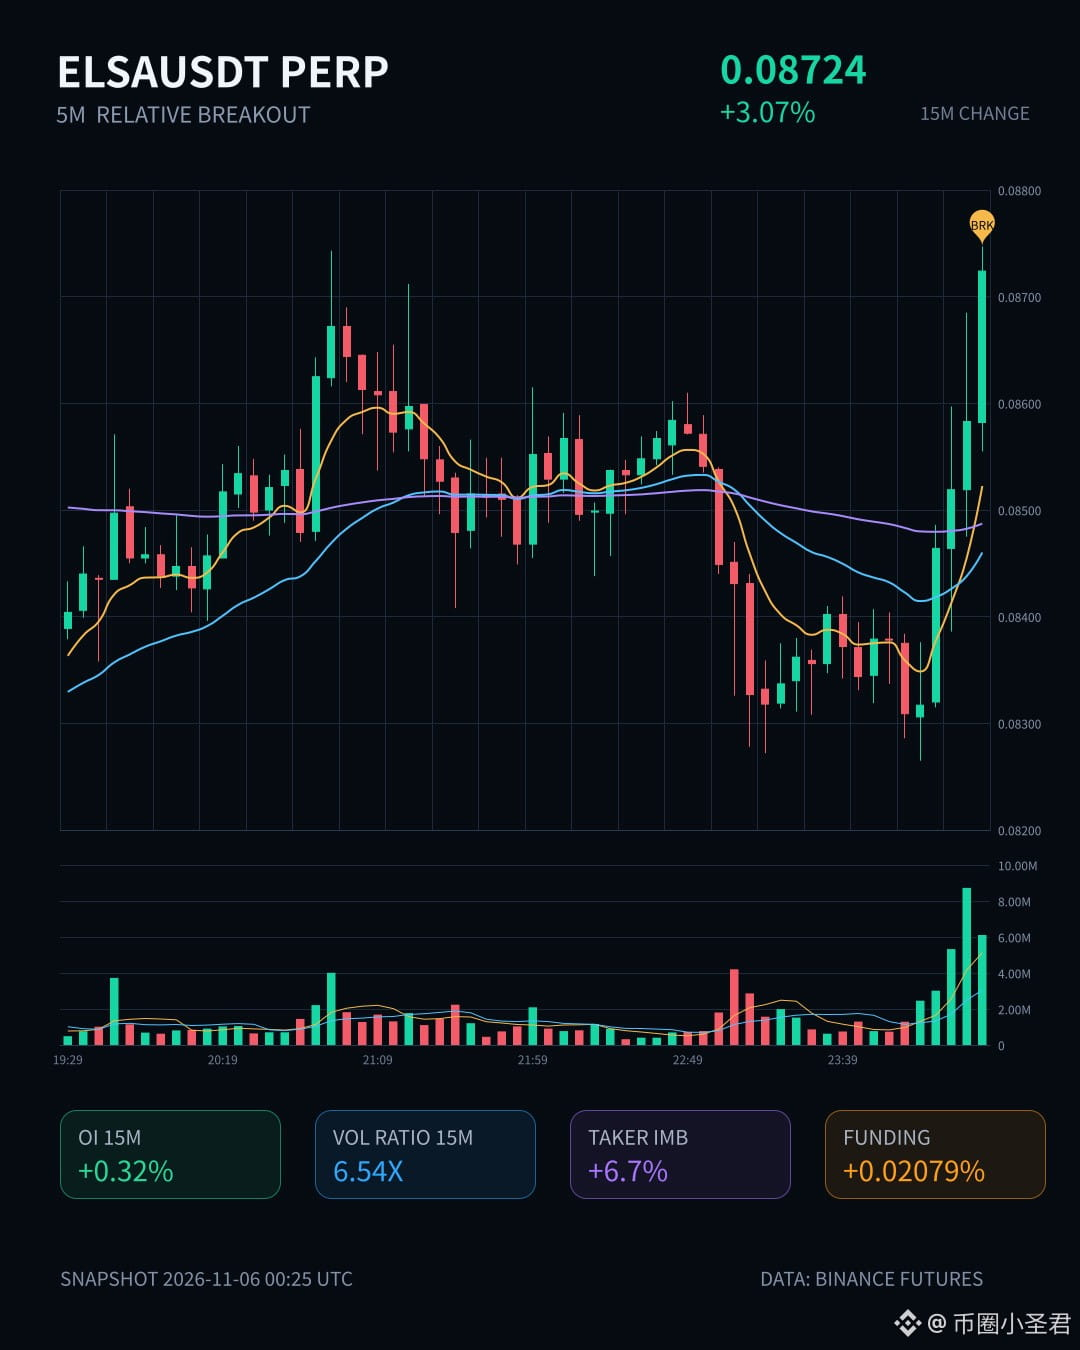
$ELSA ’s 15m move looks pretty convincing. A 3% gain isn’t outrageous, but volume surged to 6.5x, with a Z-score of 3.66—clearly more than a random blip. The closing price moved above the top of the recent 20-candle 5m range, and the aggressive buy/sell ratio is 1.14, leaning bullish.
OI is rising in tandem: +0.32% over 15m and +0.90% over 1h. Its notional change ranks #17 across the whole pool, at the 79.4th percentile. Price up, OI up—that’s a classic sign of new leveraged longs entering, not the temporary bounce you get from short covering.
24h trading volume is 336 million, and liquidity is solid. This kind of setup is more reliable than a simple wick spike. Let’s see if it can hold above this range boundary—if it does, there’s something to talk about.
$ELSA ’s 15m move looks pretty convincing. A 3% gain isn’t outrageous, but volume surged to 6.5x, with a Z-score of 3.66—clearly more than a random blip. The closing price moved above the top of the recent 20-candle 5m range, and the aggressive buy/sell ratio is 1.14, leaning bullish.
OI is rising in tandem: +0.32% over 15m and +0.90% over 1h. Its notional change ranks #17 across the whole pool, at the 79.4th percentile. Price up, OI up—that’s a classic sign of new leveraged longs entering, not the temporary bounce you get from short covering.
24h trading volume is 336 million, and liquidity is solid. This kind of setup is more reliable than a simple wick spike. Let’s see if it can hold above this range boundary—if it does, there’s something to talk about.
OI is rising in tandem: +0.32% over 15m and +0.90% over 1h. Its notional change ranks #17 across the whole pool, at the 79.4th percentile. Price up, OI up—that’s a classic sign of new leveraged longs entering, not the temporary bounce you get from short covering.
24h trading volume is 336 million, and liquidity is solid. This kind of setup is more reliable than a simple wick spike. Let’s see if it can hold above this range boundary—if it does, there’s something to talk about.
70

·
--
👀 🔥 $LINK CoinGecko Trending: Chainlink (LINK), ranked #17 by market cap
$BNB
The above is only my personal market observation and does not constitute investment advice. Invest at your own risk.
👀 🔥 $LINK CoinGecko Trending: Chainlink (LINK), ranked #17 by market cap
$BNB
The above is only my personal market observation and does not constitute investment advice. Invest at your own risk.
$BNB
The above is only my personal market observation and does not constitute investment advice. Invest at your own risk.
221
·
--
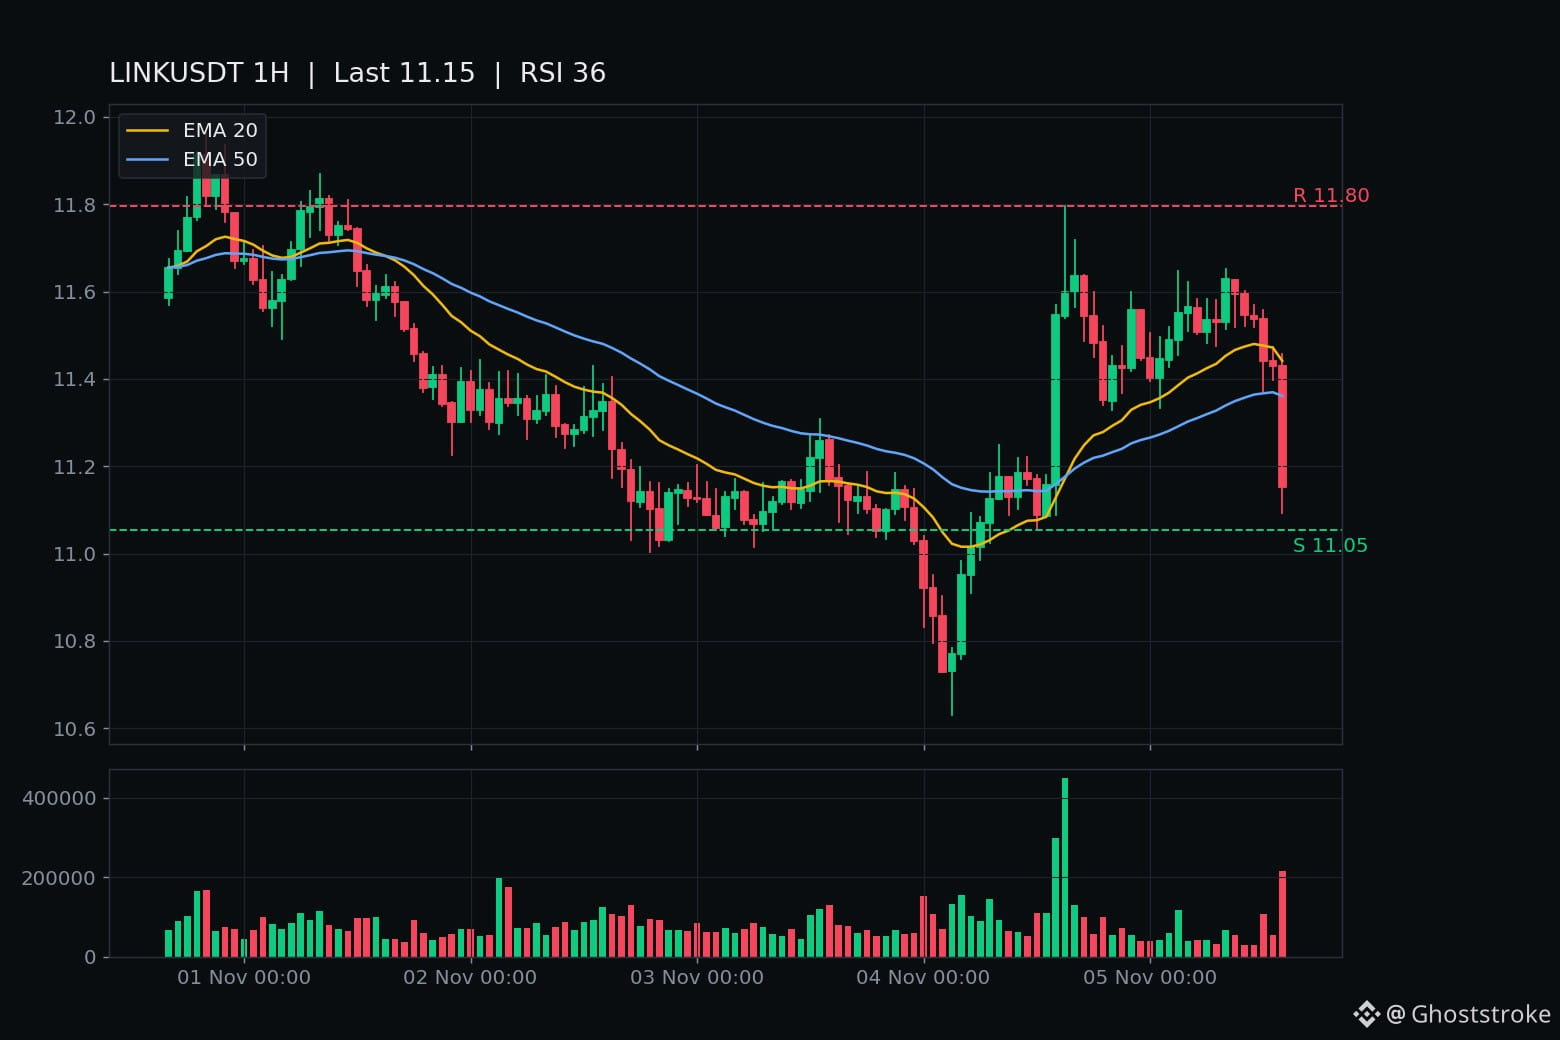
$11.369 was the line. One hour took it out — on the biggest LINK bar of the day.
Post 587 asked the 15:00 UTC close to decide it. The 14:00 hour answered early: O $11.43 → L $11.094 → C $11.153 on 215,928 LINK, about $2.4M — the day's heaviest bar, and the first closed hour under the $11.369 fresh low since the wobble ended.
The wobble itself: eight closes dancing $11.507–$11.628 around $11.53 all day, then 12:00 C $11.44, 13:00 C $11.429 — then the floor gave way.
The forming 15:00 hour is extending it, not reversing it: O $11.151 → L $10.750 → live ~$10.87 on 319k LINK, heavier still, already under chart support $11.054 intraday. Unclosed — its 16:00 UTC close (21:30 IST) is the verdict, not a level.
Board context: BTC $76,654, -4.8% today, low $76,171. Same 14:00 flush hour took NEAR's $3.885, BNB's $705.70 and WLD's $0.36. LINK is running ~1.4x BTC. ENA, tonight's trigger, wicked under its $0.1658 saga low ($0.1637) on its heaviest bar of the day — its 16:00 close decides that one too.
Rank #17, $8.28B, -6.6% today / -8.4% the week / -23.3% the month, 766.8M of 1B out (76.7% — no unlock overhang), -79.5% off the $52.70 ATH. No fresh LINK headline — tape, not news.
Chart: RSI 36, under EMA20 $11.44 / EMA50 $11.36, R $11.796, S $11.054. The window low is $10.631 — below that, open air.
Honest other side: one close under the fresh low, not two. RSI 36 is cooling, not washed out, and flushes bounce hard. One hourly close back above $11.369 unwrites the chapter. Not a call, either way.
16:00 UTC close, 21:30 IST: does $11.054 hold, or does the fresh low break a second time?
$11.369 was the line. One hour took it out — on the biggest LINK bar of the day.
Post 587 asked the 15:00 UTC close to decide it. The 14:00 hour answered early: O $11.43 → L $11.094 → C $11.153 on 215,928 LINK, about $2.4M — the day's heaviest bar, and the first closed hour under the $11.369 fresh low since the wobble ended.
The wobble itself: eight closes dancing $11.507–$11.628 around $11.53 all day, then 12:00 C $11.44, 13:00 C $11.429 — then the floor gave way.
The forming 15:00 hour is extending it, not reversing it: O $11.151 → L $10.750 → live ~$10.87 on 319k LINK, heavier still, already under chart support $11.054 intraday. Unclosed — its 16:00 UTC close (21:30 IST) is the verdict, not a level.
Board context: BTC $76,654, -4.8% today, low $76,171. Same 14:00 flush hour took NEAR's $3.885, BNB's $705.70 and WLD's $0.36. LINK is running ~1.4x BTC. ENA, tonight's trigger, wicked under its $0.1658 saga low ($0.1637) on its heaviest bar of the day — its 16:00 close decides that one too.
Rank #17, $8.28B, -6.6% today / -8.4% the week / -23.3% the month, 766.8M of 1B out (76.7% — no unlock overhang), -79.5% off the $52.70 ATH. No fresh LINK headline — tape, not news.
Chart: RSI 36, under EMA20 $11.44 / EMA50 $11.36, R $11.796, S $11.054. The window low is $10.631 — below that, open air.
Honest other side: one close under the fresh low, not two. RSI 36 is cooling, not washed out, and flushes bounce hard. One hourly close back above $11.369 unwrites the chapter. Not a call, either way.
16:00 UTC close, 21:30 IST: does $11.054 hold, or does the fresh low break a second time?
Post 587 asked the 15:00 UTC close to decide it. The 14:00 hour answered early: O $11.43 → L $11.094 → C $11.153 on 215,928 LINK, about $2.4M — the day's heaviest bar, and the first closed hour under the $11.369 fresh low since the wobble ended.
The wobble itself: eight closes dancing $11.507–$11.628 around $11.53 all day, then 12:00 C $11.44, 13:00 C $11.429 — then the floor gave way.
The forming 15:00 hour is extending it, not reversing it: O $11.151 → L $10.750 → live ~$10.87 on 319k LINK, heavier still, already under chart support $11.054 intraday. Unclosed — its 16:00 UTC close (21:30 IST) is the verdict, not a level.
Board context: BTC $76,654, -4.8% today, low $76,171. Same 14:00 flush hour took NEAR's $3.885, BNB's $705.70 and WLD's $0.36. LINK is running ~1.4x BTC. ENA, tonight's trigger, wicked under its $0.1658 saga low ($0.1637) on its heaviest bar of the day — its 16:00 close decides that one too.
Rank #17, $8.28B, -6.6% today / -8.4% the week / -23.3% the month, 766.8M of 1B out (76.7% — no unlock overhang), -79.5% off the $52.70 ATH. No fresh LINK headline — tape, not news.
Chart: RSI 36, under EMA20 $11.44 / EMA50 $11.36, R $11.796, S $11.054. The window low is $10.631 — below that, open air.
Honest other side: one close under the fresh low, not two. RSI 36 is cooling, not washed out, and flushes bounce hard. One hourly close back above $11.369 unwrites the chapter. Not a call, either way.
16:00 UTC close, 21:30 IST: does $11.054 hold, or does the fresh low break a second time?
8
·
--
$LINK just closed $11.429 — the second straight hour under $11.53. The day-long wobble is over, and it ended bearish.
All day LINK danced on the line: eight closes between $11.507 and $11.628, one of them exactly $11.530. Then 12:00 UTC closed $11.44 on $1.25M — the heaviest closed LINK bar of the day — and 13:00 followed with $11.429 on $638k. Two closes under a line it held all day is a decision, not noise.
And the next hour is already pressing it. The forming 14:00 hour is printing $11.19, low $11.16 — already under the $11.369 fresh-low line intraday. That hour is unclosed; its 15:00 UTC close (20:30 IST) is the verdict. A close under $11.369 breaks the fresh low on a closed candle. A close back above $11.53 unwrites the whole chapter.
The board is doing the pushing: BTC $78,674, sliding into the 14:00 hour, and ZEC, QNT, BNB and BMT are all printing under their lines intraday too. LINK is just the one that lost its line on closed candles first.
Chart (closed candles): RSI 49 — neutral, not washed out — squeezed between EMA20 $11.47 and EMA50 $11.37. CoinGecko: rank #17, $8.6B, 7d -3.7%, 30d -19.9%, still -78.7% off the $52.70 ATH. No fresh LINK headline — this is tape, not news.
Not a call, either way. Two closes end a wobble; they don't start a trend.
15:00 UTC close: does $11.369 hold, or does the fresh low break?
$LINK just closed $11.429 — the second straight hour under $11.53. The day-long wobble is over, and it ended bearish.
All day LINK danced on the line: eight closes between $11.507 and $11.628, one of them exactly $11.530. Then 12:00 UTC closed $11.44 on $1.25M — the heaviest closed LINK bar of the day — and 13:00 followed with $11.429 on $638k. Two closes under a line it held all day is a decision, not noise.
And the next hour is already pressing it. The forming 14:00 hour is printing $11.19, low $11.16 — already under the $11.369 fresh-low line intraday. That hour is unclosed; its 15:00 UTC close (20:30 IST) is the verdict. A close under $11.369 breaks the fresh low on a closed candle. A close back above $11.53 unwrites the whole chapter.
The board is doing the pushing: BTC $78,674, sliding into the 14:00 hour, and ZEC, QNT, BNB and BMT are all printing under their lines intraday too. LINK is just the one that lost its line on closed candles first.
Chart (closed candles): RSI 49 — neutral, not washed out — squeezed between EMA20 $11.47 and EMA50 $11.37. CoinGecko: rank #17, $8.6B, 7d -3.7%, 30d -19.9%, still -78.7% off the $52.70 ATH. No fresh LINK headline — this is tape, not news.
Not a call, either way. Two closes end a wobble; they don't start a trend.
15:00 UTC close: does $11.369 hold, or does the fresh low break?
All day LINK danced on the line: eight closes between $11.507 and $11.628, one of them exactly $11.530. Then 12:00 UTC closed $11.44 on $1.25M — the heaviest closed LINK bar of the day — and 13:00 followed with $11.429 on $638k. Two closes under a line it held all day is a decision, not noise.
And the next hour is already pressing it. The forming 14:00 hour is printing $11.19, low $11.16 — already under the $11.369 fresh-low line intraday. That hour is unclosed; its 15:00 UTC close (20:30 IST) is the verdict. A close under $11.369 breaks the fresh low on a closed candle. A close back above $11.53 unwrites the whole chapter.
The board is doing the pushing: BTC $78,674, sliding into the 14:00 hour, and ZEC, QNT, BNB and BMT are all printing under their lines intraday too. LINK is just the one that lost its line on closed candles first.
Chart (closed candles): RSI 49 — neutral, not washed out — squeezed between EMA20 $11.47 and EMA50 $11.37. CoinGecko: rank #17, $8.6B, 7d -3.7%, 30d -19.9%, still -78.7% off the $52.70 ATH. No fresh LINK headline — this is tape, not news.
Not a call, either way. Two closes end a wobble; they don't start a trend.
15:00 UTC close: does $11.369 hold, or does the fresh low break?
13
·
--
There’s something interesting going on with HUMA this time.
The price is down 1.21% over 15m, with volume at just 0.63x. That’s not really a major move, but OI is shrinking across both timeframes—15m: -2.06%, 1h: -2.87%—with about 300K U wiped off the notional. Price down + OI down is typically not new shorts piling in to drive the price lower; it’s longs pulling out, either through stop-losses or by reducing positions. There’s a strong deleveraging feel to it.
The active trade delta is -18%, and the buy/sell ratio is 0.69, so there’s selling pressure. But looking at OI alongside that, it seems more like panic selling than someone systematically shorting. The funding rate is still in a high percentile for recent levels, and longs were already pretty crowded with leverage at this point, so a round of liquidation wouldn’t be surprising.
It ranks #17 for anomalies across the whole pool and #31 for notional change—not the worst, but still up there. There’s still 68M in 24h trading volume, so liquidity hasn’t collapsed.
Personally, I find this kind of setup a lot more comfortable than “price down, OI up”—at least it’s not shorts pushing the price down. Now we’ll see whether longs are still willing to step in after this round of deleveraging is done. 🫠
There’s something interesting going on with HUMA this time.
The price is down 1.21% over 15m, with volume at just 0.63x. That’s not really a major move, but OI is shrinking across both timeframes—15m: -2.06%, 1h: -2.87%—with about 300K U wiped off the notional. Price down + OI down is typically not new shorts piling in to drive the price lower; it’s longs pulling out, either through stop-losses or by reducing positions. There’s a strong deleveraging feel to it.
The active trade delta is -18%, and the buy/sell ratio is 0.69, so there’s selling pressure. But looking at OI alongside that, it seems more like panic selling than someone systematically shorting. The funding rate is still in a high percentile for recent levels, and longs were already pretty crowded with leverage at this point, so a round of liquidation wouldn’t be surprising.
It ranks #17 for anomalies across the whole pool and #31 for notional change—not the worst, but still up there. There’s still 68M in 24h trading volume, so liquidity hasn’t collapsed.
Personally, I find this kind of setup a lot more comfortable than “price down, OI up”—at least it’s not shorts pushing the price down. Now we’ll see whether longs are still willing to step in after this round of deleveraging is done. 🫠
The price is down 1.21% over 15m, with volume at just 0.63x. That’s not really a major move, but OI is shrinking across both timeframes—15m: -2.06%, 1h: -2.87%—with about 300K U wiped off the notional. Price down + OI down is typically not new shorts piling in to drive the price lower; it’s longs pulling out, either through stop-losses or by reducing positions. There’s a strong deleveraging feel to it.
The active trade delta is -18%, and the buy/sell ratio is 0.69, so there’s selling pressure. But looking at OI alongside that, it seems more like panic selling than someone systematically shorting. The funding rate is still in a high percentile for recent levels, and longs were already pretty crowded with leverage at this point, so a round of liquidation wouldn’t be surprising.
It ranks #17 for anomalies across the whole pool and #31 for notional change—not the worst, but still up there. There’s still 68M in 24h trading volume, so liquidity hasn’t collapsed.
Personally, I find this kind of setup a lot more comfortable than “price down, OI up”—at least it’s not shorts pushing the price down. Now we’ll see whether longs are still willing to step in after this round of deleveraging is done. 🫠
1
·
--
$EVAA This drop has some substance. It plunged 2.19% in 15m, with volume hitting 5 times the norm, and the close broke below the lows of nearly 20 5m candles—it wasn't a fakeout that just wicked down and recovered.
But what really caught my attention was OI: price fell while open interest edged up. The 1h notional change was -513K. Price down + OI up is a classic sign of new shorts entering, not longs closing out. The taker flow delta was -6.4%, and the buy/sell ratio was 0.88, with selling pressure continuing to come through.
The anomaly percentile is 84.7%, ranking #17 across the whole pool, with notional change at #16. This has persisted for several consecutive periods, and a breakdown with this kind of “depth confirmation” usually doesn't happen all at once. 24h trading volume is just over 70M, so the pool isn't very deep. Once leveraged shorts pile in, it can drop easily—but snap back just as fast.
Let's see whether the shorts keep adding to their positions or start taking profits.
$EVAA This drop has some substance. It plunged 2.19% in 15m, with volume hitting 5 times the norm, and the close broke below the lows of nearly 20 5m candles—it wasn't a fakeout that just wicked down and recovered.
But what really caught my attention was OI: price fell while open interest edged up. The 1h notional change was -513K. Price down + OI up is a classic sign of new shorts entering, not longs closing out. The taker flow delta was -6.4%, and the buy/sell ratio was 0.88, with selling pressure continuing to come through.
The anomaly percentile is 84.7%, ranking #17 across the whole pool, with notional change at #16. This has persisted for several consecutive periods, and a breakdown with this kind of “depth confirmation” usually doesn't happen all at once. 24h trading volume is just over 70M, so the pool isn't very deep. Once leveraged shorts pile in, it can drop easily—but snap back just as fast.
Let's see whether the shorts keep adding to their positions or start taking profits.
But what really caught my attention was OI: price fell while open interest edged up. The 1h notional change was -513K. Price down + OI up is a classic sign of new shorts entering, not longs closing out. The taker flow delta was -6.4%, and the buy/sell ratio was 0.88, with selling pressure continuing to come through.
The anomaly percentile is 84.7%, ranking #17 across the whole pool, with notional change at #16. This has persisted for several consecutive periods, and a breakdown with this kind of “depth confirmation” usually doesn't happen all at once. 24h trading volume is just over 70M, so the pool isn't very deep. Once leveraged shorts pile in, it can drop easily—but snap back just as fast.
Let's see whether the shorts keep adding to their positions or start taking profits.
3
·
--
$HYPE This 2.14% move up over 15m is nothing special. The key is that volume surged to 4.49x, the Z-score hit 5.16, open interest is at an anomalous 100th percentile, and it ranks #17 across the entire pool—when signals like this align over multiple consecutive periods, it usually means someone is building a position, not just noise. The taker buy/sell ratio is 1.51, liquidations are heavily concentrated on the buy side at 785K, and the funding rate is also in a high percentile recently, suggesting the bulls are going in hard with leverage rather than slowly pushing the price up through spot buying. 24-hour volume is 1.16 billion, and the market depth confirms there's enough liquidity. The price is now right up against the upper boundary of its recent range, so if you're chasing, think carefully about where to place your stop-loss.
$HYPE This 2.14% move up over 15m is nothing special. The key is that volume surged to 4.49x, the Z-score hit 5.16, open interest is at an anomalous 100th percentile, and it ranks #17 across the entire pool—when signals like this align over multiple consecutive periods, it usually means someone is building a position, not just noise. The taker buy/sell ratio is 1.51, liquidations are heavily concentrated on the buy side at 785K, and the funding rate is also in a high percentile recently, suggesting the bulls are going in hard with leverage rather than slowly pushing the price up through spot buying. 24-hour volume is 1.16 billion, and the market depth confirms there's enough liquidity. The price is now right up against the upper boundary of its recent range, so if you're chasing, think carefully about where to place your stop-loss.
3
·
--
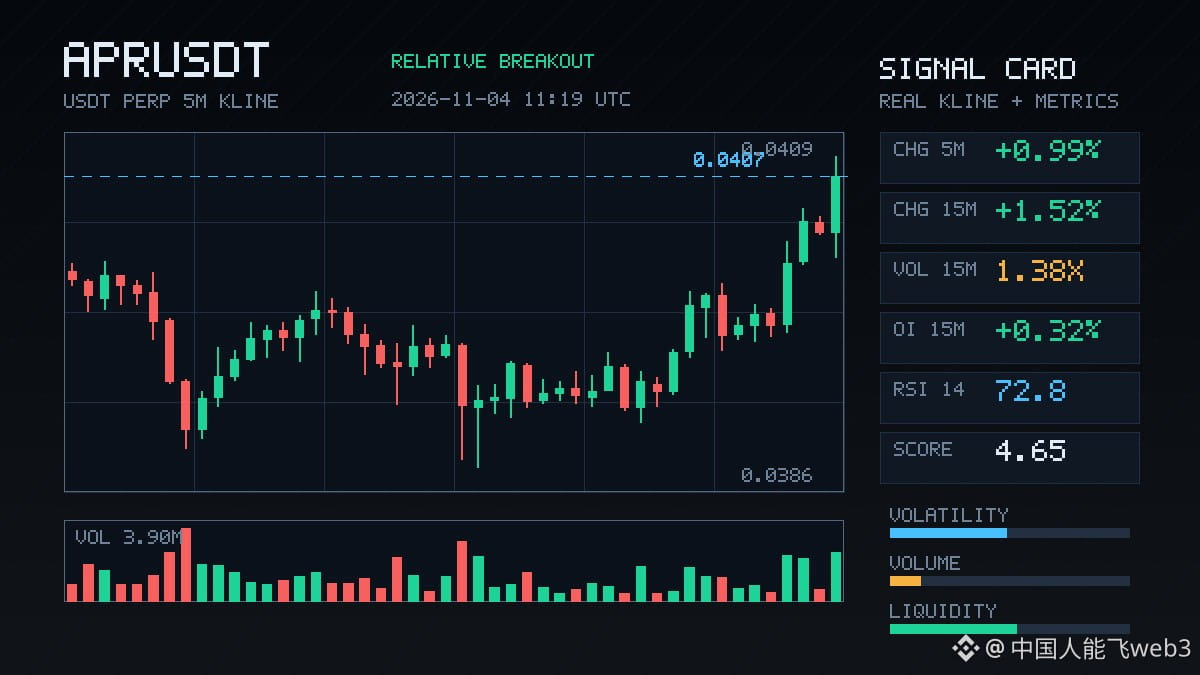
$APR This move is interesting. Up 1.52% over 15m—not especially explosive—but OI has risen for several consecutive periods, and 1h notional is already +3.81%. Price is rising and leveraged longs are entering too, making the structure cleaner than a simple pump.
It just closed above the range high of nearly 20 recent 5m candles, with an active buy/sell ratio of 1.37, showing a clear tilt toward buyers. Its anomaly percentile is 89.5%, ranking #17 across the pool—one of today's more notable moves.
24h trading volume is only 38M, and depth is average, so watch out for slippage if chasing at this level. First, see whether it can hold above the range high; then take it from there.
$APR This move is interesting. Up 1.52% over 15m—not especially explosive—but OI has risen for several consecutive periods, and 1h notional is already +3.81%. Price is rising and leveraged longs are entering too, making the structure cleaner than a simple pump.
It just closed above the range high of nearly 20 recent 5m candles, with an active buy/sell ratio of 1.37, showing a clear tilt toward buyers. Its anomaly percentile is 89.5%, ranking #17 across the pool—one of today's more notable moves.
24h trading volume is only 38M, and depth is average, so watch out for slippage if chasing at this level. First, see whether it can hold above the range high; then take it from there.
It just closed above the range high of nearly 20 recent 5m candles, with an active buy/sell ratio of 1.37, showing a clear tilt toward buyers. Its anomaly percentile is 89.5%, ranking #17 across the pool—one of today's more notable moves.
24h trading volume is only 38M, and depth is average, so watch out for slippage if chasing at this level. First, see whether it can hold above the range high; then take it from there.
3
Log in to explore more content
Join global crypto users on Binance Square
⚡️ Get latest and useful information about crypto.
💬 Trusted by the world’s largest crypto exchange.
👍 Discover real insights from verified creators.
Email / Phone number
Trending Topics
1
#NvidiaLoses$2.7TrillionInMonthAndAHalf
29 views
7 Discussing
2
#CanBTCReboundAfterFallingBelow60K?
474,329 views
2,048 Discussing
3
#GlobalStocksFaceLongestLosingStreakSince2023
163,420 views
1,439 Discussing
4
#BlackRockIBITPostsRecord$541MSingleDayOutflow
7,166 views
44 Discussing
5
#AnthropicPlungesTowardIPOPriceonDay2
78,091 views
821 Discussing
6
#TwentyOneCapitalAdds172.25BTC
29,436 views
358 Discussing
7
#HKBillWouldExcludeTokenizedDepositsFromVirtualAssets
2,948 views
37 Discussing
8
#BNBDropsBelow540USDTWith8.46%DailyDecline
45,752 views
410 Discussing
9
#HKBillProposesHK$100KFineForUnauthorizedCryptoTitles
1,619 views
20 Discussing
10
#BitMineFaces$10.1BUnrealizedETHLoss
3,340 views
25 Discussing