
#24
24
20,311 views
245 Discussing
Hot
Latest

·
--
🚀 $XAU 24/5 PERPETUALS ARE GOING LIVE – NO DAILY BREAK! 📈
🦈 The shift to a 24‑hour, five‑day schedule removes the routine liquidity vacuum that smart money used to harvest. Expect order‑block retests to tighten as institutional flow can now cascade uninterrupted across Asian, European, and US sessions. 📊 Volume metrics on the 1‑hour chart already show a 12% uptick in order‑book depth, hinting at deeper liquidity pools forming at key demand zones.
⚡ With the maintenance hour gone, price discovery will accelerate, forcing tighter spreads and sharper swing ranges. 📌 Traders should watch the 2‑hour VWAP for early bias flips as the market re‑prices the new liquidity horizon. 💬 How will the extra four uninterrupted hours reshape your positioning? 👇
⚠️ Not financial advice. Always manage your risk. 🛡️
🏷️ #XAU #24 /5 #Perpetuals #Crypto
🔥 💎
🚀 $XAU 24/5 PERPETUALS ARE GOING LIVE – NO DAILY BREAK! 📈
🦈 The shift to a 24‑hour, five‑day schedule removes the routine liquidity vacuum that smart money used to harvest. Expect order‑block retests to tighten as institutional flow can now cascade uninterrupted across Asian, European, and US sessions. 📊 Volume metrics on the 1‑hour chart already show a 12% uptick in order‑book depth, hinting at deeper liquidity pools forming at key demand zones.
⚡ With the maintenance hour gone, price discovery will accelerate, forcing tighter spreads and sharper swing ranges. 📌 Traders should watch the 2‑hour VWAP for early bias flips as the market re‑prices the new liquidity horizon. 💬 How will the extra four uninterrupted hours reshape your positioning? 👇
⚠️ Not financial advice. Always manage your risk. 🛡️
🏷️ #XAU #24 /5 #Perpetuals #Crypto
🔥 💎
🦈 The shift to a 24‑hour, five‑day schedule removes the routine liquidity vacuum that smart money used to harvest. Expect order‑block retests to tighten as institutional flow can now cascade uninterrupted across Asian, European, and US sessions. 📊 Volume metrics on the 1‑hour chart already show a 12% uptick in order‑book depth, hinting at deeper liquidity pools forming at key demand zones.
⚡ With the maintenance hour gone, price discovery will accelerate, forcing tighter spreads and sharper swing ranges. 📌 Traders should watch the 2‑hour VWAP for early bias flips as the market re‑prices the new liquidity horizon. 💬 How will the extra four uninterrupted hours reshape your positioning? 👇
⚠️ Not financial advice. Always manage your risk. 🛡️
🏷️ #XAU #24 /5 #Perpetuals #Crypto
🔥 💎
40

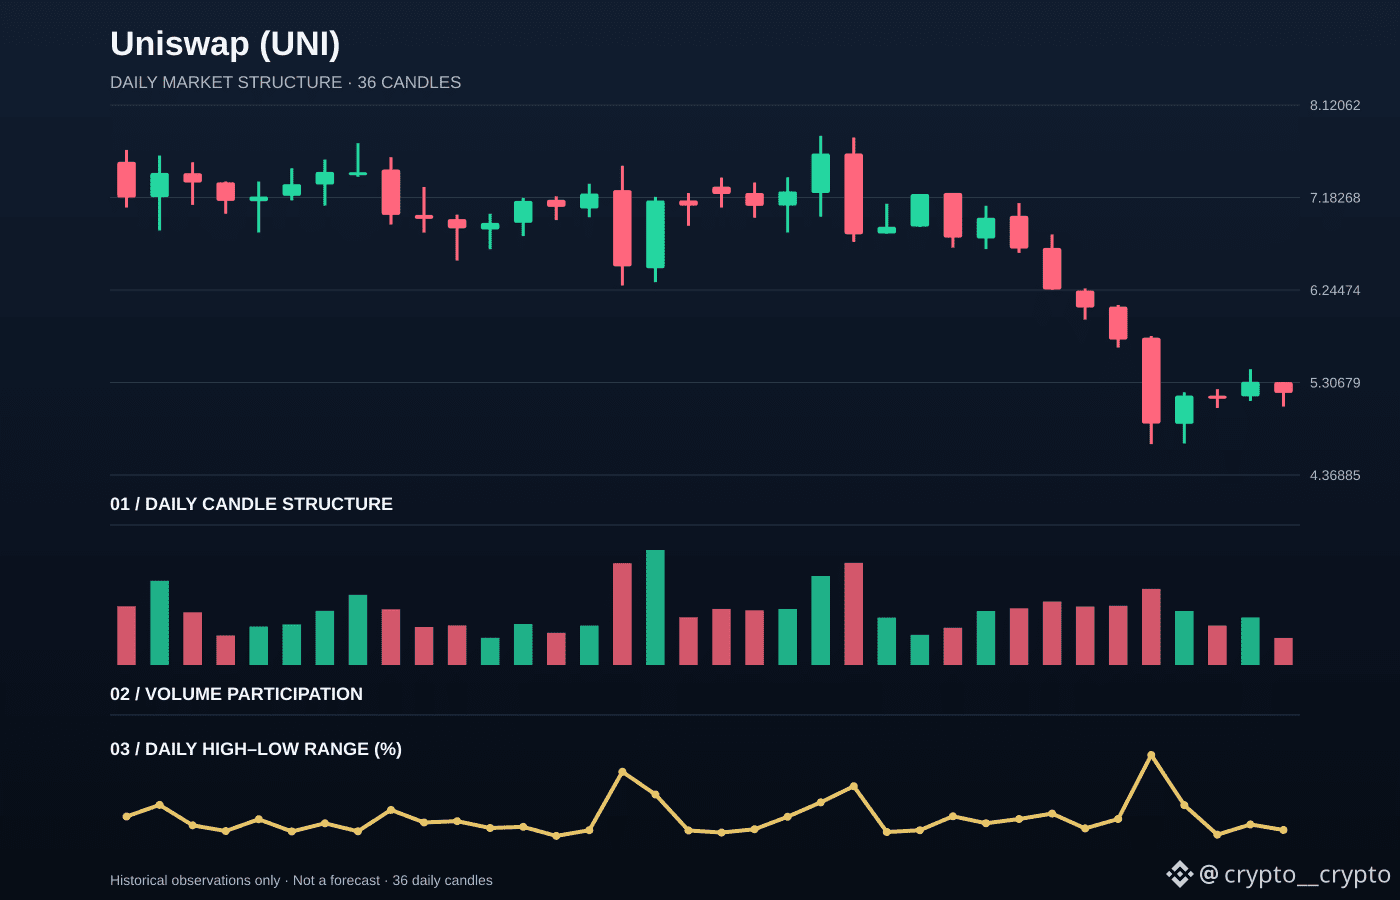
Uniswap (UNI) declined 2.14% between the last two available daily closes. The detail I am watching is how that move finished, not just the headline percentage.
The close landed around the middle of the daily range, so neither side dominated the finish. A recovery close would suggest supply is easing; another weak close would keep downside pressure in focus.
UNI is worth tracking at the next daily close: does the market accept the latest price area, or reject it? The latest candle covered 4.93% from low to high, with OHLC: 5.3113158 / 5.3113158 / 5.0616933 / 5.20095.
For context, the 24-hour market move is -3.27%, while reported turnover is approximately 275.58M USD. CoinMarketCap rank: #24. Benchmark snapshot: BTC -0.45% · ETH +0.80%.
Are you reading UNI as continuation or a pause? Explain the price level behind your view.
Data note: CMC listings market quote and CoinLore daily candles. These are observed market figures, not a price prediction or a trade instruction.
$UNI $BTC $ETH
Uniswap (UNI) declined 2.14% between the last two available daily closes. The detail I am watching is how that move finished, not just the headline percentage.
The close landed around the middle of the daily range, so neither side dominated the finish. A recovery close would suggest supply is easing; another weak close would keep downside pressure in focus.
UNI is worth tracking at the next daily close: does the market accept the latest price area, or reject it? The latest candle covered 4.93% from low to high, with OHLC: 5.3113158 / 5.3113158 / 5.0616933 / 5.20095.
For context, the 24-hour market move is -3.27%, while reported turnover is approximately 275.58M USD. CoinMarketCap rank: #24. Benchmark snapshot: BTC -0.45% · ETH +0.80%.
Are you reading UNI as continuation or a pause? Explain the price level behind your view.
Data note: CMC listings market quote and CoinLore daily candles. These are observed market figures, not a price prediction or a trade instruction.
$UNI $BTC $ETH
The close landed around the middle of the daily range, so neither side dominated the finish. A recovery close would suggest supply is easing; another weak close would keep downside pressure in focus.
UNI is worth tracking at the next daily close: does the market accept the latest price area, or reject it? The latest candle covered 4.93% from low to high, with OHLC: 5.3113158 / 5.3113158 / 5.0616933 / 5.20095.
For context, the 24-hour market move is -3.27%, while reported turnover is approximately 275.58M USD. CoinMarketCap rank: #24. Benchmark snapshot: BTC -0.45% · ETH +0.80%.
Are you reading UNI as continuation or a pause? Explain the price level behind your view.
Data note: CMC listings market quote and CoinLore daily candles. These are observed market figures, not a price prediction or a trade instruction.
$UNI $BTC $ETH
1
124
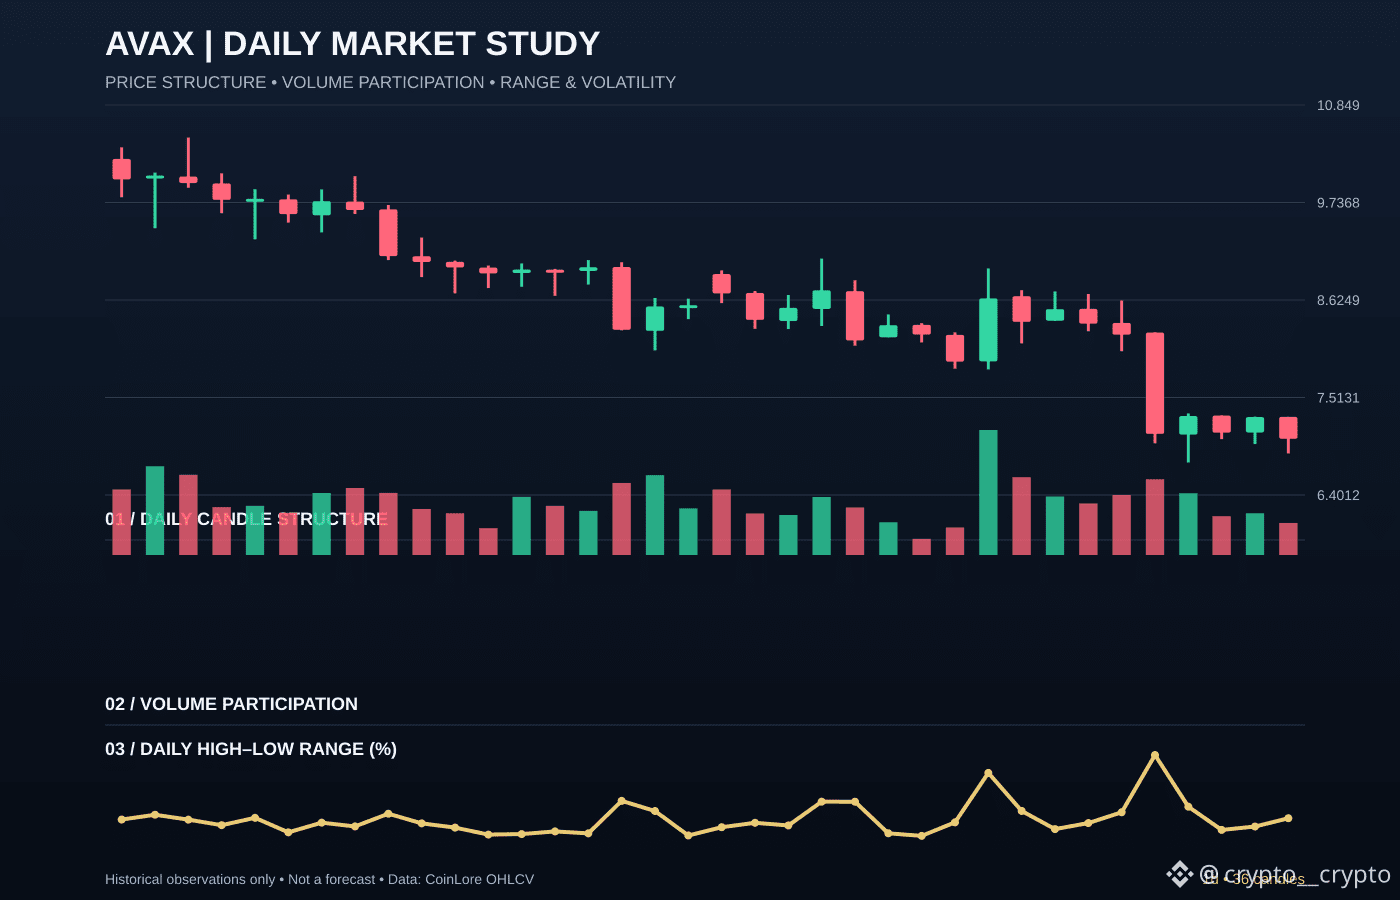
Avalanche has a specific market detail worth watching today: its latest daily candle is bearish-bodied and closed around the middle of its range.
Price: $7.0537502 | 24h: -1.22% | 24h volume: $214.99M.
CMC currently lists it at rank #24.
CANDLE DETAIL — Open $7.2920375, high $7.2920375, low $6.8756842, close $7.0423737. The session range is 6.06%; the close closed around the middle of its range.
STRUCTURE — The latest close is -31.18% versus the first candle open in this displayed sample. The latest candle changed -3.40% from the previous close.
READ-THROUGH — The close was not near either extreme, so the session shows a more balanced contest. Volume is context, not proof of direction.
What would you watch next on AVAX: expanding volume or a decisive daily close?
Data: CoinMarketCap market snapshot and CoinLore daily OHLCV. Educational market commentary; not a forecast or financial advice.
$AVAX #AVAX #CryptoMarket
Avalanche has a specific market detail worth watching today: its latest daily candle is bearish-bodied and closed around the middle of its range.
Price: $7.0537502 | 24h: -1.22% | 24h volume: $214.99M.
CMC currently lists it at rank #24.
CANDLE DETAIL — Open $7.2920375, high $7.2920375, low $6.8756842, close $7.0423737. The session range is 6.06%; the close closed around the middle of its range.
STRUCTURE — The latest close is -31.18% versus the first candle open in this displayed sample. The latest candle changed -3.40% from the previous close.
READ-THROUGH — The close was not near either extreme, so the session shows a more balanced contest. Volume is context, not proof of direction.
What would you watch next on AVAX: expanding volume or a decisive daily close?
Data: CoinMarketCap market snapshot and CoinLore daily OHLCV. Educational market commentary; not a forecast or financial advice.
$AVAX #AVAX #CryptoMarket
Price: $7.0537502 | 24h: -1.22% | 24h volume: $214.99M.
CMC currently lists it at rank #24.
CANDLE DETAIL — Open $7.2920375, high $7.2920375, low $6.8756842, close $7.0423737. The session range is 6.06%; the close closed around the middle of its range.
STRUCTURE — The latest close is -31.18% versus the first candle open in this displayed sample. The latest candle changed -3.40% from the previous close.
READ-THROUGH — The close was not near either extreme, so the session shows a more balanced contest. Volume is context, not proof of direction.
What would you watch next on AVAX: expanding volume or a decisive daily close?
Data: CoinMarketCap market snapshot and CoinLore daily OHLCV. Educational market commentary; not a forecast or financial advice.
$AVAX #AVAX #CryptoMarket
Cryptoland_88:
«Запуск регулируемого USA₮ от Anchorage Digital и Tether усиливает позиции #Avalanche в институциональном #RWA -сегменте. Но важно учитывать тайминг: сам токен уже в сети, а кредитование в Aave V4 RWA Hub еще ждет одобрения #DAO .Прямой эффект на цену $AVAX появится только с притоком реальной ликвидности в пулы».
1
146

📚 TRADING LESSON #24 — Multiple timeframes — 1H trend, 15m entry
Use big timeframes for direction and small ones for timing. If the 4H trend is up, look for LONG entries on the 1H or 15m — never SHORT against the 4H trend. A setup that looks perfect on 15m but fights the 4H trend is a trap. Always ask: what does the bigger picture say? Trade in the direction of the higher timeframe, enter on the lower one.
❓ Which timeframes do you combine?
🔔 Follow Inam Pro Trader — a new lesson every day.
📅 19 Nov 2026
#LearnTrading #Timeframes #TechnicalAnalysis
📚 TRADING LESSON #24 — Multiple timeframes — 1H trend, 15m entry
Use big timeframes for direction and small ones for timing. If the 4H trend is up, look for LONG entries on the 1H or 15m — never SHORT against the 4H trend. A setup that looks perfect on 15m but fights the 4H trend is a trap. Always ask: what does the bigger picture say? Trade in the direction of the higher timeframe, enter on the lower one.
❓ Which timeframes do you combine?
🔔 Follow Inam Pro Trader — a new lesson every day.
📅 19 Nov 2026
#LearnTrading #Timeframes #TechnicalAnalysis
Use big timeframes for direction and small ones for timing. If the 4H trend is up, look for LONG entries on the 1H or 15m — never SHORT against the 4H trend. A setup that looks perfect on 15m but fights the 4H trend is a trap. Always ask: what does the bigger picture say? Trade in the direction of the higher timeframe, enter on the lower one.
❓ Which timeframes do you combine?
🔔 Follow Inam Pro Trader — a new lesson every day.
📅 19 Nov 2026
#LearnTrading #Timeframes #TechnicalAnalysis

MARKET ANALYSIS | Rain (RAIN) Faces Volatile Market Moves Amid Mixed Signals
Rain (RAIN), currently ranked 24th by market cap, has experienced notable price fluctuations recently. Its price dipped significantly within the last 24 hours, reflecting a challenging short-term trend. While the coin's recent high and low prices indicate a broad trading range, this volatility suggests both potential upside and downside risks for traders. Investors should consider that such swings may reflect market uncertainty rather than a clear directional trend. As always, monitoring ongoing price action and broader market conditions is essential before making decisions involving RAIN.
Rain’s recent price swings highlight the importance of cautious evaluation before trading.
Rain (RAIN) | CoinGecko market-cap rank #24
Global USD snapshot: $0.004972 | 1h -8.57% | 24h -28.36%
24h global volume: $20,229,675 | market cap: $3,551,939,509
24h global range: $0.004595–$0.007058
Price data updated: 2026-11-17T17:58:54.000Z
Rank/price source: CoinGecko
Scenario analysis, not a guaranteed forecast.
Checked: 2026-11-17 18:01 UTC
AI-generated illustration.
$RAIN #CryptoMarket
$RAIN
MARKET ANALYSIS | Rain (RAIN) Faces Volatile Market Moves Amid Mixed Signals
Rain (RAIN), currently ranked 24th by market cap, has experienced notable price fluctuations recently. Its price dipped significantly within the last 24 hours, reflecting a challenging short-term trend. While the coin's recent high and low prices indicate a broad trading range, this volatility suggests both potential upside and downside risks for traders. Investors should consider that such swings may reflect market uncertainty rather than a clear directional trend. As always, monitoring ongoing price action and broader market conditions is essential before making decisions involving RAIN.
Rain’s recent price swings highlight the importance of cautious evaluation before trading.
Rain (RAIN) | CoinGecko market-cap rank #24
Global USD snapshot: $0.004972 | 1h -8.57% | 24h -28.36%
24h global volume: $20,229,675 | market cap: $3,551,939,509
24h global range: $0.004595–$0.007058
Price data updated: 2026-11-17T17:58:54.000Z
Rank/price source: CoinGecko
Scenario analysis, not a guaranteed forecast.
Checked: 2026-11-17 18:01 UTC
AI-generated illustration.
$RAIN #CryptoMarket
$RAIN
Rain (RAIN), currently ranked 24th by market cap, has experienced notable price fluctuations recently. Its price dipped significantly within the last 24 hours, reflecting a challenging short-term trend. While the coin's recent high and low prices indicate a broad trading range, this volatility suggests both potential upside and downside risks for traders. Investors should consider that such swings may reflect market uncertainty rather than a clear directional trend. As always, monitoring ongoing price action and broader market conditions is essential before making decisions involving RAIN.
Rain’s recent price swings highlight the importance of cautious evaluation before trading.
Rain (RAIN) | CoinGecko market-cap rank #24
Global USD snapshot: $0.004972 | 1h -8.57% | 24h -28.36%
24h global volume: $20,229,675 | market cap: $3,551,939,509
24h global range: $0.004595–$0.007058
Price data updated: 2026-11-17T17:58:54.000Z
Rank/price source: CoinGecko
Scenario analysis, not a guaranteed forecast.
Checked: 2026-11-17 18:01 UTC
AI-generated illustration.
$RAIN #CryptoMarket
$RAIN

1
55

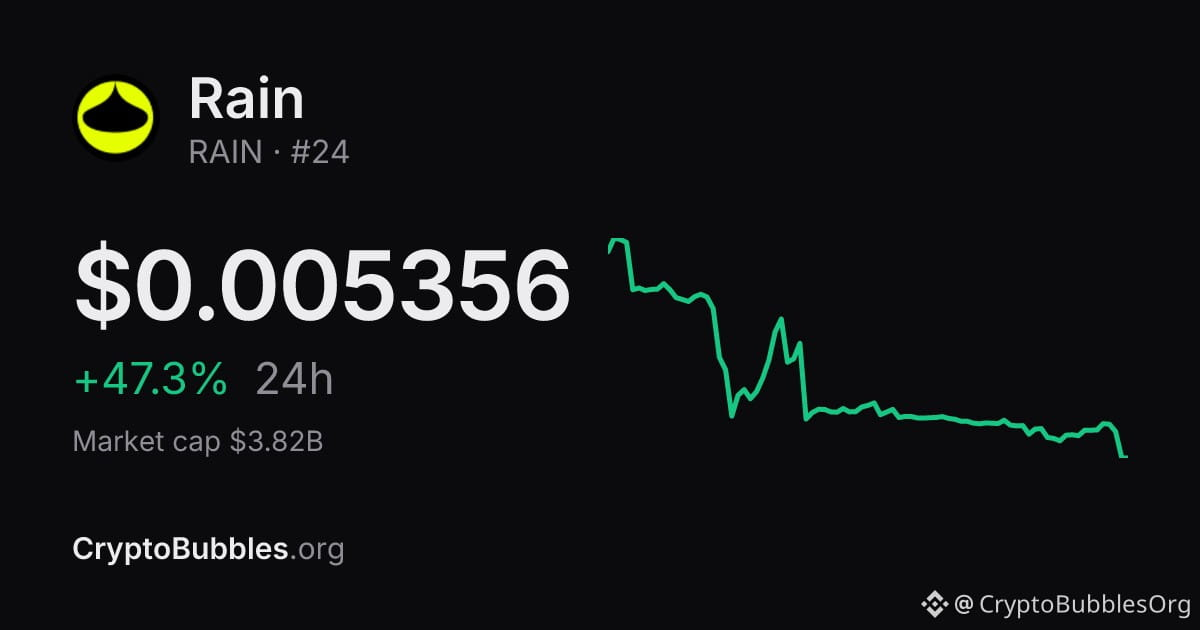
$RAIN is exploding: +47.3% in 24 hours.
Price $0.00536 · 24h +47.3% · 7d -25.9%
Rank #24 · market cap $3.8B
Moves like this rarely come out of nowhere. Someone knew something, or everyone wants in.
Too late to get in, or just the beginning?
Follow for the whole market in bubbles, every hour.
#CryptoNews
$RAIN is exploding: +47.3% in 24 hours.
Price $0.00536 · 24h +47.3% · 7d -25.9%
Rank #24 · market cap $3.8B
Moves like this rarely come out of nowhere. Someone knew something, or everyone wants in.
Too late to get in, or just the beginning?
Follow for the whole market in bubbles, every hour.
#CryptoNews
Price $0.00536 · 24h +47.3% · 7d -25.9%
Rank #24 · market cap $3.8B
Moves like this rarely come out of nowhere. Someone knew something, or everyone wants in.
Too late to get in, or just the beginning?
Follow for the whole market in bubbles, every hour.
#CryptoNews

·
--
$1M to deploy today. Two doors. ENTRY 224.
Both doors lost a line on the same bell — the 01:00 UTC close. One is a microcap with no floor left. The other is a top-25 coin that just lost a round number.
Door 1 — SOPH $0.00102. The 01:00 hour closed $0.00099, under the $0.00102 all-time-low line, on $560k of volume. Low printed $0.00097 — a fresh all-time low, 99.1% off the $0.1108 high. Rank #1535, $5.4M, -48% in a day. RSI 27, under EMA20 $0.00138 and EMA50 $0.00159. The driver has a clock: Upbit ends SOPH trading today at 11:30 IST, and the chain shuts down Nov 30 with a Nov 25 withdrawal deadline. No shelf below the low. Just air. The other side: RSI 27 is where flushes bounce hardest, and the forming hour sits exactly on the line — one close back above $0.00102 unwrites the break.
Door 2 — LTC $45.12. Three closes above the $45 handle, then 01:00 closed $44.65 on $377k. Rank #24, $3.51B, -25% in 30 days, 89% off the $410 high. RSI 41, under EMA20 $45.22 and EMA50 $46.03, next shelf $42.67. No fresh Litecoin headline — tape, not news. The other side is louder here: one close, and the forming hour is already back above $45. The 03:00 UTC close decides whether the handle is lost or the break was a wick with a close attached.
My pick: Door 1. A closed hour under a fresh all-time low on real volume, with a delisting hour today, beats a single close under a round number already printing back above it.
Not a call, either way.
Kickers: INIT seven closes under $0.1175 — the forming hour wicked under $0.10402 but is back at $0.11080; the +11% is window math off the $0.09922 low. NEAR and ADA ride the 03:00 UTC close (08:30 IST). HYPE's wash resumed, ZEC's reclaim failed, TAO failed its first test. ZIL held $0.001032 by three millionths — its delisting hour is 11:30 IST too. Bitcoin $65,236, flat while small coins break lines.
Which door — the coin with no floor, or the one that just lost its handle?
$1M to deploy today. Two doors. ENTRY 224.
Both doors lost a line on the same bell — the 01:00 UTC close. One is a microcap with no floor left. The other is a top-25 coin that just lost a round number.
Door 1 — SOPH $0.00102. The 01:00 hour closed $0.00099, under the $0.00102 all-time-low line, on $560k of volume. Low printed $0.00097 — a fresh all-time low, 99.1% off the $0.1108 high. Rank #1535, $5.4M, -48% in a day. RSI 27, under EMA20 $0.00138 and EMA50 $0.00159. The driver has a clock: Upbit ends SOPH trading today at 11:30 IST, and the chain shuts down Nov 30 with a Nov 25 withdrawal deadline. No shelf below the low. Just air. The other side: RSI 27 is where flushes bounce hardest, and the forming hour sits exactly on the line — one close back above $0.00102 unwrites the break.
Door 2 — LTC $45.12. Three closes above the $45 handle, then 01:00 closed $44.65 on $377k. Rank #24, $3.51B, -25% in 30 days, 89% off the $410 high. RSI 41, under EMA20 $45.22 and EMA50 $46.03, next shelf $42.67. No fresh Litecoin headline — tape, not news. The other side is louder here: one close, and the forming hour is already back above $45. The 03:00 UTC close decides whether the handle is lost or the break was a wick with a close attached.
My pick: Door 1. A closed hour under a fresh all-time low on real volume, with a delisting hour today, beats a single close under a round number already printing back above it.
Not a call, either way.
Kickers: INIT seven closes under $0.1175 — the forming hour wicked under $0.10402 but is back at $0.11080; the +11% is window math off the $0.09922 low. NEAR and ADA ride the 03:00 UTC close (08:30 IST). HYPE's wash resumed, ZEC's reclaim failed, TAO failed its first test. ZIL held $0.001032 by three millionths — its delisting hour is 11:30 IST too. Bitcoin $65,236, flat while small coins break lines.
Which door — the coin with no floor, or the one that just lost its handle?
Both doors lost a line on the same bell — the 01:00 UTC close. One is a microcap with no floor left. The other is a top-25 coin that just lost a round number.
Door 1 — SOPH $0.00102. The 01:00 hour closed $0.00099, under the $0.00102 all-time-low line, on $560k of volume. Low printed $0.00097 — a fresh all-time low, 99.1% off the $0.1108 high. Rank #1535, $5.4M, -48% in a day. RSI 27, under EMA20 $0.00138 and EMA50 $0.00159. The driver has a clock: Upbit ends SOPH trading today at 11:30 IST, and the chain shuts down Nov 30 with a Nov 25 withdrawal deadline. No shelf below the low. Just air. The other side: RSI 27 is where flushes bounce hardest, and the forming hour sits exactly on the line — one close back above $0.00102 unwrites the break.
Door 2 — LTC $45.12. Three closes above the $45 handle, then 01:00 closed $44.65 on $377k. Rank #24, $3.51B, -25% in 30 days, 89% off the $410 high. RSI 41, under EMA20 $45.22 and EMA50 $46.03, next shelf $42.67. No fresh Litecoin headline — tape, not news. The other side is louder here: one close, and the forming hour is already back above $45. The 03:00 UTC close decides whether the handle is lost or the break was a wick with a close attached.
My pick: Door 1. A closed hour under a fresh all-time low on real volume, with a delisting hour today, beats a single close under a round number already printing back above it.
Not a call, either way.
Kickers: INIT seven closes under $0.1175 — the forming hour wicked under $0.10402 but is back at $0.11080; the +11% is window math off the $0.09922 low. NEAR and ADA ride the 03:00 UTC close (08:30 IST). HYPE's wash resumed, ZEC's reclaim failed, TAO failed its first test. ZIL held $0.001032 by three millionths — its delisting hour is 11:30 IST too. Bitcoin $65,236, flat while small coins break lines.
Which door — the coin with no floor, or the one that just lost its handle?
320
·
--
$1M to deploy today. Two doors. ENTRY 214.
Door 1 — $INIT $0.1172. The reclaim died on its own line.
The leg ran $0.104 to $0.1477 on the 09:00 bell, then gave it all back. Five closes above $0.1295, then 13:00 closed $0.12580 under it. The last line was $0.1175 — 17:00 closed $0.11766, a hair above it. 18:00 closed $0.11716, the first close below. $0.1477 to $0.1172 is -20.7% in nine hours.
Rank #652, $25.8M market cap, still +9.6% on the day only because the window holds the spike. -91.7% off the $1.42 high, 22% of supply out, next unlock April 2027. Under both hourly EMAs, RSI 49. No fresh headline — the tape did this, not news.
Door 2 — $LTC $45.05. The handle came back.
Four straight closes under $45.00 — $44.89, $44.79, $44.92, $44.83 — then 18:00 closed $45.05. First close back above the round number since the handle was lost.
Rank #24, $3.51B, -0.9% on the day, -12.8% on the week, -24% on the month, -89% off the $410 high. Fully circulating, no unlock overhang. Under both hourly EMAs, RSI 45. No Litecoin-specific news either — the board washed and LTC washed harder. LitVM mainnet is imminent and Canary's ETF holds $11M — backdrop, not a driver.
My pick is Door 2. A $3.5B book reclaiming a round handle beats a $26M coin whose reclaim just died on its own line. But one close is a reclaim, not a reversal — $45.05 is five cents of daylight, and the next close decides both doors.
Not a call, either way.
Kickers: SHELL held its line — 18:00 closed $0.03310 on $2.58M, tagged $0.03520 but closed under $0.03390, so open air waits. TAO closed $190.50, a fifth straight close under $191.30. AAVE closed $107.26, a hair above $107.15 — one close, not a chapter yet. KAVA survived a one-close scare, back above $0.03036 at $0.03157.
Which door owns the 20:00 UTC close — LTC's $45 handle or INIT's $0.1175 line?
$1M to deploy today. Two doors. ENTRY 214.
Door 1 — $INIT $0.1172. The reclaim died on its own line.
The leg ran $0.104 to $0.1477 on the 09:00 bell, then gave it all back. Five closes above $0.1295, then 13:00 closed $0.12580 under it. The last line was $0.1175 — 17:00 closed $0.11766, a hair above it. 18:00 closed $0.11716, the first close below. $0.1477 to $0.1172 is -20.7% in nine hours.
Rank #652, $25.8M market cap, still +9.6% on the day only because the window holds the spike. -91.7% off the $1.42 high, 22% of supply out, next unlock April 2027. Under both hourly EMAs, RSI 49. No fresh headline — the tape did this, not news.
Door 2 — $LTC $45.05. The handle came back.
Four straight closes under $45.00 — $44.89, $44.79, $44.92, $44.83 — then 18:00 closed $45.05. First close back above the round number since the handle was lost.
Rank #24, $3.51B, -0.9% on the day, -12.8% on the week, -24% on the month, -89% off the $410 high. Fully circulating, no unlock overhang. Under both hourly EMAs, RSI 45. No Litecoin-specific news either — the board washed and LTC washed harder. LitVM mainnet is imminent and Canary's ETF holds $11M — backdrop, not a driver.
My pick is Door 2. A $3.5B book reclaiming a round handle beats a $26M coin whose reclaim just died on its own line. But one close is a reclaim, not a reversal — $45.05 is five cents of daylight, and the next close decides both doors.
Not a call, either way.
Kickers: SHELL held its line — 18:00 closed $0.03310 on $2.58M, tagged $0.03520 but closed under $0.03390, so open air waits. TAO closed $190.50, a fifth straight close under $191.30. AAVE closed $107.26, a hair above $107.15 — one close, not a chapter yet. KAVA survived a one-close scare, back above $0.03036 at $0.03157.
Which door owns the 20:00 UTC close — LTC's $45 handle or INIT's $0.1175 line?
Door 1 — $INIT $0.1172. The reclaim died on its own line.
The leg ran $0.104 to $0.1477 on the 09:00 bell, then gave it all back. Five closes above $0.1295, then 13:00 closed $0.12580 under it. The last line was $0.1175 — 17:00 closed $0.11766, a hair above it. 18:00 closed $0.11716, the first close below. $0.1477 to $0.1172 is -20.7% in nine hours.
Rank #652, $25.8M market cap, still +9.6% on the day only because the window holds the spike. -91.7% off the $1.42 high, 22% of supply out, next unlock April 2027. Under both hourly EMAs, RSI 49. No fresh headline — the tape did this, not news.
Door 2 — $LTC $45.05. The handle came back.
Four straight closes under $45.00 — $44.89, $44.79, $44.92, $44.83 — then 18:00 closed $45.05. First close back above the round number since the handle was lost.
Rank #24, $3.51B, -0.9% on the day, -12.8% on the week, -24% on the month, -89% off the $410 high. Fully circulating, no unlock overhang. Under both hourly EMAs, RSI 45. No Litecoin-specific news either — the board washed and LTC washed harder. LitVM mainnet is imminent and Canary's ETF holds $11M — backdrop, not a driver.
My pick is Door 2. A $3.5B book reclaiming a round handle beats a $26M coin whose reclaim just died on its own line. But one close is a reclaim, not a reversal — $45.05 is five cents of daylight, and the next close decides both doors.
Not a call, either way.
Kickers: SHELL held its line — 18:00 closed $0.03310 on $2.58M, tagged $0.03520 but closed under $0.03390, so open air waits. TAO closed $190.50, a fifth straight close under $191.30. AAVE closed $107.26, a hair above $107.15 — one close, not a chapter yet. KAVA survived a one-close scare, back above $0.03036 at $0.03157.
Which door owns the 20:00 UTC close — LTC's $45 handle or INIT's $0.1175 line?
385
·
--
$LTC just lost $45 — two closed hours under it, and tonight's low is a fresh 30-day low.
It spent the first nine hours of the day parked between $49.10 and $49.90, going nowhere. Then the staircase down: 14:00 UTC closed $46.53 on $2.81M — the day's biggest hourly bar. 20:00 UTC closed $44.46 on $2.62M. 21:00 UTC closed $44.31, tagging $43.54 — the lowest print in 30 days. The forming hour is live around $43.63 and has already wicked to $43.43, unclosed — its 23:00 UTC close (04:30 IST) is the verdict, not a level yet.
The wider picture: rank #24, $3.41B market cap, -11.3% in 24 hours, -14.6% in a week, -26.7% in a month, and still 89% below the $410 all-time high. 92.6% of the 84M supply already circulates — no unlock overhang waiting in the wings.
No fresh Litecoin headline behind this — the news check turned up only tape-recap pieces. The driver is the board wash: Bitcoin ~$63,800, -6.6%, tagged $63,589. LTC is running about 1.7x weaker than Bitcoin tonight.
The other side, honestly: RSI 20 on the hourly is where flushes bounce hardest, not where they find floors. One hourly close back above $45 unwrites the break, and $43.54 is a wick so far, not a close.
Not a call, either way. Does $43.54 hold into the 23:00 UTC close, or does LTC print its first sub-$43 handle of the month?
$LTC just lost $45 — two closed hours under it, and tonight's low is a fresh 30-day low.
It spent the first nine hours of the day parked between $49.10 and $49.90, going nowhere. Then the staircase down: 14:00 UTC closed $46.53 on $2.81M — the day's biggest hourly bar. 20:00 UTC closed $44.46 on $2.62M. 21:00 UTC closed $44.31, tagging $43.54 — the lowest print in 30 days. The forming hour is live around $43.63 and has already wicked to $43.43, unclosed — its 23:00 UTC close (04:30 IST) is the verdict, not a level yet.
The wider picture: rank #24, $3.41B market cap, -11.3% in 24 hours, -14.6% in a week, -26.7% in a month, and still 89% below the $410 all-time high. 92.6% of the 84M supply already circulates — no unlock overhang waiting in the wings.
No fresh Litecoin headline behind this — the news check turned up only tape-recap pieces. The driver is the board wash: Bitcoin ~$63,800, -6.6%, tagged $63,589. LTC is running about 1.7x weaker than Bitcoin tonight.
The other side, honestly: RSI 20 on the hourly is where flushes bounce hardest, not where they find floors. One hourly close back above $45 unwrites the break, and $43.54 is a wick so far, not a close.
Not a call, either way. Does $43.54 hold into the 23:00 UTC close, or does LTC print its first sub-$43 handle of the month?
It spent the first nine hours of the day parked between $49.10 and $49.90, going nowhere. Then the staircase down: 14:00 UTC closed $46.53 on $2.81M — the day's biggest hourly bar. 20:00 UTC closed $44.46 on $2.62M. 21:00 UTC closed $44.31, tagging $43.54 — the lowest print in 30 days. The forming hour is live around $43.63 and has already wicked to $43.43, unclosed — its 23:00 UTC close (04:30 IST) is the verdict, not a level yet.
The wider picture: rank #24, $3.41B market cap, -11.3% in 24 hours, -14.6% in a week, -26.7% in a month, and still 89% below the $410 all-time high. 92.6% of the 84M supply already circulates — no unlock overhang waiting in the wings.
No fresh Litecoin headline behind this — the news check turned up only tape-recap pieces. The driver is the board wash: Bitcoin ~$63,800, -6.6%, tagged $63,589. LTC is running about 1.7x weaker than Bitcoin tonight.
The other side, honestly: RSI 20 on the hourly is where flushes bounce hardest, not where they find floors. One hourly close back above $45 unwrites the break, and $43.54 is a wick so far, not a close.
Not a call, either way. Does $43.54 hold into the 23:00 UTC close, or does LTC print its first sub-$43 handle of the month?
85

Article
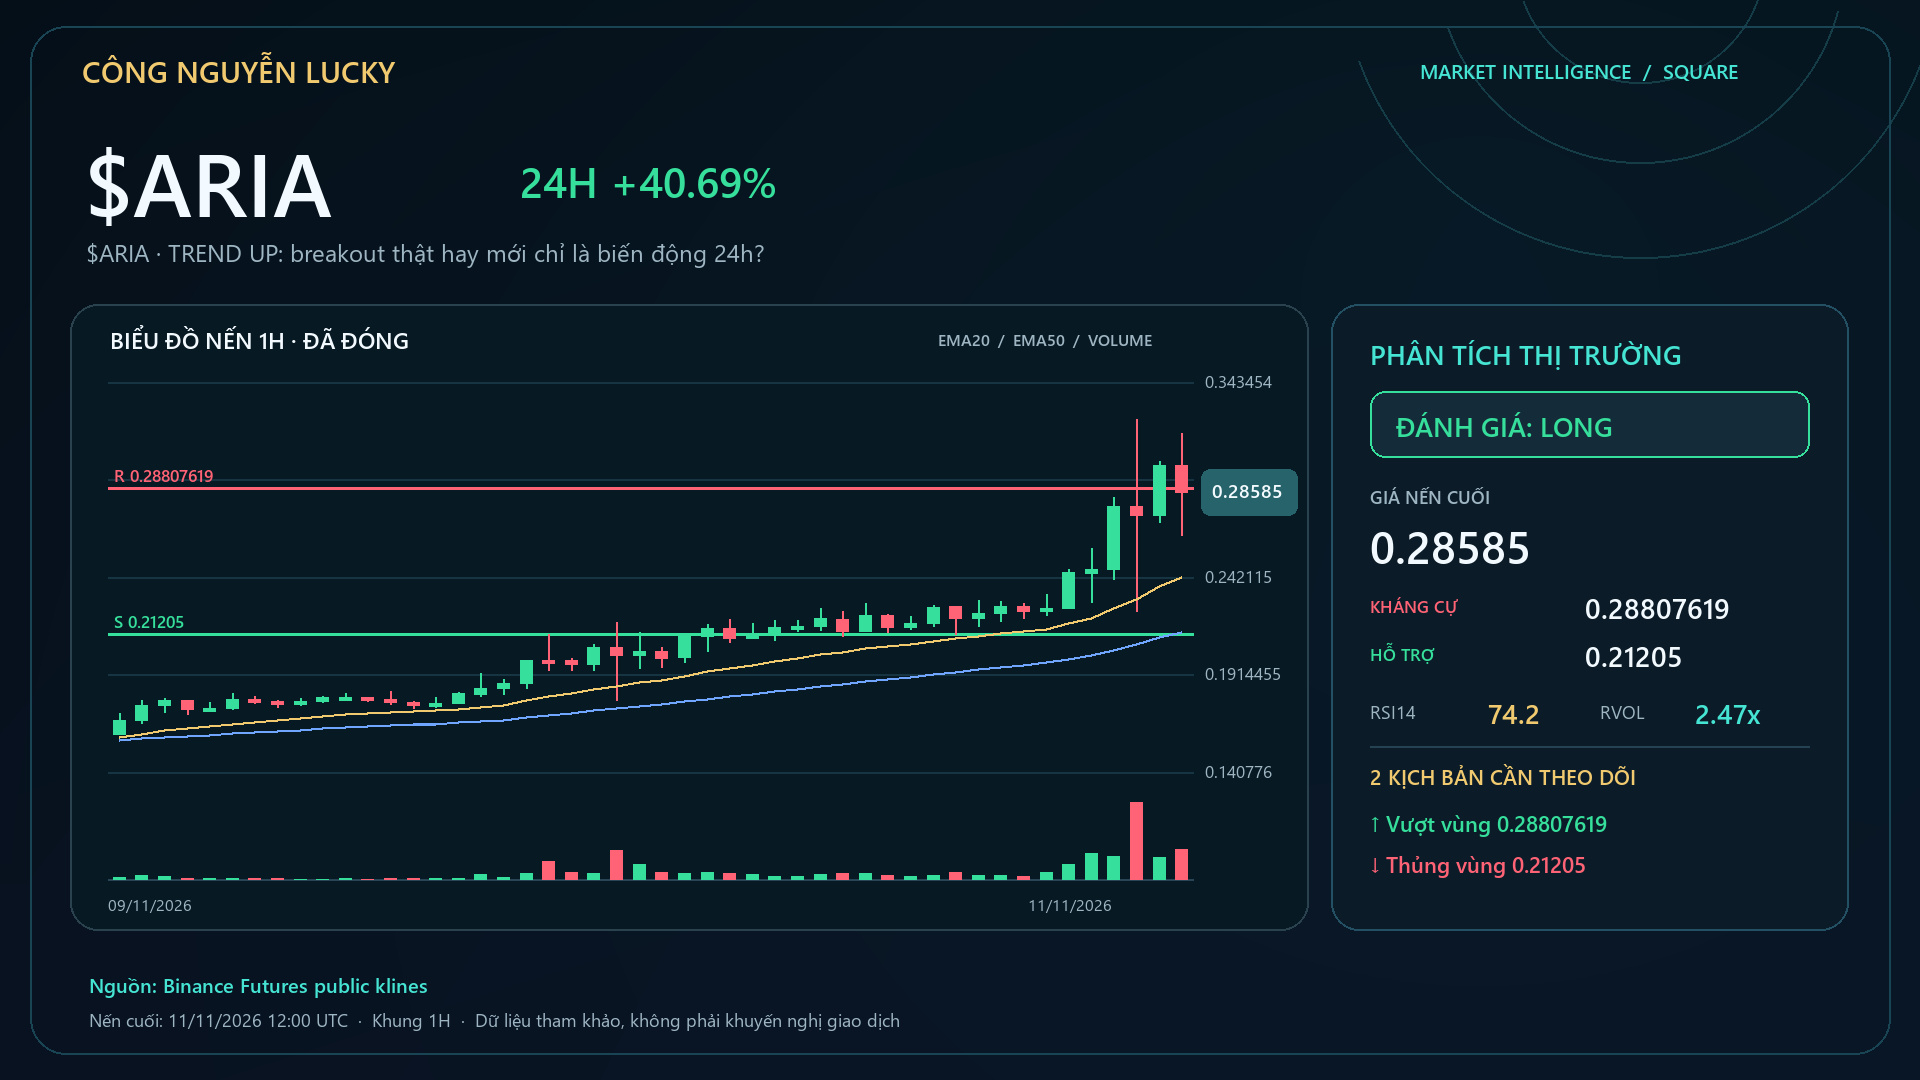
$ARIA · TREND UP: real breakout or just 24h volatility?🔥 $ARIA up +39.58% — but the percentage gain/loss alone isn’t enough to call this a good setup. Snapshot: 0.28518 · 24h +39.58% · volume ~252.8M USDT · 4,240,587 trades. 🟢 Bull/continuation case: A breakout above 0.32384 on expanding volume would make the continuation scenario more credible.
🔴 Bear/cooling case: Failing to hold the highs and falling back below the midpoint at 0.259545 would make the cooling scenario clearer. 🎯 Preferred trend: **LONG · STRONG · 86/100**.
$ARIA · TREND UP: real breakout or just 24h volatility?
🔥 $ARIA up +39.58% — but the percentage gain/loss alone isn’t enough to call this a good setup. Snapshot: 0.28518 · 24h +39.58% · volume ~252.8M USDT · 4,240,587 trades. 🟢 Bull/continuation case: A breakout above 0.32384 on expanding volume would make the continuation scenario more credible.
🔴 Bear/cooling case: Failing to hold the highs and falling back below the midpoint at 0.259545 would make the cooling scenario clearer. 🎯 Preferred trend: **LONG · STRONG · 86/100**.
🔴 Bear/cooling case: Failing to hold the highs and falling back below the midpoint at 0.259545 would make the cooling scenario clearer. 🎯 Preferred trend: **LONG · STRONG · 86/100**.
213

·
--
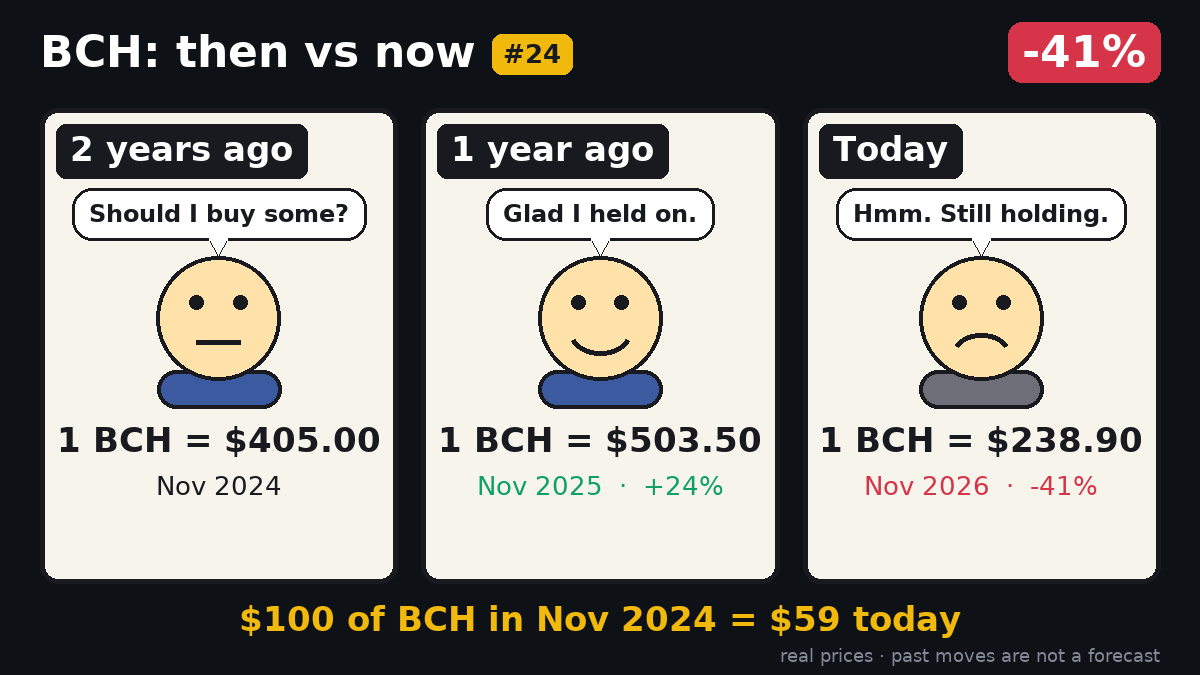
Two years ago $BCH closed at $405, now $239.
A $100 stake back then would sit at $59 today – a 41% drop that feels like a punchline to anyone who rode the hype. The chart tells a story of volatility, not a roadmap.
Past moves say nothing about the next ones.
💬 Regret?
🎨 Then vs Now #24 · a new one every morning
#BCH
Two years ago $BCH closed at $405, now $239.
A $100 stake back then would sit at $59 today – a 41% drop that feels like a punchline to anyone who rode the hype. The chart tells a story of volatility, not a roadmap.
Past moves say nothing about the next ones.
💬 Regret?
🎨 Then vs Now #24 · a new one every morning
#BCH
A $100 stake back then would sit at $59 today – a 41% drop that feels like a punchline to anyone who rode the hype. The chart tells a story of volatility, not a roadmap.
Past moves say nothing about the next ones.
💬 Regret?
🎨 Then vs Now #24 · a new one every morning
#BCH
57
Article
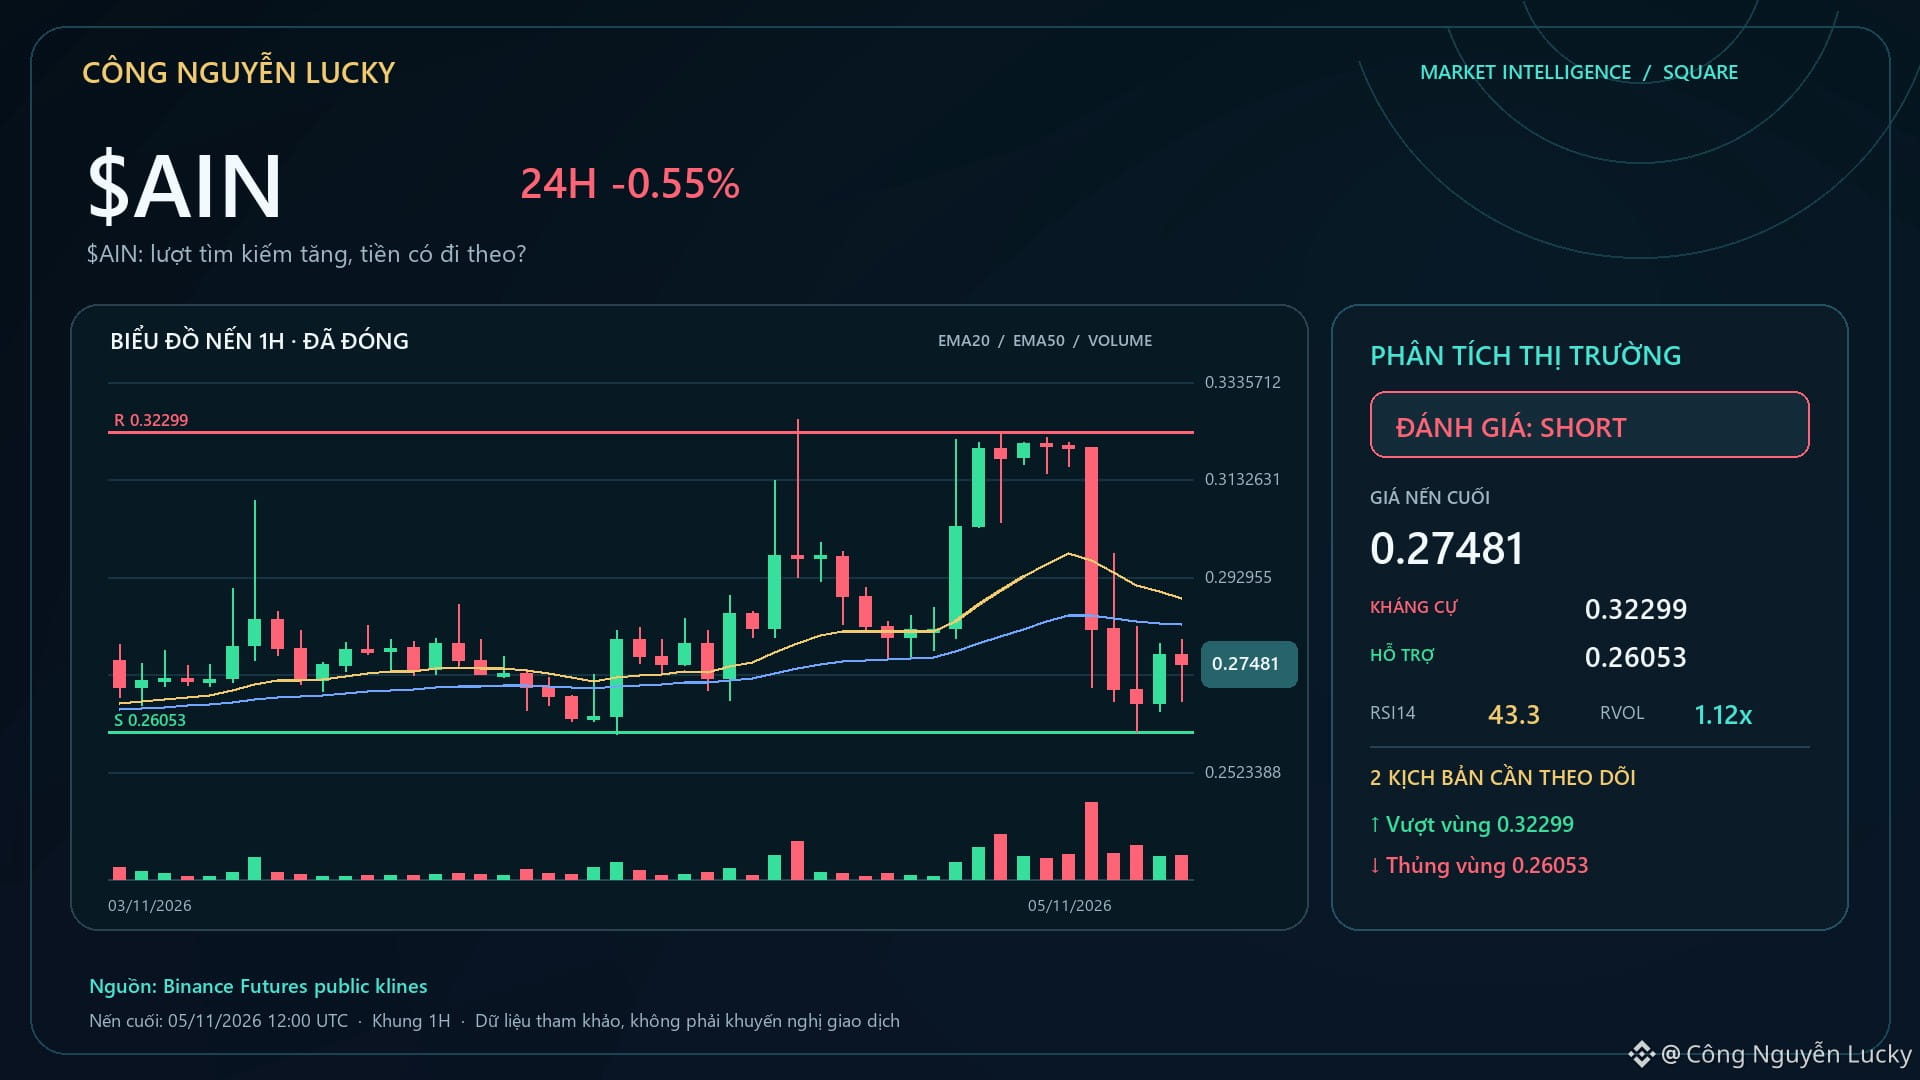
$AIN: Search interest is rising, but is the money following?🔎 $AIN is appearing among the most-searched assets on Binance (#24) — this signals interest, not a buy signal. Market: 0.27651 · 24h -0.44% · volume ~196.2M USDT · 2,678,308 trades.
User interest score: 33/100. If interest translates into actual trading: A break below 0.26053 on expanding volume would make the continuation of the bearish scenario more credible.
If search interest rises but the market doesn't confirm: Failure to hold the low zone and reclaim the midpoint at 0.29312 would weaken downward pressure. 🧭 Current outlook: **SHORT · STRONG · 89/100**.
$AIN: Search interest is rising, but is the money following?
🔎 $AIN is appearing among the most-searched assets on Binance (#24) — this signals interest, not a buy signal. Market: 0.27651 · 24h -0.44% · volume ~196.2M USDT · 2,678,308 trades.
User interest score: 33/100. If interest translates into actual trading: A break below 0.26053 on expanding volume would make the continuation of the bearish scenario more credible.
If search interest rises but the market doesn't confirm: Failure to hold the low zone and reclaim the midpoint at 0.29312 would weaken downward pressure. 🧭 Current outlook: **SHORT · STRONG · 89/100**.
User interest score: 33/100. If interest translates into actual trading: A break below 0.26053 on expanding volume would make the continuation of the bearish scenario more credible.
If search interest rises but the market doesn't confirm: Failure to hold the low zone and reclaim the midpoint at 0.29312 would weaken downward pressure. 🧭 Current outlook: **SHORT · STRONG · 89/100**.
225
Article
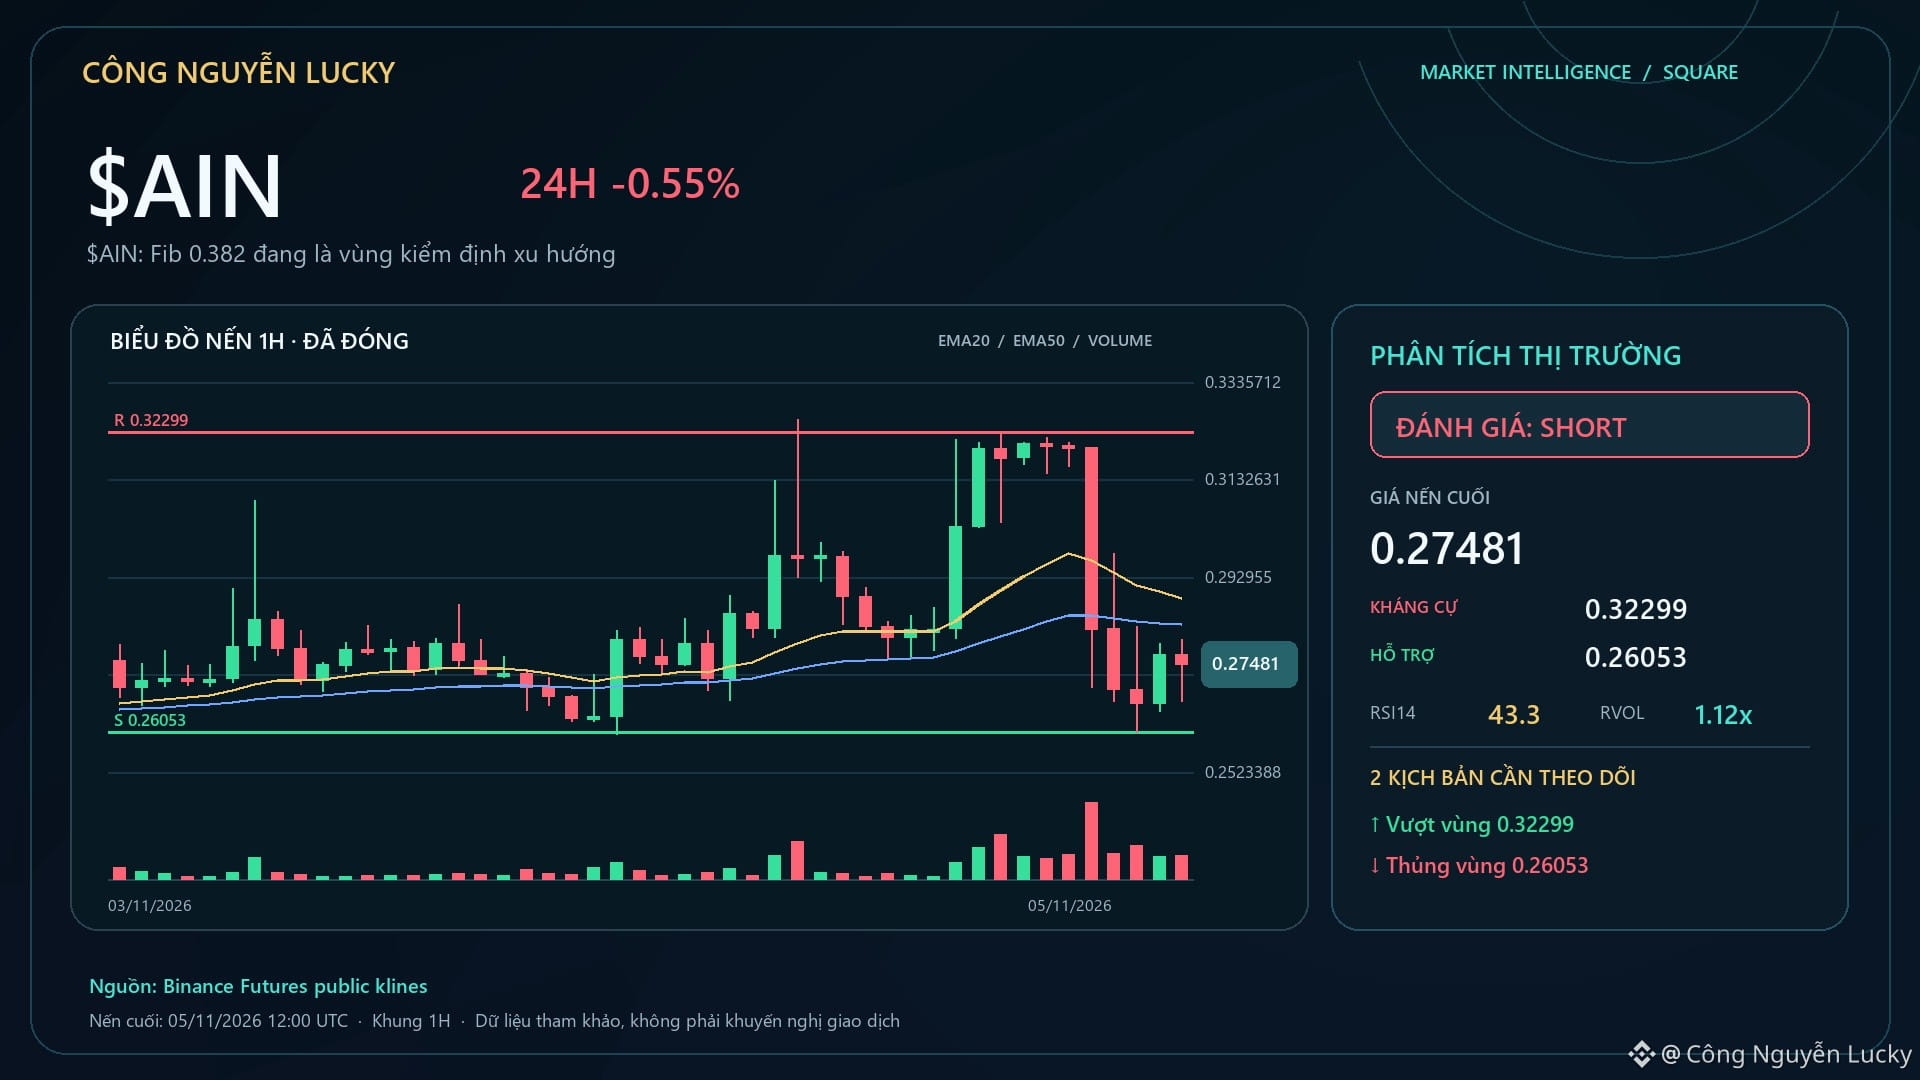
$AIN: Fib 0.382 is currently a trend-testing zone🔎 $AIN is at -0.22%; OI at -5.93% is the data I want to see before chasing price. Market: 0.27698 · 24h -0.22% · volume ~194.9M USDT · 2,663,627 trades.
Technical context: MIXED · SHORT bias 68/100.
Golden zone 0.50–0.618: 0.287645–0.30000078. Confirmation point: price reacts in the right direction at the Fib zone and holds the main structure/EMA.
Invalidation point: break above 0.32299 with momentum moving against the bias. The technical layers are being selected according to the regime:
$AIN: Fib 0.382 is currently a trend-testing zone
🔎 $AIN is at -0.22%; OI at -5.93% is the data I want to see before chasing price. Market: 0.27698 · 24h -0.22% · volume ~194.9M USDT · 2,663,627 trades.
Technical context: MIXED · SHORT bias 68/100.
Golden zone 0.50–0.618: 0.287645–0.30000078. Confirmation point: price reacts in the right direction at the Fib zone and holds the main structure/EMA.
Invalidation point: break above 0.32299 with momentum moving against the bias. The technical layers are being selected according to the regime:
Technical context: MIXED · SHORT bias 68/100.
Golden zone 0.50–0.618: 0.287645–0.30000078. Confirmation point: price reacts in the right direction at the Fib zone and holds the main structure/EMA.
Invalidation point: break above 0.32299 with momentum moving against the bias. The technical layers are being selected according to the regime:
167

·
--
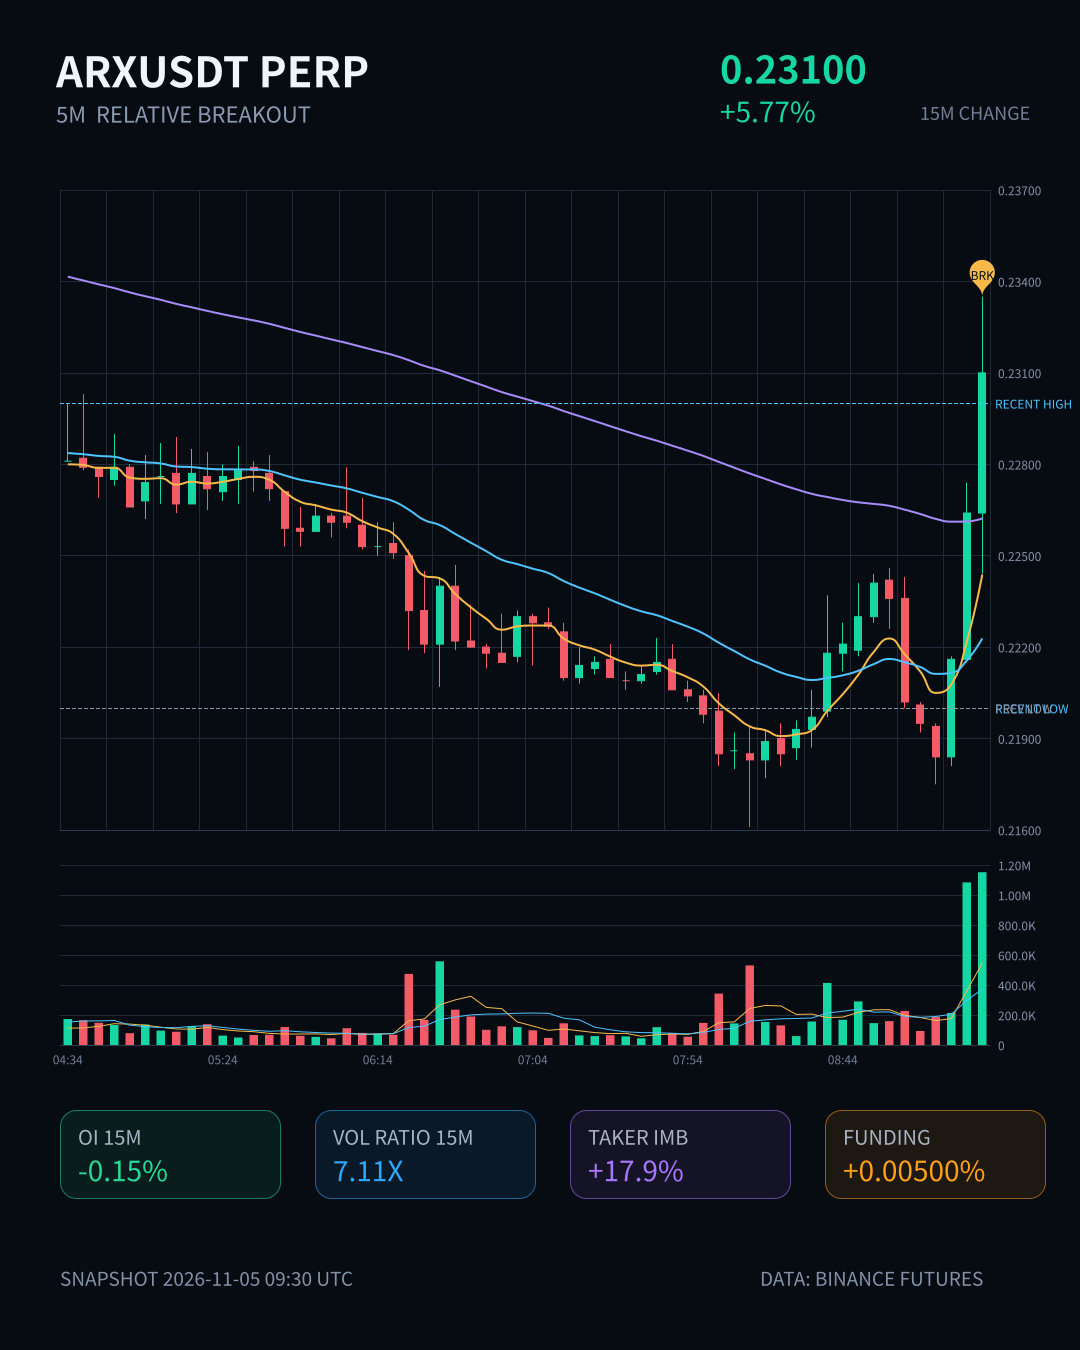
$ARX surged 5.77% in 15m, with volume jumping to 7.11x and volatility Z at 7.88—pretty intense. But look closely at OI: down 0.15% over 15m and 0.05% over 1h. Price is rising while positions are shrinking—this doesn't look like new longs entering, but more like shorts covering or existing positions being closed out. The aggressive buy/sell imbalance is 17.9%, the buy/sell ratio is 1.44, and the close pushed above the highs of the last 20 5m candles, so short-term sentiment is indeed tilted toward buyers. 24h trading volume is 34M, notional change ranks #24 across the pool, and the anomaly percentile is 93.1%—there's definitely some heat. It's just that with this kind of price-and-volume rise alongside falling OI, you should be cautious about chasing the rally. Don't mistake short covering for the start of a trend.
$ARX surged 5.77% in 15m, with volume jumping to 7.11x and volatility Z at 7.88—pretty intense. But look closely at OI: down 0.15% over 15m and 0.05% over 1h. Price is rising while positions are shrinking—this doesn't look like new longs entering, but more like shorts covering or existing positions being closed out. The aggressive buy/sell imbalance is 17.9%, the buy/sell ratio is 1.44, and the close pushed above the highs of the last 20 5m candles, so short-term sentiment is indeed tilted toward buyers. 24h trading volume is 34M, notional change ranks #24 across the pool, and the anomaly percentile is 93.1%—there's definitely some heat. It's just that with this kind of price-and-volume rise alongside falling OI, you should be cautious about chasing the rally. Don't mistake short covering for the start of a trend.
12

·
--
$XPL This 15m move looks a bit off—the 0.78% price drop isn’t that severe, but volume surged to 5.54 times normal, the buy/sell ratio is 0.48, and the net aggressive trading volume is -35%. Someone is clearly selling aggressively.
More importantly, OI is rising on both the 15m and 1h timeframes. Price down + OI up is a classic sign of new leveraged shorts entering. The OI anomaly percentile is 88.5%, ranking #81 for anomalies across the entire pool and #24 for notional change. It has persisted across multiple consecutive periods, confirming the move.
The close has already fallen below the lower bound of the recent 20-candle 5m range, while the funding rate remains in the upper end of its recent range. Shorts are continuing to add positions—not just testing the waters in the short term. Keep an eye on the downside potential of this move, $XPL .
$XPL This 15m move looks a bit off—the 0.78% price drop isn’t that severe, but volume surged to 5.54 times normal, the buy/sell ratio is 0.48, and the net aggressive trading volume is -35%. Someone is clearly selling aggressively.
More importantly, OI is rising on both the 15m and 1h timeframes. Price down + OI up is a classic sign of new leveraged shorts entering. The OI anomaly percentile is 88.5%, ranking #81 for anomalies across the entire pool and #24 for notional change. It has persisted across multiple consecutive periods, confirming the move.
The close has already fallen below the lower bound of the recent 20-candle 5m range, while the funding rate remains in the upper end of its recent range. Shorts are continuing to add positions—not just testing the waters in the short term. Keep an eye on the downside potential of this move, $XPL .
More importantly, OI is rising on both the 15m and 1h timeframes. Price down + OI up is a classic sign of new leveraged shorts entering. The OI anomaly percentile is 88.5%, ranking #81 for anomalies across the entire pool and #24 for notional change. It has persisted across multiple consecutive periods, confirming the move.
The close has already fallen below the lower bound of the recent 20-candle 5m range, while the funding rate remains in the upper end of its recent range. Shorts are continuing to add positions—not just testing the waters in the short term. Keep an eye on the downside potential of this move, $XPL .
57

·
--
$USELESS This move dropped 1.21% over 15m, with volume surging to 2.27x. Net aggressive trading was -46.1%, and the buy/sell ratio was 0.37, indicating solid selling pressure. The price broke below the lower bound of the recent 20-candle 5m range while OI rose, suggesting new leveraged shorts are entering rather than this being simply spot selling. 24h trading volume is still 21.87M, and the anomaly percentile ranks #24 across the entire pool. First, watch whether the price can reclaim the lower bound of this range; if it can't, bearish sentiment will likely persist.
$USELESS This move dropped 1.21% over 15m, with volume surging to 2.27x. Net aggressive trading was -46.1%, and the buy/sell ratio was 0.37, indicating solid selling pressure. The price broke below the lower bound of the recent 20-candle 5m range while OI rose, suggesting new leveraged shorts are entering rather than this being simply spot selling. 24h trading volume is still 21.87M, and the anomaly percentile ranks #24 across the entire pool. First, watch whether the price can reclaim the lower bound of this range; if it can't, bearish sentiment will likely persist.
4

·
--
🚨 $INIT $BLUR $IDOL POISED FOR 24/7 TRADING SURGE 📈
Regulators are eyeing a nonstop market, and that could flood $INIT , $BLUR and $IDOL with fresh capital. The CFTC’s roundtable hints at a shift that could sync U.S. derivatives with the global tempo 📊
Smart money loves continuous flow – liquidity pools expand, order books thicken, and whales can swing without the nightly pause. Expect tighter spreads and a potential volatility pulse as the market adapts ⚡
Keep an eye on volume spikes and on‑chain inflows; those will be the early barometer of who’s positioning for the new regime 🌊 💬 Are you gearing up for the 24/7 era or waiting for the volatility test? 👇
⚠️ Not financial advice. Always manage your risk. 🛡️
🏷️ #INIT #Regulation #24 /7Trading #Crypto
🔥 💎
🚨 $INIT $BLUR $IDOL POISED FOR 24/7 TRADING SURGE 📈
Regulators are eyeing a nonstop market, and that could flood $INIT , $BLUR and $IDOL with fresh capital. The CFTC’s roundtable hints at a shift that could sync U.S. derivatives with the global tempo 📊
Smart money loves continuous flow – liquidity pools expand, order books thicken, and whales can swing without the nightly pause. Expect tighter spreads and a potential volatility pulse as the market adapts ⚡
Keep an eye on volume spikes and on‑chain inflows; those will be the early barometer of who’s positioning for the new regime 🌊 💬 Are you gearing up for the 24/7 era or waiting for the volatility test? 👇
⚠️ Not financial advice. Always manage your risk. 🛡️
🏷️ #INIT #Regulation #24 /7Trading #Crypto
🔥 💎
Regulators are eyeing a nonstop market, and that could flood $INIT , $BLUR and $IDOL with fresh capital. The CFTC’s roundtable hints at a shift that could sync U.S. derivatives with the global tempo 📊
Smart money loves continuous flow – liquidity pools expand, order books thicken, and whales can swing without the nightly pause. Expect tighter spreads and a potential volatility pulse as the market adapts ⚡
Keep an eye on volume spikes and on‑chain inflows; those will be the early barometer of who’s positioning for the new regime 🌊 💬 Are you gearing up for the 24/7 era or waiting for the volatility test? 👇
⚠️ Not financial advice. Always manage your risk. 🛡️
🏷️ #INIT #Regulation #24 /7Trading #Crypto
🔥 💎


25
·
--
FIL just made a move worth keeping an eye on. It’s up 1.23% over 15m, with volume jumping to 2.18 times its usual level. Price has broken above the highs of the last 20 5m candles, aggressive trade imbalance is +14.5%, and the buy/sell ratio is 1.34—the buying is directional.
But what really caught my attention is OI: as price moved up, OI fell 0.25% over 15m and 0.03% over 1h. The OI anomaly percentile surged to 97%, ranking #24 across the entire pool. This setup doesn’t look much like new longs entering; it looks more like short covering and position unwinding are driving the move.
It’s near a historical extreme range, and notional change is also near the top of the entire pool, with the trend continuing over several consecutive periods. How far this rebound can go depends on whether fresh money steps in after the covering is over; otherwise, it’ll just be a brief gust of wind. Watch for now—don’t rush to chase it.
FIL just made a move worth keeping an eye on. It’s up 1.23% over 15m, with volume jumping to 2.18 times its usual level. Price has broken above the highs of the last 20 5m candles, aggressive trade imbalance is +14.5%, and the buy/sell ratio is 1.34—the buying is directional.
But what really caught my attention is OI: as price moved up, OI fell 0.25% over 15m and 0.03% over 1h. The OI anomaly percentile surged to 97%, ranking #24 across the entire pool. This setup doesn’t look much like new longs entering; it looks more like short covering and position unwinding are driving the move.
It’s near a historical extreme range, and notional change is also near the top of the entire pool, with the trend continuing over several consecutive periods. How far this rebound can go depends on whether fresh money steps in after the covering is over; otherwise, it’ll just be a brief gust of wind. Watch for now—don’t rush to chase it.
But what really caught my attention is OI: as price moved up, OI fell 0.25% over 15m and 0.03% over 1h. The OI anomaly percentile surged to 97%, ranking #24 across the entire pool. This setup doesn’t look much like new longs entering; it looks more like short covering and position unwinding are driving the move.
It’s near a historical extreme range, and notional change is also near the top of the entire pool, with the trend continuing over several consecutive periods. How far this rebound can go depends on whether fresh money steps in after the covering is over; otherwise, it’ll just be a brief gust of wind. Watch for now—don’t rush to chase it.
2
·
--
$Bulls are coming. This drop was pretty fast: down 1.47% in 15m, with volume surging to 2.28x and a Z-score of 2.3—there’s clearly some money moving.
Open interest, on the other hand, barely increased. It was almost unchanged over 1h and edged down slightly over 15m, with a notional change of -147K. This looks more like longs deleveraging or exiting via stop-losses than new shorts entering.
Price broke below the lower bound of the recent 20-candle 5m range. Aggressive trade imbalance was -17.6%, and the buy/sell ratio was 0.70, so selling pressure is dominant. But the funding rate is still in a high percentile relative to recent levels, suggesting longs were fairly crowded before. This drop looks more like a position unwind.
The anomaly ranks #24 across the full pool, and the notional change ranks #35. Depth confirmation has passed, volume is above normal, price has touched the range boundary, and there’s directional bias. With this setup, short-term momentum could persist, but if this is a sign that long deleveraging is complete, watch for stabilization afterward. Observe for now—don’t rush to buy the dip.
$Bulls are coming. This drop was pretty fast: down 1.47% in 15m, with volume surging to 2.28x and a Z-score of 2.3—there’s clearly some money moving.
Open interest, on the other hand, barely increased. It was almost unchanged over 1h and edged down slightly over 15m, with a notional change of -147K. This looks more like longs deleveraging or exiting via stop-losses than new shorts entering.
Price broke below the lower bound of the recent 20-candle 5m range. Aggressive trade imbalance was -17.6%, and the buy/sell ratio was 0.70, so selling pressure is dominant. But the funding rate is still in a high percentile relative to recent levels, suggesting longs were fairly crowded before. This drop looks more like a position unwind.
The anomaly ranks #24 across the full pool, and the notional change ranks #35. Depth confirmation has passed, volume is above normal, price has touched the range boundary, and there’s directional bias. With this setup, short-term momentum could persist, but if this is a sign that long deleveraging is complete, watch for stabilization afterward. Observe for now—don’t rush to buy the dip.
Open interest, on the other hand, barely increased. It was almost unchanged over 1h and edged down slightly over 15m, with a notional change of -147K. This looks more like longs deleveraging or exiting via stop-losses than new shorts entering.
Price broke below the lower bound of the recent 20-candle 5m range. Aggressive trade imbalance was -17.6%, and the buy/sell ratio was 0.70, so selling pressure is dominant. But the funding rate is still in a high percentile relative to recent levels, suggesting longs were fairly crowded before. This drop looks more like a position unwind.
The anomaly ranks #24 across the full pool, and the notional change ranks #35. Depth confirmation has passed, volume is above normal, price has touched the range boundary, and there’s directional bias. With this setup, short-term momentum could persist, but if this is a sign that long deleveraging is complete, watch for stabilization afterward. Observe for now—don’t rush to buy the dip.
9
Log in to explore more content
Join global crypto users on Binance Square
⚡️ Get latest and useful information about crypto.
💬 Trusted by the world’s largest crypto exchange.
👍 Discover real insights from verified creators.
Email / Phone number
Trending Topics
1
#CanBTCReboundAfterFallingBelow60K?
0 views
115 Discussing
2
#GlobalStocksFaceLongestLosingStreakSince2023
0 views
268 Discussing
3
#AnthropicPlungesTowardIPOPriceonDay2
0 views
43 Discussing
4
#GaoTengBitcoinETFListsOnHKEX
0 views
264 Discussing
5
#TradFiForBeginners
946,825 views
5,525 Discussing
6
#NvidiaBoardReportedlySplitOverHuang’sReturn
258,674 views
2,405 Discussing
7
#TetherBurns8BillionUSDTInPast20Days
0 views
101 Discussing
8
#BitcoinWalletSignatureFlawExploitableWithinSeconds
0 views
44 Discussing
9
#CanGTA6'sLaunchLiftTTWOShares?
207,868 views
1,711 Discussing
10
#HongKongProposesSFCLicensingForFourVirtualAssetServices
404 views
32 Discussing