
#426
426
341 views
11 Discussing
Hot
Latest

·
--
Three days ago $MMT couldn't stop going up. Tonight it can't stop giving it back.
$0.2099 now, down 20% on the day — and Bitcoin's up 2% while it happens, so this isn't the board dragging it down. This is MMT's own leg unwinding.
The hourly closes tell it straight: 11:00 UTC slipped under $0.2336, the door from the Nov 19 reversal. 12:00 closed under the EMA50 at $0.2268. Since then eight of nine closes have printed under it, and the 21:00 close tagged a fresh 24h low of $0.2091. That's not one bad hour, that's a ten-hour grind from $0.24 to $0.21.
The numbers around it: rank #426 on CoinGecko, $42.9M market cap, $32.7M global volume today. Still up 115% on the week, still 95% below its $4.03 all-time high. No fresh headline anywhere — quote pages only. The backdrop hasn't changed either: the Nov 4 unlock freed 252M tokens against just 204.1M circulating, so four-fifths of supply is still locked overhang.
Honest other side: RSI is 32, and that's where flushes bounce hardest. One hourly close back above $0.2268 unwrites the EMA50 leg, and the Nov 19 low at $0.1926 hasn't been tested yet.
So which is it — the blast fully unwinding, or the first deep breath before another run at $0.26?
Three days ago $MMT couldn't stop going up. Tonight it can't stop giving it back.
$0.2099 now, down 20% on the day — and Bitcoin's up 2% while it happens, so this isn't the board dragging it down. This is MMT's own leg unwinding.
The hourly closes tell it straight: 11:00 UTC slipped under $0.2336, the door from the Nov 19 reversal. 12:00 closed under the EMA50 at $0.2268. Since then eight of nine closes have printed under it, and the 21:00 close tagged a fresh 24h low of $0.2091. That's not one bad hour, that's a ten-hour grind from $0.24 to $0.21.
The numbers around it: rank #426 on CoinGecko, $42.9M market cap, $32.7M global volume today. Still up 115% on the week, still 95% below its $4.03 all-time high. No fresh headline anywhere — quote pages only. The backdrop hasn't changed either: the Nov 4 unlock freed 252M tokens against just 204.1M circulating, so four-fifths of supply is still locked overhang.
Honest other side: RSI is 32, and that's where flushes bounce hardest. One hourly close back above $0.2268 unwrites the EMA50 leg, and the Nov 19 low at $0.1926 hasn't been tested yet.
So which is it — the blast fully unwinding, or the first deep breath before another run at $0.26?
$0.2099 now, down 20% on the day — and Bitcoin's up 2% while it happens, so this isn't the board dragging it down. This is MMT's own leg unwinding.
The hourly closes tell it straight: 11:00 UTC slipped under $0.2336, the door from the Nov 19 reversal. 12:00 closed under the EMA50 at $0.2268. Since then eight of nine closes have printed under it, and the 21:00 close tagged a fresh 24h low of $0.2091. That's not one bad hour, that's a ten-hour grind from $0.24 to $0.21.
The numbers around it: rank #426 on CoinGecko, $42.9M market cap, $32.7M global volume today. Still up 115% on the week, still 95% below its $4.03 all-time high. No fresh headline anywhere — quote pages only. The backdrop hasn't changed either: the Nov 4 unlock freed 252M tokens against just 204.1M circulating, so four-fifths of supply is still locked overhang.
Honest other side: RSI is 32, and that's where flushes bounce hardest. One hourly close back above $0.2268 unwrites the EMA50 leg, and the Nov 19 low at $0.1926 hasn't been tested yet.
So which is it — the blast fully unwinding, or the first deep breath before another run at $0.26?
43

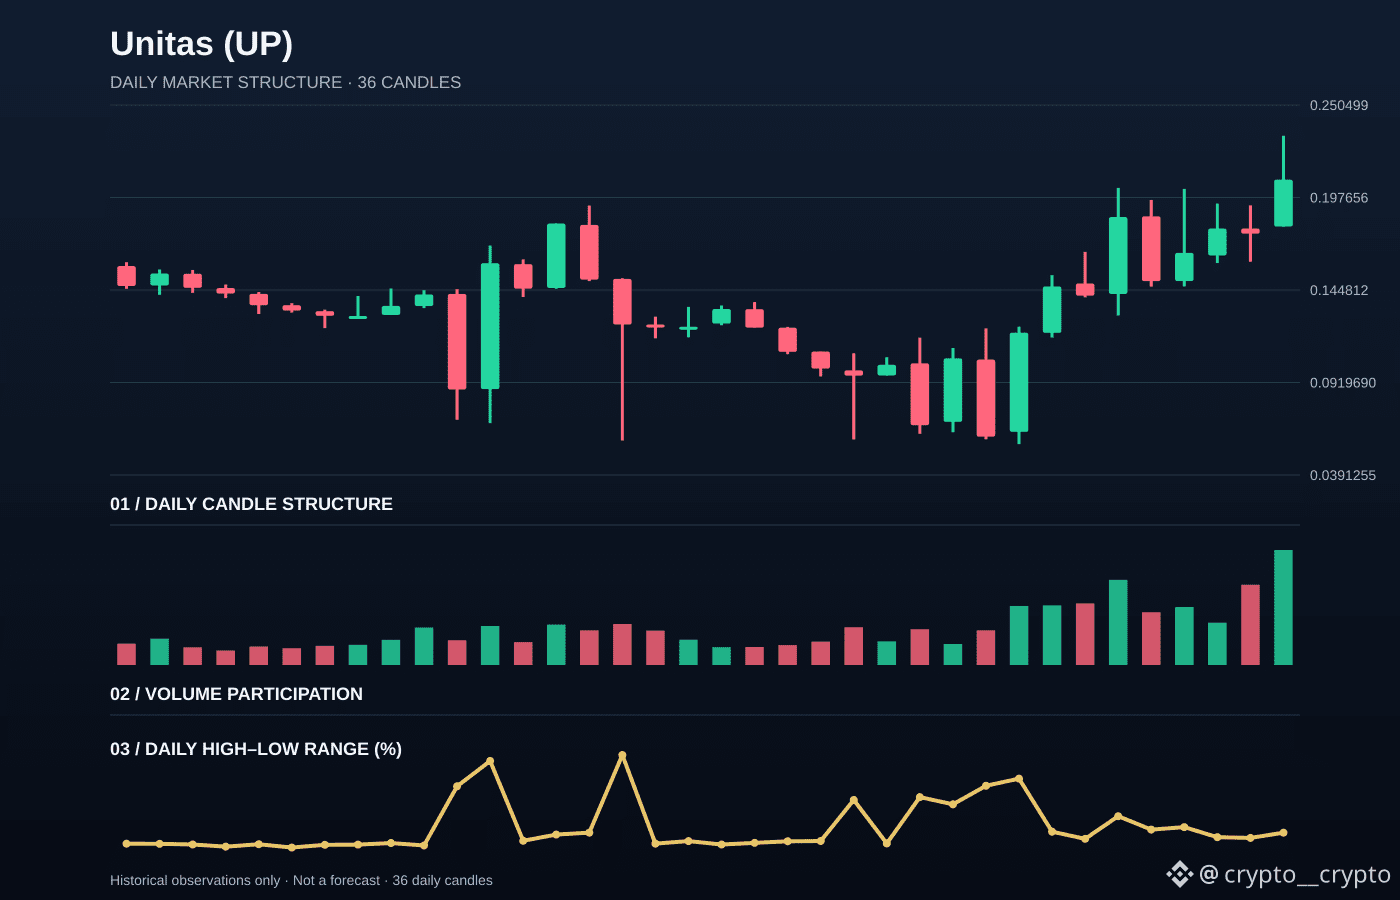
Unitas (UP) advanced 17.44% between the last two available daily closes. The detail I am watching is how that move finished, not just the headline percentage.
The close landed around the middle of the daily range, so neither side dominated the finish. A follow-through close would strengthen the case that demand is persisting; a quick reversal would weaken it.
For Unitas, the useful question is whether participation expands if price attempts to recover the latest session range. The latest candle covered 28.71% from low to high, with OHLC: 0.18105533 / 0.232885 / 0.18094071 / 0.2078475.
For context, the 24-hour market move is +17.64%, while reported turnover is approximately 796.51M USD. CoinMarketCap rank: #426. Benchmark snapshot: BTC +0.13% · ETH +1.19%.
What level would change your view on UP—the latest low, the latest high, or the previous close?
Data note: CMC listings market quote and CoinLore daily candles. These are observed market figures, not a price prediction or a trade instruction.
$UP $BTC $ETH
Unitas (UP) advanced 17.44% between the last two available daily closes. The detail I am watching is how that move finished, not just the headline percentage.
The close landed around the middle of the daily range, so neither side dominated the finish. A follow-through close would strengthen the case that demand is persisting; a quick reversal would weaken it.
For Unitas, the useful question is whether participation expands if price attempts to recover the latest session range. The latest candle covered 28.71% from low to high, with OHLC: 0.18105533 / 0.232885 / 0.18094071 / 0.2078475.
For context, the 24-hour market move is +17.64%, while reported turnover is approximately 796.51M USD. CoinMarketCap rank: #426. Benchmark snapshot: BTC +0.13% · ETH +1.19%.
What level would change your view on UP—the latest low, the latest high, or the previous close?
Data note: CMC listings market quote and CoinLore daily candles. These are observed market figures, not a price prediction or a trade instruction.
$UP $BTC $ETH
The close landed around the middle of the daily range, so neither side dominated the finish. A follow-through close would strengthen the case that demand is persisting; a quick reversal would weaken it.
For Unitas, the useful question is whether participation expands if price attempts to recover the latest session range. The latest candle covered 28.71% from low to high, with OHLC: 0.18105533 / 0.232885 / 0.18094071 / 0.2078475.
For context, the 24-hour market move is +17.64%, while reported turnover is approximately 796.51M USD. CoinMarketCap rank: #426. Benchmark snapshot: BTC +0.13% · ETH +1.19%.
What level would change your view on UP—the latest low, the latest high, or the previous close?
Data note: CMC listings market quote and CoinLore daily candles. These are observed market figures, not a price prediction or a trade instruction.
$UP $BTC $ETH
1
129

·
--
ZEST surges 6.5% in 5 minutes! What happened? Key levels here19:16 (27 minutes ago) ZEST surged 6.5% within 5 minutes (5-minute window 19:11→19:16). As of 19:43:49, the current price is 0.1761, down 2.5% over 24h. Other tokens with unusual moves in the same batch include US and MAGIC.
📅 Data as of 19:43:49 (event trigger times are noted for each item; prices are real-time snapshots at the time of writing)
📌 In a nutshell: Short-term momentum is concentrated, and pullbacks can come quickly—placing staggered limit orders is safer than chasing the price
Market overview: BTC 83,307.00(+0.37%) · ETH 2,544.99(+1.72%); across the market, 231 gainers / 260 losers over 24h; top gainer GTC+59.61%, top loser LUMIA-24.00%.
ZEST surges 6.5% in 5 minutes! What happened? Key levels here
19:16 (27 minutes ago) ZEST surged 6.5% within 5 minutes (5-minute window 19:11→19:16). As of 19:43:49, the current price is 0.1761, down 2.5% over 24h. Other tokens with unusual moves in the same batch include US and MAGIC.
📅 Data as of 19:43:49 (event trigger times are noted for each item; prices are real-time snapshots at the time of writing)
📌 In a nutshell: Short-term momentum is concentrated, and pullbacks can come quickly—placing staggered limit orders is safer than chasing the price
Market overview: BTC 83,307.00(+0.37%) · ETH 2,544.99(+1.72%); across the market, 231 gainers / 260 losers over 24h; top gainer GTC+59.61%, top loser LUMIA-24.00%.
📅 Data as of 19:43:49 (event trigger times are noted for each item; prices are real-time snapshots at the time of writing)
📌 In a nutshell: Short-term momentum is concentrated, and pullbacks can come quickly—placing staggered limit orders is safer than chasing the price
Market overview: BTC 83,307.00(+0.37%) · ETH 2,544.99(+1.72%); across the market, 231 gainers / 260 losers over 24h; top gainer GTC+59.61%, top loser LUMIA-24.00%.
16
·
--
Attention! AXS suddenly surged 2.1% at an important time point—where to look for a pullback to enter?14:08 (21 minutes ago) AXS saw a jump of 2.1% at an important time point (5-minute window 14:03→14:08). As of 14:29:45, the current price is 1.4198, up 13.1% in 24h. Other movers in the same batch include MAGMA and XPIN.
📅 Data as of 14:29:45 (event trigger time is noted in each entry; prices are live snapshots at the time of writing)
📌 One-sentence takeaway: In important time windows (K-line close / U.S. stock market open and close), most of the anomalies involve institutional participation, so the signals are of higher quality
Market Overview: BTC 84,922.50 (+0.38%) · ETH 2,690.98 (+0.56%); Across the whole market, 358 stocks rose and 134 fell in the past 24 hours; Top gainer in the past 24 hours: AIN +176.52%; Top laggard: BTW -35.85%.
Attention! AXS suddenly surged 2.1% at an important time point—where to look for a pullback to enter?
14:08 (21 minutes ago) AXS saw a jump of 2.1% at an important time point (5-minute window 14:03→14:08). As of 14:29:45, the current price is 1.4198, up 13.1% in 24h. Other movers in the same batch include MAGMA and XPIN.
📅 Data as of 14:29:45 (event trigger time is noted in each entry; prices are live snapshots at the time of writing)
📌 One-sentence takeaway: In important time windows (K-line close / U.S. stock market open and close), most of the anomalies involve institutional participation, so the signals are of higher quality
Market Overview: BTC 84,922.50 (+0.38%) · ETH 2,690.98 (+0.56%); Across the whole market, 358 stocks rose and 134 fell in the past 24 hours; Top gainer in the past 24 hours: AIN +176.52%; Top laggard: BTW -35.85%.
📅 Data as of 14:29:45 (event trigger time is noted in each entry; prices are live snapshots at the time of writing)
📌 One-sentence takeaway: In important time windows (K-line close / U.S. stock market open and close), most of the anomalies involve institutional participation, so the signals are of higher quality
Market Overview: BTC 84,922.50 (+0.38%) · ETH 2,690.98 (+0.56%); Across the whole market, 358 stocks rose and 134 fell in the past 24 hours; Top gainer in the past 24 hours: AIN +176.52%; Top laggard: BTW -35.85%.
70
·
--
Attention! SAND surged straight up 4.7% within 5 minutes—where to buy on the pullback?12:50 (9 minutes ago) SAND surged 4.7% within 5 minutes (5-minute window 12:45→12:50). As of 13:00:29, the current price is 0.07891, with a 24h change of -2.2%. Other movers in the same batch include MAGMA and AIN.
📅 Data as of 13:00:29 (event trigger times are noted on each item; prices are live snapshots at the time of writing)
📌 One-sentence takeaway: short-term momentum is concentrated, and pullbacks often come and go quickly—placing staggered limit orders is steadier than chasing the price up
Market Overview: BTC 84,772.60 (+0.28%) · ETH 2,691.25 (+0.62%); In the whole market, 240 stocks rose and 113 fell over the past 24h; Top gainer over 24h: STRK +23.70%, top decliner: RESOLV -11.78%.
Attention! SAND surged straight up 4.7% within 5 minutes—where to buy on the pullback?
12:50 (9 minutes ago) SAND surged 4.7% within 5 minutes (5-minute window 12:45→12:50). As of 13:00:29, the current price is 0.07891, with a 24h change of -2.2%. Other movers in the same batch include MAGMA and AIN.
📅 Data as of 13:00:29 (event trigger times are noted on each item; prices are live snapshots at the time of writing)
📌 One-sentence takeaway: short-term momentum is concentrated, and pullbacks often come and go quickly—placing staggered limit orders is steadier than chasing the price up
Market Overview: BTC 84,772.60 (+0.28%) · ETH 2,691.25 (+0.62%); In the whole market, 240 stocks rose and 113 fell over the past 24h; Top gainer over 24h: STRK +23.70%, top decliner: RESOLV -11.78%.
📅 Data as of 13:00:29 (event trigger times are noted on each item; prices are live snapshots at the time of writing)
📌 One-sentence takeaway: short-term momentum is concentrated, and pullbacks often come and go quickly—placing staggered limit orders is steadier than chasing the price up
Market Overview: BTC 84,772.60 (+0.28%) · ETH 2,691.25 (+0.62%); In the whole market, 240 stocks rose and 113 fell over the past 24h; Top gainer over 24h: STRK +23.70%, top decliner: RESOLV -11.78%.
2

·
--
$BERA On the chart, I have a vague feeling that the decline is narrowing — but for that intuition to hold, I still need to see two things: first, whether trading volume can recover from the current daily average of 6–7M to above 10M; second, whether $0.149 (the 30-day low) can be effectively confirmed as support, rather than just a rebound relay.
The data is simple: it has dropped 26% over the past 30 days, and it is almost back to zero from ATH (-98.94%). The market cap ranking has fallen to #426. The rebound is only +1.96%, which looks more like a technical bounce after being oversold. What really matters is not that gain, but the fact that turnover in the $0.15–$0.16 range has started to slow over the past week — after the drop to $0.149 on July 30, volume actually shrank, which suggests the selling momentum is also fading.
What is the money trading? I think it is not betting on a fundamentals reversal, but on a “mean reversion after falling too far” trade. But this is a low-liquidity game: market cap is 47M, 24h turnover is only about 13%, and once buying pressure concentrates, the rebound can come quickly — but chasing higher prices makes it easier to get trapped.
The easiest risk to overlook is this: a small green candle after a slow, low-volume decline is often a hallmark of a “dead cat” market, not a reversal signal. If volume continues to shrink below 5M over the next three days, $0.14 is likely to break.
My view is valid only if price holds $0.149 and daily volume climbs back above 10M. If it breaks below that level with rising volume, then this bottoming intuition is wrong. Which do you pay more attention to, volume or price? Feel free to share your thoughts.
$BERA On the chart, I have a vague feeling that the decline is narrowing — but for that intuition to hold, I still need to see two things: first, whether trading volume can recover from the current daily average of 6–7M to above 10M; second, whether $0.149 (the 30-day low) can be effectively confirmed as support, rather than just a rebound relay.
The data is simple: it has dropped 26% over the past 30 days, and it is almost back to zero from ATH (-98.94%). The market cap ranking has fallen to #426. The rebound is only +1.96%, which looks more like a technical bounce after being oversold. What really matters is not that gain, but the fact that turnover in the $0.15–$0.16 range has started to slow over the past week — after the drop to $0.149 on July 30, volume actually shrank, which suggests the selling momentum is also fading.
What is the money trading? I think it is not betting on a fundamentals reversal, but on a “mean reversion after falling too far” trade. But this is a low-liquidity game: market cap is 47M, 24h turnover is only about 13%, and once buying pressure concentrates, the rebound can come quickly — but chasing higher prices makes it easier to get trapped.
The easiest risk to overlook is this: a small green candle after a slow, low-volume decline is often a hallmark of a “dead cat” market, not a reversal signal. If volume continues to shrink below 5M over the next three days, $0.14 is likely to break.
My view is valid only if price holds $0.149 and daily volume climbs back above 10M. If it breaks below that level with rising volume, then this bottoming intuition is wrong. Which do you pay more attention to, volume or price? Feel free to share your thoughts.
The data is simple: it has dropped 26% over the past 30 days, and it is almost back to zero from ATH (-98.94%). The market cap ranking has fallen to #426. The rebound is only +1.96%, which looks more like a technical bounce after being oversold. What really matters is not that gain, but the fact that turnover in the $0.15–$0.16 range has started to slow over the past week — after the drop to $0.149 on July 30, volume actually shrank, which suggests the selling momentum is also fading.
What is the money trading? I think it is not betting on a fundamentals reversal, but on a “mean reversion after falling too far” trade. But this is a low-liquidity game: market cap is 47M, 24h turnover is only about 13%, and once buying pressure concentrates, the rebound can come quickly — but chasing higher prices makes it easier to get trapped.
The easiest risk to overlook is this: a small green candle after a slow, low-volume decline is often a hallmark of a “dead cat” market, not a reversal signal. If volume continues to shrink below 5M over the next three days, $0.14 is likely to break.
My view is valid only if price holds $0.149 and daily volume climbs back above 10M. If it breaks below that level with rising volume, then this bottoming intuition is wrong. Which do you pay more attention to, volume or price? Feel free to share your thoughts.
358
·
--
ZEREBRO surges 2.9%! Is this kind of sharp rally worth chasing?At 19:50 (25 minutes ago), ZEREBRO surged 2.9% at a key time (5-minute window: 19:45→19:50). As of 20:16:01, its current price is 0.04369, down 7.4% over 24h. STRK also saw a similar move.
📅 Data as of 20:16:01 (event trigger times are noted for each item; prices are real-time snapshots taken when this was written)
📌 In a nutshell: Moves during key periods (when candles close or U.S. markets open/close) often involve institutional participation, making them more significant signals
Market overview: BTC 82,211.10 (+1.55%) · ETH 2,464.08 (+4.20%); across the market, 451 assets rose and 39 fell in the past 24h; top 24h gainer: AGT +140.71%, top loser: GOAT -21.52%.
ZEREBRO surges 2.9%! Is this kind of sharp rally worth chasing?
At 19:50 (25 minutes ago), ZEREBRO surged 2.9% at a key time (5-minute window: 19:45→19:50). As of 20:16:01, its current price is 0.04369, down 7.4% over 24h. STRK also saw a similar move.
📅 Data as of 20:16:01 (event trigger times are noted for each item; prices are real-time snapshots taken when this was written)
📌 In a nutshell: Moves during key periods (when candles close or U.S. markets open/close) often involve institutional participation, making them more significant signals
Market overview: BTC 82,211.10 (+1.55%) · ETH 2,464.08 (+4.20%); across the market, 451 assets rose and 39 fell in the past 24h; top 24h gainer: AGT +140.71%, top loser: GOAT -21.52%.
📅 Data as of 20:16:01 (event trigger times are noted for each item; prices are real-time snapshots taken when this was written)
📌 In a nutshell: Moves during key periods (when candles close or U.S. markets open/close) often involve institutional participation, making them more significant signals
Market overview: BTC 82,211.10 (+1.55%) · ETH 2,464.08 (+4.20%); across the market, 451 assets rose and 39 fell in the past 24h; top 24h gainer: AGT +140.71%, top loser: GOAT -21.52%.
4
Log in to explore more content
Join global crypto users on Binance Square
⚡️ Get latest and useful information about crypto.
💬 Trusted by the world’s largest crypto exchange.
👍 Discover real insights from verified creators.
Email / Phone number
Trending Topics
1
#BTCReboundsAbove$60KAmidWhaleDipBuying
31,465 views
181 Discussing
2
#SolanaSets2027RoadmapToDoubleComputeCapacity
14,765 views
402 Discussing
3
#CaliforniaNvidiaProbeExaminesPotentialCriminalViolations
4,617 views
61 Discussing
4
#BlackRockLaunchesHKDollarDigitalLiquidityFund
11,377 views
346 Discussing
5
#NvidiaLoses$2.7TrillionInMonthAndAHalf
58,939 views
263 Discussing
6
#GlobalStocksFaceLongestLosingStreakSince2023
483,441 views
3,076 Discussing
7
#BlackRockIBITPostsRecord$541MSingleDayOutflow
76,921 views
159 Discussing
8
#AnthropicPlungesTowardIPOPriceonDay2
262,108 views
2,038 Discussing
9
#TwentyOneCapitalAdds172.25BTC
131,625 views
1,376 Discussing
10
#HKBillWouldExcludeTokenizedDepositsFromVirtualAssets
16,220 views
95 Discussing