
#67
67
9,575 views
89 Discussing
Hot
Latest

·
--
# Technical Analysis
coine,: #67
## 1. Overview & Key Metrics
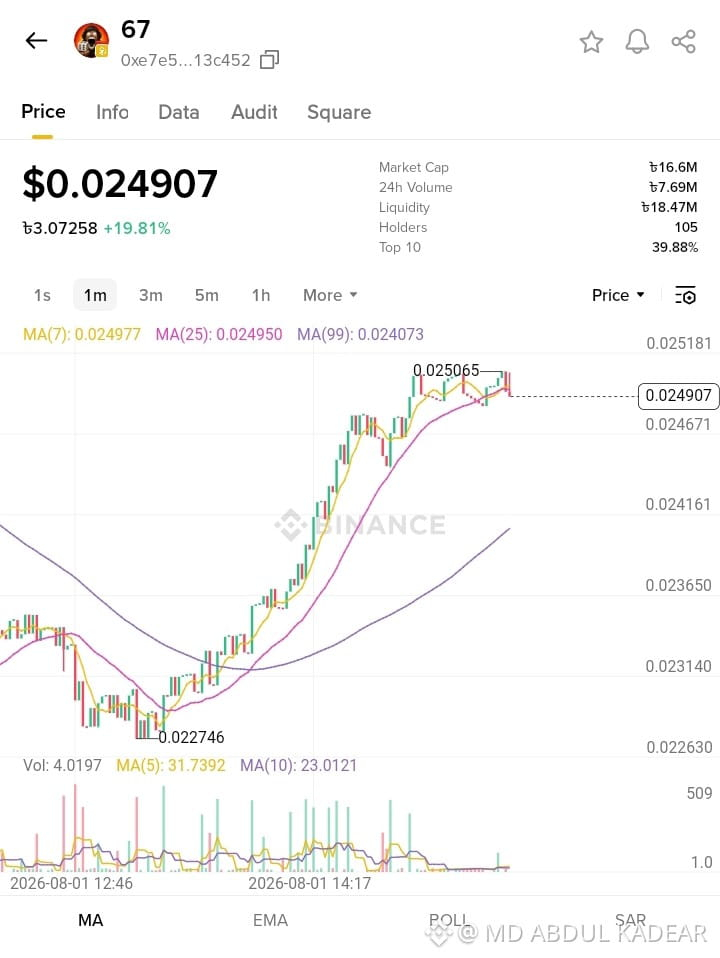
- Token Symbol: 67 (Contract: 0xe7e5...13c452)
- Current Price: $0.024907 (৳3.07258)
- 24-Hour Price Change: +19.81%
- Recent Peak High: $0.025065
- Recent Low: $0.022746
- Market Cap: ৳16.6M
- 24h Volume: ৳7.69M
- Total Liquidity: ৳18.47M
- Total Holders: 105
- Top 10 Holders Control: 39.88%
## 2. Technical Indicator Status
- MA(7) [Short-term Trend]: $0.024977
- MA(25) [Medium-term Trend]: $0.024950
- MA(99) [Long-term Trend]: $0.024073
## 3. 24-Hour Price Prediction Analysis (5% – 6% Potential Upside)
### Technical Justification:
1. Bullish Moving Average Alignment:
The MA(7) and MA(25) moving averages are holding above the long-term MA(99) support line ($0.024073). This configuration indicates strong buying power and a sustained upward trend.
2. Consolidation before Continuation:
After reaching a high of $0.025065, the token experienced a slight pullback and is now consolidating near the $0.02490 mark rather than dumping. In technical chart patterns, consolidation right below resistance usually indicates a buildup for another breakout.
### Target Price Calculation:
- Base Price: $0.024907
- Target (+5.0% Gain): $0.02615
- Target (+6.0% Gain): $0.02640
A breakout above the local high of $0.025065 is expected to push the price into the $0.02615 – $0.02640 zone within 24 hours.
## 4. Support, Resistance & Risk Factors
- Immediate Resistance: $0.025065
- Bullish Target Range: $0.02615 – $0.02640
- Immediate Support Level: $0.024671
- Crucial Trend Support (MA-99): $0.024073
- Risk Warning: Low holder count (105) and heavy concentration in top wallets (39.88%) indicate high volatility. Always utilize proper risk management strategies.
# Technical Analysis
coine,: #67
## 1. Overview & Key Metrics
- Token Symbol: 67 (Contract: 0xe7e5...13c452)
- Current Price: $0.024907 (৳3.07258)
- 24-Hour Price Change: +19.81%
- Recent Peak High: $0.025065
- Recent Low: $0.022746
- Market Cap: ৳16.6M
- 24h Volume: ৳7.69M
- Total Liquidity: ৳18.47M
- Total Holders: 105
- Top 10 Holders Control: 39.88%
## 2. Technical Indicator Status
- MA(7) [Short-term Trend]: $0.024977
- MA(25) [Medium-term Trend]: $0.024950
- MA(99) [Long-term Trend]: $0.024073
## 3. 24-Hour Price Prediction Analysis (5% – 6% Potential Upside)
### Technical Justification:
1. Bullish Moving Average Alignment:
The MA(7) and MA(25) moving averages are holding above the long-term MA(99) support line ($0.024073). This configuration indicates strong buying power and a sustained upward trend.
2. Consolidation before Continuation:
After reaching a high of $0.025065, the token experienced a slight pullback and is now consolidating near the $0.02490 mark rather than dumping. In technical chart patterns, consolidation right below resistance usually indicates a buildup for another breakout.
### Target Price Calculation:
- Base Price: $0.024907
- Target (+5.0% Gain): $0.02615
- Target (+6.0% Gain): $0.02640
A breakout above the local high of $0.025065 is expected to push the price into the $0.02615 – $0.02640 zone within 24 hours.
## 4. Support, Resistance & Risk Factors
- Immediate Resistance: $0.025065
- Bullish Target Range: $0.02615 – $0.02640
- Immediate Support Level: $0.024671
- Crucial Trend Support (MA-99): $0.024073
- Risk Warning: Low holder count (105) and heavy concentration in top wallets (39.88%) indicate high volatility. Always utilize proper risk management strategies.
coine,: #67
## 1. Overview & Key Metrics
- Token Symbol: 67 (Contract: 0xe7e5...13c452)
- Current Price: $0.024907 (৳3.07258)
- 24-Hour Price Change: +19.81%
- Recent Peak High: $0.025065
- Recent Low: $0.022746
- Market Cap: ৳16.6M
- 24h Volume: ৳7.69M
- Total Liquidity: ৳18.47M
- Total Holders: 105
- Top 10 Holders Control: 39.88%
## 2. Technical Indicator Status
- MA(7) [Short-term Trend]: $0.024977
- MA(25) [Medium-term Trend]: $0.024950
- MA(99) [Long-term Trend]: $0.024073
## 3. 24-Hour Price Prediction Analysis (5% – 6% Potential Upside)
### Technical Justification:
1. Bullish Moving Average Alignment:
The MA(7) and MA(25) moving averages are holding above the long-term MA(99) support line ($0.024073). This configuration indicates strong buying power and a sustained upward trend.
2. Consolidation before Continuation:
After reaching a high of $0.025065, the token experienced a slight pullback and is now consolidating near the $0.02490 mark rather than dumping. In technical chart patterns, consolidation right below resistance usually indicates a buildup for another breakout.
### Target Price Calculation:
- Base Price: $0.024907
- Target (+5.0% Gain): $0.02615
- Target (+6.0% Gain): $0.02640
A breakout above the local high of $0.025065 is expected to push the price into the $0.02615 – $0.02640 zone within 24 hours.
## 4. Support, Resistance & Risk Factors
- Immediate Resistance: $0.025065
- Bullish Target Range: $0.02615 – $0.02640
- Immediate Support Level: $0.024671
- Crucial Trend Support (MA-99): $0.024073
- Risk Warning: Low holder count (105) and heavy concentration in top wallets (39.88%) indicate high volatility. Always utilize proper risk management strategies.
101

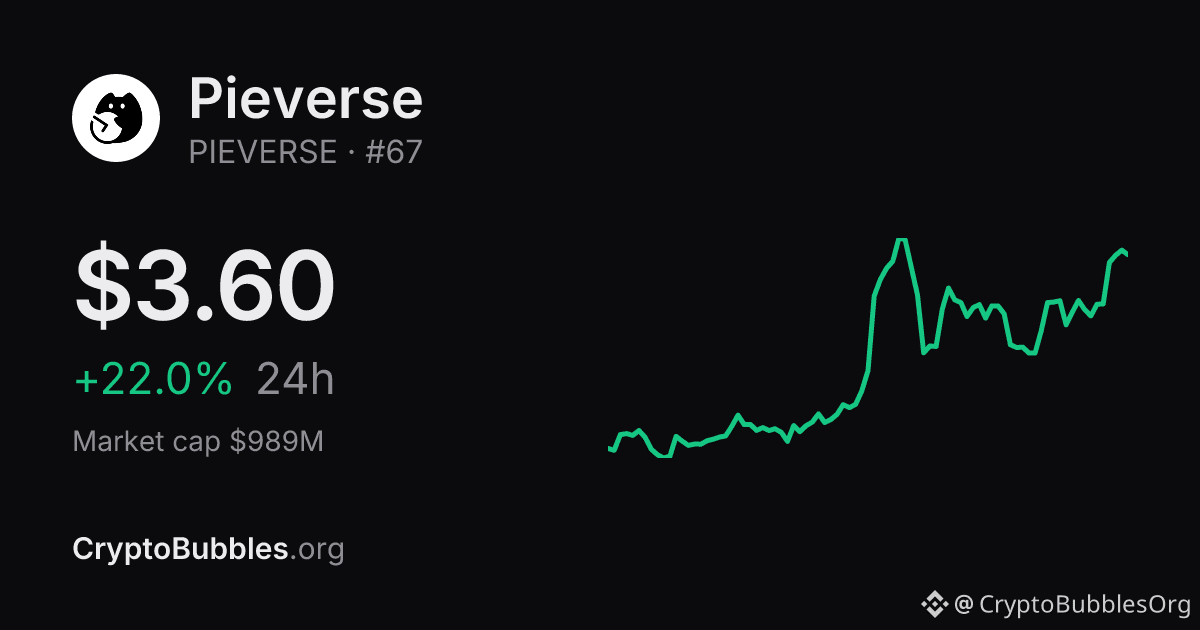
NEW ALL-TIME HIGH: $PIEVERSE just broke its record at $5.33.
Price $3.6 · 24h +22.0% · 7d +53.7%
Rank #67 · market cap $989M
Price discovery mode. There is no resistance above an all-time high, only belief.
How high does it go from here?
Follow for the whole market in bubbles, every hour.
#CryptoNews
NEW ALL-TIME HIGH: $PIEVERSE just broke its record at $5.33.
Price $3.6 · 24h +22.0% · 7d +53.7%
Rank #67 · market cap $989M
Price discovery mode. There is no resistance above an all-time high, only belief.
How high does it go from here?
Follow for the whole market in bubbles, every hour.
#CryptoNews
Price $3.6 · 24h +22.0% · 7d +53.7%
Rank #67 · market cap $989M
Price discovery mode. There is no resistance above an all-time high, only belief.
How high does it go from here?
Follow for the whole market in bubbles, every hour.
#CryptoNews
162


·
--
$BNB closed $699.54 — the first hourly close under $700 in four days. The 67-close streak is dead.
The tape: 16:00 UTC closed $703.40 — that was close #67 above the line. Then 17:00 UTC: O $703.40 → H $704.01 → L $697.37 → C $699.54 on $3.89M. First closed hour under $700 since Oct 30 21:00 UTC's $696.71.
The forming 18:00 hour is live and unclosed — its 19:00 UTC close (00:30 IST) is the verdict, not a level: O $699.54 → wicked $701.58 back above the line, got sold → L $697.60 → printing $697.76. Buyers knocked once and got rejected inside the hour.
Live: $697.76, -1.7% 24h, H $716.00 / L $697.37 (fresh 24h low), $77.1M / 538k trades. Chart: 1h RSI 34, pinned under EMA20 $706.41 / EMA50 $708.39, R $717.75 / S $700.40.
Rank #4, $91.7B, 131.5M circ, 7d -6.3% / 30d -11.6%, -49.1% off $1,369.99 ATH.
Driver: no fresh timed headline — this is the hack-wash overhang doing the work. Withdrawals have now hit $4.7B since the $6.3B theft (Seeking Alpha, ~3h ago), up from $3.6B a day earlier (BBC/Guardian). BNB remains the coin most tied to Binance itself, and it's bleeding while majors hold better.
Honest other side: one close under, not two — 46 cents is real but thin. The $697.37 wick recovered within the hour. $680 ate real selling twice. Sunday-evening volume, not a flush bar ($3.89M vs the day's $5.9M). One hourly close back above $700 unwrites this chapter.
New lines: $700 broken (hourly close back above = reclaim attempt two); $697.37 24h low (closed hour below = deeper air); $680 flush low (closed bar below = real deep water); $706–708 EMA stack overhead.
Not a call. Just the tape.
00:30 IST question: does the 18:00 hour close back above $700 and kill this, or does the $701.58 wick stand as the first failed reclaim?
$BNB $BTC
$BNB closed $699.54 — the first hourly close under $700 in four days. The 67-close streak is dead.
The tape: 16:00 UTC closed $703.40 — that was close #67 above the line. Then 17:00 UTC: O $703.40 → H $704.01 → L $697.37 → C $699.54 on $3.89M. First closed hour under $700 since Oct 30 21:00 UTC's $696.71.
The forming 18:00 hour is live and unclosed — its 19:00 UTC close (00:30 IST) is the verdict, not a level: O $699.54 → wicked $701.58 back above the line, got sold → L $697.60 → printing $697.76. Buyers knocked once and got rejected inside the hour.
Live: $697.76, -1.7% 24h, H $716.00 / L $697.37 (fresh 24h low), $77.1M / 538k trades. Chart: 1h RSI 34, pinned under EMA20 $706.41 / EMA50 $708.39, R $717.75 / S $700.40.
Rank #4, $91.7B, 131.5M circ, 7d -6.3% / 30d -11.6%, -49.1% off $1,369.99 ATH.
Driver: no fresh timed headline — this is the hack-wash overhang doing the work. Withdrawals have now hit $4.7B since the $6.3B theft (Seeking Alpha, ~3h ago), up from $3.6B a day earlier (BBC/Guardian). BNB remains the coin most tied to Binance itself, and it's bleeding while majors hold better.
Honest other side: one close under, not two — 46 cents is real but thin. The $697.37 wick recovered within the hour. $680 ate real selling twice. Sunday-evening volume, not a flush bar ($3.89M vs the day's $5.9M). One hourly close back above $700 unwrites this chapter.
New lines: $700 broken (hourly close back above = reclaim attempt two); $697.37 24h low (closed hour below = deeper air); $680 flush low (closed bar below = real deep water); $706–708 EMA stack overhead.
Not a call. Just the tape.
00:30 IST question: does the 18:00 hour close back above $700 and kill this, or does the $701.58 wick stand as the first failed reclaim?
$BNB $BTC
The tape: 16:00 UTC closed $703.40 — that was close #67 above the line. Then 17:00 UTC: O $703.40 → H $704.01 → L $697.37 → C $699.54 on $3.89M. First closed hour under $700 since Oct 30 21:00 UTC's $696.71.
The forming 18:00 hour is live and unclosed — its 19:00 UTC close (00:30 IST) is the verdict, not a level: O $699.54 → wicked $701.58 back above the line, got sold → L $697.60 → printing $697.76. Buyers knocked once and got rejected inside the hour.
Live: $697.76, -1.7% 24h, H $716.00 / L $697.37 (fresh 24h low), $77.1M / 538k trades. Chart: 1h RSI 34, pinned under EMA20 $706.41 / EMA50 $708.39, R $717.75 / S $700.40.
Rank #4, $91.7B, 131.5M circ, 7d -6.3% / 30d -11.6%, -49.1% off $1,369.99 ATH.
Driver: no fresh timed headline — this is the hack-wash overhang doing the work. Withdrawals have now hit $4.7B since the $6.3B theft (Seeking Alpha, ~3h ago), up from $3.6B a day earlier (BBC/Guardian). BNB remains the coin most tied to Binance itself, and it's bleeding while majors hold better.
Honest other side: one close under, not two — 46 cents is real but thin. The $697.37 wick recovered within the hour. $680 ate real selling twice. Sunday-evening volume, not a flush bar ($3.89M vs the day's $5.9M). One hourly close back above $700 unwrites this chapter.
New lines: $700 broken (hourly close back above = reclaim attempt two); $697.37 24h low (closed hour below = deeper air); $680 flush low (closed bar below = real deep water); $706–708 EMA stack overhead.
Not a call. Just the tape.
00:30 IST question: does the 18:00 hour close back above $700 and kill this, or does the $701.58 wick stand as the first failed reclaim?
$BNB $BTC
8

·
--
Chess Zeiss's Prediction Diary #67 ⚽
As promised in the last post, I’ll report the wins and losses honestly.
Last night (10/31), I placed 12 bets in one go: 5 wins, 7 losses, for a net loss of -$587.
First, the wins:
• Bournemouth to win: $104, average odds 0.47; beat Leeds 2-0, +$113
• Brentford to win: $104, average odds 0.46; beat Nottingham Forest 2-0, +$117
• Barcelona -2.5 ($103, average odds 0.53) + Barcelona -3.5 ($52, average odds 0.33): thrashed Alavés 6-1; +$190 across both bets
• Porto to win: $105, average odds 0.84; beat Estoril 4-0, +$20
Now, the losses:
• Bayern to win, $512 (average odds 0.73), plus Bayern -1.5 for $103 and -2.5 for $104: Dortmund equalized to make it 2-2 in the German Klassiker. All three bets lost, -$719. This was the biggest pitfall of the day.
• Man City to win: $103, average odds 0.56; lost 0-1 at home to Brighton, -$103
• Hull City to win: $104, average odds 0.34; drew 2-2 with Ipswich, -$104
• Two 6-leg parlays at $50 each: one Man City loss wiped them both out, -$100
One-line review: I put nearly half my bankroll on one derby, and even added handicap bets. It looked safe, but derbies never play by the rules. Next time, I’ll cap the stake on any one match and won’t add handicap bets.
Still open:
• Missouri vs. Arkansas (NCAA football), Missouri to win: a small $1 bet. At halftime when I’m writing this, Missouri leads 13-7. I’ll review it tomorrow.
• Long-term bet: Arsenal to win the Premier League, Yes. Average odds 0.52, current odds 0.645, unrealized profit around +$120. Come on, Gunners!
It’s even more important to keep records on losing days.
See you tomorrow!
This content was compiled by me (with possible AI assistance) for personal record-keeping and sharing only; it does not constitute investment advice. Markets involve risk, so make your own independent judgments.
#预测日记 #足球 #PredictionMarket
「Love, Death & Robots」🩷☠️🤖
That’s it for this episode!
Chess Zeiss's Prediction Diary #67 ⚽
As promised in the last post, I’ll report the wins and losses honestly.
Last night (10/31), I placed 12 bets in one go: 5 wins, 7 losses, for a net loss of -$587.
First, the wins:
• Bournemouth to win: $104, average odds 0.47; beat Leeds 2-0, +$113
• Brentford to win: $104, average odds 0.46; beat Nottingham Forest 2-0, +$117
• Barcelona -2.5 ($103, average odds 0.53) + Barcelona -3.5 ($52, average odds 0.33): thrashed Alavés 6-1; +$190 across both bets
• Porto to win: $105, average odds 0.84; beat Estoril 4-0, +$20
Now, the losses:
• Bayern to win, $512 (average odds 0.73), plus Bayern -1.5 for $103 and -2.5 for $104: Dortmund equalized to make it 2-2 in the German Klassiker. All three bets lost, -$719. This was the biggest pitfall of the day.
• Man City to win: $103, average odds 0.56; lost 0-1 at home to Brighton, -$103
• Hull City to win: $104, average odds 0.34; drew 2-2 with Ipswich, -$104
• Two 6-leg parlays at $50 each: one Man City loss wiped them both out, -$100
One-line review: I put nearly half my bankroll on one derby, and even added handicap bets. It looked safe, but derbies never play by the rules. Next time, I’ll cap the stake on any one match and won’t add handicap bets.
Still open:
• Missouri vs. Arkansas (NCAA football), Missouri to win: a small $1 bet. At halftime when I’m writing this, Missouri leads 13-7. I’ll review it tomorrow.
• Long-term bet: Arsenal to win the Premier League, Yes. Average odds 0.52, current odds 0.645, unrealized profit around +$120. Come on, Gunners!
It’s even more important to keep records on losing days.
See you tomorrow!
This content was compiled by me (with possible AI assistance) for personal record-keeping and sharing only; it does not constitute investment advice. Markets involve risk, so make your own independent judgments.
#预测日记 #足球 #PredictionMarket
「Love, Death & Robots」🩷☠️🤖
That’s it for this episode!
As promised in the last post, I’ll report the wins and losses honestly.
Last night (10/31), I placed 12 bets in one go: 5 wins, 7 losses, for a net loss of -$587.
First, the wins:
• Bournemouth to win: $104, average odds 0.47; beat Leeds 2-0, +$113
• Brentford to win: $104, average odds 0.46; beat Nottingham Forest 2-0, +$117
• Barcelona -2.5 ($103, average odds 0.53) + Barcelona -3.5 ($52, average odds 0.33): thrashed Alavés 6-1; +$190 across both bets
• Porto to win: $105, average odds 0.84; beat Estoril 4-0, +$20
Now, the losses:
• Bayern to win, $512 (average odds 0.73), plus Bayern -1.5 for $103 and -2.5 for $104: Dortmund equalized to make it 2-2 in the German Klassiker. All three bets lost, -$719. This was the biggest pitfall of the day.
• Man City to win: $103, average odds 0.56; lost 0-1 at home to Brighton, -$103
• Hull City to win: $104, average odds 0.34; drew 2-2 with Ipswich, -$104
• Two 6-leg parlays at $50 each: one Man City loss wiped them both out, -$100
One-line review: I put nearly half my bankroll on one derby, and even added handicap bets. It looked safe, but derbies never play by the rules. Next time, I’ll cap the stake on any one match and won’t add handicap bets.
Still open:
• Missouri vs. Arkansas (NCAA football), Missouri to win: a small $1 bet. At halftime when I’m writing this, Missouri leads 13-7. I’ll review it tomorrow.
• Long-term bet: Arsenal to win the Premier League, Yes. Average odds 0.52, current odds 0.645, unrealized profit around +$120. Come on, Gunners!
It’s even more important to keep records on losing days.
See you tomorrow!
This content was compiled by me (with possible AI assistance) for personal record-keeping and sharing only; it does not constitute investment advice. Markets involve risk, so make your own independent judgments.
#预测日记 #足球 #PredictionMarket
「Love, Death & Robots」🩷☠️🤖
That’s it for this episode!
124

·
--
$QNT Over 15 minutes, volume expanded by 1.58%, trading volume was 2.23x, and price broke above the upper bound of the range formed by nearly 20 five-minute candles—the strength behind this rally is clear.
But the OI tells an interesting story: 15-minute contract OI actually fell 0.15%, while 1-hour OI rose just 0.69%. Combined with an aggressive trade imbalance of +12.7% and a buy/sell ratio of 1.29, this is a classic case of shorts being forced to cover. Price is rising, but positions aren't keeping pace, suggesting this move is more about existing shorts throwing in the towel than a major influx of new longs.
24-hour turnover is 260 million, with sufficient market depth, but the full-pool anomaly percentile is only 42.7%, ranking #67, while nominal change ranks just #25. The volume surge is real, but the move isn't a market-wide focal point. The breakout is questionable; before chasing the price, it may be worth seeing whether OI can genuinely turn positive and strengthen. Otherwise, once the short-covering rally runs its course, who will take over?
$QNT Over 15 minutes, volume expanded by 1.58%, trading volume was 2.23x, and price broke above the upper bound of the range formed by nearly 20 five-minute candles—the strength behind this rally is clear.
But the OI tells an interesting story: 15-minute contract OI actually fell 0.15%, while 1-hour OI rose just 0.69%. Combined with an aggressive trade imbalance of +12.7% and a buy/sell ratio of 1.29, this is a classic case of shorts being forced to cover. Price is rising, but positions aren't keeping pace, suggesting this move is more about existing shorts throwing in the towel than a major influx of new longs.
24-hour turnover is 260 million, with sufficient market depth, but the full-pool anomaly percentile is only 42.7%, ranking #67, while nominal change ranks just #25. The volume surge is real, but the move isn't a market-wide focal point. The breakout is questionable; before chasing the price, it may be worth seeing whether OI can genuinely turn positive and strengthen. Otherwise, once the short-covering rally runs its course, who will take over?
But the OI tells an interesting story: 15-minute contract OI actually fell 0.15%, while 1-hour OI rose just 0.69%. Combined with an aggressive trade imbalance of +12.7% and a buy/sell ratio of 1.29, this is a classic case of shorts being forced to cover. Price is rising, but positions aren't keeping pace, suggesting this move is more about existing shorts throwing in the towel than a major influx of new longs.
24-hour turnover is 260 million, with sufficient market depth, but the full-pool anomaly percentile is only 42.7%, ranking #67, while nominal change ranks just #25. The volume surge is real, but the move isn't a market-wide focal point. The breakout is questionable; before chasing the price, it may be worth seeing whether OI can genuinely turn positive and strengthen. Otherwise, once the short-covering rally runs its course, who will take over?
3

·
--
Bullish
BITCOIN: The trap that almost no one sees.
The stock market jumped 1% on news of peace with Iran.
Bitcoin bounced too. But here's the problem: the bounce was COMPLETELY news-driven, not based on real technical structure.
WHAT THIS MEANS:
{spot}(BTCUSDT)
News-driven = volatile = fake. When the market rises due to external news, the bounce is fragile. It falls when the news fades.
Real technical structure = volume + patterns = reliable. Sustainable.
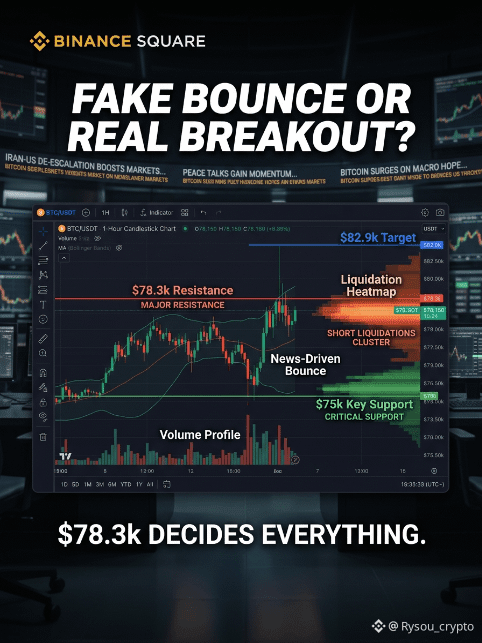
THE LEVELS THAT DEFINE EVERYTHING THIS WEEK:
$75k = Daily Higher Low (critical support)
If it breaks: the rally ends. Next: $71k–$73k.
$78.3k = 12H Lower High + Weekly Zone (critical resistance)
If it breaks: the rally is REAL. Next: $82.9k
$82.9k = The Wall (historical resistance)
If it breaks: BTC is ready for new ATHs.
THE MARKET QUESTION:
Was Bitcoin's bounce news-driven or a structural change?
- If it's news: back to $75k and then drops
- If it's structure: clears $78.3k and moves to $82.9k
This week will tell. Volume will be the key.
WHAT DO YOU SEE? Note: Smart traders DO NOT buy on news-driven bounces. They wait for confirmation.
#BTC #Bitcoin #67 #Rysou #WriteToEarn
BITCOIN: The trap that almost no one sees.
The stock market jumped 1% on news of peace with Iran.
Bitcoin bounced too. But here's the problem: the bounce was COMPLETELY news-driven, not based on real technical structure.
WHAT THIS MEANS:
News-driven = volatile = fake. When the market rises due to external news, the bounce is fragile. It falls when the news fades.
Real technical structure = volume + patterns = reliable. Sustainable.
THE LEVELS THAT DEFINE EVERYTHING THIS WEEK:
$75k = Daily Higher Low (critical support)
If it breaks: the rally ends. Next: $71k–$73k.
$78.3k = 12H Lower High + Weekly Zone (critical resistance)
If it breaks: the rally is REAL. Next: $82.9k
$82.9k = The Wall (historical resistance)
If it breaks: BTC is ready for new ATHs.
THE MARKET QUESTION:
Was Bitcoin's bounce news-driven or a structural change?
- If it's news: back to $75k and then drops
- If it's structure: clears $78.3k and moves to $82.9k
This week will tell. Volume will be the key.
WHAT DO YOU SEE? Note: Smart traders DO NOT buy on news-driven bounces. They wait for confirmation.
#BTC #Bitcoin #67 #Rysou #WriteToEarn
The stock market jumped 1% on news of peace with Iran.
Bitcoin bounced too. But here's the problem: the bounce was COMPLETELY news-driven, not based on real technical structure.
WHAT THIS MEANS:
News-driven = volatile = fake. When the market rises due to external news, the bounce is fragile. It falls when the news fades.
Real technical structure = volume + patterns = reliable. Sustainable.
THE LEVELS THAT DEFINE EVERYTHING THIS WEEK:
$75k = Daily Higher Low (critical support)
If it breaks: the rally ends. Next: $71k–$73k.
$78.3k = 12H Lower High + Weekly Zone (critical resistance)
If it breaks: the rally is REAL. Next: $82.9k
$82.9k = The Wall (historical resistance)
If it breaks: BTC is ready for new ATHs.
THE MARKET QUESTION:
Was Bitcoin's bounce news-driven or a structural change?
- If it's news: back to $75k and then drops
- If it's structure: clears $78.3k and moves to $82.9k
This week will tell. Volume will be the key.
WHAT DO YOU SEE? Note: Smart traders DO NOT buy on news-driven bounces. They wait for confirmation.
#BTC #Bitcoin #67 #Rysou #WriteToEarn
107

·
--
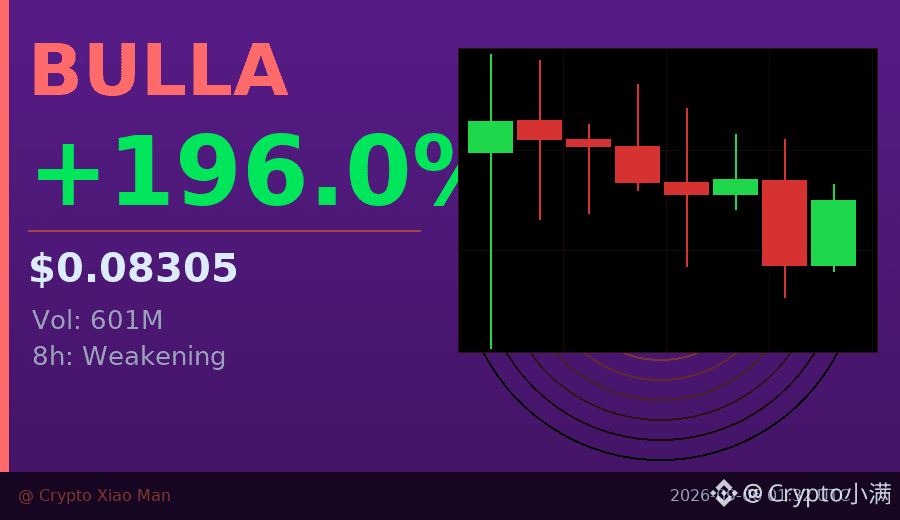
Up nearly 200%, but two-thirds of traders are short.
BULLA surged to 0.083 today, with trading volume of $601 million and a funding rate of 0.0123%. On the surface, it looks like a strong breakout, but positioning data shows 67% are short — meaning either big money is betting on a pullback, or shorts are being squeezed.
Over the past 8 hours, the candles have actually been weakening, falling back from the high of 0.092 to around 0.083. Bulls have pushed it this high, and whether they can hold it next is the key. If shorts keep adding positions, it could trigger an even sharper squeeze; if bulls lose momentum, the pullback won’t be small either.
In this kind of extremely divided market, chasing pumps or panic selling is both dangerous.
$BULLA #逼仓预警 #67% short
Click the card below to quickly check the market 👇
Up nearly 200%, but two-thirds of traders are short.
BULLA surged to 0.083 today, with trading volume of $601 million and a funding rate of 0.0123%. On the surface, it looks like a strong breakout, but positioning data shows 67% are short — meaning either big money is betting on a pullback, or shorts are being squeezed.
Over the past 8 hours, the candles have actually been weakening, falling back from the high of 0.092 to around 0.083. Bulls have pushed it this high, and whether they can hold it next is the key. If shorts keep adding positions, it could trigger an even sharper squeeze; if bulls lose momentum, the pullback won’t be small either.
In this kind of extremely divided market, chasing pumps or panic selling is both dangerous.
$BULLA #逼仓预警 #67% short
Click the card below to quickly check the market 👇
BULLA surged to 0.083 today, with trading volume of $601 million and a funding rate of 0.0123%. On the surface, it looks like a strong breakout, but positioning data shows 67% are short — meaning either big money is betting on a pullback, or shorts are being squeezed.
Over the past 8 hours, the candles have actually been weakening, falling back from the high of 0.092 to around 0.083. Bulls have pushed it this high, and whether they can hold it next is the key. If shorts keep adding positions, it could trigger an even sharper squeeze; if bulls lose momentum, the pullback won’t be small either.
In this kind of extremely divided market, chasing pumps or panic selling is both dangerous.
$BULLA #逼仓预警 #67% short
Click the card below to quickly check the market 👇
71
·
--
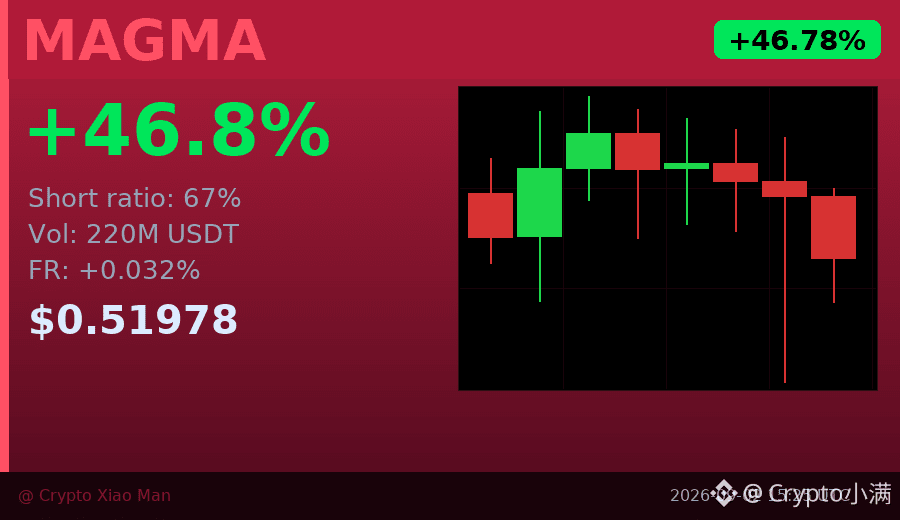
To be honest, today this data combination of $MAGMA is a bit unusual.
It’s up nearly 47%, but 67% of the market is betting on the decline, while only 33% are betting on the rise.
You read that right—most people are choosing to go against this rally.
What does that mean?
As the price continues to rise, those betting on the decline will face increasing loss pressure,
and at some critical point they’ll be forced to close positions—admitting defeat—
which in turn will further push the price up.
This is what’s called a "short squeeze": it’s not because the coin itself is so great,
but because there are too many people who made the wrong bet, and the market forces them to push the price higher themselves.
The 24-hour trading volume has already reached 220 million USDT—not small.
But over the past few hours’ candlesticks, they’ve continued closing bearish, indicating that the momentum behind this rally is weakening.
At the moment, either scenario could happen:
Either those betting on the decline gradually give up and get squeezed into pushing the price up again;
Or the buying side has already run out of steam, the price starts to fall, and the shorts this time place the correct bet.
I’ll be paying close attention to the closing situation over the next 1–2 hours.
If volume keeps shrinking, be careful—there may be a fast pullback.
$MAGMA #空头挤压 #67% short
Click the small card below to quickly view the market👇
To be honest, today this data combination of $MAGMA is a bit unusual.
It’s up nearly 47%, but 67% of the market is betting on the decline, while only 33% are betting on the rise.
You read that right—most people are choosing to go against this rally.
What does that mean?
As the price continues to rise, those betting on the decline will face increasing loss pressure,
and at some critical point they’ll be forced to close positions—admitting defeat—
which in turn will further push the price up.
This is what’s called a "short squeeze": it’s not because the coin itself is so great,
but because there are too many people who made the wrong bet, and the market forces them to push the price higher themselves.
The 24-hour trading volume has already reached 220 million USDT—not small.
But over the past few hours’ candlesticks, they’ve continued closing bearish, indicating that the momentum behind this rally is weakening.
At the moment, either scenario could happen:
Either those betting on the decline gradually give up and get squeezed into pushing the price up again;
Or the buying side has already run out of steam, the price starts to fall, and the shorts this time place the correct bet.
I’ll be paying close attention to the closing situation over the next 1–2 hours.
If volume keeps shrinking, be careful—there may be a fast pullback.
$MAGMA #空头挤压 #67% short
Click the small card below to quickly view the market👇
It’s up nearly 47%, but 67% of the market is betting on the decline, while only 33% are betting on the rise.
You read that right—most people are choosing to go against this rally.
What does that mean?
As the price continues to rise, those betting on the decline will face increasing loss pressure,
and at some critical point they’ll be forced to close positions—admitting defeat—
which in turn will further push the price up.
This is what’s called a "short squeeze": it’s not because the coin itself is so great,
but because there are too many people who made the wrong bet, and the market forces them to push the price higher themselves.
The 24-hour trading volume has already reached 220 million USDT—not small.
But over the past few hours’ candlesticks, they’ve continued closing bearish, indicating that the momentum behind this rally is weakening.
At the moment, either scenario could happen:
Either those betting on the decline gradually give up and get squeezed into pushing the price up again;
Or the buying side has already run out of steam, the price starts to fall, and the shorts this time place the correct bet.
I’ll be paying close attention to the closing situation over the next 1–2 hours.
If volume keeps shrinking, be careful—there may be a fast pullback.
$MAGMA #空头挤压 #67% short
Click the small card below to quickly view the market👇
1
361
·
--
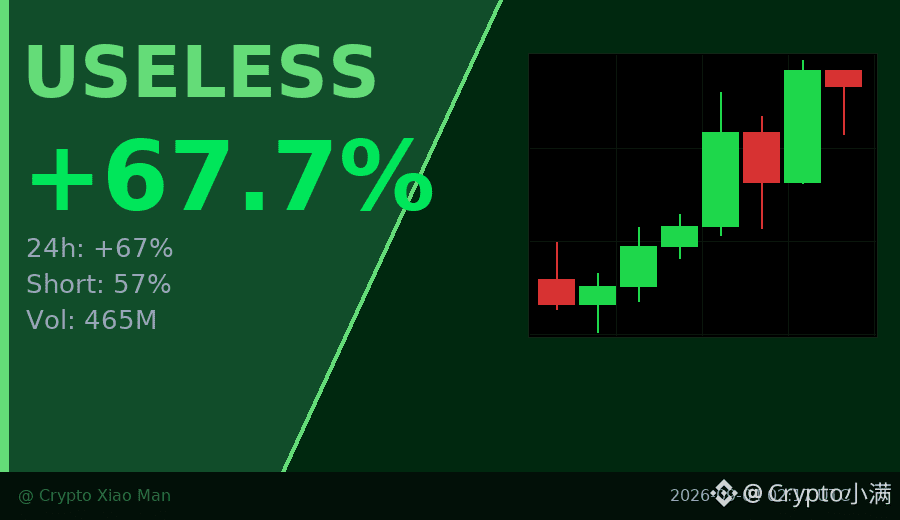
Behind the 67% surge, the shorts are being squeezed.
USELESS surged from 0.127 to 0.217, with trading volume hitting 465 million USDT.
But interestingly, the open position data shows 57% of people are shorting.
A sharp price rally + crowded shorts = a classic short-squeeze scenario.
Within 8 hours, buy-side pressure has kept strengthening, but the funding rate is only 0.005%,
which suggests the longs haven’t gone completely wild yet—the move may not be over.
$USELESS #轧空行情 #67%
Click the small card below to quickly check the market👇
Behind the 67% surge, the shorts are being squeezed.
USELESS surged from 0.127 to 0.217, with trading volume hitting 465 million USDT.
But interestingly, the open position data shows 57% of people are shorting.
A sharp price rally + crowded shorts = a classic short-squeeze scenario.
Within 8 hours, buy-side pressure has kept strengthening, but the funding rate is only 0.005%,
which suggests the longs haven’t gone completely wild yet—the move may not be over.
$USELESS #轧空行情 #67%
Click the small card below to quickly check the market👇
USELESS surged from 0.127 to 0.217, with trading volume hitting 465 million USDT.
But interestingly, the open position data shows 57% of people are shorting.
A sharp price rally + crowded shorts = a classic short-squeeze scenario.
Within 8 hours, buy-side pressure has kept strengthening, but the funding rate is only 0.005%,
which suggests the longs haven’t gone completely wild yet—the move may not be over.
$USELESS #轧空行情 #67%
Click the small card below to quickly check the market👇
12

·
--
$PI In this dataset, the least coordinated isn’t that it dropped 97% from ATH—it’s that its market cap ranks #67 and is close to $1 billion, but the 24-hour trading volume is only $7.52M. That ratio is even lower than many empty shells that haven’t launched on the mainnet yet. More contradictory still: it’s up +4.78% over 7 days, but down -27% over 30 days. This suggests that the sell pressure from the first few weeks hasn’t been absorbed yet; today’s rebound looks more like a liquidity tide than demand-driven.
The real highlight isn’t the price itself, but the fact that in mid-July there’s a clear volume spike (7/14-7/20, with volume rising to 20-30M), followed by a rapid drop back below 10M. Those days correspond to the price moving from $0.077 to $0.095, but it has now shrunk back near $0.085. What is the market trading? It might just be a few market makers posting orders within a range to earn the spread, not a change in fundamental expectations.
There are two explanations here—you can pick one, but you need to see the corresponding signals before making a conclusion: First, “this is accumulation at the bottom; smart money is slowly collecting around $0.08.” The confirmation signal would be price consolidating with steadily decreasing volume between 0.08-0.09 for more than 10 days, followed by a sudden breakout above 0.09 with follow-through. Second, “this is completely dead—nobody’s playing.” The confirmation signal would be volume shrinking further to below 5M, the price drifting and breaking below 0.08, and even accelerating further downward.
Which do you think is closer to the actual situation right now?
$PI In this dataset, the least coordinated isn’t that it dropped 97% from ATH—it’s that its market cap ranks #67 and is close to $1 billion, but the 24-hour trading volume is only $7.52M. That ratio is even lower than many empty shells that haven’t launched on the mainnet yet. More contradictory still: it’s up +4.78% over 7 days, but down -27% over 30 days. This suggests that the sell pressure from the first few weeks hasn’t been absorbed yet; today’s rebound looks more like a liquidity tide than demand-driven.
The real highlight isn’t the price itself, but the fact that in mid-July there’s a clear volume spike (7/14-7/20, with volume rising to 20-30M), followed by a rapid drop back below 10M. Those days correspond to the price moving from $0.077 to $0.095, but it has now shrunk back near $0.085. What is the market trading? It might just be a few market makers posting orders within a range to earn the spread, not a change in fundamental expectations.
There are two explanations here—you can pick one, but you need to see the corresponding signals before making a conclusion: First, “this is accumulation at the bottom; smart money is slowly collecting around $0.08.” The confirmation signal would be price consolidating with steadily decreasing volume between 0.08-0.09 for more than 10 days, followed by a sudden breakout above 0.09 with follow-through. Second, “this is completely dead—nobody’s playing.” The confirmation signal would be volume shrinking further to below 5M, the price drifting and breaking below 0.08, and even accelerating further downward.
Which do you think is closer to the actual situation right now?
The real highlight isn’t the price itself, but the fact that in mid-July there’s a clear volume spike (7/14-7/20, with volume rising to 20-30M), followed by a rapid drop back below 10M. Those days correspond to the price moving from $0.077 to $0.095, but it has now shrunk back near $0.085. What is the market trading? It might just be a few market makers posting orders within a range to earn the spread, not a change in fundamental expectations.
There are two explanations here—you can pick one, but you need to see the corresponding signals before making a conclusion: First, “this is accumulation at the bottom; smart money is slowly collecting around $0.08.” The confirmation signal would be price consolidating with steadily decreasing volume between 0.08-0.09 for more than 10 days, followed by a sudden breakout above 0.09 with follow-through. Second, “this is completely dead—nobody’s playing.” The confirmation signal would be volume shrinking further to below 5M, the price drifting and breaking below 0.08, and even accelerating further downward.
Which do you think is closer to the actual situation right now?
10

·
--
🏆 FLIPPENING
💰 Ethereum just flipped Philip Morris!
$ETH $299.32B · now #67 of all assets
Passed Philip Morris ($299.02B)
🍳 Crypto vs the whole world. Not financial advice.
#CookingBNB #Crypto #Bitcoin #BTC
🏆 FLIPPENING
💰 Ethereum just flipped Philip Morris!
$ETH $299.32B · now #67 of all assets
Passed Philip Morris ($299.02B)
🍳 Crypto vs the whole world. Not financial advice.
#CookingBNB #Crypto #Bitcoin #BTC
💰 Ethereum just flipped Philip Morris!
$ETH $299.32B · now #67 of all assets
Passed Philip Morris ($299.02B)
🍳 Crypto vs the whole world. Not financial advice.
#CookingBNB #Crypto #Bitcoin #BTC

22
·
--
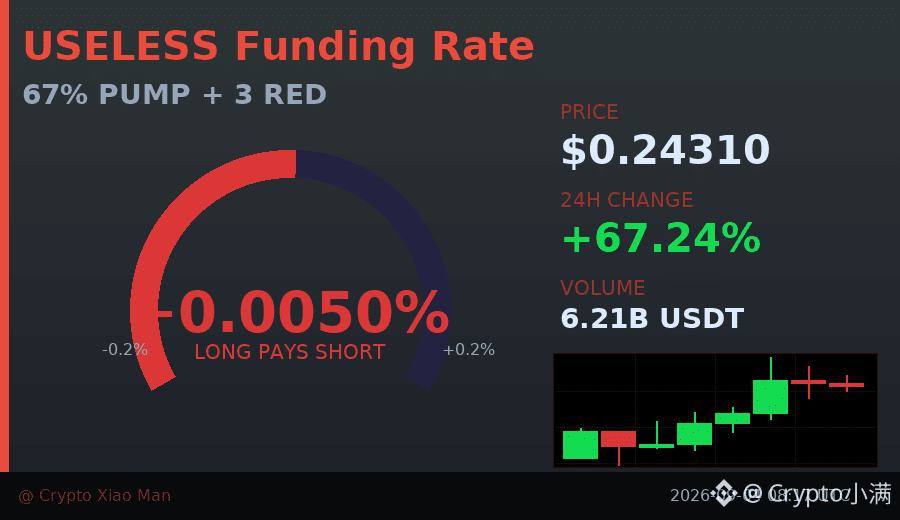
67% rise, but the hourly candles have three consecutive bearish closes—USELESS is starting to wheeze at the top.
In the past 24 hours, trading volume surged to 621 million USDT. After the price climbed from 0.14 to 0.25784, it pulled back.
After a massive spike like this followed by consecutive bearish candles, it usually indicates short-term profit-taking being cashed out.
The funding rate is only 0.005%. The long/short ratio is 42% longs to 58% shorts,
which suggests most people aren’t chasing higher prices; instead, they’re waiting for a pullback.
My observation: if in the next 1–2 hours it can’t reclaim and hold above 0.25,
there may be a short-term retest of the 0.22–0.23 range.
$USELESS #巨量回调 #67%
Tap the small card below to quickly check the market trend👇
67% rise, but the hourly candles have three consecutive bearish closes—USELESS is starting to wheeze at the top.
In the past 24 hours, trading volume surged to 621 million USDT. After the price climbed from 0.14 to 0.25784, it pulled back.
After a massive spike like this followed by consecutive bearish candles, it usually indicates short-term profit-taking being cashed out.
The funding rate is only 0.005%. The long/short ratio is 42% longs to 58% shorts,
which suggests most people aren’t chasing higher prices; instead, they’re waiting for a pullback.
My observation: if in the next 1–2 hours it can’t reclaim and hold above 0.25,
there may be a short-term retest of the 0.22–0.23 range.
$USELESS #巨量回调 #67%
Tap the small card below to quickly check the market trend👇
In the past 24 hours, trading volume surged to 621 million USDT. After the price climbed from 0.14 to 0.25784, it pulled back.
After a massive spike like this followed by consecutive bearish candles, it usually indicates short-term profit-taking being cashed out.
The funding rate is only 0.005%. The long/short ratio is 42% longs to 58% shorts,
which suggests most people aren’t chasing higher prices; instead, they’re waiting for a pullback.
My observation: if in the next 1–2 hours it can’t reclaim and hold above 0.25,
there may be a short-term retest of the 0.22–0.23 range.
$USELESS #巨量回调 #67%
Tap the small card below to quickly check the market trend👇
20

·
--
50

·
--
6-7! 6-7! 🫲🫱
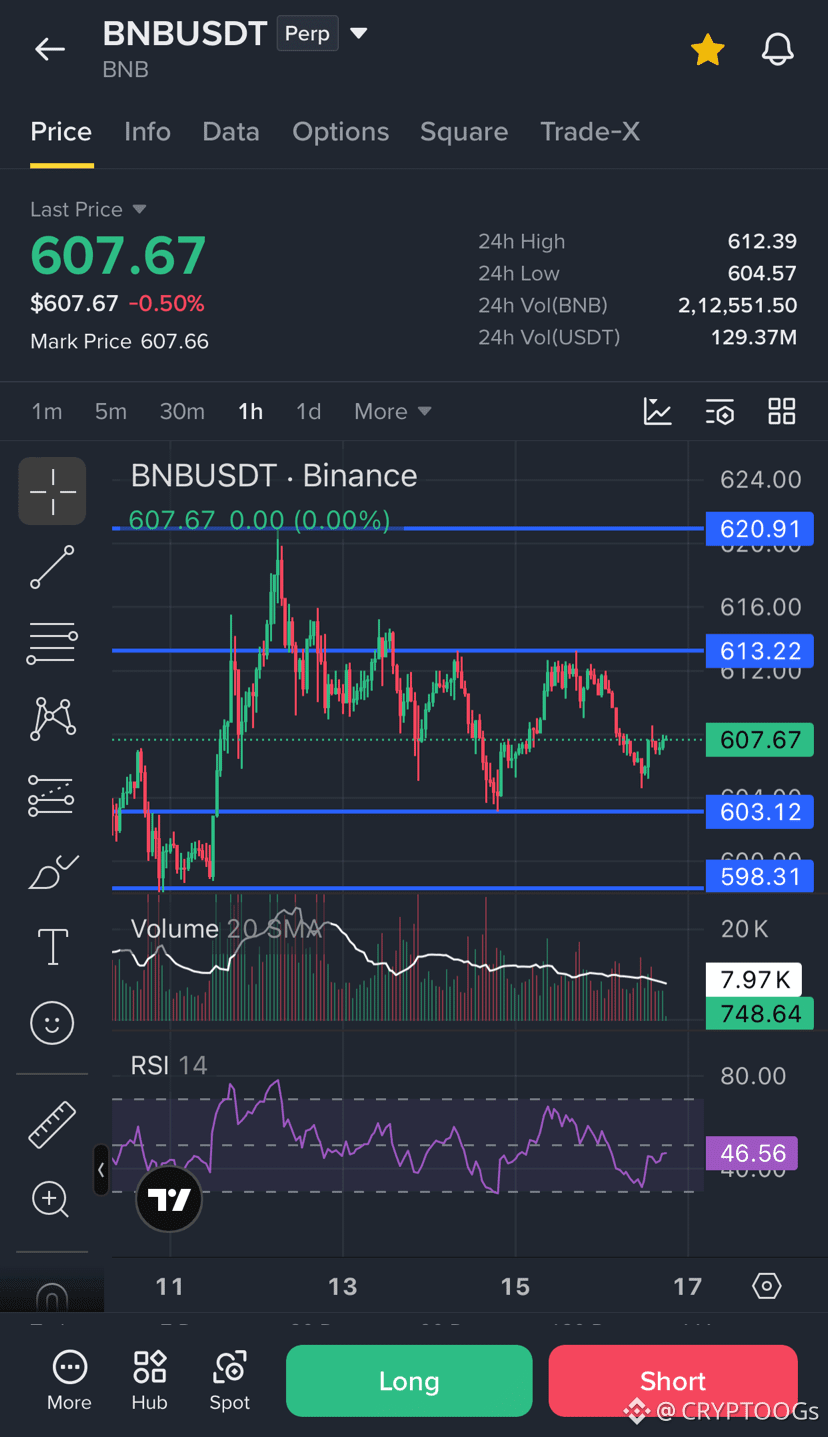
Look at the chart... $607.67 is literally screaming at us.
When $BNB hits the 6-7 zone, you already know the vibe. We held support at $603, RSI is sitting chill at 46.5, and we're weighing up the next move to $620+.
Are we hitting the 6-7 rocket or what? 🚀
$BNB #BNB #BNBUSDT #Binance #CryptoMemes #67
6-7! 6-7! 🫲🫱
Look at the chart... $607.67 is literally screaming at us.
When $BNB hits the 6-7 zone, you already know the vibe. We held support at $603, RSI is sitting chill at 46.5, and we're weighing up the next move to $620+.
Are we hitting the 6-7 rocket or what? 🚀
$BNB #BNB #BNBUSDT #Binance #CryptoMemes #67
Look at the chart... $607.67 is literally screaming at us.
When $BNB hits the 6-7 zone, you already know the vibe. We held support at $603, RSI is sitting chill at 46.5, and we're weighing up the next move to $620+.
Are we hitting the 6-7 rocket or what? 🚀
$BNB #BNB #BNBUSDT #Binance #CryptoMemes #67
1
82
·
--
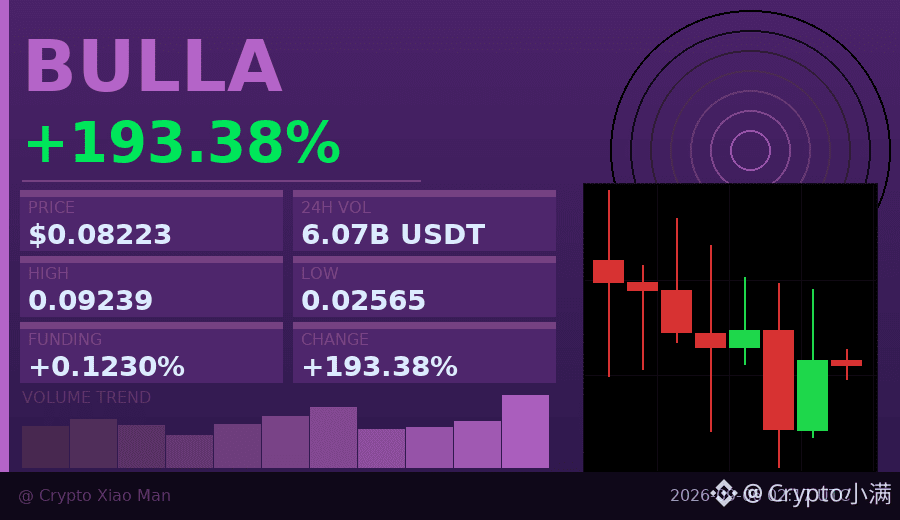
Behind the 193% surge, shorts are still adding positions?
BULLA has pumped to $0.082 today, with 24-hour trading volume at 607 million USDT. It looks like the bulls are strong. But a closer look shows the funding rate is only 0.012%, so it’s not overheated; more importantly, the long/short ratio shows 67% of people are opening shorts — daring to short after such a rise means either seasoned traders are waiting for a pullback, or someone is betting it can’t hold.
The candlestick chart shows overall weakness over the past 8 hours, with no further breakout at the highs. At times like this, chasing longs carries significant risk, and the bears may have a point.
$BULLA #多空分歧 #67% shorts
Click the small card below to quickly view the market 👇
Behind the 193% surge, shorts are still adding positions?
BULLA has pumped to $0.082 today, with 24-hour trading volume at 607 million USDT. It looks like the bulls are strong. But a closer look shows the funding rate is only 0.012%, so it’s not overheated; more importantly, the long/short ratio shows 67% of people are opening shorts — daring to short after such a rise means either seasoned traders are waiting for a pullback, or someone is betting it can’t hold.
The candlestick chart shows overall weakness over the past 8 hours, with no further breakout at the highs. At times like this, chasing longs carries significant risk, and the bears may have a point.
$BULLA #多空分歧 #67% shorts
Click the small card below to quickly view the market 👇
BULLA has pumped to $0.082 today, with 24-hour trading volume at 607 million USDT. It looks like the bulls are strong. But a closer look shows the funding rate is only 0.012%, so it’s not overheated; more importantly, the long/short ratio shows 67% of people are opening shorts — daring to short after such a rise means either seasoned traders are waiting for a pullback, or someone is betting it can’t hold.
The candlestick chart shows overall weakness over the past 8 hours, with no further breakout at the highs. At times like this, chasing longs carries significant risk, and the bears may have a point.
$BULLA #多空分歧 #67% shorts
Click the small card below to quickly view the market 👇
1
375
·
--
$PI In this order book, the most incongruous set of data is: a market cap close to $950M and a rank of #67, yet the 24-hour trading volume is only $9.37M—less than 1% of the market cap. The price has fallen 97% from ATH, and is down 27% over the past 30 days, but is up 4.57% over the last 7 days. This looks more like a sign of liquidity drying up than a signal of trend reversal.
You can think of it as two completely different scripts. Script A: This is a technical rebound after severe overselling—the low buy-side support can lift the price because the sell pressure is also fading. But the trading volume hasn’t really changed compared to yesterday and the day before ($9.09M, $9.59M); without incremental capital confirmation, the rebound could fail at any moment. Script B: This is the gradual consolidation of “sleeping chips” at the bottom—from the July 14 surge with volume up to $29.56M. After that, volume declines, but the price doesn’t break below the prior low, suggesting that panic selling has been cleared. Once an external narrative emerges (for example, mainnet progress or an exchange listing), it could trigger a reversal.
Your conclusion depends on which signal you believe. If it’s Script A, you need to see volume continue shrinking to below $7M, or the price quickly falling below the prior low of $0.077. If it’s Script B, you need to see volume ramp back up to $20M+ and the price hold above $0.09, with at least three consecutive days of increasing volume. At this level, waiting is more rational than taking action.
$PI In this order book, the most incongruous set of data is: a market cap close to $950M and a rank of #67, yet the 24-hour trading volume is only $9.37M—less than 1% of the market cap. The price has fallen 97% from ATH, and is down 27% over the past 30 days, but is up 4.57% over the last 7 days. This looks more like a sign of liquidity drying up than a signal of trend reversal.
You can think of it as two completely different scripts. Script A: This is a technical rebound after severe overselling—the low buy-side support can lift the price because the sell pressure is also fading. But the trading volume hasn’t really changed compared to yesterday and the day before ($9.09M, $9.59M); without incremental capital confirmation, the rebound could fail at any moment. Script B: This is the gradual consolidation of “sleeping chips” at the bottom—from the July 14 surge with volume up to $29.56M. After that, volume declines, but the price doesn’t break below the prior low, suggesting that panic selling has been cleared. Once an external narrative emerges (for example, mainnet progress or an exchange listing), it could trigger a reversal.
Your conclusion depends on which signal you believe. If it’s Script A, you need to see volume continue shrinking to below $7M, or the price quickly falling below the prior low of $0.077. If it’s Script B, you need to see volume ramp back up to $20M+ and the price hold above $0.09, with at least three consecutive days of increasing volume. At this level, waiting is more rational than taking action.
You can think of it as two completely different scripts. Script A: This is a technical rebound after severe overselling—the low buy-side support can lift the price because the sell pressure is also fading. But the trading volume hasn’t really changed compared to yesterday and the day before ($9.09M, $9.59M); without incremental capital confirmation, the rebound could fail at any moment. Script B: This is the gradual consolidation of “sleeping chips” at the bottom—from the July 14 surge with volume up to $29.56M. After that, volume declines, but the price doesn’t break below the prior low, suggesting that panic selling has been cleared. Once an external narrative emerges (for example, mainnet progress or an exchange listing), it could trigger a reversal.
Your conclusion depends on which signal you believe. If it’s Script A, you need to see volume continue shrinking to below $7M, or the price quickly falling below the prior low of $0.077. If it’s Script B, you need to see volume ramp back up to $20M+ and the price hold above $0.09, with at least three consecutive days of increasing volume. At this level, waiting is more rational than taking action.
14
·
--
🏆 FLIPPENING
💰 Ethereum just flipped Bank of China!
$ETH $298.09B · now #67 of all assets
Passed Bank of China ($297.78B)
🍳 Crypto vs the whole world. Not financial advice.
#CookingBNB #Crypto #Bitcoin #BTC
🏆 FLIPPENING
💰 Ethereum just flipped Bank of China!
$ETH $298.09B · now #67 of all assets
Passed Bank of China ($297.78B)
🍳 Crypto vs the whole world. Not financial advice.
#CookingBNB #Crypto #Bitcoin #BTC
💰 Ethereum just flipped Bank of China!
$ETH $298.09B · now #67 of all assets
Passed Bank of China ($297.78B)
🍳 Crypto vs the whole world. Not financial advice.
#CookingBNB #Crypto #Bitcoin #BTC

21
·
--
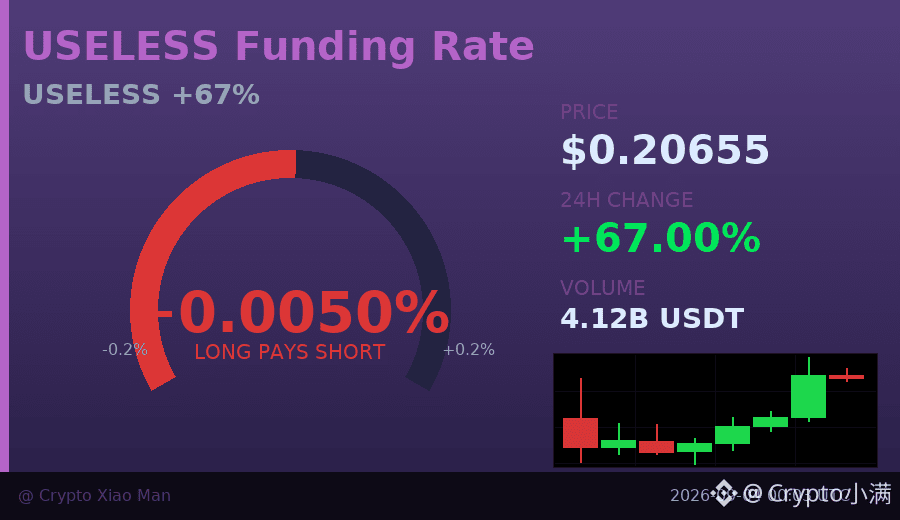
Behind the 67% rise, there are actually more shorts.
USELESS Over these 8 hours, it’s been strengthening nonstop. Trading volume surged to 410 million USD, but the long/short ratio shows that 57% of people are shorting, with only 43% going long. Price is rising while shorts are crowded—this kind of divergence usually means one of two things: either the shorts get squeezed and forced to cover, pushing the price higher, or someone is lifting the price to unload/sell into it.
The funding rate is only 0.005%, which suggests longs haven’t started getting wildly excited yet, and there aren’t many people chasing the breakout. The key is whether it can hold above 0.20. If it breaks through the prior high at 0.213, those 57% shorts could become fuel for what happens next.
I’d rather wait for a pullback to see support than try to guess the top during a divergence.
$USELESS #空头拥挤 #67%涨幅
Click the small card below to quickly view the market👇
Behind the 67% rise, there are actually more shorts.
USELESS Over these 8 hours, it’s been strengthening nonstop. Trading volume surged to 410 million USD, but the long/short ratio shows that 57% of people are shorting, with only 43% going long. Price is rising while shorts are crowded—this kind of divergence usually means one of two things: either the shorts get squeezed and forced to cover, pushing the price higher, or someone is lifting the price to unload/sell into it.
The funding rate is only 0.005%, which suggests longs haven’t started getting wildly excited yet, and there aren’t many people chasing the breakout. The key is whether it can hold above 0.20. If it breaks through the prior high at 0.213, those 57% shorts could become fuel for what happens next.
I’d rather wait for a pullback to see support than try to guess the top during a divergence.
$USELESS #空头拥挤 #67%涨幅
Click the small card below to quickly view the market👇
USELESS Over these 8 hours, it’s been strengthening nonstop. Trading volume surged to 410 million USD, but the long/short ratio shows that 57% of people are shorting, with only 43% going long. Price is rising while shorts are crowded—this kind of divergence usually means one of two things: either the shorts get squeezed and forced to cover, pushing the price higher, or someone is lifting the price to unload/sell into it.
The funding rate is only 0.005%, which suggests longs haven’t started getting wildly excited yet, and there aren’t many people chasing the breakout. The key is whether it can hold above 0.20. If it breaks through the prior high at 0.213, those 57% shorts could become fuel for what happens next.
I’d rather wait for a pullback to see support than try to guess the top during a divergence.
$USELESS #空头拥挤 #67%涨幅
Click the small card below to quickly view the market👇
1
119
·
--
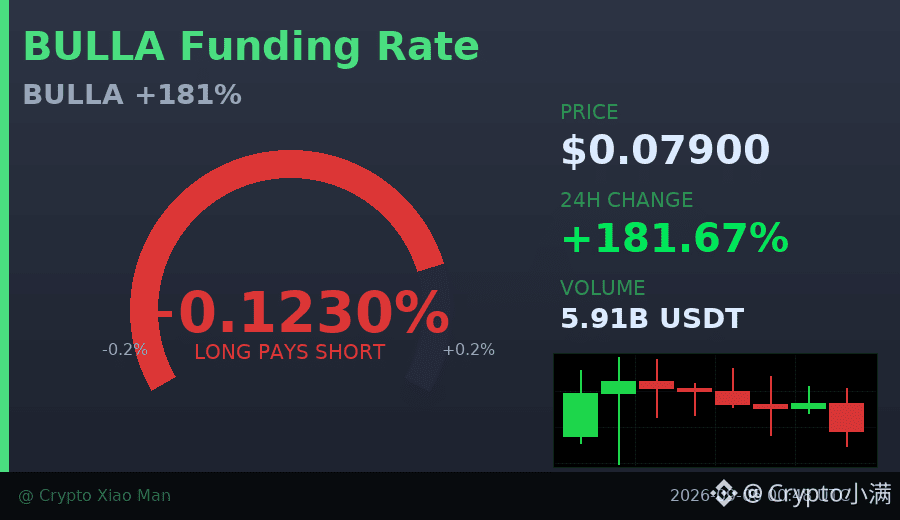
181% gains, and the shorts are still stubbornly holding on.
BULLA was pumped from 0.025 to 0.092 today, and has now pulled back to 0.079, with a trading volume of $590 million.
What’s strange is that 67% of positions are still short—do so many people think it will go down?
The price has indeed been weakening over the past 8 hours, but the latest candlestick shows a clear spike in volume,
which suggests there is buying support at the current level.
If the price keeps rising, these shorts will be forced to close their positions,
which could trigger another round of gains.
$BULLA #逼空行情 #67% short
Click the card below to quickly view the market👇
181% gains, and the shorts are still stubbornly holding on.
BULLA was pumped from 0.025 to 0.092 today, and has now pulled back to 0.079, with a trading volume of $590 million.
What’s strange is that 67% of positions are still short—do so many people think it will go down?
The price has indeed been weakening over the past 8 hours, but the latest candlestick shows a clear spike in volume,
which suggests there is buying support at the current level.
If the price keeps rising, these shorts will be forced to close their positions,
which could trigger another round of gains.
$BULLA #逼空行情 #67% short
Click the card below to quickly view the market👇
BULLA was pumped from 0.025 to 0.092 today, and has now pulled back to 0.079, with a trading volume of $590 million.
What’s strange is that 67% of positions are still short—do so many people think it will go down?
The price has indeed been weakening over the past 8 hours, but the latest candlestick shows a clear spike in volume,
which suggests there is buying support at the current level.
If the price keeps rising, these shorts will be forced to close their positions,
which could trigger another round of gains.
$BULLA #逼空行情 #67% short
Click the card below to quickly view the market👇
183
Log in to explore more content
Join global crypto users on Binance Square
⚡️ Get latest and useful information about crypto.
💬 Trusted by the world’s largest crypto exchange.
👍 Discover real insights from verified creators.
Email / Phone number
Trending Topics
1
#BTCReboundsAbove$60KAmidWhaleDipBuying
81,456 views
363 Discussing
2
#SolanaSets2027RoadmapToDoubleComputeCapacity
66,241 views
1,071 Discussing
3
#CaliforniaNvidiaProbeExaminesPotentialCriminalViolations
17,858 views
145 Discussing
4
#BlackRockLaunchesHKDollarDigitalLiquidityFund
54,757 views
805 Discussing
5
#NvidiaLoses$2.7TrillionInMonthAndAHalf
79,559 views
317 Discussing
6
#GlobalStocksFaceLongestLosingStreakSince2023
580,802 views
3,526 Discussing
7
#BlackRockIBITPostsRecord$541MSingleDayOutflow
97,715 views
186 Discussing
8
#AnthropicPlungesTowardIPOPriceonDay2
322,964 views
2,372 Discussing
9
#TwentyOneCapitalAdds172.25BTC
173,239 views
1,678 Discussing
10
#HKBillWouldExcludeTokenizedDepositsFromVirtualAssets
18,747 views
108 Discussing