
#btclevels
btclevels
6,760 views
46 Discussing
Hot
Latest

·
--
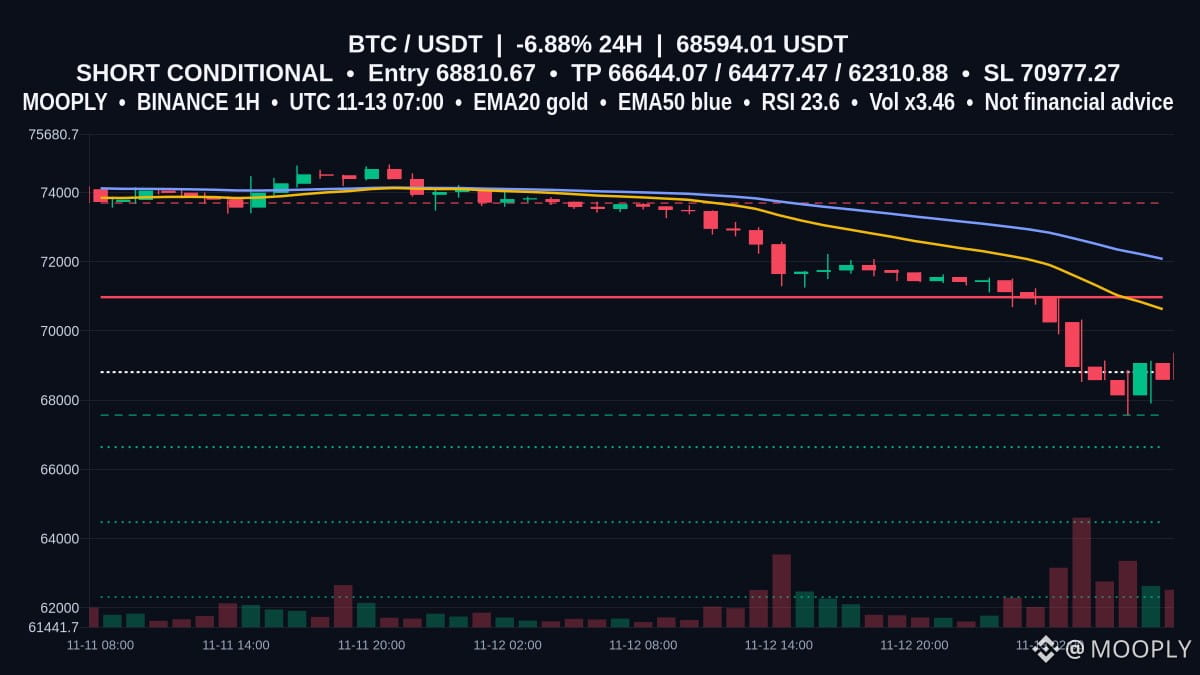
Data surprise: $BTC at 68,594.01 shows RSI 23.61 and MACD −1,181.53 (signal −941.66); EMA20/EMA50 (70,629.82 / 72,082.29) sit overhead across 48 completed 1h candles, so momentum looks skewed bearish.
VolRatio 3.46 with 24h volume 2,001,285,557 and a SHORT bias point toward support 67,568. Plan uses ATR14 (722.2) with entry 68,810.67, SL 70,977.27 and TPs at 66,644.07 / 64,477.47 / 62,310.88.
Will the elevated volume sustain and confirm a decisive break below 67,568?
🔴 Direction: SHORT
📍 Entry 68810.67
🎯 TP1 66644.07 (-3.15%) · TP2 64477.47 · TP3 62310.88
🛑 SL 70977.27 (+3.15%)
⚖️ Reward:Risk up to 1:3
Not financial advice.
#BTCLevels #TargetsAndStops #RejectionZones
Data surprise: $BTC at 68,594.01 shows RSI 23.61 and MACD −1,181.53 (signal −941.66); EMA20/EMA50 (70,629.82 / 72,082.29) sit overhead across 48 completed 1h candles, so momentum looks skewed bearish.
VolRatio 3.46 with 24h volume 2,001,285,557 and a SHORT bias point toward support 67,568. Plan uses ATR14 (722.2) with entry 68,810.67, SL 70,977.27 and TPs at 66,644.07 / 64,477.47 / 62,310.88.
Will the elevated volume sustain and confirm a decisive break below 67,568?
🔴 Direction: SHORT
📍 Entry 68810.67
🎯 TP1 66644.07 (-3.15%) · TP2 64477.47 · TP3 62310.88
🛑 SL 70977.27 (+3.15%)
⚖️ Reward:Risk up to 1:3
Not financial advice.
#BTCLevels #TargetsAndStops #RejectionZones
VolRatio 3.46 with 24h volume 2,001,285,557 and a SHORT bias point toward support 67,568. Plan uses ATR14 (722.2) with entry 68,810.67, SL 70,977.27 and TPs at 66,644.07 / 64,477.47 / 62,310.88.
Will the elevated volume sustain and confirm a decisive break below 67,568?
🔴 Direction: SHORT
📍 Entry 68810.67
🎯 TP1 66644.07 (-3.15%) · TP2 64477.47 · TP3 62310.88
🛑 SL 70977.27 (+3.15%)
⚖️ Reward:Risk up to 1:3
Not financial advice.
#BTCLevels #TargetsAndStops #RejectionZones
59

🚨 $BTC TEETERING ON A MAJOR BULL TRAP? 💥
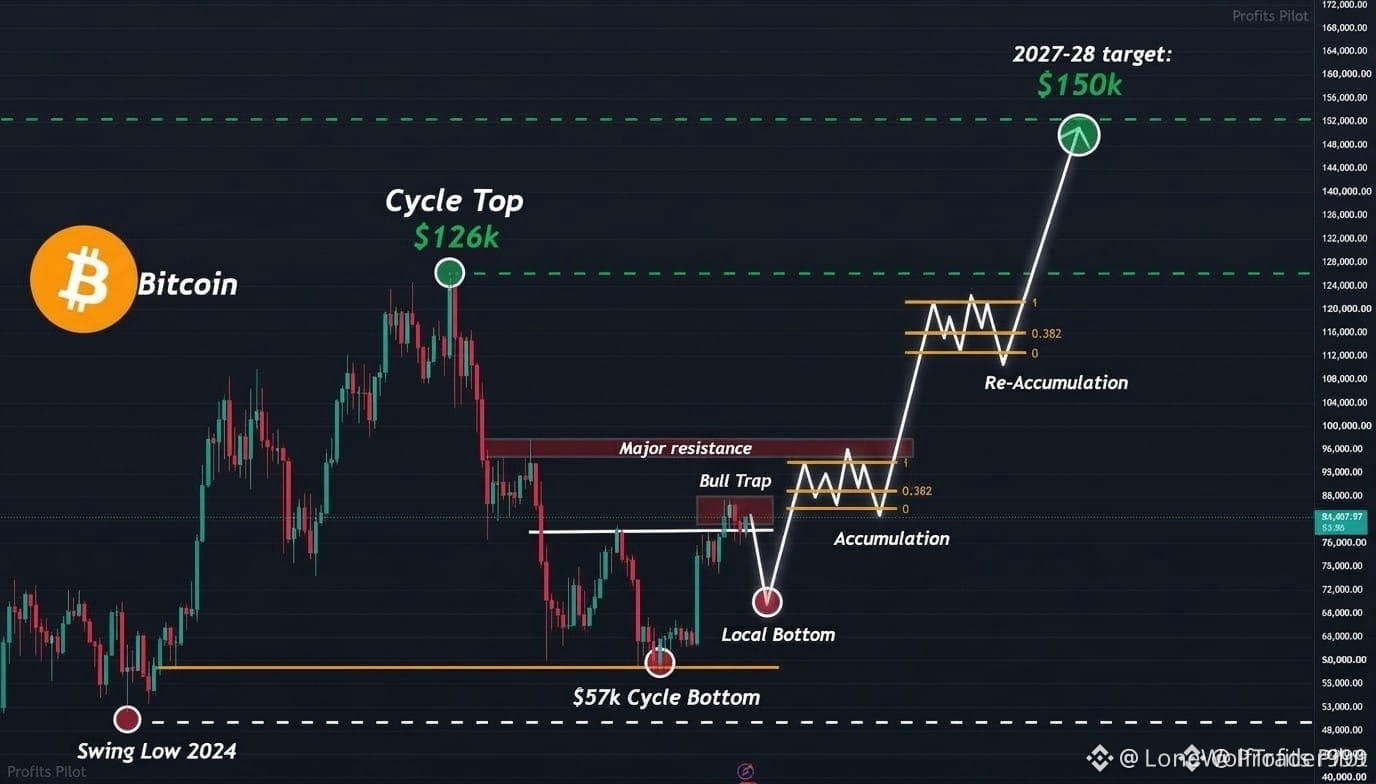
📊 Smart money is already stacking liquidity below $85K, and the order flow shows a relentless sell‑side push. The recent volume spike on the 4‑hour chart paints a classic bear trap pattern, with sellers swallowing every bid at $73K and $70K. 🦈
If the pressure holds, we could see the price cascade toward $67K, a key demand zone that has acted as a floor in past corrections. Conversely, a sudden reversal above $85K would flip the narrative and spark a fresh rally. 📌
💬 Do you think the bears will force a dive to $67K or are the bulls ready to reclaim the $85K ceiling? 👇
⚠️ Not financial advice. Always manage your risk. 🛡️
🏷️ #BTC #Bearish #BTCLevels #Crypto
🔥 💎
🚨 $BTC TEETERING ON A MAJOR BULL TRAP? 💥
📊 Smart money is already stacking liquidity below $85K, and the order flow shows a relentless sell‑side push. The recent volume spike on the 4‑hour chart paints a classic bear trap pattern, with sellers swallowing every bid at $73K and $70K. 🦈
If the pressure holds, we could see the price cascade toward $67K, a key demand zone that has acted as a floor in past corrections. Conversely, a sudden reversal above $85K would flip the narrative and spark a fresh rally. 📌
💬 Do you think the bears will force a dive to $67K or are the bulls ready to reclaim the $85K ceiling? 👇
⚠️ Not financial advice. Always manage your risk. 🛡️
🏷️ #BTC #Bearish #BTCLevels #Crypto
🔥 💎
📊 Smart money is already stacking liquidity below $85K, and the order flow shows a relentless sell‑side push. The recent volume spike on the 4‑hour chart paints a classic bear trap pattern, with sellers swallowing every bid at $73K and $70K. 🦈
If the pressure holds, we could see the price cascade toward $67K, a key demand zone that has acted as a floor in past corrections. Conversely, a sudden reversal above $85K would flip the narrative and spark a fresh rally. 📌
💬 Do you think the bears will force a dive to $67K or are the bulls ready to reclaim the $85K ceiling? 👇
⚠️ Not financial advice. Always manage your risk. 🛡️
🏷️ #BTC #Bearish #BTCLevels #Crypto
🔥 💎
1

·
--
Bearish
⚠️ Not every red market is a buying opportunity ⚠️
{future}(BTCUSDT)
$BTC is around $82.8K and most altcoins are still under pressure.
But I'm watching one thing:
Can BTC stabilize while strong coins continue holding their gains?
If yes → possible rotation.
If BTC keeps making lower lows → altcoin longs become much riskier.
For now, patience > catching the bottom.
#BTCLevels #CryptoVolatility #AltcoinRotation #RiskManagement #FedMinutesFocusOnOctoberPause
⚠️ Not every red market is a buying opportunity ⚠️
$BTC is around $82.8K and most altcoins are still under pressure.
But I'm watching one thing:
Can BTC stabilize while strong coins continue holding their gains?
If yes → possible rotation.
If BTC keeps making lower lows → altcoin longs become much riskier.
For now, patience > catching the bottom.
#BTCLevels #CryptoVolatility #AltcoinRotation #RiskManagement #FedMinutesFocusOnOctoberPause
$BTC is around $82.8K and most altcoins are still under pressure.
But I'm watching one thing:
Can BTC stabilize while strong coins continue holding their gains?
If yes → possible rotation.
If BTC keeps making lower lows → altcoin longs become much riskier.
For now, patience > catching the bottom.
#BTCLevels #CryptoVolatility #AltcoinRotation #RiskManagement #FedMinutesFocusOnOctoberPause
1
145

·
--
Bullish
🚨 BTC KEY LEVELS TO WATCH 👀
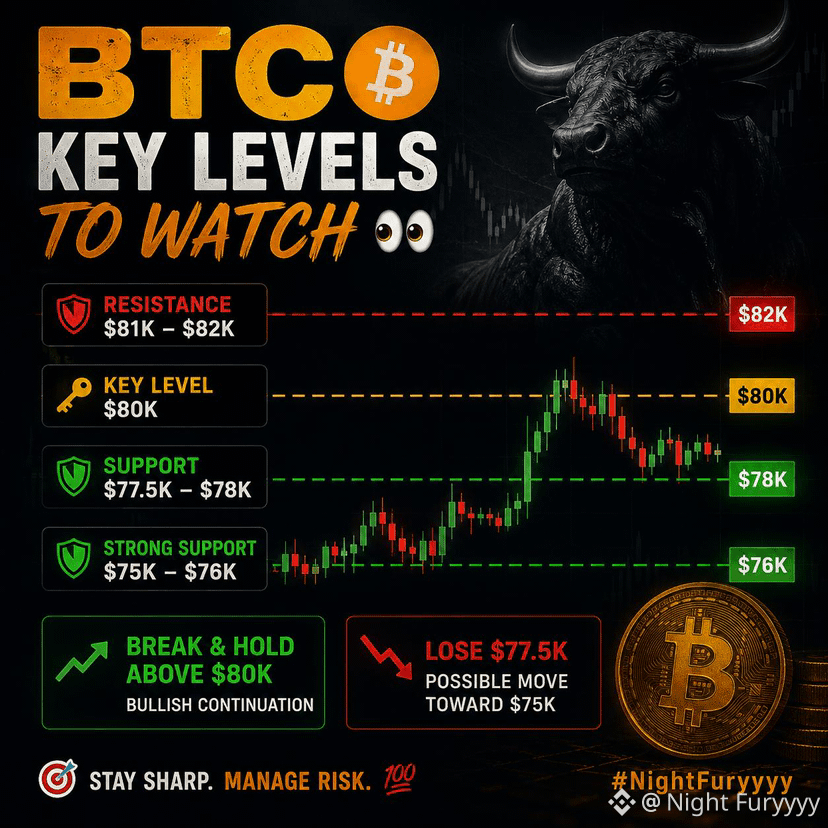
BTC is currently hovering around the $78K–$79K zone after failing to hold above $80K.
🔴 Resistance: $81K–$82K
🟡 Key level: $80K
🟢 Support: $77.5K–$78K
🟢 Strong support: $75K–$76K
📈 Break & hold above $80K → bullish continuation
📉 Lose $77.5K → possible move toward $75K
Stay sharp. Manage risk. 💯
#bitcoin #BTC #crypto #BTCLevels
🚨 BTC KEY LEVELS TO WATCH 👀
BTC is currently hovering around the $78K–$79K zone after failing to hold above $80K.
🔴 Resistance: $81K–$82K
🟡 Key level: $80K
🟢 Support: $77.5K–$78K
🟢 Strong support: $75K–$76K
📈 Break & hold above $80K → bullish continuation
📉 Lose $77.5K → possible move toward $75K
Stay sharp. Manage risk. 💯
#bitcoin #BTC #crypto #BTCLevels
BTC is currently hovering around the $78K–$79K zone after failing to hold above $80K.
🔴 Resistance: $81K–$82K
🟡 Key level: $80K
🟢 Support: $77.5K–$78K
🟢 Strong support: $75K–$76K
📈 Break & hold above $80K → bullish continuation
📉 Lose $77.5K → possible move toward $75K
Stay sharp. Manage risk. 💯
#bitcoin #BTC #crypto #BTCLevels
1
91

🎯 Bitcoin Key Levels: Support at $58.9K, Resistance at $60.4K
On June 29, 2026, Bitcoin $BTC trades at $59,726 between crucial levels. Support zones: $58,935 (24h low), $57,000 (June low), $55,000 (major psychological support). Resistance: $60,360 (24h high), $62,000 (June high), $65,000 (key resistance). With BTC dominance at 55.64%, Bitcoin's directional move will determine the trajectory for the entire crypto market in the coming weeks.
📌 Key Takeaway:
BTC between $58.9K and $60.4K — the breakout direction from this range sets the tone for July.
#Bitcoin #BTCLevels
#BinanceAlphaAlert
🎯 Bitcoin Key Levels: Support at $58.9K, Resistance at $60.4K
On June 29, 2026, Bitcoin $BTC trades at $59,726 between crucial levels. Support zones: $58,935 (24h low), $57,000 (June low), $55,000 (major psychological support). Resistance: $60,360 (24h high), $62,000 (June high), $65,000 (key resistance). With BTC dominance at 55.64%, Bitcoin's directional move will determine the trajectory for the entire crypto market in the coming weeks.
📌 Key Takeaway:
BTC between $58.9K and $60.4K — the breakout direction from this range sets the tone for July.
#Bitcoin #BTCLevels
#BinanceAlphaAlert
On June 29, 2026, Bitcoin $BTC trades at $59,726 between crucial levels. Support zones: $58,935 (24h low), $57,000 (June low), $55,000 (major psychological support). Resistance: $60,360 (24h high), $62,000 (June high), $65,000 (key resistance). With BTC dominance at 55.64%, Bitcoin's directional move will determine the trajectory for the entire crypto market in the coming weeks.
📌 Key Takeaway:
BTC between $58.9K and $60.4K — the breakout direction from this range sets the tone for July.
#Bitcoin #BTCLevels
#BinanceAlphaAlert
15

$BTC just tagged ~$81.9k on Binance — evening session still green.
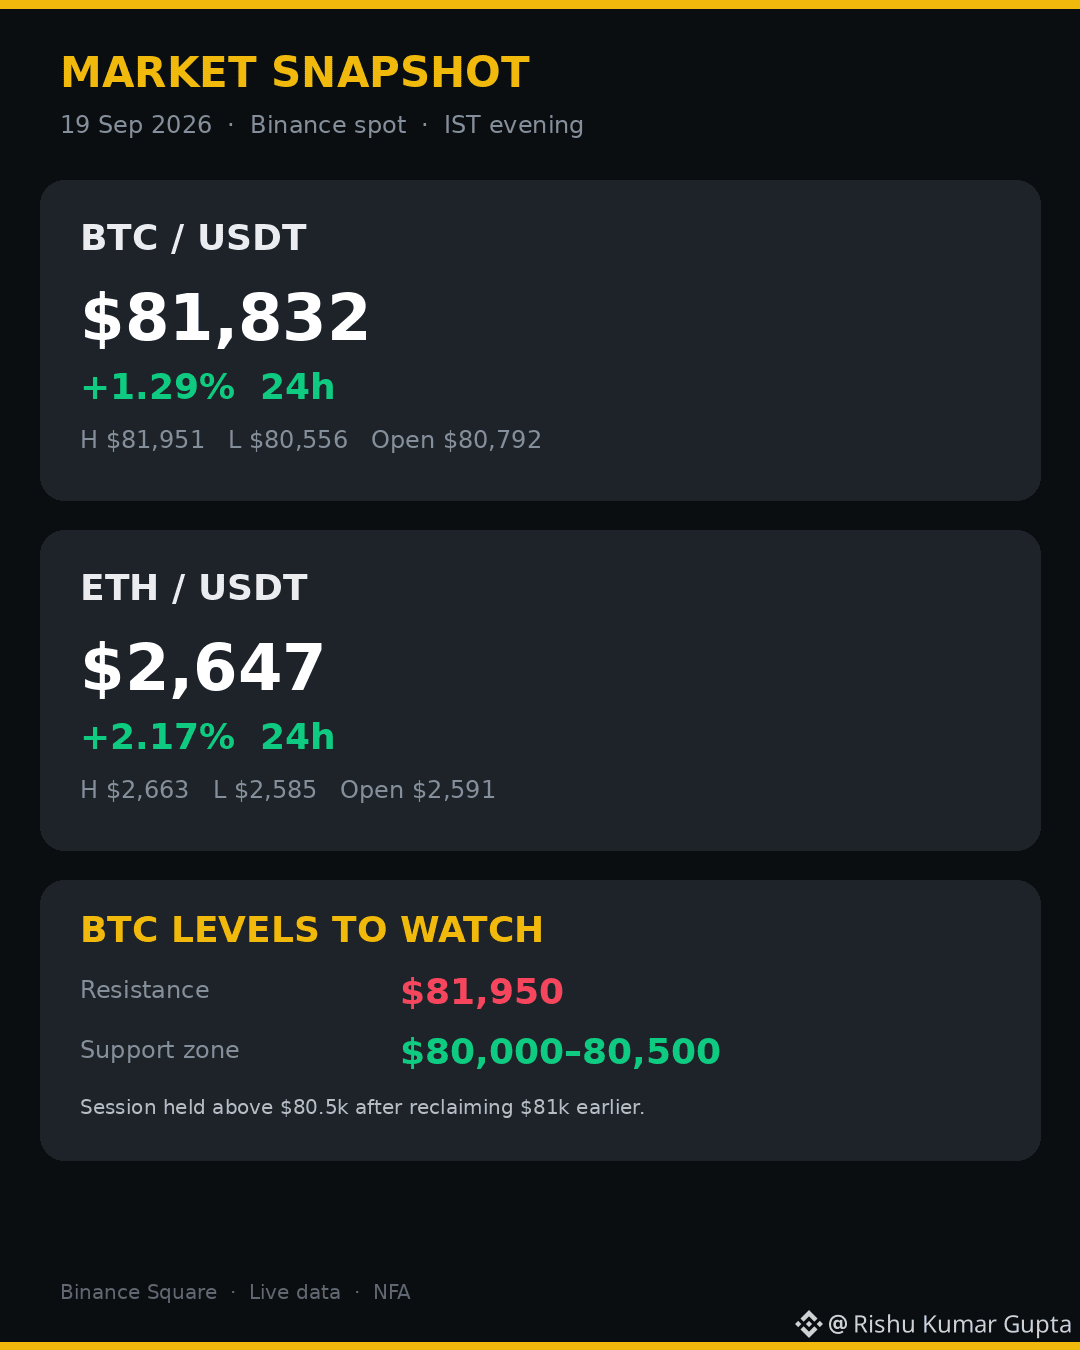
Live Binance spot (rolling 24h): BTC $81,832 (+1.29%), session high $81,951 / low $80,556. ETH $2,647 (+2.17%), high $2,663 / low $2,585. Earlier today both ripped harder off the reclaim of $81k; the tape has cooled into a hold above the round number.
Levels that matter into the next session: resistance at today's high ~$81,950, first support $80,000–$80,500. ETH is still outperforming on the percentage print — classic risk-on rotation when BTC breaks and holds a big handle.
No chase, no doom — just the numbers and the map. NFA.
$BTC $ETH
#Bitcoin #Ethereum #CryptoMarket #BTCLevels #BinanceSquare
Holding $81k into Asia open, or do we fade back toward $80.5k first?
$BTC just tagged ~$81.9k on Binance — evening session still green.
Live Binance spot (rolling 24h): BTC $81,832 (+1.29%), session high $81,951 / low $80,556. ETH $2,647 (+2.17%), high $2,663 / low $2,585. Earlier today both ripped harder off the reclaim of $81k; the tape has cooled into a hold above the round number.
Levels that matter into the next session: resistance at today's high ~$81,950, first support $80,000–$80,500. ETH is still outperforming on the percentage print — classic risk-on rotation when BTC breaks and holds a big handle.
No chase, no doom — just the numbers and the map. NFA.
$BTC $ETH
#Bitcoin #Ethereum #CryptoMarket #BTCLevels #BinanceSquare
Holding $81k into Asia open, or do we fade back toward $80.5k first?
Live Binance spot (rolling 24h): BTC $81,832 (+1.29%), session high $81,951 / low $80,556. ETH $2,647 (+2.17%), high $2,663 / low $2,585. Earlier today both ripped harder off the reclaim of $81k; the tape has cooled into a hold above the round number.
Levels that matter into the next session: resistance at today's high ~$81,950, first support $80,000–$80,500. ETH is still outperforming on the percentage print — classic risk-on rotation when BTC breaks and holds a big handle.
No chase, no doom — just the numbers and the map. NFA.
$BTC $ETH
#Bitcoin #Ethereum #CryptoMarket #BTCLevels #BinanceSquare
Holding $81k into Asia open, or do we fade back toward $80.5k first?
87

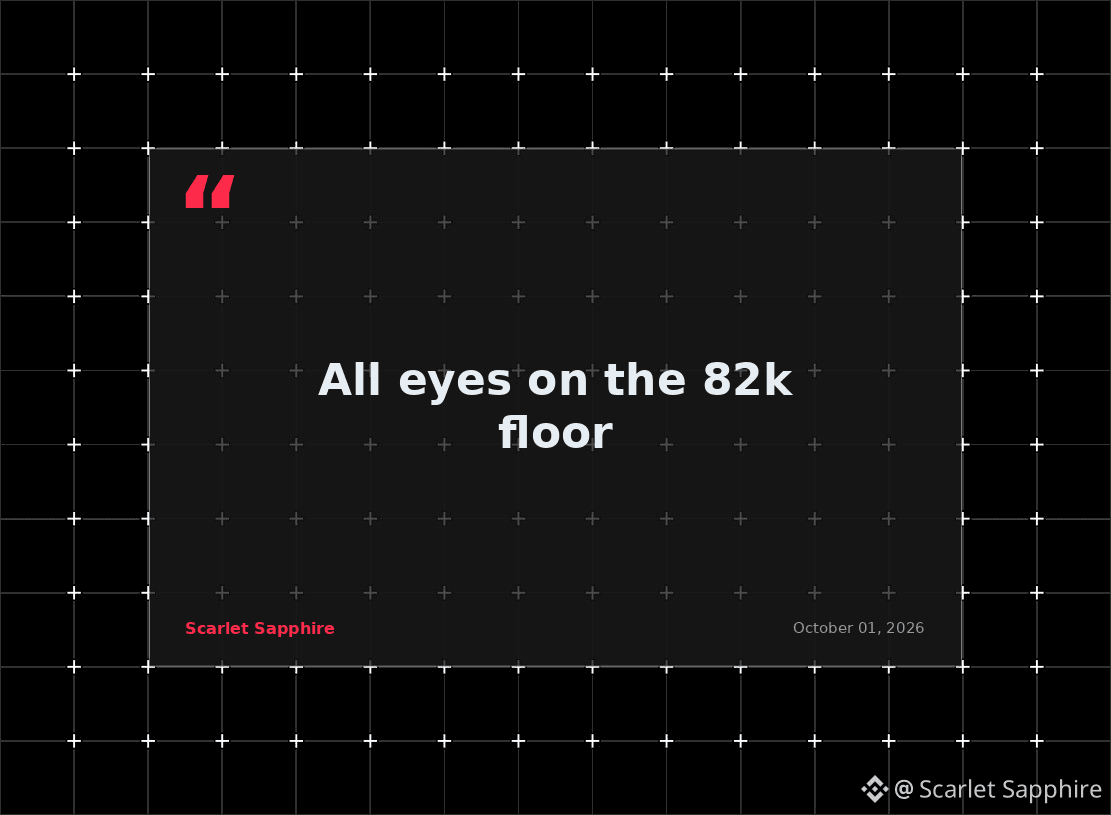
All eyes on the 82k floor.
Bitcoin is losing momentum after hitting $85500 and is now hovering near $83500. Traders are watching the $82000 level as the critical support zone for the October outlook.
#BTCLevels #BitcoinTechnicals
All eyes on the 82k floor.
Bitcoin is losing momentum after hitting $85500 and is now hovering near $83500. Traders are watching the $82000 level as the critical support zone for the October outlook.
#BTCLevels #BitcoinTechnicals
Bitcoin is losing momentum after hitting $85500 and is now hovering near $83500. Traders are watching the $82000 level as the critical support zone for the October outlook.
#BTCLevels #BitcoinTechnicals
33

·
--
Bullish
📈💹🔥 BTC Market Analysis – Friday, November 14, 2025
Current Price: $36,400
General Trend: Neutral with a tendency to rise
Daily Trading Range: $35,800 – $36,800
🧠 Analytical Overview:
Bitcoin has been trading in a narrow sideways range since the beginning of the week, with repeated attempts to break the resistance level at $37,000. Sustaining above this level may open the way towards $38,500, while any break below $35,500 could bring the price back to the $34,000 area.
📊 Technical Indicators:
- RSI at 54: still in the neutral area, indicating a balance between buying and selling forces.
- MACD shows a slight positive crossover, reflecting the possibility of the beginning of a bullish wave.
- 100-Day Moving Average: the price is trading above it, supporting the positive outlook in the medium term.
🧱 Supports and Resistances:
| Level | Type |
|-------------|----------------|
| $34,000 | Major Support |
| $35,500 | Minor Support |
| $37,000 | Current Resistance |
| $38,500 | Bullish Target |
🧭 Possible Scenarios:
- Bullish: Clear breakout of the $37,000 level with increased trading volume → targeting $38,500 then $40,000.
- Bearish: Break of the $35,500 support → we may see a pullback towards $34,000 with a possibility of a technical rebound.
#BitcoinAnalysis #BTCUpdate #CryptoTrends #DigitalCurrencyMarket #TechnicalAnalysis #BinanceArabic #SmartTrading #CryptoVision #BTCLevels #CryptoMindset #CryptoArabic #Bitcoin #BitcoinForecast #CryptoFlow #BinanceCreatorPad
$BTC
📈💹🔥 BTC Market Analysis – Friday, November 14, 2025
Current Price: $36,400
General Trend: Neutral with a tendency to rise
Daily Trading Range: $35,800 – $36,800
🧠 Analytical Overview:
Bitcoin has been trading in a narrow sideways range since the beginning of the week, with repeated attempts to break the resistance level at $37,000. Sustaining above this level may open the way towards $38,500, while any break below $35,500 could bring the price back to the $34,000 area.
📊 Technical Indicators:
- RSI at 54: still in the neutral area, indicating a balance between buying and selling forces.
- MACD shows a slight positive crossover, reflecting the possibility of the beginning of a bullish wave.
- 100-Day Moving Average: the price is trading above it, supporting the positive outlook in the medium term.
🧱 Supports and Resistances:
| Level | Type |
|-------------|----------------|
| $34,000 | Major Support |
| $35,500 | Minor Support |
| $37,000 | Current Resistance |
| $38,500 | Bullish Target |
🧭 Possible Scenarios:
- Bullish: Clear breakout of the $37,000 level with increased trading volume → targeting $38,500 then $40,000.
- Bearish: Break of the $35,500 support → we may see a pullback towards $34,000 with a possibility of a technical rebound.
#BitcoinAnalysis #BTCUpdate #CryptoTrends #DigitalCurrencyMarket #TechnicalAnalysis #BinanceArabic #SmartTrading #CryptoVision #BTCLevels #CryptoMindset #CryptoArabic #Bitcoin #BitcoinForecast #CryptoFlow #BinanceCreatorPad
$BTC
Current Price: $36,400
General Trend: Neutral with a tendency to rise
Daily Trading Range: $35,800 – $36,800
🧠 Analytical Overview:
Bitcoin has been trading in a narrow sideways range since the beginning of the week, with repeated attempts to break the resistance level at $37,000. Sustaining above this level may open the way towards $38,500, while any break below $35,500 could bring the price back to the $34,000 area.
📊 Technical Indicators:
- RSI at 54: still in the neutral area, indicating a balance between buying and selling forces.
- MACD shows a slight positive crossover, reflecting the possibility of the beginning of a bullish wave.
- 100-Day Moving Average: the price is trading above it, supporting the positive outlook in the medium term.
🧱 Supports and Resistances:
| Level | Type |
|-------------|----------------|
| $34,000 | Major Support |
| $35,500 | Minor Support |
| $37,000 | Current Resistance |
| $38,500 | Bullish Target |
🧭 Possible Scenarios:
- Bullish: Clear breakout of the $37,000 level with increased trading volume → targeting $38,500 then $40,000.
- Bearish: Break of the $35,500 support → we may see a pullback towards $34,000 with a possibility of a technical rebound.
#BitcoinAnalysis #BTCUpdate #CryptoTrends #DigitalCurrencyMarket #TechnicalAnalysis #BinanceArabic #SmartTrading #CryptoVision #BTCLevels #CryptoMindset #CryptoArabic #Bitcoin #BitcoinForecast #CryptoFlow #BinanceCreatorPad
$BTC
1
55

·
--
📊 BITCOIN ($BTC ) Quick Market Insight
Bitcoin is hovering near a key decision zone. $69K remains the short-term support while $72K–$73K is the critical resistance barrier.
A strong breakout above $73K may trigger bullish momentum toward $76K–$80K as buyers regain control. However, losing $69K support could invite selling pressure toward $66K–$64K where stronger demand is expected.
⚠️ Caution: Market liquidity is tight and sudden volatility spikes are possible. Traders should wait for clear breakout confirmation and avoid emotional or over-leveraged trades.
🔎 Outlook: Slight bullish bias while support holds, but confirmation is essential.
#Bitcoin #BTCUpdate #CryptoMarket #BTCLevels #CryptoCommunity
{spot}(BTCUSDT)
📊 BITCOIN ($BTC ) Quick Market Insight
Bitcoin is hovering near a key decision zone. $69K remains the short-term support while $72K–$73K is the critical resistance barrier.
A strong breakout above $73K may trigger bullish momentum toward $76K–$80K as buyers regain control. However, losing $69K support could invite selling pressure toward $66K–$64K where stronger demand is expected.
⚠️ Caution: Market liquidity is tight and sudden volatility spikes are possible. Traders should wait for clear breakout confirmation and avoid emotional or over-leveraged trades.
🔎 Outlook: Slight bullish bias while support holds, but confirmation is essential.
#Bitcoin #BTCUpdate #CryptoMarket #BTCLevels #CryptoCommunity
Bitcoin is hovering near a key decision zone. $69K remains the short-term support while $72K–$73K is the critical resistance barrier.
A strong breakout above $73K may trigger bullish momentum toward $76K–$80K as buyers regain control. However, losing $69K support could invite selling pressure toward $66K–$64K where stronger demand is expected.
⚠️ Caution: Market liquidity is tight and sudden volatility spikes are possible. Traders should wait for clear breakout confirmation and avoid emotional or over-leveraged trades.
🔎 Outlook: Slight bullish bias while support holds, but confirmation is essential.
#Bitcoin #BTCUpdate #CryptoMarket #BTCLevels #CryptoCommunity
1
40

Bitcoin Market Structure Sounds Complicated. It Really Isn't.
If you're new to trading $BTC, don't worry about memorizing 50 indicators.
Start with four things:
Higher High
Price breaks above the previous important high.
Higher Low
Price pulls back but holds above the previous important low.
Lower High
The bounce can't reach the previous high.
Lower Low
Price breaks below the previous important low.
That's basically the foundation.
For example:
Higher High + Higher Low
usually tells me buyers still have control of the short-term structure.
But here's where it gets interesting.
I don't look at structure alone.
I also check volume, spot demand and leverage.
Because a beautiful-looking breakout can still fail if almost everyone is already heavily leveraged.
So my simple rule:
Structure tells me what price is doing.
Liquidity tells me how trustworthy the move might be.
Much easier than trying to predict every candle.
Follow @SulemaOFCrypto
$BANK
$BMT
$YB
#BTCStructure #BitcoinPriceAction #BTCLevels #BitcoinTrading #BTCSetup
Bitcoin Market Structure Sounds Complicated. It Really Isn't.
If you're new to trading $BTC, don't worry about memorizing 50 indicators.
Start with four things:
Higher High
Price breaks above the previous important high.
Higher Low
Price pulls back but holds above the previous important low.
Lower High
The bounce can't reach the previous high.
Lower Low
Price breaks below the previous important low.
That's basically the foundation.
For example:
Higher High + Higher Low
usually tells me buyers still have control of the short-term structure.
But here's where it gets interesting.
I don't look at structure alone.
I also check volume, spot demand and leverage.
Because a beautiful-looking breakout can still fail if almost everyone is already heavily leveraged.
So my simple rule:
Structure tells me what price is doing.
Liquidity tells me how trustworthy the move might be.
Much easier than trying to predict every candle.
Follow @Sulaiman 零号猎人
$BANK
$BMT
$YB
#BTCStructure #BitcoinPriceAction #BTCLevels #BitcoinTrading #BTCSetup
If you're new to trading $BTC, don't worry about memorizing 50 indicators.
Start with four things:
Higher High
Price breaks above the previous important high.
Higher Low
Price pulls back but holds above the previous important low.
Lower High
The bounce can't reach the previous high.
Lower Low
Price breaks below the previous important low.
That's basically the foundation.
For example:
Higher High + Higher Low
usually tells me buyers still have control of the short-term structure.
But here's where it gets interesting.
I don't look at structure alone.
I also check volume, spot demand and leverage.
Because a beautiful-looking breakout can still fail if almost everyone is already heavily leveraged.
So my simple rule:
Structure tells me what price is doing.
Liquidity tells me how trustworthy the move might be.
Much easier than trying to predict every candle.
Follow @Sulaiman 零号猎人
$BANK
$BMT
$YB
#BTCStructure #BitcoinPriceAction #BTCLevels #BitcoinTrading #BTCSetup
15
Log in to explore more content
Join global crypto users on Binance Square
⚡️ Get latest and useful information about crypto.
💬 Trusted by the world’s largest crypto exchange.
👍 Discover real insights from verified creators.
Email / Phone number
Trending Topics
1
#NvidiaLoses$2.7TrillionInMonthAndAHalf
29 views
7 Discussing
2
#CanBTCReboundAfterFallingBelow60K?
474,329 views
2,048 Discussing
3
#GlobalStocksFaceLongestLosingStreakSince2023
163,420 views
1,423 Discussing
4
#BlackRockIBITPostsRecord$541MSingleDayOutflow
7,166 views
44 Discussing
5
#AnthropicPlungesTowardIPOPriceonDay2
78,091 views
821 Discussing
6
#TwentyOneCapitalAdds172.25BTC
29,436 views
346 Discussing
7
#HKBillWouldExcludeTokenizedDepositsFromVirtualAssets
2,948 views
37 Discussing
8
#BNBDropsBelow540USDTWith8.46%DailyDecline
45,752 views
410 Discussing
9
#HKBillProposesHK$100KFineForUnauthorizedCryptoTitles
1,619 views
20 Discussing
10
#BitMineFaces$10.1BUnrealizedETHLoss
3,340 views
25 Discussing