
#btcpriceaction
btcpriceaction
103,575 views
218 Discussing
Hot
Latest

🚀 $BTC BOUNCES HARD OFF THE 62K FLOOR AS BULLS CHARGE THE 68K WALL! 💥
Entry: 65,157.40 USDT ⚡
Target: 77,500 USDT 🚀
Stop Loss: 63,500 USDT ⚠️
The structural bounce from 62,000 has ignited fresh momentum, clearing the path straight toward the 66,500 to 68,000 resistance corridor. 📊 Order flow shows aggressive buyers defending lower timeframes while sellers scramble to cover underwater shorts. ⚡
If price manages to digest supply above 68,000 and flip it into solid support, the door swings wide open for a rapid march toward higher structural targets. 🌊 Are you taking chips off the table at the first major resistance test or holding out for the full extension? 💬
⚠️ Not financial advice. Always manage your risk. 🛡️
🏷️ #BTC #FuturesTrading #BTCPriceAction #Crypto
🔥 🚀
🚀 $BTC BOUNCES HARD OFF THE 62K FLOOR AS BULLS CHARGE THE 68K WALL! 💥
Entry: 65,157.40 USDT ⚡
Target: 77,500 USDT 🚀
Stop Loss: 63,500 USDT ⚠️
The structural bounce from 62,000 has ignited fresh momentum, clearing the path straight toward the 66,500 to 68,000 resistance corridor. 📊 Order flow shows aggressive buyers defending lower timeframes while sellers scramble to cover underwater shorts. ⚡
If price manages to digest supply above 68,000 and flip it into solid support, the door swings wide open for a rapid march toward higher structural targets. 🌊 Are you taking chips off the table at the first major resistance test or holding out for the full extension? 💬
⚠️ Not financial advice. Always manage your risk. 🛡️
🏷️ #BTC #FuturesTrading #BTCPriceAction #Crypto
🔥 🚀
Entry: 65,157.40 USDT ⚡
Target: 77,500 USDT 🚀
Stop Loss: 63,500 USDT ⚠️
The structural bounce from 62,000 has ignited fresh momentum, clearing the path straight toward the 66,500 to 68,000 resistance corridor. 📊 Order flow shows aggressive buyers defending lower timeframes while sellers scramble to cover underwater shorts. ⚡
If price manages to digest supply above 68,000 and flip it into solid support, the door swings wide open for a rapid march toward higher structural targets. 🌊 Are you taking chips off the table at the first major resistance test or holding out for the full extension? 💬
⚠️ Not financial advice. Always manage your risk. 🛡️
🏷️ #BTC #FuturesTrading #BTCPriceAction #Crypto
🔥 🚀
11

·
--
Bullish
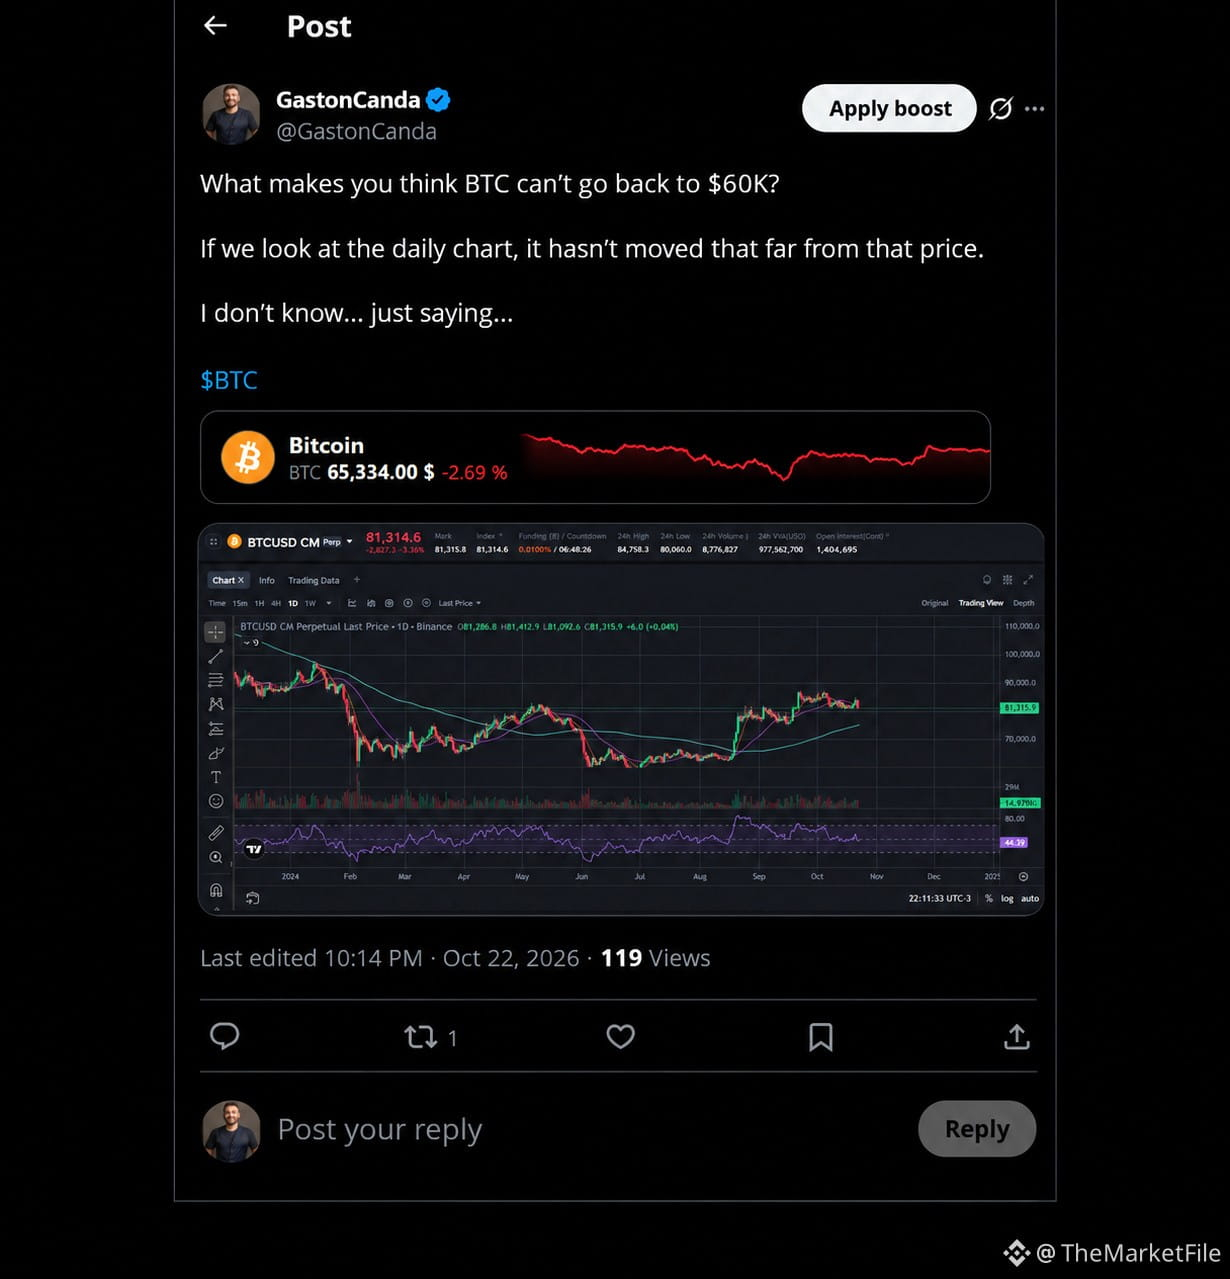
🚨 When Bitcoin was at $81,300, I asked on X what made people think it couldn’t go back to $60,000. Twenty-four days later, BTC hit 62,006 USDT on Binance.
THE MARKET FILE — FROM $81K TO $62K. NOW WHAT?
On October 22, before the U.S. midterms, I shared Bitcoin’s daily chart on X. The $60,000 area looked closer than market sentiment suggested. The chart attached to that post shows BTC trading around $81,300 at the time.
BTC has since bounced toward $65,400. The question I care about now is how much ground buyers can reclaim.
👀 What I’m watching this Sunday
I expect BTC to make a run at $68,000. Tonight’s Asian session is the first test. If BTC reclaims that level and finds buyers on a retest, I’ll be watching Monday’s Wall Street open to see if it gives Bitcoin enough momentum to challenge $70,000.
If BTC gets rejected between $66,500 and $68,000, I’ll watch how buyers respond around $62,000.
💬 At $81,300, I asked what was stopping BTC from going back to $60,000. Today, I’ll flip the question. What would Bitcoin have to show you before you’d believe in a move back to $70,000?
$BTC
#WhatWillDriveCryptoandStocks’NextRebound?
#BTCPriceAction
#SupportAndResistance
{future}(BTCUSDT)
🚨 When Bitcoin was at $81,300, I asked on X what made people think it couldn’t go back to $60,000. Twenty-four days later, BTC hit 62,006 USDT on Binance.
THE MARKET FILE — FROM $81K TO $62K. NOW WHAT?
On October 22, before the U.S. midterms, I shared Bitcoin’s daily chart on X. The $60,000 area looked closer than market sentiment suggested. The chart attached to that post shows BTC trading around $81,300 at the time.
BTC has since bounced toward $65,400. The question I care about now is how much ground buyers can reclaim.
👀 What I’m watching this Sunday
I expect BTC to make a run at $68,000. Tonight’s Asian session is the first test. If BTC reclaims that level and finds buyers on a retest, I’ll be watching Monday’s Wall Street open to see if it gives Bitcoin enough momentum to challenge $70,000.
If BTC gets rejected between $66,500 and $68,000, I’ll watch how buyers respond around $62,000.
💬 At $81,300, I asked what was stopping BTC from going back to $60,000. Today, I’ll flip the question. What would Bitcoin have to show you before you’d believe in a move back to $70,000?
$BTC
#WhatWillDriveCryptoandStocks’NextRebound?
#BTCPriceAction
#SupportAndResistance
THE MARKET FILE — FROM $81K TO $62K. NOW WHAT?
On October 22, before the U.S. midterms, I shared Bitcoin’s daily chart on X. The $60,000 area looked closer than market sentiment suggested. The chart attached to that post shows BTC trading around $81,300 at the time.
BTC has since bounced toward $65,400. The question I care about now is how much ground buyers can reclaim.
👀 What I’m watching this Sunday
I expect BTC to make a run at $68,000. Tonight’s Asian session is the first test. If BTC reclaims that level and finds buyers on a retest, I’ll be watching Monday’s Wall Street open to see if it gives Bitcoin enough momentum to challenge $70,000.
If BTC gets rejected between $66,500 and $68,000, I’ll watch how buyers respond around $62,000.
💬 At $81,300, I asked what was stopping BTC from going back to $60,000. Today, I’ll flip the question. What would Bitcoin have to show you before you’d believe in a move back to $70,000?
$BTC
#WhatWillDriveCryptoandStocks’NextRebound?
#BTCPriceAction
#SupportAndResistance
4
1k

·
--
Bearish
Bitcoin had a rough day today, 14 November. It opened near $68,200, dipped to about $66,500, and was sitting around $67,000. That's a drop of nearly 4% in one day.
Not a great Saturday for holders, but not a crash either.
The market looks a bit tired right now. Buyers are not rushing in, and sellers are keeping the pressure on. Most traders betting on today's close expect it to stay between $66K and $68K.
The big picture is what hurts. A year ago BTC was around $119K, so we are far below that level. A lot of people who bought near the top are still sitting in the red.
Still, I don't think it's time to panic. Bitcoin has gone up and down like this many times before, and no one can say where it goes next.
If you are buying, do it slowly. Put in small amounts instead of going all in on one day.
Only invest money you can afford to leave alone for a long time. And please don't make decisions based on one red candle or a loud post online.
I'm watching the $66K level closely. If it holds, we may see a small bounce. If it breaks, expect more pain.
$BTC #BTCPriceAction
{spot}(BTCUSDT)
Bitcoin had a rough day today, 14 November. It opened near $68,200, dipped to about $66,500, and was sitting around $67,000. That's a drop of nearly 4% in one day.
Not a great Saturday for holders, but not a crash either.
The market looks a bit tired right now. Buyers are not rushing in, and sellers are keeping the pressure on. Most traders betting on today's close expect it to stay between $66K and $68K.
The big picture is what hurts. A year ago BTC was around $119K, so we are far below that level. A lot of people who bought near the top are still sitting in the red.
Still, I don't think it's time to panic. Bitcoin has gone up and down like this many times before, and no one can say where it goes next.
If you are buying, do it slowly. Put in small amounts instead of going all in on one day.
Only invest money you can afford to leave alone for a long time. And please don't make decisions based on one red candle or a loud post online.
I'm watching the $66K level closely. If it holds, we may see a small bounce. If it breaks, expect more pain.
$BTC #BTCPriceAction
Not a great Saturday for holders, but not a crash either.
The market looks a bit tired right now. Buyers are not rushing in, and sellers are keeping the pressure on. Most traders betting on today's close expect it to stay between $66K and $68K.
The big picture is what hurts. A year ago BTC was around $119K, so we are far below that level. A lot of people who bought near the top are still sitting in the red.
Still, I don't think it's time to panic. Bitcoin has gone up and down like this many times before, and no one can say where it goes next.
If you are buying, do it slowly. Put in small amounts instead of going all in on one day.
Only invest money you can afford to leave alone for a long time. And please don't make decisions based on one red candle or a loud post online.
I'm watching the $66K level closely. If it holds, we may see a small bounce. If it breaks, expect more pain.
$BTC #BTCPriceAction
2
360

Bitcoin is fighting to reclaim $84,000 after a recent dip below $80,000. With the price currently hovering around $81,731, the market is split on whether this recovery will sustain or fail at immediate resistance.
#BitcoinResistance #BTCPriceAction
Bitcoin is fighting to reclaim $84,000 after a recent dip below $80,000. With the price currently hovering around $81,731, the market is split on whether this recovery will sustain or fail at immediate resistance.
#BitcoinResistance #BTCPriceAction
#BitcoinResistance #BTCPriceAction
42
Bitcoin has bounced back above $80,000, recovering from a dip below $75,000 that was triggered by Fed rate decisions and setbacks regarding the Senate Clarity Act.
#BTCPriceAction #SenateClarityAct
Bitcoin has bounced back above $80,000, recovering from a dip below $75,000 that was triggered by Fed rate decisions and setbacks regarding the Senate Clarity Act.
#BTCPriceAction #SenateClarityAct
#BTCPriceAction #SenateClarityAct
25

·
--
Bearish
Bitcoin remains under pressure near $60K after major ETF outflows and broader crypto market weakness. Investors continue shifting capital toward AI-related stocks and upcoming IPOs. Market sentiment is cautious as traders watch the $60K support zone closely. A successful defense of this level could spark a relief rally. Bulls and bears are currently battling for short-term control#BullVsBear #MarketUpdate #BTCPriceAction
Bitcoin remains under pressure near $60K after major ETF outflows and broader crypto market weakness. Investors continue shifting capital toward AI-related stocks and upcoming IPOs. Market sentiment is cautious as traders watch the $60K support zone closely. A successful defense of this level could spark a relief rally. Bulls and bears are currently battling for short-term control#BullVsBear #MarketUpdate #BTCPriceAction
187

$BTC Market Update 💸🔥
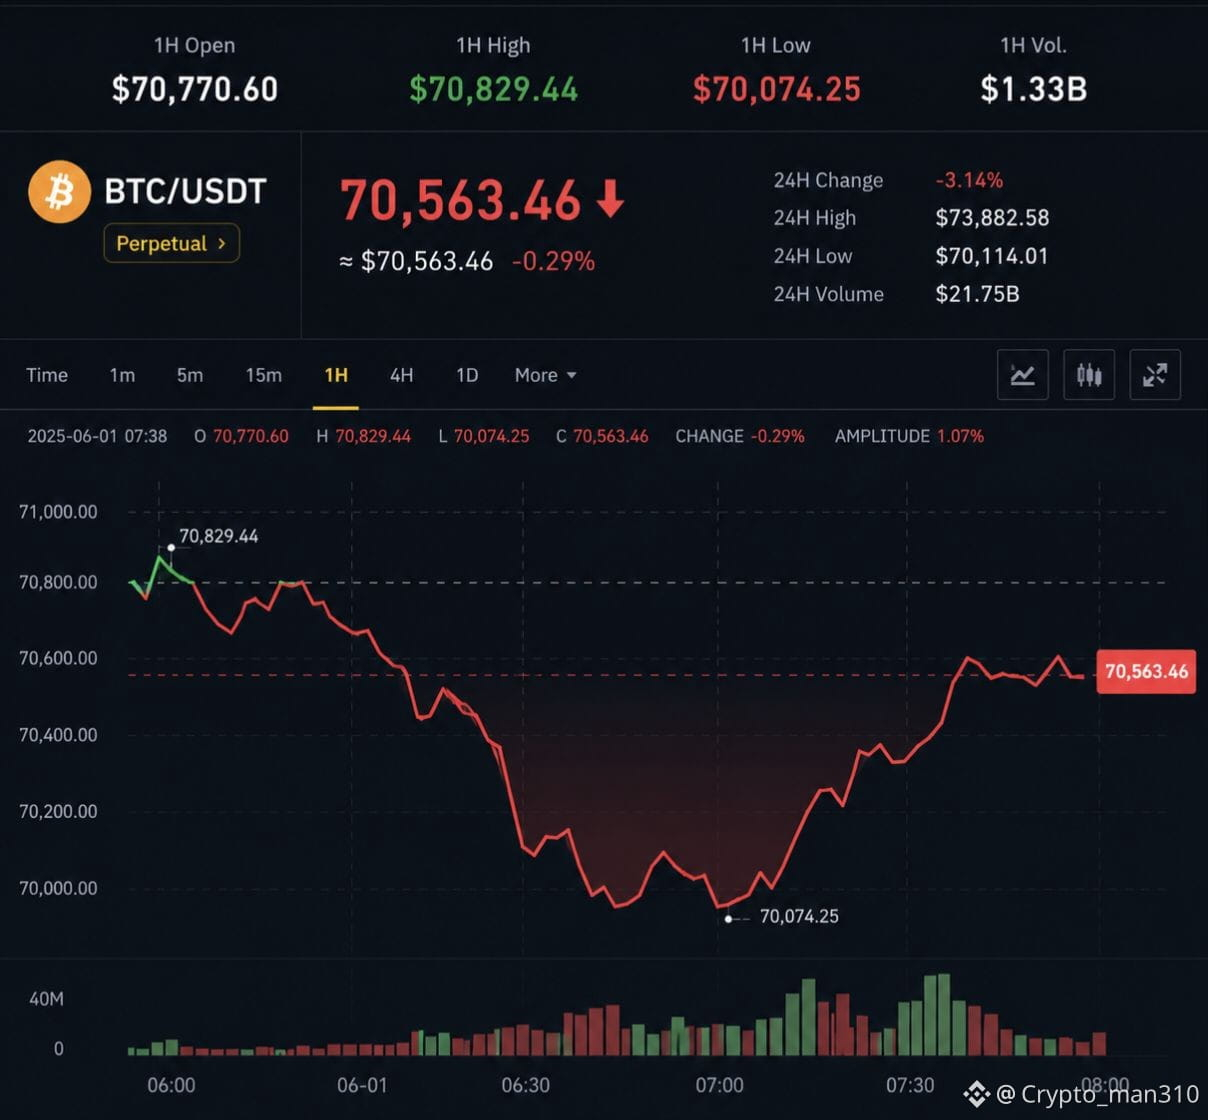
🎯 Resistance is currently forming around the $70,800–$71,000 zone.
💡 A breakout above resistance could open the door for further upside movement.
⚠️ Failure to hold support may lead to another retest of lower levels.
🔥 Market sentiment remains mixed with high intraday volatility.
📌 Smart traders are watching volume confirmation before entering positions.
💰 Risk management is essential during rapid price fluctuations.
🚀 Always follow your trading plan and avoid emotional decisions.
📉 Price dropped sharply from the session high, triggering short-term bearish momentum.
#Market_Update #bitcoin #BTCPriceAction #Price-Prediction
$BTC
{spot}(BTCUSDT)
$BTC Market Update 💸🔥
🎯 Resistance is currently forming around the $70,800–$71,000 zone.
💡 A breakout above resistance could open the door for further upside movement.
⚠️ Failure to hold support may lead to another retest of lower levels.
🔥 Market sentiment remains mixed with high intraday volatility.
📌 Smart traders are watching volume confirmation before entering positions.
💰 Risk management is essential during rapid price fluctuations.
🚀 Always follow your trading plan and avoid emotional decisions.
📉 Price dropped sharply from the session high, triggering short-term bearish momentum.
#Market_Update #bitcoin #BTCPriceAction #Price-Prediction
$BTC
🎯 Resistance is currently forming around the $70,800–$71,000 zone.
💡 A breakout above resistance could open the door for further upside movement.
⚠️ Failure to hold support may lead to another retest of lower levels.
🔥 Market sentiment remains mixed with high intraday volatility.
📌 Smart traders are watching volume confirmation before entering positions.
💰 Risk management is essential during rapid price fluctuations.
🚀 Always follow your trading plan and avoid emotional decisions.
📉 Price dropped sharply from the session high, triggering short-term bearish momentum.
#Market_Update #bitcoin #BTCPriceAction #Price-Prediction
$BTC
1
118

·
--
Bullish
BTC/USD Technical Analysis (45-Minute
Chart)
$BTC Technical Analysis (45-
Minute Chart): Bears Defend Resistance as Price Tests Key Support**
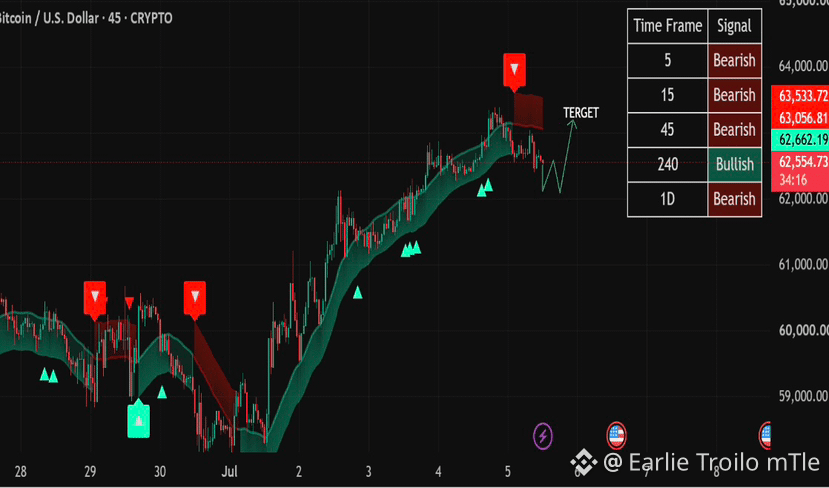
Bitcoin is showing signs of short-term weakness after failing to sustain its recent rally above the **63,000** region. On the 45-minute timeframe, price has pulled back from the recent swing high and is now consolidating around **62,580**, while remaining above a significant dynamic support zone. Although the broader trend remains constructive on higher timeframes, short-term momentum currently favors the sellers.
###**Technical Overview**
***Current Price:** 62,582
***Trend:** Short-term Bearish | Higher-Timeframe Bullish
* **Timeframe:** 45 Minutes
###**Market Structure**
BTC/USD remains in an overall higher-high and higher-low structure, indicating that the broader uptrend is still intact.
However, the latest rejection near
**63,300-63,500** has triggered a corrective move, suggesting buyers are losing momentum in the short term. The multi-timeframe signal panel highlights:
***5-Minute:** Bearish
* **15-Minute:** Bearish
***45-Minute:** Bearish
* **4-Hour:** Bullish
* **Daily:** Bearish
This alignment suggests that intraday momentum remains negative, despite the
4-hour trend continuing to support the broader bullish structure.
###**Key Resistance Levels**
***63,050 - 63,535:** Immediate resistance zone.
* A break and close above this region would invalidate the current bearish correction and could open the door for another push toward recent highs.
###**Key Support Levels** #BTCPriceAction
BTC/USD Technical Analysis (45-Minute
Chart)
$BTC Technical Analysis (45-
Minute Chart): Bears Defend Resistance as Price Tests Key Support**
Bitcoin is showing signs of short-term weakness after failing to sustain its recent rally above the **63,000** region. On the 45-minute timeframe, price has pulled back from the recent swing high and is now consolidating around **62,580**, while remaining above a significant dynamic support zone. Although the broader trend remains constructive on higher timeframes, short-term momentum currently favors the sellers.
###**Technical Overview**
***Current Price:** 62,582
***Trend:** Short-term Bearish | Higher-Timeframe Bullish
* **Timeframe:** 45 Minutes
###**Market Structure**
BTC/USD remains in an overall higher-high and higher-low structure, indicating that the broader uptrend is still intact.
However, the latest rejection near
**63,300-63,500** has triggered a corrective move, suggesting buyers are losing momentum in the short term. The multi-timeframe signal panel highlights:
***5-Minute:** Bearish
* **15-Minute:** Bearish
***45-Minute:** Bearish
* **4-Hour:** Bullish
* **Daily:** Bearish
This alignment suggests that intraday momentum remains negative, despite the
4-hour trend continuing to support the broader bullish structure.
###**Key Resistance Levels**
***63,050 - 63,535:** Immediate resistance zone.
* A break and close above this region would invalidate the current bearish correction and could open the door for another push toward recent highs.
###**Key Support Levels** #BTCPriceAction
Chart)
$BTC Technical Analysis (45-
Minute Chart): Bears Defend Resistance as Price Tests Key Support**
Bitcoin is showing signs of short-term weakness after failing to sustain its recent rally above the **63,000** region. On the 45-minute timeframe, price has pulled back from the recent swing high and is now consolidating around **62,580**, while remaining above a significant dynamic support zone. Although the broader trend remains constructive on higher timeframes, short-term momentum currently favors the sellers.
###**Technical Overview**
***Current Price:** 62,582
***Trend:** Short-term Bearish | Higher-Timeframe Bullish
* **Timeframe:** 45 Minutes
###**Market Structure**
BTC/USD remains in an overall higher-high and higher-low structure, indicating that the broader uptrend is still intact.
However, the latest rejection near
**63,300-63,500** has triggered a corrective move, suggesting buyers are losing momentum in the short term. The multi-timeframe signal panel highlights:
***5-Minute:** Bearish
* **15-Minute:** Bearish
***45-Minute:** Bearish
* **4-Hour:** Bullish
* **Daily:** Bearish
This alignment suggests that intraday momentum remains negative, despite the
4-hour trend continuing to support the broader bullish structure.
###**Key Resistance Levels**
***63,050 - 63,535:** Immediate resistance zone.
* A break and close above this region would invalidate the current bearish correction and could open the door for another push toward recent highs.
###**Key Support Levels** #BTCPriceAction
117

·
--
A staggering 85% of the time since 2012, one key ratio has been a crystal clear greenlight for Bitcoin bulls - but in a brutal reversal, it's now a red flag that threatens to derail the current rally.
This ratio, a closely watched comparison between Bitcoin's price and the US dollar, has spent the last 14 years almost exclusively trending upward. Until now. As of this week, it has decisively broken trendlines and flipped decisively to its first-ever downside bias - a move that should send shivers down the spines of even the most seasoned traders. So what is smart money doing in the face of this new trend?
According to Binance order book analysis, #bitcoin whales are quietly increasing their long positions amidst the chaos #btcpriceaction. If the downtrend holds, look for key support around the $32,000 level. Will bulls find footing before the next major sell-off?
A staggering 85% of the time since 2012, one key ratio has been a crystal clear greenlight for Bitcoin bulls - but in a brutal reversal, it's now a red flag that threatens to derail the current rally.
This ratio, a closely watched comparison between Bitcoin's price and the US dollar, has spent the last 14 years almost exclusively trending upward. Until now. As of this week, it has decisively broken trendlines and flipped decisively to its first-ever downside bias - a move that should send shivers down the spines of even the most seasoned traders. So what is smart money doing in the face of this new trend?
According to Binance order book analysis, #bitcoin whales are quietly increasing their long positions amidst the chaos #btcpriceaction. If the downtrend holds, look for key support around the $32,000 level. Will bulls find footing before the next major sell-off?
This ratio, a closely watched comparison between Bitcoin's price and the US dollar, has spent the last 14 years almost exclusively trending upward. Until now. As of this week, it has decisively broken trendlines and flipped decisively to its first-ever downside bias - a move that should send shivers down the spines of even the most seasoned traders. So what is smart money doing in the face of this new trend?
According to Binance order book analysis, #bitcoin whales are quietly increasing their long positions amidst the chaos #btcpriceaction. If the downtrend holds, look for key support around the $32,000 level. Will bulls find footing before the next major sell-off?
18


Article
🚨 Bitcoin: Are the sellers getting exhausted?
Bitcoin is creating a development that the crypto market mustBitcoin: Are the sellers getting exhausted?
🚨 Bitcoin: Are the sellers getting exhausted?
Bitcoin is creating a development that the crypto market needs to pay attention to. Against the backdrop of the Fed keeping interest rates high, oil prices rising above $106 per barrel, the US dollar strengthening, and some expectations related to crypto regulations not coming to fruition, BTC has still maintained its strength and has surpassed the $81,000 mark.
What’s notable is that the selling pressure does not seem strong enough to push Bitcoin down deeply. This raises a big question:
🚨 Bitcoin: Are the sellers getting exhausted? Bitcoin is creating a development that the crypto market must
Bitcoin: Are the sellers getting exhausted?
🚨 Bitcoin: Are the sellers getting exhausted?
Bitcoin is creating a development that the crypto market needs to pay attention to. Against the backdrop of the Fed keeping interest rates high, oil prices rising above $106 per barrel, the US dollar strengthening, and some expectations related to crypto regulations not coming to fruition, BTC has still maintained its strength and has surpassed the $81,000 mark.
What’s notable is that the selling pressure does not seem strong enough to push Bitcoin down deeply. This raises a big question:
🚨 Bitcoin: Are the sellers getting exhausted?
Bitcoin is creating a development that the crypto market needs to pay attention to. Against the backdrop of the Fed keeping interest rates high, oil prices rising above $106 per barrel, the US dollar strengthening, and some expectations related to crypto regulations not coming to fruition, BTC has still maintained its strength and has surpassed the $81,000 mark.
What’s notable is that the selling pressure does not seem strong enough to push Bitcoin down deeply. This raises a big question:
164

·
--
$BTC The bearish momentum played out precisely as mapped after the uptrend support cracked.
The 72K-74K accumulation zone that was highlighted previously couldn't defend the price, and Bitcoin has now confirmed a break beneath the critical $70K threshold — exactly as cautioned in the last analysis.
This is the clearest reminder yet that market structure and discipline will always outperform sentiment-driven decisions.
Right now, every trader should be watching the wider channel floor closely. If bulls can't step in and flip momentum fast, the door opens wide for a much steeper correction ahead.
#bitcoin is executing the technical playbook to perfection — no surprises for those who respected the chart.
{spot}(BTCUSDT)
#CryptoMarketWatch #BTCPriceAction #BinanceCrypto
$BTC The bearish momentum played out precisely as mapped after the uptrend support cracked.
The 72K-74K accumulation zone that was highlighted previously couldn't defend the price, and Bitcoin has now confirmed a break beneath the critical $70K threshold — exactly as cautioned in the last analysis.
This is the clearest reminder yet that market structure and discipline will always outperform sentiment-driven decisions.
Right now, every trader should be watching the wider channel floor closely. If bulls can't step in and flip momentum fast, the door opens wide for a much steeper correction ahead.
#bitcoin is executing the technical playbook to perfection — no surprises for those who respected the chart.
#CryptoMarketWatch #BTCPriceAction #BinanceCrypto
The 72K-74K accumulation zone that was highlighted previously couldn't defend the price, and Bitcoin has now confirmed a break beneath the critical $70K threshold — exactly as cautioned in the last analysis.
This is the clearest reminder yet that market structure and discipline will always outperform sentiment-driven decisions.
Right now, every trader should be watching the wider channel floor closely. If bulls can't step in and flip momentum fast, the door opens wide for a much steeper correction ahead.
#bitcoin is executing the technical playbook to perfection — no surprises for those who respected the chart.
#CryptoMarketWatch #BTCPriceAction #BinanceCrypto
165

·
--
Bullish
📊 VIP TRADE SETUP: BTC/USDT (Spot & Futures)
🟢 Entry Zone: $83,800 – $84,800
⚙️ Leverage: 5x - 10x (Strict Risk Management)
🎯 TAKE-PROFIT TARGETS:
TP 1: $86,200
TP 2: $87,800
TP 3: $89,500
TP 4: $92,000+ 🚀
🛑 STOP LOSS: $81,900
🔍 WHY THIS SETUP HAS HIGH PROBABILITY:
Institutional Demand: Heavy ETF accumulation absorbing sell pressure.
Key Level Support: Clean retest and hold above $83,500 demand zone.
Market Sentiment: High volume indicating liquidations of short positions
⚠️ Risk Management Rule: Never risk more than 3% - 5% of your total balance on a single trade!
💬 Will $BTC break $88,000 this week? Share your targets below! 👇
#BTCPriceAction #DollarIndexReclaims101 $BTC
{future}(BTCUSDT)
$ETH
{future}(ETHUSDT)
📊 VIP TRADE SETUP: BTC/USDT (Spot & Futures)
🟢 Entry Zone: $83,800 – $84,800
⚙️ Leverage: 5x - 10x (Strict Risk Management)
🎯 TAKE-PROFIT TARGETS:
TP 1: $86,200
TP 2: $87,800
TP 3: $89,500
TP 4: $92,000+ 🚀
🛑 STOP LOSS: $81,900
🔍 WHY THIS SETUP HAS HIGH PROBABILITY:
Institutional Demand: Heavy ETF accumulation absorbing sell pressure.
Key Level Support: Clean retest and hold above $83,500 demand zone.
Market Sentiment: High volume indicating liquidations of short positions
⚠️ Risk Management Rule: Never risk more than 3% - 5% of your total balance on a single trade!
💬 Will $BTC break $88,000 this week? Share your targets below! 👇
#BTCPriceAction #DollarIndexReclaims101 $BTC
$ETH
🟢 Entry Zone: $83,800 – $84,800
⚙️ Leverage: 5x - 10x (Strict Risk Management)
🎯 TAKE-PROFIT TARGETS:
TP 1: $86,200
TP 2: $87,800
TP 3: $89,500
TP 4: $92,000+ 🚀
🛑 STOP LOSS: $81,900
🔍 WHY THIS SETUP HAS HIGH PROBABILITY:
Institutional Demand: Heavy ETF accumulation absorbing sell pressure.
Key Level Support: Clean retest and hold above $83,500 demand zone.
Market Sentiment: High volume indicating liquidations of short positions
⚠️ Risk Management Rule: Never risk more than 3% - 5% of your total balance on a single trade!
💬 Will $BTC break $88,000 this week? Share your targets below! 👇
#BTCPriceAction #DollarIndexReclaims101 $BTC
$ETH

85

·
--
Bitcoin Exchange Deposits Surge
Bitcoin exchange deposits have spiked dramatically, pushing price projections toward $53,000 as analysts flag heightened volatility ahead. The influx of BTC into trading venues signals potential selling pressure, with on-chain metrics showing the largest deposit surge in three months.
Market watchers point to a 27% week-over-week increase in exchange balances, the steepest climb since the April halving. Whales moving 12,000 BTC to top-tier venues over 72 hours have triggered alerts across quant desks. Historical patterns suggest similar deposit spikes preceded 8-12% corrections within 48-96 hours.
Technical indicators compound the concern. The Exchange Reserve Gauge (ERG) has flipped bearish after six months of steady outflows, while the MVRV Z-Score sits in the yellow zone—neither overheated nor deeply undervalued. Analysts note that if deposits continue at this pace, the $52,400 support level could crack, opening a path toward $49,800.
Institutional players remain split. Short-side ETFs saw $41M net outflows yesterday, but perp funding rates haven't flipped negative, suggesting hedge positioning is still cautious. The coming 72-hour window will test whether this deposit wave is profit-taking or a full-scale reload for the next leg down.
Bullish dip-buyers or bearish breakout? Which side wins here? 👇
#BitcoinVolatility #ExchangeDeposits #BTCPriceAction
Bitcoin Exchange Deposits Surge
Bitcoin exchange deposits have spiked dramatically, pushing price projections toward $53,000 as analysts flag heightened volatility ahead. The influx of BTC into trading venues signals potential selling pressure, with on-chain metrics showing the largest deposit surge in three months.
Market watchers point to a 27% week-over-week increase in exchange balances, the steepest climb since the April halving. Whales moving 12,000 BTC to top-tier venues over 72 hours have triggered alerts across quant desks. Historical patterns suggest similar deposit spikes preceded 8-12% corrections within 48-96 hours.
Technical indicators compound the concern. The Exchange Reserve Gauge (ERG) has flipped bearish after six months of steady outflows, while the MVRV Z-Score sits in the yellow zone—neither overheated nor deeply undervalued. Analysts note that if deposits continue at this pace, the $52,400 support level could crack, opening a path toward $49,800.
Institutional players remain split. Short-side ETFs saw $41M net outflows yesterday, but perp funding rates haven't flipped negative, suggesting hedge positioning is still cautious. The coming 72-hour window will test whether this deposit wave is profit-taking or a full-scale reload for the next leg down.
Bullish dip-buyers or bearish breakout? Which side wins here? 👇
#BitcoinVolatility #ExchangeDeposits #BTCPriceAction
Bitcoin exchange deposits have spiked dramatically, pushing price projections toward $53,000 as analysts flag heightened volatility ahead. The influx of BTC into trading venues signals potential selling pressure, with on-chain metrics showing the largest deposit surge in three months.
Market watchers point to a 27% week-over-week increase in exchange balances, the steepest climb since the April halving. Whales moving 12,000 BTC to top-tier venues over 72 hours have triggered alerts across quant desks. Historical patterns suggest similar deposit spikes preceded 8-12% corrections within 48-96 hours.
Technical indicators compound the concern. The Exchange Reserve Gauge (ERG) has flipped bearish after six months of steady outflows, while the MVRV Z-Score sits in the yellow zone—neither overheated nor deeply undervalued. Analysts note that if deposits continue at this pace, the $52,400 support level could crack, opening a path toward $49,800.
Institutional players remain split. Short-side ETFs saw $41M net outflows yesterday, but perp funding rates haven't flipped negative, suggesting hedge positioning is still cautious. The coming 72-hour window will test whether this deposit wave is profit-taking or a full-scale reload for the next leg down.
Bullish dip-buyers or bearish breakout? Which side wins here? 👇
#BitcoinVolatility #ExchangeDeposits #BTCPriceAction
26

·
--
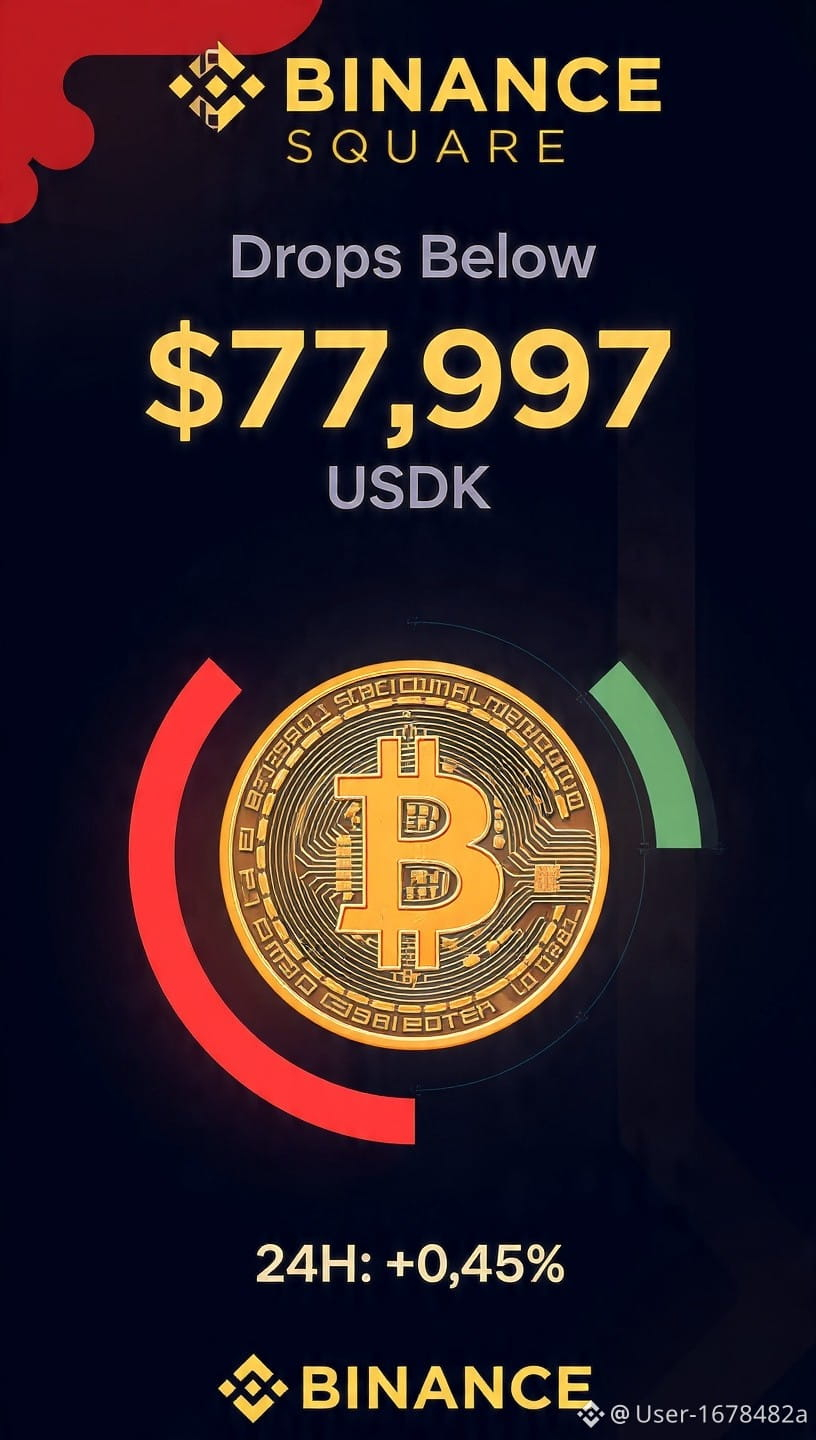
$BTC Dips Below $78K, But Holds Green 🟠
Aug 30, 2026 09:34 UTC
$BTC : $77,997 USDT | 24H: +0.44%
Price slipped under $78K after testing $81.3K earlier this week.
But zoom out: $BTC is _still_ up on the day.
What’s really happening:
1. Profit-taking - Normal after a 9-day ETF inflow streak + $2.8B
2. $80K is now support - Bulls defending the level, not collapsing
3. Context matters - +0.44% in 24H means volatility is cooling, not crashing
This looks like a pause, not a reversal.
Institutions didn’t buy for 9 days just to sell on a 2% wick.
Key levels to watch: $77K support, $80K-$81K resistance.
#BTC #Binance #CryptoMarket #BTCPriceAction #BinanceSquare
{spot}(BTCUSDT)
$BTC Dips Below $78K, But Holds Green 🟠
Aug 30, 2026 09:34 UTC
$BTC : $77,997 USDT | 24H: +0.44%
Price slipped under $78K after testing $81.3K earlier this week.
But zoom out: $BTC is _still_ up on the day.
What’s really happening:
1. Profit-taking - Normal after a 9-day ETF inflow streak + $2.8B
2. $80K is now support - Bulls defending the level, not collapsing
3. Context matters - +0.44% in 24H means volatility is cooling, not crashing
This looks like a pause, not a reversal.
Institutions didn’t buy for 9 days just to sell on a 2% wick.
Key levels to watch: $77K support, $80K-$81K resistance.
#BTC #Binance #CryptoMarket #BTCPriceAction #BinanceSquare
Aug 30, 2026 09:34 UTC
$BTC : $77,997 USDT | 24H: +0.44%
Price slipped under $78K after testing $81.3K earlier this week.
But zoom out: $BTC is _still_ up on the day.
What’s really happening:
1. Profit-taking - Normal after a 9-day ETF inflow streak + $2.8B
2. $80K is now support - Bulls defending the level, not collapsing
3. Context matters - +0.44% in 24H means volatility is cooling, not crashing
This looks like a pause, not a reversal.
Institutions didn’t buy for 9 days just to sell on a 2% wick.
Key levels to watch: $77K support, $80K-$81K resistance.
#BTC #Binance #CryptoMarket #BTCPriceAction #BinanceSquare
67
Watch the 90k level closely
Onchain signals confirm a Bitcoin bull market is here, but traders should watch for heavy profit taking as we approach the 90k resistance.
#BTCPriceAction #OnchainSignals
Watch the 90k level closely
Onchain signals confirm a Bitcoin bull market is here, but traders should watch for heavy profit taking as we approach the 90k resistance.
#BTCPriceAction #OnchainSignals
Onchain signals confirm a Bitcoin bull market is here, but traders should watch for heavy profit taking as we approach the 90k resistance.
#BTCPriceAction #OnchainSignals

31
Bitcoin dropped below 83000 after a prominent Ethereum researcher called for bunker mode. The market is currently divided on whether this is a sign of a broader bearish shift or a healthy correction.
#BTCPriceAction #SentimentShift
Bitcoin dropped below 83000 after a prominent Ethereum researcher called for bunker mode. The market is currently divided on whether this is a sign of a broader bearish shift or a healthy correction.
#BTCPriceAction #SentimentShift
#BTCPriceAction #SentimentShift
24
·
--
KABOOM
Historic levels of fear are plaguing the Bitcoin market, with five separate data points suggesting it's one of the best accumulation setups in years (1) (2) - and I'm betting big it'll be a buying opportunity we won't see again #BTCpriceaction #BitcoinBullRun. The flood has started, with smart money positioning themselves for a potential rebound at a 99.8% probability #cryptomarketmoves.
The stakes are high - if history repeats, this price action could be a buying opportunity unlike any other, with Bitcoin potentially doubling in value #BTCmoonshot.
What are you doing while this is happening - are you positioning yourself for the potential upside, or are you getting caught in a potential sell-off? Buy now, or watch while others reap the rewards.
KABOOM
Historic levels of fear are plaguing the Bitcoin market, with five separate data points suggesting it's one of the best accumulation setups in years (1) (2) - and I'm betting big it'll be a buying opportunity we won't see again #BTCpriceaction #BitcoinBullRun. The flood has started, with smart money positioning themselves for a potential rebound at a 99.8% probability #cryptomarketmoves.
The stakes are high - if history repeats, this price action could be a buying opportunity unlike any other, with Bitcoin potentially doubling in value #BTCmoonshot.
What are you doing while this is happening - are you positioning yourself for the potential upside, or are you getting caught in a potential sell-off? Buy now, or watch while others reap the rewards.
Historic levels of fear are plaguing the Bitcoin market, with five separate data points suggesting it's one of the best accumulation setups in years (1) (2) - and I'm betting big it'll be a buying opportunity we won't see again #BTCpriceaction #BitcoinBullRun. The flood has started, with smart money positioning themselves for a potential rebound at a 99.8% probability #cryptomarketmoves.
The stakes are high - if history repeats, this price action could be a buying opportunity unlike any other, with Bitcoin potentially doubling in value #BTCmoonshot.
What are you doing while this is happening - are you positioning yourself for the potential upside, or are you getting caught in a potential sell-off? Buy now, or watch while others reap the rewards.
48
·
--
Bitcoin ETFs just bled $620M in a single day.
Bitcoin ETFs posted their largest single-day outflows of June as the asset slipped below $60K for the first time since early 2025. BlackRock and Fidelity were among the funds seeing redemptions, signaling a broader risk-off sentiment among institutional investors. The pullback comes after months of steady inflows that had pushed BTC to all-time highs earlier this year.
The $60K level is a critical support zone. Multiple analysts have flagged it as a make-or-break point for the current cycle. A sustained break below could trigger further selling pressure, while a bounce here would confirm that institutional demand remains intact despite short-term profit-taking.
What makes this outflow notable is the timing. June historically weakens for crypto markets, but the scale of the redemption suggests macro headwinds are playing a larger role than seasonal patterns alone. Rising rate expectations and geopolitical uncertainty are weighing on risk assets across the board.
For traders watching the chart, the next 48 hours are critical. If BTC holds above $58K, the outflow narrative may cool. If it breaks lower, expect volatility to spike.
Will institutional buyers step in at these levels, or is this the start of a deeper correction? 👇
#BitcoinETFOutflows #InstitutionalCrypto #BTCPriceAction
Bitcoin ETFs just bled $620M in a single day.
Bitcoin ETFs posted their largest single-day outflows of June as the asset slipped below $60K for the first time since early 2025. BlackRock and Fidelity were among the funds seeing redemptions, signaling a broader risk-off sentiment among institutional investors. The pullback comes after months of steady inflows that had pushed BTC to all-time highs earlier this year.
The $60K level is a critical support zone. Multiple analysts have flagged it as a make-or-break point for the current cycle. A sustained break below could trigger further selling pressure, while a bounce here would confirm that institutional demand remains intact despite short-term profit-taking.
What makes this outflow notable is the timing. June historically weakens for crypto markets, but the scale of the redemption suggests macro headwinds are playing a larger role than seasonal patterns alone. Rising rate expectations and geopolitical uncertainty are weighing on risk assets across the board.
For traders watching the chart, the next 48 hours are critical. If BTC holds above $58K, the outflow narrative may cool. If it breaks lower, expect volatility to spike.
Will institutional buyers step in at these levels, or is this the start of a deeper correction? 👇
#BitcoinETFOutflows #InstitutionalCrypto #BTCPriceAction
Bitcoin ETFs posted their largest single-day outflows of June as the asset slipped below $60K for the first time since early 2025. BlackRock and Fidelity were among the funds seeing redemptions, signaling a broader risk-off sentiment among institutional investors. The pullback comes after months of steady inflows that had pushed BTC to all-time highs earlier this year.
The $60K level is a critical support zone. Multiple analysts have flagged it as a make-or-break point for the current cycle. A sustained break below could trigger further selling pressure, while a bounce here would confirm that institutional demand remains intact despite short-term profit-taking.
What makes this outflow notable is the timing. June historically weakens for crypto markets, but the scale of the redemption suggests macro headwinds are playing a larger role than seasonal patterns alone. Rising rate expectations and geopolitical uncertainty are weighing on risk assets across the board.
For traders watching the chart, the next 48 hours are critical. If BTC holds above $58K, the outflow narrative may cool. If it breaks lower, expect volatility to spike.
Will institutional buyers step in at these levels, or is this the start of a deeper correction? 👇
#BitcoinETFOutflows #InstitutionalCrypto #BTCPriceAction
1
40

·
--
#BTC
🚀 BTC Market Update
Bitcoin is trading near a key resistance zone. If buyers break above this level with strong volume, the next move could be a rally toward higher resistance. If it gets rejected, a pullback to nearby support is still possible before the next trend develops. Recent market commentary shows analysts are divided between a bullish breakout and a period of sideways or corrective price action.
Resistance Zone: 64800 - 64900
Support Zone: 64300 - 64400
{spot}(BTCUSDT)
Outlook:
📈 Bullish scenario: Breakout above resistance could trigger a stronger upward move.
📉 Bearish scenario: Failure to hold support may lead to a deeper correction.
⚠️ Always use stop-loss and proper risk management—crypto markets remain highly volatile. (DYOR) #BTCPriceAction
$BTC
#BTC
🚀 BTC Market Update
Bitcoin is trading near a key resistance zone. If buyers break above this level with strong volume, the next move could be a rally toward higher resistance. If it gets rejected, a pullback to nearby support is still possible before the next trend develops. Recent market commentary shows analysts are divided between a bullish breakout and a period of sideways or corrective price action.
Resistance Zone: 64800 - 64900
Support Zone: 64300 - 64400
Outlook:
📈 Bullish scenario: Breakout above resistance could trigger a stronger upward move.
📉 Bearish scenario: Failure to hold support may lead to a deeper correction.
⚠️ Always use stop-loss and proper risk management—crypto markets remain highly volatile. (DYOR) #BTCPriceAction
$BTC
🚀 BTC Market Update
Bitcoin is trading near a key resistance zone. If buyers break above this level with strong volume, the next move could be a rally toward higher resistance. If it gets rejected, a pullback to nearby support is still possible before the next trend develops. Recent market commentary shows analysts are divided between a bullish breakout and a period of sideways or corrective price action.
Resistance Zone: 64800 - 64900
Support Zone: 64300 - 64400
Outlook:
📈 Bullish scenario: Breakout above resistance could trigger a stronger upward move.
📉 Bearish scenario: Failure to hold support may lead to a deeper correction.
⚠️ Always use stop-loss and proper risk management—crypto markets remain highly volatile. (DYOR) #BTCPriceAction
$BTC
97
Bitcoin Faces Macro Pressure Ahead Of Inflation Data
Bitcoin pulls back from $84000 as market awaits crucial US inflation figures.
#BTCPriceAction #MacroVolatility
Bitcoin Faces Macro Pressure Ahead Of Inflation Data
Bitcoin pulls back from $84000 as market awaits crucial US inflation figures.
#BTCPriceAction #MacroVolatility
Bitcoin pulls back from $84000 as market awaits crucial US inflation figures.
#BTCPriceAction #MacroVolatility

30
Log in to explore more content
Join global crypto users on Binance Square
⚡️ Get latest and useful information about crypto.
💬 Trusted by the world’s largest crypto exchange.
👍 Discover real insights from verified creators.
Email / Phone number
Trending Topics
1
#NvidiaBeatsEstimatesWith$130BQ4Outlook
38,162 views
244 Discussing
2
#AnthropicIPOPriceCouldExceed$80
41,087 views
214 Discussing
3
#RussiaCentralBankAddsAlfaBankToCryptoExchangeRegister
1,501 views
27 Discussing
4
#RussianCentralBankPlansToAllowFundsToHoldCryptoIn2027
1,209 views
23 Discussing
5
#VisaPlansStablecoinPrefundingForAPACCrossBorderPayments
1,727 views
23 Discussing
6
#CanNvidia’sDataCenterGrowthContinue?
108,211 views
1,229 Discussing
7
#CanadaAndUSLaunchOperationNiagaraAgainstApprovalPhishing
22,081 views
53 Discussing
8
#BankOfEnglandUnveilsClearingHousePathwayCoveringDLTFirms
3,495 views
60 Discussing
9
#DBSAndCirclePartnerToExpandAsianInstitutionsUSDCAccess
4,591 views
63 Discussing
10
#LedgerHardwareImplantReportsExtendToDubai
59,960 views
676 Discussing