
#bitcoinetfssee
bitcoinetfssee
970 views
101 Discussing
Hot
Latest

·
--
Seven straight days of $BTC ETF outflows — $1.07B gone this week alone. $BTC sits near $65.6K, down 5% today. Hold $65K and dip buyers may step in; lose it and $64K is next. Buying the fear or waiting it out? #BitcoinETFsSee$1BWeeklyOutflows #CryptoMarket #CryptoContent
Seven straight days of $BTC ETF outflows — $1.07B gone this week alone. $BTC sits near $65.6K, down 5% today. Hold $65K and dip buyers may step in; lose it and $64K is next. Buying the fear or waiting it out? #BitcoinETFsSee$1BWeeklyOutflows #CryptoMarket #CryptoContent
2
·
--
Spot $BTC ETFs bled $300M in a day — 5th straight session, $1.44B out in 5 days. Institutions are cutting risk after hot CPI. $BTC near $71.9K, -3.5%. Hold $70K and buyers step in; lose it and the slide extends. Are ETF flows the tell now? #BitcoinETFsSee$300MOutflows #CryptoMarket #CryptoContent
Spot $BTC ETFs bled $300M in a day — 5th straight session, $1.44B out in 5 days. Institutions are cutting risk after hot CPI. $BTC near $71.9K, -3.5%. Hold $70K and buyers step in; lose it and the slide extends. Are ETF flows the tell now? #BitcoinETFsSee$300MOutflows #CryptoMarket #CryptoContent
3
·
--
Institutions pulled $1.28B from $BTC ETFs in a week — worst since June, IBIT alone losing $1.21B. $BTC near $74,577, down 1.3%. Hold $73,500 and bleeding pauses; lose it and outflows snowball. Buying the dip or waiting for flows to turn? #BitcoinETFsSee$1.28BOutflows #CryptoMarket #CryptoContent
Institutions pulled $1.28B from $BTC ETFs in a week — worst since June, IBIT alone losing $1.21B. $BTC near $74,577, down 1.3%. Hold $73,500 and bleeding pauses; lose it and outflows snowball. Buying the dip or waiting for flows to turn? #BitcoinETFsSee$1.28BOutflows #CryptoMarket #CryptoContent
1

·
--
ETF money just flipped — $BTC funds saw 1.28B walk out last week, worst since June, yet $BTC still holds near $75,639. Hold $75K and the selling may be done; lose it and a fifth straight weekly loss is on the cards. Who's buying this dip? #BitcoinETFsSee$1.28BOutflows #Bitcoin #BinanceSquare
ETF money just flipped — $BTC funds saw 1.28B walk out last week, worst since June, yet $BTC still holds near $75,639. Hold $75K and the selling may be done; lose it and a fifth straight weekly loss is on the cards. Who's buying this dip? #BitcoinETFsSee$1.28BOutflows #Bitcoin #BinanceSquare
5

·
--
#BitcoinETFsSee$412MNetOutflows
🧲 $1.28B Left Bitcoin ETFs in 5 Days. One Fund Took Most.
Friday's $412M exit capped the worst week for US spot Bitcoin ETFs since late June, per SoSoValue and Farside data.
📉 Nov 2-6: -$1.28B, with outflows on 4 of 5 sessions
🏦 BlackRock's IBIT alone: -$1.21B; Fidelity's FBTC: +$93.1M
📊 About six times the prior week's -$202.4M
⚠️ Ether ETFs: -$365.2M, a sixth straight losing week
Watch next: Monday's flow print, with Tuesday's CPI right behind it.
Bitcoin ETFs back to net inflows this week, or a third red week past $500M? 👇
$BTC $ETH
#BitcoinETFsSee$412MNetOutflows #Bitcoin #ETF
#BitcoinETFsSee$412MNetOutflows
🧲 $1.28B Left Bitcoin ETFs in 5 Days. One Fund Took Most.
Friday's $412M exit capped the worst week for US spot Bitcoin ETFs since late June, per SoSoValue and Farside data.
📉 Nov 2-6: -$1.28B, with outflows on 4 of 5 sessions
🏦 BlackRock's IBIT alone: -$1.21B; Fidelity's FBTC: +$93.1M
📊 About six times the prior week's -$202.4M
⚠️ Ether ETFs: -$365.2M, a sixth straight losing week
Watch next: Monday's flow print, with Tuesday's CPI right behind it.
Bitcoin ETFs back to net inflows this week, or a third red week past $500M? 👇
$BTC $ETH
#BitcoinETFsSee$412MNetOutflows #Bitcoin #ETF
🧲 $1.28B Left Bitcoin ETFs in 5 Days. One Fund Took Most.
Friday's $412M exit capped the worst week for US spot Bitcoin ETFs since late June, per SoSoValue and Farside data.
📉 Nov 2-6: -$1.28B, with outflows on 4 of 5 sessions
🏦 BlackRock's IBIT alone: -$1.21B; Fidelity's FBTC: +$93.1M
📊 About six times the prior week's -$202.4M
⚠️ Ether ETFs: -$365.2M, a sixth straight losing week
Watch next: Monday's flow print, with Tuesday's CPI right behind it.
Bitcoin ETFs back to net inflows this week, or a third red week past $500M? 👇
$BTC $ETH
#BitcoinETFsSee$412MNetOutflows #Bitcoin #ETF

6

#BitcoinETFsSee$412MNetOutflows
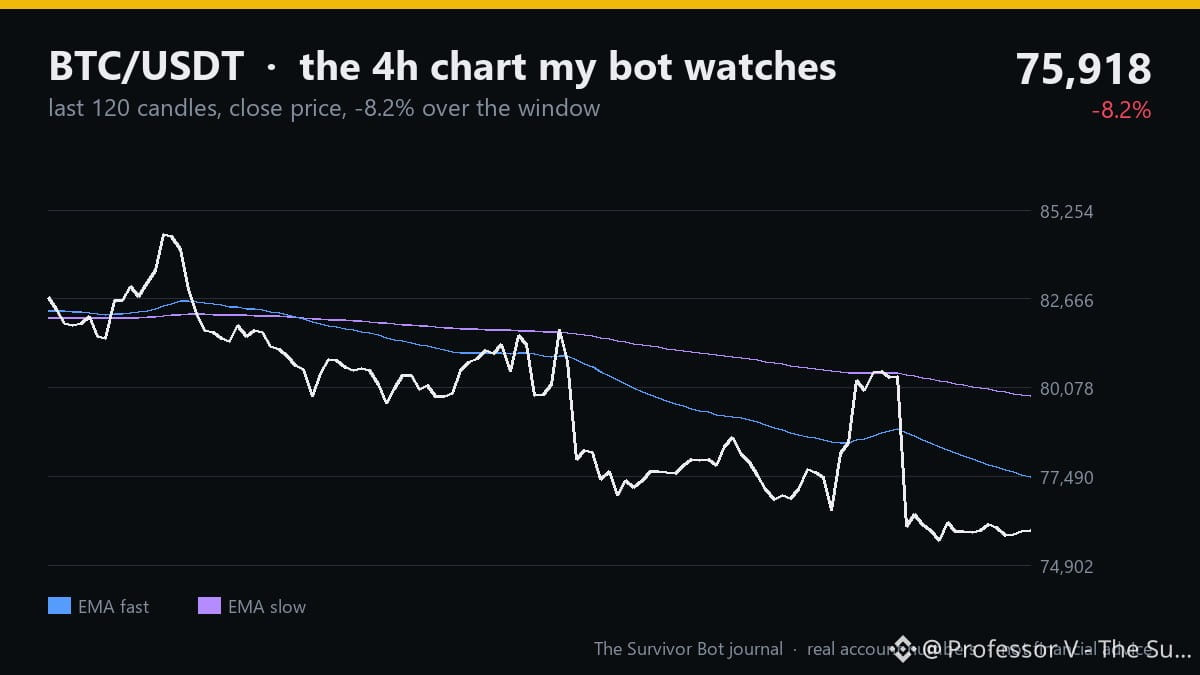
$BTC 75,831 - the spot Bitcoin price sits at 75,831 USDT as the market eyes a massive 412 M net outflow from ETFs.
Equity sits at 10.17 USDT, down 96.63% since the bot started with 100 USDT.
BTC 4-hour trend is downtrend and the daily bias is down.
News mood is risk-off (-0.22) with mixed negative headlines.
With a risk-off mood the bot holds no open positions and adds no new longs, because its rule blocks any new entry when the bias is down and the news mood is negative. If nothing changes, the bot will stay flat, keeping stop-loss orders ready on the exchange.
Levels I'm watching on BTC: 75,831 entry, 10.17 equity.
Follow to watch a real bot account (started with 100 USDT) survive in public, one rule at a time.
#BitcoinETFsSee$412MNetOutflows #TheSurvivorBot
#BitcoinETFsSee$412MNetOutflows
$BTC 75,831 - the spot Bitcoin price sits at 75,831 USDT as the market eyes a massive 412 M net outflow from ETFs.
Equity sits at 10.17 USDT, down 96.63% since the bot started with 100 USDT.
BTC 4-hour trend is downtrend and the daily bias is down.
News mood is risk-off (-0.22) with mixed negative headlines.
With a risk-off mood the bot holds no open positions and adds no new longs, because its rule blocks any new entry when the bias is down and the news mood is negative. If nothing changes, the bot will stay flat, keeping stop-loss orders ready on the exchange.
Levels I'm watching on BTC: 75,831 entry, 10.17 equity.
Follow to watch a real bot account (started with 100 USDT) survive in public, one rule at a time.
#BitcoinETFsSee$412MNetOutflows #TheSurvivorBot
$BTC 75,831 - the spot Bitcoin price sits at 75,831 USDT as the market eyes a massive 412 M net outflow from ETFs.
Equity sits at 10.17 USDT, down 96.63% since the bot started with 100 USDT.
BTC 4-hour trend is downtrend and the daily bias is down.
News mood is risk-off (-0.22) with mixed negative headlines.
With a risk-off mood the bot holds no open positions and adds no new longs, because its rule blocks any new entry when the bias is down and the news mood is negative. If nothing changes, the bot will stay flat, keeping stop-loss orders ready on the exchange.
Levels I'm watching on BTC: 75,831 entry, 10.17 equity.
Follow to watch a real bot account (started with 100 USDT) survive in public, one rule at a time.
#BitcoinETFsSee$412MNetOutflows #TheSurvivorBot
69


·
--
Verified
friday's bitcoin etf outflow was basically one fund
#BitcoinETFsSee$412MNetOutflows
us spot bitcoin etfs saw about 412 million leave on friday, a second red session. blackrock's ibit did most of the redeeming, while fidelity's fund took money in
one side reads that as the biggest wrapper distributing, so real $BTC hits the market when those shares get redeemed. the other side says this is rotation between products, not a broad exit, since money still went into a different bitcoin fund
what i watch is monday's flow print. another heavy ibit redemption day means that bid is still in reverse. flat or green on a quiet chart means friday was just weekend book cleaning
does monday stay red on those etfs, or was friday just weekend tidying ?
friday's bitcoin etf outflow was basically one fund
#BitcoinETFsSee$412MNetOutflows
us spot bitcoin etfs saw about 412 million leave on friday, a second red session. blackrock's ibit did most of the redeeming, while fidelity's fund took money in
one side reads that as the biggest wrapper distributing, so real $BTC hits the market when those shares get redeemed. the other side says this is rotation between products, not a broad exit, since money still went into a different bitcoin fund
what i watch is monday's flow print. another heavy ibit redemption day means that bid is still in reverse. flat or green on a quiet chart means friday was just weekend book cleaning
does monday stay red on those etfs, or was friday just weekend tidying ?
#BitcoinETFsSee$412MNetOutflows
us spot bitcoin etfs saw about 412 million leave on friday, a second red session. blackrock's ibit did most of the redeeming, while fidelity's fund took money in
one side reads that as the biggest wrapper distributing, so real $BTC hits the market when those shares get redeemed. the other side says this is rotation between products, not a broad exit, since money still went into a different bitcoin fund
what i watch is monday's flow print. another heavy ibit redemption day means that bid is still in reverse. flat or green on a quiet chart means friday was just weekend book cleaning
does monday stay red on those etfs, or was friday just weekend tidying ?
1
689

·
--
BTC funds see another day of outflows | BITB quarterly figures use a different basis | Wait below $76,000
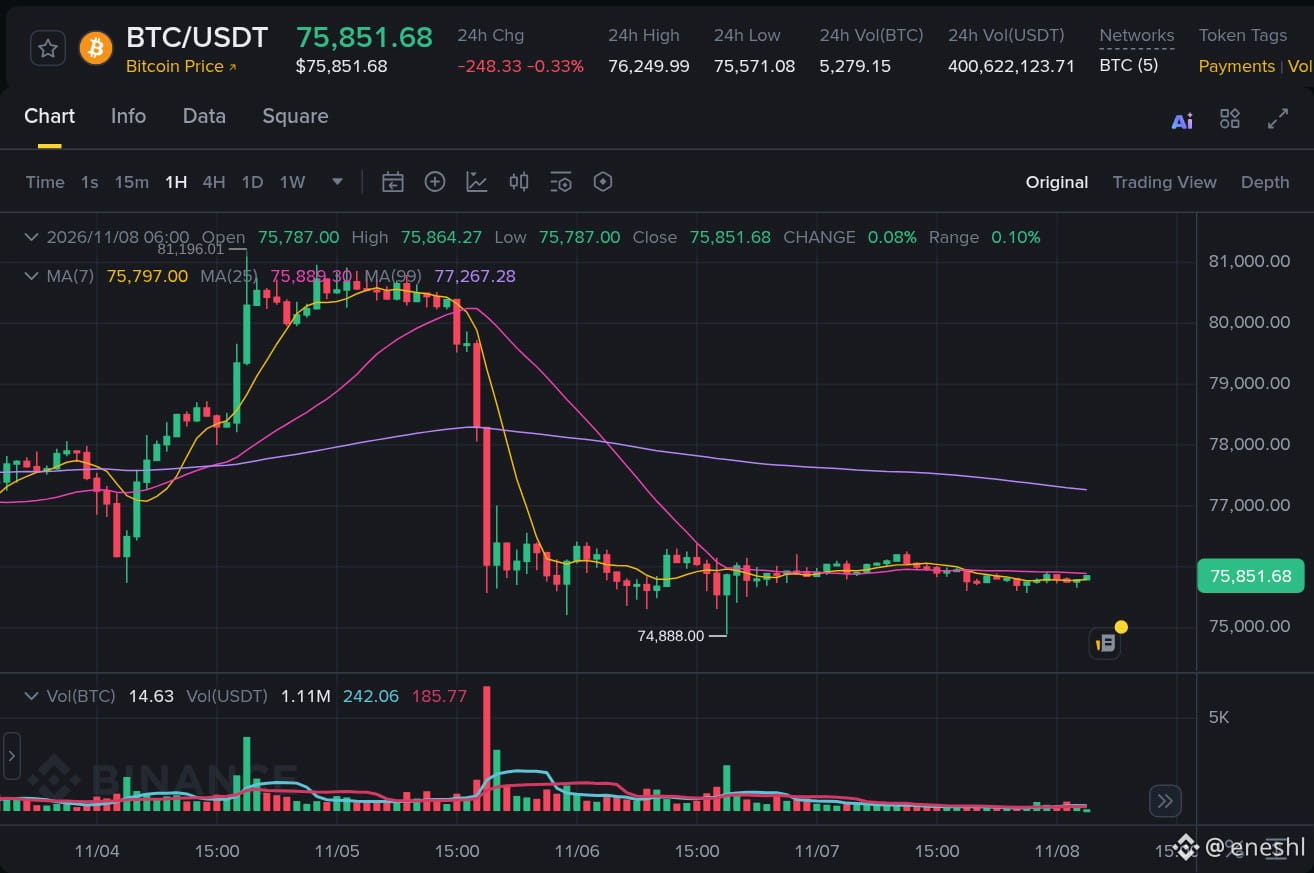
My stance is cautious and neutral. A popular topic on Binance Square, #BitcoinETFsSee$412MNetOutflows, discusses net outflows from U.S. spot Bitcoin funds on November 6. I checked Farside’s original fund-by-fund table: total outflows that day were about $411.9 million, which can be rounded to about $412 million. BlackRock’s IBIT saw outflows of about $403 million, Bitwise’s BITB about $20.5 million, while Fidelity’s FBTC saw inflows of $42.8 million. Similar-looking totals do not mean every fund was selling, and redemption data should not be described directly as immediate selling pressure in spot markets on exchanges.
I checked BITB’s recently filed third-quarter 10-Q. The SEC filing shows 8.39 million shares issued and 5.19 million redeemed from July through September, for a net quarterly increase of 3.20 million shares. But over the first nine months, 26.06 million shares were issued and 26.95 million redeemed, leaving a net decrease of 890,000 shares through the end of September. The improvement in the third quarter has not offset net redemptions in the first two quarters. BITB held about 37,926.1475 BTC as of September 30, compared with about 38,468.0468 BTC at the end of last year; creations, redemptions, and management fee payments can all change its BTC holdings. Bitwise’s website confirms that BITB invests directly in Bitcoin; its shares and BTC holdings are not the same as Strategy’s corporate holdings.
Looking only at the net increase in shares during the third quarter could lead to the conclusion that “institutions are continuing to buy.” Looking only at the November 6 outflows could just as easily lead to the claim that “long-term demand has reversed.” The former is based on financial results through September, while the latter is a single day of fund flows in November; the periods and coverage differ. We also need to look at flows across consecutive trading days and price structure. The latest Strategy holdings I can currently verify on the company’s website are 849,327 BTC as of November 2; social media hints are no substitute for formal disclosures.
The market has not made a strong breakout yet: BTC/USDT on Binance is around $75,978, down about 0.17% from $76,106.56 over the rolling 24-hour period, with a high of $76,249.99 and a low of $75,571.08. The price is holding above $75,000, but that is not enough to prove that fund outflows have been absorbed. On October 28, the Federal Reserve held its target interest rate range at 3.75% to 4.00%. The next round of macroeconomic data could still change risk appetite; neither fund flows nor rate expectations follow a one-way causal formula.
I’m treating $76,250 as the short-term confirmation level and around $75,570 as the defense level. If the price regains and holds above $76,250, then retests it without breaking below, that would suggest buyers have at least absorbed the recent range high. If it breaks below $75,570 and fails to recover, I’ll shift today’s cautious stance to a more defensive one. Other developments that would invalidate my view include ETF flow data turning positive across consecutive trading days, a material issuer disclosure, or Strategy formally disclosing new holdings. Until evidence emerges, I won’t present speculation as fact.
If I were trading this myself, I would stay out for now, remain directionally neutral, and hold a 0% position. Only if BTC spot holds above $76,250 and confirms the level on a retest, while fund flows in the next round do not continue to deteriorate, would I use at most 0.5% of total capital to test a long position, without leverage. The first target would be around $77,000, where I would take half off; I’d look to exit the remainder around $78,000 or if the price spikes on heavy volume and then reverses. After entry, I’d stop out if the price falls back below $75,700. If it first breaks below $75,570, I’d cancel the long plan and stay out. I’d also exit the test position if fund outflows expand significantly. An untriggered plan has resulted in neither a trade nor a profit.
#BitcoinETFsSee$412MNetOutflows #BTC
The above is solely my personal market observation and does not constitute investment advice.
BTC funds see another day of outflows | BITB quarterly figures use a different basis | Wait below $76,000
My stance is cautious and neutral. A popular topic on Binance Square, #BitcoinETFsSee$412MNetOutflows, discusses net outflows from U.S. spot Bitcoin funds on November 6. I checked Farside’s original fund-by-fund table: total outflows that day were about $411.9 million, which can be rounded to about $412 million. BlackRock’s IBIT saw outflows of about $403 million, Bitwise’s BITB about $20.5 million, while Fidelity’s FBTC saw inflows of $42.8 million. Similar-looking totals do not mean every fund was selling, and redemption data should not be described directly as immediate selling pressure in spot markets on exchanges.
I checked BITB’s recently filed third-quarter 10-Q. The SEC filing shows 8.39 million shares issued and 5.19 million redeemed from July through September, for a net quarterly increase of 3.20 million shares. But over the first nine months, 26.06 million shares were issued and 26.95 million redeemed, leaving a net decrease of 890,000 shares through the end of September. The improvement in the third quarter has not offset net redemptions in the first two quarters. BITB held about 37,926.1475 BTC as of September 30, compared with about 38,468.0468 BTC at the end of last year; creations, redemptions, and management fee payments can all change its BTC holdings. Bitwise’s website confirms that BITB invests directly in Bitcoin; its shares and BTC holdings are not the same as Strategy’s corporate holdings.
Looking only at the net increase in shares during the third quarter could lead to the conclusion that “institutions are continuing to buy.” Looking only at the November 6 outflows could just as easily lead to the claim that “long-term demand has reversed.” The former is based on financial results through September, while the latter is a single day of fund flows in November; the periods and coverage differ. We also need to look at flows across consecutive trading days and price structure. The latest Strategy holdings I can currently verify on the company’s website are 849,327 BTC as of November 2; social media hints are no substitute for formal disclosures.
The market has not made a strong breakout yet: BTC/USDT on Binance is around $75,978, down about 0.17% from $76,106.56 over the rolling 24-hour period, with a high of $76,249.99 and a low of $75,571.08. The price is holding above $75,000, but that is not enough to prove that fund outflows have been absorbed. On October 28, the Federal Reserve held its target interest rate range at 3.75% to 4.00%. The next round of macroeconomic data could still change risk appetite; neither fund flows nor rate expectations follow a one-way causal formula.
I’m treating $76,250 as the short-term confirmation level and around $75,570 as the defense level. If the price regains and holds above $76,250, then retests it without breaking below, that would suggest buyers have at least absorbed the recent range high. If it breaks below $75,570 and fails to recover, I’ll shift today’s cautious stance to a more defensive one. Other developments that would invalidate my view include ETF flow data turning positive across consecutive trading days, a material issuer disclosure, or Strategy formally disclosing new holdings. Until evidence emerges, I won’t present speculation as fact.
If I were trading this myself, I would stay out for now, remain directionally neutral, and hold a 0% position. Only if BTC spot holds above $76,250 and confirms the level on a retest, while fund flows in the next round do not continue to deteriorate, would I use at most 0.5% of total capital to test a long position, without leverage. The first target would be around $77,000, where I would take half off; I’d look to exit the remainder around $78,000 or if the price spikes on heavy volume and then reverses. After entry, I’d stop out if the price falls back below $75,700. If it first breaks below $75,570, I’d cancel the long plan and stay out. I’d also exit the test position if fund outflows expand significantly. An untriggered plan has resulted in neither a trade nor a profit.
#BitcoinETFsSee$412MNetOutflows #BTC
The above is solely my personal market observation and does not constitute investment advice.
My stance is cautious and neutral. A popular topic on Binance Square, #BitcoinETFsSee$412MNetOutflows, discusses net outflows from U.S. spot Bitcoin funds on November 6. I checked Farside’s original fund-by-fund table: total outflows that day were about $411.9 million, which can be rounded to about $412 million. BlackRock’s IBIT saw outflows of about $403 million, Bitwise’s BITB about $20.5 million, while Fidelity’s FBTC saw inflows of $42.8 million. Similar-looking totals do not mean every fund was selling, and redemption data should not be described directly as immediate selling pressure in spot markets on exchanges.
I checked BITB’s recently filed third-quarter 10-Q. The SEC filing shows 8.39 million shares issued and 5.19 million redeemed from July through September, for a net quarterly increase of 3.20 million shares. But over the first nine months, 26.06 million shares were issued and 26.95 million redeemed, leaving a net decrease of 890,000 shares through the end of September. The improvement in the third quarter has not offset net redemptions in the first two quarters. BITB held about 37,926.1475 BTC as of September 30, compared with about 38,468.0468 BTC at the end of last year; creations, redemptions, and management fee payments can all change its BTC holdings. Bitwise’s website confirms that BITB invests directly in Bitcoin; its shares and BTC holdings are not the same as Strategy’s corporate holdings.
Looking only at the net increase in shares during the third quarter could lead to the conclusion that “institutions are continuing to buy.” Looking only at the November 6 outflows could just as easily lead to the claim that “long-term demand has reversed.” The former is based on financial results through September, while the latter is a single day of fund flows in November; the periods and coverage differ. We also need to look at flows across consecutive trading days and price structure. The latest Strategy holdings I can currently verify on the company’s website are 849,327 BTC as of November 2; social media hints are no substitute for formal disclosures.
The market has not made a strong breakout yet: BTC/USDT on Binance is around $75,978, down about 0.17% from $76,106.56 over the rolling 24-hour period, with a high of $76,249.99 and a low of $75,571.08. The price is holding above $75,000, but that is not enough to prove that fund outflows have been absorbed. On October 28, the Federal Reserve held its target interest rate range at 3.75% to 4.00%. The next round of macroeconomic data could still change risk appetite; neither fund flows nor rate expectations follow a one-way causal formula.
I’m treating $76,250 as the short-term confirmation level and around $75,570 as the defense level. If the price regains and holds above $76,250, then retests it without breaking below, that would suggest buyers have at least absorbed the recent range high. If it breaks below $75,570 and fails to recover, I’ll shift today’s cautious stance to a more defensive one. Other developments that would invalidate my view include ETF flow data turning positive across consecutive trading days, a material issuer disclosure, or Strategy formally disclosing new holdings. Until evidence emerges, I won’t present speculation as fact.
If I were trading this myself, I would stay out for now, remain directionally neutral, and hold a 0% position. Only if BTC spot holds above $76,250 and confirms the level on a retest, while fund flows in the next round do not continue to deteriorate, would I use at most 0.5% of total capital to test a long position, without leverage. The first target would be around $77,000, where I would take half off; I’d look to exit the remainder around $78,000 or if the price spikes on heavy volume and then reverses. After entry, I’d stop out if the price falls back below $75,700. If it first breaks below $75,570, I’d cancel the long plan and stay out. I’d also exit the test position if fund outflows expand significantly. An untriggered plan has resulted in neither a trade nor a profit.
#BitcoinETFsSee$412MNetOutflows #BTC
The above is solely my personal market observation and does not constitute investment advice.

3

·
--
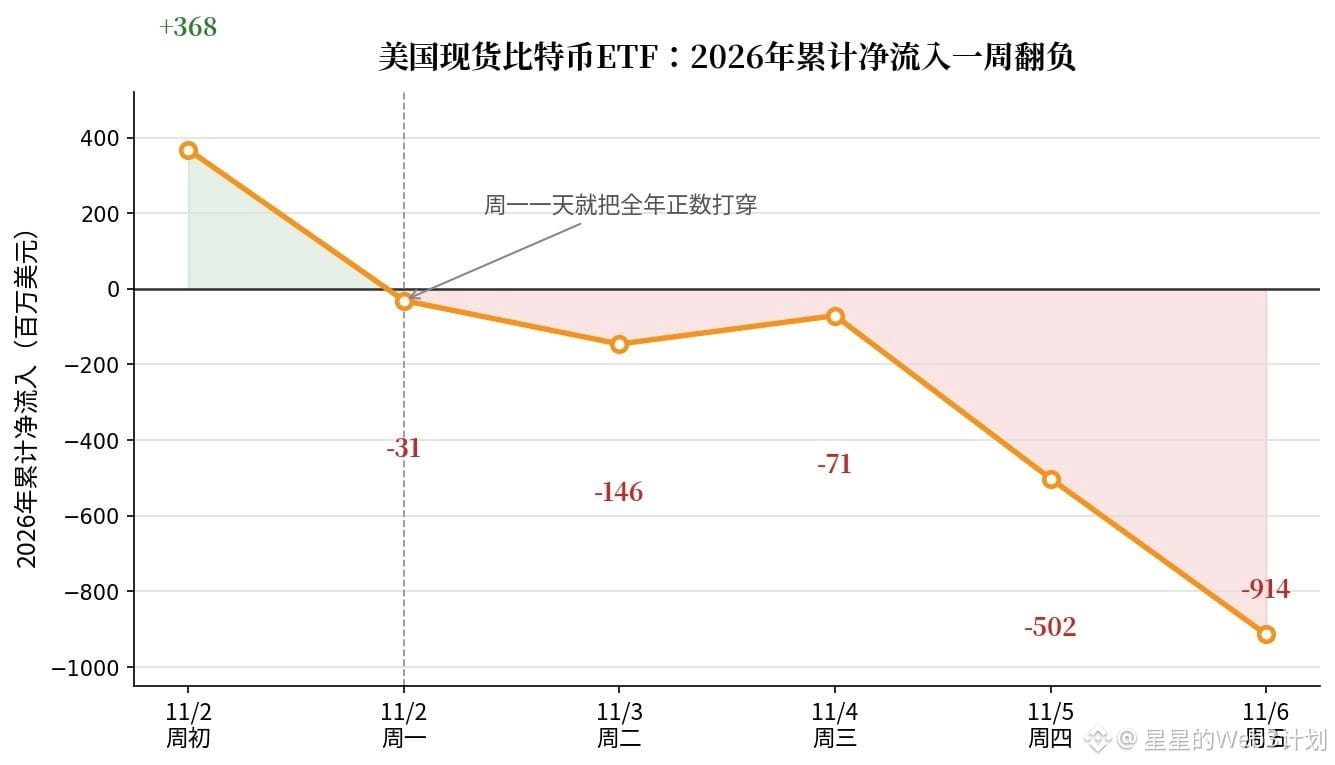
$1.28 billion gone in one week; Bitcoin ETFs turn negative for the year: -$914 million.
U.S. spot Bitcoin ETFs saw net outflows of $1.28 billion last week, their worst week since June. At the start of the week, year-to-date flows were still positive at $368 million. Monday’s $399 million outflow alone wiped out that gain, and by Friday, the year-to-date total had settled at -$914 million.
BlackRock’s IBIT alone accounted for $1.21 billion of the week’s outflows, including $403 million on Friday. Ethereum ETFs weren’t spared either: they posted outflows for the sixth straight week, with $365 million leaving this week.
Bitcoin is now hovering around $75,800. It opened Monday at $78,232, and needs to rise more than 3% by Sunday to avoid a fifth consecutive weekly loss. Over five weeks, it has slid from $87,000 to $76,500, a drop of about 12%. A fifth straight weekly loss would tie the third-longest streak on record—only an eight-week losing streak in 2022 and a six-week streak early this year were longer.
My take: This isn’t a panic-driven sell-off. Institutions are repricing rate-hike expectations after the midterm elections. Money is flowing out, but Bitcoin’s price hasn’t collapsed, suggesting spot buyers are still stepping in. The real test is Tuesday’s CPI report. If the data is unfavorable, expectations for a December rate hike will come under renewed pressure, and ETF outflows will only accelerate.
Invalidation level: If ETFs see net inflows of more than $300 million on the day after the CPI release and Bitcoin climbs back above $78,232, then this was just a shakeout.
Pick one: After Tuesday’s CPI report, do you think ETF money will flow back in or keep heading out?
$BTC $ETH
#BitcoinETFsSee$412MNetOutflows #CPITestsDecemberRateOutlook
$1.28 billion gone in one week; Bitcoin ETFs turn negative for the year: -$914 million.
U.S. spot Bitcoin ETFs saw net outflows of $1.28 billion last week, their worst week since June. At the start of the week, year-to-date flows were still positive at $368 million. Monday’s $399 million outflow alone wiped out that gain, and by Friday, the year-to-date total had settled at -$914 million.
BlackRock’s IBIT alone accounted for $1.21 billion of the week’s outflows, including $403 million on Friday. Ethereum ETFs weren’t spared either: they posted outflows for the sixth straight week, with $365 million leaving this week.
Bitcoin is now hovering around $75,800. It opened Monday at $78,232, and needs to rise more than 3% by Sunday to avoid a fifth consecutive weekly loss. Over five weeks, it has slid from $87,000 to $76,500, a drop of about 12%. A fifth straight weekly loss would tie the third-longest streak on record—only an eight-week losing streak in 2022 and a six-week streak early this year were longer.
My take: This isn’t a panic-driven sell-off. Institutions are repricing rate-hike expectations after the midterm elections. Money is flowing out, but Bitcoin’s price hasn’t collapsed, suggesting spot buyers are still stepping in. The real test is Tuesday’s CPI report. If the data is unfavorable, expectations for a December rate hike will come under renewed pressure, and ETF outflows will only accelerate.
Invalidation level: If ETFs see net inflows of more than $300 million on the day after the CPI release and Bitcoin climbs back above $78,232, then this was just a shakeout.
Pick one: After Tuesday’s CPI report, do you think ETF money will flow back in or keep heading out?
$BTC $ETH
#BitcoinETFsSee$412MNetOutflows #CPITestsDecemberRateOutlook
U.S. spot Bitcoin ETFs saw net outflows of $1.28 billion last week, their worst week since June. At the start of the week, year-to-date flows were still positive at $368 million. Monday’s $399 million outflow alone wiped out that gain, and by Friday, the year-to-date total had settled at -$914 million.
BlackRock’s IBIT alone accounted for $1.21 billion of the week’s outflows, including $403 million on Friday. Ethereum ETFs weren’t spared either: they posted outflows for the sixth straight week, with $365 million leaving this week.
Bitcoin is now hovering around $75,800. It opened Monday at $78,232, and needs to rise more than 3% by Sunday to avoid a fifth consecutive weekly loss. Over five weeks, it has slid from $87,000 to $76,500, a drop of about 12%. A fifth straight weekly loss would tie the third-longest streak on record—only an eight-week losing streak in 2022 and a six-week streak early this year were longer.
My take: This isn’t a panic-driven sell-off. Institutions are repricing rate-hike expectations after the midterm elections. Money is flowing out, but Bitcoin’s price hasn’t collapsed, suggesting spot buyers are still stepping in. The real test is Tuesday’s CPI report. If the data is unfavorable, expectations for a December rate hike will come under renewed pressure, and ETF outflows will only accelerate.
Invalidation level: If ETFs see net inflows of more than $300 million on the day after the CPI release and Bitcoin climbs back above $78,232, then this was just a shakeout.
Pick one: After Tuesday’s CPI report, do you think ETF money will flow back in or keep heading out?
$BTC $ETH
#BitcoinETFsSee$412MNetOutflows #CPITestsDecemberRateOutlook
39
·
--
IBIT’s quarterly report shows net creations in Q3|But Friday saw a large single-day outflow|Wait for confirmation at $75,800 BTC
My stance is cautious. The Q3 10-Q for the iShares Bitcoin Trust ETF, recently disclosed by the U.S. SEC, shows that IBIT shares outstanding rose from 1.29604 billion at the end of June to 1.41476 billion at the end of September. During the quarter, 187.48 million shares were created and 68.76 million were redeemed, for a net increase of 118.72 million. The fund’s net assets rose from approximately $43.386 billion to $67.031 billion, an increase of 54.5%, but the filing says the main driver was an approximately 41.62% rise in Bitcoin’s valuation, with the increase in shares also contributing. The entire increase in net assets cannot be attributed to net inflows, much less described as new buying in November.
The exact topic being discussed on Square is #BitcoinETFsSee$412MNetOutflows. Farside’s fund-by-fund flow table puts total net outflows from U.S. BTC funds on November 6 at approximately $411.9 million, including about $403 million in outflows from IBIT. That trading day and IBIT’s quarterly report through the end of September cover different time periods: the former indicates that risk appetite is under pressure now, while the latter shows that the product expanded in size during the previous quarter. Both can be true at the same time. IBIT accounting for most of the single-day outflows does not mean all funds sold in unison; according to Farside’s table, other products saw both inflows and outflows. Only after the next trading day’s figures are updated will there be enough information to judge whether a sustained withdrawal is underway.
Changes in ETF shares affect creations and redemptions, as well as the underlying BTC allocation, and may feed through to spot demand. But quarterly net assets combine the effects of price changes, and Farside’s dollar-denominated flows are not the same as tick-by-tick selling pressure on exchanges. U.S. equity ETFs are closed over the weekend while Binance spot trading continues, so weekend BTC price movements cannot be attributed to “continued ETF outflows right now.” Strategy’s website news list shows no announcement of a new purchase this week, so speculation about corporate accumulation is not counted as confirmed demand for now.
BTC/USDT on Binance was trading around $75,809.99 at approximately 08:28 Beijing time on November 8, down about 0.17% over the rolling 24 hours, with a high of $76,249.99 and a low of $75,571.08. The price is holding above $75,000 but has not yet broken convincingly above the upper level. I’m using $76,250 as the strength-confirmation level and $75,570 as the support level. If support gives way and the price fails to reclaim it on a rebound, I’ll drop my bullish bias; even if it breaks higher, I’ll still check the ETF flows on the next trading day.
If I were trading this myself, I’d stay out for now and only consider a leveraged-free spot long. I’d enter with 0.5% of my total capital only if two consecutive one-hour candles close above $76,250, the price holds above $76,000 on a retest, and trading volume is higher than the average for the same hours over the past 24 hours. I’d take half off at the first target of $77,000, then sell half of the remaining position at the second target of $78,200. The initial stop-loss would be below $75,480. If a one-hour candle closes back below $76,000 after entry, or ETF outflows widen further on the next trading day while price breaks below support, I’d close the entire remaining position. If price breaks below $75,570 first, the plan is canceled; if it heads straight to $77,000 without triggering an entry, I won’t chase it.
Sources: SEC IBIT Q3 10-Q; Farside U.S. BTC ETF flow table; iShares product page; Binance BTC/USDT spot market data; Strategy website news list. #BitcoinETFsSee$412MNetOutflows #BTC
The above is solely my personal market observation and does not constitute investment advice.
IBIT’s quarterly report shows net creations in Q3|But Friday saw a large single-day outflow|Wait for confirmation at $75,800 BTC
My stance is cautious. The Q3 10-Q for the iShares Bitcoin Trust ETF, recently disclosed by the U.S. SEC, shows that IBIT shares outstanding rose from 1.29604 billion at the end of June to 1.41476 billion at the end of September. During the quarter, 187.48 million shares were created and 68.76 million were redeemed, for a net increase of 118.72 million. The fund’s net assets rose from approximately $43.386 billion to $67.031 billion, an increase of 54.5%, but the filing says the main driver was an approximately 41.62% rise in Bitcoin’s valuation, with the increase in shares also contributing. The entire increase in net assets cannot be attributed to net inflows, much less described as new buying in November.
The exact topic being discussed on Square is #BitcoinETFsSee$412MNetOutflows. Farside’s fund-by-fund flow table puts total net outflows from U.S. BTC funds on November 6 at approximately $411.9 million, including about $403 million in outflows from IBIT. That trading day and IBIT’s quarterly report through the end of September cover different time periods: the former indicates that risk appetite is under pressure now, while the latter shows that the product expanded in size during the previous quarter. Both can be true at the same time. IBIT accounting for most of the single-day outflows does not mean all funds sold in unison; according to Farside’s table, other products saw both inflows and outflows. Only after the next trading day’s figures are updated will there be enough information to judge whether a sustained withdrawal is underway.
Changes in ETF shares affect creations and redemptions, as well as the underlying BTC allocation, and may feed through to spot demand. But quarterly net assets combine the effects of price changes, and Farside’s dollar-denominated flows are not the same as tick-by-tick selling pressure on exchanges. U.S. equity ETFs are closed over the weekend while Binance spot trading continues, so weekend BTC price movements cannot be attributed to “continued ETF outflows right now.” Strategy’s website news list shows no announcement of a new purchase this week, so speculation about corporate accumulation is not counted as confirmed demand for now.
BTC/USDT on Binance was trading around $75,809.99 at approximately 08:28 Beijing time on November 8, down about 0.17% over the rolling 24 hours, with a high of $76,249.99 and a low of $75,571.08. The price is holding above $75,000 but has not yet broken convincingly above the upper level. I’m using $76,250 as the strength-confirmation level and $75,570 as the support level. If support gives way and the price fails to reclaim it on a rebound, I’ll drop my bullish bias; even if it breaks higher, I’ll still check the ETF flows on the next trading day.
If I were trading this myself, I’d stay out for now and only consider a leveraged-free spot long. I’d enter with 0.5% of my total capital only if two consecutive one-hour candles close above $76,250, the price holds above $76,000 on a retest, and trading volume is higher than the average for the same hours over the past 24 hours. I’d take half off at the first target of $77,000, then sell half of the remaining position at the second target of $78,200. The initial stop-loss would be below $75,480. If a one-hour candle closes back below $76,000 after entry, or ETF outflows widen further on the next trading day while price breaks below support, I’d close the entire remaining position. If price breaks below $75,570 first, the plan is canceled; if it heads straight to $77,000 without triggering an entry, I won’t chase it.
Sources: SEC IBIT Q3 10-Q; Farside U.S. BTC ETF flow table; iShares product page; Binance BTC/USDT spot market data; Strategy website news list. #BitcoinETFsSee$412MNetOutflows #BTC
The above is solely my personal market observation and does not constitute investment advice.
My stance is cautious. The Q3 10-Q for the iShares Bitcoin Trust ETF, recently disclosed by the U.S. SEC, shows that IBIT shares outstanding rose from 1.29604 billion at the end of June to 1.41476 billion at the end of September. During the quarter, 187.48 million shares were created and 68.76 million were redeemed, for a net increase of 118.72 million. The fund’s net assets rose from approximately $43.386 billion to $67.031 billion, an increase of 54.5%, but the filing says the main driver was an approximately 41.62% rise in Bitcoin’s valuation, with the increase in shares also contributing. The entire increase in net assets cannot be attributed to net inflows, much less described as new buying in November.
The exact topic being discussed on Square is #BitcoinETFsSee$412MNetOutflows. Farside’s fund-by-fund flow table puts total net outflows from U.S. BTC funds on November 6 at approximately $411.9 million, including about $403 million in outflows from IBIT. That trading day and IBIT’s quarterly report through the end of September cover different time periods: the former indicates that risk appetite is under pressure now, while the latter shows that the product expanded in size during the previous quarter. Both can be true at the same time. IBIT accounting for most of the single-day outflows does not mean all funds sold in unison; according to Farside’s table, other products saw both inflows and outflows. Only after the next trading day’s figures are updated will there be enough information to judge whether a sustained withdrawal is underway.
Changes in ETF shares affect creations and redemptions, as well as the underlying BTC allocation, and may feed through to spot demand. But quarterly net assets combine the effects of price changes, and Farside’s dollar-denominated flows are not the same as tick-by-tick selling pressure on exchanges. U.S. equity ETFs are closed over the weekend while Binance spot trading continues, so weekend BTC price movements cannot be attributed to “continued ETF outflows right now.” Strategy’s website news list shows no announcement of a new purchase this week, so speculation about corporate accumulation is not counted as confirmed demand for now.
BTC/USDT on Binance was trading around $75,809.99 at approximately 08:28 Beijing time on November 8, down about 0.17% over the rolling 24 hours, with a high of $76,249.99 and a low of $75,571.08. The price is holding above $75,000 but has not yet broken convincingly above the upper level. I’m using $76,250 as the strength-confirmation level and $75,570 as the support level. If support gives way and the price fails to reclaim it on a rebound, I’ll drop my bullish bias; even if it breaks higher, I’ll still check the ETF flows on the next trading day.
If I were trading this myself, I’d stay out for now and only consider a leveraged-free spot long. I’d enter with 0.5% of my total capital only if two consecutive one-hour candles close above $76,250, the price holds above $76,000 on a retest, and trading volume is higher than the average for the same hours over the past 24 hours. I’d take half off at the first target of $77,000, then sell half of the remaining position at the second target of $78,200. The initial stop-loss would be below $75,480. If a one-hour candle closes back below $76,000 after entry, or ETF outflows widen further on the next trading day while price breaks below support, I’d close the entire remaining position. If price breaks below $75,570 first, the plan is canceled; if it heads straight to $77,000 without triggering an entry, I won’t chase it.
Sources: SEC IBIT Q3 10-Q; Farside U.S. BTC ETF flow table; iShares product page; Binance BTC/USDT spot market data; Strategy website news list. #BitcoinETFsSee$412MNetOutflows #BTC
The above is solely my personal market observation and does not constitute investment advice.

BTC+2.18%
IBITETF-4.95%
56
·
--
BTC fund’s old quarterly report and Friday outflows coexist | Still range-bound near 75,800 | I’ll wait for confirmation
My stance is to respect the timing gap in fund data and not use one historical quarterly report as the sole explanation for today’s decline. Binance Square’s trending topics included the exact hashtag “#BitcoinETFsSee$412MNetOutflows”. Farside’s fund-by-fund table shows that U.S. Bitcoin funds saw total net outflows of $411.9 million on November 6, including $403 million in net outflows from IBIT; the Grayscale Bitcoin Mini Trust (ticker BTC) showed zero for that day. Meanwhile, the SEC recently made public the Grayscale mini fund’s 10-Q for the quarter ended September 30: shares increased from about 122.75 million to about 142.72 million in the third quarter, a net increase of 19.97 million shares; at the end of September, it held about 63,087 bitcoins. Grayscale’s website also confirms that “BTC” is the ticker for this mini fund, and it should not be confused with the spot price of Bitcoin or with GBTC.
What is really worth discussing is the scope of the figures: the increase in this fund’s shares in the third quarter reflects historical flows from July through September; the market-wide outflow on November 6 is a snapshot from a single, more recent trading day. Both can be true at once. They are not contradictory, nor do they mean that holdings at the end of September have remained unchanged through today. Changes in fund shares, the amount of BTC held by a fund, and the dollar value of BTC are also different metrics. An increase in quarterly assets on the books could come from subscriptions, price changes, or both; to assess new demand, I pay more attention to share counts and daily creations and redemptions over the same period than to dollar asset values alone. If multiple products continue to see outflows, marginal demand will weaken, but ETF data cannot be equated directly with net selling across the entire market that day.
Price action has not delivered a strong breakout in response to this information. At around 06:58 Beijing time, BTC/USDT on Binance was about $75,785, with a rolling 24-hour open of $75,942, a high of $76,250, and a low of $75,571—down about 0.2%. I view the area around $75,570 as a short-term support level to watch, and $76,250 as the intraday high to overcome; if price breaks below the low and cannot reclaim it, the rebound thesis is invalidated. A break above $76,250 followed by a quick pullback would not constitute reliable evidence of returning fund inflows either. Another trending Square topic, “Bitcoin rebounds to 75K,” may indicate interest, but hashtag popularity is no substitute for verifying spot trading activity and fund net flows.
If I were trading this myself, I would stay on the sidelines for now and consider only unleveraged spot longs. I would enter a test position using 0.5% of total capital only if price moves above $76,250, holds on a retest, and the next complete fund-flow disclosure does not show outflows widening further. My first target would be $77,000, where I would take half off; the second target would be $78,000, where I would close the rest in stages. I would stop out if price fell below $75,570 after entry. I would also exit early if price rose on weak volume or if multiple funds continued to see consecutive outflows. If these conditions are not met, I’ll hold cash rather than portraying September fund holdings as new buying today.
Sources: SEC 10-Q for Grayscale Bitcoin Mini Trust; Grayscale fund website; Farside fund-by-fund flows; Binance BTC/USDT market data. #BitcoinETFsSee$412MNetOutflows #BTC
This is solely my personal market observation and does not constitute investment advice.
BTC fund’s old quarterly report and Friday outflows coexist | Still range-bound near 75,800 | I’ll wait for confirmation
My stance is to respect the timing gap in fund data and not use one historical quarterly report as the sole explanation for today’s decline. Binance Square’s trending topics included the exact hashtag “#BitcoinETFsSee$412MNetOutflows”. Farside’s fund-by-fund table shows that U.S. Bitcoin funds saw total net outflows of $411.9 million on November 6, including $403 million in net outflows from IBIT; the Grayscale Bitcoin Mini Trust (ticker BTC) showed zero for that day. Meanwhile, the SEC recently made public the Grayscale mini fund’s 10-Q for the quarter ended September 30: shares increased from about 122.75 million to about 142.72 million in the third quarter, a net increase of 19.97 million shares; at the end of September, it held about 63,087 bitcoins. Grayscale’s website also confirms that “BTC” is the ticker for this mini fund, and it should not be confused with the spot price of Bitcoin or with GBTC.
What is really worth discussing is the scope of the figures: the increase in this fund’s shares in the third quarter reflects historical flows from July through September; the market-wide outflow on November 6 is a snapshot from a single, more recent trading day. Both can be true at once. They are not contradictory, nor do they mean that holdings at the end of September have remained unchanged through today. Changes in fund shares, the amount of BTC held by a fund, and the dollar value of BTC are also different metrics. An increase in quarterly assets on the books could come from subscriptions, price changes, or both; to assess new demand, I pay more attention to share counts and daily creations and redemptions over the same period than to dollar asset values alone. If multiple products continue to see outflows, marginal demand will weaken, but ETF data cannot be equated directly with net selling across the entire market that day.
Price action has not delivered a strong breakout in response to this information. At around 06:58 Beijing time, BTC/USDT on Binance was about $75,785, with a rolling 24-hour open of $75,942, a high of $76,250, and a low of $75,571—down about 0.2%. I view the area around $75,570 as a short-term support level to watch, and $76,250 as the intraday high to overcome; if price breaks below the low and cannot reclaim it, the rebound thesis is invalidated. A break above $76,250 followed by a quick pullback would not constitute reliable evidence of returning fund inflows either. Another trending Square topic, “Bitcoin rebounds to 75K,” may indicate interest, but hashtag popularity is no substitute for verifying spot trading activity and fund net flows.
If I were trading this myself, I would stay on the sidelines for now and consider only unleveraged spot longs. I would enter a test position using 0.5% of total capital only if price moves above $76,250, holds on a retest, and the next complete fund-flow disclosure does not show outflows widening further. My first target would be $77,000, where I would take half off; the second target would be $78,000, where I would close the rest in stages. I would stop out if price fell below $75,570 after entry. I would also exit early if price rose on weak volume or if multiple funds continued to see consecutive outflows. If these conditions are not met, I’ll hold cash rather than portraying September fund holdings as new buying today.
Sources: SEC 10-Q for Grayscale Bitcoin Mini Trust; Grayscale fund website; Farside fund-by-fund flows; Binance BTC/USDT market data. #BitcoinETFsSee$412MNetOutflows #BTC
This is solely my personal market observation and does not constitute investment advice.
My stance is to respect the timing gap in fund data and not use one historical quarterly report as the sole explanation for today’s decline. Binance Square’s trending topics included the exact hashtag “#BitcoinETFsSee$412MNetOutflows”. Farside’s fund-by-fund table shows that U.S. Bitcoin funds saw total net outflows of $411.9 million on November 6, including $403 million in net outflows from IBIT; the Grayscale Bitcoin Mini Trust (ticker BTC) showed zero for that day. Meanwhile, the SEC recently made public the Grayscale mini fund’s 10-Q for the quarter ended September 30: shares increased from about 122.75 million to about 142.72 million in the third quarter, a net increase of 19.97 million shares; at the end of September, it held about 63,087 bitcoins. Grayscale’s website also confirms that “BTC” is the ticker for this mini fund, and it should not be confused with the spot price of Bitcoin or with GBTC.
What is really worth discussing is the scope of the figures: the increase in this fund’s shares in the third quarter reflects historical flows from July through September; the market-wide outflow on November 6 is a snapshot from a single, more recent trading day. Both can be true at once. They are not contradictory, nor do they mean that holdings at the end of September have remained unchanged through today. Changes in fund shares, the amount of BTC held by a fund, and the dollar value of BTC are also different metrics. An increase in quarterly assets on the books could come from subscriptions, price changes, or both; to assess new demand, I pay more attention to share counts and daily creations and redemptions over the same period than to dollar asset values alone. If multiple products continue to see outflows, marginal demand will weaken, but ETF data cannot be equated directly with net selling across the entire market that day.
Price action has not delivered a strong breakout in response to this information. At around 06:58 Beijing time, BTC/USDT on Binance was about $75,785, with a rolling 24-hour open of $75,942, a high of $76,250, and a low of $75,571—down about 0.2%. I view the area around $75,570 as a short-term support level to watch, and $76,250 as the intraday high to overcome; if price breaks below the low and cannot reclaim it, the rebound thesis is invalidated. A break above $76,250 followed by a quick pullback would not constitute reliable evidence of returning fund inflows either. Another trending Square topic, “Bitcoin rebounds to 75K,” may indicate interest, but hashtag popularity is no substitute for verifying spot trading activity and fund net flows.
If I were trading this myself, I would stay on the sidelines for now and consider only unleveraged spot longs. I would enter a test position using 0.5% of total capital only if price moves above $76,250, holds on a retest, and the next complete fund-flow disclosure does not show outflows widening further. My first target would be $77,000, where I would take half off; the second target would be $78,000, where I would close the rest in stages. I would stop out if price fell below $75,570 after entry. I would also exit early if price rose on weak volume or if multiple funds continued to see consecutive outflows. If these conditions are not met, I’ll hold cash rather than portraying September fund holdings as new buying today.
Sources: SEC 10-Q for Grayscale Bitcoin Mini Trust; Grayscale fund website; Farside fund-by-fund flows; Binance BTC/USDT market data. #BitcoinETFsSee$412MNetOutflows #BTC
This is solely my personal market observation and does not constitute investment advice.

1
·
--
Wall Street just sold $412M of Bitcoin in a single day — and the weekly tape looks worse.
Spot $BTC ETFs bled $412M on Nov 6, with IBIT alone losing $403M, taking the week's total to about $1.28B. Four of the five sessions ran red, and 2026 net flows have now flipped negative.
Yet $BTC is holding near $76,000, flat on the day. Long-term buyers are quietly on the other side: Strive added 15,124 BTC in October, and Kazakhstan's central bank put $90M into Bitcoin ETFs. If the selling slows, $75,500 holds and a relief bounce is on the table; if outflows keep coming, $69,000 is the next line in the sand. Which side are you on — the sellers, or the steady buyers?
#BitcoinETFsSee$412MNetOutflows #Bitcoin #CryptoContent
Wall Street just sold $412M of Bitcoin in a single day — and the weekly tape looks worse.
Spot $BTC ETFs bled $412M on Nov 6, with IBIT alone losing $403M, taking the week's total to about $1.28B. Four of the five sessions ran red, and 2026 net flows have now flipped negative.
Yet $BTC is holding near $76,000, flat on the day. Long-term buyers are quietly on the other side: Strive added 15,124 BTC in October, and Kazakhstan's central bank put $90M into Bitcoin ETFs. If the selling slows, $75,500 holds and a relief bounce is on the table; if outflows keep coming, $69,000 is the next line in the sand. Which side are you on — the sellers, or the steady buyers?
#BitcoinETFsSee$412MNetOutflows #Bitcoin #CryptoContent
Spot $BTC ETFs bled $412M on Nov 6, with IBIT alone losing $403M, taking the week's total to about $1.28B. Four of the five sessions ran red, and 2026 net flows have now flipped negative.
Yet $BTC is holding near $76,000, flat on the day. Long-term buyers are quietly on the other side: Strive added 15,124 BTC in October, and Kazakhstan's central bank put $90M into Bitcoin ETFs. If the selling slows, $75,500 holds and a relief bounce is on the table; if outflows keep coming, $69,000 is the next line in the sand. Which side are you on — the sellers, or the steady buyers?
#BitcoinETFsSee$412MNetOutflows #Bitcoin #CryptoContent
7
·
--
#BitcoinETFsSee$412MNetOutflows
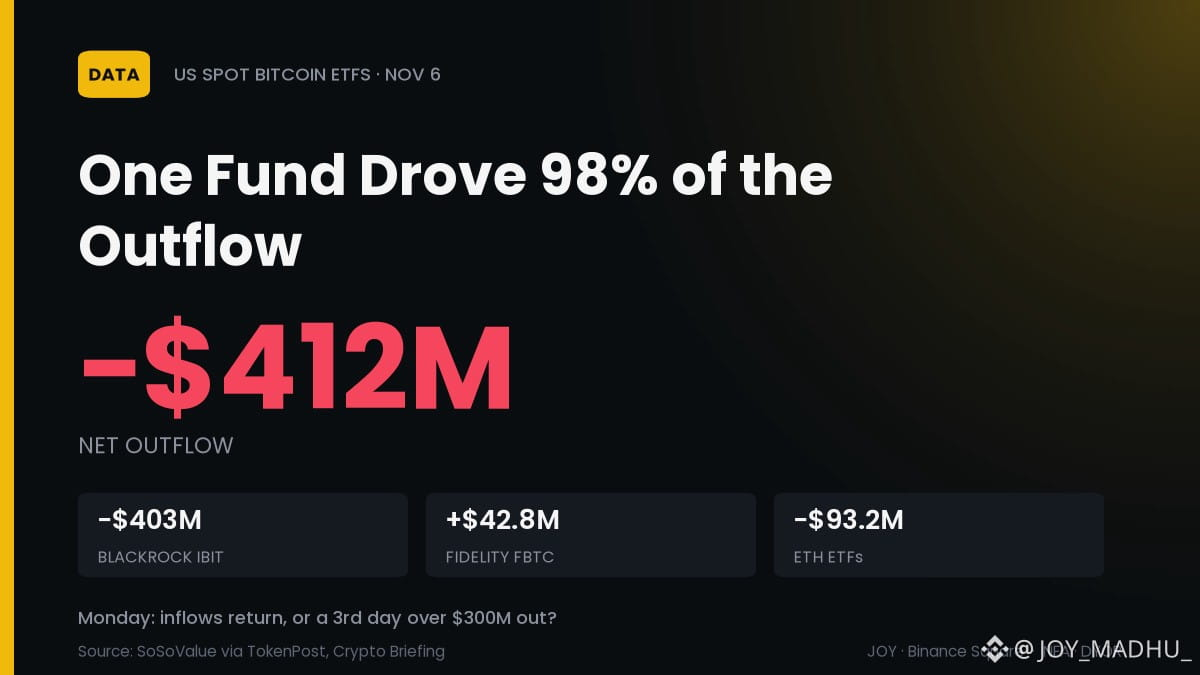
🔍 IBIT Lost $403M. Fidelity Quietly Took In $42.8M.
US spot Bitcoin ETFs bled $412M on Nov 6, a second straight day of exits, and one fund drove almost all of it.
📉 $411.9M net outflow on Nov 6 (SoSoValue)
🏦 BlackRock IBIT: -$403M, about 98% of the total
📈 Fidelity FBTC: +$42.8M, the only fund with inflows
📅 Nov 5 outflow was ~$430M; ETH ETFs also lost $93.2M on Nov 6
The catch: 2026 BTC ETF flows are now ~-$502M YTD, a dent against ~$96.65B in assets, not a broad exit.
Monday's session: inflows return, or a 3rd straight day over $300M out? 👇
$BTC $ETH
#BitcoinETFsSee$412MNetOutflows #BitcoinETF #Bitcoin
#BitcoinETFsSee$412MNetOutflows
🔍 IBIT Lost $403M. Fidelity Quietly Took In $42.8M.
US spot Bitcoin ETFs bled $412M on Nov 6, a second straight day of exits, and one fund drove almost all of it.
📉 $411.9M net outflow on Nov 6 (SoSoValue)
🏦 BlackRock IBIT: -$403M, about 98% of the total
📈 Fidelity FBTC: +$42.8M, the only fund with inflows
📅 Nov 5 outflow was ~$430M; ETH ETFs also lost $93.2M on Nov 6
The catch: 2026 BTC ETF flows are now ~-$502M YTD, a dent against ~$96.65B in assets, not a broad exit.
Monday's session: inflows return, or a 3rd straight day over $300M out? 👇
$BTC $ETH
#BitcoinETFsSee$412MNetOutflows #BitcoinETF #Bitcoin
🔍 IBIT Lost $403M. Fidelity Quietly Took In $42.8M.
US spot Bitcoin ETFs bled $412M on Nov 6, a second straight day of exits, and one fund drove almost all of it.
📉 $411.9M net outflow on Nov 6 (SoSoValue)
🏦 BlackRock IBIT: -$403M, about 98% of the total
📈 Fidelity FBTC: +$42.8M, the only fund with inflows
📅 Nov 5 outflow was ~$430M; ETH ETFs also lost $93.2M on Nov 6
The catch: 2026 BTC ETF flows are now ~-$502M YTD, a dent against ~$96.65B in assets, not a broad exit.
Monday's session: inflows return, or a 3rd straight day over $300M out? 👇
$BTC $ETH
#BitcoinETFsSee$412MNetOutflows #BitcoinETF #Bitcoin
4
·
--
Bitcoin funds see two days of net outflows | Price still holds above $75,000 | I’m watching to see whether the divergence continues
My stance is to watch BTC cautiously and not chase this rebound. Binance Square has a relevant trending topic, #BitcoinETFsSee$412MNetOutflows, and BTC also appeared in Most Searched over the past six hours, but it was not labeled a Rapid Riser. This topic is directly relevant to the market. The key is to view fund flows and spot prices together, rather than assume that $400 million in outflows means an equivalent amount of market sell orders right now. An earlier post reported that the missing November 6 data had been filled in; this time, I’m checking whether the pressure from two consecutive days of outflows has actually pushed the price lower.
Farside’s U.S. spot Bitcoin fund table shows total net outflows of $430.2 million on November 5 and $411.9 million on November 6, for a combined total of about $842.1 million over the two days according to the table. On November 6, IBIT alone saw $403 million in outflows, while FBTC had net inflows of $42.8 million, showing that not all products moved in the same direction. The trending topic’s “$412 million” is a rounded figure for $411.9 million; it should not be counted as another outflow. The two-day total is also just a record of subscriptions and redemptions across two trading days. It does not mean redemptions continued at the same rate over the weekend, nor does it imply that BTC balances fell by the same amount.
Mechanically, net fund redemptions may affect BTC demand through the creation-and-redemption and market-making process, but prices are also influenced by spot buying, derivatives positioning, expectations for U.S. interest rates, and thinner liquidity over the weekend. On November 6, the U.S. Bureau of Labor Statistics reported that nonfarm payrolls rose by 165,000 in October; at its most recent meeting, the Federal Reserve maintained its interest-rate range at 3.75% to 4%. Market bets on a December rate hike are expectations, not a policy decision that has already been made. Strategy’s website news page has no new same-day purchase announcement, and social media hints cannot be used to offset confirmed fund outflows.
So far, the price has not followed the fund-flow figures below $75,000. At the time of checking, the latest BTC/USD trade on Kraken was about $75,989.80, with an open of $75,741.60, an intraday low of $75,692.60, and a high of $76,009.40. The rolling 24-hour low was $74,790 and the high was $76,258.10. The current price is slightly above the daily open, but has yet to break through the $76,258 upper bound. This is an observation of “weak fund flows, but some support for the price,” not a declaration that the pressure from outflows has disappeared. I view $76,010 to $76,260 as the confirmation zone, $75,690 as near-term support, and $74,790 as the more important level that would invalidate the rebound. If the price first breaks below $75,690 and fails to recover, the view that buyers are providing support will start to weaken; if it then loses $74,790, the risk signal from the two days of outflows deserves greater attention.
If I were trading this myself, I would not enter now. My directional bias would be a small long spot position only if conditions are met; my current position size is 0%. I would only place a test trade using no more than 0.35% of total capital, with no leverage, if BTC closes two consecutive one-hour candles above $76,260, holds $76,010 on a retest, and the latest fund table shows no larger revision. The first target is $76,800, where I would take half off; the second target is $77,500, where I would close the rest. If a one-hour candle closes below $75,690 after entry, I would exit the entire position at a loss. If the price breaks below $74,790 before entry, I would cancel the plan outright. If no trigger occurs, I will remain in cash; waiting is also a discipline.
#BitcoinETFsSee$412MNetOutflows #BTC
This is solely my personal market observation and does not constitute investment advice.
Bitcoin funds see two days of net outflows | Price still holds above $75,000 | I’m watching to see whether the divergence continues
My stance is to watch BTC cautiously and not chase this rebound. Binance Square has a relevant trending topic, #BitcoinETFsSee$412MNetOutflows, and BTC also appeared in Most Searched over the past six hours, but it was not labeled a Rapid Riser. This topic is directly relevant to the market. The key is to view fund flows and spot prices together, rather than assume that $400 million in outflows means an equivalent amount of market sell orders right now. An earlier post reported that the missing November 6 data had been filled in; this time, I’m checking whether the pressure from two consecutive days of outflows has actually pushed the price lower.
Farside’s U.S. spot Bitcoin fund table shows total net outflows of $430.2 million on November 5 and $411.9 million on November 6, for a combined total of about $842.1 million over the two days according to the table. On November 6, IBIT alone saw $403 million in outflows, while FBTC had net inflows of $42.8 million, showing that not all products moved in the same direction. The trending topic’s “$412 million” is a rounded figure for $411.9 million; it should not be counted as another outflow. The two-day total is also just a record of subscriptions and redemptions across two trading days. It does not mean redemptions continued at the same rate over the weekend, nor does it imply that BTC balances fell by the same amount.
Mechanically, net fund redemptions may affect BTC demand through the creation-and-redemption and market-making process, but prices are also influenced by spot buying, derivatives positioning, expectations for U.S. interest rates, and thinner liquidity over the weekend. On November 6, the U.S. Bureau of Labor Statistics reported that nonfarm payrolls rose by 165,000 in October; at its most recent meeting, the Federal Reserve maintained its interest-rate range at 3.75% to 4%. Market bets on a December rate hike are expectations, not a policy decision that has already been made. Strategy’s website news page has no new same-day purchase announcement, and social media hints cannot be used to offset confirmed fund outflows.
So far, the price has not followed the fund-flow figures below $75,000. At the time of checking, the latest BTC/USD trade on Kraken was about $75,989.80, with an open of $75,741.60, an intraday low of $75,692.60, and a high of $76,009.40. The rolling 24-hour low was $74,790 and the high was $76,258.10. The current price is slightly above the daily open, but has yet to break through the $76,258 upper bound. This is an observation of “weak fund flows, but some support for the price,” not a declaration that the pressure from outflows has disappeared. I view $76,010 to $76,260 as the confirmation zone, $75,690 as near-term support, and $74,790 as the more important level that would invalidate the rebound. If the price first breaks below $75,690 and fails to recover, the view that buyers are providing support will start to weaken; if it then loses $74,790, the risk signal from the two days of outflows deserves greater attention.
If I were trading this myself, I would not enter now. My directional bias would be a small long spot position only if conditions are met; my current position size is 0%. I would only place a test trade using no more than 0.35% of total capital, with no leverage, if BTC closes two consecutive one-hour candles above $76,260, holds $76,010 on a retest, and the latest fund table shows no larger revision. The first target is $76,800, where I would take half off; the second target is $77,500, where I would close the rest. If a one-hour candle closes below $75,690 after entry, I would exit the entire position at a loss. If the price breaks below $74,790 before entry, I would cancel the plan outright. If no trigger occurs, I will remain in cash; waiting is also a discipline.
#BitcoinETFsSee$412MNetOutflows #BTC
This is solely my personal market observation and does not constitute investment advice.
My stance is to watch BTC cautiously and not chase this rebound. Binance Square has a relevant trending topic, #BitcoinETFsSee$412MNetOutflows, and BTC also appeared in Most Searched over the past six hours, but it was not labeled a Rapid Riser. This topic is directly relevant to the market. The key is to view fund flows and spot prices together, rather than assume that $400 million in outflows means an equivalent amount of market sell orders right now. An earlier post reported that the missing November 6 data had been filled in; this time, I’m checking whether the pressure from two consecutive days of outflows has actually pushed the price lower.
Farside’s U.S. spot Bitcoin fund table shows total net outflows of $430.2 million on November 5 and $411.9 million on November 6, for a combined total of about $842.1 million over the two days according to the table. On November 6, IBIT alone saw $403 million in outflows, while FBTC had net inflows of $42.8 million, showing that not all products moved in the same direction. The trending topic’s “$412 million” is a rounded figure for $411.9 million; it should not be counted as another outflow. The two-day total is also just a record of subscriptions and redemptions across two trading days. It does not mean redemptions continued at the same rate over the weekend, nor does it imply that BTC balances fell by the same amount.
Mechanically, net fund redemptions may affect BTC demand through the creation-and-redemption and market-making process, but prices are also influenced by spot buying, derivatives positioning, expectations for U.S. interest rates, and thinner liquidity over the weekend. On November 6, the U.S. Bureau of Labor Statistics reported that nonfarm payrolls rose by 165,000 in October; at its most recent meeting, the Federal Reserve maintained its interest-rate range at 3.75% to 4%. Market bets on a December rate hike are expectations, not a policy decision that has already been made. Strategy’s website news page has no new same-day purchase announcement, and social media hints cannot be used to offset confirmed fund outflows.
So far, the price has not followed the fund-flow figures below $75,000. At the time of checking, the latest BTC/USD trade on Kraken was about $75,989.80, with an open of $75,741.60, an intraday low of $75,692.60, and a high of $76,009.40. The rolling 24-hour low was $74,790 and the high was $76,258.10. The current price is slightly above the daily open, but has yet to break through the $76,258 upper bound. This is an observation of “weak fund flows, but some support for the price,” not a declaration that the pressure from outflows has disappeared. I view $76,010 to $76,260 as the confirmation zone, $75,690 as near-term support, and $74,790 as the more important level that would invalidate the rebound. If the price first breaks below $75,690 and fails to recover, the view that buyers are providing support will start to weaken; if it then loses $74,790, the risk signal from the two days of outflows deserves greater attention.
If I were trading this myself, I would not enter now. My directional bias would be a small long spot position only if conditions are met; my current position size is 0%. I would only place a test trade using no more than 0.35% of total capital, with no leverage, if BTC closes two consecutive one-hour candles above $76,260, holds $76,010 on a retest, and the latest fund table shows no larger revision. The first target is $76,800, where I would take half off; the second target is $77,500, where I would close the rest. If a one-hour candle closes below $75,690 after entry, I would exit the entire position at a loss. If the price breaks below $74,790 before entry, I would cancel the plan outright. If no trigger occurs, I will remain in cash; waiting is also a discipline.
#BitcoinETFsSee$412MNetOutflows #BTC
This is solely my personal market observation and does not constitute investment advice.

2
·
--
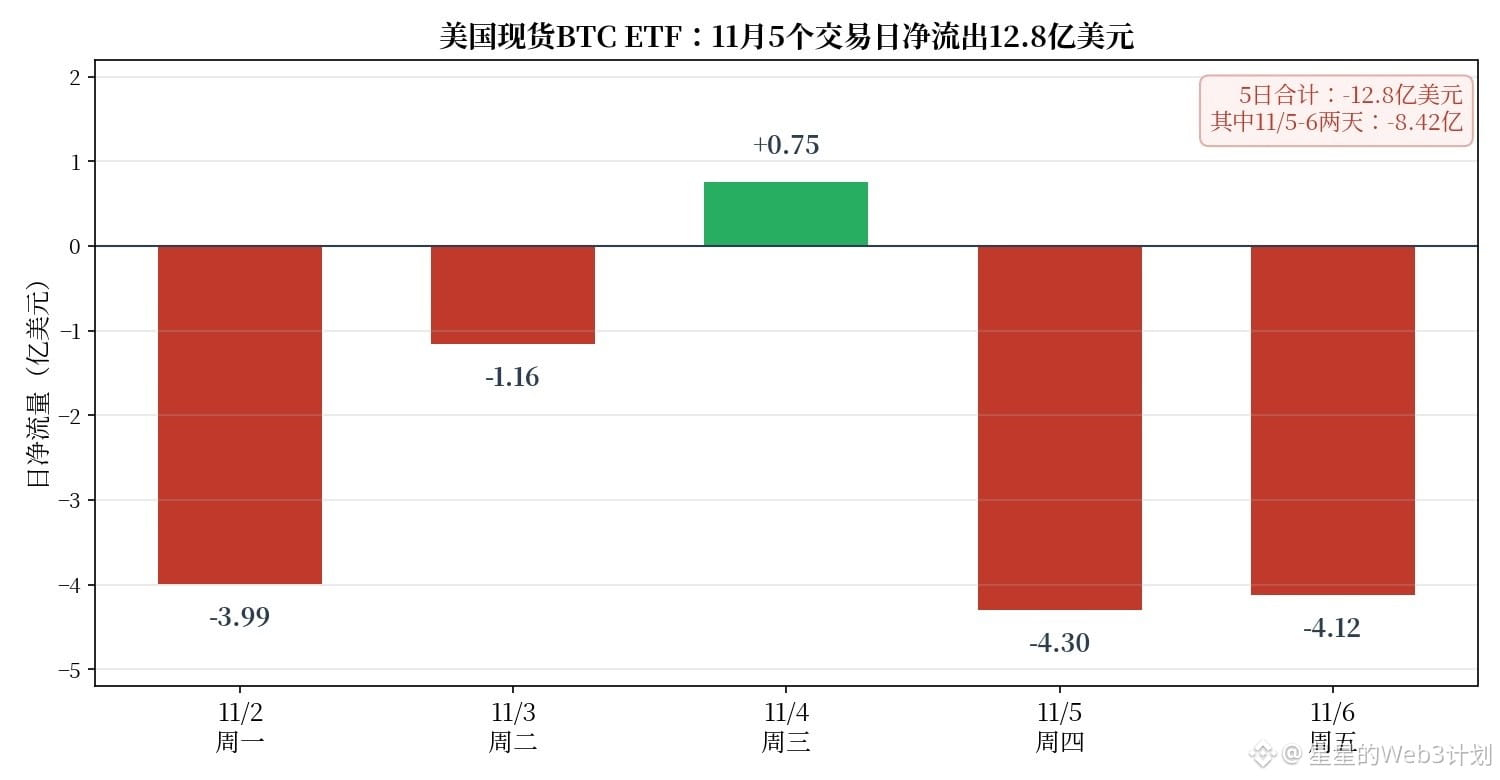
$412 million ran for the exits again, yet Bitcoin is still holding above $76,000—the ETF money is flowing out, but the price isn’t following. That’s the divergence worth watching most this weekend.
U.S. spot Bitcoin ETFs saw $412 million in net outflows on Friday, with BlackRock’s IBIT alone accounting for $403 million. Fidelity’s FBTC was the only fund to see inflows, bringing in $42.8 million for the day. Add Thursday’s $430 million, and the two-day total comes to $842 million in outflows. In the first five trading days of November, ETFs have already seen $1.28 billion in net outflows. Ethereum fared no better: $93.3 million flowed out on Friday, bringing its five-day total to $365 million.
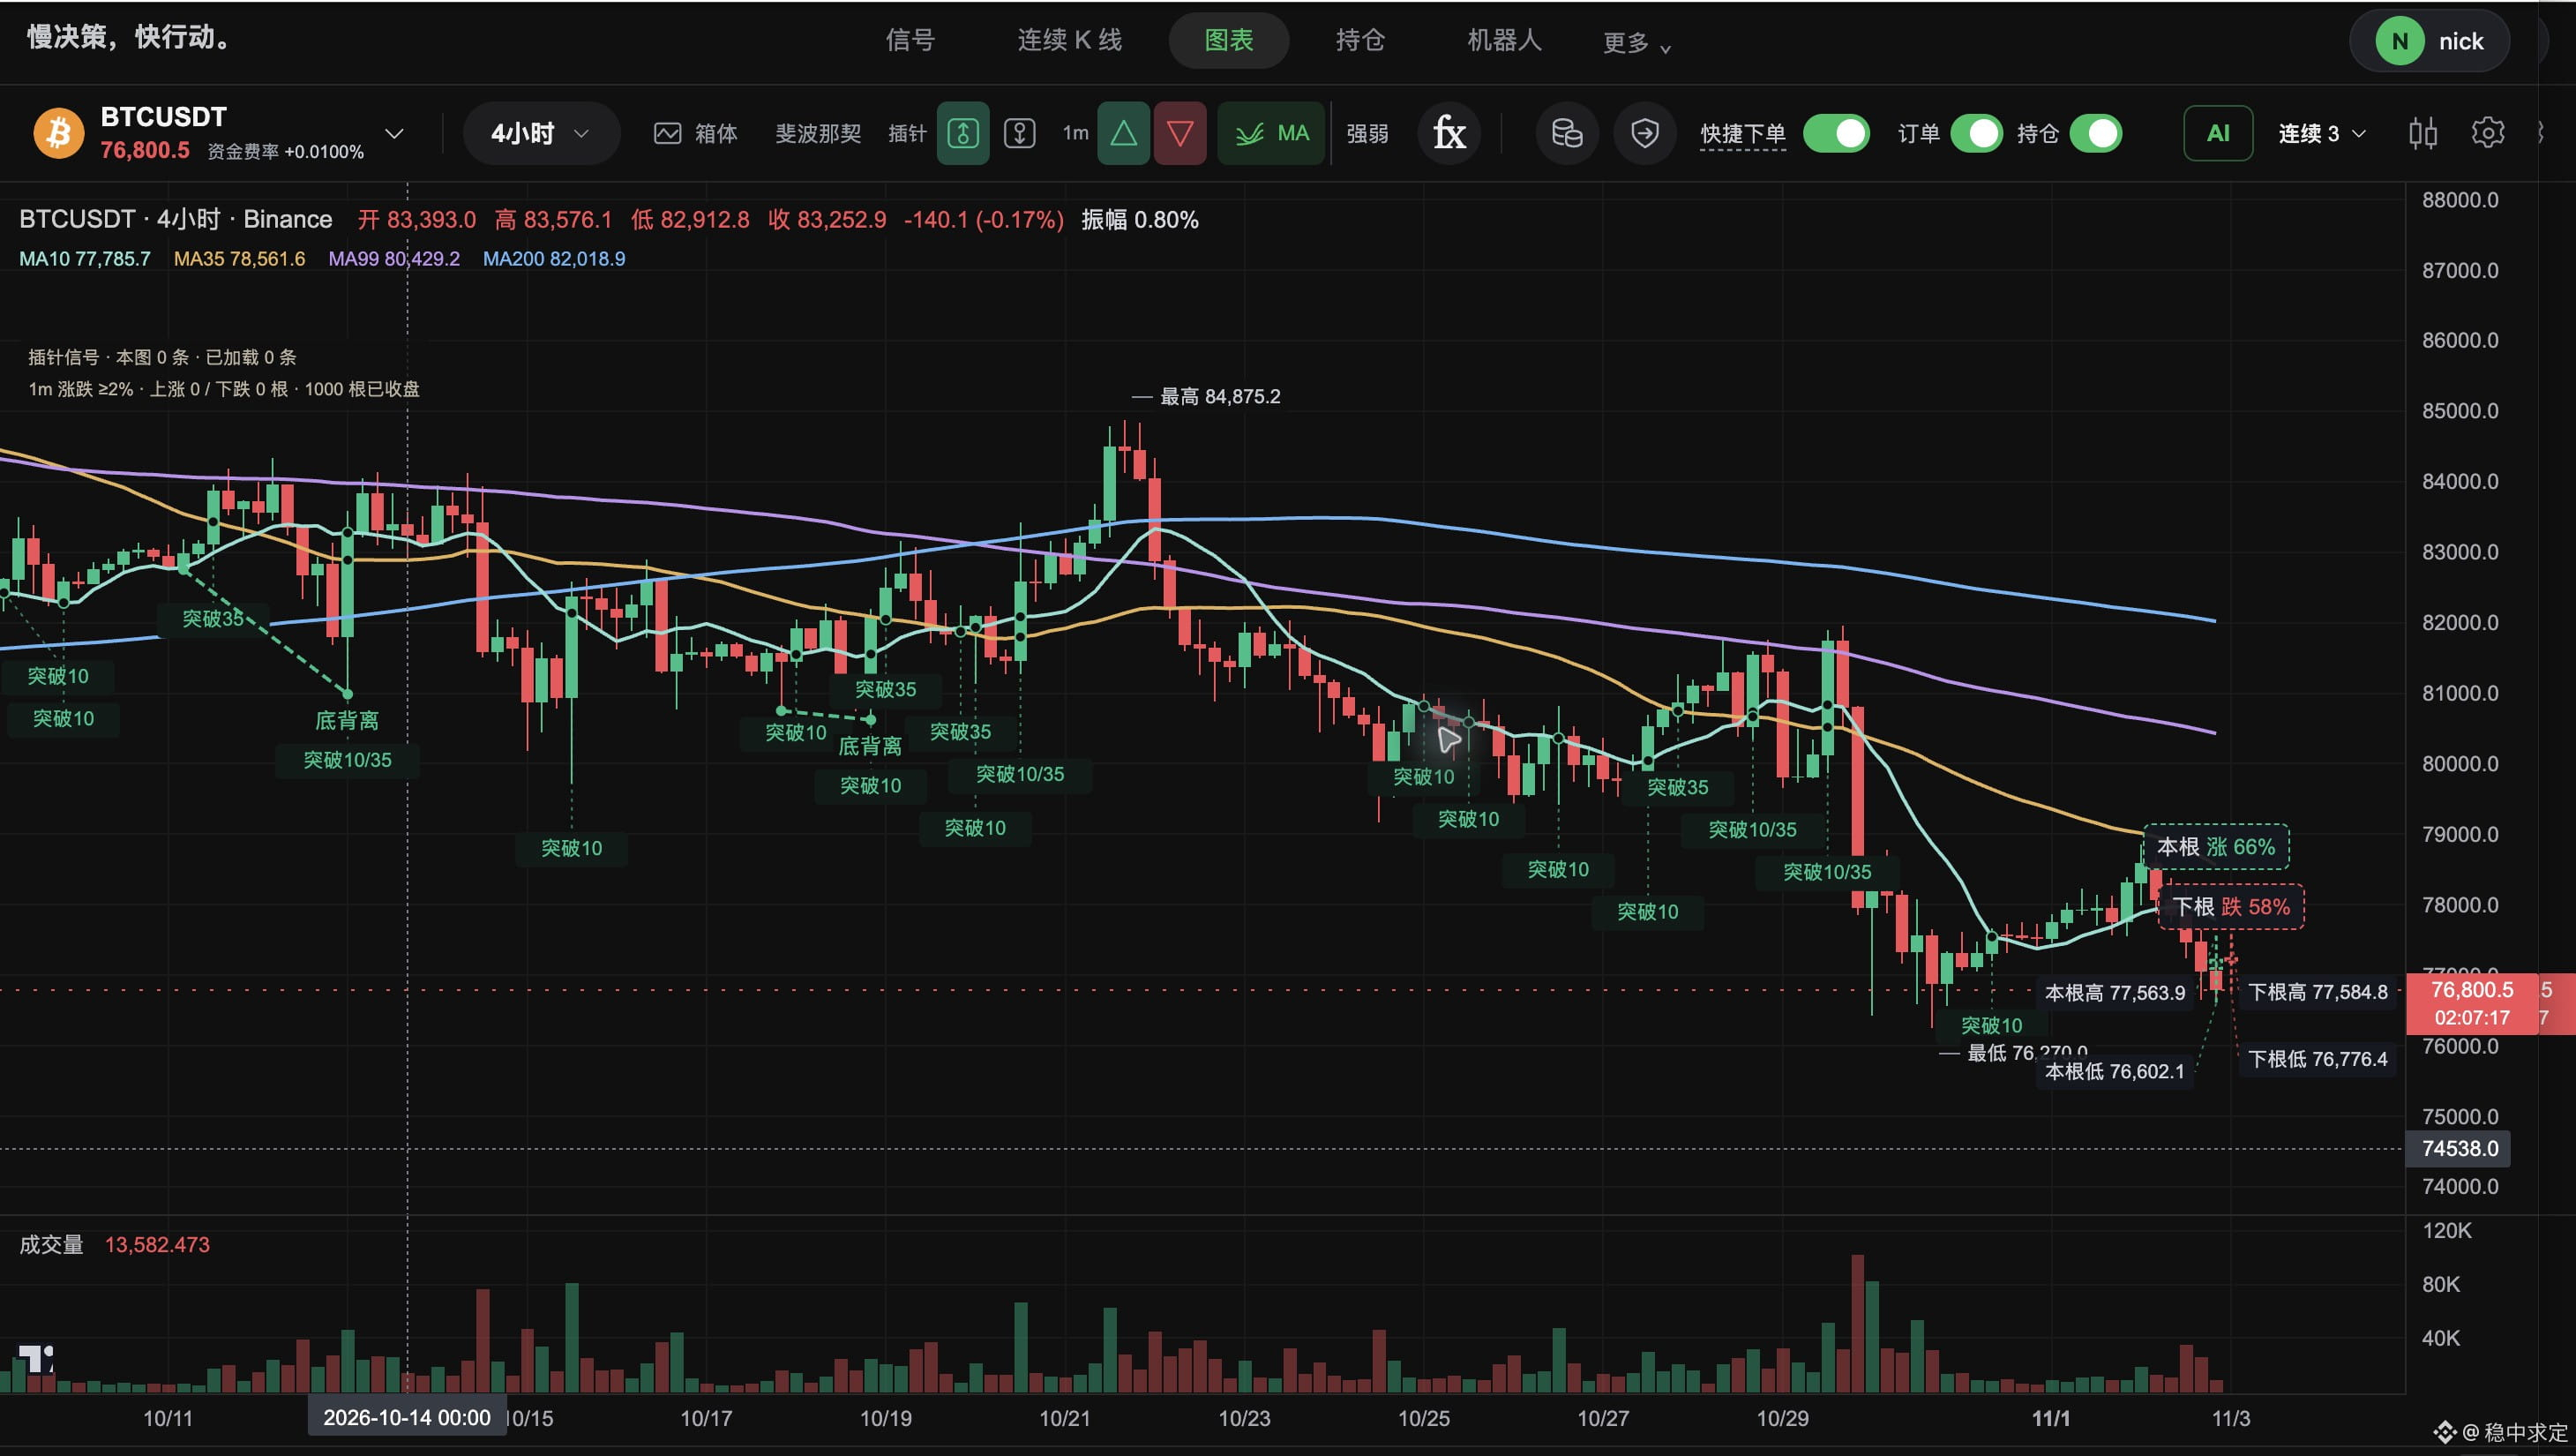
But prices haven’t followed suit: Bitcoin closed around $75,800 on Friday and is trading at about $76,000 on Saturday. It has held above $75,600, and the 50-week moving average at $75,559 hasn’t been breached either.
My take: This isn’t institutions buying the dip; spot buyers are absorbing ETF redemptions. Selling pressure is being digested, but the process isn’t over—the Fear and Greed Index at 25, signaling extreme fear, is proof. Invalidation level: if ETFs see more than $300 million in net outflows again on Monday and Bitcoin closes the day below $75,600, the dip-buying narrative is invalidated, with $73,000 next. Conversely, if ETF flows turn positive and Bitcoin reclaims $77,700, this week was just a shakeout.
Do you think ETFs will keep seeing outflows next Monday and push Bitcoin below $75,600, or will flows finally turn positive and help Bitcoin reclaim $77,700?
$BTC $ETH
#BitcoinETFsSee$412MNetOutflows #BitcoinRebounds$75KAsChipsLead
$412 million ran for the exits again, yet Bitcoin is still holding above $76,000—the ETF money is flowing out, but the price isn’t following. That’s the divergence worth watching most this weekend.
U.S. spot Bitcoin ETFs saw $412 million in net outflows on Friday, with BlackRock’s IBIT alone accounting for $403 million. Fidelity’s FBTC was the only fund to see inflows, bringing in $42.8 million for the day. Add Thursday’s $430 million, and the two-day total comes to $842 million in outflows. In the first five trading days of November, ETFs have already seen $1.28 billion in net outflows. Ethereum fared no better: $93.3 million flowed out on Friday, bringing its five-day total to $365 million.
But prices haven’t followed suit: Bitcoin closed around $75,800 on Friday and is trading at about $76,000 on Saturday. It has held above $75,600, and the 50-week moving average at $75,559 hasn’t been breached either.
My take: This isn’t institutions buying the dip; spot buyers are absorbing ETF redemptions. Selling pressure is being digested, but the process isn’t over—the Fear and Greed Index at 25, signaling extreme fear, is proof. Invalidation level: if ETFs see more than $300 million in net outflows again on Monday and Bitcoin closes the day below $75,600, the dip-buying narrative is invalidated, with $73,000 next. Conversely, if ETF flows turn positive and Bitcoin reclaims $77,700, this week was just a shakeout.
Do you think ETFs will keep seeing outflows next Monday and push Bitcoin below $75,600, or will flows finally turn positive and help Bitcoin reclaim $77,700?
$BTC $ETH
#BitcoinETFsSee$412MNetOutflows #BitcoinRebounds$75KAsChipsLead
U.S. spot Bitcoin ETFs saw $412 million in net outflows on Friday, with BlackRock’s IBIT alone accounting for $403 million. Fidelity’s FBTC was the only fund to see inflows, bringing in $42.8 million for the day. Add Thursday’s $430 million, and the two-day total comes to $842 million in outflows. In the first five trading days of November, ETFs have already seen $1.28 billion in net outflows. Ethereum fared no better: $93.3 million flowed out on Friday, bringing its five-day total to $365 million.
But prices haven’t followed suit: Bitcoin closed around $75,800 on Friday and is trading at about $76,000 on Saturday. It has held above $75,600, and the 50-week moving average at $75,559 hasn’t been breached either.
My take: This isn’t institutions buying the dip; spot buyers are absorbing ETF redemptions. Selling pressure is being digested, but the process isn’t over—the Fear and Greed Index at 25, signaling extreme fear, is proof. Invalidation level: if ETFs see more than $300 million in net outflows again on Monday and Bitcoin closes the day below $75,600, the dip-buying narrative is invalidated, with $73,000 next. Conversely, if ETF flows turn positive and Bitcoin reclaims $77,700, this week was just a shakeout.
Do you think ETFs will keep seeing outflows next Monday and push Bitcoin below $75,600, or will flows finally turn positive and help Bitcoin reclaim $77,700?
$BTC $ETH
#BitcoinETFsSee$412MNetOutflows #BitcoinRebounds$75KAsChipsLead
5

·
--
Article
$643 million in single-day outflows from spot Bitcoin ETFs: the alarm is escalating, but this is not “institutions abandoning Bitcoin for good”# $643 million in single-day outflows from spot Bitcoin ETFs: the alarm is escalating, but this is not “institutions abandoning Bitcoin for good”
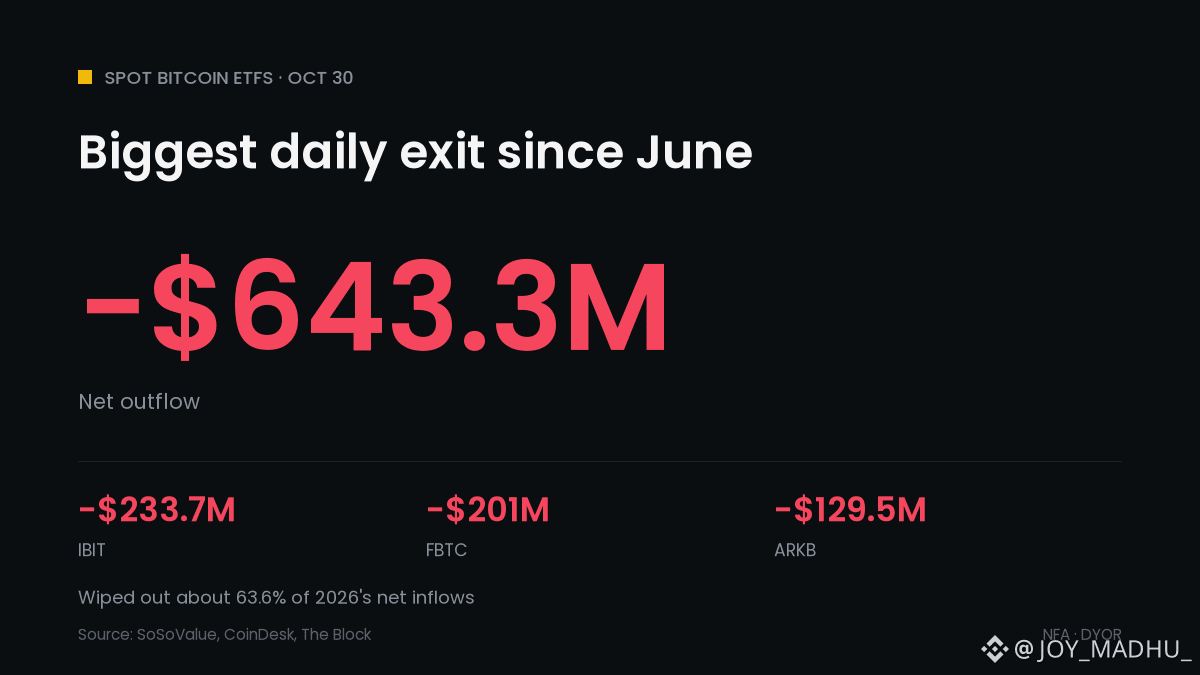
U.S. spot Bitcoin ETFs saw net outflows of about $643.2 million on October 30. According to a review of Farside’s publicly available historical data, this was the largest outflow since June 25. That figure is enough to prompt the market to reassess the quality of buying demand, but it describes a U.S. trading day that has already concluded. It cannot be directly translated into “institutions have permanently exited,” much less equated with ETF redemptions to spot sell orders on Binance.
## First, separate buzz from facts
At 05:53 Beijing time on November 3, the publicly available results on Binance Square’s trending page showed `#BitcoinETFsSee$643MOutflowLargestSinceJune` ranked fifth, with around 11 people discussing it. This level of buzz shows that the topic made it onto the platform’s visible trends, but buzz itself is not fund-flow data.
$643 million in single-day outflows from spot Bitcoin ETFs: the alarm is escalating, but this is not “institutions abandoning Bitcoin for good”
# $643 million in single-day outflows from spot Bitcoin ETFs: the alarm is escalating, but this is not “institutions abandoning Bitcoin for good”
U.S. spot Bitcoin ETFs saw net outflows of about $643.2 million on October 30. According to a review of Farside’s publicly available historical data, this was the largest outflow since June 25. That figure is enough to prompt the market to reassess the quality of buying demand, but it describes a U.S. trading day that has already concluded. It cannot be directly translated into “institutions have permanently exited,” much less equated with ETF redemptions to spot sell orders on Binance.
## First, separate buzz from facts
At 05:53 Beijing time on November 3, the publicly available results on Binance Square’s trending page showed `#BitcoinETFsSee$643MOutflowLargestSinceJune` ranked fifth, with around 11 people discussing it. This level of buzz shows that the topic made it onto the platform’s visible trends, but buzz itself is not fund-flow data.
U.S. spot Bitcoin ETFs saw net outflows of about $643.2 million on October 30. According to a review of Farside’s publicly available historical data, this was the largest outflow since June 25. That figure is enough to prompt the market to reassess the quality of buying demand, but it describes a U.S. trading day that has already concluded. It cannot be directly translated into “institutions have permanently exited,” much less equated with ETF redemptions to spot sell orders on Binance.
## First, separate buzz from facts
At 05:53 Beijing time on November 3, the publicly available results on Binance Square’s trending page showed `#BitcoinETFsSee$643MOutflowLargestSinceJune` ranked fifth, with around 11 people discussing it. This level of buzz shows that the topic made it onto the platform’s visible trends, but buzz itself is not fund-flow data.
4
·
--
#BitcoinETFsSee$643MOutflowLargestSinceJune
📉 Bitcoin ETFs Lose $643M in One Day, Most Since June
📅 Friday Oct 30: US spot Bitcoin ETFs saw $643.3M in net outflows (SoSoValue)
⚠️ Biggest single-day exit since June 25, when $696.3M left
📊 It wiped out about 63.6% of 2026's net inflows, which were just over $1B before Friday
🔻 BlackRock IBIT lost $233.7M, Fidelity FBTC about $201M, ARK ARKB $129.5M
🔍 The selling came a day after the $6B+ Binance hack
📉 Ether ETFs also shed $155.9M, their worst day since Oct 7
What it means for Bitcoin: US institutional demand is cooling, and a negative Coinbase premium points the same way. Next tests are the Nov 3 midterms and the Nov 6 jobs report.
Do ETF flows still lead $BTC, or has the market moved past them? 👇
$BTC $ETH
#CryptoNews #BitcoinETF #Bitcoin #BitcoinETFsSee$643MOutflowLargestSinceJune
#BitcoinETFsSee$643MOutflowLargestSinceJune
📉 Bitcoin ETFs Lose $643M in One Day, Most Since June
📅 Friday Oct 30: US spot Bitcoin ETFs saw $643.3M in net outflows (SoSoValue)
⚠️ Biggest single-day exit since June 25, when $696.3M left
📊 It wiped out about 63.6% of 2026's net inflows, which were just over $1B before Friday
🔻 BlackRock IBIT lost $233.7M, Fidelity FBTC about $201M, ARK ARKB $129.5M
🔍 The selling came a day after the $6B+ Binance hack
📉 Ether ETFs also shed $155.9M, their worst day since Oct 7
What it means for Bitcoin: US institutional demand is cooling, and a negative Coinbase premium points the same way. Next tests are the Nov 3 midterms and the Nov 6 jobs report.
Do ETF flows still lead $BTC , or has the market moved past them? 👇
$BTC $ETH
#CryptoNews #BitcoinETF #Bitcoin #BitcoinETFsSee$643MOutflowLargestSinceJune
📉 Bitcoin ETFs Lose $643M in One Day, Most Since June
📅 Friday Oct 30: US spot Bitcoin ETFs saw $643.3M in net outflows (SoSoValue)
⚠️ Biggest single-day exit since June 25, when $696.3M left
📊 It wiped out about 63.6% of 2026's net inflows, which were just over $1B before Friday
🔻 BlackRock IBIT lost $233.7M, Fidelity FBTC about $201M, ARK ARKB $129.5M
🔍 The selling came a day after the $6B+ Binance hack
📉 Ether ETFs also shed $155.9M, their worst day since Oct 7
What it means for Bitcoin: US institutional demand is cooling, and a negative Coinbase premium points the same way. Next tests are the Nov 3 midterms and the Nov 6 jobs report.
Do ETF flows still lead $BTC , or has the market moved past them? 👇
$BTC $ETH
#CryptoNews #BitcoinETF #Bitcoin #BitcoinETFsSee$643MOutflowLargestSinceJune
6

·
--
Let the data lead: $BTC 24 hours -0.01%, current price 78022.03 USDT.
📊 Data snapshot
· Current price: 78022.03 USDT
· 24h: -0.01%
· Range: 77602.72 — 78878.01
· Trading volume: 723223777.03 USDT
Don’t rush to conclusions. The data is right here—take a clear look first, then decide.
Are you keeping an eye on it? 👇
#市场观察 #BTC #Binance #BitcoinETFsSee$643MOutflowLargestSinceJune
Let the data lead: $BTC 24 hours -0.01%, current price 78022.03 USDT.
📊 Data snapshot
· Current price: 78022.03 USDT
· 24h: -0.01%
· Range: 77602.72 — 78878.01
· Trading volume: 723223777.03 USDT
Don’t rush to conclusions. The data is right here—take a clear look first, then decide.
Are you keeping an eye on it? 👇
#市场观察 #BTC #Binance #BitcoinETFsSee$643MOutflowLargestSinceJune
📊 Data snapshot
· Current price: 78022.03 USDT
· 24h: -0.01%
· Range: 77602.72 — 78878.01
· Trading volume: 723223777.03 USDT
Don’t rush to conclusions. The data is right here—take a clear look first, then decide.
Are you keeping an eye on it? 👇
#市场观察 #BTC #Binance #BitcoinETFsSee$643MOutflowLargestSinceJune

4
·
--
BTC ETF trending topic discusses $244M in outflows | October 9 data still blank | No rush to draw conclusions near $82.4K
My approach is to verify the data first, then discuss market direction. The exact topic being discussed on Binance Square is #BitcoinETFsSee$244MNetOutflows. Farside’s spot Bitcoin fund table shows total net outflows of about $244.1 million on October 8 and about $484.9 million on October 7; these are figures for historical trading days already listed. More importantly, when I checked the October 9 row just now, the fields for each fund still showed dashes, while the page’s automatic total displayed 0.0. That 0.0 does not mean ETFs actually had zero inflows and zero outflows today; it is a placeholder when data has not yet been reported. Writing that “fund flows have stabilized” based on it would mislead trading decisions. U.S. trading hours and fund reporting schedules differ from Beijing time, so we should at least wait for the individual figures to appear and be totaled before assessing institutional flows for the day.
There are also limits to how fund flows affect the market: sustained redemptions may reduce passive demand for spot exposure and weigh on sentiment, but daily flows do not capture all institutional trading, nor are they a mirror of every trade in the BTC spot order book. Market-maker hedging, changes in existing positions, and spot buying and selling on exchanges can all affect the immediate price. So two days of net outflows can be evidence of cooling risk appetite, but they do not, by themselves, imply that prices must fall next. Conversely, a temporary price rebound does not prove that ETF flows have turned positive.
The market’s actual reaction has been choppy. When I checked BTC/USD on Kraken, the latest trade was around $82,397, with a 24-hour open near $81,684, a high of about $83,463, and a low of about $81,543. The current price is above the open but has yet to reclaim the intraday high, suggesting neither buyers nor sellers have secured a firm confirmation. In the short term, I’m watching to see whether the price can convincingly reclaim around $83,460. Below that, I’m first watching $81,600–$81,540; if that level breaks, I’ll keep an eye on $80,500. If the complete October 9 ETF data later turns positive and BTC holds above $83,460, I may revise my cautious view upward. If the data continues to show net outflows and the price falls below $81,540, I’ll prioritize risk management. These are explicitly conditional scenarios; I’m not presuming that unknown data is either bullish or bearish.
If I were trading, I would stay out for now. I’m only considering a small spot position to test a long, and would never use leverage just because a topic is trending. I would enter in stages, using at most 2% of my total capital, only if the price moves above $83,460 on the hourly chart, holds above $83,000 on a retest, and ETF breakdown data is no longer blank. The first target would be $84,600, where I’d take half off; the second target would be $85,800, where I’d look to close the remainder. After entry, I’d reduce the position first if the price falls back to $82,500, and exit entirely if it drops below $81,600. If the price breaks below $81,540 before any of those entry conditions are met, I’ll cancel the long plan and wait on the sidelines for the next round of information. No trigger means no trade—and no profit to speak of.
Sources: Farside daily flow table for spot BTC funds; live BTC/USD market data from Kraken. #BitcoinETFsSee$244MNetOutflows #BTC
This is solely my personal market observation and does not constitute investment advice.
BTC ETF trending topic discusses $244M in outflows | October 9 data still blank | No rush to draw conclusions near $82.4K
My approach is to verify the data first, then discuss market direction. The exact topic being discussed on Binance Square is #BitcoinETFsSee$244MNetOutflows. Farside’s spot Bitcoin fund table shows total net outflows of about $244.1 million on October 8 and about $484.9 million on October 7; these are figures for historical trading days already listed. More importantly, when I checked the October 9 row just now, the fields for each fund still showed dashes, while the page’s automatic total displayed 0.0. That 0.0 does not mean ETFs actually had zero inflows and zero outflows today; it is a placeholder when data has not yet been reported. Writing that “fund flows have stabilized” based on it would mislead trading decisions. U.S. trading hours and fund reporting schedules differ from Beijing time, so we should at least wait for the individual figures to appear and be totaled before assessing institutional flows for the day.
There are also limits to how fund flows affect the market: sustained redemptions may reduce passive demand for spot exposure and weigh on sentiment, but daily flows do not capture all institutional trading, nor are they a mirror of every trade in the BTC spot order book. Market-maker hedging, changes in existing positions, and spot buying and selling on exchanges can all affect the immediate price. So two days of net outflows can be evidence of cooling risk appetite, but they do not, by themselves, imply that prices must fall next. Conversely, a temporary price rebound does not prove that ETF flows have turned positive.
The market’s actual reaction has been choppy. When I checked BTC/USD on Kraken, the latest trade was around $82,397, with a 24-hour open near $81,684, a high of about $83,463, and a low of about $81,543. The current price is above the open but has yet to reclaim the intraday high, suggesting neither buyers nor sellers have secured a firm confirmation. In the short term, I’m watching to see whether the price can convincingly reclaim around $83,460. Below that, I’m first watching $81,600–$81,540; if that level breaks, I’ll keep an eye on $80,500. If the complete October 9 ETF data later turns positive and BTC holds above $83,460, I may revise my cautious view upward. If the data continues to show net outflows and the price falls below $81,540, I’ll prioritize risk management. These are explicitly conditional scenarios; I’m not presuming that unknown data is either bullish or bearish.
If I were trading, I would stay out for now. I’m only considering a small spot position to test a long, and would never use leverage just because a topic is trending. I would enter in stages, using at most 2% of my total capital, only if the price moves above $83,460 on the hourly chart, holds above $83,000 on a retest, and ETF breakdown data is no longer blank. The first target would be $84,600, where I’d take half off; the second target would be $85,800, where I’d look to close the remainder. After entry, I’d reduce the position first if the price falls back to $82,500, and exit entirely if it drops below $81,600. If the price breaks below $81,540 before any of those entry conditions are met, I’ll cancel the long plan and wait on the sidelines for the next round of information. No trigger means no trade—and no profit to speak of.
Sources: Farside daily flow table for spot BTC funds; live BTC/USD market data from Kraken. #BitcoinETFsSee$244MNetOutflows #BTC
This is solely my personal market observation and does not constitute investment advice.
My approach is to verify the data first, then discuss market direction. The exact topic being discussed on Binance Square is #BitcoinETFsSee$244MNetOutflows. Farside’s spot Bitcoin fund table shows total net outflows of about $244.1 million on October 8 and about $484.9 million on October 7; these are figures for historical trading days already listed. More importantly, when I checked the October 9 row just now, the fields for each fund still showed dashes, while the page’s automatic total displayed 0.0. That 0.0 does not mean ETFs actually had zero inflows and zero outflows today; it is a placeholder when data has not yet been reported. Writing that “fund flows have stabilized” based on it would mislead trading decisions. U.S. trading hours and fund reporting schedules differ from Beijing time, so we should at least wait for the individual figures to appear and be totaled before assessing institutional flows for the day.
There are also limits to how fund flows affect the market: sustained redemptions may reduce passive demand for spot exposure and weigh on sentiment, but daily flows do not capture all institutional trading, nor are they a mirror of every trade in the BTC spot order book. Market-maker hedging, changes in existing positions, and spot buying and selling on exchanges can all affect the immediate price. So two days of net outflows can be evidence of cooling risk appetite, but they do not, by themselves, imply that prices must fall next. Conversely, a temporary price rebound does not prove that ETF flows have turned positive.
The market’s actual reaction has been choppy. When I checked BTC/USD on Kraken, the latest trade was around $82,397, with a 24-hour open near $81,684, a high of about $83,463, and a low of about $81,543. The current price is above the open but has yet to reclaim the intraday high, suggesting neither buyers nor sellers have secured a firm confirmation. In the short term, I’m watching to see whether the price can convincingly reclaim around $83,460. Below that, I’m first watching $81,600–$81,540; if that level breaks, I’ll keep an eye on $80,500. If the complete October 9 ETF data later turns positive and BTC holds above $83,460, I may revise my cautious view upward. If the data continues to show net outflows and the price falls below $81,540, I’ll prioritize risk management. These are explicitly conditional scenarios; I’m not presuming that unknown data is either bullish or bearish.
If I were trading, I would stay out for now. I’m only considering a small spot position to test a long, and would never use leverage just because a topic is trending. I would enter in stages, using at most 2% of my total capital, only if the price moves above $83,460 on the hourly chart, holds above $83,000 on a retest, and ETF breakdown data is no longer blank. The first target would be $84,600, where I’d take half off; the second target would be $85,800, where I’d look to close the remainder. After entry, I’d reduce the position first if the price falls back to $82,500, and exit entirely if it drops below $81,600. If the price breaks below $81,540 before any of those entry conditions are met, I’ll cancel the long plan and wait on the sidelines for the next round of information. No trigger means no trade—and no profit to speak of.
Sources: Farside daily flow table for spot BTC funds; live BTC/USD market data from Kraken. #BitcoinETFsSee$244MNetOutflows #BTC
This is solely my personal market observation and does not constitute investment advice.

43

·
--
Most of the $BTC accumulated through ETFs this year will never touch a hardware wallet.
You still see the inflow number, feel the FOMO, and buy the local top only to watch it retrace while you sit there frustrated. That exact feeling is what separated the 2021 survivors from everyone else.
Spot Bitcoin ETFs introduced a buyer that simply does not panic. They allocate, they rebalance, they keep absorbing coins that used to sit on exchanges waiting to be dumped. In previous cycles we had retail leverage and then a violent unwind. This time the structural bid is quieter and more persistent. Fear and Greed sitting at 56, Neutral, is usually when experienced traders start paying attention rather than when the crowd is already all-in.
The lag is what gets people. By the time the headlines hit, a portion of that demand has already been filled. $ETH often follows with a delay, and a lot of capital just parks in $USDT waiting for the next number instead of respecting the new supply sink.
The product changed. The greed cycle did not.
Where do you think this ETF bid takes $BTC from here?
#BitcoinETFsSee #BitcoinReboundsTo #BitcoinDipsBelow
Most of the $BTC accumulated through ETFs this year will never touch a hardware wallet.
You still see the inflow number, feel the FOMO, and buy the local top only to watch it retrace while you sit there frustrated. That exact feeling is what separated the 2021 survivors from everyone else.
Spot Bitcoin ETFs introduced a buyer that simply does not panic. They allocate, they rebalance, they keep absorbing coins that used to sit on exchanges waiting to be dumped. In previous cycles we had retail leverage and then a violent unwind. This time the structural bid is quieter and more persistent. Fear and Greed sitting at 56, Neutral, is usually when experienced traders start paying attention rather than when the crowd is already all-in.
The lag is what gets people. By the time the headlines hit, a portion of that demand has already been filled. $ETH often follows with a delay, and a lot of capital just parks in $USDT waiting for the next number instead of respecting the new supply sink.
The product changed. The greed cycle did not.
Where do you think this ETF bid takes $BTC from here?
#BitcoinETFsSee #BitcoinReboundsTo #BitcoinDipsBelow
You still see the inflow number, feel the FOMO, and buy the local top only to watch it retrace while you sit there frustrated. That exact feeling is what separated the 2021 survivors from everyone else.
Spot Bitcoin ETFs introduced a buyer that simply does not panic. They allocate, they rebalance, they keep absorbing coins that used to sit on exchanges waiting to be dumped. In previous cycles we had retail leverage and then a violent unwind. This time the structural bid is quieter and more persistent. Fear and Greed sitting at 56, Neutral, is usually when experienced traders start paying attention rather than when the crowd is already all-in.
The lag is what gets people. By the time the headlines hit, a portion of that demand has already been filled. $ETH often follows with a delay, and a lot of capital just parks in $USDT waiting for the next number instead of respecting the new supply sink.
The product changed. The greed cycle did not.
Where do you think this ETF bid takes $BTC from here?
#BitcoinETFsSee #BitcoinReboundsTo #BitcoinDipsBelow
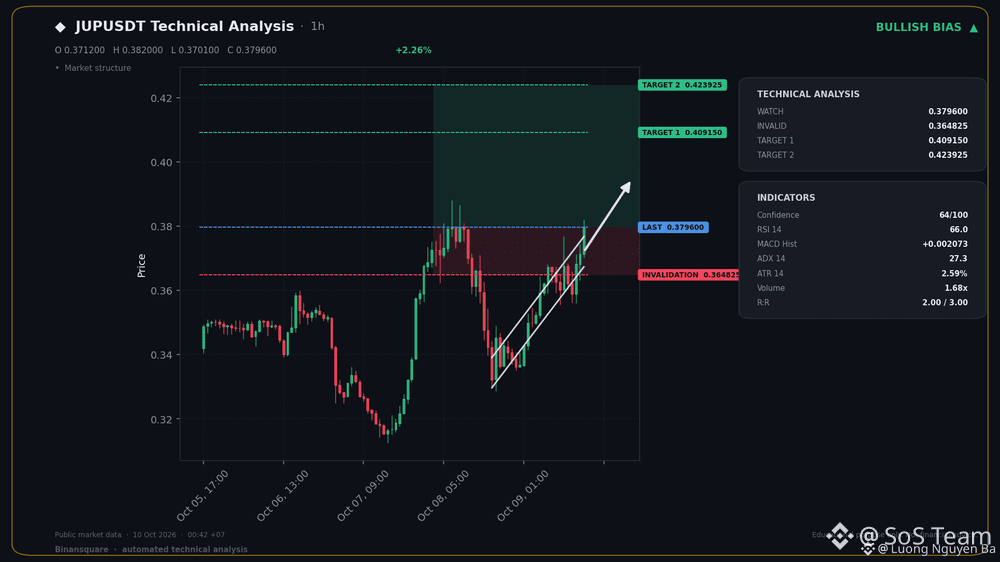
70
Log in to explore more content
Join global crypto users on Binance Square
⚡️ Get latest and useful information about crypto.
💬 Trusted by the world’s largest crypto exchange.
👍 Discover real insights from verified creators.
Email / Phone number
Trending Topics
1
#NvidiaLoses$2.7TrillionInMonthAndAHalf
21,076 views
135 Discussing
2
#CanBTCReboundAfterFallingBelow60K?
783,118 views
3,013 Discussing
3
#GlobalStocksFaceLongestLosingStreakSince2023
286,132 views
2,012 Discussing
4
#BlackRockIBITPostsRecord$541MSingleDayOutflow
34,435 views
101 Discussing
5
#AnthropicPlungesTowardIPOPriceonDay2
146,952 views
1,228 Discussing
6
#TwentyOneCapitalAdds172.25BTC
67,425 views
673 Discussing
7
#HKBillWouldExcludeTokenizedDepositsFromVirtualAssets
8,886 views
50 Discussing
8
#BNBDropsBelow540USDTWith8.46%DailyDecline
79,793 views
656 Discussing
9
#HKBillProposesHK$100KFineForUnauthorizedCryptoTitles
2,674 views
22 Discussing
10
#BitMineFaces$10.1BUnrealizedETHLoss
5,618 views
28 Discussing