
#bitcoinrecoversto
bitcoinrecoversto
1,627 views
63 Discussing
Hot
Latest

·
--
#BitcoinRecoversTo$82K
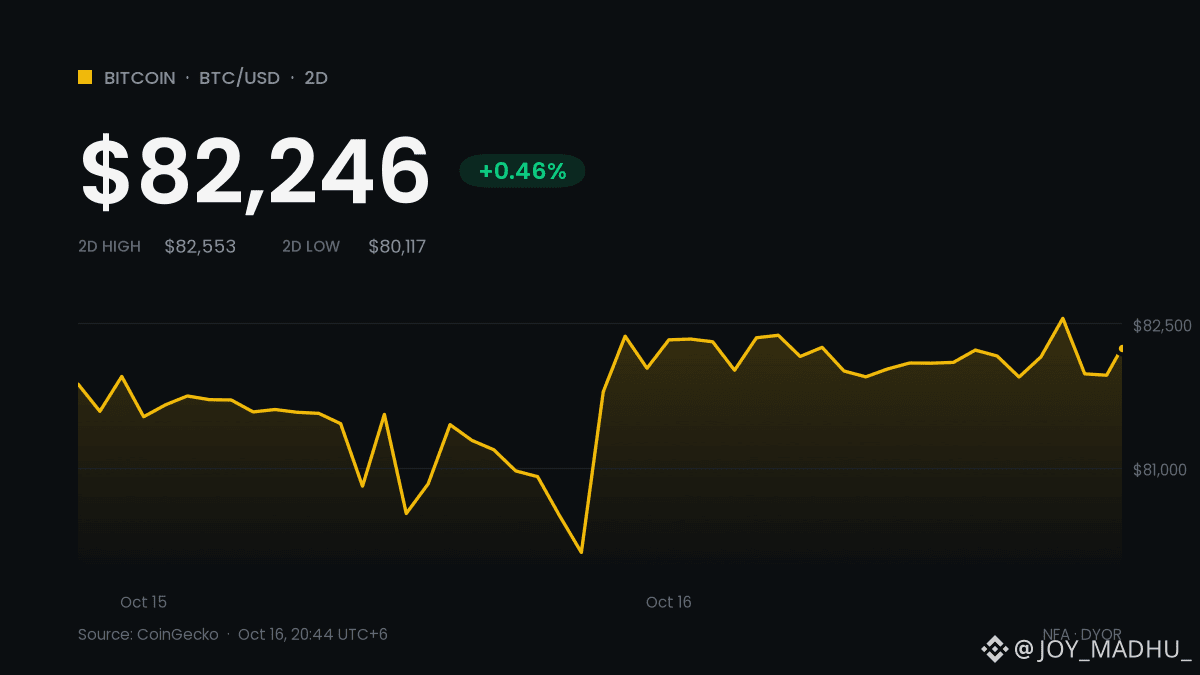
🟠 Bitcoin's Dip Under $80K Lasted Two Hours
📉 Hot US inflation data pushed $BTC to about $79,800, its weakest level in over three weeks
⚡ Buyers stepped in fast: BTC was back near $82,500 within two hours (CoinDesk)
💥 Close to $950M in leveraged positions were liquidated in the swing
📊 The trigger: September PPI at 6.3% y/y and CPI at 3.7%, both above forecasts
🇺🇸 Fed officials then cooled October hike bets, saying there's no urgency to act
🏦 Spot BTC ETFs: −$261M on Wednesday, a thin +$5M on Thursday
📅 BTC is still on track for a second losing week, about 35% below its $126K high
What it means for crypto: buyers are defending the $80K area, but ETF demand hasn't come back yet. Fresh ETF inflows and the Oct 27–28 FOMC are the next tests.
Is $80K a real floor, or just a pause? 👇
$BTC
#CryptoNews #BitcoinRecoversTo$82K #Bitcoin #FOMC
#BitcoinRecoversTo$82K
🟠 Bitcoin's Dip Under $80K Lasted Two Hours
📉 Hot US inflation data pushed $BTC to about $79,800, its weakest level in over three weeks
⚡ Buyers stepped in fast: BTC was back near $82,500 within two hours (CoinDesk)
💥 Close to $950M in leveraged positions were liquidated in the swing
📊 The trigger: September PPI at 6.3% y/y and CPI at 3.7%, both above forecasts
🇺🇸 Fed officials then cooled October hike bets, saying there's no urgency to act
🏦 Spot BTC ETFs: −$261M on Wednesday, a thin +$5M on Thursday
📅 BTC is still on track for a second losing week, about 35% below its $126K high
What it means for crypto: buyers are defending the $80K area, but ETF demand hasn't come back yet. Fresh ETF inflows and the Oct 27–28 FOMC are the next tests.
Is $80K a real floor, or just a pause? 👇
$BTC
#CryptoNews #BitcoinRecoversTo$82K #Bitcoin #FOMC
🟠 Bitcoin's Dip Under $80K Lasted Two Hours
📉 Hot US inflation data pushed $BTC to about $79,800, its weakest level in over three weeks
⚡ Buyers stepped in fast: BTC was back near $82,500 within two hours (CoinDesk)
💥 Close to $950M in leveraged positions were liquidated in the swing
📊 The trigger: September PPI at 6.3% y/y and CPI at 3.7%, both above forecasts
🇺🇸 Fed officials then cooled October hike bets, saying there's no urgency to act
🏦 Spot BTC ETFs: −$261M on Wednesday, a thin +$5M on Thursday
📅 BTC is still on track for a second losing week, about 35% below its $126K high
What it means for crypto: buyers are defending the $80K area, but ETF demand hasn't come back yet. Fresh ETF inflows and the Oct 27–28 FOMC are the next tests.
Is $80K a real floor, or just a pause? 👇
$BTC
#CryptoNews #BitcoinRecoversTo$82K #Bitcoin #FOMC
1

·
--
#BitcoinRecoversTo $64100 $BTC is showing fresh signs of strength as #Bitcoin recovers toward the $BITCOIN #64,100 level. This rebound is improving market confidence and bringing buyers back into focus. If momentum continues,#bitcoin.”
{alpha}(10x72e4f9f808c49a2a61de9c5896298920dc4eeea9)
traders may watch for the next key resistance while managing risk carefully. The crypto market remains active, so patience and smart decisions are essential. #BitcoinRecoversTo $6410 #Crypto #Binance #BTC
#BitcoinRecoversTo $64100 $BTC is showing fresh signs of strength as #Bitcoin recovers toward the $BITCOIN #64,100 level. This rebound is improving market confidence and bringing buyers back into focus. If momentum continues,#bitcoin.”
traders may watch for the next key resistance while managing risk carefully. The crypto market remains active, so patience and smart decisions are essential. #BitcoinRecoversTo $6410 #Crypto #Binance #BTC
traders may watch for the next key resistance while managing risk carefully. The crypto market remains active, so patience and smart decisions are essential. #BitcoinRecoversTo $6410 #Crypto #Binance #BTC

1
42

Behind every Bitcoin rally there is a key concept every trader should understand: **structural recovery**. When the price drops hard and then returns to previous levels, it isn't always a technical bounce; sometimes it's genuine reacumulation.
The difference lies in **volume and reaction**. A real recovery is accompanied by increasing volume on the rise and decreasing volume during pullbacks. If Bitcoin breaks a low with high volume and then quickly recovers without retesting it, the market is showing that level no longer has sellers willing to trade.
On the other hand, a false bounce rises on low volume, hits resistance quickly, and falls back with ease. Wyckoff called it "effort vs result": if price rises a little on a lot of volume, something doesn't add up; if it rises a lot on moderate but sustained volume, the demand is real.
Understanding this helps you distinguish a true trend reversal from a dead cat bounce. It’s not about guessing; it’s about reading the footprint left by order flow in each candle.
Follow us for more analysis without noise—just structure.
#BitcoinRecoversTo$64100
Behind every Bitcoin rally there is a key concept every trader should understand: **structural recovery**. When the price drops hard and then returns to previous levels, it isn't always a technical bounce; sometimes it's genuine reacumulation.
The difference lies in **volume and reaction**. A real recovery is accompanied by increasing volume on the rise and decreasing volume during pullbacks. If Bitcoin breaks a low with high volume and then quickly recovers without retesting it, the market is showing that level no longer has sellers willing to trade.
On the other hand, a false bounce rises on low volume, hits resistance quickly, and falls back with ease. Wyckoff called it "effort vs result": if price rises a little on a lot of volume, something doesn't add up; if it rises a lot on moderate but sustained volume, the demand is real.
Understanding this helps you distinguish a true trend reversal from a dead cat bounce. It’s not about guessing; it’s about reading the footprint left by order flow in each candle.
Follow us for more analysis without noise—just structure.
#BitcoinRecoversTo$64100
The difference lies in **volume and reaction**. A real recovery is accompanied by increasing volume on the rise and decreasing volume during pullbacks. If Bitcoin breaks a low with high volume and then quickly recovers without retesting it, the market is showing that level no longer has sellers willing to trade.
On the other hand, a false bounce rises on low volume, hits resistance quickly, and falls back with ease. Wyckoff called it "effort vs result": if price rises a little on a lot of volume, something doesn't add up; if it rises a lot on moderate but sustained volume, the demand is real.
Understanding this helps you distinguish a true trend reversal from a dead cat bounce. It’s not about guessing; it’s about reading the footprint left by order flow in each candle.
Follow us for more analysis without noise—just structure.
#BitcoinRecoversTo$64100
108

·
--
The dip below $80K was just a false alarm: $BTC proved in one night just how deep the bids at $80K were
That Thursday night, plenty of bears thought the trend was about to turn.
It started with U.S. September PPI rising 6.3% year over year, far above market expectations of 5.3%. Core PPI also came in hotter than expected, with the monthly increase reportedly the largest since March 2022. Combined with the previous day’s CPI reading of 3.7% year over year, also above expectations, fears of a Fed rate hike flared instantly. Bitcoin plunged that day, briefly falling below $80,000 to its lowest level since September 18.
But the breakdown was only an apparition. Order-flow data showed the heaviest bid wall in nearly a week clustered around $80,000. Less than two hours after it was swept, fresh large orders appeared just below $80,000. Buyers quickly pushed the price back above $82,000, with an intraday high near $82,600 and a 24-hour gain of about 1.6%.
The turnaround came from rate expectations. Fed officials struck a cautious tone, and the odds of rates holding steady in October reportedly climbed to 73%. Treasury yields fell and the dollar index weakened, temporarily easing pressure on risk assets.
But there’s no shortage of reasons for caution: on-chain order-book data shows that after this latest test, the bid wall below $80,000 has thinned—the next time it’s tested, there’ll be less of a cushion. And $84,000 is the next major resistance level; Wednesday’s rebound stalled around there. The more important variable is the October 28 FOMC meeting. PPI is the final major inflation reading before the meeting, and the market will parse every word from officials in the lead-up.
My take: This isn’t a trend reversal, but a technical recovery driven by “rate-expectation pricing.” Bulls defended the $80,000 threshold, but overhead selling pressure and inflation concerns haven’t gone away. We’ll have a better read on the direction after the Fed makes its decision on October 28.
This is not investment advice. DYOR. Trading involves risk.
#BitcoinRecoversTo$82K
#BTC #Fed
The dip below $80K was just a false alarm: $BTC proved in one night just how deep the bids at $80K were
That Thursday night, plenty of bears thought the trend was about to turn.
It started with U.S. September PPI rising 6.3% year over year, far above market expectations of 5.3%. Core PPI also came in hotter than expected, with the monthly increase reportedly the largest since March 2022. Combined with the previous day’s CPI reading of 3.7% year over year, also above expectations, fears of a Fed rate hike flared instantly. Bitcoin plunged that day, briefly falling below $80,000 to its lowest level since September 18.
But the breakdown was only an apparition. Order-flow data showed the heaviest bid wall in nearly a week clustered around $80,000. Less than two hours after it was swept, fresh large orders appeared just below $80,000. Buyers quickly pushed the price back above $82,000, with an intraday high near $82,600 and a 24-hour gain of about 1.6%.
The turnaround came from rate expectations. Fed officials struck a cautious tone, and the odds of rates holding steady in October reportedly climbed to 73%. Treasury yields fell and the dollar index weakened, temporarily easing pressure on risk assets.
But there’s no shortage of reasons for caution: on-chain order-book data shows that after this latest test, the bid wall below $80,000 has thinned—the next time it’s tested, there’ll be less of a cushion. And $84,000 is the next major resistance level; Wednesday’s rebound stalled around there. The more important variable is the October 28 FOMC meeting. PPI is the final major inflation reading before the meeting, and the market will parse every word from officials in the lead-up.
My take: This isn’t a trend reversal, but a technical recovery driven by “rate-expectation pricing.” Bulls defended the $80,000 threshold, but overhead selling pressure and inflation concerns haven’t gone away. We’ll have a better read on the direction after the Fed makes its decision on October 28.
This is not investment advice. DYOR. Trading involves risk.
#BitcoinRecoversTo$82K
#BTC #Fed
That Thursday night, plenty of bears thought the trend was about to turn.
It started with U.S. September PPI rising 6.3% year over year, far above market expectations of 5.3%. Core PPI also came in hotter than expected, with the monthly increase reportedly the largest since March 2022. Combined with the previous day’s CPI reading of 3.7% year over year, also above expectations, fears of a Fed rate hike flared instantly. Bitcoin plunged that day, briefly falling below $80,000 to its lowest level since September 18.
But the breakdown was only an apparition. Order-flow data showed the heaviest bid wall in nearly a week clustered around $80,000. Less than two hours after it was swept, fresh large orders appeared just below $80,000. Buyers quickly pushed the price back above $82,000, with an intraday high near $82,600 and a 24-hour gain of about 1.6%.
The turnaround came from rate expectations. Fed officials struck a cautious tone, and the odds of rates holding steady in October reportedly climbed to 73%. Treasury yields fell and the dollar index weakened, temporarily easing pressure on risk assets.
But there’s no shortage of reasons for caution: on-chain order-book data shows that after this latest test, the bid wall below $80,000 has thinned—the next time it’s tested, there’ll be less of a cushion. And $84,000 is the next major resistance level; Wednesday’s rebound stalled around there. The more important variable is the October 28 FOMC meeting. PPI is the final major inflation reading before the meeting, and the market will parse every word from officials in the lead-up.
My take: This isn’t a trend reversal, but a technical recovery driven by “rate-expectation pricing.” Bulls defended the $80,000 threshold, but overhead selling pressure and inflation concerns haven’t gone away. We’ll have a better read on the direction after the Fed makes its decision on October 28.
This is not investment advice. DYOR. Trading involves risk.
#BitcoinRecoversTo$82K
#BTC #Fed
7

Last week I watched someone dump their $BTC the second the chart turned green, calling it another fakeout before the candle even closed.
That hesitation is costing people real money. You either sell every bounce too early or chase it after the move is already priced in, and both habits end the same way.
This recovery is worth putting next to the 2022 and 2023 bounces, because those kept failing for the same two reasons. Short-term holders sold into every green candle, and the Fed was still tightening.
The setup looks different now. Holder distribution is cleaner than it was during those mid-bear rallies, and October hike odds have dropped far enough that risk assets usually catch a bid. It rhymes more with the 2020 reset than with those head-fakes.
$USDT on the sidelines is starting to rotate, which is often the tell before $BTC holds a higher low. Names like $OP tend to wait for that confirmation. The sequence matters more than any single daily candle.
Where do you think this goes from here if the 2020 pattern holds?
#BitcoinRecoversTo #BitcoinShortTermHoldersReach4 #OctoberFedHikeOddsFallToAround17
Last week I watched someone dump their $BTC the second the chart turned green, calling it another fakeout before the candle even closed.
That hesitation is costing people real money. You either sell every bounce too early or chase it after the move is already priced in, and both habits end the same way.
This recovery is worth putting next to the 2022 and 2023 bounces, because those kept failing for the same two reasons. Short-term holders sold into every green candle, and the Fed was still tightening.
The setup looks different now. Holder distribution is cleaner than it was during those mid-bear rallies, and October hike odds have dropped far enough that risk assets usually catch a bid. It rhymes more with the 2020 reset than with those head-fakes.
$USDT on the sidelines is starting to rotate, which is often the tell before $BTC holds a higher low. Names like $OP tend to wait for that confirmation. The sequence matters more than any single daily candle.
Where do you think this goes from here if the 2020 pattern holds?
#BitcoinRecoversTo #BitcoinShortTermHoldersReach4 #OctoberFedHikeOddsFallToAround17
That hesitation is costing people real money. You either sell every bounce too early or chase it after the move is already priced in, and both habits end the same way.
This recovery is worth putting next to the 2022 and 2023 bounces, because those kept failing for the same two reasons. Short-term holders sold into every green candle, and the Fed was still tightening.
The setup looks different now. Holder distribution is cleaner than it was during those mid-bear rallies, and October hike odds have dropped far enough that risk assets usually catch a bid. It rhymes more with the 2020 reset than with those head-fakes.
$USDT on the sidelines is starting to rotate, which is often the tell before $BTC holds a higher low. Names like $OP tend to wait for that confirmation. The sequence matters more than any single daily candle.
Where do you think this goes from here if the 2020 pattern holds?
#BitcoinRecoversTo #BitcoinShortTermHoldersReach4 #OctoberFedHikeOddsFallToAround17
8


·
--
Bullish
Bitcoin is reminding the market why patience matters. #BitcoinRecoversTo $64100 isn't just about a price move—it's a sign that confidence can return after uncertainty. Every recovery attracts fresh attention, but I think the real story is whether buyers can keep building momentum above key support instead of chasing short-term hype. If volume continues to improve, the next leg higher becomes more realistic. I'm staying focused on risk management while watching how BTC reacts around resistance. Strong recoveries often begin with steady accumulation, not explosive candles. The trend is improving, but disciplined decisions still matter more than emotions. 🚀📈
$BTC
{future}(BTCUSDT)
$NVDAB
{spot}(NVDABUSDT)
$AAPLB
{spot}(AAPLBUSDT)
#Write2Earn #KOSPINikkeiOpenHigherOnChipStocks #SpaceXToReportQ2Results
Bitcoin is reminding the market why patience matters. #BitcoinRecoversTo $64100 isn't just about a price move—it's a sign that confidence can return after uncertainty. Every recovery attracts fresh attention, but I think the real story is whether buyers can keep building momentum above key support instead of chasing short-term hype. If volume continues to improve, the next leg higher becomes more realistic. I'm staying focused on risk management while watching how BTC reacts around resistance. Strong recoveries often begin with steady accumulation, not explosive candles. The trend is improving, but disciplined decisions still matter more than emotions. 🚀📈
$BTC
$NVDAB
$AAPLB
#Write2Earn #KOSPINikkeiOpenHigherOnChipStocks #SpaceXToReportQ2Results
$BTC
$NVDAB
$AAPLB
#Write2Earn #KOSPINikkeiOpenHigherOnChipStocks #SpaceXToReportQ2Results
3
613

·
--
BTC trends and returns to around $82K: Is the rebound driven by spot buying or leveraged short covering?BTC trends and returns to around $82K: Is the rebound driven by spot buying or leveraged short covering?
The current No. 2 trending topic on Binance Square is #BitcoinRecoversTo$82K: As of 05:45 Beijing time on October 17, 2026, the page showed approximately 110,671 views and 214 people discussing it. On the topic page, bulls and bears are debating $82,000, $81,500, and $80,000, but these are only opinions in posts, not verified support levels or price targets.
First, the facts: As of around 05:45, Binance BTC/USDT spot was trading at approximately $81,708, down 0.675% over 24 hours, within a range of $80,809–$82,941. Spot trading link: BTC/USDT Spot https://www.binance.com/en/trade/BTC_USDT. In other words, the price has indeed recovered from its intraday low, but $82,000 has not yet become reliable closing support.
BTC trends and returns to around $82K: Is the rebound driven by spot buying or leveraged short covering?
BTC trends and returns to around $82K: Is the rebound driven by spot buying or leveraged short covering?
The current No. 2 trending topic on Binance Square is #BitcoinRecoversTo$82K: As of 05:45 Beijing time on October 17, 2026, the page showed approximately 110,671 views and 214 people discussing it. On the topic page, bulls and bears are debating $82,000, $81,500, and $80,000, but these are only opinions in posts, not verified support levels or price targets.
First, the facts: As of around 05:45, Binance BTC/USDT spot was trading at approximately $81,708, down 0.675% over 24 hours, within a range of $80,809–$82,941. Spot trading link: BTC/USDT Spot https://www.binance.com/en/trade/BTC_USDT. In other words, the price has indeed recovered from its intraday low, but $82,000 has not yet become reliable closing support.
The current No. 2 trending topic on Binance Square is #BitcoinRecoversTo$82K: As of 05:45 Beijing time on October 17, 2026, the page showed approximately 110,671 views and 214 people discussing it. On the topic page, bulls and bears are debating $82,000, $81,500, and $80,000, but these are only opinions in posts, not verified support levels or price targets.
First, the facts: As of around 05:45, Binance BTC/USDT spot was trading at approximately $81,708, down 0.675% over 24 hours, within a range of $80,809–$82,941. Spot trading link: BTC/USDT Spot https://www.binance.com/en/trade/BTC_USDT. In other words, the price has indeed recovered from its intraday low, but $82,000 has not yet become reliable closing support.
7

·
--
BTC Reclaims $82K and Trends|Pulls Back by the Time I’m Writing|I Don’t Treat an Instant Rebound as a Breakout
Let me state my position up front: there are buyers behind the short-term recovery, but not enough to make me chase it. Binance Square is still showing the exact topic #BitcoinRecoversTo$82K. Binance News’s account of the Asian session says BTC quickly reclaimed $82,000 after briefly dipping to around $79,800. That historical price path is worth discussing, but it is not a real-time trading signal. I checked Kraken’s BTC/USD spot quote again: it was around $81,571 as I was writing, with a rolling 24-hour high of about $82,826 and a low of about $81,355; the daily open was around $82,135. In other words, the trending headline describes a rebound that already happened, while the latest quote is back below $82,000. There’s no contradiction between the two. The mistake would be to interpret “reclaimed at one point” as “holding above it now.”
Why does this detail matter? A rapid recovery after breaking below a round-number level could reflect spot buying at lower prices, or it could simply be short covering and liquidity sweeps. If the price loses the level again, those chasing the trend could face a second pullback. The macro backdrop also doesn’t support casually taking a one-way bet: the U.S. Bureau of Labor Statistics reported that the September Producer Price Index for final demand rose 1.3% month over month and 6.3% year over year. In the latest verifiable U.S. Treasury closing data, for October 15, the 10-year Treasury yield was 5.10%, down from 5.19% on October 14. A pullback in yields could ease pressure on risk assets, but it could also reflect safe-haven demand and concerns about growth. It’s too simplistic to say, “Rates are falling, so BTC must rise.” The Treasury’s October 16 closing data has not yet been published, so I won’t treat intraday yields reported by the media as official closing figures.
The market first rebounded quickly from below $80,000, then seesawed around $82,000, and the latest snapshot has slipped below that level. This means $82,000 is a threshold that needs to be reclaimed and confirmed—not automatic support. To the upside in the short term, I’m watching the $82,100–$82,800 supply zone. To the downside, I’m watching $81,300, followed by the round-number level of $81,000. If BTC closes back above $82,300 on strong one-hour volume and then holds $82,000 on a retest, my view of this as a weak rebound could be overturned. If it breaks below $81,300 and fails to recover on a bounce, protecting capital takes priority. As for institutional flows, Farside’s October 16 Bitcoin ETF breakdown still shows dashes. The table’s automatic total of zero should not be treated as confirmed zero inflows or outflows, and unsettled data should not be used to explain the current price action.
If I were trading this myself, I’d stay out for now. My tentative bias would be to test a spot long only; I wouldn’t touch high leverage. I’d enter in two tranches, using no more than 1.5% of my total capital, only if the one-hour candle closes back above $82,300 and the following hour’s retest holds between $82,000 and $82,300. I’d take half off at the first target of $82,800–$83,000, then gradually exit the rest between $83,600 and $84,000. If the price falls back below $81,900 after entry, I’d first cut half of the remaining position. If a one-hour candle closes below $81,200, I’d exit the entire position at a loss. If $81,300 gives way first, I won’t try to catch the bottom; the original long plan is off. Without an entry trigger, I’ll stay flat. I won’t present a hypothetical trade as a profit.
Sources: Binance Square trending topics and Binance News, Kraken public spot quotes, the U.S. Bureau of Labor Statistics, the U.S. Treasury, and Farside. #BitcoinRecoversTo$82K #BTC
This is solely my personal market observation and does not constitute investment advice.
BTC Reclaims $82K and Trends|Pulls Back by the Time I’m Writing|I Don’t Treat an Instant Rebound as a Breakout
Let me state my position up front: there are buyers behind the short-term recovery, but not enough to make me chase it. Binance Square is still showing the exact topic #BitcoinRecoversTo$82K. Binance News’s account of the Asian session says BTC quickly reclaimed $82,000 after briefly dipping to around $79,800. That historical price path is worth discussing, but it is not a real-time trading signal. I checked Kraken’s BTC/USD spot quote again: it was around $81,571 as I was writing, with a rolling 24-hour high of about $82,826 and a low of about $81,355; the daily open was around $82,135. In other words, the trending headline describes a rebound that already happened, while the latest quote is back below $82,000. There’s no contradiction between the two. The mistake would be to interpret “reclaimed at one point” as “holding above it now.”
Why does this detail matter? A rapid recovery after breaking below a round-number level could reflect spot buying at lower prices, or it could simply be short covering and liquidity sweeps. If the price loses the level again, those chasing the trend could face a second pullback. The macro backdrop also doesn’t support casually taking a one-way bet: the U.S. Bureau of Labor Statistics reported that the September Producer Price Index for final demand rose 1.3% month over month and 6.3% year over year. In the latest verifiable U.S. Treasury closing data, for October 15, the 10-year Treasury yield was 5.10%, down from 5.19% on October 14. A pullback in yields could ease pressure on risk assets, but it could also reflect safe-haven demand and concerns about growth. It’s too simplistic to say, “Rates are falling, so BTC must rise.” The Treasury’s October 16 closing data has not yet been published, so I won’t treat intraday yields reported by the media as official closing figures.
The market first rebounded quickly from below $80,000, then seesawed around $82,000, and the latest snapshot has slipped below that level. This means $82,000 is a threshold that needs to be reclaimed and confirmed—not automatic support. To the upside in the short term, I’m watching the $82,100–$82,800 supply zone. To the downside, I’m watching $81,300, followed by the round-number level of $81,000. If BTC closes back above $82,300 on strong one-hour volume and then holds $82,000 on a retest, my view of this as a weak rebound could be overturned. If it breaks below $81,300 and fails to recover on a bounce, protecting capital takes priority. As for institutional flows, Farside’s October 16 Bitcoin ETF breakdown still shows dashes. The table’s automatic total of zero should not be treated as confirmed zero inflows or outflows, and unsettled data should not be used to explain the current price action.
If I were trading this myself, I’d stay out for now. My tentative bias would be to test a spot long only; I wouldn’t touch high leverage. I’d enter in two tranches, using no more than 1.5% of my total capital, only if the one-hour candle closes back above $82,300 and the following hour’s retest holds between $82,000 and $82,300. I’d take half off at the first target of $82,800–$83,000, then gradually exit the rest between $83,600 and $84,000. If the price falls back below $81,900 after entry, I’d first cut half of the remaining position. If a one-hour candle closes below $81,200, I’d exit the entire position at a loss. If $81,300 gives way first, I won’t try to catch the bottom; the original long plan is off. Without an entry trigger, I’ll stay flat. I won’t present a hypothetical trade as a profit.
Sources: Binance Square trending topics and Binance News, Kraken public spot quotes, the U.S. Bureau of Labor Statistics, the U.S. Treasury, and Farside. #BitcoinRecoversTo$82K #BTC
This is solely my personal market observation and does not constitute investment advice.
Let me state my position up front: there are buyers behind the short-term recovery, but not enough to make me chase it. Binance Square is still showing the exact topic #BitcoinRecoversTo$82K. Binance News’s account of the Asian session says BTC quickly reclaimed $82,000 after briefly dipping to around $79,800. That historical price path is worth discussing, but it is not a real-time trading signal. I checked Kraken’s BTC/USD spot quote again: it was around $81,571 as I was writing, with a rolling 24-hour high of about $82,826 and a low of about $81,355; the daily open was around $82,135. In other words, the trending headline describes a rebound that already happened, while the latest quote is back below $82,000. There’s no contradiction between the two. The mistake would be to interpret “reclaimed at one point” as “holding above it now.”
Why does this detail matter? A rapid recovery after breaking below a round-number level could reflect spot buying at lower prices, or it could simply be short covering and liquidity sweeps. If the price loses the level again, those chasing the trend could face a second pullback. The macro backdrop also doesn’t support casually taking a one-way bet: the U.S. Bureau of Labor Statistics reported that the September Producer Price Index for final demand rose 1.3% month over month and 6.3% year over year. In the latest verifiable U.S. Treasury closing data, for October 15, the 10-year Treasury yield was 5.10%, down from 5.19% on October 14. A pullback in yields could ease pressure on risk assets, but it could also reflect safe-haven demand and concerns about growth. It’s too simplistic to say, “Rates are falling, so BTC must rise.” The Treasury’s October 16 closing data has not yet been published, so I won’t treat intraday yields reported by the media as official closing figures.
The market first rebounded quickly from below $80,000, then seesawed around $82,000, and the latest snapshot has slipped below that level. This means $82,000 is a threshold that needs to be reclaimed and confirmed—not automatic support. To the upside in the short term, I’m watching the $82,100–$82,800 supply zone. To the downside, I’m watching $81,300, followed by the round-number level of $81,000. If BTC closes back above $82,300 on strong one-hour volume and then holds $82,000 on a retest, my view of this as a weak rebound could be overturned. If it breaks below $81,300 and fails to recover on a bounce, protecting capital takes priority. As for institutional flows, Farside’s October 16 Bitcoin ETF breakdown still shows dashes. The table’s automatic total of zero should not be treated as confirmed zero inflows or outflows, and unsettled data should not be used to explain the current price action.
If I were trading this myself, I’d stay out for now. My tentative bias would be to test a spot long only; I wouldn’t touch high leverage. I’d enter in two tranches, using no more than 1.5% of my total capital, only if the one-hour candle closes back above $82,300 and the following hour’s retest holds between $82,000 and $82,300. I’d take half off at the first target of $82,800–$83,000, then gradually exit the rest between $83,600 and $84,000. If the price falls back below $81,900 after entry, I’d first cut half of the remaining position. If a one-hour candle closes below $81,200, I’d exit the entire position at a loss. If $81,300 gives way first, I won’t try to catch the bottom; the original long plan is off. Without an entry trigger, I’ll stay flat. I won’t present a hypothetical trade as a profit.
Sources: Binance Square trending topics and Binance News, Kraken public spot quotes, the U.S. Bureau of Labor Statistics, the U.S. Treasury, and Farside. #BitcoinRecoversTo$82K #BTC
This is solely my personal market observation and does not constitute investment advice.


·
--
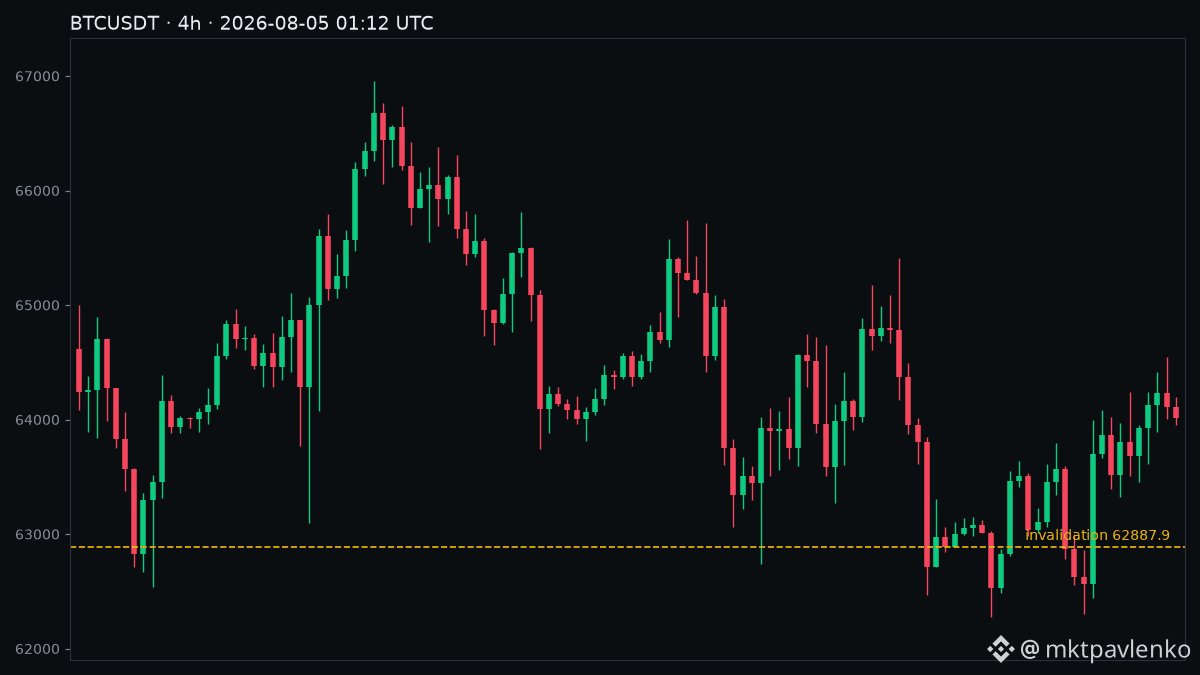
$BTC - clean, compact plan: price has reclaimed the low-64k band and my entry window is 63,700-64,200 with a tight invalidation. I will add size only on a confirmed 1H hold above 63,700 and keep invalidation at a daily close below 62,887.88. Target is tactical - first trim into 64,900-65,400 on follow-through. Risk note - US-Iran headlines can flip liquidity fast, so use size you can live with.
#BitcoinRecoversTo$64100 #USIranDealOrNoDeal #SpaceXFirstLockupExpiresAug6
$BTC - clean, compact plan: price has reclaimed the low-64k band and my entry window is 63,700-64,200 with a tight invalidation. I will add size only on a confirmed 1H hold above 63,700 and keep invalidation at a daily close below 62,887.88. Target is tactical - first trim into 64,900-65,400 on follow-through. Risk note - US-Iran headlines can flip liquidity fast, so use size you can live with.
#BitcoinRecoversTo$64100 #USIranDealOrNoDeal #SpaceXFirstLockupExpiresAug6
#BitcoinRecoversTo$64100 #USIranDealOrNoDeal #SpaceXFirstLockupExpiresAug6
18

·
--
Bitcoin has shown a remarkable recovery, pushing towards the significant $82,000 mark. This upward trend suggests a renewed optimism in the market, potentially driven by a combination of factors including increasing institutional interest and positive macroeconomic signals. Traders are closely watching this level as a key indicator of future price action. The recovery signals a potential shift in market sentiment, with many anticipating further gains if this momentum is sustained. The resilience shown by $BTC in recent times is a testament to its growing adoption and acceptance as a digital asset.
Disclaimer: This is not financial advice. Please conduct your own research before making any investment decisions.
#BitcoinRecoversTo$82K $OP
Bitcoin has shown a remarkable recovery, pushing towards the significant $82,000 mark. This upward trend suggests a renewed optimism in the market, potentially driven by a combination of factors including increasing institutional interest and positive macroeconomic signals. Traders are closely watching this level as a key indicator of future price action. The recovery signals a potential shift in market sentiment, with many anticipating further gains if this momentum is sustained. The resilience shown by $BTC in recent times is a testament to its growing adoption and acceptance as a digital asset.
Disclaimer: This is not financial advice. Please conduct your own research before making any investment decisions.
#BitcoinRecoversTo$82K $OP
Disclaimer: This is not financial advice. Please conduct your own research before making any investment decisions.
#BitcoinRecoversTo$82K $OP
11

Bitcoin recovered to 64,100 — here's what the tape says about whether it holds.
$BTC is boxed between two of the heaviest levels on its own chart:
Resistance 64,654 — twenty separate touches
Support 63,074 — thirteen separate touches
Touch count is what makes a level real. Two touches is a line you drew. Twenty is a place people defend.
But volume is contracting on every timeframe: 0.79 (1h), 0.71 (4h), 0.52 (1d). And price is sitting on the daily volume point of control at 63,931 — literally fair value.
Recovery on thin volume is not the same as recovery on demand. A push through 64,654 with volume ratio still under 1.0 is a stop raid, not a breakout.
The trigger is the volume, not the level. Hourly close outside on ratio above 1.5, or it's noise.
What's your read — does 64,654 break this week?
#BitcoinRecoversTo$64100 #MarketSentimentToday
$BTC $ETH
Analysis, not financial advice.
Bitcoin recovered to 64,100 — here's what the tape says about whether it holds.
$BTC is boxed between two of the heaviest levels on its own chart:
Resistance 64,654 — twenty separate touches
Support 63,074 — thirteen separate touches
Touch count is what makes a level real. Two touches is a line you drew. Twenty is a place people defend.
But volume is contracting on every timeframe: 0.79 (1h), 0.71 (4h), 0.52 (1d). And price is sitting on the daily volume point of control at 63,931 — literally fair value.
Recovery on thin volume is not the same as recovery on demand. A push through 64,654 with volume ratio still under 1.0 is a stop raid, not a breakout.
The trigger is the volume, not the level. Hourly close outside on ratio above 1.5, or it's noise.
What's your read — does 64,654 break this week?
#BitcoinRecoversTo$64100 #MarketSentimentToday
$BTC $ETH
Analysis, not financial advice.
$BTC is boxed between two of the heaviest levels on its own chart:
Resistance 64,654 — twenty separate touches
Support 63,074 — thirteen separate touches
Touch count is what makes a level real. Two touches is a line you drew. Twenty is a place people defend.
But volume is contracting on every timeframe: 0.79 (1h), 0.71 (4h), 0.52 (1d). And price is sitting on the daily volume point of control at 63,931 — literally fair value.
Recovery on thin volume is not the same as recovery on demand. A push through 64,654 with volume ratio still under 1.0 is a stop raid, not a breakout.
The trigger is the volume, not the level. Hourly close outside on ratio above 1.5, or it's noise.
What's your read — does 64,654 break this week?
#BitcoinRecoversTo$64100 #MarketSentimentToday
$BTC $ETH
Analysis, not financial advice.
68

#BitcoinRecoversTo
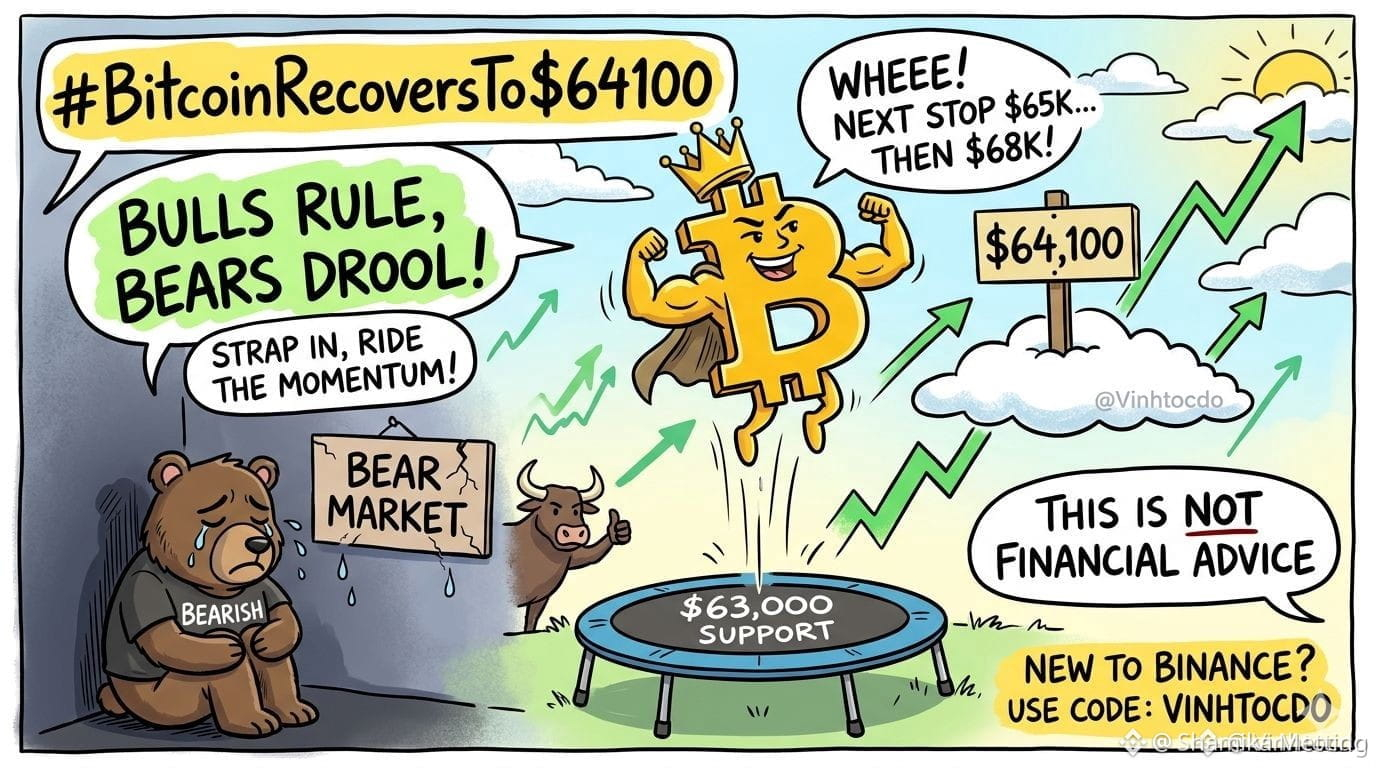
🚀 The king returned, jumping straight to $64,100! With steady support at $63K like a boss—bulls have their eyes on $65,000, so what’s next? $68,000! 🛸💨 Bears are crying in the corner right now.
What should traders do? Get ready—don’t let FOMO blindly drive you, but by all means, ride this upward momentum. Watch the crucial $63,000 level during the U.S. session! 📈🏄♂️
⚠️ NFA (not financial advice)! Always do DYOR, champ!
Please follow up
#BTCBullRun #CryptoTrading #BitcoinPump
$BTC
{future}(BTCUSDT)
#BitcoinRecoversTo
🚀 The king returned, jumping straight to $64,100! With steady support at $63K like a boss—bulls have their eyes on $65,000, so what’s next? $68,000! 🛸💨 Bears are crying in the corner right now.
What should traders do? Get ready—don’t let FOMO blindly drive you, but by all means, ride this upward momentum. Watch the crucial $63,000 level during the U.S. session! 📈🏄♂️
⚠️ NFA (not financial advice)! Always do DYOR, champ!
Please follow up
#BTCBullRun #CryptoTrading #BitcoinPump
$BTC
🚀 The king returned, jumping straight to $64,100! With steady support at $63K like a boss—bulls have their eyes on $65,000, so what’s next? $68,000! 🛸💨 Bears are crying in the corner right now.
What should traders do? Get ready—don’t let FOMO blindly drive you, but by all means, ride this upward momentum. Watch the crucial $63,000 level during the U.S. session! 📈🏄♂️
⚠️ NFA (not financial advice)! Always do DYOR, champ!
Please follow up
#BTCBullRun #CryptoTrading #BitcoinPump
$BTC
1
116
·
--
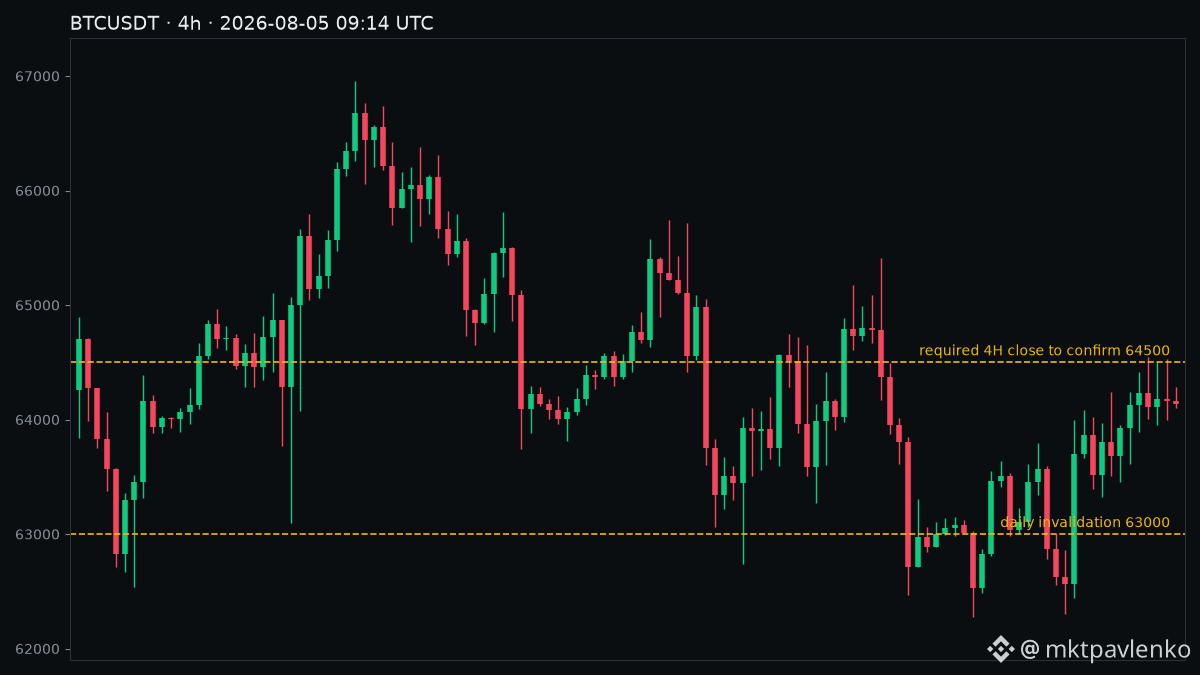
Claim - $BTC has reclaimed the 64k band, but the market shows a classic false-resume setup: price is inside a tight 4H coil, open interest is down ~1.4% over 24h, and funding is only mildly positive (0.00002325). The keepable rule: treat a reclaim as conditional - require a 4H close above 64.5k with rising OI and taker buy volume >1.2x to call a regime shift. Otherwise the move is a range reclaim, not a breakout. My invalidation is a daily close below 63,000 - that flips the read to range-fail. #BitcoinRecoversTo$64100 #USIranDealOrNoDeal #SpaceXRises9.8%AheadOfQ2Results
Claim - $BTC has reclaimed the 64k band, but the market shows a classic false-resume setup: price is inside a tight 4H coil, open interest is down ~1.4% over 24h, and funding is only mildly positive (0.00002325). The keepable rule: treat a reclaim as conditional - require a 4H close above 64.5k with rising OI and taker buy volume >1.2x to call a regime shift. Otherwise the move is a range reclaim, not a breakout. My invalidation is a daily close below 63,000 - that flips the read to range-fail. #BitcoinRecoversTo$64100 #USIranDealOrNoDeal #SpaceXRises9.8%AheadOfQ2Results
53

·
--
🚨 Why Can Bitcoin Surge 40% Against the Trend? What Did the Plunge in Gold Reveal?
This week, Bitcoin put on a show: the price jumped more than 40% outright, leaving gold and U.S. stocks—those “big brothers”—behind. According to NS3.AI data, gold fell nearly 4% in a single day. This surge in Bitcoin has led the market to speculate whether it’s really headed for the $100,000 milestone. For the crypto community and the broader investment world, this is a major piece of news.
Why is this news important?
Put simply, the core reason is risk-off sentiment and investment rotation. When traditional assets like gold slip at critical moments, money tends to move toward something more flexible—something that could offer higher returns. As “digital gold,” Bitcoin’s perceived attributes get amplified to the extreme. Also, recently there have been a string of positive developments in the crypto space (such as the earlier rumor about regulatory easing), which may further encourage buyers. This contrasts sharply with the previous cycle where “Fed rate-hike expectations suppressed risk assets,” suggesting the market may be searching for a new safe haven.
Impact on the market
For BTC and ETH, the short-term sentiment is definitely a strongly bullish signal. Bitcoin has already risen above the key level of 84,401; if it can hold, the odds of pushing toward $1,000,000 later could increase significantly. In terms of market structure, this indicates that institutional investors may be re-evaluating the risk-reward profile of crypto assets. Funds could flow out of tech stocks or other overvalued assets and rotate into Bitcoin—an asset with substitutability. Historically, after events like this (for example, gold surged after the 2008 financial crisis), Bitcoin often entered a period of breakout. But this time, the backdrop is different: the AI boom and the macro interest-rate environment require specific analysis.
Trading approach
I believe that if Bitcoin can defend the 84,401 level, the possibility of continuing its bullish push toward 90,000 is high. However, this view has invalidation conditions: if U.S. inflation data comes in hotter than expected again, or if new regulatory risks suddenly emerge (for example, the SEC officially bans a certain exchange), then this logic would immediately be invalidated. Entering now is more like betting on a long-term trend—the short-term volatility could be extremely intense.
This article has no sponsorship from any project; the author does not hold the assets mentioned
$BTC $ETH #BTC #ETH
⚠️ Not investment advice; predictions are for reference only
#BitcoinRecoversto$84,170asU.S.StocksFallforSecondSession
🚨 Why Can Bitcoin Surge 40% Against the Trend? What Did the Plunge in Gold Reveal?
This week, Bitcoin put on a show: the price jumped more than 40% outright, leaving gold and U.S. stocks—those “big brothers”—behind. According to NS3.AI data, gold fell nearly 4% in a single day. This surge in Bitcoin has led the market to speculate whether it’s really headed for the $100,000 milestone. For the crypto community and the broader investment world, this is a major piece of news.
Why is this news important?
Put simply, the core reason is risk-off sentiment and investment rotation. When traditional assets like gold slip at critical moments, money tends to move toward something more flexible—something that could offer higher returns. As “digital gold,” Bitcoin’s perceived attributes get amplified to the extreme. Also, recently there have been a string of positive developments in the crypto space (such as the earlier rumor about regulatory easing), which may further encourage buyers. This contrasts sharply with the previous cycle where “Fed rate-hike expectations suppressed risk assets,” suggesting the market may be searching for a new safe haven.
Impact on the market
For BTC and ETH, the short-term sentiment is definitely a strongly bullish signal. Bitcoin has already risen above the key level of 84,401; if it can hold, the odds of pushing toward $1,000,000 later could increase significantly. In terms of market structure, this indicates that institutional investors may be re-evaluating the risk-reward profile of crypto assets. Funds could flow out of tech stocks or other overvalued assets and rotate into Bitcoin—an asset with substitutability. Historically, after events like this (for example, gold surged after the 2008 financial crisis), Bitcoin often entered a period of breakout. But this time, the backdrop is different: the AI boom and the macro interest-rate environment require specific analysis.
Trading approach
I believe that if Bitcoin can defend the 84,401 level, the possibility of continuing its bullish push toward 90,000 is high. However, this view has invalidation conditions: if U.S. inflation data comes in hotter than expected again, or if new regulatory risks suddenly emerge (for example, the SEC officially bans a certain exchange), then this logic would immediately be invalidated. Entering now is more like betting on a long-term trend—the short-term volatility could be extremely intense.
This article has no sponsorship from any project; the author does not hold the assets mentioned
$BTC $ETH #BTC #ETH
⚠️ Not investment advice; predictions are for reference only
#BitcoinRecoversto$84,170asU.S.StocksFallforSecondSession
This week, Bitcoin put on a show: the price jumped more than 40% outright, leaving gold and U.S. stocks—those “big brothers”—behind. According to NS3.AI data, gold fell nearly 4% in a single day. This surge in Bitcoin has led the market to speculate whether it’s really headed for the $100,000 milestone. For the crypto community and the broader investment world, this is a major piece of news.
Why is this news important?
Put simply, the core reason is risk-off sentiment and investment rotation. When traditional assets like gold slip at critical moments, money tends to move toward something more flexible—something that could offer higher returns. As “digital gold,” Bitcoin’s perceived attributes get amplified to the extreme. Also, recently there have been a string of positive developments in the crypto space (such as the earlier rumor about regulatory easing), which may further encourage buyers. This contrasts sharply with the previous cycle where “Fed rate-hike expectations suppressed risk assets,” suggesting the market may be searching for a new safe haven.
Impact on the market
For BTC and ETH, the short-term sentiment is definitely a strongly bullish signal. Bitcoin has already risen above the key level of 84,401; if it can hold, the odds of pushing toward $1,000,000 later could increase significantly. In terms of market structure, this indicates that institutional investors may be re-evaluating the risk-reward profile of crypto assets. Funds could flow out of tech stocks or other overvalued assets and rotate into Bitcoin—an asset with substitutability. Historically, after events like this (for example, gold surged after the 2008 financial crisis), Bitcoin often entered a period of breakout. But this time, the backdrop is different: the AI boom and the macro interest-rate environment require specific analysis.
Trading approach
I believe that if Bitcoin can defend the 84,401 level, the possibility of continuing its bullish push toward 90,000 is high. However, this view has invalidation conditions: if U.S. inflation data comes in hotter than expected again, or if new regulatory risks suddenly emerge (for example, the SEC officially bans a certain exchange), then this logic would immediately be invalidated. Entering now is more like betting on a long-term trend—the short-term volatility could be extremely intense.
This article has no sponsorship from any project; the author does not hold the assets mentioned
$BTC $ETH #BTC #ETH
⚠️ Not investment advice; predictions are for reference only
#BitcoinRecoversto$84,170asU.S.StocksFallforSecondSession
228
·
--
Bitcoin has rebounded strongly in recent days, successfully breaking through the $82,000 mark and reflecting optimistic market sentiment and strong buying pressure. The rally has been driven by an improving global macroeconomic environment and growing investor confidence in Bitcoin as a safe-haven asset. Analysts believe Bitcoin still has room to rise further, as institutional investors continue to enter the market and technical indicators keep improving. What do you think lies ahead for Bitcoin? #BitcoinRecoversTo$82K
$BTC #BTC
Bitcoin has rebounded strongly in recent days, successfully breaking through the $82,000 mark and reflecting optimistic market sentiment and strong buying pressure. The rally has been driven by an improving global macroeconomic environment and growing investor confidence in Bitcoin as a safe-haven asset. Analysts believe Bitcoin still has room to rise further, as institutional investors continue to enter the market and technical indicators keep improving. What do you think lies ahead for Bitcoin? #BitcoinRecoversTo$82K
$BTC #BTC
$BTC #BTC
55
·
--
Today's script feels familiar: $BTC fell below $80,000 again, then bounced right back.
But the details are worth a closer look this time—the price spent only about two hours below $80,000 before buying pressure pulled it straight back to around $82,500. It's now at about $82,000, up roughly 1.5–2% over 24 hours.
It was those two “blowout” inflation readings again: September PPI was up 6.3% year over year, and CPI was up 3.7%. Thursday's jitters briefly sent the price tumbling to around $79,800.
The turnaround came as Fed officials struck a more dovish tone: according to Reuters, the odds of no rate hike in October have risen to 73%. Treasury yields fell, the dollar index dropped 0.45% (according to reports), and Asian stocks rebounded from Thursday's sell-off, giving risk assets some breathing room.
Three things to note:
First, the $80,400 support level has now been tested for the third time this week, and buyers have stepped in at the same level each time.
Second, the recovery after dipping below $80,000 is getting faster each time—this time it took only about two hours, suggesting buyers at lower levels are increasingly eager and less willing to miss out.
Third, the real dividing line is $84,000: Wednesday's post-inflation-data rebound faltered there. Until the price gets above that level, every V-shaped bounce is just an oversold recovery.
A dose of caution, too: spot BTC ETFs saw net inflows of only about $5.06 million on Thursday (according to reports), suggesting institutions are still sitting on the sidelines. Ethereum ETFs, by contrast, saw net outflows of about $60 million. Ethereum rose just 1.5% to around $2,452, and remains clearly weaker than Bitcoin.
The October 27–28 FOMC meeting is the real showdown. The $80,000–$84,000 range is likely to hold until then.
This is not investment advice. DYOR; trading involves risk.
#BitcoinRecoversTo$82K
#BTC #Bitcoin
Today's script feels familiar: $BTC fell below $80,000 again, then bounced right back.
But the details are worth a closer look this time—the price spent only about two hours below $80,000 before buying pressure pulled it straight back to around $82,500. It's now at about $82,000, up roughly 1.5–2% over 24 hours.
It was those two “blowout” inflation readings again: September PPI was up 6.3% year over year, and CPI was up 3.7%. Thursday's jitters briefly sent the price tumbling to around $79,800.
The turnaround came as Fed officials struck a more dovish tone: according to Reuters, the odds of no rate hike in October have risen to 73%. Treasury yields fell, the dollar index dropped 0.45% (according to reports), and Asian stocks rebounded from Thursday's sell-off, giving risk assets some breathing room.
Three things to note:
First, the $80,400 support level has now been tested for the third time this week, and buyers have stepped in at the same level each time.
Second, the recovery after dipping below $80,000 is getting faster each time—this time it took only about two hours, suggesting buyers at lower levels are increasingly eager and less willing to miss out.
Third, the real dividing line is $84,000: Wednesday's post-inflation-data rebound faltered there. Until the price gets above that level, every V-shaped bounce is just an oversold recovery.
A dose of caution, too: spot BTC ETFs saw net inflows of only about $5.06 million on Thursday (according to reports), suggesting institutions are still sitting on the sidelines. Ethereum ETFs, by contrast, saw net outflows of about $60 million. Ethereum rose just 1.5% to around $2,452, and remains clearly weaker than Bitcoin.
The October 27–28 FOMC meeting is the real showdown. The $80,000–$84,000 range is likely to hold until then.
This is not investment advice. DYOR; trading involves risk.
#BitcoinRecoversTo$82K
#BTC #Bitcoin
But the details are worth a closer look this time—the price spent only about two hours below $80,000 before buying pressure pulled it straight back to around $82,500. It's now at about $82,000, up roughly 1.5–2% over 24 hours.
It was those two “blowout” inflation readings again: September PPI was up 6.3% year over year, and CPI was up 3.7%. Thursday's jitters briefly sent the price tumbling to around $79,800.
The turnaround came as Fed officials struck a more dovish tone: according to Reuters, the odds of no rate hike in October have risen to 73%. Treasury yields fell, the dollar index dropped 0.45% (according to reports), and Asian stocks rebounded from Thursday's sell-off, giving risk assets some breathing room.
Three things to note:
First, the $80,400 support level has now been tested for the third time this week, and buyers have stepped in at the same level each time.
Second, the recovery after dipping below $80,000 is getting faster each time—this time it took only about two hours, suggesting buyers at lower levels are increasingly eager and less willing to miss out.
Third, the real dividing line is $84,000: Wednesday's post-inflation-data rebound faltered there. Until the price gets above that level, every V-shaped bounce is just an oversold recovery.
A dose of caution, too: spot BTC ETFs saw net inflows of only about $5.06 million on Thursday (according to reports), suggesting institutions are still sitting on the sidelines. Ethereum ETFs, by contrast, saw net outflows of about $60 million. Ethereum rose just 1.5% to around $2,452, and remains clearly weaker than Bitcoin.
The October 27–28 FOMC meeting is the real showdown. The $80,000–$84,000 range is likely to hold until then.
This is not investment advice. DYOR; trading involves risk.
#BitcoinRecoversTo$82K
#BTC #Bitcoin


3
·
--
Inflation Data Surprises to the Upside, Rattling Markets as Tokenized U.S. Stocks Emerge as a Focus
I. U.S. Inflation Data Shock Markets, Spreading Fear
In mid-October 2026, economic data for September released by the U.S. Department of Labor sent shockwaves through global markets. The Consumer Price Index rose 3.7% year over year, above market expectations of 3.6%. More concerningly, the Producer Price Index surged to 6.3% year over year, far exceeding the 5.3% forecast and reaching its highest level in four years. The figures directly fueled fears that the Federal Reserve might resume raising interest rates.
The crypto market bore the brunt of the reaction. Bitcoin briefly fell below the $80,000 mark, triggering a cascade of liquidations totaling about $950 million. Major tokens such as Ethereum and Solana also fell in tandem, and short-term market panic reached a peak. On-chain data showed that digital asset funds recorded net outflows of $434 million for the week, indicating that institutional investors were temporarily seeking safety amid inflationary pressure.
II. Bitcoin Rebounds Quickly as Short-Term Holder Supply Hits a Record
However, market resilience far exceeded expectations. After briefly dropping below $80,000, Bitcoin quickly rebounded to around $82,000, demonstrating strong support. Notably, on-chain data showed that short-term holders’ Bitcoin holdings had reached 4.08 million BTC, a record high. This suggests that despite macroeconomic uncertainty, substantial new capital continues to flow into the crypto market, and long-term bullish conviction remains intact.
Meanwhile, Binance recorded net inflows of $163 million, its highest level since early July, and has now seen inflows grow for four consecutive weeks. Binance CEO Deng Weizheng said that institutional inflows continued even during the week when inflation data delivered its sharpest shock, reflecting persistent growth in structural demand for crypto assets.
III. Tokenized U.S. Stocks Surge, with Binance bStocks Surpassing $1 Billion in Four Months
Against the backdrop of accelerating integration between traditional finance and crypto markets, tokenized U.S. stocks have reached a milestone. Binance’s tokenized stock product, bStocks, launched in June 2026, surpassed $1 billion in assets under management in just four months, with cumulative trading volume exceeding $40 billion. This achievement clearly demonstrates the accelerating demand among institutional investors for on-chain U.S. stocks and tokenized ETF products.
Binance now lists several tokenized U.S. stock products spanning sectors including technology, healthcare, and emerging markets. Investors can trade traditional U.S. stock assets directly on-chain, enjoying benefits unavailable in traditional markets, such as 24/7 trading and instant settlement. Binance Wallet has also launched a 50,000 USDC competition to further promote the on-chain bStocks trading ecosystem.
IV. Regulatory Tailwinds Loom as Stablecoin Payments Expand
On the regulatory front, the head of the U.S. Office of the Comptroller of the Currency confirmed that the final rules for the GENIUS Act’s stablecoin framework will be officially released by the end of October. This landmark regulatory development provides the industry with a clear legal foundation. Circle’s CEO then announced plans to expand USDC into around 50 new emerging markets, while Visa moved its USDC prefunded cross-border payment service from the pilot phase to full commercial rollout. Mastercard also completed its stablecoin integration during the same period. The simultaneous efforts of the three major payment giants mark the transformation of stablecoins from tools used within the crypto sector into core components of global payment infrastructure.
V. Outlook
Overall, although short-term inflation data has put pressure on markets, the crypto market’s resilience in rebounding, continued institutional inflows, and the rapid development of tokenized U.S. stocks and stablecoin payments all point to a clear signal: the integration of traditional finance and the blockchain world is accelerating irreversibly. While keeping an eye on short-term volatility, investors should also seize the long-term opportunities created by this historic trend.
#BitcoinRecoversTo$82K #BitcoinShortTermHoldersReach4.08MBTC #TIA
Inflation Data Surprises to the Upside, Rattling Markets as Tokenized U.S. Stocks Emerge as a Focus
I. U.S. Inflation Data Shock Markets, Spreading Fear
In mid-October 2026, economic data for September released by the U.S. Department of Labor sent shockwaves through global markets. The Consumer Price Index rose 3.7% year over year, above market expectations of 3.6%. More concerningly, the Producer Price Index surged to 6.3% year over year, far exceeding the 5.3% forecast and reaching its highest level in four years. The figures directly fueled fears that the Federal Reserve might resume raising interest rates.
The crypto market bore the brunt of the reaction. Bitcoin briefly fell below the $80,000 mark, triggering a cascade of liquidations totaling about $950 million. Major tokens such as Ethereum and Solana also fell in tandem, and short-term market panic reached a peak. On-chain data showed that digital asset funds recorded net outflows of $434 million for the week, indicating that institutional investors were temporarily seeking safety amid inflationary pressure.
II. Bitcoin Rebounds Quickly as Short-Term Holder Supply Hits a Record
However, market resilience far exceeded expectations. After briefly dropping below $80,000, Bitcoin quickly rebounded to around $82,000, demonstrating strong support. Notably, on-chain data showed that short-term holders’ Bitcoin holdings had reached 4.08 million BTC, a record high. This suggests that despite macroeconomic uncertainty, substantial new capital continues to flow into the crypto market, and long-term bullish conviction remains intact.
Meanwhile, Binance recorded net inflows of $163 million, its highest level since early July, and has now seen inflows grow for four consecutive weeks. Binance CEO Deng Weizheng said that institutional inflows continued even during the week when inflation data delivered its sharpest shock, reflecting persistent growth in structural demand for crypto assets.
III. Tokenized U.S. Stocks Surge, with Binance bStocks Surpassing $1 Billion in Four Months
Against the backdrop of accelerating integration between traditional finance and crypto markets, tokenized U.S. stocks have reached a milestone. Binance’s tokenized stock product, bStocks, launched in June 2026, surpassed $1 billion in assets under management in just four months, with cumulative trading volume exceeding $40 billion. This achievement clearly demonstrates the accelerating demand among institutional investors for on-chain U.S. stocks and tokenized ETF products.
Binance now lists several tokenized U.S. stock products spanning sectors including technology, healthcare, and emerging markets. Investors can trade traditional U.S. stock assets directly on-chain, enjoying benefits unavailable in traditional markets, such as 24/7 trading and instant settlement. Binance Wallet has also launched a 50,000 USDC competition to further promote the on-chain bStocks trading ecosystem.
IV. Regulatory Tailwinds Loom as Stablecoin Payments Expand
On the regulatory front, the head of the U.S. Office of the Comptroller of the Currency confirmed that the final rules for the GENIUS Act’s stablecoin framework will be officially released by the end of October. This landmark regulatory development provides the industry with a clear legal foundation. Circle’s CEO then announced plans to expand USDC into around 50 new emerging markets, while Visa moved its USDC prefunded cross-border payment service from the pilot phase to full commercial rollout. Mastercard also completed its stablecoin integration during the same period. The simultaneous efforts of the three major payment giants mark the transformation of stablecoins from tools used within the crypto sector into core components of global payment infrastructure.
V. Outlook
Overall, although short-term inflation data has put pressure on markets, the crypto market’s resilience in rebounding, continued institutional inflows, and the rapid development of tokenized U.S. stocks and stablecoin payments all point to a clear signal: the integration of traditional finance and the blockchain world is accelerating irreversibly. While keeping an eye on short-term volatility, investors should also seize the long-term opportunities created by this historic trend.
#BitcoinRecoversTo$82K #BitcoinShortTermHoldersReach4.08MBTC #TIA
I. U.S. Inflation Data Shock Markets, Spreading Fear
In mid-October 2026, economic data for September released by the U.S. Department of Labor sent shockwaves through global markets. The Consumer Price Index rose 3.7% year over year, above market expectations of 3.6%. More concerningly, the Producer Price Index surged to 6.3% year over year, far exceeding the 5.3% forecast and reaching its highest level in four years. The figures directly fueled fears that the Federal Reserve might resume raising interest rates.
The crypto market bore the brunt of the reaction. Bitcoin briefly fell below the $80,000 mark, triggering a cascade of liquidations totaling about $950 million. Major tokens such as Ethereum and Solana also fell in tandem, and short-term market panic reached a peak. On-chain data showed that digital asset funds recorded net outflows of $434 million for the week, indicating that institutional investors were temporarily seeking safety amid inflationary pressure.
II. Bitcoin Rebounds Quickly as Short-Term Holder Supply Hits a Record
However, market resilience far exceeded expectations. After briefly dropping below $80,000, Bitcoin quickly rebounded to around $82,000, demonstrating strong support. Notably, on-chain data showed that short-term holders’ Bitcoin holdings had reached 4.08 million BTC, a record high. This suggests that despite macroeconomic uncertainty, substantial new capital continues to flow into the crypto market, and long-term bullish conviction remains intact.
Meanwhile, Binance recorded net inflows of $163 million, its highest level since early July, and has now seen inflows grow for four consecutive weeks. Binance CEO Deng Weizheng said that institutional inflows continued even during the week when inflation data delivered its sharpest shock, reflecting persistent growth in structural demand for crypto assets.
III. Tokenized U.S. Stocks Surge, with Binance bStocks Surpassing $1 Billion in Four Months
Against the backdrop of accelerating integration between traditional finance and crypto markets, tokenized U.S. stocks have reached a milestone. Binance’s tokenized stock product, bStocks, launched in June 2026, surpassed $1 billion in assets under management in just four months, with cumulative trading volume exceeding $40 billion. This achievement clearly demonstrates the accelerating demand among institutional investors for on-chain U.S. stocks and tokenized ETF products.
Binance now lists several tokenized U.S. stock products spanning sectors including technology, healthcare, and emerging markets. Investors can trade traditional U.S. stock assets directly on-chain, enjoying benefits unavailable in traditional markets, such as 24/7 trading and instant settlement. Binance Wallet has also launched a 50,000 USDC competition to further promote the on-chain bStocks trading ecosystem.
IV. Regulatory Tailwinds Loom as Stablecoin Payments Expand
On the regulatory front, the head of the U.S. Office of the Comptroller of the Currency confirmed that the final rules for the GENIUS Act’s stablecoin framework will be officially released by the end of October. This landmark regulatory development provides the industry with a clear legal foundation. Circle’s CEO then announced plans to expand USDC into around 50 new emerging markets, while Visa moved its USDC prefunded cross-border payment service from the pilot phase to full commercial rollout. Mastercard also completed its stablecoin integration during the same period. The simultaneous efforts of the three major payment giants mark the transformation of stablecoins from tools used within the crypto sector into core components of global payment infrastructure.
V. Outlook
Overall, although short-term inflation data has put pressure on markets, the crypto market’s resilience in rebounding, continued institutional inflows, and the rapid development of tokenized U.S. stocks and stablecoin payments all point to a clear signal: the integration of traditional finance and the blockchain world is accelerating irreversibly. While keeping an eye on short-term volatility, investors should also seize the long-term opportunities created by this historic trend.
#BitcoinRecoversTo$82K #BitcoinShortTermHoldersReach4.08MBTC #TIA
9

·
--
Everyone panicking right now is trading the noise instead of the chart
The crowd treats this recovery like a miracle while ignoring standard retests
Traders need to stop chasing green candles and wait for proper confirmation
My plan is sitting on my hands until the range actually breaks
A high volume breakdown below current support proves my caution was dead wrong
Agree?
#BitcoinRecoversTo$82K #CryptoNews
Everyone panicking right now is trading the noise instead of the chart
The crowd treats this recovery like a miracle while ignoring standard retests
Traders need to stop chasing green candles and wait for proper confirmation
My plan is sitting on my hands until the range actually breaks
A high volume breakdown below current support proves my caution was dead wrong
Agree?
#BitcoinRecoversTo$82K #CryptoNews
The crowd treats this recovery like a miracle while ignoring standard retests
Traders need to stop chasing green candles and wait for proper confirmation
My plan is sitting on my hands until the range actually breaks
A high volume breakdown below current support proves my caution was dead wrong
Agree?
#BitcoinRecoversTo$82K #CryptoNews
2

Is $BTC's move a liquidity-backed signal or a short-term spike? Bitcoin shows Score 159.45 – highest among Binance trade‑intent candidates with Binance 24h volume $31.13 B – deep liquidity for entry/exit. #BitcoinRecoversTo$82K Which confirmation would you watch next?
Is $BTC 's move a liquidity-backed signal or a short-term spike? Bitcoin shows Score 159.45 – highest among Binance trade‑intent candidates with Binance 24h volume $31.13 B – deep liquidity for entry/exit. #BitcoinRecoversTo$82K Which confirmation would you watch next?

62
·
--
BTC falls back below $82K | Modest ETF net inflows don’t mean a broad-based rally | I’m waiting for confirmation from both flows and price
My stance is not to chase longs for now. People on Binance Square are still discussing Bitcoin “reclaiming $82,000,” but an earlier screenshot cannot substitute for current trading prices. As I write, BTC/USD on Kraken is around $81,357, with a daily open of $82,135 and a 24-hour low of $80,705 and high of $82,826. The move back below $82,000 is an actual market reaction; its cause cannot simply be attributed to a single news item about fund flows.
What’s more worth examining today is U.S. spot Bitcoin ETFs. Farside’s fund-by-fund table has updated October 15 from pending to show net inflows of about $5.1 million, following net outflows of about $261.4 million on the previous trading day, October 14. The slight move into positive territory is clearly visible in the data, but it’s far from proof that institutional demand has fully recovered. On the 15th, IBIT saw inflows of about $16.8 million, BTCO had outflows of about $4.1 million, and Grayscale Mini BTC had outflows of about $7.6 million; several others were listed at zero. A positive total doesn’t mean every fund is attracting money, nor does it mean buying will continue on Friday.
Timing matters even more. In the table, the entries for each fund on October 16 are still dashes, while the page’s automatic total shows 0.0; this is not a confirmed “zero net inflow.” Inferring institutional retreat from that zero while the U.S. trading day is not yet over or the data is incomplete would be just as careless. ETF creations and redemptions reflect changes in fund share flows; they are not the same as immediate spot buying or selling on exchanges. And BTC’s intraday drop back below $82,000 doesn’t prove that ETF buying has failed. My assessment is that evidence of improving fund flows currently goes only as far as the 15th; we need to wait for the October 16 breakdown to be filled in before drawing conclusions.
Mechanically, if net inflows continue over multiple trading days and the price holds above a key range, allocation-driven buying could absorb spot selling pressure. Conversely, if the net inflow is just a one-day bounce from a low base and the price repeatedly fails below $82,000, short-term leveraged positions could amplify volatility. For now, the two pieces of evidence don’t confirm the same direction, so positioning should be more cautious than the outlook.
I’m watching three price levels: around $80,700, the intraday low; $80,000, a psychological round number; and $82,000–$82,800, the range that needs to be reclaimed and held. If BTC gets back above $82,000 but falls as soon as it touches $82,800, the market still looks range-bound. If it decisively breaks below $80,700, the next question is whether $80,000 can hold. If the price closes steadily above $82,800 and the October 16 ETF breakdown shows reliable net inflows, I’ll need to revise my cautious view. If BTC breaks below $80,000 and outflows grow, the short-term rebound thesis is invalidated.
If I were trading this myself, I wouldn’t chase the price now. I’d only consider a low-leverage spot long after confirmation, with no more than 5% of total capital committed to any single trade. The entry trigger would be a four-hour close above $82,800, followed by a retest that holds $82,000, alongside verification of the latest complete ETF breakdown. If any one of those conditions is missing, I’d stay out. The first target is $84,000, where I’d take half off; the second is $86,000, where I’d close the remaining position in stages. I’d place a stop below $81,800 and exit manually if the price moves back below $82,000 on a four-hour basis, even if the stop hasn’t been hit. If BTC breaks below $80,700 first, I’d cancel the long setup and wouldn’t add to a position against the trend. This is a conditional plan, not a trade that has already been executed, and there are no returns to review.
Sources: Farside’s fund-by-fund ETF flow table and live Kraken BTC/USD market data; topic activity from Binance Square. Figures are as of the time checked. #BitcoinRecoversTo$82K #BTC
This is solely my personal market commentary and does not constitute investment advice.
BTC falls back below $82K | Modest ETF net inflows don’t mean a broad-based rally | I’m waiting for confirmation from both flows and price
My stance is not to chase longs for now. People on Binance Square are still discussing Bitcoin “reclaiming $82,000,” but an earlier screenshot cannot substitute for current trading prices. As I write, BTC/USD on Kraken is around $81,357, with a daily open of $82,135 and a 24-hour low of $80,705 and high of $82,826. The move back below $82,000 is an actual market reaction; its cause cannot simply be attributed to a single news item about fund flows.
What’s more worth examining today is U.S. spot Bitcoin ETFs. Farside’s fund-by-fund table has updated October 15 from pending to show net inflows of about $5.1 million, following net outflows of about $261.4 million on the previous trading day, October 14. The slight move into positive territory is clearly visible in the data, but it’s far from proof that institutional demand has fully recovered. On the 15th, IBIT saw inflows of about $16.8 million, BTCO had outflows of about $4.1 million, and Grayscale Mini BTC had outflows of about $7.6 million; several others were listed at zero. A positive total doesn’t mean every fund is attracting money, nor does it mean buying will continue on Friday.
Timing matters even more. In the table, the entries for each fund on October 16 are still dashes, while the page’s automatic total shows 0.0; this is not a confirmed “zero net inflow.” Inferring institutional retreat from that zero while the U.S. trading day is not yet over or the data is incomplete would be just as careless. ETF creations and redemptions reflect changes in fund share flows; they are not the same as immediate spot buying or selling on exchanges. And BTC’s intraday drop back below $82,000 doesn’t prove that ETF buying has failed. My assessment is that evidence of improving fund flows currently goes only as far as the 15th; we need to wait for the October 16 breakdown to be filled in before drawing conclusions.
Mechanically, if net inflows continue over multiple trading days and the price holds above a key range, allocation-driven buying could absorb spot selling pressure. Conversely, if the net inflow is just a one-day bounce from a low base and the price repeatedly fails below $82,000, short-term leveraged positions could amplify volatility. For now, the two pieces of evidence don’t confirm the same direction, so positioning should be more cautious than the outlook.
I’m watching three price levels: around $80,700, the intraday low; $80,000, a psychological round number; and $82,000–$82,800, the range that needs to be reclaimed and held. If BTC gets back above $82,000 but falls as soon as it touches $82,800, the market still looks range-bound. If it decisively breaks below $80,700, the next question is whether $80,000 can hold. If the price closes steadily above $82,800 and the October 16 ETF breakdown shows reliable net inflows, I’ll need to revise my cautious view. If BTC breaks below $80,000 and outflows grow, the short-term rebound thesis is invalidated.
If I were trading this myself, I wouldn’t chase the price now. I’d only consider a low-leverage spot long after confirmation, with no more than 5% of total capital committed to any single trade. The entry trigger would be a four-hour close above $82,800, followed by a retest that holds $82,000, alongside verification of the latest complete ETF breakdown. If any one of those conditions is missing, I’d stay out. The first target is $84,000, where I’d take half off; the second is $86,000, where I’d close the remaining position in stages. I’d place a stop below $81,800 and exit manually if the price moves back below $82,000 on a four-hour basis, even if the stop hasn’t been hit. If BTC breaks below $80,700 first, I’d cancel the long setup and wouldn’t add to a position against the trend. This is a conditional plan, not a trade that has already been executed, and there are no returns to review.
Sources: Farside’s fund-by-fund ETF flow table and live Kraken BTC/USD market data; topic activity from Binance Square. Figures are as of the time checked. #BitcoinRecoversTo$82K #BTC
This is solely my personal market commentary and does not constitute investment advice.
My stance is not to chase longs for now. People on Binance Square are still discussing Bitcoin “reclaiming $82,000,” but an earlier screenshot cannot substitute for current trading prices. As I write, BTC/USD on Kraken is around $81,357, with a daily open of $82,135 and a 24-hour low of $80,705 and high of $82,826. The move back below $82,000 is an actual market reaction; its cause cannot simply be attributed to a single news item about fund flows.
What’s more worth examining today is U.S. spot Bitcoin ETFs. Farside’s fund-by-fund table has updated October 15 from pending to show net inflows of about $5.1 million, following net outflows of about $261.4 million on the previous trading day, October 14. The slight move into positive territory is clearly visible in the data, but it’s far from proof that institutional demand has fully recovered. On the 15th, IBIT saw inflows of about $16.8 million, BTCO had outflows of about $4.1 million, and Grayscale Mini BTC had outflows of about $7.6 million; several others were listed at zero. A positive total doesn’t mean every fund is attracting money, nor does it mean buying will continue on Friday.
Timing matters even more. In the table, the entries for each fund on October 16 are still dashes, while the page’s automatic total shows 0.0; this is not a confirmed “zero net inflow.” Inferring institutional retreat from that zero while the U.S. trading day is not yet over or the data is incomplete would be just as careless. ETF creations and redemptions reflect changes in fund share flows; they are not the same as immediate spot buying or selling on exchanges. And BTC’s intraday drop back below $82,000 doesn’t prove that ETF buying has failed. My assessment is that evidence of improving fund flows currently goes only as far as the 15th; we need to wait for the October 16 breakdown to be filled in before drawing conclusions.
Mechanically, if net inflows continue over multiple trading days and the price holds above a key range, allocation-driven buying could absorb spot selling pressure. Conversely, if the net inflow is just a one-day bounce from a low base and the price repeatedly fails below $82,000, short-term leveraged positions could amplify volatility. For now, the two pieces of evidence don’t confirm the same direction, so positioning should be more cautious than the outlook.
I’m watching three price levels: around $80,700, the intraday low; $80,000, a psychological round number; and $82,000–$82,800, the range that needs to be reclaimed and held. If BTC gets back above $82,000 but falls as soon as it touches $82,800, the market still looks range-bound. If it decisively breaks below $80,700, the next question is whether $80,000 can hold. If the price closes steadily above $82,800 and the October 16 ETF breakdown shows reliable net inflows, I’ll need to revise my cautious view. If BTC breaks below $80,000 and outflows grow, the short-term rebound thesis is invalidated.
If I were trading this myself, I wouldn’t chase the price now. I’d only consider a low-leverage spot long after confirmation, with no more than 5% of total capital committed to any single trade. The entry trigger would be a four-hour close above $82,800, followed by a retest that holds $82,000, alongside verification of the latest complete ETF breakdown. If any one of those conditions is missing, I’d stay out. The first target is $84,000, where I’d take half off; the second is $86,000, where I’d close the remaining position in stages. I’d place a stop below $81,800 and exit manually if the price moves back below $82,000 on a four-hour basis, even if the stop hasn’t been hit. If BTC breaks below $80,700 first, I’d cancel the long setup and wouldn’t add to a position against the trend. This is a conditional plan, not a trade that has already been executed, and there are no returns to review.
Sources: Farside’s fund-by-fund ETF flow table and live Kraken BTC/USD market data; topic activity from Binance Square. Figures are as of the time checked. #BitcoinRecoversTo$82K #BTC
This is solely my personal market commentary and does not constitute investment advice.

1
Log in to explore more content
Join global crypto users on Binance Square
⚡️ Get latest and useful information about crypto.
💬 Trusted by the world’s largest crypto exchange.
👍 Discover real insights from verified creators.
Email / Phone number
Trending Topics
1
#NvidiaLoses$2.7TrillionInMonthAndAHalf
2,415 views
54 Discussing
2
#CanBTCReboundAfterFallingBelow60K?
582,639 views
2,465 Discussing
3
#GlobalStocksFaceLongestLosingStreakSince2023
199,690 views
1,694 Discussing
4
#BlackRockIBITPostsRecord$541MSingleDayOutflow
18,677 views
60 Discussing
5
#AnthropicPlungesTowardIPOPriceonDay2
99,351 views
993 Discussing
6
#TwentyOneCapitalAdds172.25BTC
42,165 views
494 Discussing
7
#HKBillWouldExcludeTokenizedDepositsFromVirtualAssets
4,329 views
47 Discussing
8
#BNBDropsBelow540USDTWith8.46%DailyDecline
57,132 views
513 Discussing
9
#HKBillProposesHK$100KFineForUnauthorizedCryptoTitles
1,946 views
20 Discussing
10
#BitMineFaces$10.1BUnrealizedETHLoss
4,177 views
25 Discussing