
#dogeanalysis
dogeanalysis
264,431 views
263 Discussing
Hot
Latest

Article
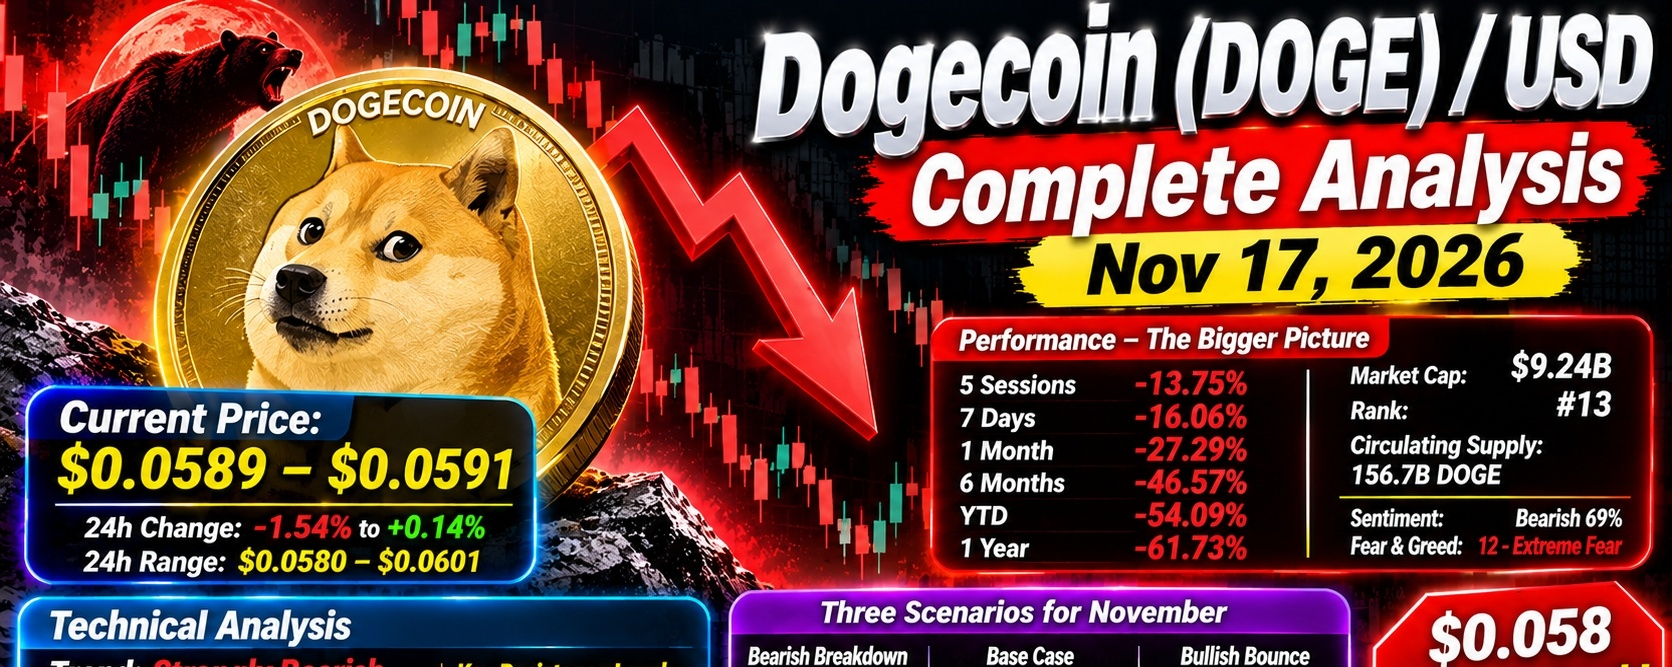
Dogecoin (DOGE) / USD - Complete Analysis Nov 17, 2026Dogecoin ($DOGE ) / USD - Complete Analysis Nov 17, 2026
1. Live Price Snapshot
Current Price: ~ $0.0589 - $0.0591
24h Change: -1.54% to +0.14% (flat, consolidating at lows)
24h Range: $0.0580 - $0.0601
Previous Close: $0.05897
Open Today: $0.05897
{spot}(DOGEUSDT)
DOGE is barely holding above $0.058 after making fresh 2026 lows. It's in a tight, low-volume chop - the market is exhausted after weeks of selling.
2. Performance - The Bigger Picture
$BTC
DOGE is one of the weakest majors this year:
| Period | Return |
| --- | --- |
| 5 Sessions | -13.75% |
| 7 Days | -16.06% |
| 1 Month | -27.29% |
| 6 Months | -46.57% |
| Year-to-Date | -54.09% |
| 1 Year | -61.73% |
Market Cap: ~ $9.24 Billion
Rank: #13 by market cap
Circulating Supply: ∼156.7 Billion DOGE (inflationary, no max supply)
Sentiment: Bearish 69% | Fear & Greed: 12 - Extreme Fear
DOGE has lost over 60% in a year and is down more than 40% from its late-September level. It's now trading at a 3-year low territory.
$ETH
3. Technical Analysis
Trend: Strongly Bearish - Death Cross Territory
DOGE is trading below ALL major moving averages:
20-day EMA: ∼$0.0782
50-day EMA: ∼$0.082 - $0.09
100-day EMA: ∼$0.083
200-day EMA: ∼$0.0885 - $0.09
Price at $0.059 is ∼25% below its 20-day average. This is a massive gap - every recent buyer is deep underwater.
Key Levels to Watch:
Support (Floor):
S1 - Immediate: $0.0578 - $0.0580 - Today's low. Must hold.
S2 - Critical: $0.0554 - $0.0560 - Fresh low zone from Nov 14-15. This is THE line.
S3 - Breakdown: $0.0540 - If $0.055 breaks, this is next
S4 - Bear Target: $0.0400 - Analysts warn a break of $0.059-$0.060 support band exposes $0.04
Resistance (Ceiling):
R1 - Immediate: $0.0605 - $0.0618 - Pivot + first resistance. Psychological $0.06 level.
R2 - Key: $0.0630 - $0.0650 - November forecast high
R3 - Major: $0.0715 - $0.0782 - Wedge floor + 20-day EMA. Bearish until this is reclaimed.
R4 - Trend Reversal: $0.0800 - $0.0850 - Weekly Bollinger + old support. Only a close above $0.08 flips trend.
Pivot Today: $0.05808
30-Day Range: ∼$0.0554 (Low) to ∼$0.08+ (High)
Chart Pattern: Some analysts see a possible Double Bottom forming near $0.055-$0.058, but it is NOT confirmed yet. Needs a break above $0.0618 to validate.
4. Why Is It Falling? - Fundamental Drivers
1. Whale Selling: Large holders have been continuously selling, keeping pressure on price even on bounce attempts. Whale activity is diverging - distribution, not accumulation.
2. ETF Demand Minimal: Dogecoin ETF demand remains very weak. Plus, 21Shares ended its support agreement with House of Doge on Nov 5, a negative institutional signal.
3. 7th Consecutive Weekly Decline: DOGE is in its 7th straight week down - longest losing streak in years. Momentum is completely broken.
4. Meme-Coin Rotation Out: Capital has rotated out of meme coins into Bitcoin / safer assets during Extreme Fear. DOGE, with unlimited supply, suffers most.
5. Three Scenarios for November
1. Bearish Breakdown Case - 40% Probability
Break below $0.0554 -> crash to $0.054 -> $0.050 -> $0.040. This is the danger zone if Bitcoin also drops.
2. Base / Consolidation Case - 45% Probability
Hold $0.055-$0.058, chop between $0.053 - $0.065 for rest of November. Slow grind, no real rally. November forecast: Low $0.053, Avg $0.061, High $0.065.
3. Bullish Bounce Case - 15% Probability
Hold $0.058 + close above $0.0618 -> bounce to $0.063 -> $0.071 -> $0.074. Needs whale buying + Bitcoin recovery. Only a close above $0.0782 confirms a real reversal.
6. Verdict
Short-term: Bearish / At Critical Support
Medium-term: Bearish until $0.078 is reclaimed
Long-term: Still the #1 meme coin, but in a deep bear cycle
For Traders: $0.058 is make-or-break. A bounce to $0.061 is possible, but $0.063-$0.065 is where sellers will likely step in. Do NOT buy a break below $0.055.
For Holders: The $0.055-$0.060 zone is your line in the sand. Holding it keeps a double-bottom alive. Losing it opens $0.04, which would be a -32% further drop from here.
This is not financial advice. DOGE is highly volatile and inflationary - never invest more than you can afford to lose.
Want me to compare:
DOGE vs SOL - which is stronger right now?
DOGE vs SHIB / PEPE - meme coin battle?
Best DCA zones for DOGE long-term?
#Dogecoin #DOGEAnalysis #DOGEUSDT #doge⚡ #TrendingPredictions
Dogecoin (DOGE) / USD - Complete Analysis Nov 17, 2026
Dogecoin ($DOGE ) / USD - Complete Analysis Nov 17, 2026
1. Live Price Snapshot
Current Price: ~ $0.0589 - $0.0591
24h Change: -1.54% to +0.14% (flat, consolidating at lows)
24h Range: $0.0580 - $0.0601
Previous Close: $0.05897
Open Today: $0.05897
DOGE is barely holding above $0.058 after making fresh 2026 lows. It's in a tight, low-volume chop - the market is exhausted after weeks of selling.
2. Performance - The Bigger Picture
$BTC
DOGE is one of the weakest majors this year:
| Period | Return |
| --- | --- |
| 5 Sessions | -13.75% |
| 7 Days | -16.06% |
| 1 Month | -27.29% |
| 6 Months | -46.57% |
| Year-to-Date | -54.09% |
| 1 Year | -61.73% |
Market Cap: ~ $9.24 Billion
Rank: #13 by market cap
Circulating Supply: ∼156.7 Billion DOGE (inflationary, no max supply)
Sentiment: Bearish 69% | Fear & Greed: 12 - Extreme Fear
DOGE has lost over 60% in a year and is down more than 40% from its late-September level. It's now trading at a 3-year low territory.
$ETH
3. Technical Analysis
Trend: Strongly Bearish - Death Cross Territory
DOGE is trading below ALL major moving averages:
20-day EMA: ∼$0.0782
50-day EMA: ∼$0.082 - $0.09
100-day EMA: ∼$0.083
200-day EMA: ∼$0.0885 - $0.09
Price at $0.059 is ∼25% below its 20-day average. This is a massive gap - every recent buyer is deep underwater.
Key Levels to Watch:
Support (Floor):
S1 - Immediate: $0.0578 - $0.0580 - Today's low. Must hold.
S2 - Critical: $0.0554 - $0.0560 - Fresh low zone from Nov 14-15. This is THE line.
S3 - Breakdown: $0.0540 - If $0.055 breaks, this is next
S4 - Bear Target: $0.0400 - Analysts warn a break of $0.059-$0.060 support band exposes $0.04
Resistance (Ceiling):
R1 - Immediate: $0.0605 - $0.0618 - Pivot + first resistance. Psychological $0.06 level.
R2 - Key: $0.0630 - $0.0650 - November forecast high
R3 - Major: $0.0715 - $0.0782 - Wedge floor + 20-day EMA. Bearish until this is reclaimed.
R4 - Trend Reversal: $0.0800 - $0.0850 - Weekly Bollinger + old support. Only a close above $0.08 flips trend.
Pivot Today: $0.05808
30-Day Range: ∼$0.0554 (Low) to ∼$0.08+ (High)
Chart Pattern: Some analysts see a possible Double Bottom forming near $0.055-$0.058, but it is NOT confirmed yet. Needs a break above $0.0618 to validate.
4. Why Is It Falling? - Fundamental Drivers
1. Whale Selling: Large holders have been continuously selling, keeping pressure on price even on bounce attempts. Whale activity is diverging - distribution, not accumulation.
2. ETF Demand Minimal: Dogecoin ETF demand remains very weak. Plus, 21Shares ended its support agreement with House of Doge on Nov 5, a negative institutional signal.
3. 7th Consecutive Weekly Decline: DOGE is in its 7th straight week down - longest losing streak in years. Momentum is completely broken.
4. Meme-Coin Rotation Out: Capital has rotated out of meme coins into Bitcoin / safer assets during Extreme Fear. DOGE, with unlimited supply, suffers most.
5. Three Scenarios for November
1. Bearish Breakdown Case - 40% Probability
Break below $0.0554 -> crash to $0.054 -> $0.050 -> $0.040. This is the danger zone if Bitcoin also drops.
2. Base / Consolidation Case - 45% Probability
Hold $0.055-$0.058, chop between $0.053 - $0.065 for rest of November. Slow grind, no real rally. November forecast: Low $0.053, Avg $0.061, High $0.065.
3. Bullish Bounce Case - 15% Probability
Hold $0.058 + close above $0.0618 -> bounce to $0.063 -> $0.071 -> $0.074. Needs whale buying + Bitcoin recovery. Only a close above $0.0782 confirms a real reversal.
6. Verdict
Short-term: Bearish / At Critical Support
Medium-term: Bearish until $0.078 is reclaimed
Long-term: Still the #1 meme coin, but in a deep bear cycle
For Traders: $0.058 is make-or-break. A bounce to $0.061 is possible, but $0.063-$0.065 is where sellers will likely step in. Do NOT buy a break below $0.055.
For Holders: The $0.055-$0.060 zone is your line in the sand. Holding it keeps a double-bottom alive. Losing it opens $0.04, which would be a -32% further drop from here.
This is not financial advice. DOGE is highly volatile and inflationary - never invest more than you can afford to lose.
Want me to compare:
DOGE vs SOL - which is stronger right now?
DOGE vs SHIB / PEPE - meme coin battle?
Best DCA zones for DOGE long-term?
#Dogecoin #DOGEAnalysis #DOGEUSDT #doge⚡ #TrendingPredictions
1. Live Price Snapshot
Current Price: ~ $0.0589 - $0.0591
24h Change: -1.54% to +0.14% (flat, consolidating at lows)
24h Range: $0.0580 - $0.0601
Previous Close: $0.05897
Open Today: $0.05897
DOGE is barely holding above $0.058 after making fresh 2026 lows. It's in a tight, low-volume chop - the market is exhausted after weeks of selling.
2. Performance - The Bigger Picture
$BTC
DOGE is one of the weakest majors this year:
| Period | Return |
| --- | --- |
| 5 Sessions | -13.75% |
| 7 Days | -16.06% |
| 1 Month | -27.29% |
| 6 Months | -46.57% |
| Year-to-Date | -54.09% |
| 1 Year | -61.73% |
Market Cap: ~ $9.24 Billion
Rank: #13 by market cap
Circulating Supply: ∼156.7 Billion DOGE (inflationary, no max supply)
Sentiment: Bearish 69% | Fear & Greed: 12 - Extreme Fear
DOGE has lost over 60% in a year and is down more than 40% from its late-September level. It's now trading at a 3-year low territory.
$ETH
3. Technical Analysis
Trend: Strongly Bearish - Death Cross Territory
DOGE is trading below ALL major moving averages:
20-day EMA: ∼$0.0782
50-day EMA: ∼$0.082 - $0.09
100-day EMA: ∼$0.083
200-day EMA: ∼$0.0885 - $0.09
Price at $0.059 is ∼25% below its 20-day average. This is a massive gap - every recent buyer is deep underwater.
Key Levels to Watch:
Support (Floor):
S1 - Immediate: $0.0578 - $0.0580 - Today's low. Must hold.
S2 - Critical: $0.0554 - $0.0560 - Fresh low zone from Nov 14-15. This is THE line.
S3 - Breakdown: $0.0540 - If $0.055 breaks, this is next
S4 - Bear Target: $0.0400 - Analysts warn a break of $0.059-$0.060 support band exposes $0.04
Resistance (Ceiling):
R1 - Immediate: $0.0605 - $0.0618 - Pivot + first resistance. Psychological $0.06 level.
R2 - Key: $0.0630 - $0.0650 - November forecast high
R3 - Major: $0.0715 - $0.0782 - Wedge floor + 20-day EMA. Bearish until this is reclaimed.
R4 - Trend Reversal: $0.0800 - $0.0850 - Weekly Bollinger + old support. Only a close above $0.08 flips trend.
Pivot Today: $0.05808
30-Day Range: ∼$0.0554 (Low) to ∼$0.08+ (High)
Chart Pattern: Some analysts see a possible Double Bottom forming near $0.055-$0.058, but it is NOT confirmed yet. Needs a break above $0.0618 to validate.
4. Why Is It Falling? - Fundamental Drivers
1. Whale Selling: Large holders have been continuously selling, keeping pressure on price even on bounce attempts. Whale activity is diverging - distribution, not accumulation.
2. ETF Demand Minimal: Dogecoin ETF demand remains very weak. Plus, 21Shares ended its support agreement with House of Doge on Nov 5, a negative institutional signal.
3. 7th Consecutive Weekly Decline: DOGE is in its 7th straight week down - longest losing streak in years. Momentum is completely broken.
4. Meme-Coin Rotation Out: Capital has rotated out of meme coins into Bitcoin / safer assets during Extreme Fear. DOGE, with unlimited supply, suffers most.
5. Three Scenarios for November
1. Bearish Breakdown Case - 40% Probability
Break below $0.0554 -> crash to $0.054 -> $0.050 -> $0.040. This is the danger zone if Bitcoin also drops.
2. Base / Consolidation Case - 45% Probability
Hold $0.055-$0.058, chop between $0.053 - $0.065 for rest of November. Slow grind, no real rally. November forecast: Low $0.053, Avg $0.061, High $0.065.
3. Bullish Bounce Case - 15% Probability
Hold $0.058 + close above $0.0618 -> bounce to $0.063 -> $0.071 -> $0.074. Needs whale buying + Bitcoin recovery. Only a close above $0.0782 confirms a real reversal.
6. Verdict
Short-term: Bearish / At Critical Support
Medium-term: Bearish until $0.078 is reclaimed
Long-term: Still the #1 meme coin, but in a deep bear cycle
For Traders: $0.058 is make-or-break. A bounce to $0.061 is possible, but $0.063-$0.065 is where sellers will likely step in. Do NOT buy a break below $0.055.
For Holders: The $0.055-$0.060 zone is your line in the sand. Holding it keeps a double-bottom alive. Losing it opens $0.04, which would be a -32% further drop from here.
This is not financial advice. DOGE is highly volatile and inflationary - never invest more than you can afford to lose.
Want me to compare:
DOGE vs SOL - which is stronger right now?
DOGE vs SHIB / PEPE - meme coin battle?
Best DCA zones for DOGE long-term?
#Dogecoin #DOGEAnalysis #DOGEUSDT #doge⚡ #TrendingPredictions
46
Article
Dogecoin (DOGE / USD) - Complete Analysis | 16 Nov 2026Dogecoin ($DOGE / USD) - Complete Analysis | 16 Nov 2026
1. Current Price Snapshot
Price: ~$0.0589
24h Change: +2.04% - a small bounce after a sharp sell-off
24h Range: $0.05716 - $0.06012
Previous Day Close (15 Nov): $0.0593
Market Cap: ~$9.01B - $9.26B
Rank: ~#12-13 by market cap
Circulating Supply: ~156.75 billion DOGE
$DOGE fell to ∼$0.0558 on Sunday, its lowest price since October 2022, before recovering slightly.
{spot}(DOGEUSDT)
### 2. Performance - The Big Picture is Bearish
| Period | Return |
| --- | --- |
| 5 Sessions | -12.85% |
| 1 Month | -26.74% |
| 6 Months | -45.78% |
| Year-to-Date 2026 | -53.24% |
| 1 Year | -62.6% |
DOGE is down -15.23% in 7 days and -27.29% in 30 days.
This is not a normal pullback. It's a sustained downtrend through most of 2026, with futures open interest collapsing 72% since January.
3. Technical Analysis
Trend: Clear downtrend on daily and weekly charts.
Momentum - Oversold:
Daily RSI (14): 25.5 - 26.8 - deep oversold territory
Weekly RSI: 33.86 - close to oversold
MACD: Below signal line - bearish
Moving Averages: Price is -15.93% below 20-day MA, -25.17% below 50-day MA, -28.92% below 200-day MA
Death Cross: 50-day MA is below 200-day MA
Oversold does NOT mean buy automatically. It means selling is exhausted, so a short-term bounce is likely, but the main trend is still down until price reclaims key levels.
Key Levels to Watch:
| Type | Levels |
| --- | --- |
| Immediate Support | $0.0578 - $0.0586 |
| Strong Support | $0.0550 - $0.0569 - if this breaks, next is $0.050 |
| Immediate Resistance | $0.0618 - $0.0680 |
| Major Resistance | $0.072 - $0.075 |
| Bullish Confirmation | $0.079 - $0.080 (50-day EMA + 50/200 MA cluster) |
The nearest support sits at $0.05863, about 0.78% below price, while nearest major resistance is at $0.07511, roughly 27% above.
4. Fundamentals - Why DOGE is Struggling
a) Unlimited Supply / Inflation
DOGE has no max supply. Every block pays 10,000 DOGE, creating ∼5.26 billion new DOGE per year. At current supply, that's ∼3.4% - 3.6% inflation per year.
That means demand must grow >3.5% every year just for price to stay flat.
b) Weak ETF Demand
2026 was supposed to be the ETF year. The SEC classified Dogecoin as a digital commodity in March 2026, clearing the way for spot ETFs.
But reality disappointed:
Spot DOGE ETFs hold only $14.33 million in assets - negligible vs $9B+ market cap
Bitwise announced it would liquidate its Dogecoin ETF (BWOW) in September 2026, less than a year after launch, after only ∼$318,000 net inflows in August
c) Lack of Utility
DOGE is still primarily a meme / payments coin with no smart contracts, no staking yield, and limited developer activity compared to Bitcoin, Ethereum, or Solana. Its price is driven almost entirely by sentiment, social media, and Elon Musk-related headlines.
d) Holder Behaviour
Short-term holders reduced their supply share from 17.47% in Jan 2025 to 7.24% by late 2025, while large wallets actively offloaded holdings - a sign of distribution, not accumulation.
5. Scenarios & Forecasts
These are analyst estimates, not guarantees. Forecasts vary wildly because DOGE is sentiment-driven.
End of 2026:
Bearish: $0.045 - $0.062
Base: $0.062 - $0.091
Bullish: $0.091 - $0.130
2027:
Bearish: $0.040 - $0.065
Base: $0.070 - $0.120
Bullish: $0.130 - $0.200
One model puts Nov 2026 target at $0.069, within a $0.063 - $0.073 band, and Jan 2027 at $0.077.
Long-term $1 forecasts exist for 2029-2030, but they would require DOGE's market cap to reach ∼$156B+ at current supply - more than 17x from here. Treat those as extreme bull cases, not base cases.
6. What Could Change the Trend?
Bullish Triggers:
Holding $0.055 and reclaiming $0.068, then $0.075
Renewed retail / meme cycle or a major Elon Musk / X payments integration
A proposed block reward cut from 10,000 to 1,000 DOGE per block - would slash inflation dramatically if approved
Broader crypto market recovery / Bitcoin rally lifting altcoins
Bearish Triggers:
Losing $0.055 support - opens $0.050, then $0.040
Continued ETF outflows / closures
Bitcoin weakness dragging the whole market down
No new utility catalyst
7. Verdict
Short-term (days-weeks): Oversold bounce likely, but capped at $0.062 - $0.068 unless volume returns.
Medium-term (1-3 months): Still bearish until DOGE closes above $0.075 - $0.080. Below that, rallies are likely to be sold.
Long-term: $DOGE remains a high-risk, high-volatility meme asset. Its unlimited supply is a structural headwind. It only works as a small, speculative position, not as a core holding.
This is not financial advice. DOGE can move 10-20% in a day on sentiment alone. If you trade it, use strict risk management and never invest more than you can afford to lose.
#Dogecoin #DOGEAnalysis #DOGEUSDT #Doge🚀🚀🚀 #TrendingTopic
Dogecoin (DOGE / USD) - Complete Analysis | 16 Nov 2026
Dogecoin ($DOGE / USD) - Complete Analysis | 16 Nov 2026
1. Current Price Snapshot
Price: ~$0.0589
24h Change: +2.04% - a small bounce after a sharp sell-off
24h Range: $0.05716 - $0.06012
Previous Day Close (15 Nov): $0.0593
Market Cap: ~$9.01B - $9.26B
Rank: ~#12-13 by market cap
Circulating Supply: ~156.75 billion DOGE
$DOGE fell to ∼$0.0558 on Sunday, its lowest price since October 2022, before recovering slightly.
### 2. Performance - The Big Picture is Bearish
| Period | Return |
| --- | --- |
| 5 Sessions | -12.85% |
| 1 Month | -26.74% |
| 6 Months | -45.78% |
| Year-to-Date 2026 | -53.24% |
| 1 Year | -62.6% |
DOGE is down -15.23% in 7 days and -27.29% in 30 days.
This is not a normal pullback. It's a sustained downtrend through most of 2026, with futures open interest collapsing 72% since January.
3. Technical Analysis
Trend: Clear downtrend on daily and weekly charts.
Momentum - Oversold:
Daily RSI (14): 25.5 - 26.8 - deep oversold territory
Weekly RSI: 33.86 - close to oversold
MACD: Below signal line - bearish
Moving Averages: Price is -15.93% below 20-day MA, -25.17% below 50-day MA, -28.92% below 200-day MA
Death Cross: 50-day MA is below 200-day MA
Oversold does NOT mean buy automatically. It means selling is exhausted, so a short-term bounce is likely, but the main trend is still down until price reclaims key levels.
Key Levels to Watch:
| Type | Levels |
| --- | --- |
| Immediate Support | $0.0578 - $0.0586 |
| Strong Support | $0.0550 - $0.0569 - if this breaks, next is $0.050 |
| Immediate Resistance | $0.0618 - $0.0680 |
| Major Resistance | $0.072 - $0.075 |
| Bullish Confirmation | $0.079 - $0.080 (50-day EMA + 50/200 MA cluster) |
The nearest support sits at $0.05863, about 0.78% below price, while nearest major resistance is at $0.07511, roughly 27% above.
4. Fundamentals - Why DOGE is Struggling
a) Unlimited Supply / Inflation
DOGE has no max supply. Every block pays 10,000 DOGE, creating ∼5.26 billion new DOGE per year. At current supply, that's ∼3.4% - 3.6% inflation per year.
That means demand must grow >3.5% every year just for price to stay flat.
b) Weak ETF Demand
2026 was supposed to be the ETF year. The SEC classified Dogecoin as a digital commodity in March 2026, clearing the way for spot ETFs.
But reality disappointed:
Spot DOGE ETFs hold only $14.33 million in assets - negligible vs $9B+ market cap
Bitwise announced it would liquidate its Dogecoin ETF (BWOW) in September 2026, less than a year after launch, after only ∼$318,000 net inflows in August
c) Lack of Utility
DOGE is still primarily a meme / payments coin with no smart contracts, no staking yield, and limited developer activity compared to Bitcoin, Ethereum, or Solana. Its price is driven almost entirely by sentiment, social media, and Elon Musk-related headlines.
d) Holder Behaviour
Short-term holders reduced their supply share from 17.47% in Jan 2025 to 7.24% by late 2025, while large wallets actively offloaded holdings - a sign of distribution, not accumulation.
5. Scenarios & Forecasts
These are analyst estimates, not guarantees. Forecasts vary wildly because DOGE is sentiment-driven.
End of 2026:
Bearish: $0.045 - $0.062
Base: $0.062 - $0.091
Bullish: $0.091 - $0.130
2027:
Bearish: $0.040 - $0.065
Base: $0.070 - $0.120
Bullish: $0.130 - $0.200
One model puts Nov 2026 target at $0.069, within a $0.063 - $0.073 band, and Jan 2027 at $0.077.
Long-term $1 forecasts exist for 2029-2030, but they would require DOGE's market cap to reach ∼$156B+ at current supply - more than 17x from here. Treat those as extreme bull cases, not base cases.
6. What Could Change the Trend?
Bullish Triggers:
Holding $0.055 and reclaiming $0.068, then $0.075
Renewed retail / meme cycle or a major Elon Musk / X payments integration
A proposed block reward cut from 10,000 to 1,000 DOGE per block - would slash inflation dramatically if approved
Broader crypto market recovery / Bitcoin rally lifting altcoins
Bearish Triggers:
Losing $0.055 support - opens $0.050, then $0.040
Continued ETF outflows / closures
Bitcoin weakness dragging the whole market down
No new utility catalyst
7. Verdict
Short-term (days-weeks): Oversold bounce likely, but capped at $0.062 - $0.068 unless volume returns.
Medium-term (1-3 months): Still bearish until DOGE closes above $0.075 - $0.080. Below that, rallies are likely to be sold.
Long-term: $DOGE remains a high-risk, high-volatility meme asset. Its unlimited supply is a structural headwind. It only works as a small, speculative position, not as a core holding.
This is not financial advice. DOGE can move 10-20% in a day on sentiment alone. If you trade it, use strict risk management and never invest more than you can afford to lose.
#Dogecoin #DOGEAnalysis #DOGEUSDT #Doge🚀🚀🚀 #TrendingTopic
1. Current Price Snapshot
Price: ~$0.0589
24h Change: +2.04% - a small bounce after a sharp sell-off
24h Range: $0.05716 - $0.06012
Previous Day Close (15 Nov): $0.0593
Market Cap: ~$9.01B - $9.26B
Rank: ~#12-13 by market cap
Circulating Supply: ~156.75 billion DOGE
$DOGE fell to ∼$0.0558 on Sunday, its lowest price since October 2022, before recovering slightly.
### 2. Performance - The Big Picture is Bearish
| Period | Return |
| --- | --- |
| 5 Sessions | -12.85% |
| 1 Month | -26.74% |
| 6 Months | -45.78% |
| Year-to-Date 2026 | -53.24% |
| 1 Year | -62.6% |
DOGE is down -15.23% in 7 days and -27.29% in 30 days.
This is not a normal pullback. It's a sustained downtrend through most of 2026, with futures open interest collapsing 72% since January.
3. Technical Analysis
Trend: Clear downtrend on daily and weekly charts.
Momentum - Oversold:
Daily RSI (14): 25.5 - 26.8 - deep oversold territory
Weekly RSI: 33.86 - close to oversold
MACD: Below signal line - bearish
Moving Averages: Price is -15.93% below 20-day MA, -25.17% below 50-day MA, -28.92% below 200-day MA
Death Cross: 50-day MA is below 200-day MA
Oversold does NOT mean buy automatically. It means selling is exhausted, so a short-term bounce is likely, but the main trend is still down until price reclaims key levels.
Key Levels to Watch:
| Type | Levels |
| --- | --- |
| Immediate Support | $0.0578 - $0.0586 |
| Strong Support | $0.0550 - $0.0569 - if this breaks, next is $0.050 |
| Immediate Resistance | $0.0618 - $0.0680 |
| Major Resistance | $0.072 - $0.075 |
| Bullish Confirmation | $0.079 - $0.080 (50-day EMA + 50/200 MA cluster) |
The nearest support sits at $0.05863, about 0.78% below price, while nearest major resistance is at $0.07511, roughly 27% above.
4. Fundamentals - Why DOGE is Struggling
a) Unlimited Supply / Inflation
DOGE has no max supply. Every block pays 10,000 DOGE, creating ∼5.26 billion new DOGE per year. At current supply, that's ∼3.4% - 3.6% inflation per year.
That means demand must grow >3.5% every year just for price to stay flat.
b) Weak ETF Demand
2026 was supposed to be the ETF year. The SEC classified Dogecoin as a digital commodity in March 2026, clearing the way for spot ETFs.
But reality disappointed:
Spot DOGE ETFs hold only $14.33 million in assets - negligible vs $9B+ market cap
Bitwise announced it would liquidate its Dogecoin ETF (BWOW) in September 2026, less than a year after launch, after only ∼$318,000 net inflows in August
c) Lack of Utility
DOGE is still primarily a meme / payments coin with no smart contracts, no staking yield, and limited developer activity compared to Bitcoin, Ethereum, or Solana. Its price is driven almost entirely by sentiment, social media, and Elon Musk-related headlines.
d) Holder Behaviour
Short-term holders reduced their supply share from 17.47% in Jan 2025 to 7.24% by late 2025, while large wallets actively offloaded holdings - a sign of distribution, not accumulation.
5. Scenarios & Forecasts
These are analyst estimates, not guarantees. Forecasts vary wildly because DOGE is sentiment-driven.
End of 2026:
Bearish: $0.045 - $0.062
Base: $0.062 - $0.091
Bullish: $0.091 - $0.130
2027:
Bearish: $0.040 - $0.065
Base: $0.070 - $0.120
Bullish: $0.130 - $0.200
One model puts Nov 2026 target at $0.069, within a $0.063 - $0.073 band, and Jan 2027 at $0.077.
Long-term $1 forecasts exist for 2029-2030, but they would require DOGE's market cap to reach ∼$156B+ at current supply - more than 17x from here. Treat those as extreme bull cases, not base cases.
6. What Could Change the Trend?
Bullish Triggers:
Holding $0.055 and reclaiming $0.068, then $0.075
Renewed retail / meme cycle or a major Elon Musk / X payments integration
A proposed block reward cut from 10,000 to 1,000 DOGE per block - would slash inflation dramatically if approved
Broader crypto market recovery / Bitcoin rally lifting altcoins
Bearish Triggers:
Losing $0.055 support - opens $0.050, then $0.040
Continued ETF outflows / closures
Bitcoin weakness dragging the whole market down
No new utility catalyst
7. Verdict
Short-term (days-weeks): Oversold bounce likely, but capped at $0.062 - $0.068 unless volume returns.
Medium-term (1-3 months): Still bearish until DOGE closes above $0.075 - $0.080. Below that, rallies are likely to be sold.
Long-term: $DOGE remains a high-risk, high-volatility meme asset. Its unlimited supply is a structural headwind. It only works as a small, speculative position, not as a core holding.
This is not financial advice. DOGE can move 10-20% in a day on sentiment alone. If you trade it, use strict risk management and never invest more than you can afford to lose.
#Dogecoin #DOGEAnalysis #DOGEUSDT #Doge🚀🚀🚀 #TrendingTopic
77
Article
DOGE/USD Complete Analysis — 10 Nov 2026$DOGE /USD Complete Analysis — 10 Nov 2026
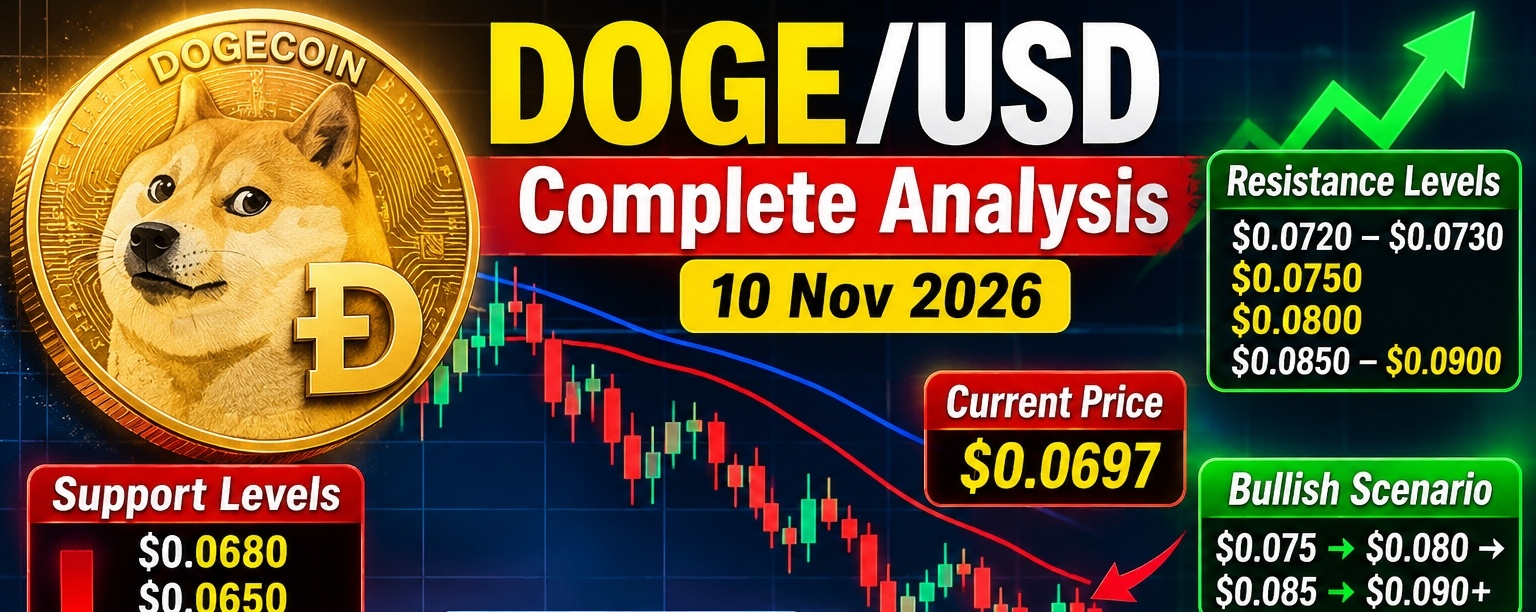
Current price: around $0.0697. DOGE has been trading in a weak range after recently touching roughly $0.0679–$0.0680.
{spot}(DOGEUSDT)
📊 Technical picture
The overall trend is bearish, although $DOGE is approaching oversold territory.
- RSI: ~38 → bearish, but not deeply oversold on some readings.
- MACD: bearish.
- Moving averages: predominantly Sell/Strong Sell.
- Price remains below important longer-term trend levels.
- Daily technical analysis shows 9 sell signals vs. 1 buy in one 18-signal model.
🟢 Key support levels
Support Importance
$0.0680 Immediate/key support
$0.0650 Secondary support
$0.0600 Major psychological support
$0.0550 Bearish breakdown target
A confirmed daily close below $0.068 would significantly weaken the structure and could expose the $0.055–$0.060 area.
🔴 Resistance levels
Resistance Importance
$0.0720–$0.0730 First recovery barrier
$0.0750 Major short-term resistance
$0.0800 Psychological resistance
$0.0850–$0.0900 Stronger recovery zone
A daily close above $0.075 would improve the short-term setup, while a move through $0.080 would provide stronger evidence of a trend reversal. Current market analysis also identifies $0.075 as an important upside level.
📈 Bullish scenario
If $DOGE holds $0.068 and breaks $0.075 with strong volume:
$0.075 → $0.080 → $0.085 → $0.090
A sustained move above $0.090 could open the way toward $0.10+, but that would require broader crypto-market strength and renewed DOGE demand.
📉 Bearish scenario
If $0.068 breaks decisively, especially on a daily close:
$0.068 → $0.065 → $0.060 → $0.055
The derivatives market also deserves caution: futures volume is currently far larger than spot volume, while open interest is around $933M, meaning leverage can amplify moves in either direction.
🐋 Market/fundamental factors
DOGE currently lacks a strong confirmed coin-specific catalyst. Recent reporting indicates weak ETF flows, reduced on-chain activity, and some whale selling. The 21Shares/House of Doge support agreement was also terminated, although that does not mean the ETF itself was closed.
The broader market remains particularly important for DOGE. Today's U.S. inflation data and Bitcoin's reaction can influence risk appetite and therefore meme-coin performance.
🎯 My trading bias
Short term: Bearish → Neutral
Medium term: Bearish until $0.075–$0.080 is reclaimed.
- Above $0.075: bullish momentum starts improving.
- Above $0.080: stronger bullish confirmation.
- Below $0.068: bearish continuation risk.
- Below $0.060: potentially much deeper downside.
Best level to watch right now: $0.068. Holding this level could produce a relief bounce; losing it could accelerate the decline.
This is market analysis, not financial advice. DOGE is highly volatile, so use appropriate risk management and avoid excessive leverage.
#Dogecoin #DOGEAnalysis #DOGEUSDT #TrendingTopic #viralpost
DOGE/USD Complete Analysis — 10 Nov 2026
$DOGE /USD Complete Analysis — 10 Nov 2026
Current price: around $0.0697. DOGE has been trading in a weak range after recently touching roughly $0.0679–$0.0680.
📊 Technical picture
The overall trend is bearish, although $DOGE is approaching oversold territory.
- RSI: ~38 → bearish, but not deeply oversold on some readings.
- MACD: bearish.
- Moving averages: predominantly Sell/Strong Sell.
- Price remains below important longer-term trend levels.
- Daily technical analysis shows 9 sell signals vs. 1 buy in one 18-signal model.
🟢 Key support levels
Support Importance
$0.0680 Immediate/key support
$0.0650 Secondary support
$0.0600 Major psychological support
$0.0550 Bearish breakdown target
A confirmed daily close below $0.068 would significantly weaken the structure and could expose the $0.055–$0.060 area.
🔴 Resistance levels
Resistance Importance
$0.0720–$0.0730 First recovery barrier
$0.0750 Major short-term resistance
$0.0800 Psychological resistance
$0.0850–$0.0900 Stronger recovery zone
A daily close above $0.075 would improve the short-term setup, while a move through $0.080 would provide stronger evidence of a trend reversal. Current market analysis also identifies $0.075 as an important upside level.
📈 Bullish scenario
If $DOGE holds $0.068 and breaks $0.075 with strong volume:
$0.075 → $0.080 → $0.085 → $0.090
A sustained move above $0.090 could open the way toward $0.10+, but that would require broader crypto-market strength and renewed DOGE demand.
📉 Bearish scenario
If $0.068 breaks decisively, especially on a daily close:
$0.068 → $0.065 → $0.060 → $0.055
The derivatives market also deserves caution: futures volume is currently far larger than spot volume, while open interest is around $933M, meaning leverage can amplify moves in either direction.
🐋 Market/fundamental factors
DOGE currently lacks a strong confirmed coin-specific catalyst. Recent reporting indicates weak ETF flows, reduced on-chain activity, and some whale selling. The 21Shares/House of Doge support agreement was also terminated, although that does not mean the ETF itself was closed.
The broader market remains particularly important for DOGE. Today's U.S. inflation data and Bitcoin's reaction can influence risk appetite and therefore meme-coin performance.
🎯 My trading bias
Short term: Bearish → Neutral
Medium term: Bearish until $0.075–$0.080 is reclaimed.
- Above $0.075: bullish momentum starts improving.
- Above $0.080: stronger bullish confirmation.
- Below $0.068: bearish continuation risk.
- Below $0.060: potentially much deeper downside.
Best level to watch right now: $0.068. Holding this level could produce a relief bounce; losing it could accelerate the decline.
This is market analysis, not financial advice. DOGE is highly volatile, so use appropriate risk management and avoid excessive leverage.
#Dogecoin #DOGEAnalysis #DOGEUSDT #TrendingTopic #viralpost
Current price: around $0.0697. DOGE has been trading in a weak range after recently touching roughly $0.0679–$0.0680.
📊 Technical picture
The overall trend is bearish, although $DOGE is approaching oversold territory.
- RSI: ~38 → bearish, but not deeply oversold on some readings.
- MACD: bearish.
- Moving averages: predominantly Sell/Strong Sell.
- Price remains below important longer-term trend levels.
- Daily technical analysis shows 9 sell signals vs. 1 buy in one 18-signal model.
🟢 Key support levels
Support Importance
$0.0680 Immediate/key support
$0.0650 Secondary support
$0.0600 Major psychological support
$0.0550 Bearish breakdown target
A confirmed daily close below $0.068 would significantly weaken the structure and could expose the $0.055–$0.060 area.
🔴 Resistance levels
Resistance Importance
$0.0720–$0.0730 First recovery barrier
$0.0750 Major short-term resistance
$0.0800 Psychological resistance
$0.0850–$0.0900 Stronger recovery zone
A daily close above $0.075 would improve the short-term setup, while a move through $0.080 would provide stronger evidence of a trend reversal. Current market analysis also identifies $0.075 as an important upside level.
📈 Bullish scenario
If $DOGE holds $0.068 and breaks $0.075 with strong volume:
$0.075 → $0.080 → $0.085 → $0.090
A sustained move above $0.090 could open the way toward $0.10+, but that would require broader crypto-market strength and renewed DOGE demand.
📉 Bearish scenario
If $0.068 breaks decisively, especially on a daily close:
$0.068 → $0.065 → $0.060 → $0.055
The derivatives market also deserves caution: futures volume is currently far larger than spot volume, while open interest is around $933M, meaning leverage can amplify moves in either direction.
🐋 Market/fundamental factors
DOGE currently lacks a strong confirmed coin-specific catalyst. Recent reporting indicates weak ETF flows, reduced on-chain activity, and some whale selling. The 21Shares/House of Doge support agreement was also terminated, although that does not mean the ETF itself was closed.
The broader market remains particularly important for DOGE. Today's U.S. inflation data and Bitcoin's reaction can influence risk appetite and therefore meme-coin performance.
🎯 My trading bias
Short term: Bearish → Neutral
Medium term: Bearish until $0.075–$0.080 is reclaimed.
- Above $0.075: bullish momentum starts improving.
- Above $0.080: stronger bullish confirmation.
- Below $0.068: bearish continuation risk.
- Below $0.060: potentially much deeper downside.
Best level to watch right now: $0.068. Holding this level could produce a relief bounce; losing it could accelerate the decline.
This is market analysis, not financial advice. DOGE is highly volatile, so use appropriate risk management and avoid excessive leverage.
#Dogecoin #DOGEAnalysis #DOGEUSDT #TrendingTopic #viralpost
13
Article
DOGE/USD Complete Analysis — 9 Nov 2026$DOGE /USD Complete Analysis — 9 Nov 2026
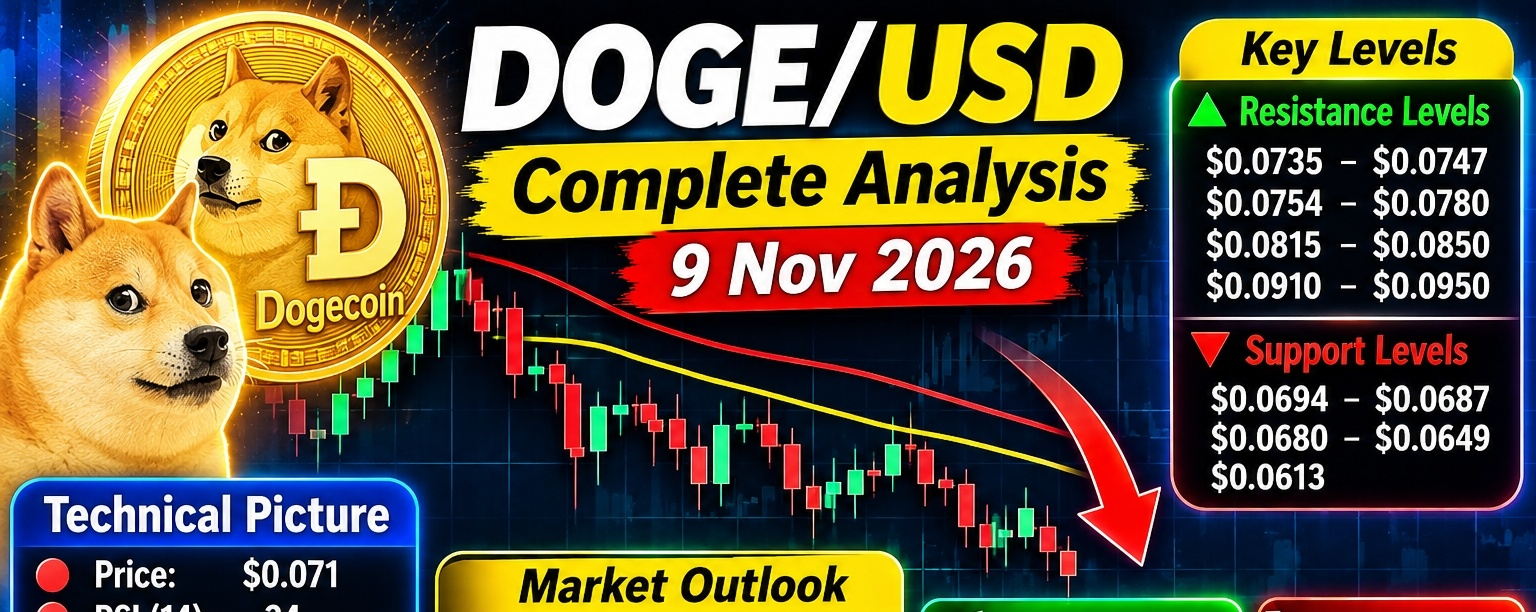
Current $DOGE price: around $0.071. Dogecoin is currently in a clearly bearish technical structure, trading below its 20-day and 50-day moving averages. Daily RSI is around 34, showing weak momentum but approaching oversold territory.
{spot}(DOGEUSDT)
📊 Technical picture
Indicator Current reading Signal
Price ~$0.071 🔴 Bearish
RSI ~34 🔴 Weak
20-day MA ~$0.0761 🔴 Resistance
50-day MA ~$0.0841 🔴 Resistance
MACD Below signal 🔴 Bearish
Short-term trend Down 🔴 Bearish
Medium-term trend Down 🔴 Bearish
Long-term trend Bearish 🔴/🟡
$DOGE is down roughly 9.9% over 20 days and is trading close to its recent low. The 50-day moving average has also fallen below the 200-day average, producing a death-cross structure.
🟢 Key support levels
- $0.0694 — immediate support
- $0.0687 — next support
- $0.0680 — deeper short-term support
- $0.0649 — important downside target
- $0.0613 — major lower support
The most important immediate zone is $0.069–$0.068. A decisive break below it would increase the probability of DOGE moving toward $0.065 and potentially $0.061.
🔴 Resistance levels
- $0.0735 — immediate pivot
- $0.0747 — first resistance
- $0.0754 — next resistance
- $0.0760–$0.0780 — major recovery zone
- $0.0815 — important trend resistance
- $0.084–$0.085 — major resistance
- $0.091–$0.095 — larger recovery zone
DOGE needs to reclaim $0.0735 first. Above that, $0.0747–$0.0754 becomes the next test. A sustained move above $0.078–$0.0815 would be much more constructive.
📈 Bullish scenario
If DOGE holds $0.069–$0.070 and recovers $0.0735, the potential path is:
$0.0735 → $0.0747 → $0.0754 → $0.078 → $0.0815
A daily close above $0.0815 would substantially improve the technical structure and could open the way toward:
$0.084 → $0.091 → $0.095
The broader recovery case becomes stronger if DOGE eventually reclaims the 200-day average, currently around the high-$0.08s/near $0.09 area.
📉 Bearish scenario
If DOGE loses $0.0694, the downside path becomes:
$0.0687 → $0.0680 → $0.0649 → $0.0613
A confirmed daily close below $0.068 would be a significant bearish development.
The recent 2026 low is approximately $0.0690, so the current price is already very close to that level.
🧠 Market outlook
DOGE currently lacks a strong independent bullish catalyst, meaning its price is likely to remain highly sensitive to Bitcoin, overall crypto liquidity and risk sentiment. Technical evidence currently dominates: price is below major averages, MACD is negative, and the daily trend remains down.
Upcoming U.S. inflation data and Federal Reserve speeches could also create significant crypto volatility this week.
🎯 My DOGE/USD outlook
Short term: 🔴 Bearish
Medium term: 🔴 Bearish
Long term: 🔴 Bearish, but reversal possible
Most important levels
Critical support: $0.069–$0.068
Bullish confirmation: $0.0755–$0.078
Strong bullish confirmation: $0.0815+
Major bearish confirmation: Below $0.068
Bottom line
DOGE is not showing a confirmed reversal yet. The first sign of strength would be a recovery above $0.0735–$0.0755. A move above $0.078–$0.0815 would provide much stronger evidence that buyers are taking control.
On the other hand, losing $0.068 could expose DOGE to $0.065 and $0.061.
Overall bias: 🔴 Bearish until DOGE reclaims $0.078–$0.0815.
This is technical market analysis, not financial advice.
#Dogecoin #DOGEAnalysis #DOGEUSDT #analysis #viralpost
DOGE/USD Complete Analysis — 9 Nov 2026
$DOGE /USD Complete Analysis — 9 Nov 2026
Current $DOGE price: around $0.071. Dogecoin is currently in a clearly bearish technical structure, trading below its 20-day and 50-day moving averages. Daily RSI is around 34, showing weak momentum but approaching oversold territory.
📊 Technical picture
Indicator Current reading Signal
Price ~$0.071 🔴 Bearish
RSI ~34 🔴 Weak
20-day MA ~$0.0761 🔴 Resistance
50-day MA ~$0.0841 🔴 Resistance
MACD Below signal 🔴 Bearish
Short-term trend Down 🔴 Bearish
Medium-term trend Down 🔴 Bearish
Long-term trend Bearish 🔴/🟡
$DOGE is down roughly 9.9% over 20 days and is trading close to its recent low. The 50-day moving average has also fallen below the 200-day average, producing a death-cross structure.
🟢 Key support levels
- $0.0694 — immediate support
- $0.0687 — next support
- $0.0680 — deeper short-term support
- $0.0649 — important downside target
- $0.0613 — major lower support
The most important immediate zone is $0.069–$0.068. A decisive break below it would increase the probability of DOGE moving toward $0.065 and potentially $0.061.
🔴 Resistance levels
- $0.0735 — immediate pivot
- $0.0747 — first resistance
- $0.0754 — next resistance
- $0.0760–$0.0780 — major recovery zone
- $0.0815 — important trend resistance
- $0.084–$0.085 — major resistance
- $0.091–$0.095 — larger recovery zone
DOGE needs to reclaim $0.0735 first. Above that, $0.0747–$0.0754 becomes the next test. A sustained move above $0.078–$0.0815 would be much more constructive.
📈 Bullish scenario
If DOGE holds $0.069–$0.070 and recovers $0.0735, the potential path is:
$0.0735 → $0.0747 → $0.0754 → $0.078 → $0.0815
A daily close above $0.0815 would substantially improve the technical structure and could open the way toward:
$0.084 → $0.091 → $0.095
The broader recovery case becomes stronger if DOGE eventually reclaims the 200-day average, currently around the high-$0.08s/near $0.09 area.
📉 Bearish scenario
If DOGE loses $0.0694, the downside path becomes:
$0.0687 → $0.0680 → $0.0649 → $0.0613
A confirmed daily close below $0.068 would be a significant bearish development.
The recent 2026 low is approximately $0.0690, so the current price is already very close to that level.
🧠 Market outlook
DOGE currently lacks a strong independent bullish catalyst, meaning its price is likely to remain highly sensitive to Bitcoin, overall crypto liquidity and risk sentiment. Technical evidence currently dominates: price is below major averages, MACD is negative, and the daily trend remains down.
Upcoming U.S. inflation data and Federal Reserve speeches could also create significant crypto volatility this week.
🎯 My DOGE/USD outlook
Short term: 🔴 Bearish
Medium term: 🔴 Bearish
Long term: 🔴 Bearish, but reversal possible
Most important levels
Critical support: $0.069–$0.068
Bullish confirmation: $0.0755–$0.078
Strong bullish confirmation: $0.0815+
Major bearish confirmation: Below $0.068
Bottom line
DOGE is not showing a confirmed reversal yet. The first sign of strength would be a recovery above $0.0735–$0.0755. A move above $0.078–$0.0815 would provide much stronger evidence that buyers are taking control.
On the other hand, losing $0.068 could expose DOGE to $0.065 and $0.061.
Overall bias: 🔴 Bearish until DOGE reclaims $0.078–$0.0815.
This is technical market analysis, not financial advice.
#Dogecoin #DOGEAnalysis #DOGEUSDT #analysis #viralpost
Current $DOGE price: around $0.071. Dogecoin is currently in a clearly bearish technical structure, trading below its 20-day and 50-day moving averages. Daily RSI is around 34, showing weak momentum but approaching oversold territory.
📊 Technical picture
Indicator Current reading Signal
Price ~$0.071 🔴 Bearish
RSI ~34 🔴 Weak
20-day MA ~$0.0761 🔴 Resistance
50-day MA ~$0.0841 🔴 Resistance
MACD Below signal 🔴 Bearish
Short-term trend Down 🔴 Bearish
Medium-term trend Down 🔴 Bearish
Long-term trend Bearish 🔴/🟡
$DOGE is down roughly 9.9% over 20 days and is trading close to its recent low. The 50-day moving average has also fallen below the 200-day average, producing a death-cross structure.
🟢 Key support levels
- $0.0694 — immediate support
- $0.0687 — next support
- $0.0680 — deeper short-term support
- $0.0649 — important downside target
- $0.0613 — major lower support
The most important immediate zone is $0.069–$0.068. A decisive break below it would increase the probability of DOGE moving toward $0.065 and potentially $0.061.
🔴 Resistance levels
- $0.0735 — immediate pivot
- $0.0747 — first resistance
- $0.0754 — next resistance
- $0.0760–$0.0780 — major recovery zone
- $0.0815 — important trend resistance
- $0.084–$0.085 — major resistance
- $0.091–$0.095 — larger recovery zone
DOGE needs to reclaim $0.0735 first. Above that, $0.0747–$0.0754 becomes the next test. A sustained move above $0.078–$0.0815 would be much more constructive.
📈 Bullish scenario
If DOGE holds $0.069–$0.070 and recovers $0.0735, the potential path is:
$0.0735 → $0.0747 → $0.0754 → $0.078 → $0.0815
A daily close above $0.0815 would substantially improve the technical structure and could open the way toward:
$0.084 → $0.091 → $0.095
The broader recovery case becomes stronger if DOGE eventually reclaims the 200-day average, currently around the high-$0.08s/near $0.09 area.
📉 Bearish scenario
If DOGE loses $0.0694, the downside path becomes:
$0.0687 → $0.0680 → $0.0649 → $0.0613
A confirmed daily close below $0.068 would be a significant bearish development.
The recent 2026 low is approximately $0.0690, so the current price is already very close to that level.
🧠 Market outlook
DOGE currently lacks a strong independent bullish catalyst, meaning its price is likely to remain highly sensitive to Bitcoin, overall crypto liquidity and risk sentiment. Technical evidence currently dominates: price is below major averages, MACD is negative, and the daily trend remains down.
Upcoming U.S. inflation data and Federal Reserve speeches could also create significant crypto volatility this week.
🎯 My DOGE/USD outlook
Short term: 🔴 Bearish
Medium term: 🔴 Bearish
Long term: 🔴 Bearish, but reversal possible
Most important levels
Critical support: $0.069–$0.068
Bullish confirmation: $0.0755–$0.078
Strong bullish confirmation: $0.0815+
Major bearish confirmation: Below $0.068
Bottom line
DOGE is not showing a confirmed reversal yet. The first sign of strength would be a recovery above $0.0735–$0.0755. A move above $0.078–$0.0815 would provide much stronger evidence that buyers are taking control.
On the other hand, losing $0.068 could expose DOGE to $0.065 and $0.061.
Overall bias: 🔴 Bearish until DOGE reclaims $0.078–$0.0815.
This is technical market analysis, not financial advice.
#Dogecoin #DOGEAnalysis #DOGEUSDT #analysis #viralpost
112

·
--
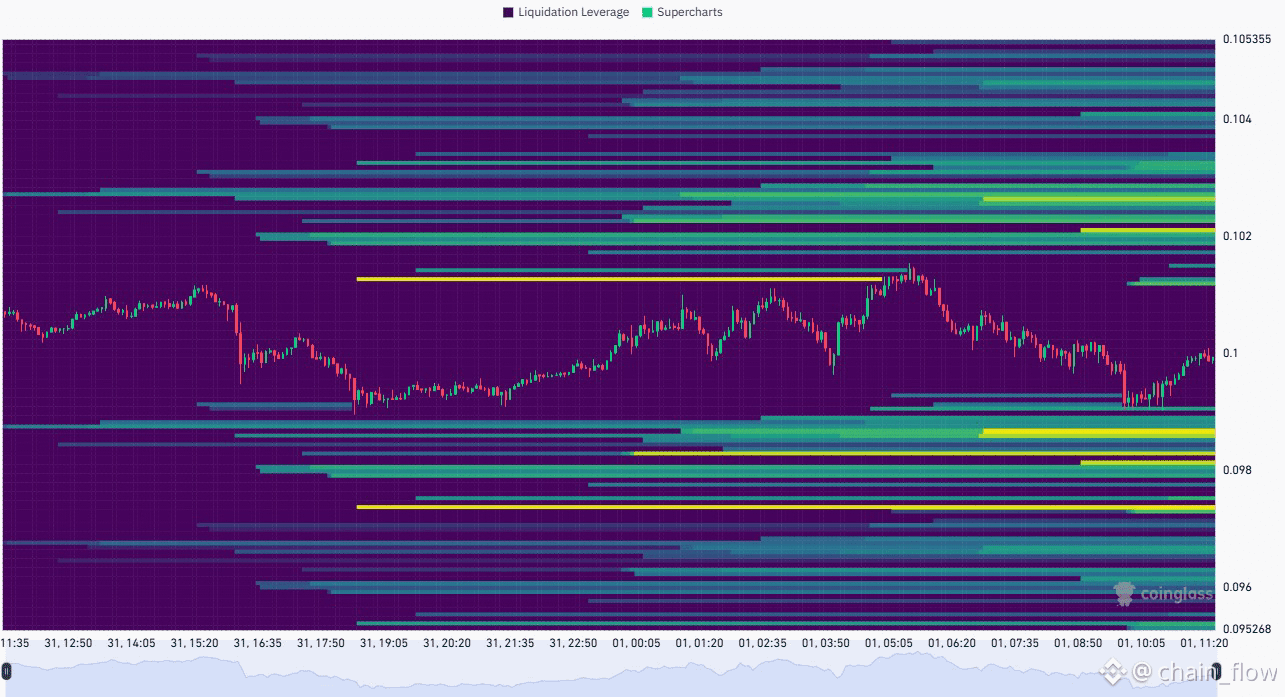
Is the $DOGE short squeeze actually real this time? Let’s talk logic
Right now, DOGE is hovering at 0.1009. The order book feels paper-thin, and my immediate instinct says caution. But the data shows an undeniable structural imbalance
The cluster of short liquidations sitting right above us at 0.1026–0.1046 completely outweighs the long risk below
Step-by-step, if we protect the 0.099 pivot, the math says shorts get sequentially wiped out up to 0.1106.
I hesitate because meme coins love a dirty stop-hunt first, but the risk-to-reward looks skewed toward the upside.
Invalidation is simple: a clean break below 0.099 and I’m out. How are you sizing this?
#DOGEAnalysis #CryptoLiquidation
#MemeAlpha #Write2Earn
Is the $DOGE short squeeze actually real this time? Let’s talk logic
Right now, DOGE is hovering at 0.1009. The order book feels paper-thin, and my immediate instinct says caution. But the data shows an undeniable structural imbalance
The cluster of short liquidations sitting right above us at 0.1026–0.1046 completely outweighs the long risk below
Step-by-step, if we protect the 0.099 pivot, the math says shorts get sequentially wiped out up to 0.1106.
I hesitate because meme coins love a dirty stop-hunt first, but the risk-to-reward looks skewed toward the upside.
Invalidation is simple: a clean break below 0.099 and I’m out. How are you sizing this?
#DOGEAnalysis #CryptoLiquidation
#MemeAlpha #Write2Earn
Right now, DOGE is hovering at 0.1009. The order book feels paper-thin, and my immediate instinct says caution. But the data shows an undeniable structural imbalance
The cluster of short liquidations sitting right above us at 0.1026–0.1046 completely outweighs the long risk below
Step-by-step, if we protect the 0.099 pivot, the math says shorts get sequentially wiped out up to 0.1106.
I hesitate because meme coins love a dirty stop-hunt first, but the risk-to-reward looks skewed toward the upside.
Invalidation is simple: a clean break below 0.099 and I’m out. How are you sizing this?
#DOGEAnalysis #CryptoLiquidation
#MemeAlpha #Write2Earn
1
168

·
--
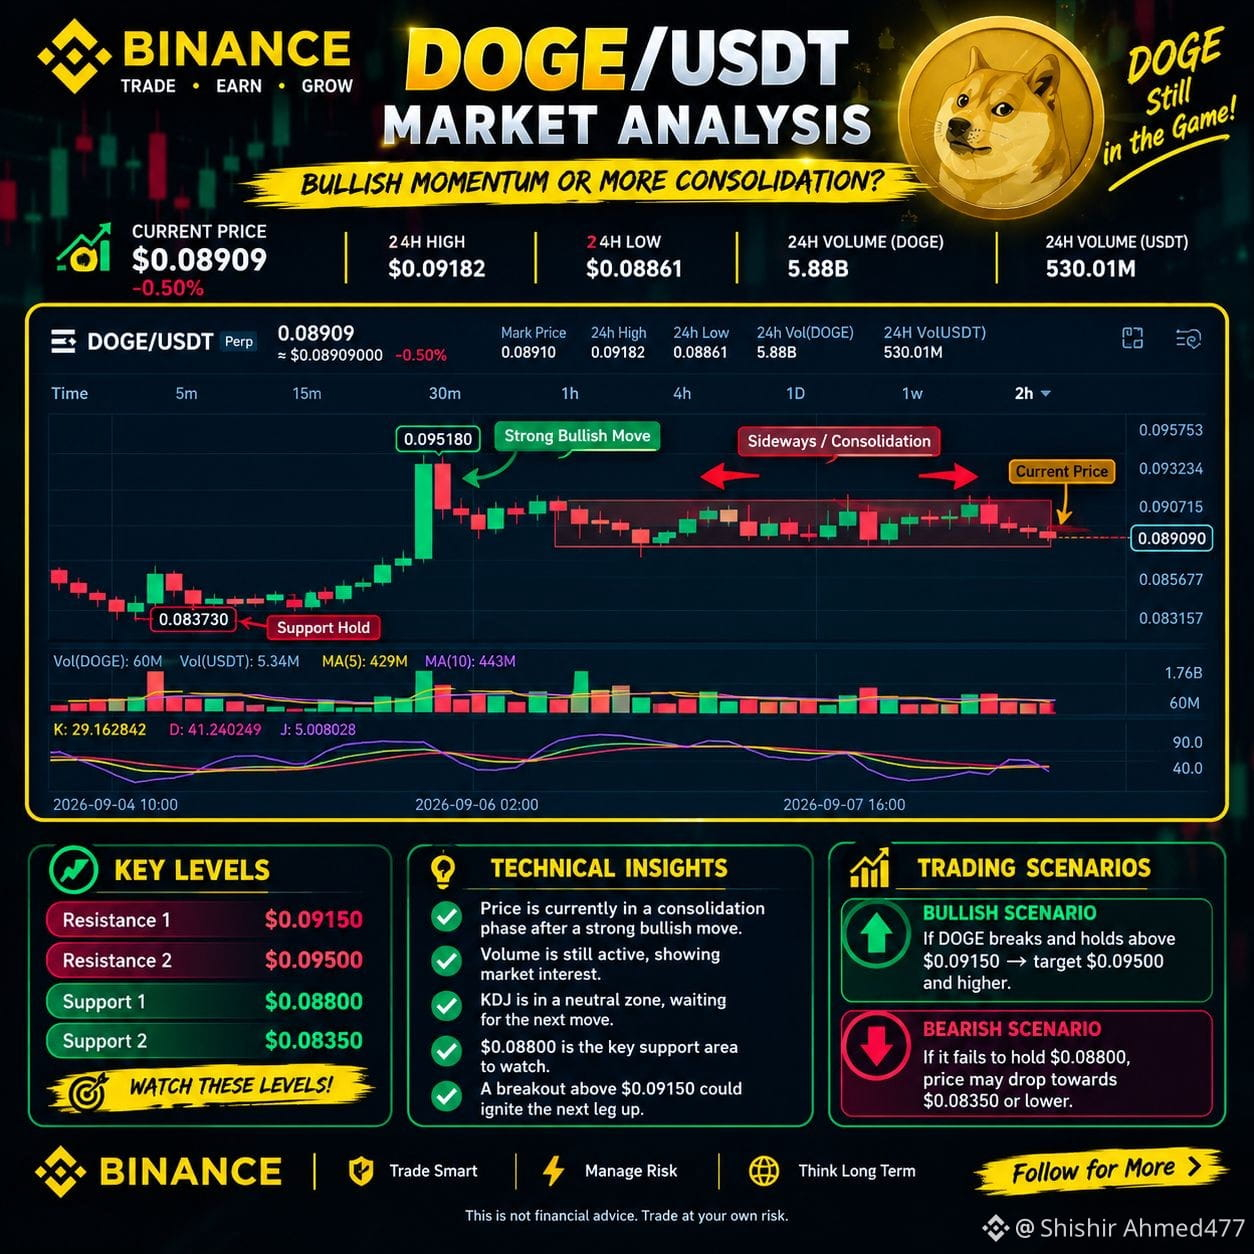
🔥 DOGE/USDT Technical Analysis | 2H Chart 🐕📊
DOGE is currently trading around $0.08909, showing sideways consolidation after a strong bullish move from the $0.08373 area.
📌 Key Levels 🔴 Resistance 1: $0.09150
🔴 Resistance 2: $0.09500
🟢 Support 1: $0.08800
🟢 Support 2: $0.08350
🚀 Bullish Scenario:
If DOGE breaks and holds above $0.09150, the next potential target zone is $0.09500 and higher.
📉 Bearish Scenario:
If DOGE fails to hold $0.08800, price could retest $0.08350 or lower.
📊 Technical View:
DOGE is currently in a consolidation phase. Volume remains active, while KDJ is showing weaker short-term momentum. The $0.09150 breakout could be the key signal for the next major move.
🎯 Watch the levels — don't chase the move.
Will DOGE break $0.09150 🚀 or drop toward $0.08350 📉?
⚠️ This is technical analysis, not financial advice. Always manage your risk and do your own research.
#DOGE #DOGEUSDT #Dogecoin #Binance #Crypto #CryptoTrading #TechnicalAnalysis #TradingSignal #Altcoins #BinanceSquare #CryptoMarket #DOGEAnalysis
🔥 DOGE/USDT Technical Analysis | 2H Chart 🐕📊
DOGE is currently trading around $0.08909, showing sideways consolidation after a strong bullish move from the $0.08373 area.
📌 Key Levels 🔴 Resistance 1: $0.09150
🔴 Resistance 2: $0.09500
🟢 Support 1: $0.08800
🟢 Support 2: $0.08350
🚀 Bullish Scenario:
If DOGE breaks and holds above $0.09150, the next potential target zone is $0.09500 and higher.
📉 Bearish Scenario:
If DOGE fails to hold $0.08800, price could retest $0.08350 or lower.
📊 Technical View:
DOGE is currently in a consolidation phase. Volume remains active, while KDJ is showing weaker short-term momentum. The $0.09150 breakout could be the key signal for the next major move.
🎯 Watch the levels — don't chase the move.
Will DOGE break $0.09150 🚀 or drop toward $0.08350 📉?
⚠️ This is technical analysis, not financial advice. Always manage your risk and do your own research.
#DOGE #DOGEUSDT #Dogecoin #Binance #Crypto #CryptoTrading #TechnicalAnalysis #TradingSignal #Altcoins #BinanceSquare #CryptoMarket #DOGEAnalysis
DOGE is currently trading around $0.08909, showing sideways consolidation after a strong bullish move from the $0.08373 area.
📌 Key Levels 🔴 Resistance 1: $0.09150
🔴 Resistance 2: $0.09500
🟢 Support 1: $0.08800
🟢 Support 2: $0.08350
🚀 Bullish Scenario:
If DOGE breaks and holds above $0.09150, the next potential target zone is $0.09500 and higher.
📉 Bearish Scenario:
If DOGE fails to hold $0.08800, price could retest $0.08350 or lower.
📊 Technical View:
DOGE is currently in a consolidation phase. Volume remains active, while KDJ is showing weaker short-term momentum. The $0.09150 breakout could be the key signal for the next major move.
🎯 Watch the levels — don't chase the move.
Will DOGE break $0.09150 🚀 or drop toward $0.08350 📉?
⚠️ This is technical analysis, not financial advice. Always manage your risk and do your own research.
#DOGE #DOGEUSDT #Dogecoin #Binance #Crypto #CryptoTrading #TechnicalAnalysis #TradingSignal #Altcoins #BinanceSquare #CryptoMarket #DOGEAnalysis
61

·
--
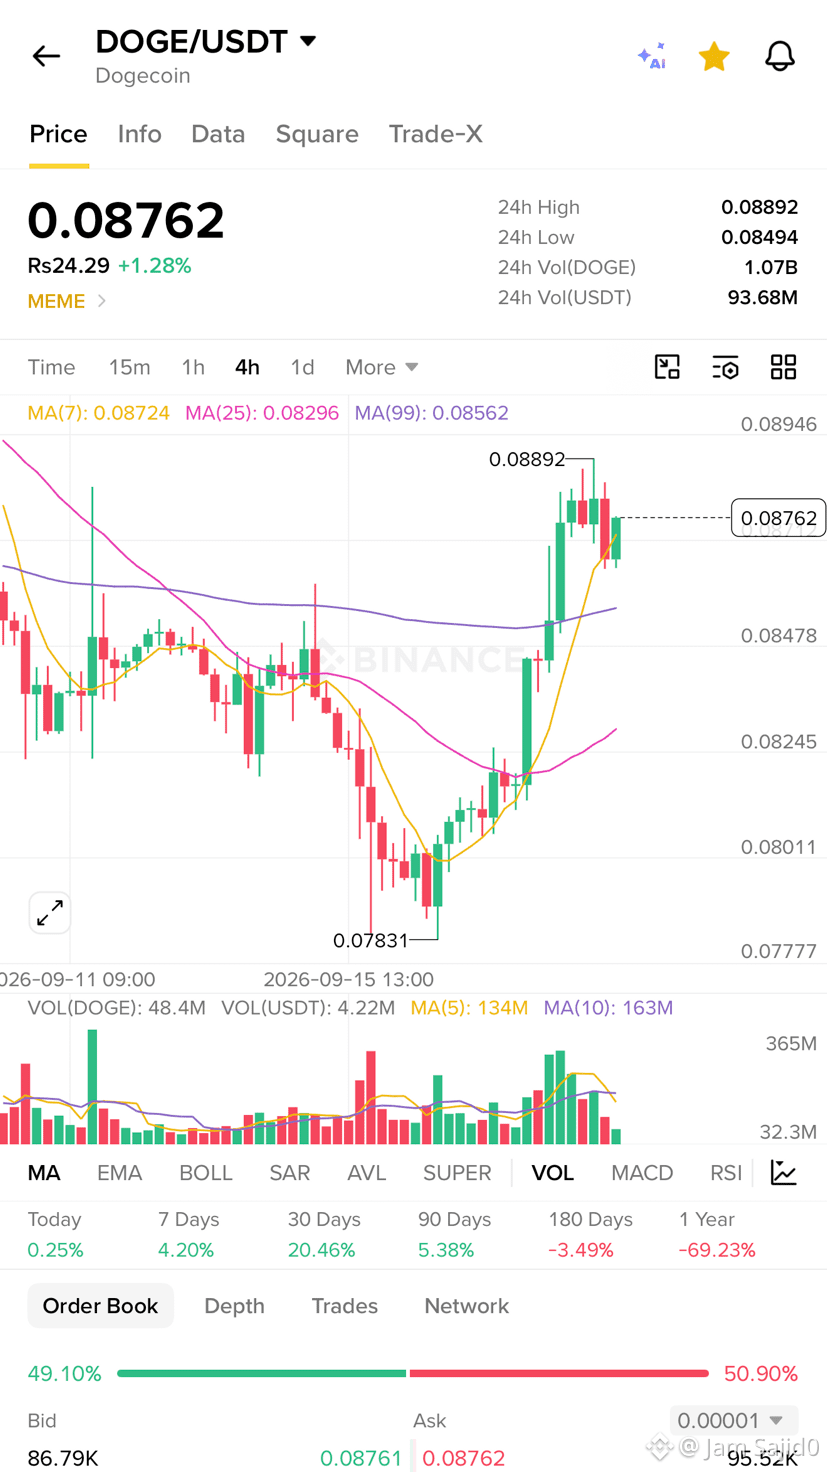
$DOGE is trading around $0.0876 with a 1.57% daily gain.
The move is positive, but momentum remains weaker than other major coins. A stronger breakout above $0.09 could attract fresh buyers and improve the short-term structure.
Cautiously Bullish
#DOGE #DOGECOİN #memecoins #crypto #DOGEAnalysis
$DOGE is trading around $0.0876 with a 1.57% daily gain.
The move is positive, but momentum remains weaker than other major coins. A stronger breakout above $0.09 could attract fresh buyers and improve the short-term structure.
Cautiously Bullish
#DOGE #DOGECOİN #memecoins #crypto #DOGEAnalysis
The move is positive, but momentum remains weaker than other major coins. A stronger breakout above $0.09 could attract fresh buyers and improve the short-term structure.
Cautiously Bullish
#DOGE #DOGECOİN #memecoins #crypto #DOGEAnalysis
123

🦈 WALLETS HOLDING 10M-100M DOGE JUST BOUGHT THE DIP — 0.074 IS THE FINAL HURDLE! 💥
Entry: 0.0708 ⚡
Target: 0.0800 🚀
Stop Loss: 0.0676 ⚠️
📊 The accumulation story is real — wallets in the 10M-100M DOGE range absorbed 180M coins during the pullback, lifting their supply share from 11.85% to 11.97%. That's smart money stepping in, but let's keep receipts: balances still trail late-July peaks, and some of these addresses could be exchange custody. 🦈 The signal is constructive, not conclusive.
Over on the derivatives side, open interest sits at $11.7B with funding staying positive — longs are in control, but that's a double-edged sword. 📉 If 0.0676 cracks, the liquidation cascade could be violent. 📌 The real tell is 0.074: a daily close above that flips the structure, opening a path toward 0.0800. MACD just printed a golden cross, but both lines remain under zero — momentum is improving, not reversing.
💬 Are you trusting the whale footprint here, or waiting to see spot volume confirm before chasing? 👇
⚠️ Not financial advice. Always manage your risk. 🛡️
🏷️ #DOGE #WhaleAlert #DOGEAnalysis #BreakoutWatch #Crypto
🦈 💎
🦈 WALLETS HOLDING 10M-100M DOGE JUST BOUGHT THE DIP — 0.074 IS THE FINAL HURDLE! 💥
Entry: 0.0708 ⚡
Target: 0.0800 🚀
Stop Loss: 0.0676 ⚠️
📊 The accumulation story is real — wallets in the 10M-100M DOGE range absorbed 180M coins during the pullback, lifting their supply share from 11.85% to 11.97%. That's smart money stepping in, but let's keep receipts: balances still trail late-July peaks, and some of these addresses could be exchange custody. 🦈 The signal is constructive, not conclusive.
Over on the derivatives side, open interest sits at $11.7B with funding staying positive — longs are in control, but that's a double-edged sword. 📉 If 0.0676 cracks, the liquidation cascade could be violent. 📌 The real tell is 0.074: a daily close above that flips the structure, opening a path toward 0.0800. MACD just printed a golden cross, but both lines remain under zero — momentum is improving, not reversing.
💬 Are you trusting the whale footprint here, or waiting to see spot volume confirm before chasing? 👇
⚠️ Not financial advice. Always manage your risk. 🛡️
🏷️ #DOGE #WhaleAlert #DOGEAnalysis #BreakoutWatch #Crypto
🦈 💎
Entry: 0.0708 ⚡
Target: 0.0800 🚀
Stop Loss: 0.0676 ⚠️
📊 The accumulation story is real — wallets in the 10M-100M DOGE range absorbed 180M coins during the pullback, lifting their supply share from 11.85% to 11.97%. That's smart money stepping in, but let's keep receipts: balances still trail late-July peaks, and some of these addresses could be exchange custody. 🦈 The signal is constructive, not conclusive.
Over on the derivatives side, open interest sits at $11.7B with funding staying positive — longs are in control, but that's a double-edged sword. 📉 If 0.0676 cracks, the liquidation cascade could be violent. 📌 The real tell is 0.074: a daily close above that flips the structure, opening a path toward 0.0800. MACD just printed a golden cross, but both lines remain under zero — momentum is improving, not reversing.
💬 Are you trusting the whale footprint here, or waiting to see spot volume confirm before chasing? 👇
⚠️ Not financial advice. Always manage your risk. 🛡️
🏷️ #DOGE #WhaleAlert #DOGEAnalysis #BreakoutWatch #Crypto
🦈 💎
1
60

·
--
Bearish
🚨 $DOGE Strategy: The Bearish Macro Flush
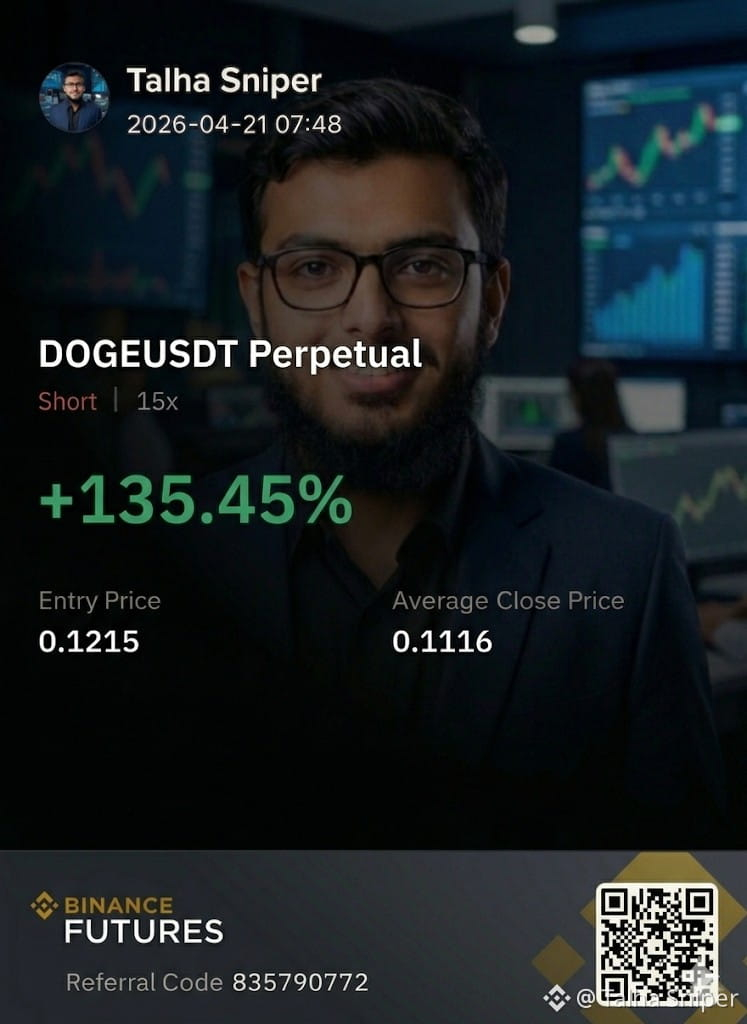
Retail is hoping for an Elon Musk tweet, but the Sniper is reading the 10-year tape. The $0.12 resistance is a "Hard Ceiling." We are targeting the macro gaps below current levels.
Entry Zone: $0.1180 – $0.1240 (Shorting the Retest)
TP1: $0.1000 (Psychological Support)
TP2: $0.0700 (Major Macro Support Base)
TP3: $0.0250 (The 10-Year "Fair Value" Target)
Stop Loss: $0.1380 (Strict exit above the breakdown diagonal)
Trade Logic:
The chart shows a clean breakdown of a decade-long bullish trend line. The massive red volume bar during the breakdown confirms powerful institutional distribution. We are currently seeing a weak relief rally (Dead Cat Bounce) that is stalling at previous support turned resistance. As long as $0.125 holds as resistance, the bias is extremely bearish.
#DOGE #DogeAnalysis #TalhaSniper #BinanceSquare #MacroSetup
{future}(DOGEUSDT)
🚨 $DOGE Strategy: The Bearish Macro Flush
Retail is hoping for an Elon Musk tweet, but the Sniper is reading the 10-year tape. The $0.12 resistance is a "Hard Ceiling." We are targeting the macro gaps below current levels.
Entry Zone: $0.1180 – $0.1240 (Shorting the Retest)
TP1: $0.1000 (Psychological Support)
TP2: $0.0700 (Major Macro Support Base)
TP3: $0.0250 (The 10-Year "Fair Value" Target)
Stop Loss: $0.1380 (Strict exit above the breakdown diagonal)
Trade Logic:
The chart shows a clean breakdown of a decade-long bullish trend line. The massive red volume bar during the breakdown confirms powerful institutional distribution. We are currently seeing a weak relief rally (Dead Cat Bounce) that is stalling at previous support turned resistance. As long as $0.125 holds as resistance, the bias is extremely bearish.
#DOGE #DogeAnalysis #TalhaSniper #BinanceSquare #MacroSetup
Retail is hoping for an Elon Musk tweet, but the Sniper is reading the 10-year tape. The $0.12 resistance is a "Hard Ceiling." We are targeting the macro gaps below current levels.
Entry Zone: $0.1180 – $0.1240 (Shorting the Retest)
TP1: $0.1000 (Psychological Support)
TP2: $0.0700 (Major Macro Support Base)
TP3: $0.0250 (The 10-Year "Fair Value" Target)
Stop Loss: $0.1380 (Strict exit above the breakdown diagonal)
Trade Logic:
The chart shows a clean breakdown of a decade-long bullish trend line. The massive red volume bar during the breakdown confirms powerful institutional distribution. We are currently seeing a weak relief rally (Dead Cat Bounce) that is stalling at previous support turned resistance. As long as $0.125 holds as resistance, the bias is extremely bearish.
#DOGE #DogeAnalysis #TalhaSniper #BinanceSquare #MacroSetup
40

$DOGE MARKET VIEW
0.24 ───────── RESISTANCE 🔴
│
│ breakout zone 🚀
0.22 ───────── range high
│
│ bullish consolidation ⚖️
0.18 ───────── support 🟢
│
0.17 ───────── key support
▼
breakdown = bearish 📉
{spot}(DOGEUSDT)
#DOGE #Dogecoin #Crypto #MemeCoin #Trading #DOGEAnalysis #bullish #Binance #BinanceOnline #bitcoin
#StablecoinTokenizationFunding
$DOGE MARKET VIEW
0.24 ───────── RESISTANCE 🔴
│
│ breakout zone 🚀
0.22 ───────── range high
│
│ bullish consolidation ⚖️
0.18 ───────── support 🟢
│
0.17 ───────── key support
▼
breakdown = bearish 📉
#DOGE #Dogecoin #Crypto #MemeCoin #Trading #DOGEAnalysis #bullish #Binance #BinanceOnline #bitcoin
#StablecoinTokenizationFunding
0.24 ───────── RESISTANCE 🔴
│
│ breakout zone 🚀
0.22 ───────── range high
│
│ bullish consolidation ⚖️
0.18 ───────── support 🟢
│
0.17 ───────── key support
▼
breakdown = bearish 📉
#DOGE #Dogecoin #Crypto #MemeCoin #Trading #DOGEAnalysis #bullish #Binance #BinanceOnline #bitcoin
#StablecoinTokenizationFunding
1
83
Log in to explore more content
Join global crypto users on Binance Square
⚡️ Get latest and useful information about crypto.
💬 Trusted by the world’s largest crypto exchange.
👍 Discover real insights from verified creators.
Email / Phone number
Trending Topics
1
#NvidiaLoses$2.7TrillionInMonthAndAHalf
12,001 views
101 Discussing
2
#CanBTCReboundAfterFallingBelow60K?
692,191 views
2,838 Discussing
3
#GlobalStocksFaceLongestLosingStreakSince2023
248,229 views
1,922 Discussing
4
#BlackRockIBITPostsRecord$541MSingleDayOutflow
26,997 views
80 Discussing
5
#AnthropicPlungesTowardIPOPriceonDay2
124,796 views
1,161 Discussing
6
#TwentyOneCapitalAdds172.25BTC
55,126 views
628 Discussing
7
#HKBillWouldExcludeTokenizedDepositsFromVirtualAssets
6,559 views
49 Discussing
8
#BNBDropsBelow540USDTWith8.46%DailyDecline
69,336 views
613 Discussing
9
#HKBillProposesHK$100KFineForUnauthorizedCryptoTitles
2,334 views
22 Discussing
10
#BitMineFaces$10.1BUnrealizedETHLoss
4,679 views
26 Discussing