
#linkupdates
linkupdates
6,791 views
10 Discussing
Hot
Latest

Article
LINK / USD - Complete Analysis
18 Nov 2026 | Price: ∼$9.30$LINK / USD - Complete Analysis
18 Nov 2026 | Price: ∼$9.30
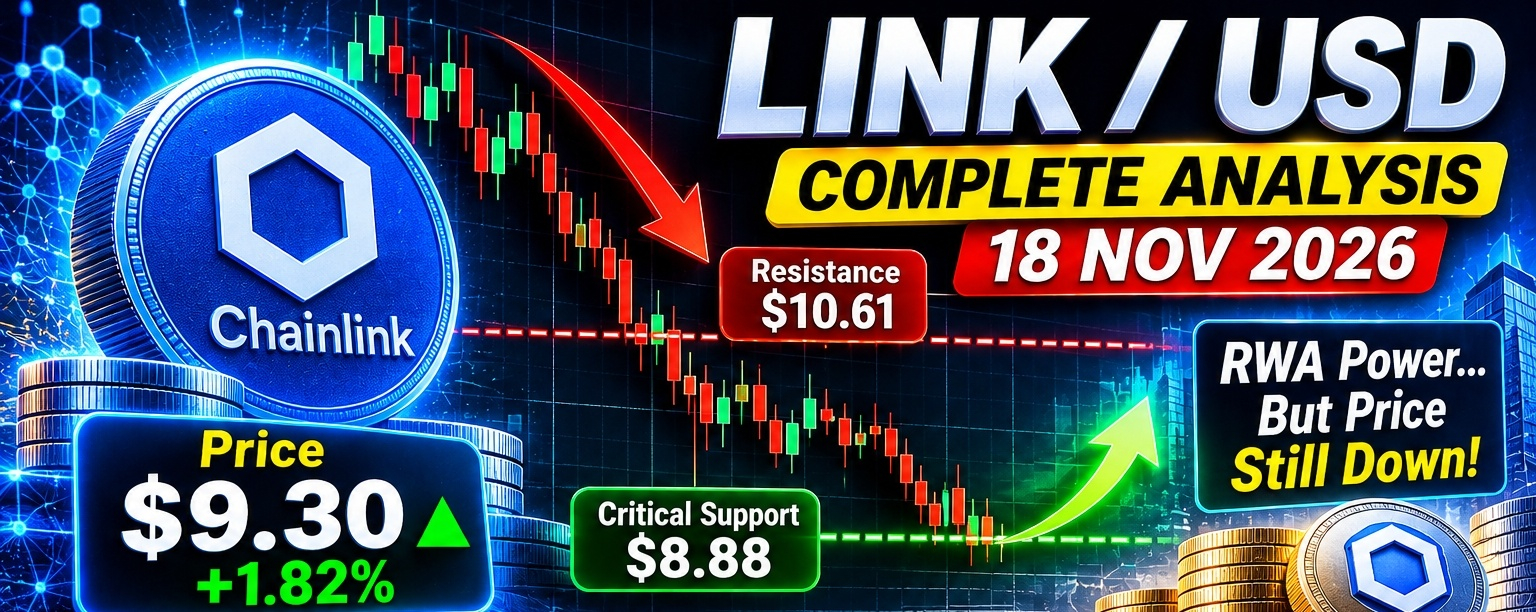
LINK is in a bearish breakdown, testing a make-or-break support zone. It has lost its long-term support at $10.61, fallen -22.2% in 30 days, and is now fighting to hold $8.88 - $9.00.
Fundamentally, Chainlink has never been stronger - it's becoming the standard for tokenized real-world assets. But price is not following fundamentals right now. That divergence is the whole story.
{spot}(LINKUSDT)
This is not financial advice.
1. Live Market Snapshot
| Metric | Value |
| --- | --- |
| Current Price | $9.30 |
| 24h Range | $8.95 - $9.38 |
| 24h Change | +1.82% to +1.95% |
| Market Cap Rank | #17 |
| 24h Forecast Range | $8.86 - $9.60, average ~$9.23 |
| Circulating Supply | ∼657M LINK (of 1B max) |
| All-Time High | $52.88 (May 2021) - now -82.4% below ATH |
Performance:
30 days: -22.2%
Recent: Fell from above $11.00 earlier in November to ∼$9.30 now
1-day technical sentiment: 34% Bullish / 66% Bearish
Sentiment: Neutral 62% in AI trackers, but market-wide Fear & Greed is Extreme Fear. LINK is not panicking alone, it's being dragged down.
## 2. What Just Happened?
LINK fell below the long-term swing support of $10.61 - a level that held for months.
That breakdown triggered a fast drop to $8.95 low. Now it's bouncing slightly to $9.30, but still below all major moving averages.
Analysts call $8.88 the make-or-break test.
3. Technical Analysis
Trend: Strong Bearish
LINK trades below short-, medium-, and long-term moving averages with high volatility, facing strong selling pressure.
MA-20 (hourly): $9.72
MA-50 (hourly): $9.87
MA-200 (daily): $10.11
200-day SMA: $10.10
Price at $9.30 is below ALL of them. Every rally will hit resistance.
Technical rating: Strong Bearish / Strong Sell
Momentum: Weak, Approaching Oversold
RSI: 34.62 - 36.1
Stochastic RSI: 40.42
CCI: -92.53
RSI near 34 means heavy selling, but not yet deeply oversold like XRP was at 17. Still room to fall if $8.88 breaks.
Key Levels
| Type | Level | Why it matters |
| --- | --- | --- |
| CRITICAL Support | $8.88 | 78.6% Fibonacci retracement inside Fair Value Gap. Make-or-break. A bullish reaction here = strong reversal signal |
| Support 1 | $9.1769 - $9.28 | Nearest support, only 0.2-0.5% below |
| Support 2 | $8.652 | Classic strong support / next floor if $8.88 fails |
| Support 3 | $7.482 - $7.71 | 7-day range low, capitulation zone |
| Resistance 1 | $9.47 - $9.6291 | Nearest resistance, +1.8% to +4.4% above |
| Resistance 2 | $9.88 | Ichimoku Kijun - immediate barrier |
| Resistance 3 | $10.44 - $10.61 | Old support turned resistance. Must reclaim to flip bullish |
| Major Resistance | $10.915 - $11.13 | 200-day + breakout zone |
| Breakout Target | $12.74 - $14.40 | If $11 breaks, next targets |
Near-term range: $8.94 - $9.57, with consolidation expected between $8.77 - $9.68 in base case (45% probability).
7-day range: $7.71 - $10.70
Buy zone concept: Some traders are watching $9.00 - $9.20 as accumulation, with stop below $8.65.
4. Fundamental Analysis - Why LINK Is Different
Chainlink launched in 2017 with 1B LINK tokens - 35% public, 35% node operators/ecosystem, 30% Chainlink Labs.
It is a Decentralized Oracle Network (DON) - it bridges real-world data (prices, weather, reserves, etc.) with blockchain smart contracts. Without oracles, DeFi cannot work.
Bullish Fundamentals - Strongest Ever
1. RWA Tokenization - The #1 Institutional Narrative
Total tokenized real-world assets hit $39.2B in Oct 2026, up from ∼$21B at start of year. Chainlink is positioned as the infrastructure for this.
2. CCIP - Cross-Chain Interoperability Protocol
CCIP lets data and assets move between blockchains. According to Chainlink's Q3 2026 review, more than $15B in token value migrated to CCIP during 2026, while the protocol secured over $85B in value.
3. Gold Token + Compliance - Oct 27, 2026
Two big institutional integrations:
Plan to bring Hong Kong Gold Exchange's HKGX gold-backed XGZ token to CCIP via GoldZip and Midas Labs
Automated Compliance Engine (ACE) selected by ADQ-backed Further Asset Management for tokenized funds
4. Japan Expansion - Oct 18, 2026
Pacific Meta selected CCIP as its preferred solution for cross-chain interoperability to enable institutional tokenization in Japan.
5. Stellar Integration - Oct 14, 2026
Chainlink Data Feeds and Data Streams went live on Stellar, which hosts $4B+ of tokenized RWAs, giving Stellar DeFi apps access to Chainlink oracles. LINK rose 3.7% on that news.
6. Robinhood Chain + TradFi
Chainlink is working with Robinhood Chain (broker's public L2 for trading) and other TradFi players. RWA tokenisation is driving demand for data services, custody, and automated collateral management.
Bearish / Risk Factors
1. CCIP Adoption Still Tiny
CCIP's total distributed asset value has fallen to $322M, only 0.8% of the ∼$40B RWA market. Huge potential, but also shows adoption is early.
2. LINK Token Utility Question
Chainlink secures $85B+, but LINK token itself is mainly used for paying node operators and staking. Critics ask: does usage directly drive LINK price? Not always.
3. Token Unlocks / Supply
Team / ecosystem still holds large supply. Selling pressure from node operator payments is constant.
4. Correlation to Market
Even with great news, LINK fell -22% in a month because BTC / ETH fell. Fundamentals don't protect short-term price.
5. Scenarios - What to Watch
🟢 Bullish Scenario (30% probability)
Trigger: Hold $8.88, daily close back above $9.88 (Kijun), then $10.61
Target: $10.44 -> $11.13 -> $12.74 -> $14.40
Analyst CryptoTanx sees a possible double bottom in $9 - $11 zone.
November forecast: $9.02 - $12.74, average $10.61, +15.00% upside if recovery holds.
1-month model target: $11.77
🟡 Base / Sideways Scenario (45% probability - Most Likely)
Range: $8.77 - $9.68
LINK consolidates, builds a base at $8.88 - $9.30, RSI recovers. No breakout yet, but no breakdown either. This is accumulation time for long-term holders.
🔴 Bearish Scenario (25% probability)
Trigger: Daily close below $8.88 with volume, especially below $8.65
Target: $7.71 -> $7.48 -> $6.38
This would confirm the breakdown from $10.61 was real and open a deeper capitulation. A bullish reversal is not confirmed yet.
6. Long-Term Outlook
| Period | Forecast |
| --- | --- |
| Nov 2026 | $9.43 - $11.10, target ~$10.25 |
| End of 2026 | $11.68 in historical models |
| 2027 | $15 - $18 range in many models (if RWA grows) |
| 2030 | $30 - $50 if CCIP becomes standard |
| Can it reclaim $50? | Only if RWA market goes from $39B to $500B+ AND LINK captures value via staking/fees. Possible, but not in 2026. |
Ignore $100+ hype targets for now - focus on reclaiming $10.61 first.
7. Strategy Summary (Not Advice)
For Traders:
Key level is $8.88. This is your line in the sand.
Long idea: Buy near $9.00 - $9.20, Stop below $8.65, Target $9.88 -> $10.61
Short / Avoid: Below $8.88, momentum is down
Next 24h range to trade: $8.95 - $9.35
For Long-Term Holders / DCA:
Current zone $9 - $11 is historically a strong accumulation zone (double bottom forming)
Fundamentals (CCIP + RWA + TradFi) are the best in LINK's history
But price can stay low for months even with good news - DCA slowly, don't all-in at one level
Staking LINK earns yield and reduces circulating supply - consider if you hold long-term
LINK vs $XRP vs $TRX Quick Comparison:
| | LINK | XRP | TRX |
| --- | --- | --- | --- |
| Price | $9.30 | $0.977 | $0.307 |
| YTD / 30D | -22% / 30D | -48% YTD | +6.5% YTD |
| Strength | Oracle / RWA infra | Payments / ETF | USDT settlement |
| Volatility | High | Very High | Very Low |
| Risk | Adoption slow | ETF outflows | Centralization |
Want me to do:
LINK vs XRP vs TRX - which to buy now head-to-head portfolio?
LINK 1H / 4H scalp levels with exact entry / SL / TP?
LINK staking + CCIP revenue - how LINK actually makes money?
#LINK🔥🔥🔥 #LINKUpdates #LINKAnalysis #LINKUSDT #TrendingPredictions
LINK / USD - Complete Analysis 18 Nov 2026 | Price: ∼$9.30
$LINK / USD - Complete Analysis
18 Nov 2026 | Price: ∼$9.30
LINK is in a bearish breakdown, testing a make-or-break support zone. It has lost its long-term support at $10.61, fallen -22.2% in 30 days, and is now fighting to hold $8.88 - $9.00.
Fundamentally, Chainlink has never been stronger - it's becoming the standard for tokenized real-world assets. But price is not following fundamentals right now. That divergence is the whole story.
This is not financial advice.
1. Live Market Snapshot
| Metric | Value |
| --- | --- |
| Current Price | $9.30 |
| 24h Range | $8.95 - $9.38 |
| 24h Change | +1.82% to +1.95% |
| Market Cap Rank | #17 |
| 24h Forecast Range | $8.86 - $9.60, average ~$9.23 |
| Circulating Supply | ∼657M LINK (of 1B max) |
| All-Time High | $52.88 (May 2021) - now -82.4% below ATH |
Performance:
30 days: -22.2%
Recent: Fell from above $11.00 earlier in November to ∼$9.30 now
1-day technical sentiment: 34% Bullish / 66% Bearish
Sentiment: Neutral 62% in AI trackers, but market-wide Fear & Greed is Extreme Fear. LINK is not panicking alone, it's being dragged down.
## 2. What Just Happened?
LINK fell below the long-term swing support of $10.61 - a level that held for months.
That breakdown triggered a fast drop to $8.95 low. Now it's bouncing slightly to $9.30, but still below all major moving averages.
Analysts call $8.88 the make-or-break test.
3. Technical Analysis
Trend: Strong Bearish
LINK trades below short-, medium-, and long-term moving averages with high volatility, facing strong selling pressure.
MA-20 (hourly): $9.72
MA-50 (hourly): $9.87
MA-200 (daily): $10.11
200-day SMA: $10.10
Price at $9.30 is below ALL of them. Every rally will hit resistance.
Technical rating: Strong Bearish / Strong Sell
Momentum: Weak, Approaching Oversold
RSI: 34.62 - 36.1
Stochastic RSI: 40.42
CCI: -92.53
RSI near 34 means heavy selling, but not yet deeply oversold like XRP was at 17. Still room to fall if $8.88 breaks.
Key Levels
| Type | Level | Why it matters |
| --- | --- | --- |
| CRITICAL Support | $8.88 | 78.6% Fibonacci retracement inside Fair Value Gap. Make-or-break. A bullish reaction here = strong reversal signal |
| Support 1 | $9.1769 - $9.28 | Nearest support, only 0.2-0.5% below |
| Support 2 | $8.652 | Classic strong support / next floor if $8.88 fails |
| Support 3 | $7.482 - $7.71 | 7-day range low, capitulation zone |
| Resistance 1 | $9.47 - $9.6291 | Nearest resistance, +1.8% to +4.4% above |
| Resistance 2 | $9.88 | Ichimoku Kijun - immediate barrier |
| Resistance 3 | $10.44 - $10.61 | Old support turned resistance. Must reclaim to flip bullish |
| Major Resistance | $10.915 - $11.13 | 200-day + breakout zone |
| Breakout Target | $12.74 - $14.40 | If $11 breaks, next targets |
Near-term range: $8.94 - $9.57, with consolidation expected between $8.77 - $9.68 in base case (45% probability).
7-day range: $7.71 - $10.70
Buy zone concept: Some traders are watching $9.00 - $9.20 as accumulation, with stop below $8.65.
4. Fundamental Analysis - Why LINK Is Different
Chainlink launched in 2017 with 1B LINK tokens - 35% public, 35% node operators/ecosystem, 30% Chainlink Labs.
It is a Decentralized Oracle Network (DON) - it bridges real-world data (prices, weather, reserves, etc.) with blockchain smart contracts. Without oracles, DeFi cannot work.
Bullish Fundamentals - Strongest Ever
1. RWA Tokenization - The #1 Institutional Narrative
Total tokenized real-world assets hit $39.2B in Oct 2026, up from ∼$21B at start of year. Chainlink is positioned as the infrastructure for this.
2. CCIP - Cross-Chain Interoperability Protocol
CCIP lets data and assets move between blockchains. According to Chainlink's Q3 2026 review, more than $15B in token value migrated to CCIP during 2026, while the protocol secured over $85B in value.
3. Gold Token + Compliance - Oct 27, 2026
Two big institutional integrations:
Plan to bring Hong Kong Gold Exchange's HKGX gold-backed XGZ token to CCIP via GoldZip and Midas Labs
Automated Compliance Engine (ACE) selected by ADQ-backed Further Asset Management for tokenized funds
4. Japan Expansion - Oct 18, 2026
Pacific Meta selected CCIP as its preferred solution for cross-chain interoperability to enable institutional tokenization in Japan.
5. Stellar Integration - Oct 14, 2026
Chainlink Data Feeds and Data Streams went live on Stellar, which hosts $4B+ of tokenized RWAs, giving Stellar DeFi apps access to Chainlink oracles. LINK rose 3.7% on that news.
6. Robinhood Chain + TradFi
Chainlink is working with Robinhood Chain (broker's public L2 for trading) and other TradFi players. RWA tokenisation is driving demand for data services, custody, and automated collateral management.
Bearish / Risk Factors
1. CCIP Adoption Still Tiny
CCIP's total distributed asset value has fallen to $322M, only 0.8% of the ∼$40B RWA market. Huge potential, but also shows adoption is early.
2. LINK Token Utility Question
Chainlink secures $85B+, but LINK token itself is mainly used for paying node operators and staking. Critics ask: does usage directly drive LINK price? Not always.
3. Token Unlocks / Supply
Team / ecosystem still holds large supply. Selling pressure from node operator payments is constant.
4. Correlation to Market
Even with great news, LINK fell -22% in a month because BTC / ETH fell. Fundamentals don't protect short-term price.
5. Scenarios - What to Watch
🟢 Bullish Scenario (30% probability)
Trigger: Hold $8.88, daily close back above $9.88 (Kijun), then $10.61
Target: $10.44 -> $11.13 -> $12.74 -> $14.40
Analyst CryptoTanx sees a possible double bottom in $9 - $11 zone.
November forecast: $9.02 - $12.74, average $10.61, +15.00% upside if recovery holds.
1-month model target: $11.77
🟡 Base / Sideways Scenario (45% probability - Most Likely)
Range: $8.77 - $9.68
LINK consolidates, builds a base at $8.88 - $9.30, RSI recovers. No breakout yet, but no breakdown either. This is accumulation time for long-term holders.
🔴 Bearish Scenario (25% probability)
Trigger: Daily close below $8.88 with volume, especially below $8.65
Target: $7.71 -> $7.48 -> $6.38
This would confirm the breakdown from $10.61 was real and open a deeper capitulation. A bullish reversal is not confirmed yet.
6. Long-Term Outlook
| Period | Forecast |
| --- | --- |
| Nov 2026 | $9.43 - $11.10, target ~$10.25 |
| End of 2026 | $11.68 in historical models |
| 2027 | $15 - $18 range in many models (if RWA grows) |
| 2030 | $30 - $50 if CCIP becomes standard |
| Can it reclaim $50? | Only if RWA market goes from $39B to $500B+ AND LINK captures value via staking/fees. Possible, but not in 2026. |
Ignore $100+ hype targets for now - focus on reclaiming $10.61 first.
7. Strategy Summary (Not Advice)
For Traders:
Key level is $8.88. This is your line in the sand.
Long idea: Buy near $9.00 - $9.20, Stop below $8.65, Target $9.88 -> $10.61
Short / Avoid: Below $8.88, momentum is down
Next 24h range to trade: $8.95 - $9.35
For Long-Term Holders / DCA:
Current zone $9 - $11 is historically a strong accumulation zone (double bottom forming)
Fundamentals (CCIP + RWA + TradFi) are the best in LINK's history
But price can stay low for months even with good news - DCA slowly, don't all-in at one level
Staking LINK earns yield and reduces circulating supply - consider if you hold long-term
LINK vs $XRP vs $TRX Quick Comparison:
| | LINK | XRP | TRX |
| --- | --- | --- | --- |
| Price | $9.30 | $0.977 | $0.307 |
| YTD / 30D | -22% / 30D | -48% YTD | +6.5% YTD |
| Strength | Oracle / RWA infra | Payments / ETF | USDT settlement |
| Volatility | High | Very High | Very Low |
| Risk | Adoption slow | ETF outflows | Centralization |
Want me to do:
LINK vs XRP vs TRX - which to buy now head-to-head portfolio?
LINK 1H / 4H scalp levels with exact entry / SL / TP?
LINK staking + CCIP revenue - how LINK actually makes money?
#LINK🔥🔥🔥 #LINKUpdates #LINKAnalysis #LINKUSDT #TrendingPredictions
18 Nov 2026 | Price: ∼$9.30
LINK is in a bearish breakdown, testing a make-or-break support zone. It has lost its long-term support at $10.61, fallen -22.2% in 30 days, and is now fighting to hold $8.88 - $9.00.
Fundamentally, Chainlink has never been stronger - it's becoming the standard for tokenized real-world assets. But price is not following fundamentals right now. That divergence is the whole story.
This is not financial advice.
1. Live Market Snapshot
| Metric | Value |
| --- | --- |
| Current Price | $9.30 |
| 24h Range | $8.95 - $9.38 |
| 24h Change | +1.82% to +1.95% |
| Market Cap Rank | #17 |
| 24h Forecast Range | $8.86 - $9.60, average ~$9.23 |
| Circulating Supply | ∼657M LINK (of 1B max) |
| All-Time High | $52.88 (May 2021) - now -82.4% below ATH |
Performance:
30 days: -22.2%
Recent: Fell from above $11.00 earlier in November to ∼$9.30 now
1-day technical sentiment: 34% Bullish / 66% Bearish
Sentiment: Neutral 62% in AI trackers, but market-wide Fear & Greed is Extreme Fear. LINK is not panicking alone, it's being dragged down.
## 2. What Just Happened?
LINK fell below the long-term swing support of $10.61 - a level that held for months.
That breakdown triggered a fast drop to $8.95 low. Now it's bouncing slightly to $9.30, but still below all major moving averages.
Analysts call $8.88 the make-or-break test.
3. Technical Analysis
Trend: Strong Bearish
LINK trades below short-, medium-, and long-term moving averages with high volatility, facing strong selling pressure.
MA-20 (hourly): $9.72
MA-50 (hourly): $9.87
MA-200 (daily): $10.11
200-day SMA: $10.10
Price at $9.30 is below ALL of them. Every rally will hit resistance.
Technical rating: Strong Bearish / Strong Sell
Momentum: Weak, Approaching Oversold
RSI: 34.62 - 36.1
Stochastic RSI: 40.42
CCI: -92.53
RSI near 34 means heavy selling, but not yet deeply oversold like XRP was at 17. Still room to fall if $8.88 breaks.
Key Levels
| Type | Level | Why it matters |
| --- | --- | --- |
| CRITICAL Support | $8.88 | 78.6% Fibonacci retracement inside Fair Value Gap. Make-or-break. A bullish reaction here = strong reversal signal |
| Support 1 | $9.1769 - $9.28 | Nearest support, only 0.2-0.5% below |
| Support 2 | $8.652 | Classic strong support / next floor if $8.88 fails |
| Support 3 | $7.482 - $7.71 | 7-day range low, capitulation zone |
| Resistance 1 | $9.47 - $9.6291 | Nearest resistance, +1.8% to +4.4% above |
| Resistance 2 | $9.88 | Ichimoku Kijun - immediate barrier |
| Resistance 3 | $10.44 - $10.61 | Old support turned resistance. Must reclaim to flip bullish |
| Major Resistance | $10.915 - $11.13 | 200-day + breakout zone |
| Breakout Target | $12.74 - $14.40 | If $11 breaks, next targets |
Near-term range: $8.94 - $9.57, with consolidation expected between $8.77 - $9.68 in base case (45% probability).
7-day range: $7.71 - $10.70
Buy zone concept: Some traders are watching $9.00 - $9.20 as accumulation, with stop below $8.65.
4. Fundamental Analysis - Why LINK Is Different
Chainlink launched in 2017 with 1B LINK tokens - 35% public, 35% node operators/ecosystem, 30% Chainlink Labs.
It is a Decentralized Oracle Network (DON) - it bridges real-world data (prices, weather, reserves, etc.) with blockchain smart contracts. Without oracles, DeFi cannot work.
Bullish Fundamentals - Strongest Ever
1. RWA Tokenization - The #1 Institutional Narrative
Total tokenized real-world assets hit $39.2B in Oct 2026, up from ∼$21B at start of year. Chainlink is positioned as the infrastructure for this.
2. CCIP - Cross-Chain Interoperability Protocol
CCIP lets data and assets move between blockchains. According to Chainlink's Q3 2026 review, more than $15B in token value migrated to CCIP during 2026, while the protocol secured over $85B in value.
3. Gold Token + Compliance - Oct 27, 2026
Two big institutional integrations:
Plan to bring Hong Kong Gold Exchange's HKGX gold-backed XGZ token to CCIP via GoldZip and Midas Labs
Automated Compliance Engine (ACE) selected by ADQ-backed Further Asset Management for tokenized funds
4. Japan Expansion - Oct 18, 2026
Pacific Meta selected CCIP as its preferred solution for cross-chain interoperability to enable institutional tokenization in Japan.
5. Stellar Integration - Oct 14, 2026
Chainlink Data Feeds and Data Streams went live on Stellar, which hosts $4B+ of tokenized RWAs, giving Stellar DeFi apps access to Chainlink oracles. LINK rose 3.7% on that news.
6. Robinhood Chain + TradFi
Chainlink is working with Robinhood Chain (broker's public L2 for trading) and other TradFi players. RWA tokenisation is driving demand for data services, custody, and automated collateral management.
Bearish / Risk Factors
1. CCIP Adoption Still Tiny
CCIP's total distributed asset value has fallen to $322M, only 0.8% of the ∼$40B RWA market. Huge potential, but also shows adoption is early.
2. LINK Token Utility Question
Chainlink secures $85B+, but LINK token itself is mainly used for paying node operators and staking. Critics ask: does usage directly drive LINK price? Not always.
3. Token Unlocks / Supply
Team / ecosystem still holds large supply. Selling pressure from node operator payments is constant.
4. Correlation to Market
Even with great news, LINK fell -22% in a month because BTC / ETH fell. Fundamentals don't protect short-term price.
5. Scenarios - What to Watch
🟢 Bullish Scenario (30% probability)
Trigger: Hold $8.88, daily close back above $9.88 (Kijun), then $10.61
Target: $10.44 -> $11.13 -> $12.74 -> $14.40
Analyst CryptoTanx sees a possible double bottom in $9 - $11 zone.
November forecast: $9.02 - $12.74, average $10.61, +15.00% upside if recovery holds.
1-month model target: $11.77
🟡 Base / Sideways Scenario (45% probability - Most Likely)
Range: $8.77 - $9.68
LINK consolidates, builds a base at $8.88 - $9.30, RSI recovers. No breakout yet, but no breakdown either. This is accumulation time for long-term holders.
🔴 Bearish Scenario (25% probability)
Trigger: Daily close below $8.88 with volume, especially below $8.65
Target: $7.71 -> $7.48 -> $6.38
This would confirm the breakdown from $10.61 was real and open a deeper capitulation. A bullish reversal is not confirmed yet.
6. Long-Term Outlook
| Period | Forecast |
| --- | --- |
| Nov 2026 | $9.43 - $11.10, target ~$10.25 |
| End of 2026 | $11.68 in historical models |
| 2027 | $15 - $18 range in many models (if RWA grows) |
| 2030 | $30 - $50 if CCIP becomes standard |
| Can it reclaim $50? | Only if RWA market goes from $39B to $500B+ AND LINK captures value via staking/fees. Possible, but not in 2026. |
Ignore $100+ hype targets for now - focus on reclaiming $10.61 first.
7. Strategy Summary (Not Advice)
For Traders:
Key level is $8.88. This is your line in the sand.
Long idea: Buy near $9.00 - $9.20, Stop below $8.65, Target $9.88 -> $10.61
Short / Avoid: Below $8.88, momentum is down
Next 24h range to trade: $8.95 - $9.35
For Long-Term Holders / DCA:
Current zone $9 - $11 is historically a strong accumulation zone (double bottom forming)
Fundamentals (CCIP + RWA + TradFi) are the best in LINK's history
But price can stay low for months even with good news - DCA slowly, don't all-in at one level
Staking LINK earns yield and reduces circulating supply - consider if you hold long-term
LINK vs $XRP vs $TRX Quick Comparison:
| | LINK | XRP | TRX |
| --- | --- | --- | --- |
| Price | $9.30 | $0.977 | $0.307 |
| YTD / 30D | -22% / 30D | -48% YTD | +6.5% YTD |
| Strength | Oracle / RWA infra | Payments / ETF | USDT settlement |
| Volatility | High | Very High | Very Low |
| Risk | Adoption slow | ETF outflows | Centralization |
Want me to do:
LINK vs XRP vs TRX - which to buy now head-to-head portfolio?
LINK 1H / 4H scalp levels with exact entry / SL / TP?
LINK staking + CCIP revenue - how LINK actually makes money?
#LINK🔥🔥🔥 #LINKUpdates #LINKAnalysis #LINKUSDT #TrendingPredictions
209

LINK Update – Currently in Loss but Still Confident 🚀
Patience pays in crypto
I'm currently down around $7 on my $LINK setup, but I’m not worried — I still have strong conviction that a pump is coming soon
Let’s see how it plays out. Will $LINK surprise us all?
💪 Holding strong! #LINK #CryptoTrader #Altcoins #HODL
#LINKUpdates #linkfuture
LINK Update – Currently in Loss but Still Confident 🚀
Patience pays in crypto
I'm currently down around $7 on my $LINK setup, but I’m not worried — I still have strong conviction that a pump is coming soon
Let’s see how it plays out. Will $LINK surprise us all?
💪 Holding strong! #LINK #CryptoTrader #Altcoins #HODL
#LINKUpdates #linkfuture
Patience pays in crypto
I'm currently down around $7 on my $LINK setup, but I’m not worried — I still have strong conviction that a pump is coming soon
Let’s see how it plays out. Will $LINK surprise us all?
💪 Holding strong! #LINK #CryptoTrader #Altcoins #HODL
#LINKUpdates #linkfuture
9
55
Log in to explore more content
Join global crypto users on Binance Square
⚡️ Get latest and useful information about crypto.
💬 Trusted by the world’s largest crypto exchange.
👍 Discover real insights from verified creators.
Email / Phone number
Trending Topics
1
#BTCReboundsAbove$60KAmidWhaleDipBuying
16,364 views
134 Discussing
2
#SolanaSets2027RoadmapToDoubleComputeCapacity
2,988 views
153 Discussing
3
#CaliforniaNvidiaProbeExaminesPotentialCriminalViolations
1,978 views
40 Discussing
4
#BlackRockLaunchesHKDollarDigitalLiquidityFund
4,508 views
159 Discussing
5
#NvidiaLoses$2.7TrillionInMonthAndAHalf
51,060 views
245 Discussing
6
#GlobalStocksFaceLongestLosingStreakSince2023
437,302 views
2,847 Discussing
7
#BlackRockIBITPostsRecord$541MSingleDayOutflow
67,293 views
157 Discussing
8
#AnthropicPlungesTowardIPOPriceonDay2
238,129 views
1,872 Discussing
9
#TwentyOneCapitalAdds172.25BTC
117,433 views
1,237 Discussing
10
#HKBillWouldExcludeTokenizedDepositsFromVirtualAssets
15,306 views
87 Discussing