
#macrocrypto
macrocrypto
198,069 views
1,583 Discussing
Hot
Latest

·
--
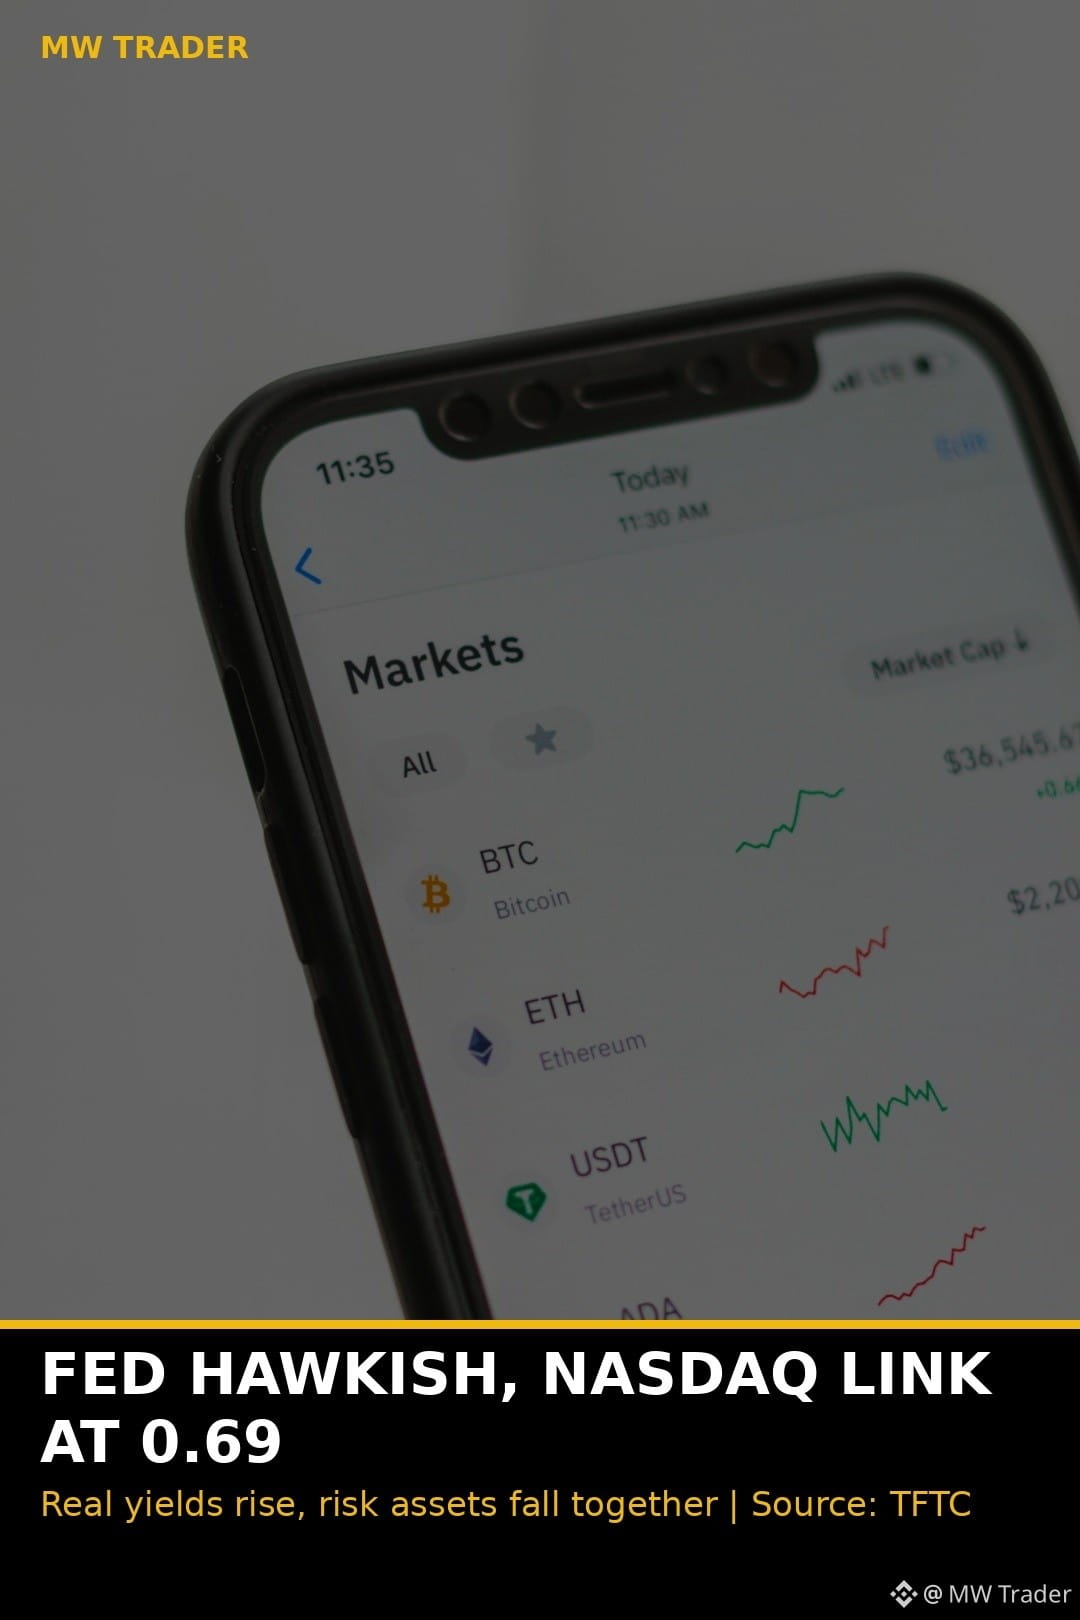
The Fed is hawkish, real yields are rising, and Bitcoin's link to the Nasdaq is 0.69. This is a macro selloff. 📊
Bitcoin's 40 day correlation with the Nasdaq 100 sits at about 0.69 during November 2026, according to TFTC, and the same report points to higher inflation adjusted Treasury yields and a more hawkish Federal Reserve as the main drivers of the fall. When real yields rise, bonds pay more for holding them, and a coin that pays nothing looks less attractive, so Bitcoin falls with stocks instead of trading on its own story. My view is that this is why the crypto bounce needs stocks to turn first, and why I watch the Nasdaq open every day before I trust a crypto long. 📰
Do you think Bitcoin breaks free from stocks soon, or does it need the Fed to turn first? 🤔
Source: TFTC.
Futures trading is risky, trade small and manage risk. ⚠️
Follow for more trades.
#Crypto #Bitcoin #FuturesTrading #TradingSignals #MacroCrypto
The Fed is hawkish, real yields are rising, and Bitcoin's link to the Nasdaq is 0.69. This is a macro selloff. 📊
Bitcoin's 40 day correlation with the Nasdaq 100 sits at about 0.69 during November 2026, according to TFTC, and the same report points to higher inflation adjusted Treasury yields and a more hawkish Federal Reserve as the main drivers of the fall. When real yields rise, bonds pay more for holding them, and a coin that pays nothing looks less attractive, so Bitcoin falls with stocks instead of trading on its own story. My view is that this is why the crypto bounce needs stocks to turn first, and why I watch the Nasdaq open every day before I trust a crypto long. 📰
Do you think Bitcoin breaks free from stocks soon, or does it need the Fed to turn first? 🤔
Source: TFTC.
Futures trading is risky, trade small and manage risk. ⚠️
Follow for more trades.
#Crypto #Bitcoin #FuturesTrading #TradingSignals #MacroCrypto
Bitcoin's 40 day correlation with the Nasdaq 100 sits at about 0.69 during November 2026, according to TFTC, and the same report points to higher inflation adjusted Treasury yields and a more hawkish Federal Reserve as the main drivers of the fall. When real yields rise, bonds pay more for holding them, and a coin that pays nothing looks less attractive, so Bitcoin falls with stocks instead of trading on its own story. My view is that this is why the crypto bounce needs stocks to turn first, and why I watch the Nasdaq open every day before I trust a crypto long. 📰
Do you think Bitcoin breaks free from stocks soon, or does it need the Fed to turn first? 🤔
Source: TFTC.
Futures trading is risky, trade small and manage risk. ⚠️
Follow for more trades.
#Crypto #Bitcoin #FuturesTrading #TradingSignals #MacroCrypto

Why is nobody talking about how traditional consumer earnings reports like Airbnb's November 5 release expose the real direction of retail crypto liquidity?
Most traders lose capital because they stay glued to low-timeframe charts while completely ignoring the macro shifts that drain consumer wallets. You cannot expect sustained market rallies if retail discretionary spending is quietly contracting in the background.
The prevailing narrative tells you to only watch central bank policy, but household balance sheets dictate whether spare capital ever flows into $BTC. When consumer platform earnings drop, look closely at booking growth and consumer demand rather than just headline revenue. A slowdown in discretionary spending shows that the disposable cash fueling speculative markets is drying up weeks before on-chain volume reflects it.
To stay ahead, turn these corporate reports into an actionable liquidity roadmap. Compare consumer platform health against active volume across $ETH to spot momentum exhaustion before the herd catches on. If discretionary spending tightens while crypto pushes into resistance, use that divergence to trim risk rather than chasing breakouts, and wait for consumer sentiment to stabilize before re-entering assets like $SOL.
Are you factoring consumer earnings into your market bias, or do you strictly trade the charts?
#MacroCrypto #Bitcoin #TradingStrategy
Why is nobody talking about how traditional consumer earnings reports like Airbnb's November 5 release expose the real direction of retail crypto liquidity?
Most traders lose capital because they stay glued to low-timeframe charts while completely ignoring the macro shifts that drain consumer wallets. You cannot expect sustained market rallies if retail discretionary spending is quietly contracting in the background.
The prevailing narrative tells you to only watch central bank policy, but household balance sheets dictate whether spare capital ever flows into $BTC . When consumer platform earnings drop, look closely at booking growth and consumer demand rather than just headline revenue. A slowdown in discretionary spending shows that the disposable cash fueling speculative markets is drying up weeks before on-chain volume reflects it.
To stay ahead, turn these corporate reports into an actionable liquidity roadmap. Compare consumer platform health against active volume across $ETH to spot momentum exhaustion before the herd catches on. If discretionary spending tightens while crypto pushes into resistance, use that divergence to trim risk rather than chasing breakouts, and wait for consumer sentiment to stabilize before re-entering assets like $SOL .
Are you factoring consumer earnings into your market bias, or do you strictly trade the charts?
#MacroCrypto #Bitcoin #TradingStrategy
Most traders lose capital because they stay glued to low-timeframe charts while completely ignoring the macro shifts that drain consumer wallets. You cannot expect sustained market rallies if retail discretionary spending is quietly contracting in the background.
The prevailing narrative tells you to only watch central bank policy, but household balance sheets dictate whether spare capital ever flows into $BTC . When consumer platform earnings drop, look closely at booking growth and consumer demand rather than just headline revenue. A slowdown in discretionary spending shows that the disposable cash fueling speculative markets is drying up weeks before on-chain volume reflects it.
To stay ahead, turn these corporate reports into an actionable liquidity roadmap. Compare consumer platform health against active volume across $ETH to spot momentum exhaustion before the herd catches on. If discretionary spending tightens while crypto pushes into resistance, use that divergence to trim risk rather than chasing breakouts, and wait for consumer sentiment to stabilize before re-entering assets like $SOL .
Are you factoring consumer earnings into your market bias, or do you strictly trade the charts?
#MacroCrypto #Bitcoin #TradingStrategy
111

·
--
Macro Deleveraging and ETF Outflows: Key Defensive Levels for $BTC, $ETH, and $BNBThe crypto market has entered a macro-driven deleveraging phase as a firmer U.S. dollar, Treasury yields above 5%, and hawkish Federal Reserve expectations weigh on risk assets alongside a tech-led equities pullback.
1. Spot ETF Flows: Institutional Redemptions Add Overhead Supply
Throughout November, U.S. spot Bitcoin ETFs have logged nearly $3.5 billion in cumulative net outflows, including a sharp $582.3 million single-day exit on November 19 led by $541.1 million from BlackRock IBIT. This steady redemption pace has temporarily removed a major structural bid from spot markets.
2. Derivatives Reset: Leverage Cleared, Funding Compressed
Recent breakdown waves wiped out $1.2B–$2.0B in 24-hour liquidations, with 80%–86% coming from overleveraged longs. Aggregated futures open interest has contracted sharply, while 8h funding rates across major venues have cooled to near-neutral levels of 0.0015%–0.0056% (with occasional negative prints), signaling that speculative long crowding has largely been flushed.
3. Key Levels and Defensive Sector Rotation
$BTC trades at $59,110.56 (-4.85% 24h) on $2.31B Binance spot volume, testing its 7-day low support at $57,778.35 after slipping below $60,000. Reclaiming the $60,000–$62,640 zone is necessary to ease immediate downside pressure.
$ETH trades at $1,627.23 (-7.35% 24h) on $1.11B volume, hovering above its 7-day low at $1,581.47 with resistance at $1,700–$1,770.55.
$BNB stands at $540.14 (-6.98% 24h) on $135.65M volume, watching $530.00 support against $565–$581.92 resistance.
Sector rotation highlights a clear flight to safety: tokenized gold assets XAUT and PAXG slipped only 1.6%–1.8%, significantly outperforming high-beta altcoins and tech-linked tokens.
4. Bull vs. Bear Outlook
With leverage reset and funding flat, any pause in ETF outflows or softer macro data could spark a sharp short-covering bounce. Until then, defensive risk management around the $57,778 support remains essential.
Market observation only, NFA.
#Bitcoin #Ethereum #MacroCrypto
Macro Deleveraging and ETF Outflows: Key Defensive Levels for $BTC, $ETH, and $BNB
The crypto market has entered a macro-driven deleveraging phase as a firmer U.S. dollar, Treasury yields above 5%, and hawkish Federal Reserve expectations weigh on risk assets alongside a tech-led equities pullback.
1. Spot ETF Flows: Institutional Redemptions Add Overhead Supply
Throughout November, U.S. spot Bitcoin ETFs have logged nearly $3.5 billion in cumulative net outflows, including a sharp $582.3 million single-day exit on November 19 led by $541.1 million from BlackRock IBIT. This steady redemption pace has temporarily removed a major structural bid from spot markets.
2. Derivatives Reset: Leverage Cleared, Funding Compressed
Recent breakdown waves wiped out $1.2B–$2.0B in 24-hour liquidations, with 80%–86% coming from overleveraged longs. Aggregated futures open interest has contracted sharply, while 8h funding rates across major venues have cooled to near-neutral levels of 0.0015%–0.0056% (with occasional negative prints), signaling that speculative long crowding has largely been flushed.
3. Key Levels and Defensive Sector Rotation
$BTC trades at $59,110.56 (-4.85% 24h) on $2.31B Binance spot volume, testing its 7-day low support at $57,778.35 after slipping below $60,000. Reclaiming the $60,000–$62,640 zone is necessary to ease immediate downside pressure.
$ETH trades at $1,627.23 (-7.35% 24h) on $1.11B volume, hovering above its 7-day low at $1,581.47 with resistance at $1,700–$1,770.55.
$BNB stands at $540.14 (-6.98% 24h) on $135.65M volume, watching $530.00 support against $565–$581.92 resistance.
Sector rotation highlights a clear flight to safety: tokenized gold assets XAUT and PAXG slipped only 1.6%–1.8%, significantly outperforming high-beta altcoins and tech-linked tokens.
4. Bull vs. Bear Outlook
With leverage reset and funding flat, any pause in ETF outflows or softer macro data could spark a sharp short-covering bounce. Until then, defensive risk management around the $57,778 support remains essential.
Market observation only, NFA.
#Bitcoin #Ethereum #MacroCrypto
1. Spot ETF Flows: Institutional Redemptions Add Overhead Supply
Throughout November, U.S. spot Bitcoin ETFs have logged nearly $3.5 billion in cumulative net outflows, including a sharp $582.3 million single-day exit on November 19 led by $541.1 million from BlackRock IBIT. This steady redemption pace has temporarily removed a major structural bid from spot markets.
2. Derivatives Reset: Leverage Cleared, Funding Compressed
Recent breakdown waves wiped out $1.2B–$2.0B in 24-hour liquidations, with 80%–86% coming from overleveraged longs. Aggregated futures open interest has contracted sharply, while 8h funding rates across major venues have cooled to near-neutral levels of 0.0015%–0.0056% (with occasional negative prints), signaling that speculative long crowding has largely been flushed.
3. Key Levels and Defensive Sector Rotation
$BTC trades at $59,110.56 (-4.85% 24h) on $2.31B Binance spot volume, testing its 7-day low support at $57,778.35 after slipping below $60,000. Reclaiming the $60,000–$62,640 zone is necessary to ease immediate downside pressure.
$ETH trades at $1,627.23 (-7.35% 24h) on $1.11B volume, hovering above its 7-day low at $1,581.47 with resistance at $1,700–$1,770.55.
$BNB stands at $540.14 (-6.98% 24h) on $135.65M volume, watching $530.00 support against $565–$581.92 resistance.
Sector rotation highlights a clear flight to safety: tokenized gold assets XAUT and PAXG slipped only 1.6%–1.8%, significantly outperforming high-beta altcoins and tech-linked tokens.
4. Bull vs. Bear Outlook
With leverage reset and funding flat, any pause in ETF outflows or softer macro data could spark a sharp short-covering bounce. Until then, defensive risk management around the $57,778 support remains essential.
Market observation only, NFA.
#Bitcoin #Ethereum #MacroCrypto
2
·
--
Macro Tightening Meets ETF Outflows: Can $BTC Hold $61,760 as $ETH and $BNB Show Relative Resilience?The cryptocurrency market has navigated a sharp one-two punch of macroeconomic tightening and derivatives deleveraging over the past week. At press time, $BTC trades at $62,118 (-0.80% over 24h on $1,195.01M Binance spot volume), hovering just above its 7-day low of $61,760.25 and down more than 13% from its 7-day high of $71,514.01. Meanwhile, $ETH at $1,761.74 (+0.63%) and $BNB at $581.50 (+0.46%) are showing modest relative strength.
1. Macro Liquidity and Spot ETF Redemptions
Firmer-than-expected inflation prints have pushed market pricing for a December Federal Reserve rate hike near 92%, lifting 10-year U.S. Treasury yields above 5.1% and driving the U.S. Dollar Index (DXY) to multi-month highs. That liquidity drain is visible in institutional flows: U.S. spot Bitcoin ETFs have recorded roughly $1.9B to $2.1B in cumulative net outflows across November, removing a key pillar of spot demand.
2. Derivatives Flush, Negative Funding, and Options Skew
Mid-November volatility triggered $1.3B to $1.7B in leveraged liquidations, with long positions accounting for 88% to 92% of the wipeout. Following that reset, perpetual funding rates across major exchanges have flipped negative, while 1-month 25-delta options skew climbed above 20, signaling heavy demand for downside put protection. Even so, Binance has led a fresh uptick in Ethereum futures open interest, pointing to early, selective positioning in core large-caps.
3. Key Support and Resistance Zones
$BTC must defend the $61,760 7-day low to avoid another leg down, while initial overhead resistance sits at the 24h high of $64,080.80.
$ETH is watching $1,711 to $1,748 as structural support, with a break above $1,817.57 needed to confirm relative outperformance.
$BNB remains range-bound between $566.00 and $594.00, backed by steady ecosystem demand.
With funding negative and protective put skew elevated, defensive positioning dominates. Until spot ETF outflows stabilize, traders should respect key support boundaries and manage leverage tightly.
#Bitcoin #Ethereum #MacroCrypto
Market observation only, NFA.
Macro Tightening Meets ETF Outflows: Can $BTC Hold $61,760 as $ETH and $BNB Show Relative Resilience?
The cryptocurrency market has navigated a sharp one-two punch of macroeconomic tightening and derivatives deleveraging over the past week. At press time, $BTC trades at $62,118 (-0.80% over 24h on $1,195.01M Binance spot volume), hovering just above its 7-day low of $61,760.25 and down more than 13% from its 7-day high of $71,514.01. Meanwhile, $ETH at $1,761.74 (+0.63%) and $BNB at $581.50 (+0.46%) are showing modest relative strength.
1. Macro Liquidity and Spot ETF Redemptions
Firmer-than-expected inflation prints have pushed market pricing for a December Federal Reserve rate hike near 92%, lifting 10-year U.S. Treasury yields above 5.1% and driving the U.S. Dollar Index (DXY) to multi-month highs. That liquidity drain is visible in institutional flows: U.S. spot Bitcoin ETFs have recorded roughly $1.9B to $2.1B in cumulative net outflows across November, removing a key pillar of spot demand.
2. Derivatives Flush, Negative Funding, and Options Skew
Mid-November volatility triggered $1.3B to $1.7B in leveraged liquidations, with long positions accounting for 88% to 92% of the wipeout. Following that reset, perpetual funding rates across major exchanges have flipped negative, while 1-month 25-delta options skew climbed above 20, signaling heavy demand for downside put protection. Even so, Binance has led a fresh uptick in Ethereum futures open interest, pointing to early, selective positioning in core large-caps.
3. Key Support and Resistance Zones
$BTC must defend the $61,760 7-day low to avoid another leg down, while initial overhead resistance sits at the 24h high of $64,080.80.
$ETH is watching $1,711 to $1,748 as structural support, with a break above $1,817.57 needed to confirm relative outperformance.
$BNB remains range-bound between $566.00 and $594.00, backed by steady ecosystem demand.
With funding negative and protective put skew elevated, defensive positioning dominates. Until spot ETF outflows stabilize, traders should respect key support boundaries and manage leverage tightly.
#Bitcoin #Ethereum #MacroCrypto
Market observation only, NFA.
1. Macro Liquidity and Spot ETF Redemptions
Firmer-than-expected inflation prints have pushed market pricing for a December Federal Reserve rate hike near 92%, lifting 10-year U.S. Treasury yields above 5.1% and driving the U.S. Dollar Index (DXY) to multi-month highs. That liquidity drain is visible in institutional flows: U.S. spot Bitcoin ETFs have recorded roughly $1.9B to $2.1B in cumulative net outflows across November, removing a key pillar of spot demand.
2. Derivatives Flush, Negative Funding, and Options Skew
Mid-November volatility triggered $1.3B to $1.7B in leveraged liquidations, with long positions accounting for 88% to 92% of the wipeout. Following that reset, perpetual funding rates across major exchanges have flipped negative, while 1-month 25-delta options skew climbed above 20, signaling heavy demand for downside put protection. Even so, Binance has led a fresh uptick in Ethereum futures open interest, pointing to early, selective positioning in core large-caps.
3. Key Support and Resistance Zones
$BTC must defend the $61,760 7-day low to avoid another leg down, while initial overhead resistance sits at the 24h high of $64,080.80.
$ETH is watching $1,711 to $1,748 as structural support, with a break above $1,817.57 needed to confirm relative outperformance.
$BNB remains range-bound between $566.00 and $594.00, backed by steady ecosystem demand.
With funding negative and protective put skew elevated, defensive positioning dominates. Until spot ETF outflows stabilize, traders should respect key support boundaries and manage leverage tightly.
#Bitcoin #Ethereum #MacroCrypto
Market observation only, NFA.
80
·
--
Key support structures for $BTC, $ETH, and $BNB amid ETF outflows and high interest ratesThe crypto market has recently entered a phase of deep, macro-driven deleveraging. A stronger U.S. dollar, Treasury yields holding above 5%, concerns about a hawkish Fed policy in December, and a pullback in U.S. tech stocks have all weighed on risk assets.
1️⃣ Spot ETF flows: Institutional withdrawals are creating overhead selling pressure
Since November, cumulative net outflows from U.S. spot Bitcoin ETFs have approached $3.5 billion, including a single-day net outflow of $582.3 million on November 19 (with BlackRock’s IBIT seeing $541.1 million in outflows that day). The temporary retreat of institutional buying has weakened a key source of demand that had previously absorbed spot selling pressure.
Key support structures for $BTC, $ETH, and $BNB amid ETF outflows and high interest rates
The crypto market has recently entered a phase of deep, macro-driven deleveraging. A stronger U.S. dollar, Treasury yields holding above 5%, concerns about a hawkish Fed policy in December, and a pullback in U.S. tech stocks have all weighed on risk assets.
1️⃣ Spot ETF flows: Institutional withdrawals are creating overhead selling pressure
Since November, cumulative net outflows from U.S. spot Bitcoin ETFs have approached $3.5 billion, including a single-day net outflow of $582.3 million on November 19 (with BlackRock’s IBIT seeing $541.1 million in outflows that day). The temporary retreat of institutional buying has weakened a key source of demand that had previously absorbed spot selling pressure.
1️⃣ Spot ETF flows: Institutional withdrawals are creating overhead selling pressure
Since November, cumulative net outflows from U.S. spot Bitcoin ETFs have approached $3.5 billion, including a single-day net outflow of $582.3 million on November 19 (with BlackRock’s IBIT seeing $541.1 million in outflows that day). The temporary retreat of institutional buying has weakened a key source of demand that had previously absorbed spot selling pressure.
33
·
--
Squeezed by Macro Tightening and ETF Outflows: $BTC Defends $61,760—How Are Funds Rotating?Over the past week, the crypto market has faced the combined impact of significant macro-driven risk aversion and deleveraging in derivatives. As of now, $BTC is trading at $62,118 (down slightly by 0.80% over 24 hours, with a trading volume of $1,195.01M). It briefly fell to a 7-day low of $61,760.25 intraday, a decline of more than 13% from its 7-day high of $71,514.01. Over the same period, $ETH is at $1,761.74 (+0.63%), and $BNB is at $581.50 (+0.46%), showing slightly greater resilience than Bitcoin.
I. Macro Liquidity and ETF Flows Under Pressure
Recently hotter-than-expected inflation data have raised market expectations of a Fed rate hike in December (with the implied probability approaching 92%). The 10-year Treasury yield has broken above 5.1%, while the U.S. Dollar Index (DXY) has strengthened, continuing to drain liquidity from riskier assets. Institutional demand has also cooled: since November, U.S. spot Bitcoin ETFs have seen cumulative net outflows of approximately $1.9 billion to $2.1 billion, with buying support weakening significantly.
Squeezed by Macro Tightening and ETF Outflows: $BTC Defends $61,760—How Are Funds Rotating?
Over the past week, the crypto market has faced the combined impact of significant macro-driven risk aversion and deleveraging in derivatives. As of now, $BTC is trading at $62,118 (down slightly by 0.80% over 24 hours, with a trading volume of $1,195.01M). It briefly fell to a 7-day low of $61,760.25 intraday, a decline of more than 13% from its 7-day high of $71,514.01. Over the same period, $ETH is at $1,761.74 (+0.63%), and $BNB is at $581.50 (+0.46%), showing slightly greater resilience than Bitcoin.
I. Macro Liquidity and ETF Flows Under Pressure
Recently hotter-than-expected inflation data have raised market expectations of a Fed rate hike in December (with the implied probability approaching 92%). The 10-year Treasury yield has broken above 5.1%, while the U.S. Dollar Index (DXY) has strengthened, continuing to drain liquidity from riskier assets. Institutional demand has also cooled: since November, U.S. spot Bitcoin ETFs have seen cumulative net outflows of approximately $1.9 billion to $2.1 billion, with buying support weakening significantly.
I. Macro Liquidity and ETF Flows Under Pressure
Recently hotter-than-expected inflation data have raised market expectations of a Fed rate hike in December (with the implied probability approaching 92%). The 10-year Treasury yield has broken above 5.1%, while the U.S. Dollar Index (DXY) has strengthened, continuing to drain liquidity from riskier assets. Institutional demand has also cooled: since November, U.S. spot Bitcoin ETFs have seen cumulative net outflows of approximately $1.9 billion to $2.1 billion, with buying support weakening significantly.
1
·
--
Market-Wide Deleveraging Amid ETF Outflows and Macroeconomic Pressures: Key BTC, ETH, and BNB Support LevelsThe crypto market has recently undergone a sharp correction, with macro interest rate expectations and institutional fund flows emerging as the key drivers of short-term volatility. Real-time market data shows that major assets are broadly under pressure, while the derivatives market has already completed a round of substantial deleveraging.
📌 Real-Time Prices and 7-Day Range Performance
1️⃣ $BTC Currently at $62,612.01 (24h -2.28%), with daily trading volume reaching $1,241.24M. The 7-day high is $74,217.49 and the low is $62,006; the price is now approaching the week's low as a key support level.
2️⃣ $ETH Currently at $1,750.43 (24h -2.85%), with a trading volume of $547.87M and a 7-day range of $1,711.08 to $2,066.42.
Market-Wide Deleveraging Amid ETF Outflows and Macroeconomic Pressures: Key BTC, ETH, and BNB Support Levels
The crypto market has recently undergone a sharp correction, with macro interest rate expectations and institutional fund flows emerging as the key drivers of short-term volatility. Real-time market data shows that major assets are broadly under pressure, while the derivatives market has already completed a round of substantial deleveraging.
📌 Real-Time Prices and 7-Day Range Performance
1️⃣ $BTC Currently at $62,612.01 (24h -2.28%), with daily trading volume reaching $1,241.24M. The 7-day high is $74,217.49 and the low is $62,006; the price is now approaching the week's low as a key support level.
2️⃣ $ETH Currently at $1,750.43 (24h -2.85%), with a trading volume of $547.87M and a 7-day range of $1,711.08 to $2,066.42.
📌 Real-Time Prices and 7-Day Range Performance
1️⃣ $BTC Currently at $62,612.01 (24h -2.28%), with daily trading volume reaching $1,241.24M. The 7-day high is $74,217.49 and the low is $62,006; the price is now approaching the week's low as a key support level.
2️⃣ $ETH Currently at $1,750.43 (24h -2.85%), with a trading volume of $547.87M and a 7-day range of $1,711.08 to $2,066.42.
·
--
After the 2B Leverage Flush: Key Levels for $BTC, $ETH, and $BNBMacro headwinds drove a sharp risk-off correction across digital assets over the past 48 hours. With 10-year U.S. Treasury yields pressing near 5.15% and sticky inflation clouding the December Federal Reserve outlook, the Crypto Fear and Greed Index plunged toward 10 in extreme fear territory. Over $1.9 billion to $2 billion in leveraged positions were liquidated during the weekend sell-off, pulling global open interest down 8% to 9% in a single day and over 15% on the week. Perpetual funding rates across major venues have flattened or flipped negative, clearing out overcrowded long leverage.
🔍 Institutional Flows Remain the Key Driver
U.S. spot Bitcoin ETFs recorded seven consecutive sessions of net outflows, bringing cumulative redemptions past $2.5 billion over the past two weeks. Until spot ETF demand stabilizes, relief bounces remain vulnerable to macro-driven selling pressure.
📌 Key Technical Zones to Watch
1. $BTC currently trades near $65,062 ($1.40B 24h spot volume on Binance) after rebounding from its 7-day low of $62,006. Immediate support holds at $62,000 to $63,900, while bulls must reclaim $65,700 and the $70,000 psychological barrier to shift momentum.
2. $ETH sits at $1,817.91 (-0.69%, $573.78M volume) within a 7-day range of $1,711 to $2,137. Key downside support rests at $1,711 to $1,787, with near-term resistance stacked at $1,867 to $2,000.
3. $BNB trades at $591.59 (-0.24%, $67.70M volume), showing relative resilience above its $566 7-day low. Overhead resistance sits around $598 to $620.
💡 Rotation and Risk Outlook
With speculative leverage purged, capital is rotating defensively away from high-beta perpetuals toward spot assets with resilient liquidity or isolated catalysts. Watch daily ETF flow reversals and open interest rebuilding before assuming a sustained trend shift.
#Bitcoin #Ethereum #MacroCrypto
Market observation only, NFA.
After the 2B Leverage Flush: Key Levels for $BTC, $ETH, and $BNB
Macro headwinds drove a sharp risk-off correction across digital assets over the past 48 hours. With 10-year U.S. Treasury yields pressing near 5.15% and sticky inflation clouding the December Federal Reserve outlook, the Crypto Fear and Greed Index plunged toward 10 in extreme fear territory. Over $1.9 billion to $2 billion in leveraged positions were liquidated during the weekend sell-off, pulling global open interest down 8% to 9% in a single day and over 15% on the week. Perpetual funding rates across major venues have flattened or flipped negative, clearing out overcrowded long leverage.
🔍 Institutional Flows Remain the Key Driver
U.S. spot Bitcoin ETFs recorded seven consecutive sessions of net outflows, bringing cumulative redemptions past $2.5 billion over the past two weeks. Until spot ETF demand stabilizes, relief bounces remain vulnerable to macro-driven selling pressure.
📌 Key Technical Zones to Watch
1. $BTC currently trades near $65,062 ($1.40B 24h spot volume on Binance) after rebounding from its 7-day low of $62,006. Immediate support holds at $62,000 to $63,900, while bulls must reclaim $65,700 and the $70,000 psychological barrier to shift momentum.
2. $ETH sits at $1,817.91 (-0.69%, $573.78M volume) within a 7-day range of $1,711 to $2,137. Key downside support rests at $1,711 to $1,787, with near-term resistance stacked at $1,867 to $2,000.
3. $BNB trades at $591.59 (-0.24%, $67.70M volume), showing relative resilience above its $566 7-day low. Overhead resistance sits around $598 to $620.
💡 Rotation and Risk Outlook
With speculative leverage purged, capital is rotating defensively away from high-beta perpetuals toward spot assets with resilient liquidity or isolated catalysts. Watch daily ETF flow reversals and open interest rebuilding before assuming a sustained trend shift.
#Bitcoin #Ethereum #MacroCrypto
Market observation only, NFA.
🔍 Institutional Flows Remain the Key Driver
U.S. spot Bitcoin ETFs recorded seven consecutive sessions of net outflows, bringing cumulative redemptions past $2.5 billion over the past two weeks. Until spot ETF demand stabilizes, relief bounces remain vulnerable to macro-driven selling pressure.
📌 Key Technical Zones to Watch
1. $BTC currently trades near $65,062 ($1.40B 24h spot volume on Binance) after rebounding from its 7-day low of $62,006. Immediate support holds at $62,000 to $63,900, while bulls must reclaim $65,700 and the $70,000 psychological barrier to shift momentum.
2. $ETH sits at $1,817.91 (-0.69%, $573.78M volume) within a 7-day range of $1,711 to $2,137. Key downside support rests at $1,711 to $1,787, with near-term resistance stacked at $1,867 to $2,000.
3. $BNB trades at $591.59 (-0.24%, $67.70M volume), showing relative resilience above its $566 7-day low. Overhead resistance sits around $598 to $620.
💡 Rotation and Risk Outlook
With speculative leverage purged, capital is rotating defensively away from high-beta perpetuals toward spot assets with resilient liquidity or isolated catalysts. Watch daily ETF flow reversals and open interest rebuilding before assuming a sustained trend shift.
#Bitcoin #Ethereum #MacroCrypto
Market observation only, NFA.
45

🚨MACRO × CRYPTO INTELLIGENCE
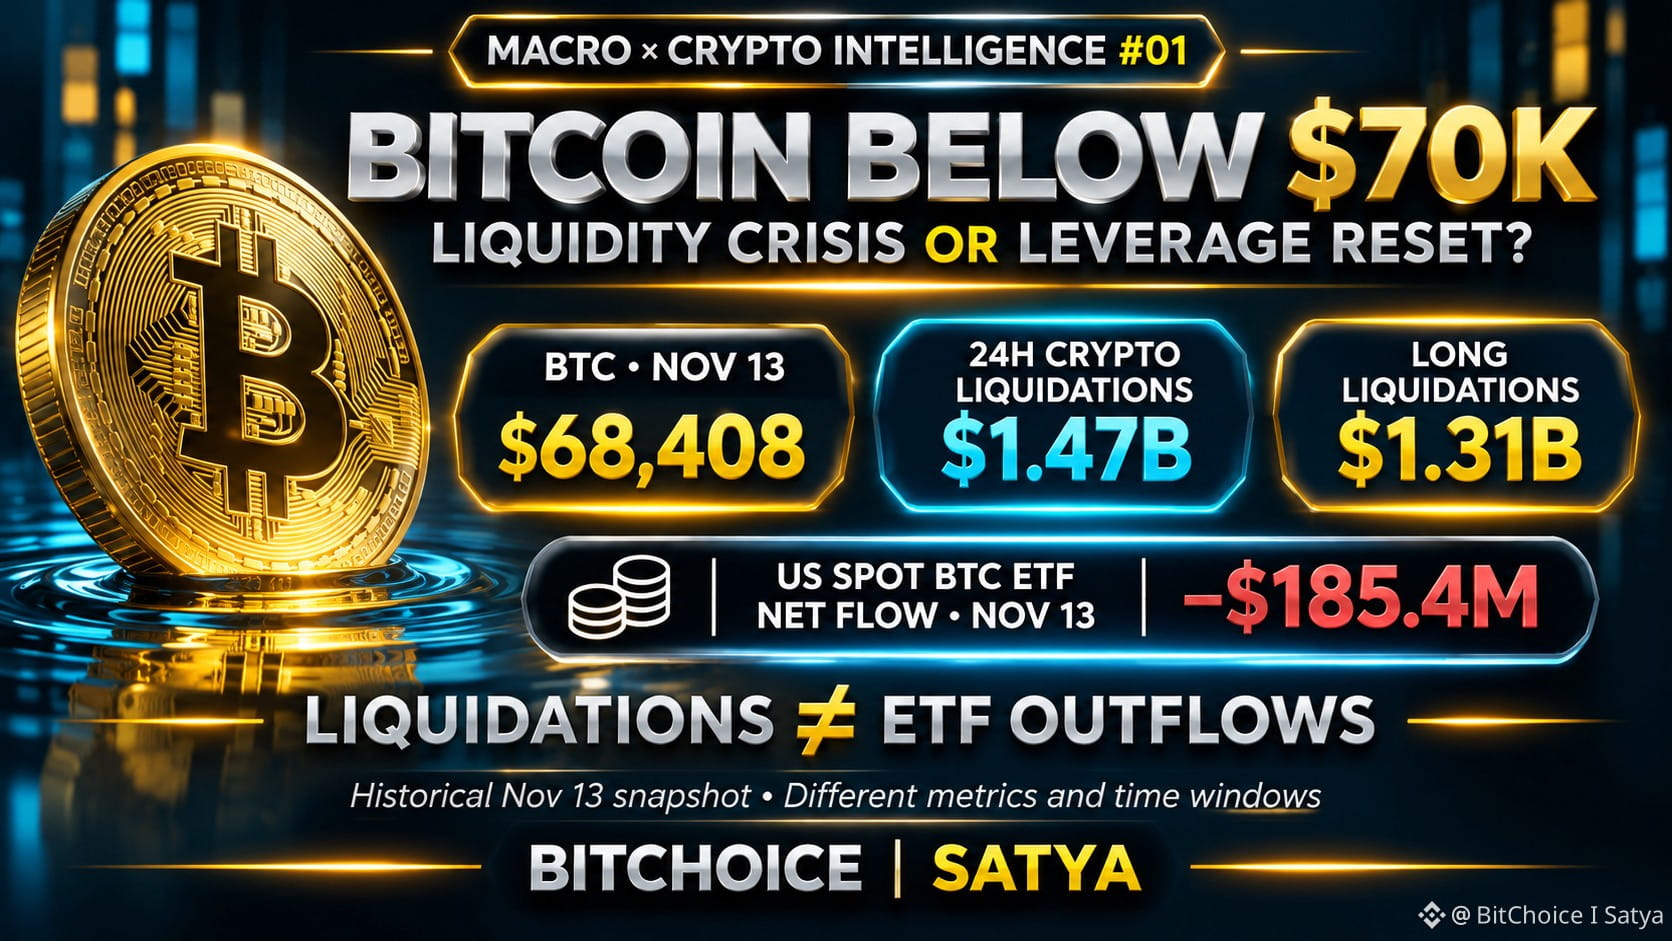
BITCOIN BELOW $70K: THE ETF & MACRO PRESSURE TEST
Bitcoin's November 13 selloff exposed two separate forces: forced closures in derivatives and weaker demand through spot ETFs.
THE NOV 13 SNAPSHOT
• BTC traded near $68,408 during the decline.
• Crypto-wide 24h liquidations reached ~$1.47B, including ~$1.31B in longs (CoinGlass snapshot).
• US spot BTC ETFs recorded a net outflow of $185.4M (Farside, Nov 13 session).
These are different metrics and time windows. Liquidations cannot be added to ETF outflows.
WHY MACRO MATTERS
Expectations of higher US rates, a stronger dollar and weakness in technology shares weighed on risk appetite.
When BTC breaks a crowded price level, leveraged long positions can be liquidated automatically. That intensifies the move, but doesn't establish that long-term holders are capitulating.
ETF redemptions are a separate signal of investment demand. One negative session is important, but not enough to establish a persistent trend.
THREE SIGNALS TO WATCH
ETF flows: Does net demand recover across multiple sessions?
Derivatives: Do open interest and funding stabilize after the flush?
Spot liquidity: Are bids and traded volumes improving on rebounds?
THE TAKEAWAY
A leverage reset can end quickly. A sustained liquidity squeeze is harder to resolve.
The distinction depends on evidence from spot demand, market depth and macro conditions — not liquidation headlines alone.
#Bitcoin #BTC #MacroCrypto #Liquidity $BTC
{spot}(BTCUSDT)
🚨MACRO × CRYPTO INTELLIGENCE
BITCOIN BELOW $70K: THE ETF & MACRO PRESSURE TEST
Bitcoin's November 13 selloff exposed two separate forces: forced closures in derivatives and weaker demand through spot ETFs.
THE NOV 13 SNAPSHOT
• BTC traded near $68,408 during the decline.
• Crypto-wide 24h liquidations reached ~$1.47B, including ~$1.31B in longs (CoinGlass snapshot).
• US spot BTC ETFs recorded a net outflow of $185.4M (Farside, Nov 13 session).
These are different metrics and time windows. Liquidations cannot be added to ETF outflows.
WHY MACRO MATTERS
Expectations of higher US rates, a stronger dollar and weakness in technology shares weighed on risk appetite.
When BTC breaks a crowded price level, leveraged long positions can be liquidated automatically. That intensifies the move, but doesn't establish that long-term holders are capitulating.
ETF redemptions are a separate signal of investment demand. One negative session is important, but not enough to establish a persistent trend.
THREE SIGNALS TO WATCH
ETF flows: Does net demand recover across multiple sessions?
Derivatives: Do open interest and funding stabilize after the flush?
Spot liquidity: Are bids and traded volumes improving on rebounds?
THE TAKEAWAY
A leverage reset can end quickly. A sustained liquidity squeeze is harder to resolve.
The distinction depends on evidence from spot demand, market depth and macro conditions — not liquidation headlines alone.
#Bitcoin #BTC #MacroCrypto #Liquidity $BTC
BITCOIN BELOW $70K: THE ETF & MACRO PRESSURE TEST
Bitcoin's November 13 selloff exposed two separate forces: forced closures in derivatives and weaker demand through spot ETFs.
THE NOV 13 SNAPSHOT
• BTC traded near $68,408 during the decline.
• Crypto-wide 24h liquidations reached ~$1.47B, including ~$1.31B in longs (CoinGlass snapshot).
• US spot BTC ETFs recorded a net outflow of $185.4M (Farside, Nov 13 session).
These are different metrics and time windows. Liquidations cannot be added to ETF outflows.
WHY MACRO MATTERS
Expectations of higher US rates, a stronger dollar and weakness in technology shares weighed on risk appetite.
When BTC breaks a crowded price level, leveraged long positions can be liquidated automatically. That intensifies the move, but doesn't establish that long-term holders are capitulating.
ETF redemptions are a separate signal of investment demand. One negative session is important, but not enough to establish a persistent trend.
THREE SIGNALS TO WATCH
ETF flows: Does net demand recover across multiple sessions?
Derivatives: Do open interest and funding stabilize after the flush?
Spot liquidity: Are bids and traded volumes improving on rebounds?
THE TAKEAWAY
A leverage reset can end quickly. A sustained liquidity squeeze is harder to resolve.
The distinction depends on evidence from spot demand, market depth and macro conditions — not liquidation headlines alone.
#Bitcoin #BTC #MacroCrypto #Liquidity $BTC
136

·
--
Where we are in the rate cycle matters more for crypto than most traders acknowledge.
Rate hikes: liquidity tightens, risk assets reprice lower. 2022 was a clean example.
Rate cuts: liquidity expands, capital flows back into risk. 2020 and early 2023 showed the effect.
The current setup: rates still restrictive, cuts being priced in for later this year. That's the anticipation phase: markets price the cut before it happens.
If cuts are delayed, that anticipation unwinds. That's the primary macro risk for crypto right now.
#MacroCrypto #Bitcoin #BTC
Where we are in the rate cycle matters more for crypto than most traders acknowledge.
Rate hikes: liquidity tightens, risk assets reprice lower. 2022 was a clean example.
Rate cuts: liquidity expands, capital flows back into risk. 2020 and early 2023 showed the effect.
The current setup: rates still restrictive, cuts being priced in for later this year. That's the anticipation phase: markets price the cut before it happens.
If cuts are delayed, that anticipation unwinds. That's the primary macro risk for crypto right now.
#MacroCrypto #Bitcoin #BTC
Rate hikes: liquidity tightens, risk assets reprice lower. 2022 was a clean example.
Rate cuts: liquidity expands, capital flows back into risk. 2020 and early 2023 showed the effect.
The current setup: rates still restrictive, cuts being priced in for later this year. That's the anticipation phase: markets price the cut before it happens.
If cuts are delayed, that anticipation unwinds. That's the primary macro risk for crypto right now.
#MacroCrypto #Bitcoin #BTC
29

·
--
Global inflation and restrictive monetary policies to control it affect crypto. By reducing liquidity and increasing the cost of capital, investors tend to reassess risk assets, putting downward pressure on cryptocurrency prices. Its macroeconomic sensitivity is evident. #MacroCrypto #CryptoEconomy
📊 https://quant-fin.online
📢 @QuantF
━━━━━━━━━━━━━━━━━━
QuantFin — RUF-Flow Protocol v7
Powered by Nexus Flow Dynamics
© 2026 QuantFin. Trading involves risk.
Global inflation and restrictive monetary policies to control it affect crypto. By reducing liquidity and increasing the cost of capital, investors tend to reassess risk assets, putting downward pressure on cryptocurrency prices. Its macroeconomic sensitivity is evident. #MacroCrypto #CryptoEconomy
📊 https://quant-fin.online
📢 @QuantF
━━━━━━━━━━━━━━━━━━
QuantFin — RUF-Flow Protocol v7
Powered by Nexus Flow Dynamics
© 2026 QuantFin. Trading involves risk.
📊 https://quant-fin.online
📢 @QuantF
━━━━━━━━━━━━━━━━━━
QuantFin — RUF-Flow Protocol v7
Powered by Nexus Flow Dynamics
© 2026 QuantFin. Trading involves risk.
50

·
--
everyone thinks $btc dumps are just whale games, but actually this case shows the yen carry trade can smack your portfolio harder than a bad entry.
the mistake is staring at candles only while macro liquidity is getting pulled in the background. that’s how traders fomo buy “support” at $62.5k, then panic if the next liquidity pocket is closer to $50k.
look at the setup: $BTC is hovering near $62,500, around 50% below its oct 2025 peak of $126,198. every major correction in this case lines up with japan defending the yen, not just crypto-native drama.
tokyo and washington also pulled off their first joint yen intervention since 1998, with $59b deployed and $32b dumped in just one week. when the yen carry trade unwinds, risk assets can get hit fast because leveraged money has to de-risk, and that can spill into $ETH, $SOL, and basically anything with beta.
ngl ser, the warning here is simple: if you’re trading crypto while ignoring yen moves, bond yields, and intervention headlines, you’re playing half the board. what’s your take on $BTC from here, bounce zone or $50k magnet?
#Bitcoin #CryptoTrading #MacroCrypto
everyone thinks $btc dumps are just whale games, but actually this case shows the yen carry trade can smack your portfolio harder than a bad entry.
the mistake is staring at candles only while macro liquidity is getting pulled in the background. that’s how traders fomo buy “support” at $62.5k, then panic if the next liquidity pocket is closer to $50k.
look at the setup: $BTC is hovering near $62,500, around 50% below its oct 2025 peak of $126,198. every major correction in this case lines up with japan defending the yen, not just crypto-native drama.
tokyo and washington also pulled off their first joint yen intervention since 1998, with $59b deployed and $32b dumped in just one week. when the yen carry trade unwinds, risk assets can get hit fast because leveraged money has to de-risk, and that can spill into $ETH , $SOL , and basically anything with beta.
ngl ser, the warning here is simple: if you’re trading crypto while ignoring yen moves, bond yields, and intervention headlines, you’re playing half the board. what’s your take on $BTC from here, bounce zone or $50k magnet?
#Bitcoin #CryptoTrading #MacroCrypto
the mistake is staring at candles only while macro liquidity is getting pulled in the background. that’s how traders fomo buy “support” at $62.5k, then panic if the next liquidity pocket is closer to $50k.
look at the setup: $BTC is hovering near $62,500, around 50% below its oct 2025 peak of $126,198. every major correction in this case lines up with japan defending the yen, not just crypto-native drama.
tokyo and washington also pulled off their first joint yen intervention since 1998, with $59b deployed and $32b dumped in just one week. when the yen carry trade unwinds, risk assets can get hit fast because leveraged money has to de-risk, and that can spill into $ETH , $SOL , and basically anything with beta.
ngl ser, the warning here is simple: if you’re trading crypto while ignoring yen moves, bond yields, and intervention headlines, you’re playing half the board. what’s your take on $BTC from here, bounce zone or $50k magnet?
#Bitcoin #CryptoTrading #MacroCrypto

47
·
--
A diplomatic headline can move $BTC faster than a chart pattern: today, “advanced” Iran-Oman talks over the Strait of Hormuz helped Bitcoin reclaim $64K before slipping back near $63.5K.
If you’ve ever chased a green candle and watched it fade within hours, this is why macro matters. Crypto traders don’t just trade charts. We trade fear, oil, war risk, liquidity, and positioning.
$BTC moved roughly 0.8% higher, trading between $63.7K and $64.25K as volume jumped 42%, then gave back part of the move over the last 4 hours. That’s not random noise. It’s the market repricing geopolitical risk in real time.
Oil told the same story, but louder. It dropped more than 2% back below $82 as war-risk premium cooled, then spiked above $88 again when uncertainty returned. In past cycles, I’ve seen this pattern many times: less conflict risk often means lower oil pressure, softer inflation fears, and a better mood for risk assets like $BTC, $ETH, and $BNB.
The lesson is simple. When headlines drive the move, entries need patience. A calmer macro backdrop can support crypto, but headline rallies can reverse fast when fear comes back into the room.
Are you treating this $BTC move as a real risk-on signal, or just another headline-driven trap?
#Bitcoin #CryptoTrading #MacroCrypto
A diplomatic headline can move $BTC faster than a chart pattern: today, “advanced” Iran-Oman talks over the Strait of Hormuz helped Bitcoin reclaim $64K before slipping back near $63.5K.
If you’ve ever chased a green candle and watched it fade within hours, this is why macro matters. Crypto traders don’t just trade charts. We trade fear, oil, war risk, liquidity, and positioning.
$BTC moved roughly 0.8% higher, trading between $63.7K and $64.25K as volume jumped 42%, then gave back part of the move over the last 4 hours. That’s not random noise. It’s the market repricing geopolitical risk in real time.
Oil told the same story, but louder. It dropped more than 2% back below $82 as war-risk premium cooled, then spiked above $88 again when uncertainty returned. In past cycles, I’ve seen this pattern many times: less conflict risk often means lower oil pressure, softer inflation fears, and a better mood for risk assets like $BTC , $ETH , and $BNB .
The lesson is simple. When headlines drive the move, entries need patience. A calmer macro backdrop can support crypto, but headline rallies can reverse fast when fear comes back into the room.
Are you treating this $BTC move as a real risk-on signal, or just another headline-driven trap?
#Bitcoin #CryptoTrading #MacroCrypto
If you’ve ever chased a green candle and watched it fade within hours, this is why macro matters. Crypto traders don’t just trade charts. We trade fear, oil, war risk, liquidity, and positioning.
$BTC moved roughly 0.8% higher, trading between $63.7K and $64.25K as volume jumped 42%, then gave back part of the move over the last 4 hours. That’s not random noise. It’s the market repricing geopolitical risk in real time.
Oil told the same story, but louder. It dropped more than 2% back below $82 as war-risk premium cooled, then spiked above $88 again when uncertainty returned. In past cycles, I’ve seen this pattern many times: less conflict risk often means lower oil pressure, softer inflation fears, and a better mood for risk assets like $BTC , $ETH , and $BNB .
The lesson is simple. When headlines drive the move, entries need patience. A calmer macro backdrop can support crypto, but headline rallies can reverse fast when fear comes back into the room.
Are you treating this $BTC move as a real risk-on signal, or just another headline-driven trap?
#Bitcoin #CryptoTrading #MacroCrypto

41
·
--
Here’s what happened when geopolitics, oil, and $BTC all moved in the same conversation.
Crypto traders know this pain too well: you see Bitcoin reclaim $64K, FOMO kicks in, and then it slips back toward $63.5K before you can even decide if it’s a breakout or a trap. Macro headlines can turn a clean setup into noise fast.
In this case, $BTC bounced after Qatar said Iran-Oman talks over the Strait of Hormuz had reached an “advanced” stage. That mattered because the Strait is a major oil chokepoint, and lower war risk usually cools oil pressure. Bitcoin traded between roughly $63.7K and $64.25K, up about 0.8%, while volume jumped 42% before the move faded over the next few hours.
We’ve seen this movie before. During past Middle East tension spikes and the Russia-Ukraine shock, oil often reacts first, then risk assets like $BTC and $ETH follow the mood shift. When oil dropped more than 2% below $82, the market briefly read it as relief. But the later jump back above $88 showed how fragile that relief can be.
The lesson is simple: macro-driven pumps are not the same as strong trend reversals. If the headline risk fades, $BNB and broader crypto can catch a bid. If the oil market stays jumpy, traders may keep selling rallies instead of chasing them.
What’s your take: is Bitcoin reacting to real risk relief here, or just another headline-driven fakeout?
#Bitcoin #CryptoMarkets #MacroCrypto
Here’s what happened when geopolitics, oil, and $BTC all moved in the same conversation.
Crypto traders know this pain too well: you see Bitcoin reclaim $64K, FOMO kicks in, and then it slips back toward $63.5K before you can even decide if it’s a breakout or a trap. Macro headlines can turn a clean setup into noise fast.
In this case, $BTC bounced after Qatar said Iran-Oman talks over the Strait of Hormuz had reached an “advanced” stage. That mattered because the Strait is a major oil chokepoint, and lower war risk usually cools oil pressure. Bitcoin traded between roughly $63.7K and $64.25K, up about 0.8%, while volume jumped 42% before the move faded over the next few hours.
We’ve seen this movie before. During past Middle East tension spikes and the Russia-Ukraine shock, oil often reacts first, then risk assets like $BTC and $ETH follow the mood shift. When oil dropped more than 2% below $82, the market briefly read it as relief. But the later jump back above $88 showed how fragile that relief can be.
The lesson is simple: macro-driven pumps are not the same as strong trend reversals. If the headline risk fades, $BNB and broader crypto can catch a bid. If the oil market stays jumpy, traders may keep selling rallies instead of chasing them.
What’s your take: is Bitcoin reacting to real risk relief here, or just another headline-driven fakeout?
#Bitcoin #CryptoMarkets #MacroCrypto
Crypto traders know this pain too well: you see Bitcoin reclaim $64K, FOMO kicks in, and then it slips back toward $63.5K before you can even decide if it’s a breakout or a trap. Macro headlines can turn a clean setup into noise fast.
In this case, $BTC bounced after Qatar said Iran-Oman talks over the Strait of Hormuz had reached an “advanced” stage. That mattered because the Strait is a major oil chokepoint, and lower war risk usually cools oil pressure. Bitcoin traded between roughly $63.7K and $64.25K, up about 0.8%, while volume jumped 42% before the move faded over the next few hours.
We’ve seen this movie before. During past Middle East tension spikes and the Russia-Ukraine shock, oil often reacts first, then risk assets like $BTC and $ETH follow the mood shift. When oil dropped more than 2% below $82, the market briefly read it as relief. But the later jump back above $88 showed how fragile that relief can be.
The lesson is simple: macro-driven pumps are not the same as strong trend reversals. If the headline risk fades, $BNB and broader crypto can catch a bid. If the oil market stays jumpy, traders may keep selling rallies instead of chasing them.
What’s your take: is Bitcoin reacting to real risk relief here, or just another headline-driven fakeout?
#Bitcoin #CryptoMarkets #MacroCrypto

34

#usweeklyjoblessclaimsfallto197000
Unemployment benefit claims in the United States fell to 197,000, meaning the job market is very strong! 🤯 Another good sign for the Fed, but a headache for rate cuts.
As a result, the probability of a rate hike in October on the CME FedWatch platform has wobbled, currently at about 47.1%. Yields are rising fast, and Bitcoin has slipped to $83.5k. Traders, get ready for the Non-Farm Payroll data on Friday. Watch the U.S. Dollar Index and set your stop-loss levels! 📉💸
⚠️ Not investment advice. Do your own research (DYOR)!
Please follow up
$BTC
$ETH
$SOL
#FedWatch #MacroCrypto #joblessclaims #CryptoTrading
#usweeklyjoblessclaimsfallto197000
Unemployment benefit claims in the United States fell to 197,000, meaning the job market is very strong! 🤯 Another good sign for the Fed, but a headache for rate cuts.
As a result, the probability of a rate hike in October on the CME FedWatch platform has wobbled, currently at about 47.1%. Yields are rising fast, and Bitcoin has slipped to $83.5k. Traders, get ready for the Non-Farm Payroll data on Friday. Watch the U.S. Dollar Index and set your stop-loss levels! 📉💸
⚠️ Not investment advice. Do your own research (DYOR)!
Please follow up
$BTC
$ETH
$SOL
#FedWatch #MacroCrypto #joblessclaims #CryptoTrading
Unemployment benefit claims in the United States fell to 197,000, meaning the job market is very strong! 🤯 Another good sign for the Fed, but a headache for rate cuts.
As a result, the probability of a rate hike in October on the CME FedWatch platform has wobbled, currently at about 47.1%. Yields are rising fast, and Bitcoin has slipped to $83.5k. Traders, get ready for the Non-Farm Payroll data on Friday. Watch the U.S. Dollar Index and set your stop-loss levels! 📉💸
⚠️ Not investment advice. Do your own research (DYOR)!
Please follow up
$BTC
$ETH
$SOL
#FedWatch #MacroCrypto #joblessclaims #CryptoTrading

1
110

⚡ OIL ANCHORED AT $100 SENDS SHOCKWAVES INTO $W AND $RSR RISK APPETITE! 🌊
Macro headwinds are colliding with crypto order flow as sticky $100 crude forces institutional desks to reassess their inflation playbook. 📊 While energy dominance puts pressure on broader market liquidity, capital is already scouting which high-beta setups can decouple from the macro noise.
When broader consensus crowds into defensive fear, order books often thin out just enough to trigger aggressive counter-trend moves. 💡
🤔 Are you positioning for a relief squeeze here or waiting for the macro dust to settle?
⚠️ Not financial advice. Always manage your risk. 🛡️
🏷️ #W #RSR #MacroCrypto #Altcoins #Crypto
🔥 ⚡
⚡ OIL ANCHORED AT $100 SENDS SHOCKWAVES INTO $W AND $RSR RISK APPETITE! 🌊
Macro headwinds are colliding with crypto order flow as sticky $100 crude forces institutional desks to reassess their inflation playbook. 📊 While energy dominance puts pressure on broader market liquidity, capital is already scouting which high-beta setups can decouple from the macro noise.
When broader consensus crowds into defensive fear, order books often thin out just enough to trigger aggressive counter-trend moves. 💡
🤔 Are you positioning for a relief squeeze here or waiting for the macro dust to settle?
⚠️ Not financial advice. Always manage your risk. 🛡️
🏷️ #W #RSR #MacroCrypto #Altcoins #Crypto
🔥 ⚡
Macro headwinds are colliding with crypto order flow as sticky $100 crude forces institutional desks to reassess their inflation playbook. 📊 While energy dominance puts pressure on broader market liquidity, capital is already scouting which high-beta setups can decouple from the macro noise.
When broader consensus crowds into defensive fear, order books often thin out just enough to trigger aggressive counter-trend moves. 💡
🤔 Are you positioning for a relief squeeze here or waiting for the macro dust to settle?
⚠️ Not financial advice. Always manage your risk. 🛡️
🏷️ #W #RSR #MacroCrypto #Altcoins #Crypto
🔥 ⚡


151

After Trump publicly backed Dell, the company’s stock surged 4.4% in a single day.
The value of this unusual move goes beyond the gain itself—political endorsements are becoming an explicit factor in how US equities are priced. From tariff exemptions to AI hardware supply chains, the administration’s stance directly affects the timing and rhythm of reassessments of individual stocks.
It’s also worth noting how this maps onto the crypto market:
1)In the AI infrastructure narrative, Dell is a key distributor of NVIDIA servers. Strength in traditional AI hardware typically boosts sentiment across on-chain AI sectors, creating a synchronization of mood in the chain;
2)The “Trump Trade” has been reactivated: policy beta for risk assets is being amplified, and the correlation between BTC and US tech stocks may rise further;
3)When political factors become the dominant variable, the marginal usefulness of purely technical analysis declines, making the macro–policy–liquidity three-part framework more practical.
In the short term, sector rotation that follows policy narratives is likely to accelerate, and on-chain AI, RWA, and assets tied to US local compliance are more likely to capture a valuation premium.
#TrumpTrade #AI #MacroCrypto
After Trump publicly backed Dell, the company’s stock surged 4.4% in a single day.
The value of this unusual move goes beyond the gain itself—political endorsements are becoming an explicit factor in how US equities are priced. From tariff exemptions to AI hardware supply chains, the administration’s stance directly affects the timing and rhythm of reassessments of individual stocks.
It’s also worth noting how this maps onto the crypto market:
1)In the AI infrastructure narrative, Dell is a key distributor of NVIDIA servers. Strength in traditional AI hardware typically boosts sentiment across on-chain AI sectors, creating a synchronization of mood in the chain;
2)The “Trump Trade” has been reactivated: policy beta for risk assets is being amplified, and the correlation between BTC and US tech stocks may rise further;
3)When political factors become the dominant variable, the marginal usefulness of purely technical analysis declines, making the macro–policy–liquidity three-part framework more practical.
In the short term, sector rotation that follows policy narratives is likely to accelerate, and on-chain AI, RWA, and assets tied to US local compliance are more likely to capture a valuation premium.
#TrumpTrade #AI #MacroCrypto
The value of this unusual move goes beyond the gain itself—political endorsements are becoming an explicit factor in how US equities are priced. From tariff exemptions to AI hardware supply chains, the administration’s stance directly affects the timing and rhythm of reassessments of individual stocks.
It’s also worth noting how this maps onto the crypto market:
1)In the AI infrastructure narrative, Dell is a key distributor of NVIDIA servers. Strength in traditional AI hardware typically boosts sentiment across on-chain AI sectors, creating a synchronization of mood in the chain;
2)The “Trump Trade” has been reactivated: policy beta for risk assets is being amplified, and the correlation between BTC and US tech stocks may rise further;
3)When political factors become the dominant variable, the marginal usefulness of purely technical analysis declines, making the macro–policy–liquidity three-part framework more practical.
In the short term, sector rotation that follows policy narratives is likely to accelerate, and on-chain AI, RWA, and assets tied to US local compliance are more likely to capture a valuation premium.
#TrumpTrade #AI #MacroCrypto
126

·
--
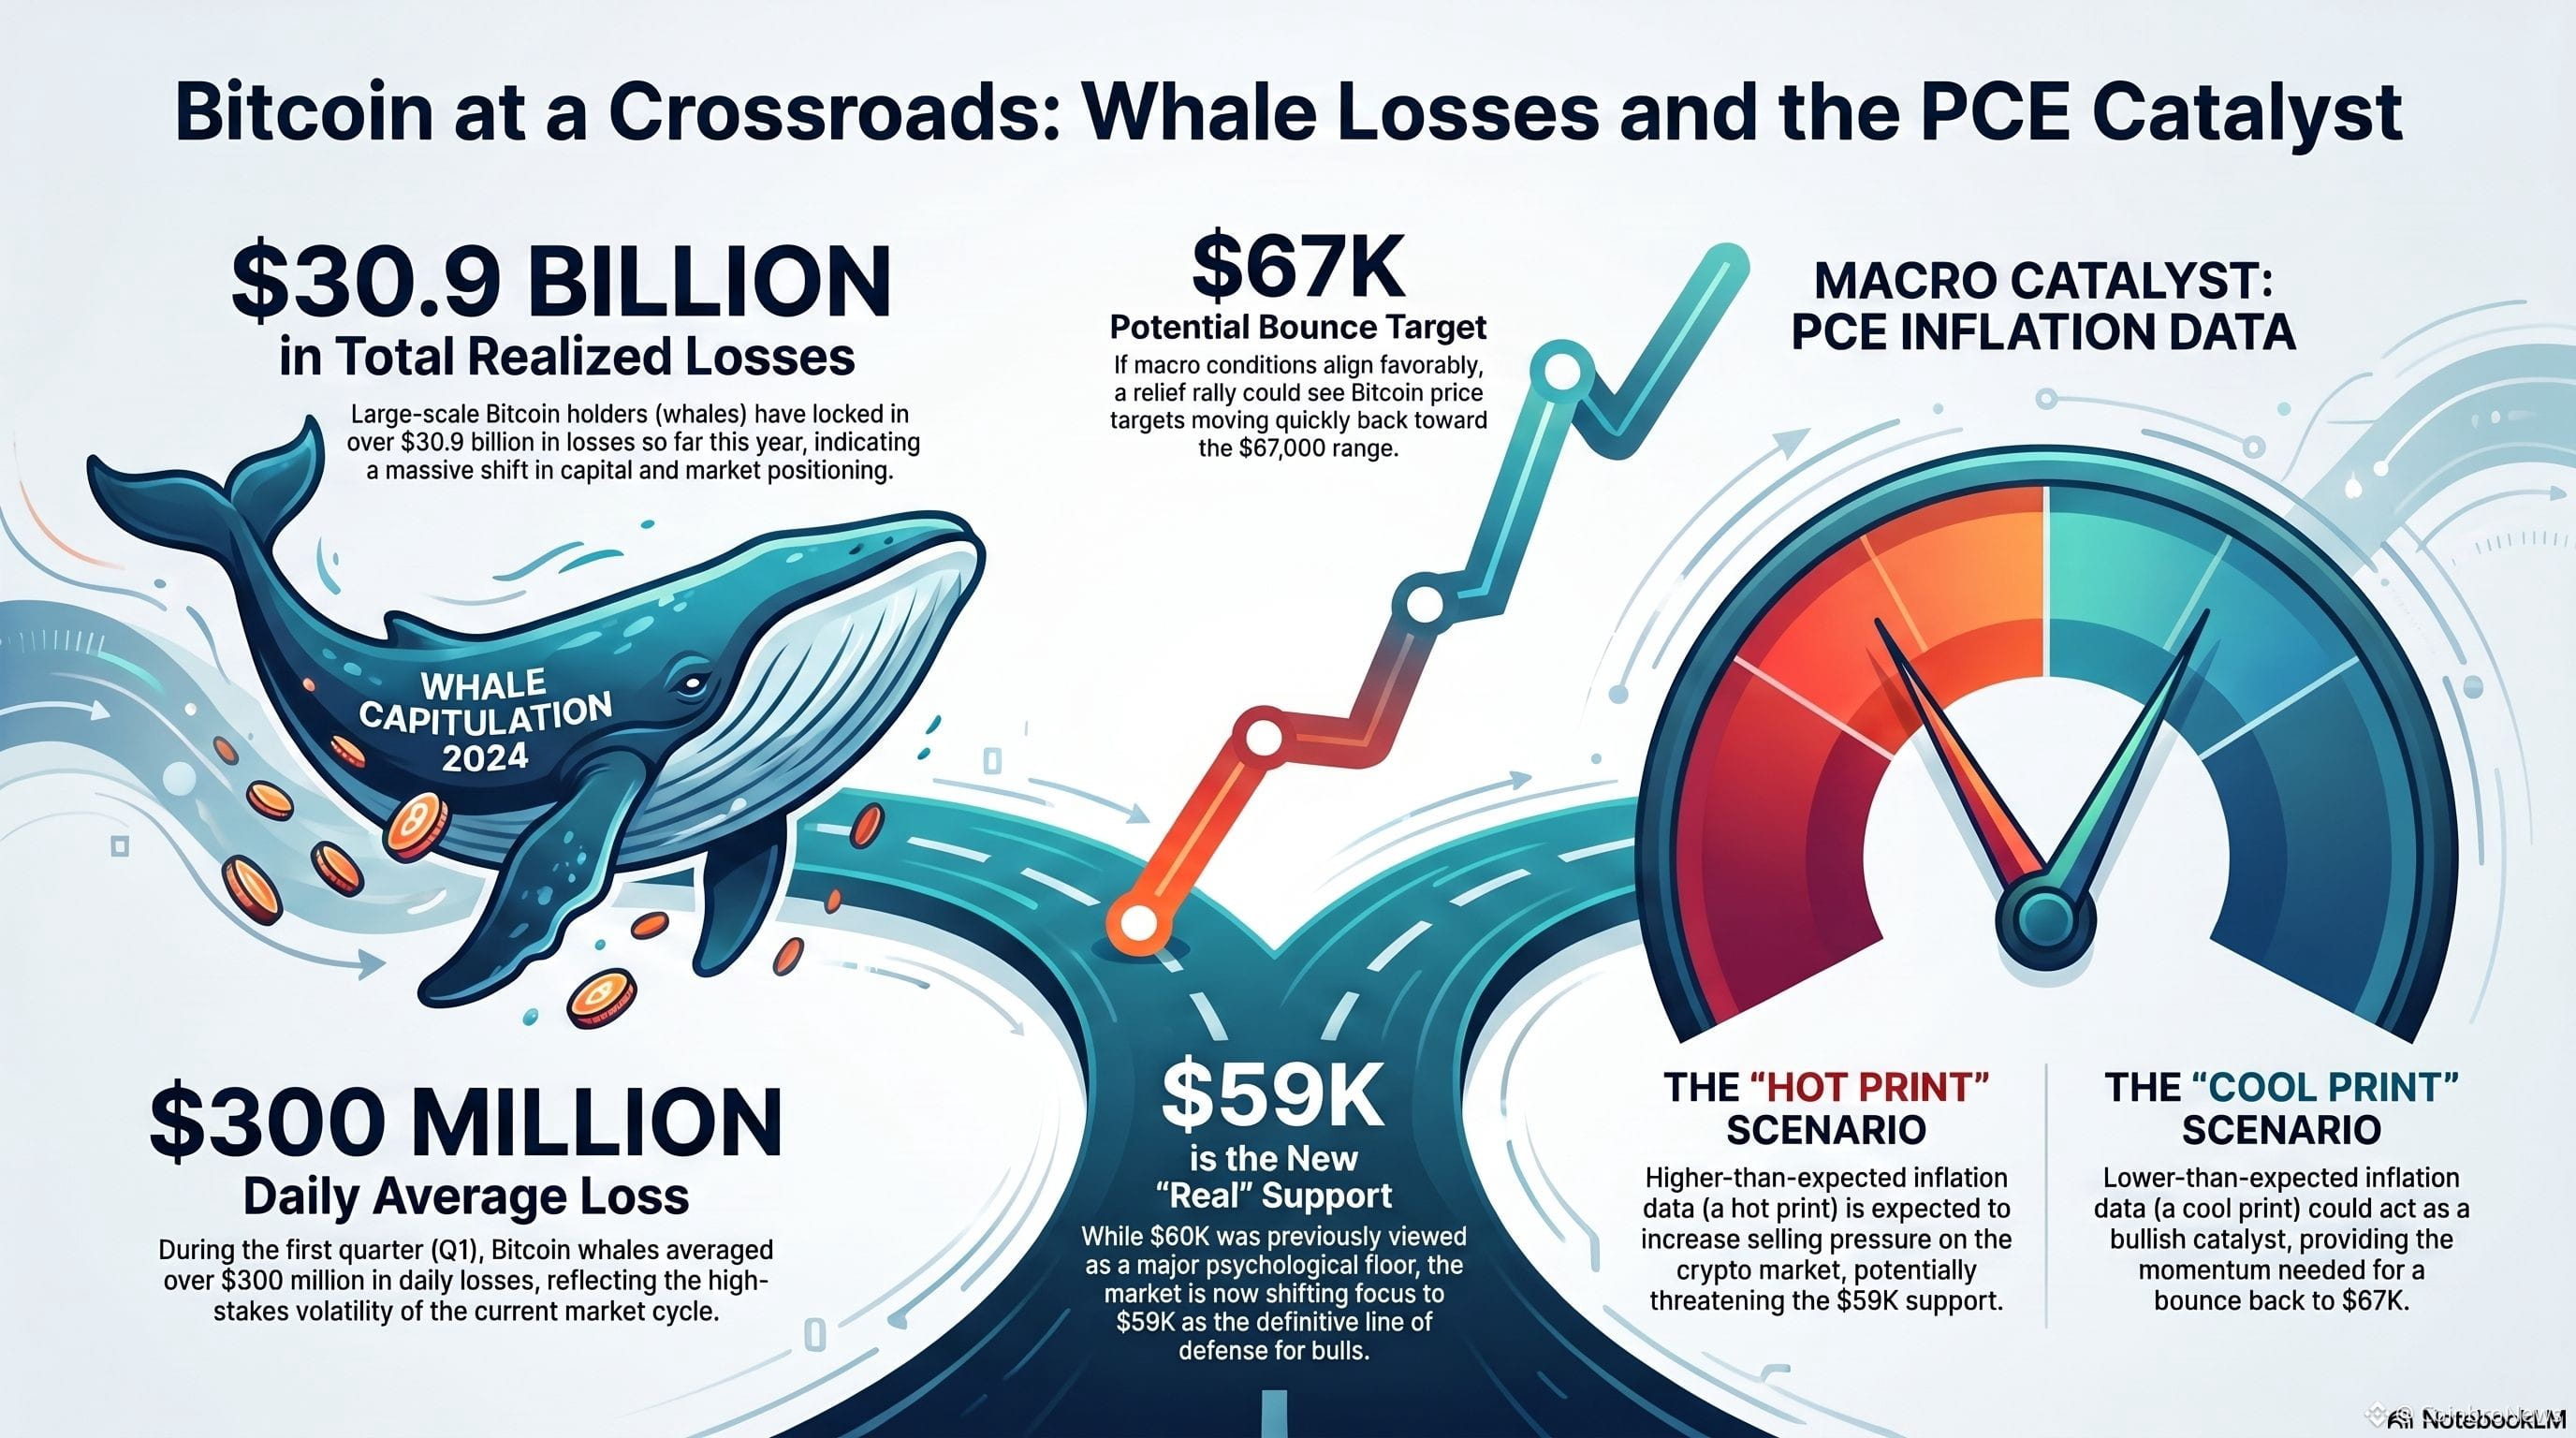
🚨🔥BITCOIN HOLDING $59K — BUT THURSDAY'S PCE DATA COULD BREAK EVERYTHING.
Bitcoin has bounced from $59,000 multiple times in June. That level has replaced $60K as the real support. Wednesday's dip touched $59K again before recovering to $61K — the same pattern that triggered a rally to $67K on June 5.
→ $59K is now the line. Below it, sentiment flips fast.
→ Thursday PCE data (the Fed's preferred inflation gauge) prints tonight — core PCE expected at 3.3–3.4%, highest since October 2023
→ Hot print = dollar strengthens, crypto gets pressured. Cool print = $59K bounce case gets stronger
One data point. Two completely different outcomes for Bitcoin tonight.
Are you buying the $59K support or waiting for PCE first?
"The support is holding. But one number tonight could change everything." — CoinbroNews Analysis
#Bitcoin #BTC #PCE #FederalReserve #CryptoTrading #MacroCrypto
CoinbroNews | coinbronews.com
🚨🔥BITCOIN HOLDING $59K — BUT THURSDAY'S PCE DATA COULD BREAK EVERYTHING.
Bitcoin has bounced from $59,000 multiple times in June. That level has replaced $60K as the real support. Wednesday's dip touched $59K again before recovering to $61K — the same pattern that triggered a rally to $67K on June 5.
→ $59K is now the line. Below it, sentiment flips fast.
→ Thursday PCE data (the Fed's preferred inflation gauge) prints tonight — core PCE expected at 3.3–3.4%, highest since October 2023
→ Hot print = dollar strengthens, crypto gets pressured. Cool print = $59K bounce case gets stronger
One data point. Two completely different outcomes for Bitcoin tonight.
Are you buying the $59K support or waiting for PCE first?
"The support is holding. But one number tonight could change everything." — CoinbroNews Analysis
#Bitcoin #BTC #PCE #FederalReserve #CryptoTrading #MacroCrypto
CoinbroNews | coinbronews.com
Bitcoin has bounced from $59,000 multiple times in June. That level has replaced $60K as the real support. Wednesday's dip touched $59K again before recovering to $61K — the same pattern that triggered a rally to $67K on June 5.
→ $59K is now the line. Below it, sentiment flips fast.
→ Thursday PCE data (the Fed's preferred inflation gauge) prints tonight — core PCE expected at 3.3–3.4%, highest since October 2023
→ Hot print = dollar strengthens, crypto gets pressured. Cool print = $59K bounce case gets stronger
One data point. Two completely different outcomes for Bitcoin tonight.
Are you buying the $59K support or waiting for PCE first?
"The support is holding. But one number tonight could change everything." — CoinbroNews Analysis
#Bitcoin #BTC #PCE #FederalReserve #CryptoTrading #MacroCrypto
CoinbroNews | coinbronews.com
184

·
--
Bullish
🌍 THIS WEEK WILL MOVE CRYPTO HARD — Here's exactly what to watch
📅 MACRO CALENDAR | Week of June 7, 2026
Most crypto traders watch charts.
The smart ones watch THIS first.
━━━━━━━━━━━━━━━━━━
WHY THIS WEEK IS DIFFERENT:
This week has:
→ 6 major US economic data releases
→ 7 Federal Reserve speaker events
→ US–Iran peace talks (no resolution yet)
→ BTC already in extreme fear zone
Any single one of these can send BTC ±10% within minutes.
━━━━━━━━━━━━━━━━━━
THE MOST IMPORTANT EVENT — JOBS REPORT:
Here's how it works (simple version):
📊 WEAK JOBS
→ Economy slowing → Fed more likely to cut rates
→ Rate cuts = cheaper money = investors buy risk assets
→ BTC + altcoins PUMP
📊 STRONG JOBS
→ Economy hot → Fed keeps rates high
→ High rates = expensive money = investors avoid risk
→ BTC + altcoins DUMP
That's it. That's the whole macro game right now.
━━━━━━━━━━━━━━━━━━
THE FED SPEAKER RISK:
7 Fed officials speaking this week. Each one can:
→ Hint at rate path changes
→ React to live economic data
→ Send completely mixed signals
The danger: One hawkish Fed comment right after soft jobs data can cancel out what looks like a bullish setup. This is the hidden volatility that wipes out leveraged positions.
BTC CURRENT REALITY:
→ 92% correlated with S&P 500 — crypto is a risk asset now, full stop
→ Fear & Greed: 11 (Extreme Fear)
→ $60,000 is the line that must hold this week
HOW TO TRADE THIS WEEK:
→ Reduce leverage before data releases
→ Watch BTC reaction within 15 mins of data drop
→ Don't chase moves — wait for confirmation candle
→ Keep 20-30% in stablecoins as dry powder
Knowledge is the edge most retail traders don't have.
Save this post. Share it with someone who needs it.
Follow for daily market updates 🔔
⚠️ NFA — Always DYOR
#CryptoMarket #bitcoin #MacroCrypto #FederalReserve #JobsReport
🌍 THIS WEEK WILL MOVE CRYPTO HARD — Here's exactly what to watch
📅 MACRO CALENDAR | Week of June 7, 2026
Most crypto traders watch charts.
The smart ones watch THIS first.
━━━━━━━━━━━━━━━━━━
WHY THIS WEEK IS DIFFERENT:
This week has:
→ 6 major US economic data releases
→ 7 Federal Reserve speaker events
→ US–Iran peace talks (no resolution yet)
→ BTC already in extreme fear zone
Any single one of these can send BTC ±10% within minutes.
━━━━━━━━━━━━━━━━━━
THE MOST IMPORTANT EVENT — JOBS REPORT:
Here's how it works (simple version):
📊 WEAK JOBS
→ Economy slowing → Fed more likely to cut rates
→ Rate cuts = cheaper money = investors buy risk assets
→ BTC + altcoins PUMP
📊 STRONG JOBS
→ Economy hot → Fed keeps rates high
→ High rates = expensive money = investors avoid risk
→ BTC + altcoins DUMP
That's it. That's the whole macro game right now.
━━━━━━━━━━━━━━━━━━
THE FED SPEAKER RISK:
7 Fed officials speaking this week. Each one can:
→ Hint at rate path changes
→ React to live economic data
→ Send completely mixed signals
The danger: One hawkish Fed comment right after soft jobs data can cancel out what looks like a bullish setup. This is the hidden volatility that wipes out leveraged positions.
BTC CURRENT REALITY:
→ 92% correlated with S&P 500 — crypto is a risk asset now, full stop
→ Fear & Greed: 11 (Extreme Fear)
→ $60,000 is the line that must hold this week
HOW TO TRADE THIS WEEK:
→ Reduce leverage before data releases
→ Watch BTC reaction within 15 mins of data drop
→ Don't chase moves — wait for confirmation candle
→ Keep 20-30% in stablecoins as dry powder
Knowledge is the edge most retail traders don't have.
Save this post. Share it with someone who needs it.
Follow for daily market updates 🔔
⚠️ NFA — Always DYOR
#CryptoMarket #bitcoin #MacroCrypto #FederalReserve #JobsReport
📅 MACRO CALENDAR | Week of June 7, 2026
Most crypto traders watch charts.
The smart ones watch THIS first.
━━━━━━━━━━━━━━━━━━
WHY THIS WEEK IS DIFFERENT:
This week has:
→ 6 major US economic data releases
→ 7 Federal Reserve speaker events
→ US–Iran peace talks (no resolution yet)
→ BTC already in extreme fear zone
Any single one of these can send BTC ±10% within minutes.
━━━━━━━━━━━━━━━━━━
THE MOST IMPORTANT EVENT — JOBS REPORT:
Here's how it works (simple version):
📊 WEAK JOBS
→ Economy slowing → Fed more likely to cut rates
→ Rate cuts = cheaper money = investors buy risk assets
→ BTC + altcoins PUMP
📊 STRONG JOBS
→ Economy hot → Fed keeps rates high
→ High rates = expensive money = investors avoid risk
→ BTC + altcoins DUMP
That's it. That's the whole macro game right now.
━━━━━━━━━━━━━━━━━━
THE FED SPEAKER RISK:
7 Fed officials speaking this week. Each one can:
→ Hint at rate path changes
→ React to live economic data
→ Send completely mixed signals
The danger: One hawkish Fed comment right after soft jobs data can cancel out what looks like a bullish setup. This is the hidden volatility that wipes out leveraged positions.
BTC CURRENT REALITY:
→ 92% correlated with S&P 500 — crypto is a risk asset now, full stop
→ Fear & Greed: 11 (Extreme Fear)
→ $60,000 is the line that must hold this week
HOW TO TRADE THIS WEEK:
→ Reduce leverage before data releases
→ Watch BTC reaction within 15 mins of data drop
→ Don't chase moves — wait for confirmation candle
→ Keep 20-30% in stablecoins as dry powder
Knowledge is the edge most retail traders don't have.
Save this post. Share it with someone who needs it.
Follow for daily market updates 🔔
⚠️ NFA — Always DYOR
#CryptoMarket #bitcoin #MacroCrypto #FederalReserve #JobsReport
94

·
--
CPI Day / BTC
📉 CPI day. $63,500 is the line in the sand for Bitcoin.
BTC is sitting near $64,000, coiled and waiting on today's US CPI print. This is the kind of day where the next few hours matter more than the last few weeks.
Here's the setup:
🔹 Bullish trigger: Reclaim and hold above $64,250
🔹 Bearish trigger: Sustained break below $63,500
🔹 The catalyst: A softer-than-expected CPI could cool rate-hike fears and give risk assets room to breathe. A hot print does the opposite
Why it matters beyond BTC: crypto doesn't move in a vacuum. Rate expectations move the dollar, the dollar moves liquidity, and liquidity moves everything from BTC to your altcoin bags.
Zoom out: BTC's still roughly flat on the month despite the daily noise. Today's print will set tone, not necessarily trend.
Not financial advice. Just marking the levels before the number drops.
Where do you think BTC closes today — above or below $64k? 👇
#bitcoin #cpi #MacroCrypto #BİNANCESQUARE
{future}(BTCUSDT)
CPI Day / BTC
📉 CPI day. $63,500 is the line in the sand for Bitcoin.
BTC is sitting near $64,000, coiled and waiting on today's US CPI print. This is the kind of day where the next few hours matter more than the last few weeks.
Here's the setup:
🔹 Bullish trigger: Reclaim and hold above $64,250
🔹 Bearish trigger: Sustained break below $63,500
🔹 The catalyst: A softer-than-expected CPI could cool rate-hike fears and give risk assets room to breathe. A hot print does the opposite
Why it matters beyond BTC: crypto doesn't move in a vacuum. Rate expectations move the dollar, the dollar moves liquidity, and liquidity moves everything from BTC to your altcoin bags.
Zoom out: BTC's still roughly flat on the month despite the daily noise. Today's print will set tone, not necessarily trend.
Not financial advice. Just marking the levels before the number drops.
Where do you think BTC closes today — above or below $64k? 👇
#bitcoin #cpi #MacroCrypto #BİNANCESQUARE
📉 CPI day. $63,500 is the line in the sand for Bitcoin.
BTC is sitting near $64,000, coiled and waiting on today's US CPI print. This is the kind of day where the next few hours matter more than the last few weeks.
Here's the setup:
🔹 Bullish trigger: Reclaim and hold above $64,250
🔹 Bearish trigger: Sustained break below $63,500
🔹 The catalyst: A softer-than-expected CPI could cool rate-hike fears and give risk assets room to breathe. A hot print does the opposite
Why it matters beyond BTC: crypto doesn't move in a vacuum. Rate expectations move the dollar, the dollar moves liquidity, and liquidity moves everything from BTC to your altcoin bags.
Zoom out: BTC's still roughly flat on the month despite the daily noise. Today's print will set tone, not necessarily trend.
Not financial advice. Just marking the levels before the number drops.
Where do you think BTC closes today — above or below $64k? 👇
#bitcoin #cpi #MacroCrypto #BİNANCESQUARE
118
Log in to explore more content
Join global crypto users on Binance Square
⚡️ Get latest and useful information about crypto.
💬 Trusted by the world’s largest crypto exchange.
👍 Discover real insights from verified creators.
Email / Phone number
Trending Topics
1
#NvidiaLoses$2.7TrillionInMonthAndAHalf
21,495 views
141 Discussing
2
#CanBTCReboundAfterFallingBelow60K?
787,243 views
3,033 Discussing
3
#GlobalStocksFaceLongestLosingStreakSince2023
287,946 views
2,025 Discussing
4
#BlackRockIBITPostsRecord$541MSingleDayOutflow
34,801 views
106 Discussing
5
#AnthropicPlungesTowardIPOPriceonDay2
148,109 views
1,232 Discussing
6
#TwentyOneCapitalAdds172.25BTC
67,960 views
678 Discussing
7
#HKBillWouldExcludeTokenizedDepositsFromVirtualAssets
9,019 views
50 Discussing
8
#BNBDropsBelow540USDTWith8.46%DailyDecline
80,268 views
659 Discussing
9
#HKBillProposesHK$100KFineForUnauthorizedCryptoTitles
2,696 views
22 Discussing
10
#BitMineFaces$10.1BUnrealizedETHLoss
5,658 views
28 Discussing