
#natgas
natgas
50,597 views
974 Discussing
Hot
Latest

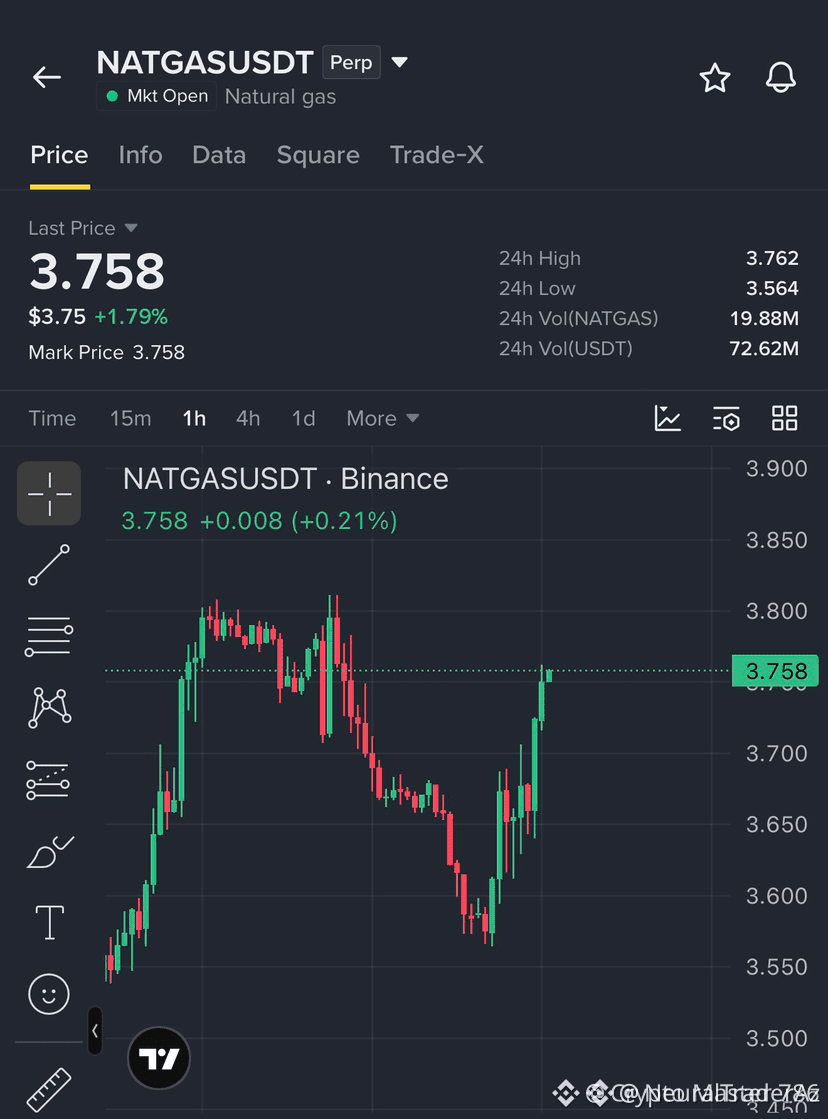
$NATGAS IS FORMING A PRISTINE RECOVERY STRUCTURE AWAITING CONFIRMATION 🚨 📈
Entry: 3.762 ⚡
Target: 3.810 🎯
Stop Loss: 3.738 🛑
Price action is carving out a clean structural reversal after sweeping local lows. Smart money is quietly absorbing supply around this key inflection point, waiting for the hourly candle confirmation to flip the order block. 📊
We need that decisive 1H close above the pivot to invalidate seller momentum and trigger institutional participation. Volume profile suggests minimal resistance once the retest holds firm and continuation kicks in. 💡
Are you waiting for the confirmed retest or scaling in early? 👇
⚠️ Not financial advice. Always manage your risk. 🛡️
🏷️ #NATGAS #LongSetup #MarketStructure #Commodities
🔥 💎
$NATGAS IS FORMING A PRISTINE RECOVERY STRUCTURE AWAITING CONFIRMATION 🚨 📈
Entry: 3.762 ⚡
Target: 3.810 🎯
Stop Loss: 3.738 🛑
Price action is carving out a clean structural reversal after sweeping local lows. Smart money is quietly absorbing supply around this key inflection point, waiting for the hourly candle confirmation to flip the order block. 📊
We need that decisive 1H close above the pivot to invalidate seller momentum and trigger institutional participation. Volume profile suggests minimal resistance once the retest holds firm and continuation kicks in. 💡
Are you waiting for the confirmed retest or scaling in early? 👇
⚠️ Not financial advice. Always manage your risk. 🛡️
🏷️ #NATGAS #LongSetup #MarketStructure #Commodities
🔥 💎
Entry: 3.762 ⚡
Target: 3.810 🎯
Stop Loss: 3.738 🛑
Price action is carving out a clean structural reversal after sweeping local lows. Smart money is quietly absorbing supply around this key inflection point, waiting for the hourly candle confirmation to flip the order block. 📊
We need that decisive 1H close above the pivot to invalidate seller momentum and trigger institutional participation. Volume profile suggests minimal resistance once the retest holds firm and continuation kicks in. 💡
Are you waiting for the confirmed retest or scaling in early? 👇
⚠️ Not financial advice. Always manage your risk. 🛡️
🏷️ #NATGAS #LongSetup #MarketStructure #Commodities
🔥 💎
1

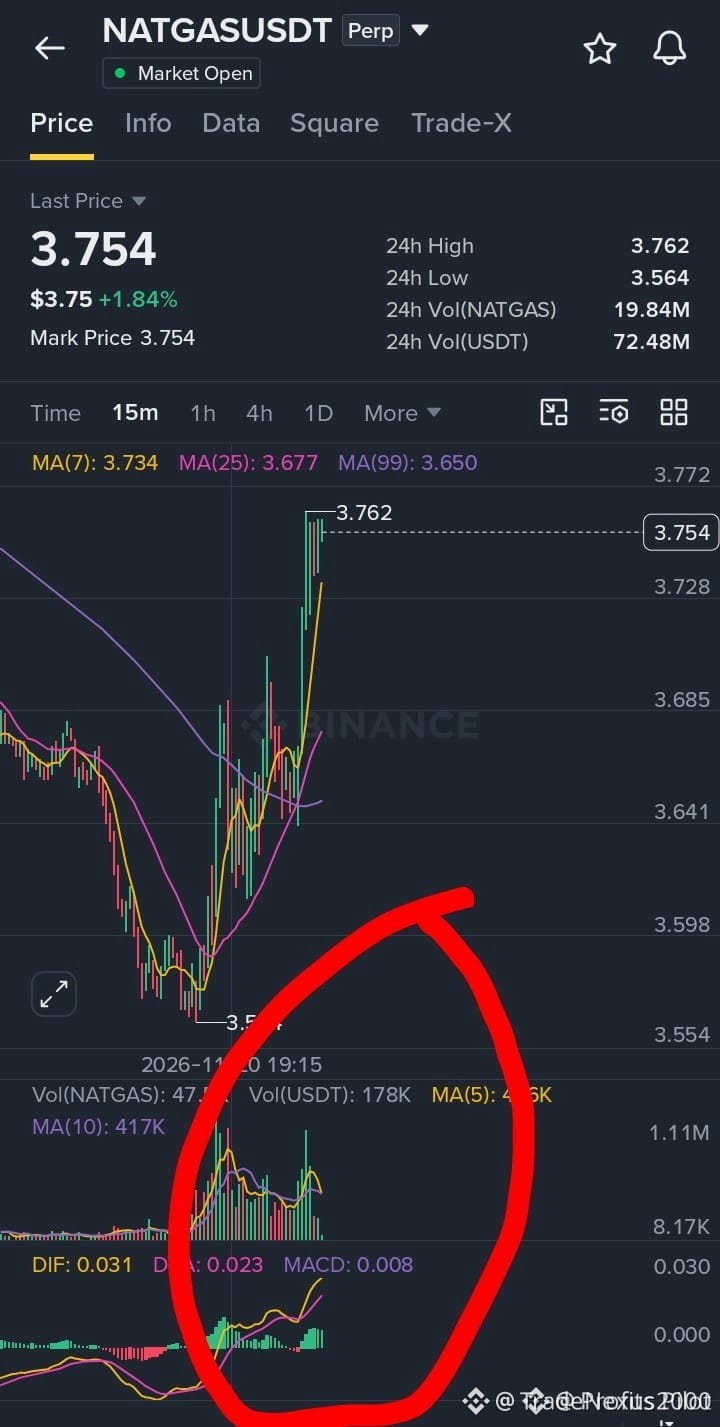
🦈 $NATGAS NEARING A CRITICAL LIQUIDITY RECLAIM AS SMART MONEY TESTS KEY INEFFICIENCY! ⚡
Entry: $3.762 ⚡
Target: $3.810 🚀
Stop Loss: $3.738 🛑
Price action is carving out a clean structural base right beneath the $3.762 resistance shelf, indicating aggressive institutional absorption of trapped supply. 📊
A confirmed one-hour candle closure above this pivot followed by a measured retest will validate buyer dominance before expansion toward higher liquidity pools. 💡 Will smart money successfully flip this zone into immediate support, or are we heading for a deeper sweep first? 💬
⚠️ Not financial advice. Always manage your risk. 🛡️
🏷️ #NATGAS #LongSetup #Commodities #MarketStructure #Trading
🦈 ⚖️
🦈 $NATGAS NEARING A CRITICAL LIQUIDITY RECLAIM AS SMART MONEY TESTS KEY INEFFICIENCY! ⚡
Entry: $3.762 ⚡
Target: $3.810 🚀
Stop Loss: $3.738 🛑
Price action is carving out a clean structural base right beneath the $3.762 resistance shelf, indicating aggressive institutional absorption of trapped supply. 📊
A confirmed one-hour candle closure above this pivot followed by a measured retest will validate buyer dominance before expansion toward higher liquidity pools. 💡 Will smart money successfully flip this zone into immediate support, or are we heading for a deeper sweep first? 💬
⚠️ Not financial advice. Always manage your risk. 🛡️
🏷️ #NATGAS #LongSetup #Commodities #MarketStructure #Trading
🦈 ⚖️
Entry: $3.762 ⚡
Target: $3.810 🚀
Stop Loss: $3.738 🛑
Price action is carving out a clean structural base right beneath the $3.762 resistance shelf, indicating aggressive institutional absorption of trapped supply. 📊
A confirmed one-hour candle closure above this pivot followed by a measured retest will validate buyer dominance before expansion toward higher liquidity pools. 💡 Will smart money successfully flip this zone into immediate support, or are we heading for a deeper sweep first? 💬
⚠️ Not financial advice. Always manage your risk. 🛡️
🏷️ #NATGAS #LongSetup #Commodities #MarketStructure #Trading
🦈 ⚖️
9

·
--
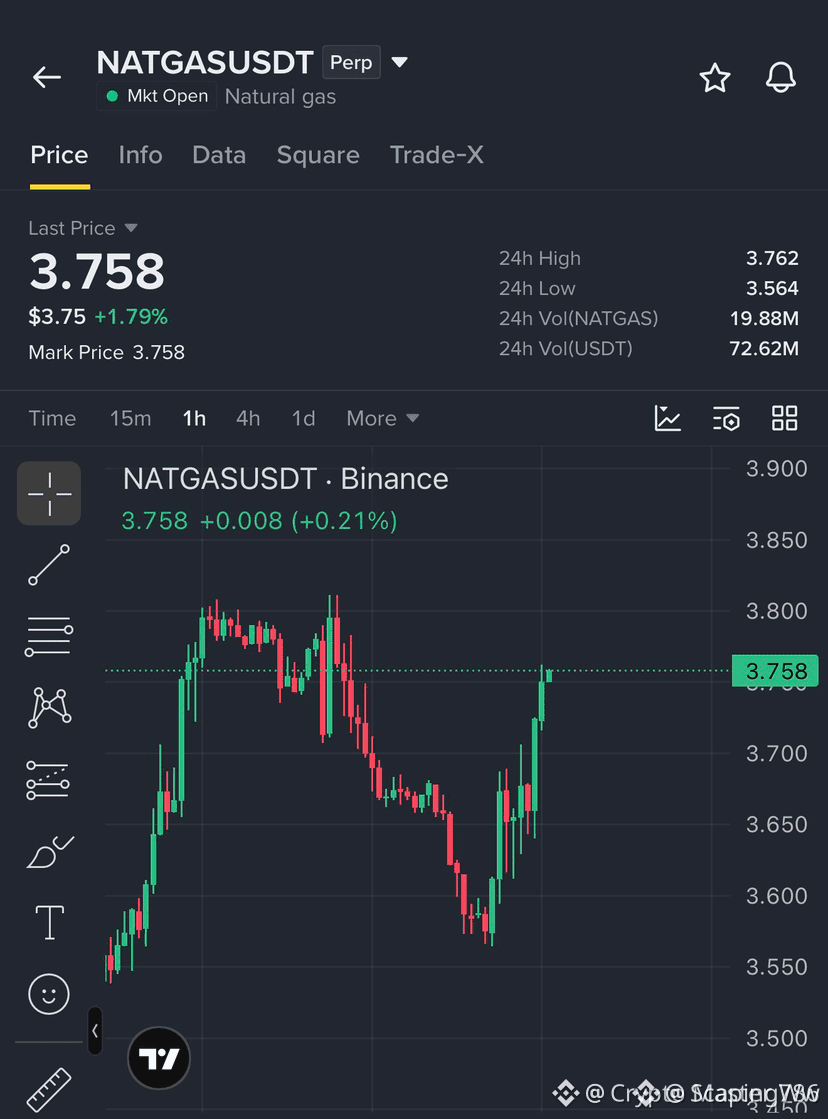
🚨 $NATGAS COMMODITY BULLS EYE A CLEAN BREAKOUT AS MOMENTUM BUILDS 📈
Entry: 3.762 ⚡
Target: 3.810 🚀
Stop Loss: 3.738 ⚠️
Sellers are steadily losing their grip as energy markets flash early signs of an aggressive trend reversal. ⚡ We are closely tracking a high-probability setup waiting for a confirmed 1H close above local resistance before letting capital flow into the momentum wave. 📊
Patience remains our greatest edge here as smart money tests the structural boundary. 💡 Are you waiting for the clean retest confirmation or jumping early on the initial push? 👇
⚠️ Not financial advice. Always manage your risk. 🛡️
🏷️ #NATGAS #LongSetup #CommodityTrading #Breakout
🔥 💎
🚨 $NATGAS COMMODITY BULLS EYE A CLEAN BREAKOUT AS MOMENTUM BUILDS 📈
Entry: 3.762 ⚡
Target: 3.810 🚀
Stop Loss: 3.738 ⚠️
Sellers are steadily losing their grip as energy markets flash early signs of an aggressive trend reversal. ⚡ We are closely tracking a high-probability setup waiting for a confirmed 1H close above local resistance before letting capital flow into the momentum wave. 📊
Patience remains our greatest edge here as smart money tests the structural boundary. 💡 Are you waiting for the clean retest confirmation or jumping early on the initial push? 👇
⚠️ Not financial advice. Always manage your risk. 🛡️
🏷️ #NATGAS #LongSetup #CommodityTrading #Breakout
🔥 💎
Entry: 3.762 ⚡
Target: 3.810 🚀
Stop Loss: 3.738 ⚠️
Sellers are steadily losing their grip as energy markets flash early signs of an aggressive trend reversal. ⚡ We are closely tracking a high-probability setup waiting for a confirmed 1H close above local resistance before letting capital flow into the momentum wave. 📊
Patience remains our greatest edge here as smart money tests the structural boundary. 💡 Are you waiting for the clean retest confirmation or jumping early on the initial push? 👇
⚠️ Not financial advice. Always manage your risk. 🛡️
🏷️ #NATGAS #LongSetup #CommodityTrading #Breakout
🔥 💎
2

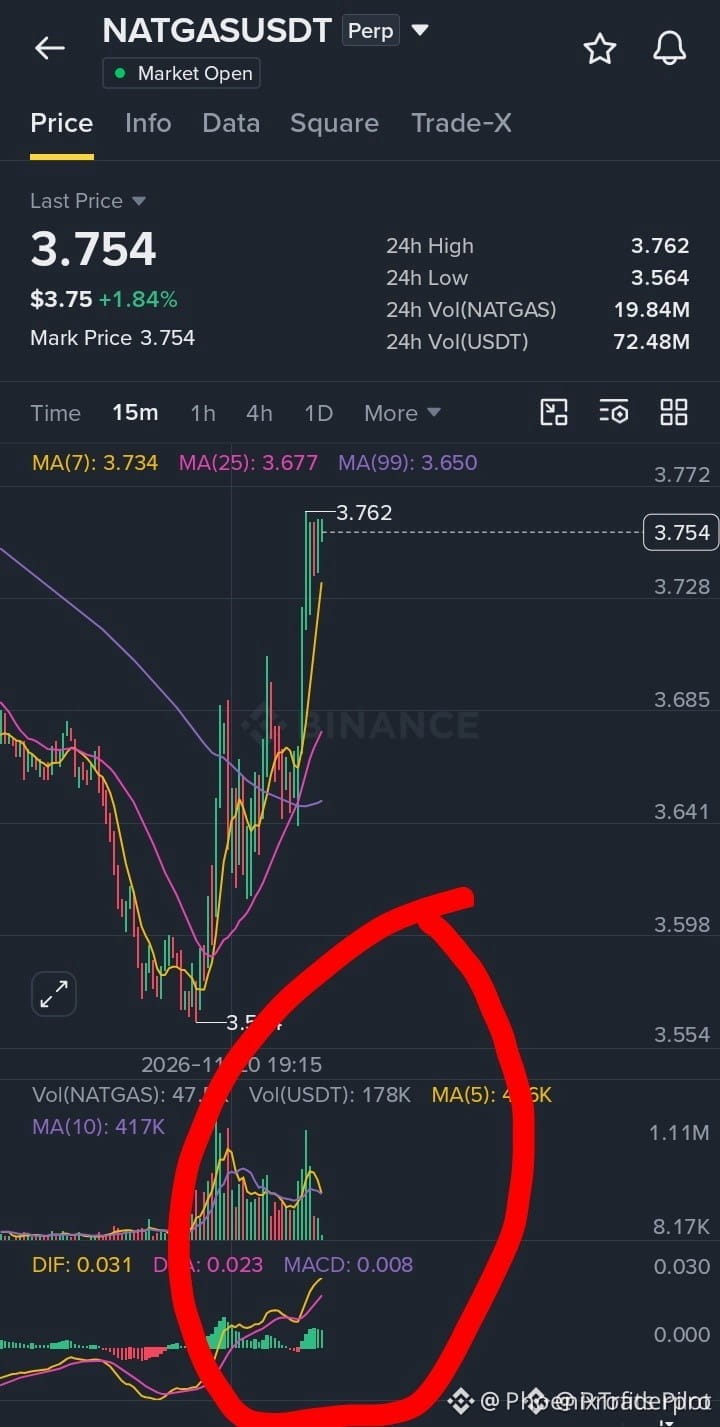
🚨 $NATGAS BULLS ARE TIGHTENING THE SCREWS FOR A CLEAN BREAKOUT SETUP! ⚡
Entry: $3.762 ⚡
Target: $3.810 🚀
Stop Loss: $3.738 ⚠️
Sellers tried to slam the lid down hard, but order books are showing aggressive institutional bids stepping in right at the local inflection point. 📊
Momentum is shifting back toward the buy side as market participants defend key structural floors, requiring a confirmed hourly close above the pivot for continuation. ⚡
💬 Are you positioning for this retest or waiting for a deeper flush first? 👇
⚠️ Not financial advice. Always manage your risk. 🛡️
🏷️ #NATGAS #LongSetup #Momentum #Commodities #Breakout
🔥 💎
🚨 $NATGAS BULLS ARE TIGHTENING THE SCREWS FOR A CLEAN BREAKOUT SETUP! ⚡
Entry: $3.762 ⚡
Target: $3.810 🚀
Stop Loss: $3.738 ⚠️
Sellers tried to slam the lid down hard, but order books are showing aggressive institutional bids stepping in right at the local inflection point. 📊
Momentum is shifting back toward the buy side as market participants defend key structural floors, requiring a confirmed hourly close above the pivot for continuation. ⚡
💬 Are you positioning for this retest or waiting for a deeper flush first? 👇
⚠️ Not financial advice. Always manage your risk. 🛡️
🏷️ #NATGAS #LongSetup #Momentum #Commodities #Breakout
🔥 💎
Entry: $3.762 ⚡
Target: $3.810 🚀
Stop Loss: $3.738 ⚠️
Sellers tried to slam the lid down hard, but order books are showing aggressive institutional bids stepping in right at the local inflection point. 📊
Momentum is shifting back toward the buy side as market participants defend key structural floors, requiring a confirmed hourly close above the pivot for continuation. ⚡
💬 Are you positioning for this retest or waiting for a deeper flush first? 👇
⚠️ Not financial advice. Always manage your risk. 🛡️
🏷️ #NATGAS #LongSetup #Momentum #Commodities #Breakout
🔥 💎
7

·
--
{future}(NATGASUSDT)
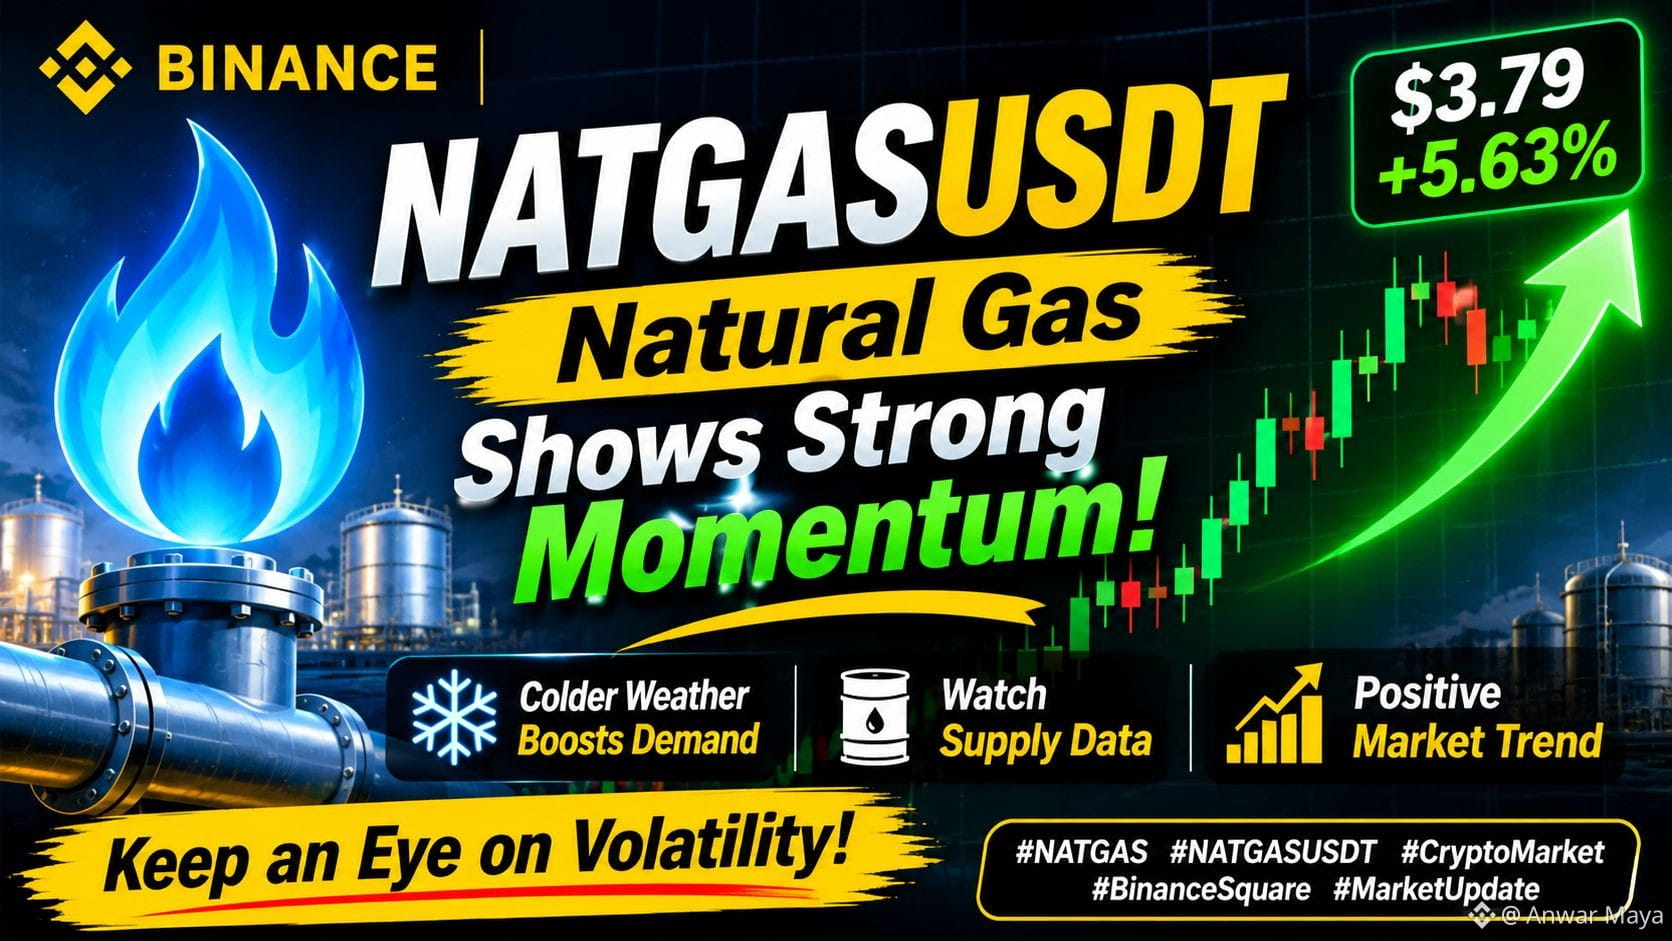
🚨 NATGASUSDT – Natural Gas Shows Strong Momentum!
Natural Gas is attracting market attention as prices move higher.
📈 Recent market data shows:
- Price: Around $3.79
- 24H Change: +5.63%
- Market sentiment: Positive momentum
🌡️ Colder weather forecasts are increasing expectations for heating demand, while storage levels remain an important factor to watch.
Key takeaway: Keep an eye on market volatility, weather updates, and upcoming inventory data.
#NATGAS #NATGASUSDT #CryptoMarket #MarketUpdate #BinanceSquare
🚨 NATGASUSDT – Natural Gas Shows Strong Momentum!
Natural Gas is attracting market attention as prices move higher.
📈 Recent market data shows:
- Price: Around $3.79
- 24H Change: +5.63%
- Market sentiment: Positive momentum
🌡️ Colder weather forecasts are increasing expectations for heating demand, while storage levels remain an important factor to watch.
Key takeaway: Keep an eye on market volatility, weather updates, and upcoming inventory data.
#NATGAS #NATGASUSDT #CryptoMarket #MarketUpdate #BinanceSquare
Natural Gas is attracting market attention as prices move higher.
📈 Recent market data shows:
- Price: Around $3.79
- 24H Change: +5.63%
- Market sentiment: Positive momentum
🌡️ Colder weather forecasts are increasing expectations for heating demand, while storage levels remain an important factor to watch.
Key takeaway: Keep an eye on market volatility, weather updates, and upcoming inventory data.
#NATGAS #NATGASUSDT #CryptoMarket #MarketUpdate #BinanceSquare
373

·
--
The energy markets are flashing a clear warning signal, and $NATGAS is positioning for a move that demands your attention. I’ve isolated the key zones for this bearish play based on the current order flow.
⚡ $NATGAS — SHORT SETUP
📍 Entry: 3.8112 – 3.834
🎯 TP1: 3.7656
🎯 TP2: 3.7353
🎯 TP3: 3.6897
🛑 Stop Loss: 3.8567
Trade here 👇
📌 Trade management rules: see pinned post.
How are you positioning for this volatility? Drop your thoughts below and hit follow for the next breakdown.
#WriteToEarn #NATGAS #CryptoTrading #BinanceSquare #Crypto
The energy markets are flashing a clear warning signal, and $NATGAS is positioning for a move that demands your attention. I’ve isolated the key zones for this bearish play based on the current order flow.
⚡ $NATGAS — SHORT SETUP
📍 Entry: 3.8112 – 3.834
🎯 TP1: 3.7656
🎯 TP2: 3.7353
🎯 TP3: 3.6897
🛑 Stop Loss: 3.8567
Trade here 👇
📌 Trade management rules: see pinned post.
How are you positioning for this volatility? Drop your thoughts below and hit follow for the next breakdown.
#WriteToEarn #NATGAS #CryptoTrading #BinanceSquare #Crypto
⚡ $NATGAS — SHORT SETUP
📍 Entry: 3.8112 – 3.834
🎯 TP1: 3.7656
🎯 TP2: 3.7353
🎯 TP3: 3.6897
🛑 Stop Loss: 3.8567
Trade here 👇
📌 Trade management rules: see pinned post.
How are you positioning for this volatility? Drop your thoughts below and hit follow for the next breakdown.
#WriteToEarn #NATGAS #CryptoTrading #BinanceSquare #Crypto
1
26

·
--
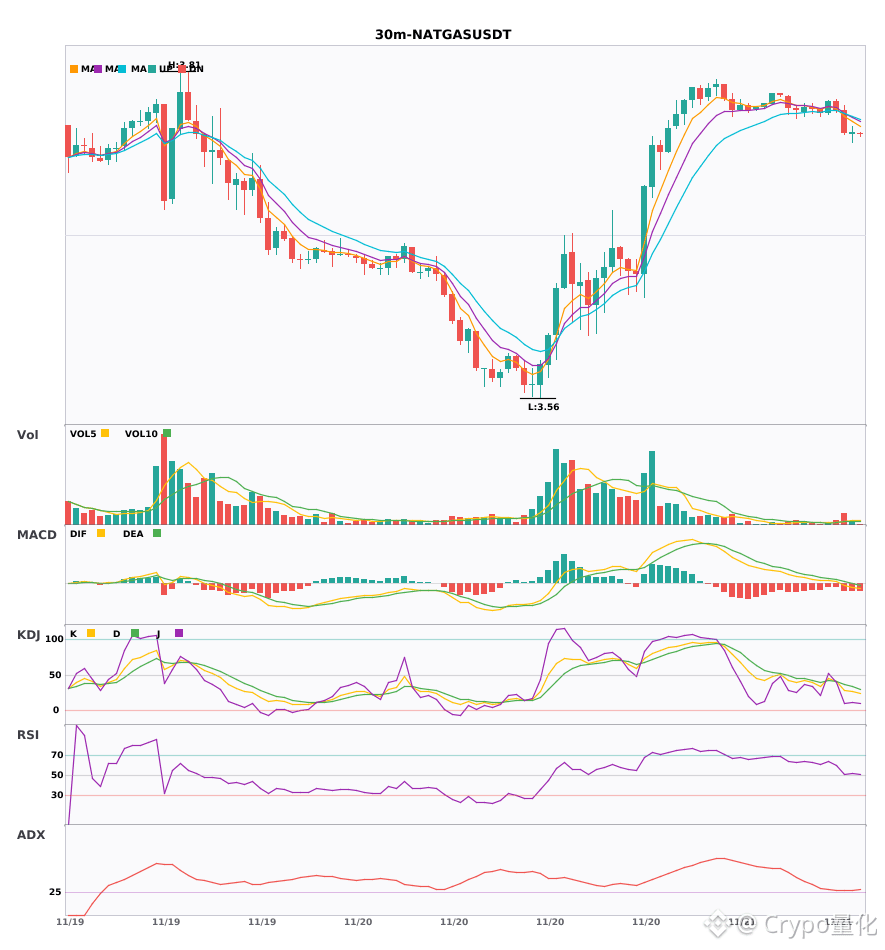
$NATGAS 30-minute moving averages are weakening; watch out for risk 🔥
════════════════════
🟢 $NATGAS 30-minute bearish signal
⚠️Technical analysis: The ADX trend is just emerging; consider entering. After the MACD death cross, the green bars are growing, indicating strengthening momentum. The moving averages have just formed a bearish alignment. On the KDJ, K has crossed below D but is not yet oversold. Trading volume surged to 3.3 times its usual level.
════════════════════
🔔 Follow to get first-hand alerts on market movements 🔔
#技术分析 #NATGAS
📌 When trading, check whether the candlestick pattern confirms the setup
$NATGAS 30-minute moving averages are weakening; watch out for risk 🔥
════════════════════
🟢 $NATGAS 30-minute bearish signal
⚠️Technical analysis: The ADX trend is just emerging; consider entering. After the MACD death cross, the green bars are growing, indicating strengthening momentum. The moving averages have just formed a bearish alignment. On the KDJ, K has crossed below D but is not yet oversold. Trading volume surged to 3.3 times its usual level.
════════════════════
🔔 Follow to get first-hand alerts on market movements 🔔
#技术分析 #NATGAS
📌 When trading, check whether the candlestick pattern confirms the setup
════════════════════
🟢 $NATGAS 30-minute bearish signal
⚠️Technical analysis: The ADX trend is just emerging; consider entering. After the MACD death cross, the green bars are growing, indicating strengthening momentum. The moving averages have just formed a bearish alignment. On the KDJ, K has crossed below D but is not yet oversold. Trading volume surged to 3.3 times its usual level.
════════════════════
🔔 Follow to get first-hand alerts on market movements 🔔
#技术分析 #NATGAS
📌 When trading, check whether the candlestick pattern confirms the setup
13

·
--
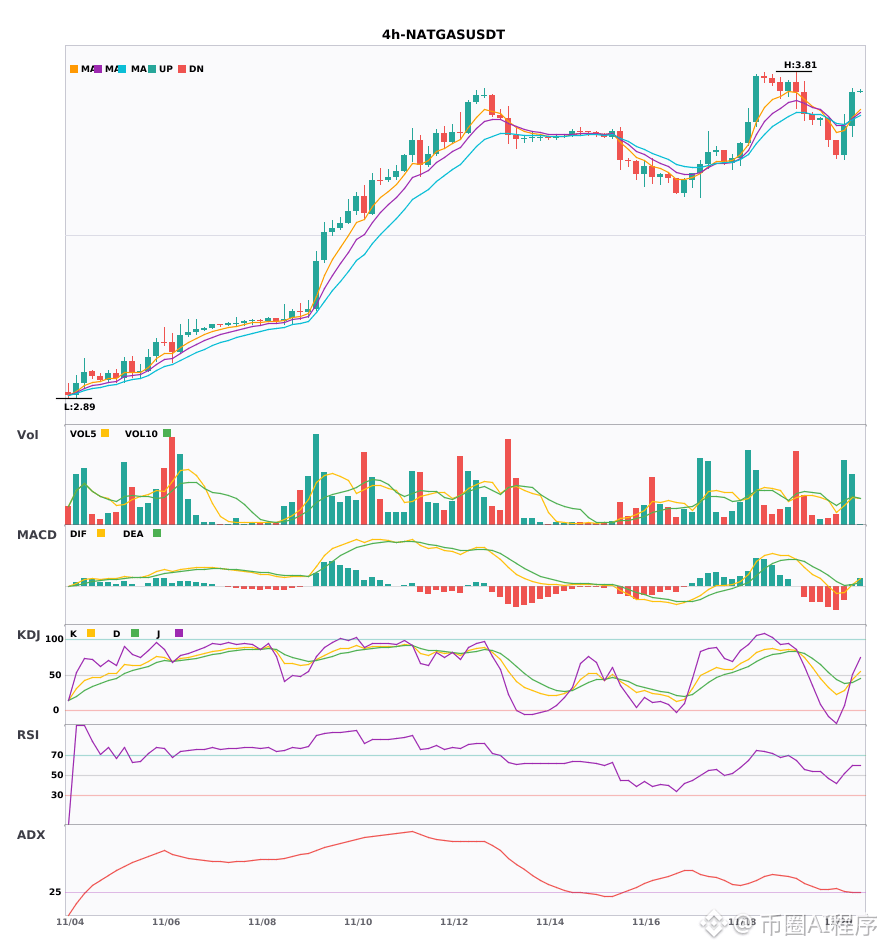
$NATGAS 4-hour daily moving averages are aligned bullishly; a short-term opportunity is here 🔥
════════════════════
🔴 $NATGAS 4-hour bullish signal
⚠️ Technical analysis: Daily bullish trend + 4-hour entry, with multi-timeframe confluence! After the MACD golden cross, the red bars are growing. EMA5 has just crossed above EMA8, forming a bullish alignment. KDJ has a golden cross, with K crossing above D and not yet overbought. Trading volume has increased 2.6 times.
════════════════════
🔔 Follow to get first-hand market updates 🔔
#多周期共振 #NATGAS
📌 When trading, pay attention to whether the candlestick pattern matches.
$NATGAS 4-hour daily moving averages are aligned bullishly; a short-term opportunity is here 🔥
════════════════════
🔴 $NATGAS 4-hour bullish signal
⚠️ Technical analysis: Daily bullish trend + 4-hour entry, with multi-timeframe confluence! After the MACD golden cross, the red bars are growing. EMA5 has just crossed above EMA8, forming a bullish alignment. KDJ has a golden cross, with K crossing above D and not yet overbought. Trading volume has increased 2.6 times.
════════════════════
🔔 Follow to get first-hand market updates 🔔
#多周期共振 #NATGAS
📌 When trading, pay attention to whether the candlestick pattern matches.
════════════════════
🔴 $NATGAS 4-hour bullish signal
⚠️ Technical analysis: Daily bullish trend + 4-hour entry, with multi-timeframe confluence! After the MACD golden cross, the red bars are growing. EMA5 has just crossed above EMA8, forming a bullish alignment. KDJ has a golden cross, with K crossing above D and not yet overbought. Trading volume has increased 2.6 times.
════════════════════
🔔 Follow to get first-hand market updates 🔔
#多周期共振 #NATGAS
📌 When trading, pay attention to whether the candlestick pattern matches.
14

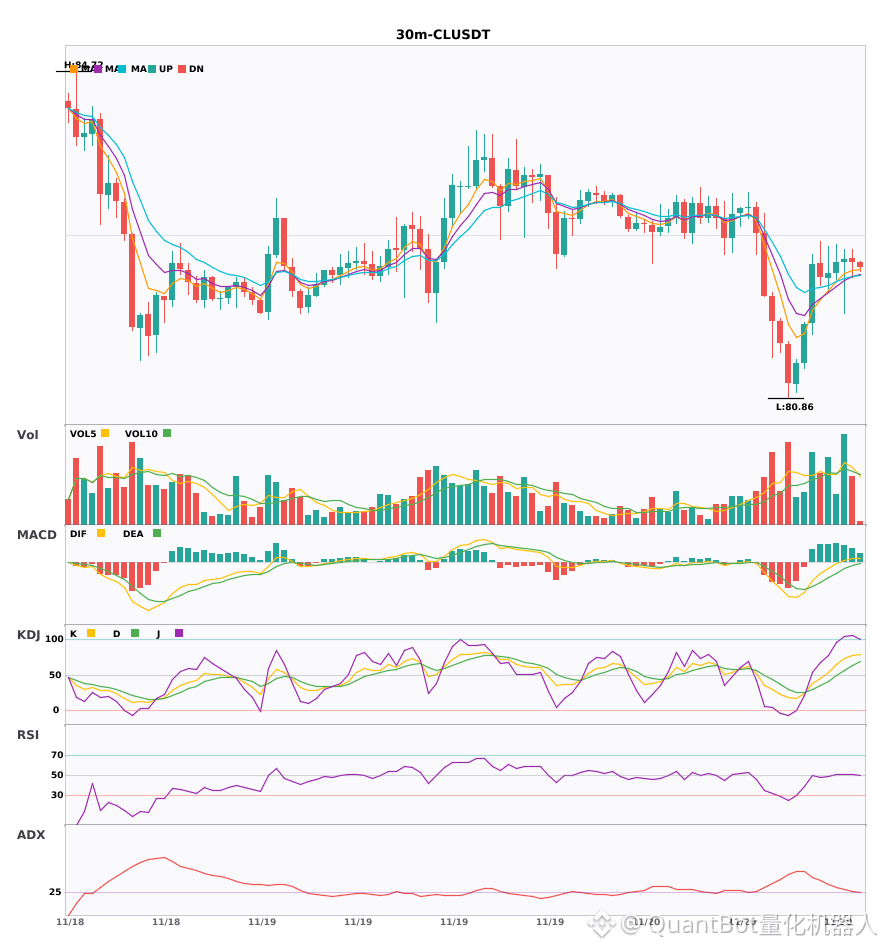
$CL/$NATGAS 30-minute dual resonance, bullish signal confirmed
📈 $CL | 30-minute bullish signal
━━━━━━━━━━━━━━━━━━
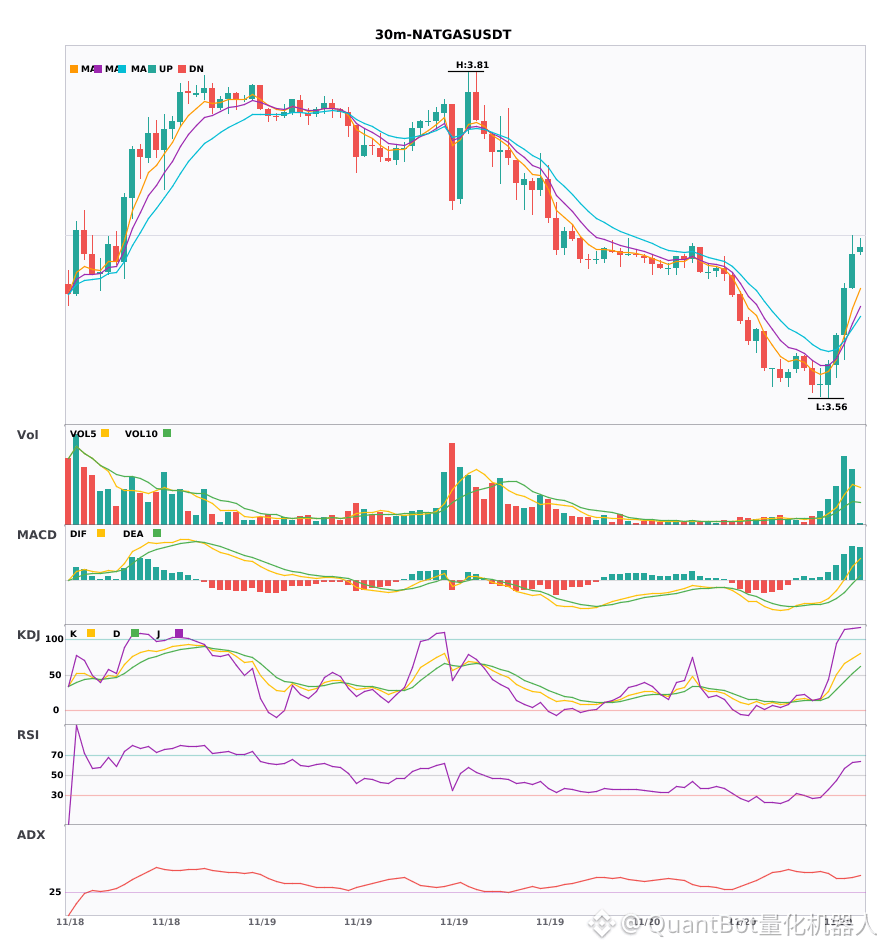
Technical analysis: ADX(29) indicates a developing trend, suitable for participation; MACD DIF crosses above the zero line, turning bullish; moving averages are converging, awaiting a market shift; KDJ shows strong bullish momentum (K72.5/D56.6); volume increased 1.6x.
Price change: 0.0400%
📈 $NATGAS | 30-minute bullish signal
━━━━━━━━━━━━━━━━━━
Technical analysis: ADX(43) indicates a pronounced trend; bullish MACD momentum is strengthening; EMA5>8>13 are in bullish alignment; KDJ shows strong momentum (K73.3/D52.1); trading volume increased 3.7x.
Price change: 0.7100%
━━━━━━━━━━━━━━━━━━
#技术分析 #CL #NATGAS
📌 The above content is for reference only and does not constitute investment advice
$CL /$NATGAS 30-minute dual resonance, bullish signal confirmed
📈 $CL | 30-minute bullish signal
━━━━━━━━━━━━━━━━━━
Technical analysis: ADX(29) indicates a developing trend, suitable for participation; MACD DIF crosses above the zero line, turning bullish; moving averages are converging, awaiting a market shift; KDJ shows strong bullish momentum (K72.5/D56.6); volume increased 1.6x.
Price change: 0.0400%
📈 $NATGAS | 30-minute bullish signal
━━━━━━━━━━━━━━━━━━
Technical analysis: ADX(43) indicates a pronounced trend; bullish MACD momentum is strengthening; EMA5>8>13 are in bullish alignment; KDJ shows strong momentum (K73.3/D52.1); trading volume increased 3.7x.
Price change: 0.7100%
━━━━━━━━━━━━━━━━━━
#技术分析 #CL #NATGAS
📌 The above content is for reference only and does not constitute investment advice
📈 $CL | 30-minute bullish signal
━━━━━━━━━━━━━━━━━━
Technical analysis: ADX(29) indicates a developing trend, suitable for participation; MACD DIF crosses above the zero line, turning bullish; moving averages are converging, awaiting a market shift; KDJ shows strong bullish momentum (K72.5/D56.6); volume increased 1.6x.
Price change: 0.0400%
📈 $NATGAS | 30-minute bullish signal
━━━━━━━━━━━━━━━━━━
Technical analysis: ADX(43) indicates a pronounced trend; bullish MACD momentum is strengthening; EMA5>8>13 are in bullish alignment; KDJ shows strong momentum (K73.3/D52.1); trading volume increased 3.7x.
Price change: 0.7100%
━━━━━━━━━━━━━━━━━━
#技术分析 #CL #NATGAS
📌 The above content is for reference only and does not constitute investment advice
5
·
--
$CL and $NATGAS 30 minutes have just emerged from a bullish alignment, confirming a bullish outlook 🔥
════════════════════
🔴 $CL 30-minute bullish signal
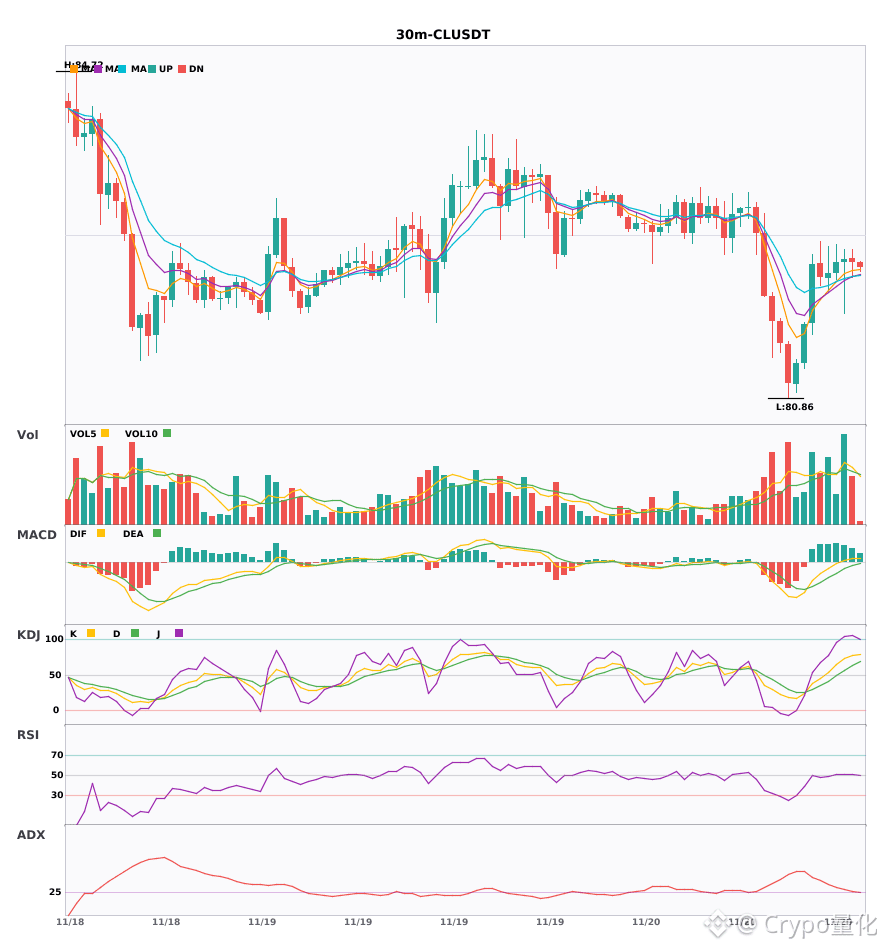
⚠️Technical analysis: ADX shows the trend is picking up, so an entry is possible. After the MACD golden cross, the red bars are growing, clearly signaling a bullish reversal. The moving averages are beginning to fan upward. K has crossed above D but has not yet reached the overbought zone. Volume has increased 1.6 times, favoring the bulls.
════════════════════
🔴 $NATGAS 30-minute bullish signal
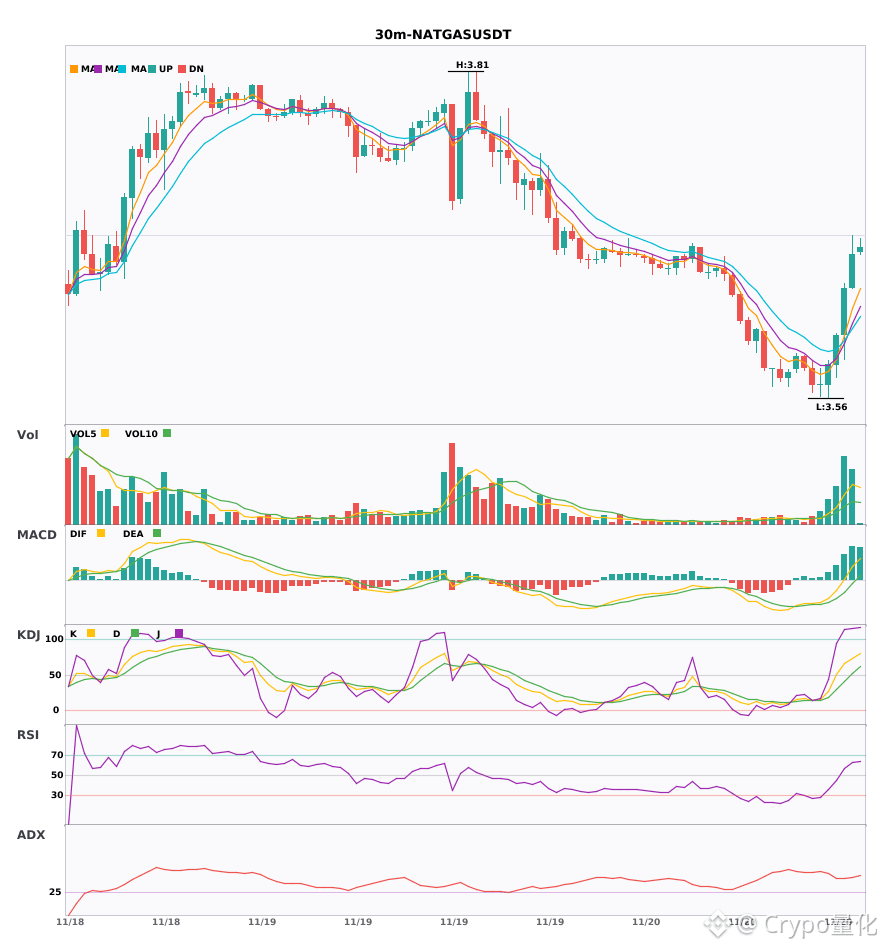
⚠️Technical analysis: ADX indicates a clear trend. After the MACD golden cross, volume-backed red bars continue to grow; the moving averages have just formed a bullish alignment and are fanning upward; K has crossed above D but has not yet reached the overbought zone; trading volume has surged 3.7 times, showing strong bullish momentum.
════════════════════
🔔 Follow us for the latest market-moving updates 🔔
#技术分析 #CL #NATGAS
📌 When trading, pay attention to whether the candlestick pattern confirms the setup
$CL and $NATGAS 30 minutes have just emerged from a bullish alignment, confirming a bullish outlook 🔥
════════════════════
🔴 $CL 30-minute bullish signal
⚠️Technical analysis: ADX shows the trend is picking up, so an entry is possible. After the MACD golden cross, the red bars are growing, clearly signaling a bullish reversal. The moving averages are beginning to fan upward. K has crossed above D but has not yet reached the overbought zone. Volume has increased 1.6 times, favoring the bulls.
════════════════════
🔴 $NATGAS 30-minute bullish signal
⚠️Technical analysis: ADX indicates a clear trend. After the MACD golden cross, volume-backed red bars continue to grow; the moving averages have just formed a bullish alignment and are fanning upward; K has crossed above D but has not yet reached the overbought zone; trading volume has surged 3.7 times, showing strong bullish momentum.
════════════════════
🔔 Follow us for the latest market-moving updates 🔔
#技术分析 #CL #NATGAS
📌 When trading, pay attention to whether the candlestick pattern confirms the setup
════════════════════
🔴 $CL 30-minute bullish signal
⚠️Technical analysis: ADX shows the trend is picking up, so an entry is possible. After the MACD golden cross, the red bars are growing, clearly signaling a bullish reversal. The moving averages are beginning to fan upward. K has crossed above D but has not yet reached the overbought zone. Volume has increased 1.6 times, favoring the bulls.
════════════════════
🔴 $NATGAS 30-minute bullish signal
⚠️Technical analysis: ADX indicates a clear trend. After the MACD golden cross, volume-backed red bars continue to grow; the moving averages have just formed a bullish alignment and are fanning upward; K has crossed above D but has not yet reached the overbought zone; trading volume has surged 3.7 times, showing strong bullish momentum.
════════════════════
🔔 Follow us for the latest market-moving updates 🔔
#技术分析 #CL #NATGAS
📌 When trading, pay attention to whether the candlestick pattern confirms the setup
5
$UVXY, $NATGAS 30-minute bullish outlook, short-term bullish confluence signals
📈 $UVXY | 30-minute bullish signal
━━━━━━━━━━━━━━━━━━
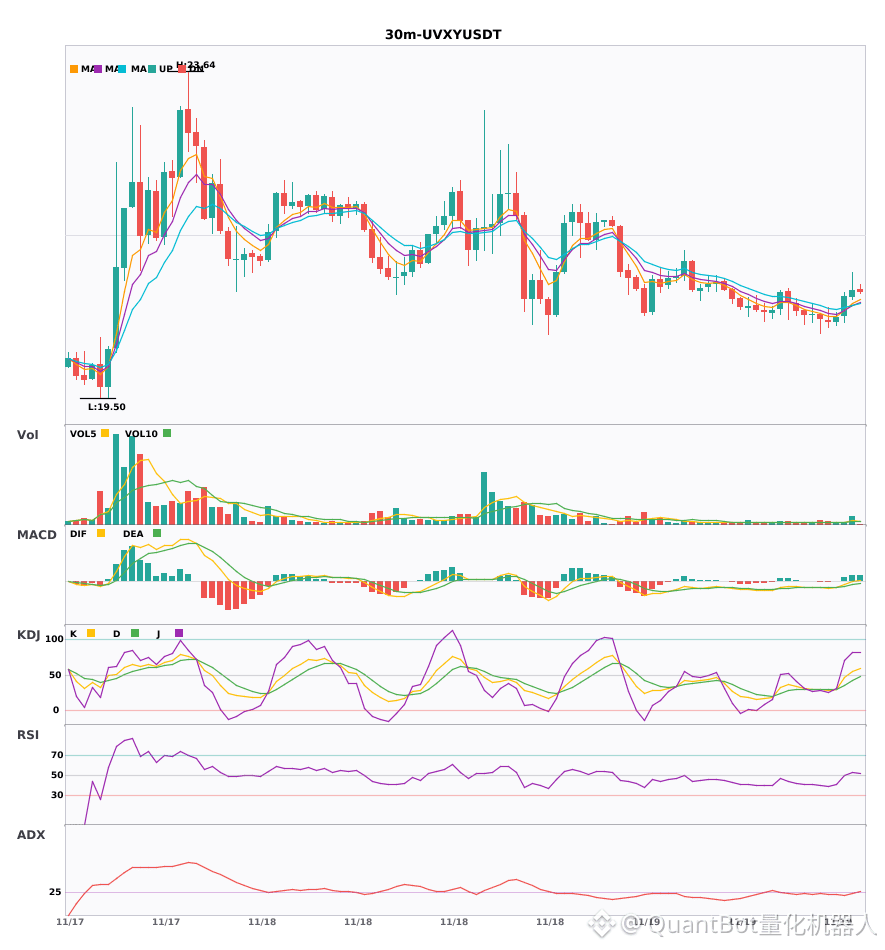
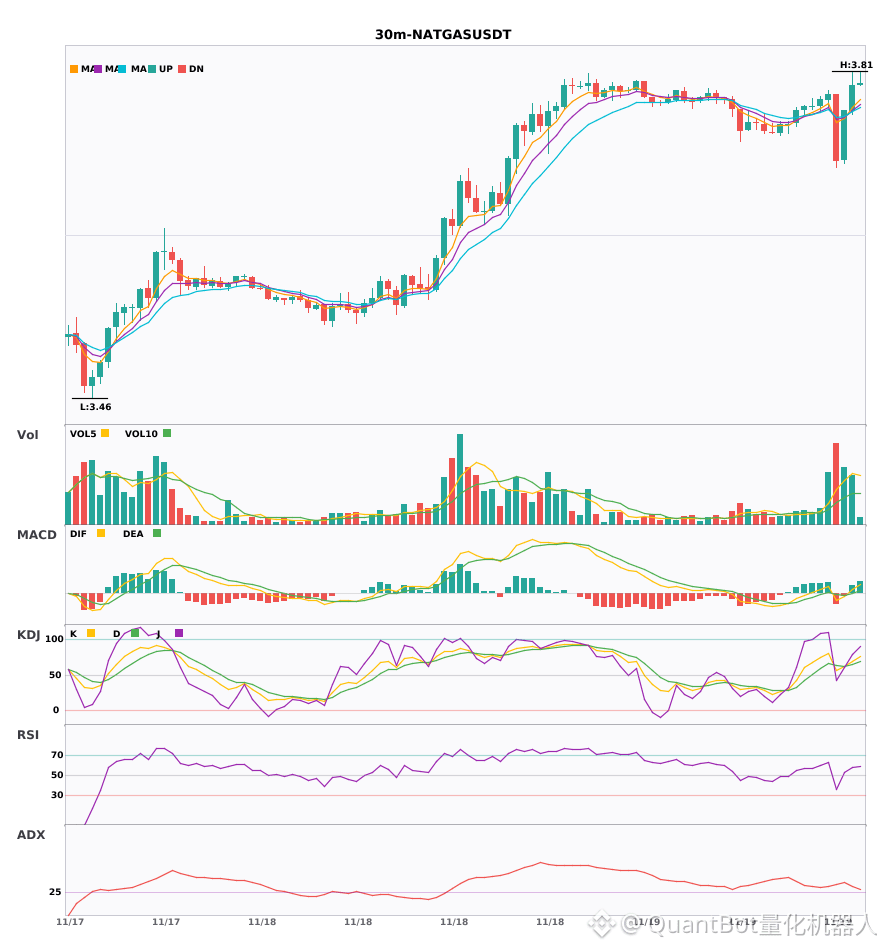
Technical analysis: ADX(26) confirms the trend, meeting conditions for participation; MACD DIF crosses above the zero line, a bullish signal; moving averages are converging ahead of a potential breakout; volume is up 2.6×.
Price change: 0.3800%
📈 $NATGAS | 30-minute bullish signal
━━━━━━━━━━━━━━━━━━
Technical analysis: ADX(35) indicates a pronounced trend; bullish MACD crossover above zero, with strengthening bullish momentum; EMA5 crosses above EMA8, signaling a short-term shift to bullish; KDJ bullish crossover (K69.5, D64.8); volume is up 2.1×.
Price change: 0.7200%
━━━━━━━━━━━━━━━━━━
#技术分析 #UVXY #NATGAS
📌 The above is for reference only and does not constitute investment advice
$UVXY , $NATGAS 30-minute bullish outlook, short-term bullish confluence signals
📈 $UVXY | 30-minute bullish signal
━━━━━━━━━━━━━━━━━━
Technical analysis: ADX(26) confirms the trend, meeting conditions for participation; MACD DIF crosses above the zero line, a bullish signal; moving averages are converging ahead of a potential breakout; volume is up 2.6×.
Price change: 0.3800%
📈 $NATGAS | 30-minute bullish signal
━━━━━━━━━━━━━━━━━━
Technical analysis: ADX(35) indicates a pronounced trend; bullish MACD crossover above zero, with strengthening bullish momentum; EMA5 crosses above EMA8, signaling a short-term shift to bullish; KDJ bullish crossover (K69.5, D64.8); volume is up 2.1×.
Price change: 0.7200%
━━━━━━━━━━━━━━━━━━
#技术分析 #UVXY #NATGAS
📌 The above is for reference only and does not constitute investment advice
📈 $UVXY | 30-minute bullish signal
━━━━━━━━━━━━━━━━━━
Technical analysis: ADX(26) confirms the trend, meeting conditions for participation; MACD DIF crosses above the zero line, a bullish signal; moving averages are converging ahead of a potential breakout; volume is up 2.6×.
Price change: 0.3800%
📈 $NATGAS | 30-minute bullish signal
━━━━━━━━━━━━━━━━━━
Technical analysis: ADX(35) indicates a pronounced trend; bullish MACD crossover above zero, with strengthening bullish momentum; EMA5 crosses above EMA8, signaling a short-term shift to bullish; KDJ bullish crossover (K69.5, D64.8); volume is up 2.1×.
Price change: 0.7200%
━━━━━━━━━━━━━━━━━━
#技术分析 #UVXY #NATGAS
📌 The above is for reference only and does not constitute investment advice
10
·
--
30-minute moving averages are in bullish alignment. Which will surge first, $UVXY or $NATGAS? 🔥
════════════════════
🔴 $UVXY 30-minute bullish signal
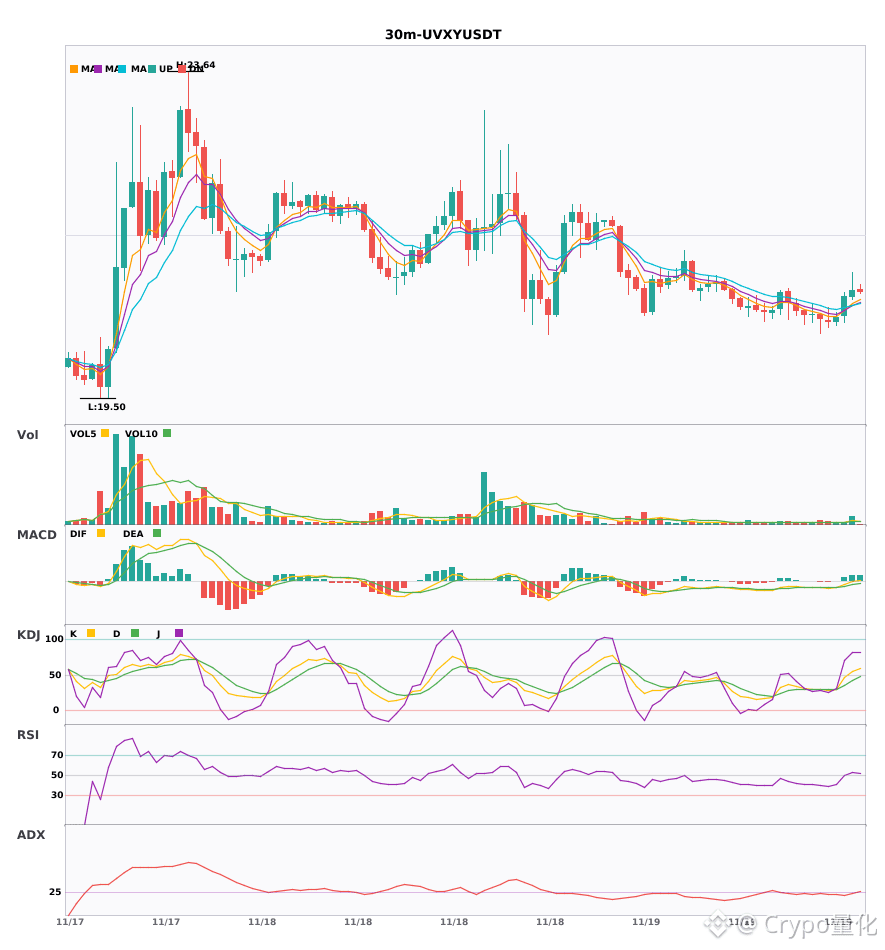
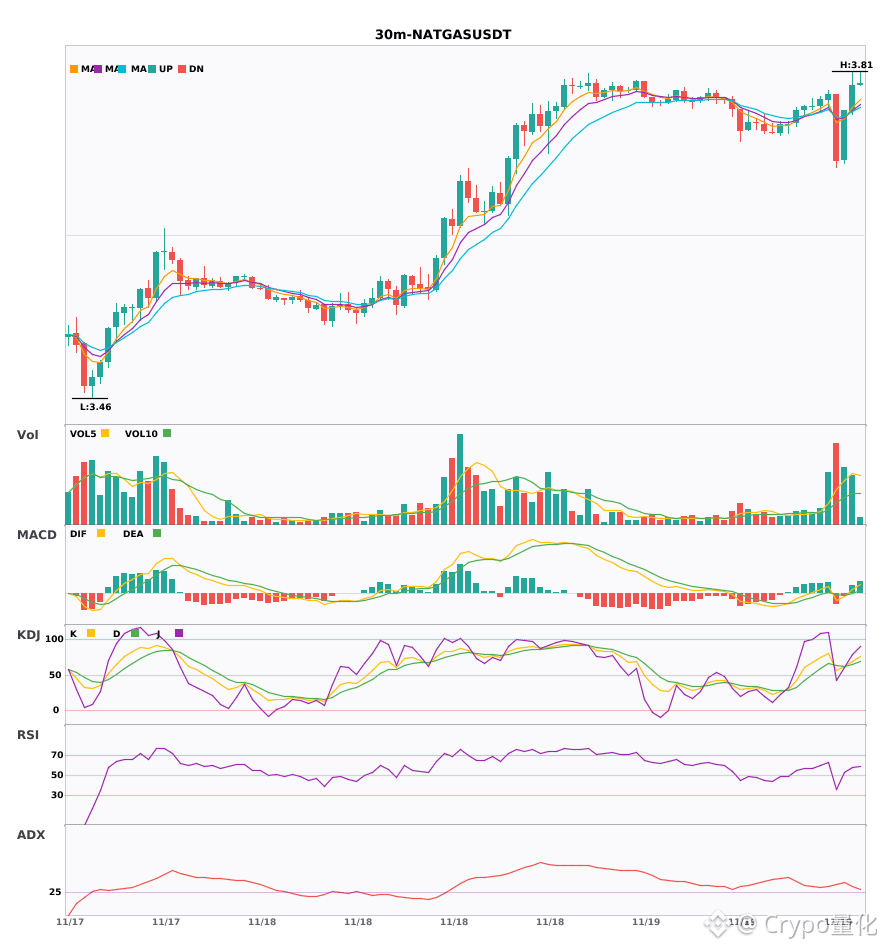
⚠️Technical analysis: ADX shows the trend is just getting started, so it may be a good time to enter; MACD had a bullish crossover followed by rising volume, with the red bars growing; the moving averages have just formed a bullish alignment after converging; volume surged to 2.6x.
════════════════════
🔴 $NATGAS 30-minute bullish signal
⚠️Technical analysis: ADX at 35 indicates a clear trend; MACD had a bullish crossover on rising volume, with the red bars strengthening; EMA5 has crossed above EMA8, and a bullish alignment has just formed; KDJ K has crossed above D without entering overbought territory; volume is up 2.1x, suggesting a short-term bullish outlook.
════════════════════
🔔 Follow for real-time market alerts 🔔
#技术分析 #UVXY #NATGAS
📌 When trading, pay attention to whether the candlestick pattern confirms the signal.
30-minute moving averages are in bullish alignment. Which will surge first, $UVXY or $NATGAS ? 🔥
════════════════════
🔴 $UVXY 30-minute bullish signal
⚠️Technical analysis: ADX shows the trend is just getting started, so it may be a good time to enter; MACD had a bullish crossover followed by rising volume, with the red bars growing; the moving averages have just formed a bullish alignment after converging; volume surged to 2.6x.
════════════════════
🔴 $NATGAS 30-minute bullish signal
⚠️Technical analysis: ADX at 35 indicates a clear trend; MACD had a bullish crossover on rising volume, with the red bars strengthening; EMA5 has crossed above EMA8, and a bullish alignment has just formed; KDJ K has crossed above D without entering overbought territory; volume is up 2.1x, suggesting a short-term bullish outlook.
════════════════════
🔔 Follow for real-time market alerts 🔔
#技术分析 #UVXY #NATGAS
📌 When trading, pay attention to whether the candlestick pattern confirms the signal.
════════════════════
🔴 $UVXY 30-minute bullish signal
⚠️Technical analysis: ADX shows the trend is just getting started, so it may be a good time to enter; MACD had a bullish crossover followed by rising volume, with the red bars growing; the moving averages have just formed a bullish alignment after converging; volume surged to 2.6x.
════════════════════
🔴 $NATGAS 30-minute bullish signal
⚠️Technical analysis: ADX at 35 indicates a clear trend; MACD had a bullish crossover on rising volume, with the red bars strengthening; EMA5 has crossed above EMA8, and a bullish alignment has just formed; KDJ K has crossed above D without entering overbought territory; volume is up 2.1x, suggesting a short-term bullish outlook.
════════════════════
🔔 Follow for real-time market alerts 🔔
#技术分析 #UVXY #NATGAS
📌 When trading, pay attention to whether the candlestick pattern confirms the signal.
10
·
--
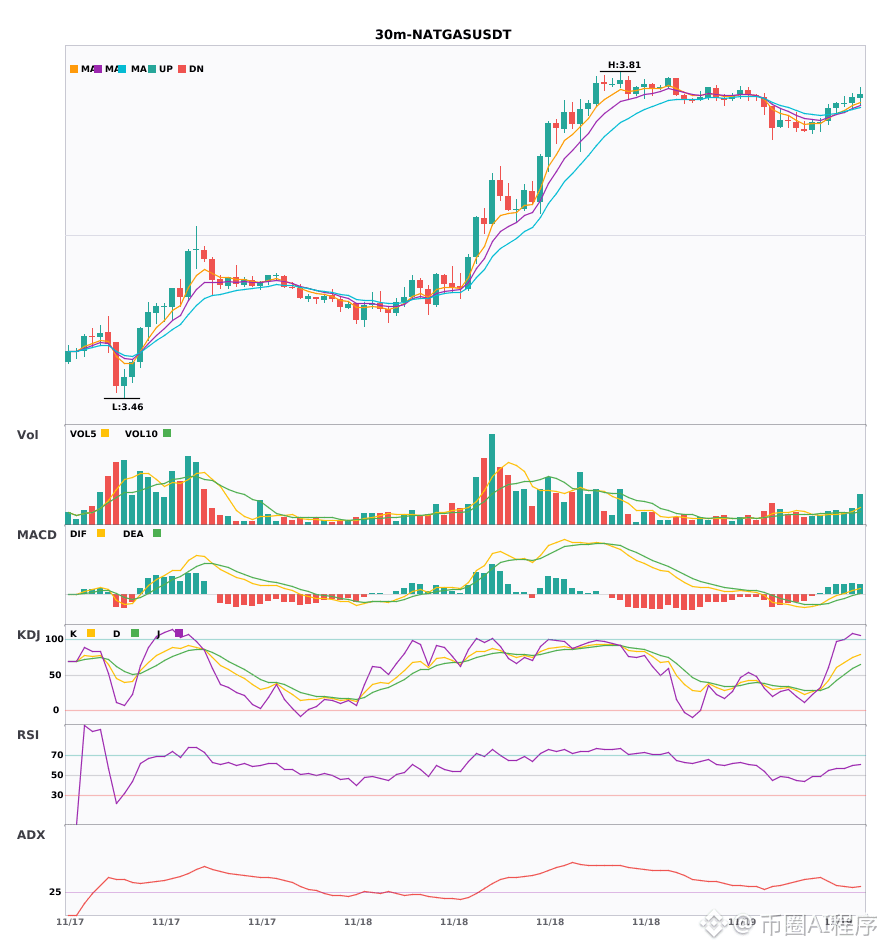
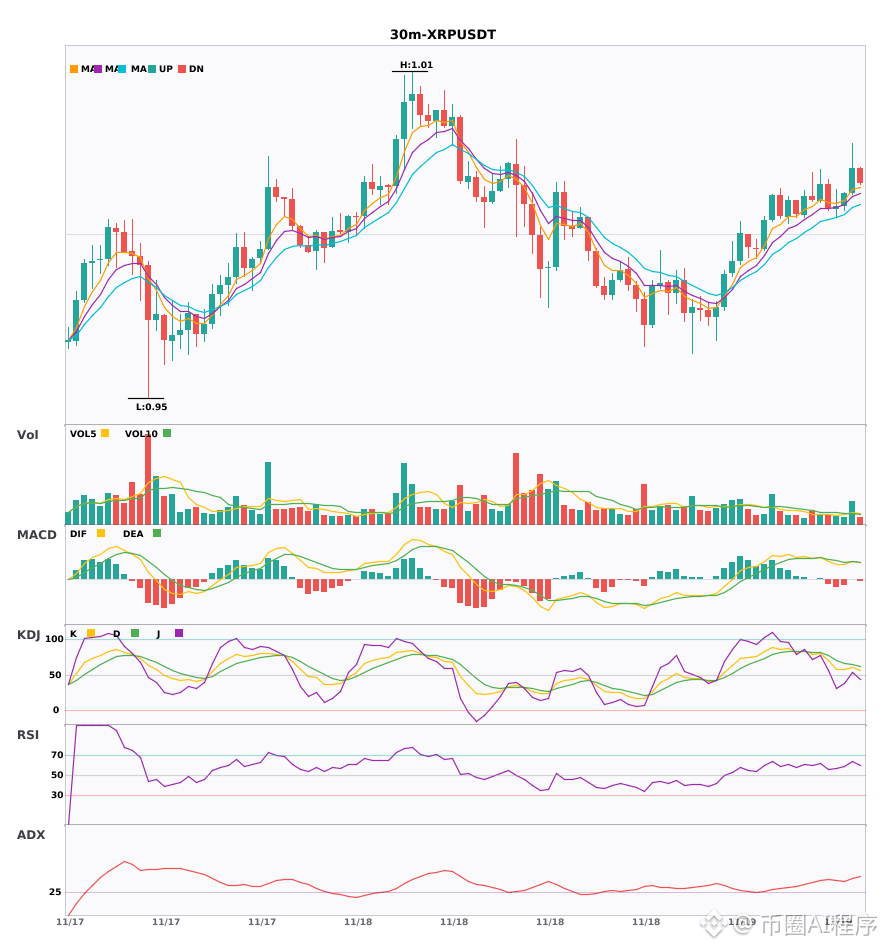
$TAO $NATGAS $XRP 30-minute rally, bullish on the 4-hour chart 🔥
════════════════════
🔴 $TAO 3 30-minute bullish signal
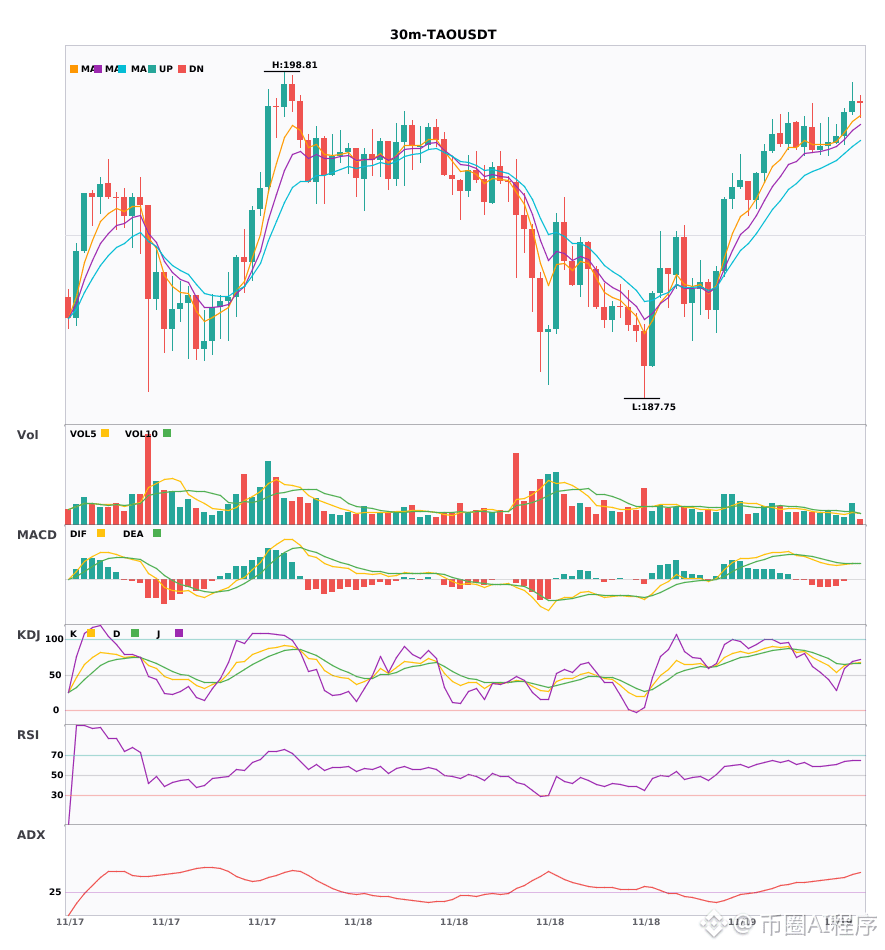
⚠️Technical analysis: Bullish confluence confirmed on the 4-hour chart. 30-minute entry: MACD bullish crossover with expanding red bars; moving averages are in a bullish alignment and diverging upward; K has crossed above D on the KDJ without entering overbought territory; volume is up 1.6x. Short-term outlook is bullish.
════════════════════
🔴 $NATGAS 30-minute bullish signal
⚠️Technical analysis: Bullish confluence confirmed on the 4-hour chart. A 30-minute entry signal has just appeared: red bars have continued to expand after the MACD bullish crossover; moving averages are in a bullish alignment and diverging upward; K has crossed above D on the KDJ but is not overbought; volume is at a normal 1.4x level. The trend is strong!
════════════════════
🔴 $XRP 30-minute bullish signal
⚠️Technical analysis: Multi-timeframe confluence! 4-hour bullish confirmation + 30-minute entry signal. Volume has increased after the MACD bullish crossover, with red bars continuing to expand; moving averages are in a bullish alignment and diverging upward; KDJ is running strong; volume is up 2.1x. Bullish confluence points to further gains.
════════════════════
🔔 Follow for first-hand market updates 🔔
#多周期共振 #TAO #NATGAS #XRP
📌 When trading, pay attention to whether the candlestick pattern aligns.
$TAO $NATGAS $XRP 30-minute rally, bullish on the 4-hour chart 🔥
════════════════════
🔴 $TAO 3 30-minute bullish signal
⚠️Technical analysis: Bullish confluence confirmed on the 4-hour chart. 30-minute entry: MACD bullish crossover with expanding red bars; moving averages are in a bullish alignment and diverging upward; K has crossed above D on the KDJ without entering overbought territory; volume is up 1.6x. Short-term outlook is bullish.
════════════════════
🔴 $NATGAS 30-minute bullish signal
⚠️Technical analysis: Bullish confluence confirmed on the 4-hour chart. A 30-minute entry signal has just appeared: red bars have continued to expand after the MACD bullish crossover; moving averages are in a bullish alignment and diverging upward; K has crossed above D on the KDJ but is not overbought; volume is at a normal 1.4x level. The trend is strong!
════════════════════
🔴 $XRP 30-minute bullish signal
⚠️Technical analysis: Multi-timeframe confluence! 4-hour bullish confirmation + 30-minute entry signal. Volume has increased after the MACD bullish crossover, with red bars continuing to expand; moving averages are in a bullish alignment and diverging upward; KDJ is running strong; volume is up 2.1x. Bullish confluence points to further gains.
════════════════════
🔔 Follow for first-hand market updates 🔔
#多周期共振 #TAO #NATGAS #XRP
📌 When trading, pay attention to whether the candlestick pattern aligns.
════════════════════
🔴 $TAO 3 30-minute bullish signal
⚠️Technical analysis: Bullish confluence confirmed on the 4-hour chart. 30-minute entry: MACD bullish crossover with expanding red bars; moving averages are in a bullish alignment and diverging upward; K has crossed above D on the KDJ without entering overbought territory; volume is up 1.6x. Short-term outlook is bullish.
════════════════════
🔴 $NATGAS 30-minute bullish signal
⚠️Technical analysis: Bullish confluence confirmed on the 4-hour chart. A 30-minute entry signal has just appeared: red bars have continued to expand after the MACD bullish crossover; moving averages are in a bullish alignment and diverging upward; K has crossed above D on the KDJ but is not overbought; volume is at a normal 1.4x level. The trend is strong!
════════════════════
🔴 $XRP 30-minute bullish signal
⚠️Technical analysis: Multi-timeframe confluence! 4-hour bullish confirmation + 30-minute entry signal. Volume has increased after the MACD bullish crossover, with red bars continuing to expand; moving averages are in a bullish alignment and diverging upward; KDJ is running strong; volume is up 2.1x. Bullish confluence points to further gains.
════════════════════
🔔 Follow for first-hand market updates 🔔
#多周期共振 #TAO #NATGAS #XRP
📌 When trading, pay attention to whether the candlestick pattern aligns.
7
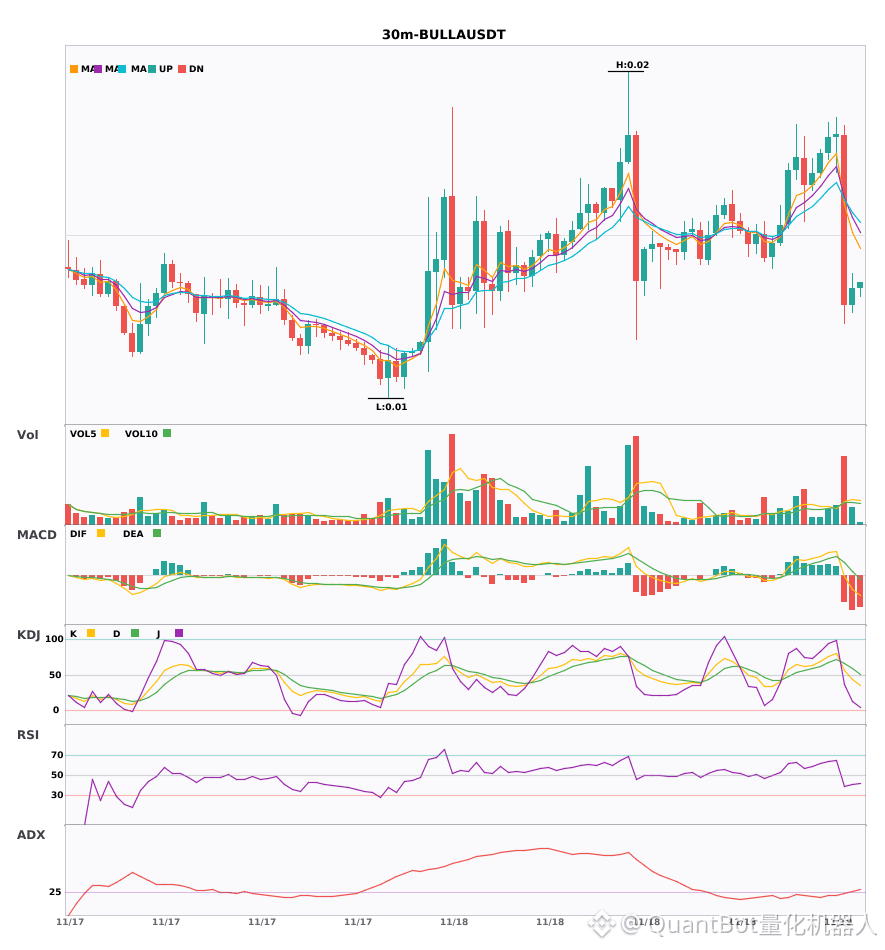
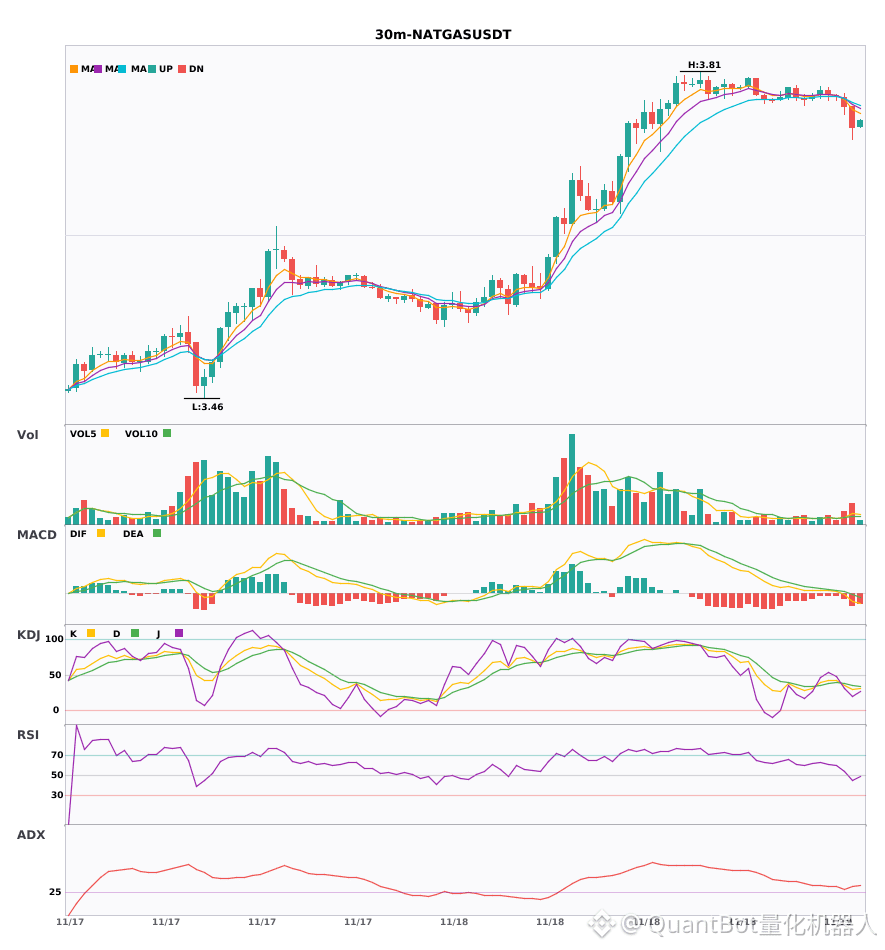
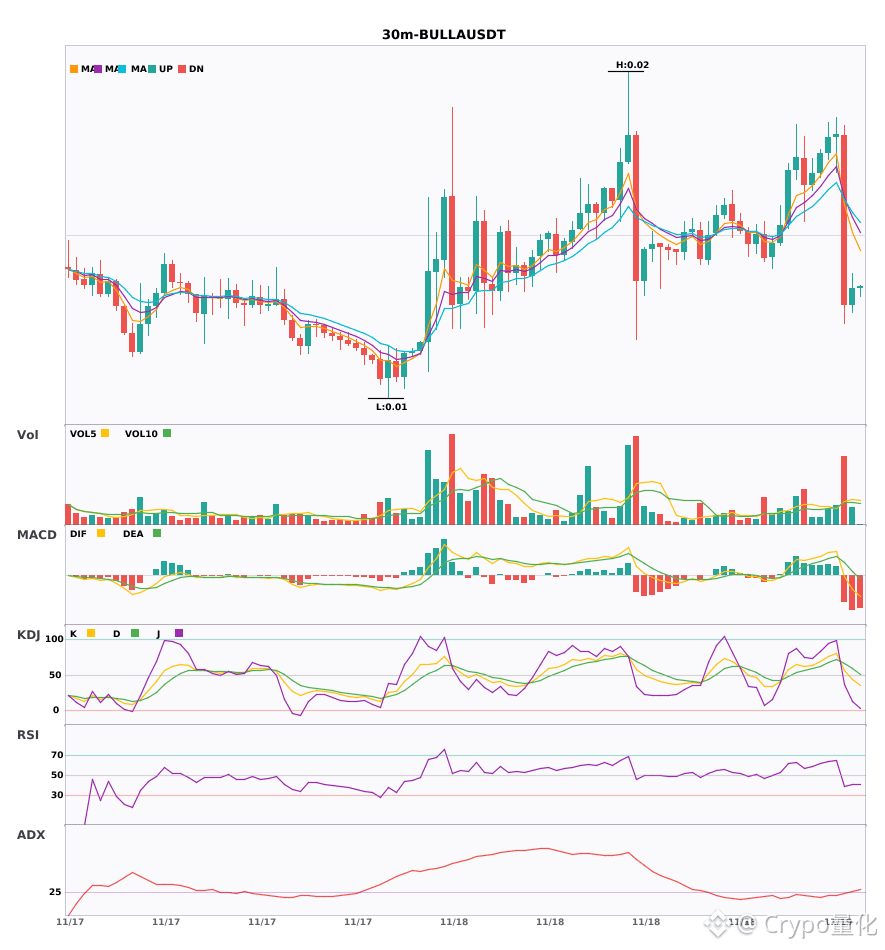
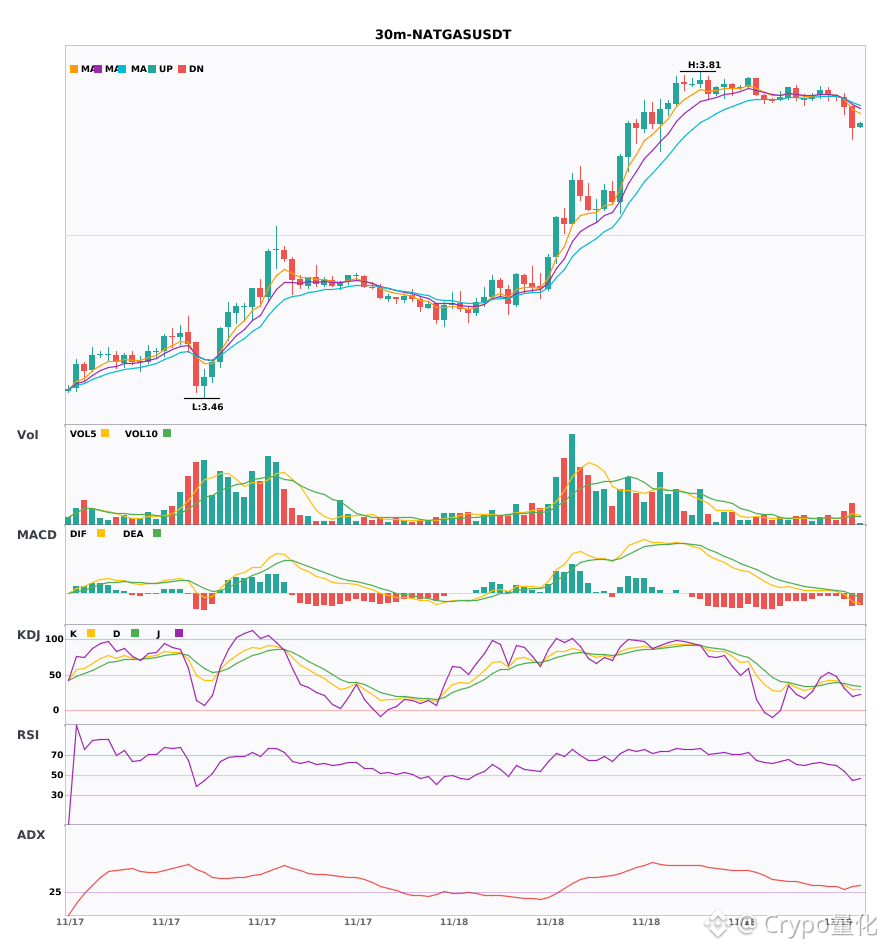
$BULLA / $NATGAS 30-minute confluence turns bearish, confirmed by dual signals
📉 $BULLA | 30-minute Bearish Signal
━━━━━━━━━━━━━━━━━━
Technical analysis: ADX(29) trend established, suitable for participation | MACD bearish momentum strengthening | EMA5<EMA8<EMA13 bearish alignment | Volume up 3.1x
Price change: 2.4700%
📉 $NATGAS | 30-minute Bearish Signal
━━━━━━━━━━━━━━━━━━
Technical analysis: ADX(30) trend emerging, offering potential for participation. MACD bearish trend continues, with a weak trend and strengthening momentum. EMA5<EMA8<EMA13 in bearish alignment. KDJ is weak, with bears in control (K=30.1,D=35.4). Volume significantly increased (2.4x).
Price change: -0.6100%
━━━━━━━━━━━━━━━━━━
#技术分析 #BULLA #NATGAS
📌 The above content is for reference only and does not constitute investment advice
$BULLA / $NATGAS 30-minute confluence turns bearish, confirmed by dual signals
📉 $BULLA | 30-minute Bearish Signal
━━━━━━━━━━━━━━━━━━
Technical analysis: ADX(29) trend established, suitable for participation | MACD bearish momentum strengthening | EMA5<EMA8<EMA13 bearish alignment | Volume up 3.1x
Price change: 2.4700%
📉 $NATGAS | 30-minute Bearish Signal
━━━━━━━━━━━━━━━━━━
Technical analysis: ADX(30) trend emerging, offering potential for participation. MACD bearish trend continues, with a weak trend and strengthening momentum. EMA5<EMA8<EMA13 in bearish alignment. KDJ is weak, with bears in control (K=30.1,D=35.4). Volume significantly increased (2.4x).
Price change: -0.6100%
━━━━━━━━━━━━━━━━━━
#技术分析 #BULLA #NATGAS
📌 The above content is for reference only and does not constitute investment advice
📉 $BULLA | 30-minute Bearish Signal
━━━━━━━━━━━━━━━━━━
Technical analysis: ADX(29) trend established, suitable for participation | MACD bearish momentum strengthening | EMA5<EMA8<EMA13 bearish alignment | Volume up 3.1x
Price change: 2.4700%
📉 $NATGAS | 30-minute Bearish Signal
━━━━━━━━━━━━━━━━━━
Technical analysis: ADX(30) trend emerging, offering potential for participation. MACD bearish trend continues, with a weak trend and strengthening momentum. EMA5<EMA8<EMA13 in bearish alignment. KDJ is weak, with bears in control (K=30.1,D=35.4). Volume significantly increased (2.4x).
Price change: -0.6100%
━━━━━━━━━━━━━━━━━━
#技术分析 #BULLA #NATGAS
📌 The above content is for reference only and does not constitute investment advice
20
·
--
$BULLA $NATGAS 30-minute convergence turns bearish; bearish signals are firing across the board🔥
════════════════════
🟢 $BULLA 30-minute bearish signal
⚠️Technical: ADX 29; the trend has just formed, so it may be worth participating. MACD green bars are expanding, indicating bearish momentum is strengthening. Moving averages have just diverged bearishly and are pointing down. Trading volume is up 3.1x.
════════════════════
🟢 $NATGAS 30-minute bearish signal
⚠️Technical: ADX shows the trend is just emerging, so it’s worth watching. MACD green bars are weakening, but momentum is strengthening; moving averages are aligned bearishly and pointing down. On KDJ, K is below D and not yet oversold, so bears have the upper hand. Volume is up 2.4x.
════════════════════
🔔 Follow to get first-hand alerts on market moves 🔔
#技术分析 #BULLA #NATGAS
📌 When trading, pay attention to whether the candlestick pattern aligns
$BULLA $NATGAS 30-minute convergence turns bearish; bearish signals are firing across the board🔥
════════════════════
🟢 $BULLA 30-minute bearish signal
⚠️Technical: ADX 29; the trend has just formed, so it may be worth participating. MACD green bars are expanding, indicating bearish momentum is strengthening. Moving averages have just diverged bearishly and are pointing down. Trading volume is up 3.1x.
════════════════════
🟢 $NATGAS 30-minute bearish signal
⚠️Technical: ADX shows the trend is just emerging, so it’s worth watching. MACD green bars are weakening, but momentum is strengthening; moving averages are aligned bearishly and pointing down. On KDJ, K is below D and not yet oversold, so bears have the upper hand. Volume is up 2.4x.
════════════════════
🔔 Follow to get first-hand alerts on market moves 🔔
#技术分析 #BULLA #NATGAS
📌 When trading, pay attention to whether the candlestick pattern aligns
════════════════════
🟢 $BULLA 30-minute bearish signal
⚠️Technical: ADX 29; the trend has just formed, so it may be worth participating. MACD green bars are expanding, indicating bearish momentum is strengthening. Moving averages have just diverged bearishly and are pointing down. Trading volume is up 3.1x.
════════════════════
🟢 $NATGAS 30-minute bearish signal
⚠️Technical: ADX shows the trend is just emerging, so it’s worth watching. MACD green bars are weakening, but momentum is strengthening; moving averages are aligned bearishly and pointing down. On KDJ, K is below D and not yet oversold, so bears have the upper hand. Volume is up 2.4x.
════════════════════
🔔 Follow to get first-hand alerts on market moves 🔔
#技术分析 #BULLA #NATGAS
📌 When trading, pay attention to whether the candlestick pattern aligns
11

·
--
Experienced traders looking at NATGAS don’t focus on the gain at first glance; they ask whether anyone is still willing to step in after the rally.
Binance TradFi Perpetuals (traditional finance assets; high gap risk outside trading hours) | NATGAS is up 5.99% over the past 24 hours, and momentum remains strong. For the next leg, watch for a pullback. At 21:55:03 Beijing time on 2026-11-18, the price was around 3.678 (30m indicators use the 21:30 closing candle), with 24h trading volume at around 99.1171 million; the 30m volume ratio was 9.8x, showing rising participation. Positioning: 65% of accounts are short; the taker buy/sell ratio is 1.04 (aggressive trading is nearly balanced); 30m open interest is down 1.0%.
Reference indicators: The 30m RSI at 78.14 is elevated, suggesting traders are getting carried away chasing prices. The 30m ATR trend band reference is 3.58168; the current price is above it, indicating the structure favors trend continuation.
The order book needs to answer two questions: Can the taker buy/sell ratio of 1.04 hold above 1.10, and can the 30m RSI at 78.1 first fall back below 70? If both hold, this move is worth discussing further; if only one does, treat it as sentiment-driven volatility.
#NATGAS #UnusualMoveAlert
Experienced traders looking at NATGAS don’t focus on the gain at first glance; they ask whether anyone is still willing to step in after the rally.
Binance TradFi Perpetuals (traditional finance assets; high gap risk outside trading hours) | NATGAS is up 5.99% over the past 24 hours, and momentum remains strong. For the next leg, watch for a pullback. At 21:55:03 Beijing time on 2026-11-18, the price was around 3.678 (30m indicators use the 21:30 closing candle), with 24h trading volume at around 99.1171 million; the 30m volume ratio was 9.8x, showing rising participation. Positioning: 65% of accounts are short; the taker buy/sell ratio is 1.04 (aggressive trading is nearly balanced); 30m open interest is down 1.0%.
Reference indicators: The 30m RSI at 78.14 is elevated, suggesting traders are getting carried away chasing prices. The 30m ATR trend band reference is 3.58168; the current price is above it, indicating the structure favors trend continuation.
The order book needs to answer two questions: Can the taker buy/sell ratio of 1.04 hold above 1.10, and can the 30m RSI at 78.1 first fall back below 70? If both hold, this move is worth discussing further; if only one does, treat it as sentiment-driven volatility.
#NATGAS #UnusualMoveAlert
Binance TradFi Perpetuals (traditional finance assets; high gap risk outside trading hours) | NATGAS is up 5.99% over the past 24 hours, and momentum remains strong. For the next leg, watch for a pullback. At 21:55:03 Beijing time on 2026-11-18, the price was around 3.678 (30m indicators use the 21:30 closing candle), with 24h trading volume at around 99.1171 million; the 30m volume ratio was 9.8x, showing rising participation. Positioning: 65% of accounts are short; the taker buy/sell ratio is 1.04 (aggressive trading is nearly balanced); 30m open interest is down 1.0%.
Reference indicators: The 30m RSI at 78.14 is elevated, suggesting traders are getting carried away chasing prices. The 30m ATR trend band reference is 3.58168; the current price is above it, indicating the structure favors trend continuation.
The order book needs to answer two questions: Can the taker buy/sell ratio of 1.04 hold above 1.10, and can the 30m RSI at 78.1 first fall back below 70? If both hold, this move is worth discussing further; if only one does, treat it as sentiment-driven volatility.
#NATGAS #UnusualMoveAlert
5
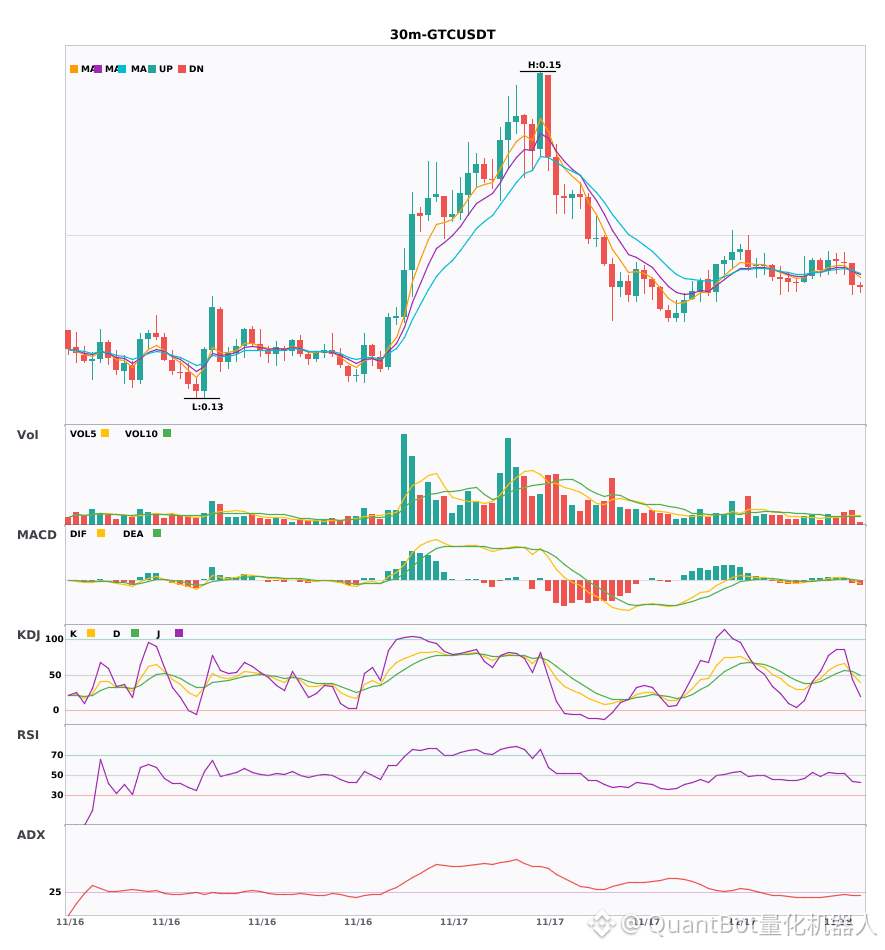
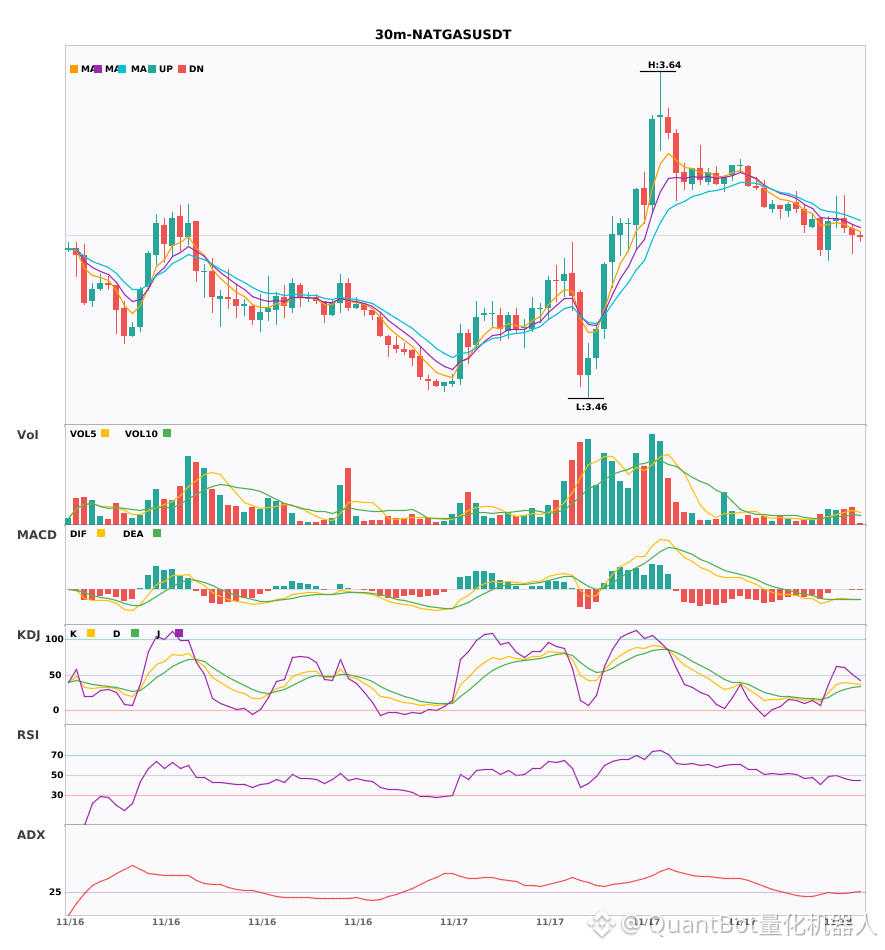
$GTC/$NATGAS 30-minute confluence turns bearish, confirmed by dual signals
📉 $GTC | 30-minute bearish signal
━━━━━━━━━━━━━━━━━━
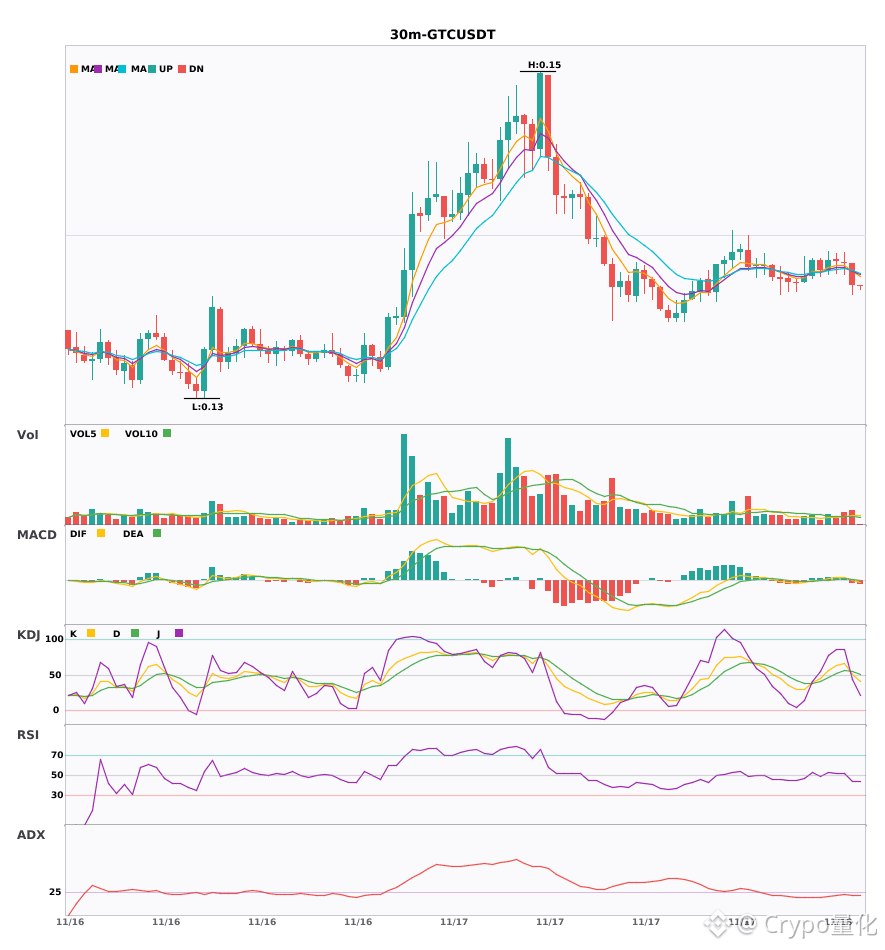
Technical analysis: ADX(26) confirms the trend, making it suitable for participation; MACD has formed a death cross below the zero line, strengthening bearish momentum; EMA5 has crossed below EMA8, turning short-term bearish; KDJ death cross (K=51.3,D=54.8); trading volume increased 1.7x.
Price change: -0.7800%
📉 $NATGAS | 30-minute bearish signal
━━━━━━━━━━━━━━━━━━
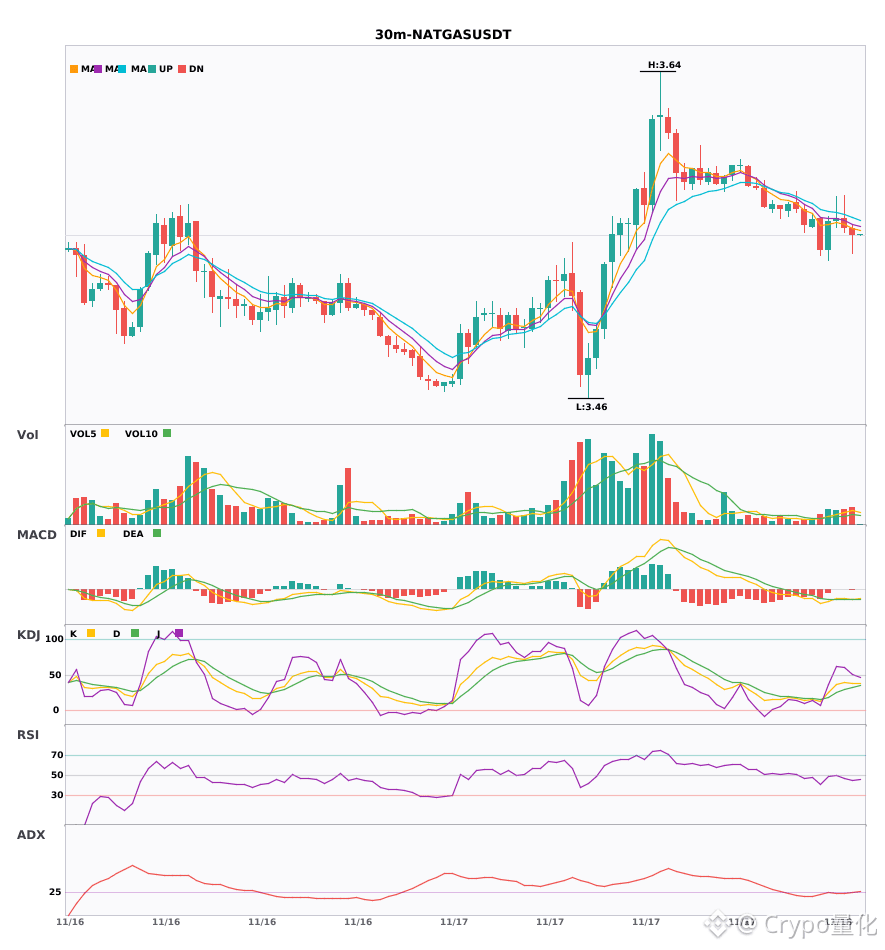
Technical analysis: ADX(29) confirms the trend, meeting the conditions for participation; MACD has formed a death cross below the zero line, strengthening downward momentum; EMA5/8/13 are in bearish alignment; KDJ is in weak territory (K38.7/D32.9), with bears in control; trading volume increased 1.8x.
Price change: -0.1100%
━━━━━━━━━━━━━━━━━━
#技术分析 #GTC #NATGAS
📌 The above is for reference only and does not constitute investment advice
$GTC /$NATGAS 30-minute confluence turns bearish, confirmed by dual signals
📉 $GTC | 30-minute bearish signal
━━━━━━━━━━━━━━━━━━
Technical analysis: ADX(26) confirms the trend, making it suitable for participation; MACD has formed a death cross below the zero line, strengthening bearish momentum; EMA5 has crossed below EMA8, turning short-term bearish; KDJ death cross (K=51.3,D=54.8); trading volume increased 1.7x.
Price change: -0.7800%
📉 $NATGAS | 30-minute bearish signal
━━━━━━━━━━━━━━━━━━
Technical analysis: ADX(29) confirms the trend, meeting the conditions for participation; MACD has formed a death cross below the zero line, strengthening downward momentum; EMA5/8/13 are in bearish alignment; KDJ is in weak territory (K38.7/D32.9), with bears in control; trading volume increased 1.8x.
Price change: -0.1100%
━━━━━━━━━━━━━━━━━━
#技术分析 #GTC #NATGAS
📌 The above is for reference only and does not constitute investment advice
📉 $GTC | 30-minute bearish signal
━━━━━━━━━━━━━━━━━━
Technical analysis: ADX(26) confirms the trend, making it suitable for participation; MACD has formed a death cross below the zero line, strengthening bearish momentum; EMA5 has crossed below EMA8, turning short-term bearish; KDJ death cross (K=51.3,D=54.8); trading volume increased 1.7x.
Price change: -0.7800%
📉 $NATGAS | 30-minute bearish signal
━━━━━━━━━━━━━━━━━━
Technical analysis: ADX(29) confirms the trend, meeting the conditions for participation; MACD has formed a death cross below the zero line, strengthening downward momentum; EMA5/8/13 are in bearish alignment; KDJ is in weak territory (K38.7/D32.9), with bears in control; trading volume increased 1.8x.
Price change: -0.1100%
━━━━━━━━━━━━━━━━━━
#技术分析 #GTC #NATGAS
📌 The above is for reference only and does not constitute investment advice
5
·
--
$GTC / $NATGAS 30-minute bearish, with short-term prices still under pressure🔥
════════════════════
🟢 $GTC 30-minute bearish signal
⚠️Technical analysis: ADX indicates a trend is forming, so you can participate; MACD green bars are expanding, with bearish momentum accelerating; short-term moving averages have turned bearish; the KDJ death cross has not yet reached the oversold zone; trading volume is 1.7 times higher.
════════════════════
🟢 $NATGAS 30-minute bearish signal
⚠️Technical analysis: MACD has formed a death cross below zero with increased volume; moving averages are bearishly aligned and trending downward; bears have the upper hand in the weak KDJ; the trend has just formed, so you can participate.
════════════════════
🔔 Follow for first-hand market movement updates 🔔
#技术分析 #GTC #NATGAS
📌 When trading, pay attention to whether the candlestick pattern matches
$GTC / $NATGAS 30-minute bearish, with short-term prices still under pressure🔥
════════════════════
🟢 $GTC 30-minute bearish signal
⚠️Technical analysis: ADX indicates a trend is forming, so you can participate; MACD green bars are expanding, with bearish momentum accelerating; short-term moving averages have turned bearish; the KDJ death cross has not yet reached the oversold zone; trading volume is 1.7 times higher.
════════════════════
🟢 $NATGAS 30-minute bearish signal
⚠️Technical analysis: MACD has formed a death cross below zero with increased volume; moving averages are bearishly aligned and trending downward; bears have the upper hand in the weak KDJ; the trend has just formed, so you can participate.
════════════════════
🔔 Follow for first-hand market movement updates 🔔
#技术分析 #GTC #NATGAS
📌 When trading, pay attention to whether the candlestick pattern matches
════════════════════
🟢 $GTC 30-minute bearish signal
⚠️Technical analysis: ADX indicates a trend is forming, so you can participate; MACD green bars are expanding, with bearish momentum accelerating; short-term moving averages have turned bearish; the KDJ death cross has not yet reached the oversold zone; trading volume is 1.7 times higher.
════════════════════
🟢 $NATGAS 30-minute bearish signal
⚠️Technical analysis: MACD has formed a death cross below zero with increased volume; moving averages are bearishly aligned and trending downward; bears have the upper hand in the weak KDJ; the trend has just formed, so you can participate.
════════════════════
🔔 Follow for first-hand market movement updates 🔔
#技术分析 #GTC #NATGAS
📌 When trading, pay attention to whether the candlestick pattern matches
13
·
--
$VIRTUAL / $NATGAS 30-minute, 4-hour bearish confluence 🔥
════════════════════
🟢 $VIRTUAL 30-minute bearish signal
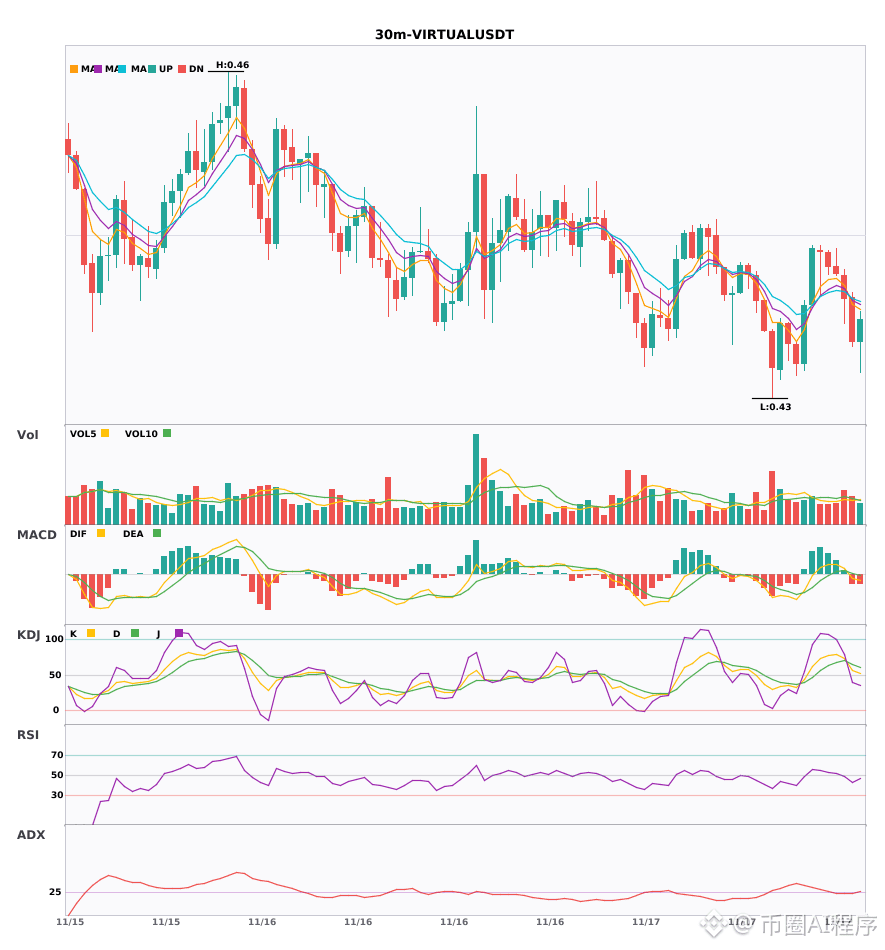
⚠️Technical analysis: 4-hour and 30-minute bearish confluence confirmed! MACD bearish crossover below zero signals accelerating bearish momentum; EMA5 falls below EMA8, turning bearish in the short term; KDJ bearish crossover; volume is normal.
════════════════════
🟢 $NATGAS 30-minute bearish signal
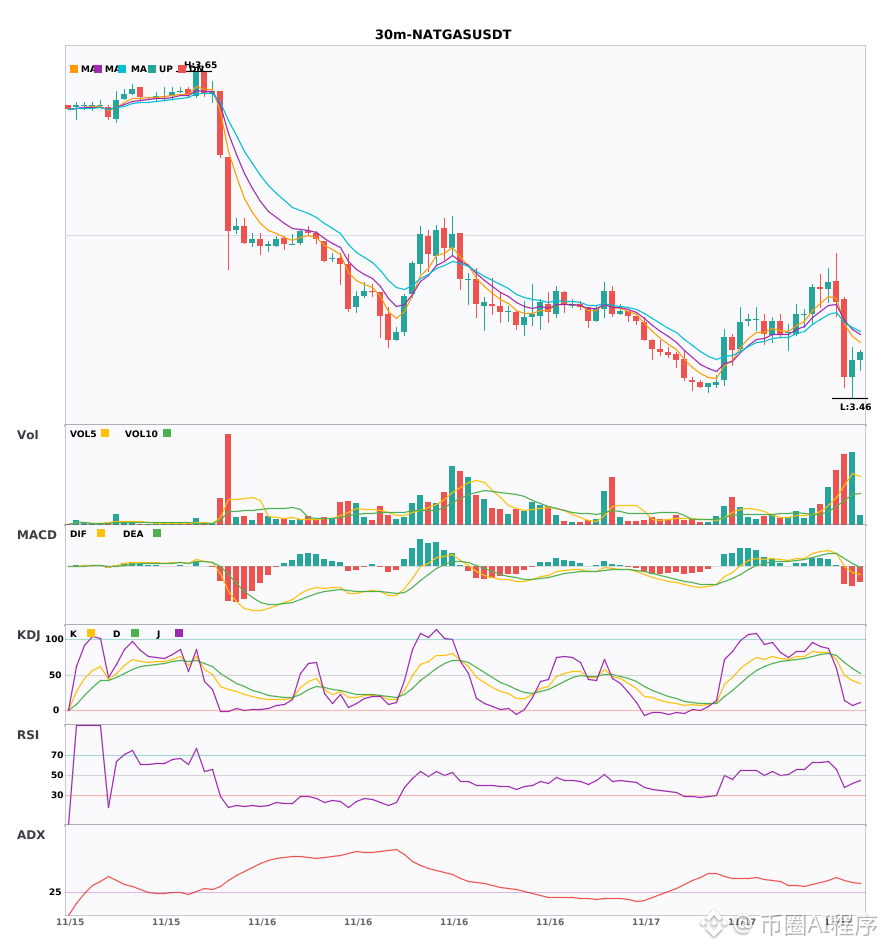
⚠️Technical analysis: 4-hour bearish confluence confirmed. 30-minute entry: MACD green bars continue to expand, bearish momentum is strengthening, and moving averages are bearishly aligned and diverging downward. Trading volume surged to 2.9 times the usual level. Multiple timeframes are aligned, and the trend is weak.
════════════════════
🔔 Follow to get the latest market updates 🔔
#多周期共振 #VIRTUAL #NATGAS
📌 When trading, pay attention to whether the candlestick patterns align.
$VIRTUAL / $NATGAS 30-minute, 4-hour bearish confluence 🔥
════════════════════
🟢 $VIRTUAL 30-minute bearish signal
⚠️Technical analysis: 4-hour and 30-minute bearish confluence confirmed! MACD bearish crossover below zero signals accelerating bearish momentum; EMA5 falls below EMA8, turning bearish in the short term; KDJ bearish crossover; volume is normal.
════════════════════
🟢 $NATGAS 30-minute bearish signal
⚠️Technical analysis: 4-hour bearish confluence confirmed. 30-minute entry: MACD green bars continue to expand, bearish momentum is strengthening, and moving averages are bearishly aligned and diverging downward. Trading volume surged to 2.9 times the usual level. Multiple timeframes are aligned, and the trend is weak.
════════════════════
🔔 Follow to get the latest market updates 🔔
#多周期共振 #VIRTUAL #NATGAS
📌 When trading, pay attention to whether the candlestick patterns align.
════════════════════
🟢 $VIRTUAL 30-minute bearish signal
⚠️Technical analysis: 4-hour and 30-minute bearish confluence confirmed! MACD bearish crossover below zero signals accelerating bearish momentum; EMA5 falls below EMA8, turning bearish in the short term; KDJ bearish crossover; volume is normal.
════════════════════
🟢 $NATGAS 30-minute bearish signal
⚠️Technical analysis: 4-hour bearish confluence confirmed. 30-minute entry: MACD green bars continue to expand, bearish momentum is strengthening, and moving averages are bearishly aligned and diverging downward. Trading volume surged to 2.9 times the usual level. Multiple timeframes are aligned, and the trend is weak.
════════════════════
🔔 Follow to get the latest market updates 🔔
#多周期共振 #VIRTUAL #NATGAS
📌 When trading, pay attention to whether the candlestick patterns align.
26
·
--
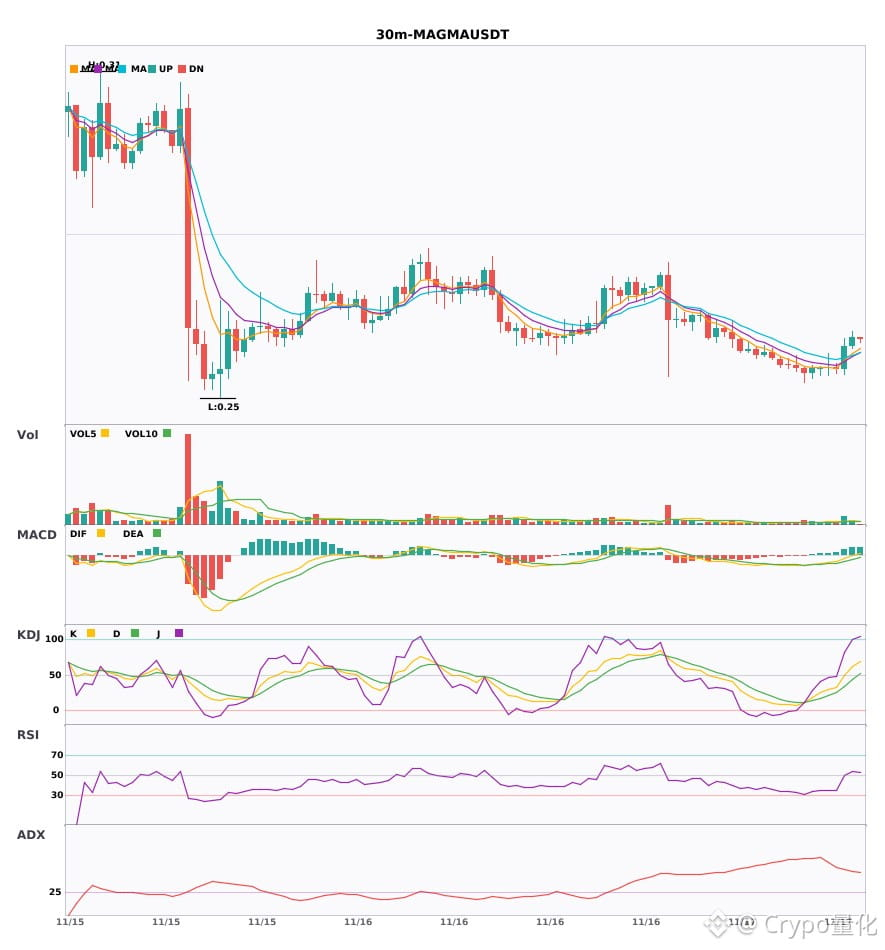
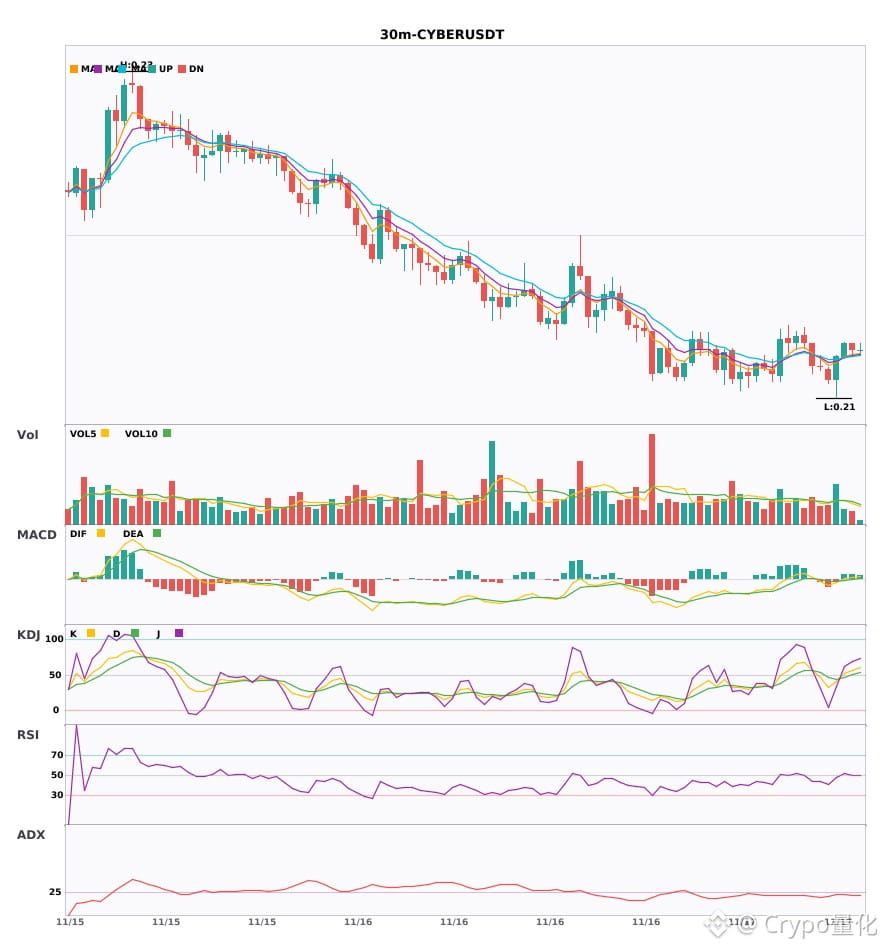
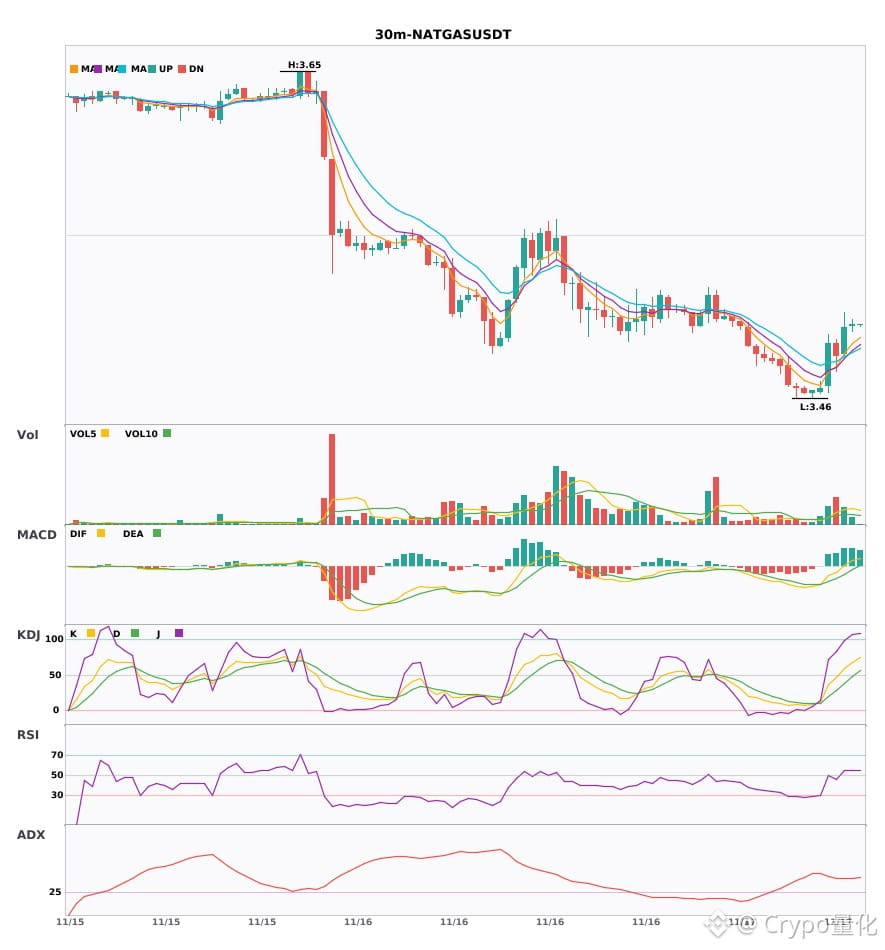
$MAGMA/$CYBER/$NATGAS 30-minute consensus bullish 🔥
════════════════════
🔴 $MAGMA 30-minute bullish signal
⚠️ Technicals: ADX surged to 50, indicating a very strong trend—watch for an overbought pullback; after the MACD bullish crossover, DIF moved above the zero line, turning bullish; the moving averages have just converged, so the market needs to pick a direction; volume surged to 2.7x.
════════════════════
🔴 $CYBER 30-minute bullish signal
⚠️ Technicals: The trend is forming, so you can participate | MACD bullish crossover on rising volume, with the red histogram bars expanding | Moving averages have just formed a bullish alignment and are trending upward | K crossed above D without entering overbought territory; short-term outlook is bullish | Volume up 1.7x
════════════════════
🔴 $NATGAS 30-minute bullish signal
⚠️ Technicals: ADX is as high as 46, indicating a very strong trend, but beware of an overbought pullback. After the MACD bullish crossover, the red histogram bars continue to expand, showing strengthening momentum. Moving averages are in a bullish alignment and spreading upward, with volume rising to 1.7x.
════════════════════
🔔 Follow for first-hand market movement alerts 🔔
#技术分析 #MAGMA #CYBER #NATGAS
📌 When trading, pay attention to whether the candlestick pattern confirms the setup
$MAGMA /$CYBER /$NATGAS 30-minute consensus bullish 🔥
════════════════════
🔴 $MAGMA 30-minute bullish signal
⚠️ Technicals: ADX surged to 50, indicating a very strong trend—watch for an overbought pullback; after the MACD bullish crossover, DIF moved above the zero line, turning bullish; the moving averages have just converged, so the market needs to pick a direction; volume surged to 2.7x.
════════════════════
🔴 $CYBER 30-minute bullish signal
⚠️ Technicals: The trend is forming, so you can participate | MACD bullish crossover on rising volume, with the red histogram bars expanding | Moving averages have just formed a bullish alignment and are trending upward | K crossed above D without entering overbought territory; short-term outlook is bullish | Volume up 1.7x
════════════════════
🔴 $NATGAS 30-minute bullish signal
⚠️ Technicals: ADX is as high as 46, indicating a very strong trend, but beware of an overbought pullback. After the MACD bullish crossover, the red histogram bars continue to expand, showing strengthening momentum. Moving averages are in a bullish alignment and spreading upward, with volume rising to 1.7x.
════════════════════
🔔 Follow for first-hand market movement alerts 🔔
#技术分析 #MAGMA #CYBER #NATGAS
📌 When trading, pay attention to whether the candlestick pattern confirms the setup
════════════════════
🔴 $MAGMA 30-minute bullish signal
⚠️ Technicals: ADX surged to 50, indicating a very strong trend—watch for an overbought pullback; after the MACD bullish crossover, DIF moved above the zero line, turning bullish; the moving averages have just converged, so the market needs to pick a direction; volume surged to 2.7x.
════════════════════
🔴 $CYBER 30-minute bullish signal
⚠️ Technicals: The trend is forming, so you can participate | MACD bullish crossover on rising volume, with the red histogram bars expanding | Moving averages have just formed a bullish alignment and are trending upward | K crossed above D without entering overbought territory; short-term outlook is bullish | Volume up 1.7x
════════════════════
🔴 $NATGAS 30-minute bullish signal
⚠️ Technicals: ADX is as high as 46, indicating a very strong trend, but beware of an overbought pullback. After the MACD bullish crossover, the red histogram bars continue to expand, showing strengthening momentum. Moving averages are in a bullish alignment and spreading upward, with volume rising to 1.7x.
════════════════════
🔔 Follow for first-hand market movement alerts 🔔
#技术分析 #MAGMA #CYBER #NATGAS
📌 When trading, pay attention to whether the candlestick pattern confirms the setup
21
Log in to explore more content
Join global crypto users on Binance Square
⚡️ Get latest and useful information about crypto.
💬 Trusted by the world’s largest crypto exchange.
👍 Discover real insights from verified creators.
Email / Phone number
Trending Topics
1
#NvidiaLoses$2.7TrillionInMonthAndAHalf
13,490 views
108 Discussing
2
#CanBTCReboundAfterFallingBelow60K?
705,696 views
2,893 Discussing
3
#GlobalStocksFaceLongestLosingStreakSince2023
253,881 views
1,948 Discussing
4
#BlackRockIBITPostsRecord$541MSingleDayOutflow
28,055 views
87 Discussing
5
#AnthropicPlungesTowardIPOPriceonDay2
128,180 views
1,180 Discussing
6
#TwentyOneCapitalAdds172.25BTC
57,809 views
643 Discussing
7
#HKBillWouldExcludeTokenizedDepositsFromVirtualAssets
6,943 views
49 Discussing
8
#BNBDropsBelow540USDTWith8.46%DailyDecline
70,998 views
629 Discussing
9
#HKBillProposesHK$100KFineForUnauthorizedCryptoTitles
2,397 views
22 Discussing
10
#BitMineFaces$10.1BUnrealizedETHLoss
4,779 views
26 Discussing