
#nbis
nbis
109,597 views
2,075 Discussing
Hot
Latest

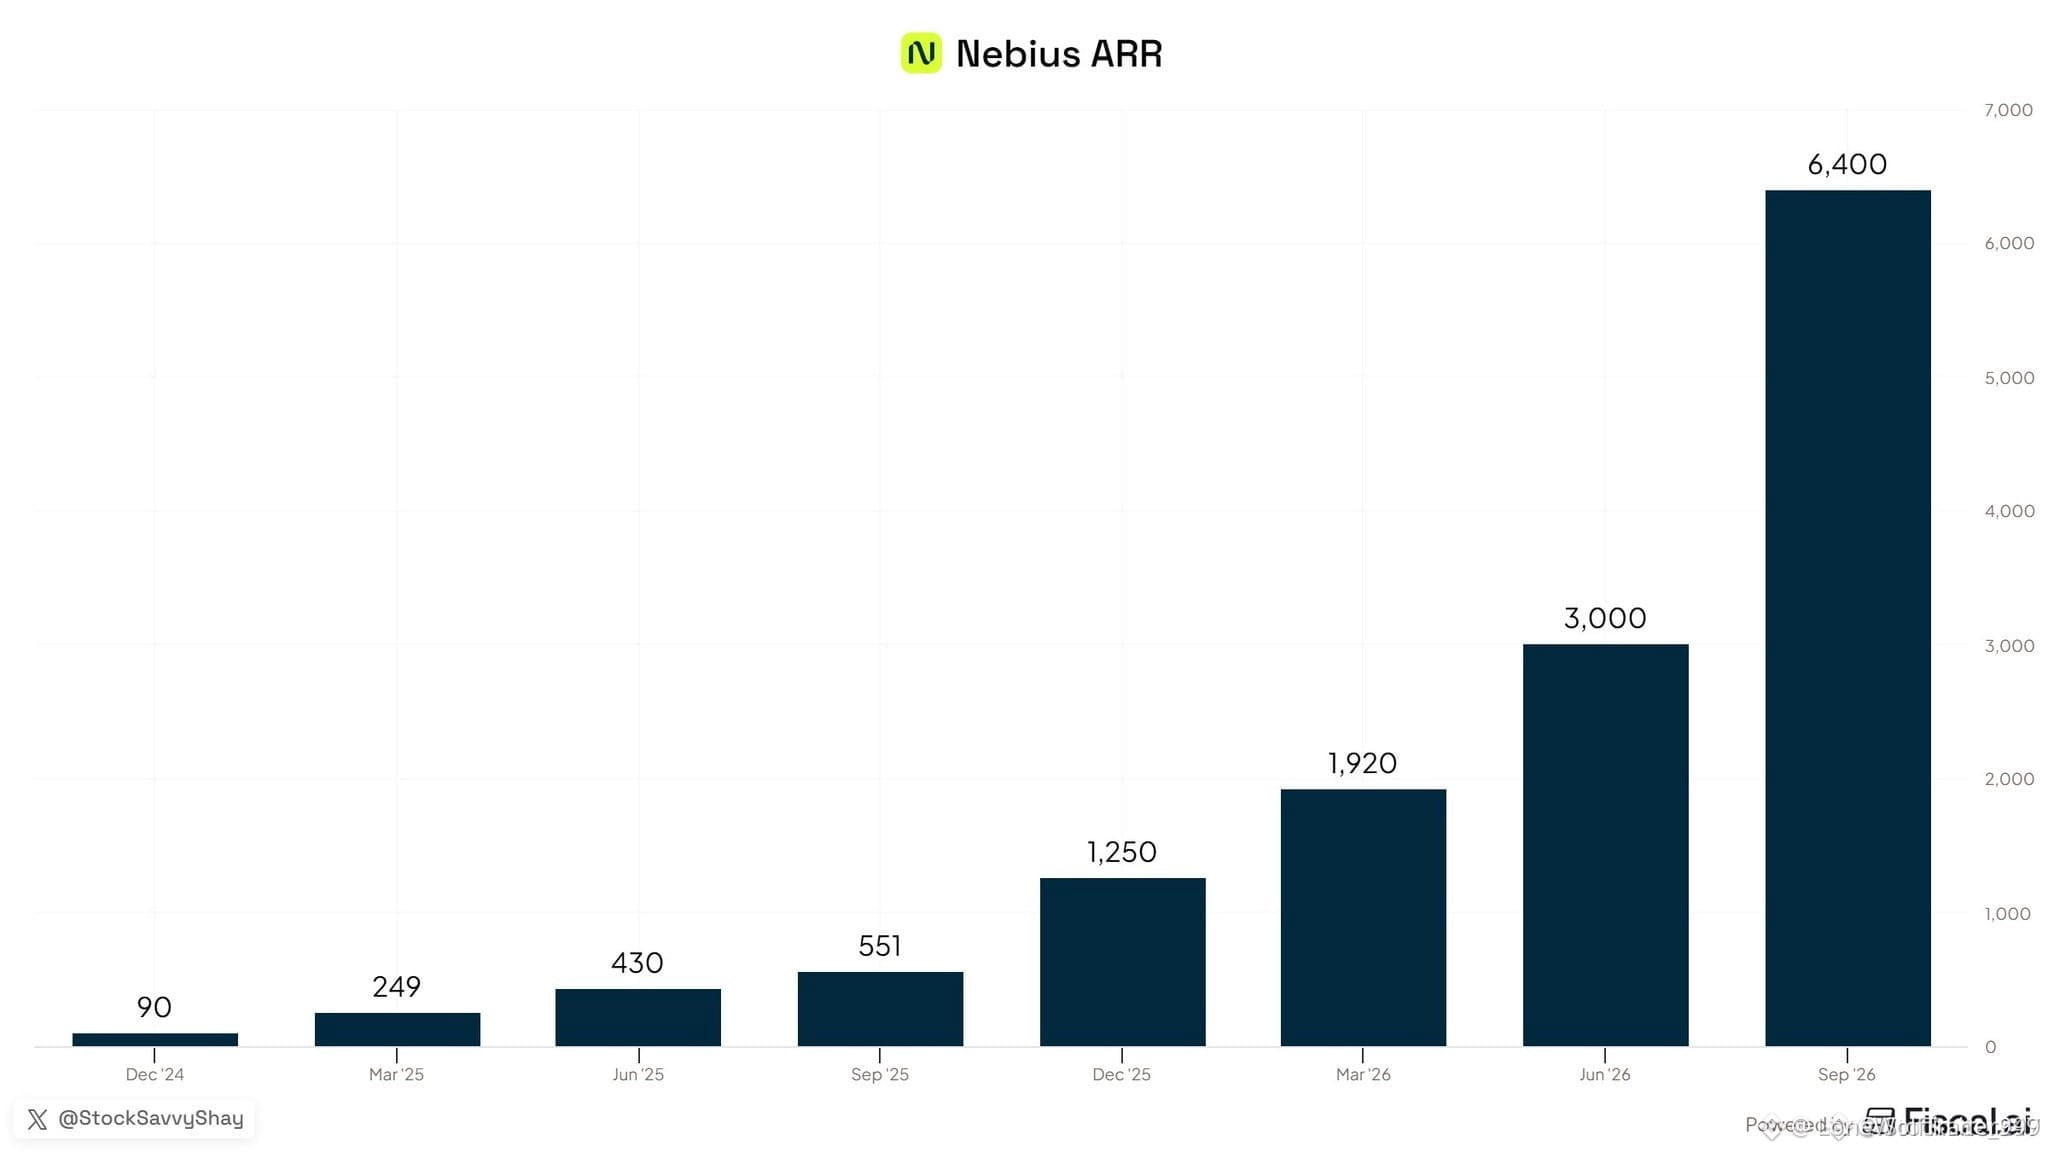
🦈 $NBIS IS SITTING AT A MISPRICED 4X ARR WHILE INSTITUTIONAL SMART MONEY ACCUMULATES QUIETLY ⚡
The market is entirely sleeping on a fundamental mismatch here as $NBIS trades at a modest four times annual recurring revenue while doubling its top-line growth last quarter alone. 📊
Token Factory expansion into inference and managed AI services gives them real utility infrastructure, backed heavily by Hopper GPUs recontracting at double their original rates. Add in $NVDA locking them in as an early Rubin customer, and this setup screams heavy accumulation before the broader retail crowd notices the valuation gap. ⚡
💬 Are you positioning ahead of the expansion wave or waiting for the breakout confirmation? 👇
⚠️ Not financial advice. Always manage your risk. 🛡️
🏷️ #NBIS #AI #Crypto #SmartMoney #Altcoins
🔥 💎
🦈 $NBIS IS SITTING AT A MISPRICED 4X ARR WHILE INSTITUTIONAL SMART MONEY ACCUMULATES QUIETLY ⚡
The market is entirely sleeping on a fundamental mismatch here as $NBIS trades at a modest four times annual recurring revenue while doubling its top-line growth last quarter alone. 📊
Token Factory expansion into inference and managed AI services gives them real utility infrastructure, backed heavily by Hopper GPUs recontracting at double their original rates. Add in $NVDA locking them in as an early Rubin customer, and this setup screams heavy accumulation before the broader retail crowd notices the valuation gap. ⚡
💬 Are you positioning ahead of the expansion wave or waiting for the breakout confirmation? 👇
⚠️ Not financial advice. Always manage your risk. 🛡️
🏷️ #NBIS #AI #Crypto #SmartMoney #Altcoins
🔥 💎
The market is entirely sleeping on a fundamental mismatch here as $NBIS trades at a modest four times annual recurring revenue while doubling its top-line growth last quarter alone. 📊
Token Factory expansion into inference and managed AI services gives them real utility infrastructure, backed heavily by Hopper GPUs recontracting at double their original rates. Add in $NVDA locking them in as an early Rubin customer, and this setup screams heavy accumulation before the broader retail crowd notices the valuation gap. ⚡
💬 Are you positioning ahead of the expansion wave or waiting for the breakout confirmation? 👇
⚠️ Not financial advice. Always manage your risk. 🛡️
🏷️ #NBIS #AI #Crypto #SmartMoney #Altcoins
🔥 💎
1

·
--
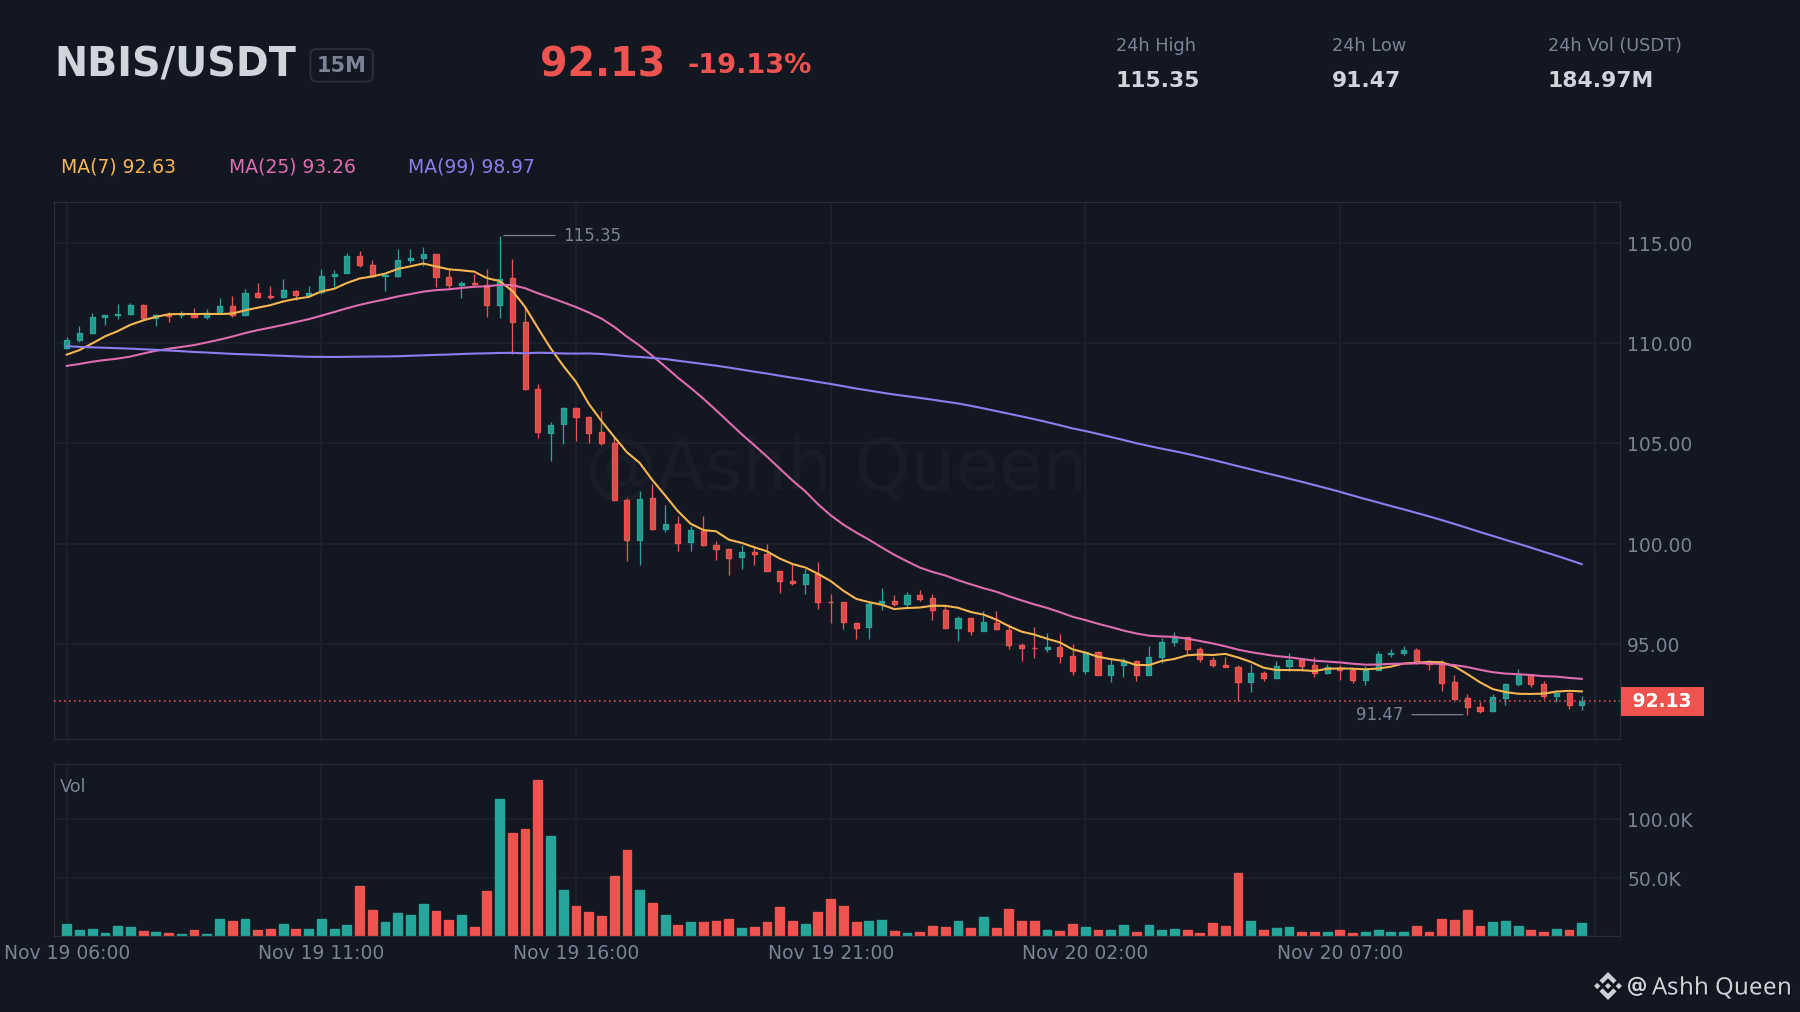
Is $NBIS finally losing its grip on support? 🔍
I’m leaning bearish on this perpetual contract. Sellers are firmly in control, and the lack of upward momentum is evident with the RSI at 40.41.
Next stop: a breakdown below support at 91.47.
I’m wrong if: price flips resistance at 94.69. 💡
What is your read?
#NBIS #USStocks #MarketUpdate #BinanceSquare
⚠️ Perpetual contracts are leveraged derivatives, not the stock or commodity itself.
This is analysis, not a recommendation. Manage risk first, profit second.
Is $NBIS finally losing its grip on support? 🔍
I’m leaning bearish on this perpetual contract. Sellers are firmly in control, and the lack of upward momentum is evident with the RSI at 40.41.
Next stop: a breakdown below support at 91.47.
I’m wrong if: price flips resistance at 94.69. 💡
What is your read?
#NBIS #USStocks #MarketUpdate #BinanceSquare
⚠️ Perpetual contracts are leveraged derivatives, not the stock or commodity itself.
This is analysis, not a recommendation. Manage risk first, profit second.
I’m leaning bearish on this perpetual contract. Sellers are firmly in control, and the lack of upward momentum is evident with the RSI at 40.41.
Next stop: a breakdown below support at 91.47.
I’m wrong if: price flips resistance at 94.69. 💡
What is your read?
#NBIS #USStocks #MarketUpdate #BinanceSquare
⚠️ Perpetual contracts are leveraged derivatives, not the stock or commodity itself.
This is analysis, not a recommendation. Manage risk first, profit second.
🚨 WHY IS EVERYONE FIXATED ON $NBIS AND $CRWV WHILE THE ENTIRE TAPE BLEEDS? 📉
The narrative machine is working overtime, pinning all attention on $NBIS and $CRWV after a couple of high-profile shorts. Meanwhile, the broader tape has shed over six trillion in valuation since October with major indexes taking heavy beatdowns. 📊
Singling out two charts while the entire macro landscape corrects is textbook selective outrage. Every major correction flushes weak hands across every asset class, but seasoned market participants know this is just standard cycle mechanics. 💡
💬 Are you getting distracted by social media noise, or are you zooming out to trade the macro reality? 👇
⚠️ Not financial advice. Always manage your risk. 🛡️
🏷️ #NBIS #CRWV #Macro #MarketCorrection #TradingPsychology
🔥 💎
🚨 WHY IS EVERYONE FIXATED ON $NBIS AND $CRWV WHILE THE ENTIRE TAPE BLEEDS? 📉
The narrative machine is working overtime, pinning all attention on $NBIS and $CRWV after a couple of high-profile shorts. Meanwhile, the broader tape has shed over six trillion in valuation since October with major indexes taking heavy beatdowns. 📊
Singling out two charts while the entire macro landscape corrects is textbook selective outrage. Every major correction flushes weak hands across every asset class, but seasoned market participants know this is just standard cycle mechanics. 💡
💬 Are you getting distracted by social media noise, or are you zooming out to trade the macro reality? 👇
⚠️ Not financial advice. Always manage your risk. 🛡️
🏷️ #NBIS #CRWV #Macro #MarketCorrection #TradingPsychology
🔥 💎
The narrative machine is working overtime, pinning all attention on $NBIS and $CRWV after a couple of high-profile shorts. Meanwhile, the broader tape has shed over six trillion in valuation since October with major indexes taking heavy beatdowns. 📊
Singling out two charts while the entire macro landscape corrects is textbook selective outrage. Every major correction flushes weak hands across every asset class, but seasoned market participants know this is just standard cycle mechanics. 💡
💬 Are you getting distracted by social media noise, or are you zooming out to trade the macro reality? 👇
⚠️ Not financial advice. Always manage your risk. 🛡️
🏷️ #NBIS #CRWV #Macro #MarketCorrection #TradingPsychology
🔥 💎
3
·
--
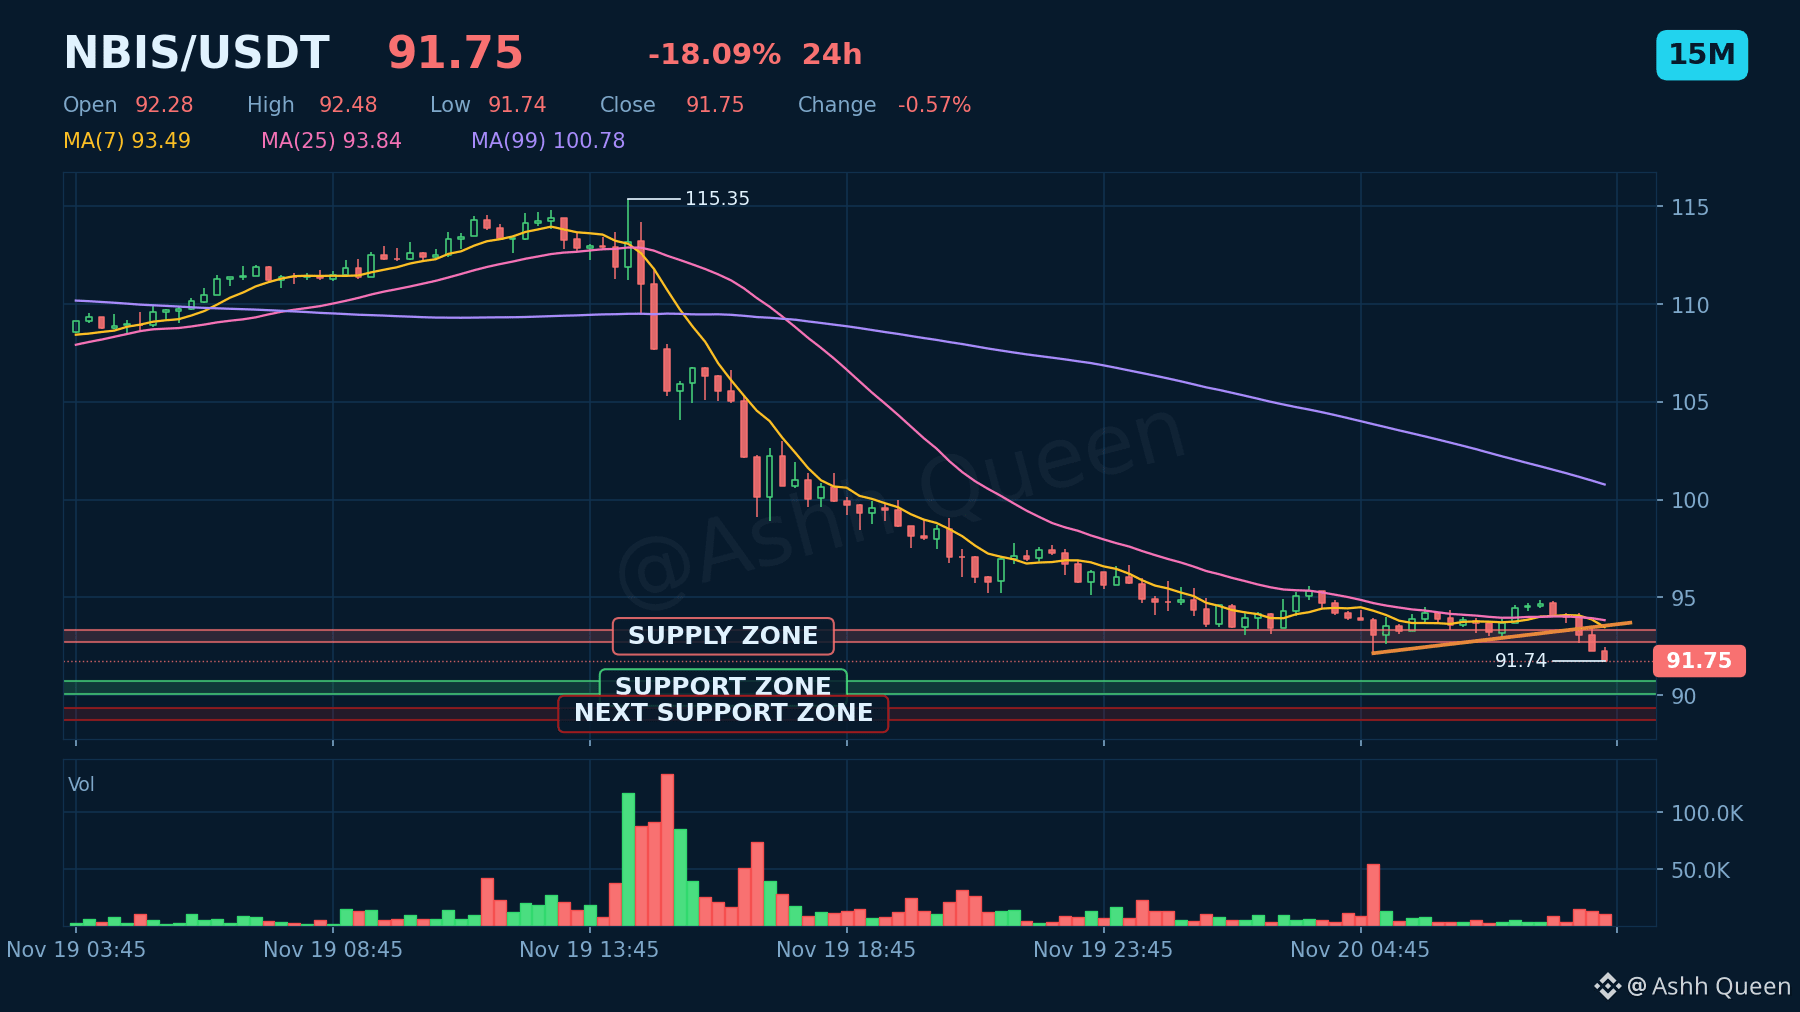
Most expect a bounce for $NBIS, but the data tells a sharper story.
We saw a move of -2.36% in the last hour for this perpetual contract. Price is now at 91.76, failing to reclaim support at 90.40. ⚠️
If this level breaks, look toward support2 at 89.04. 🧐
What is your read on this trend?
#NBIS #Stocks #Volatility
⚠️ Perpetual contracts are leveraged derivatives, not the stock or commodity itself.
DYOR. Size positions carefully and never trade with money you cannot afford to lose.
Most expect a bounce for $NBIS , but the data tells a sharper story.
We saw a move of -2.36% in the last hour for this perpetual contract. Price is now at 91.76, failing to reclaim support at 90.40. ⚠️
If this level breaks, look toward support2 at 89.04. 🧐
What is your read on this trend?
#NBIS #Stocks #Volatility
⚠️ Perpetual contracts are leveraged derivatives, not the stock or commodity itself.
DYOR. Size positions carefully and never trade with money you cannot afford to lose.
We saw a move of -2.36% in the last hour for this perpetual contract. Price is now at 91.76, failing to reclaim support at 90.40. ⚠️
If this level breaks, look toward support2 at 89.04. 🧐
What is your read on this trend?
#NBIS #Stocks #Volatility
⚠️ Perpetual contracts are leveraged derivatives, not the stock or commodity itself.
DYOR. Size positions carefully and never trade with money you cannot afford to lose.

·
--
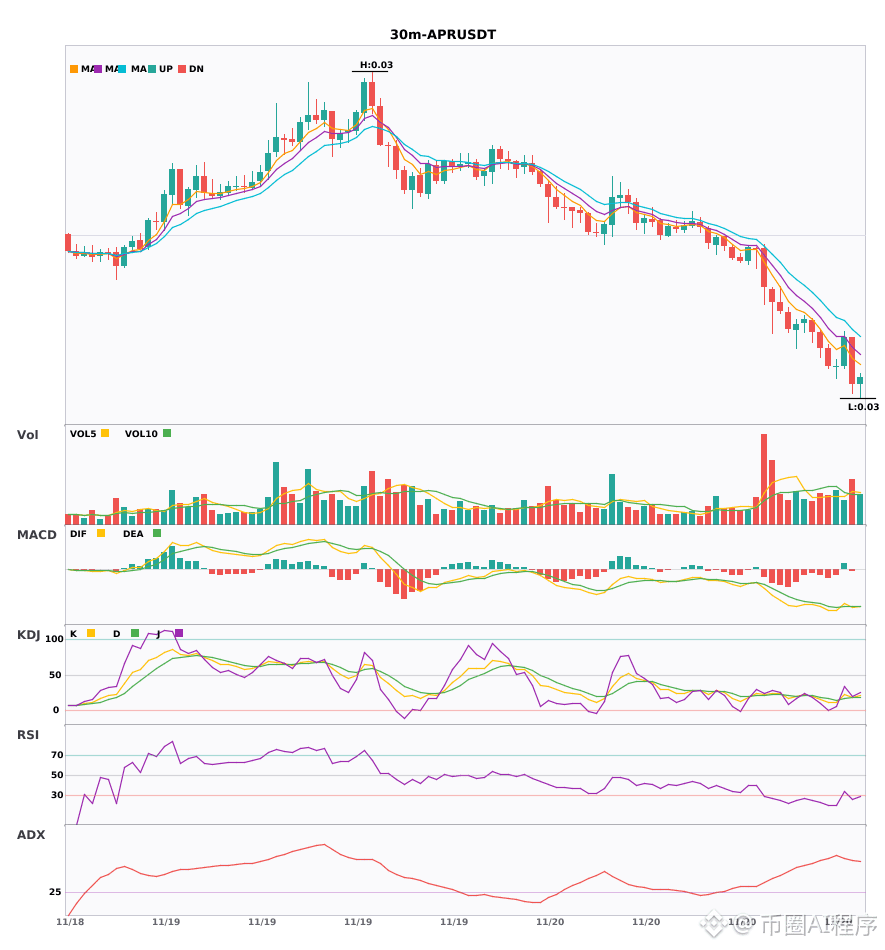
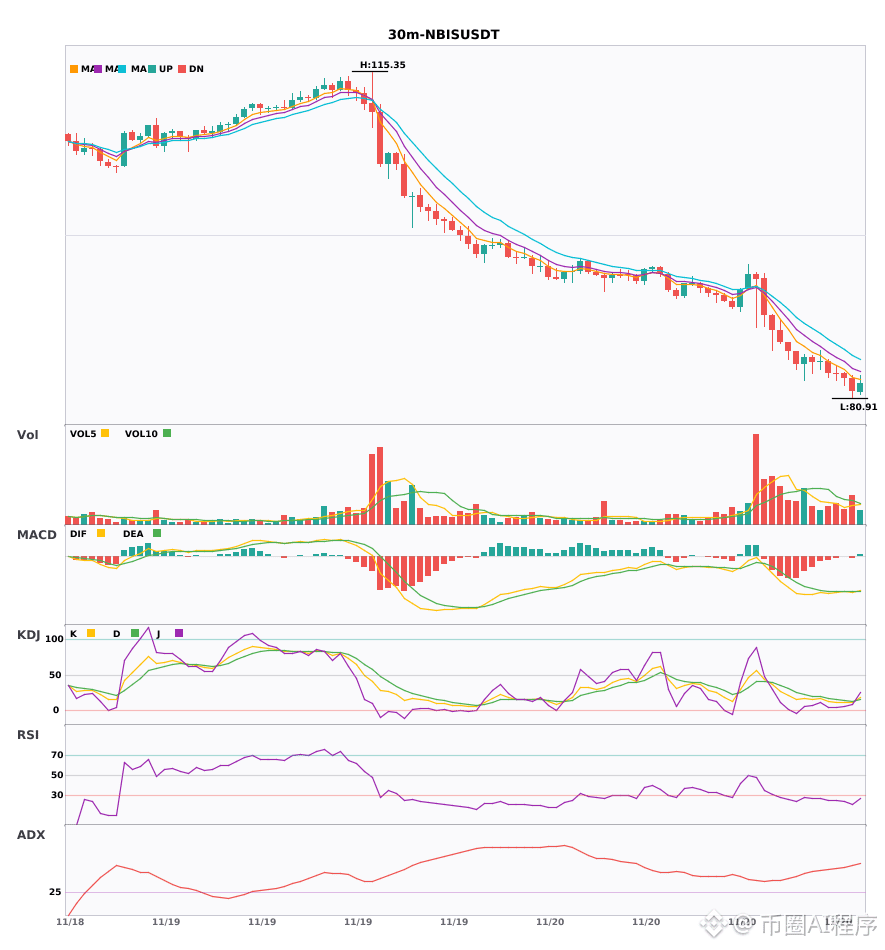
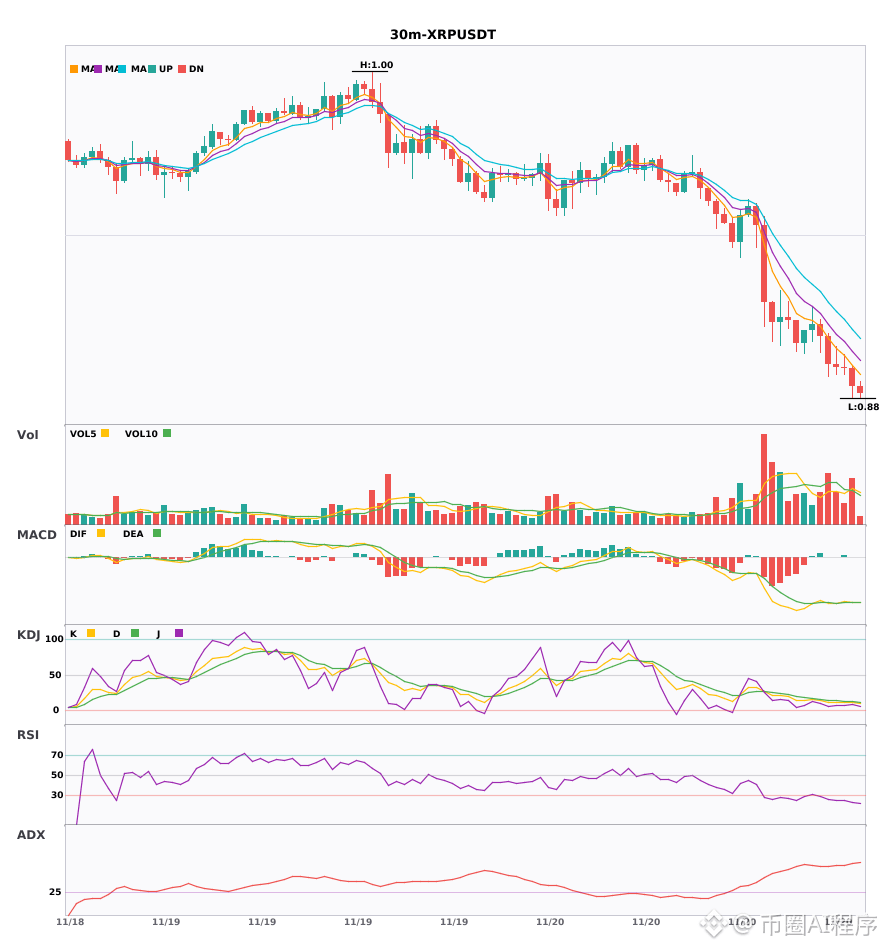
$APR/$NBIS/$XRP 30-minute weakness, 4-hour bearish confluence 🔥
════════════════════
🟢 $APR 30-minute bearish signal
⚠️ Technical analysis: 4-hour bearish confluence confirms the 30-minute short signal: MACD bearish crossover, with green bars expanding; moving averages are bearishly aligned and diverging downward; KDJ is in oversold territory (K at 18.5), so beware of a rebound. Volume is 1.5x normal.
📢 Market update: MyShell (SHELL) airdrop ongoing: Binance's second-round HODLer airdrop is live. Hold BNB in Simple Earn at the snapshot to receive SHELL; SHELL locked products offer an annualized yield of up to 29.9%.
════════════════════
🟢 $NBIS 30-minute bearish signal
⚠️ Technical analysis: 4-hour bearish confluence confirmed | 30-minute entry; MACD bearish crossover with expanding green bars, accelerating bearish momentum | Moving averages bearishly aligned and trending downward | KDJ in oversold territory; watch for a rebound | Volume is normal, at 1.2x
════════════════════
🟢 $XRP 30-minute bearish signal
⚠️ Technical analysis: 4-hour and 30-minute bearish confluence confirmed; MACD bearish crossover on rising volume, with green bars continuing to expand; moving averages are bearishly aligned and diverging downward; KDJ is in oversold territory (K 11.4 / D 12.4)—watch for a rebound.
════════════════════
🔔 Follow for first-hand market alerts 🔔
#多周期共振 #APR #NBIS #XRP
📌 When trading, pay attention to whether the candlestick pattern meets the criteria
$APR /$NBIS /$XRP 30-minute weakness, 4-hour bearish confluence 🔥
════════════════════
🟢 $APR 30-minute bearish signal
⚠️ Technical analysis: 4-hour bearish confluence confirms the 30-minute short signal: MACD bearish crossover, with green bars expanding; moving averages are bearishly aligned and diverging downward; KDJ is in oversold territory (K at 18.5), so beware of a rebound. Volume is 1.5x normal.
📢 Market update: MyShell (SHELL) airdrop ongoing: Binance's second-round HODLer airdrop is live. Hold BNB in Simple Earn at the snapshot to receive SHELL; SHELL locked products offer an annualized yield of up to 29.9%.
════════════════════
🟢 $NBIS 30-minute bearish signal
⚠️ Technical analysis: 4-hour bearish confluence confirmed | 30-minute entry; MACD bearish crossover with expanding green bars, accelerating bearish momentum | Moving averages bearishly aligned and trending downward | KDJ in oversold territory; watch for a rebound | Volume is normal, at 1.2x
════════════════════
🟢 $XRP 30-minute bearish signal
⚠️ Technical analysis: 4-hour and 30-minute bearish confluence confirmed; MACD bearish crossover on rising volume, with green bars continuing to expand; moving averages are bearishly aligned and diverging downward; KDJ is in oversold territory (K 11.4 / D 12.4)—watch for a rebound.
════════════════════
🔔 Follow for first-hand market alerts 🔔
#多周期共振 #APR #NBIS #XRP
📌 When trading, pay attention to whether the candlestick pattern meets the criteria
════════════════════
🟢 $APR 30-minute bearish signal
⚠️ Technical analysis: 4-hour bearish confluence confirms the 30-minute short signal: MACD bearish crossover, with green bars expanding; moving averages are bearishly aligned and diverging downward; KDJ is in oversold territory (K at 18.5), so beware of a rebound. Volume is 1.5x normal.
📢 Market update: MyShell (SHELL) airdrop ongoing: Binance's second-round HODLer airdrop is live. Hold BNB in Simple Earn at the snapshot to receive SHELL; SHELL locked products offer an annualized yield of up to 29.9%.
════════════════════
🟢 $NBIS 30-minute bearish signal
⚠️ Technical analysis: 4-hour bearish confluence confirmed | 30-minute entry; MACD bearish crossover with expanding green bars, accelerating bearish momentum | Moving averages bearishly aligned and trending downward | KDJ in oversold territory; watch for a rebound | Volume is normal, at 1.2x
════════════════════
🟢 $XRP 30-minute bearish signal
⚠️ Technical analysis: 4-hour and 30-minute bearish confluence confirmed; MACD bearish crossover on rising volume, with green bars continuing to expand; moving averages are bearishly aligned and diverging downward; KDJ is in oversold territory (K 11.4 / D 12.4)—watch for a rebound.
════════════════════
🔔 Follow for first-hand market alerts 🔔
#多周期共振 #APR #NBIS #XRP
📌 When trading, pay attention to whether the candlestick pattern meets the criteria
6

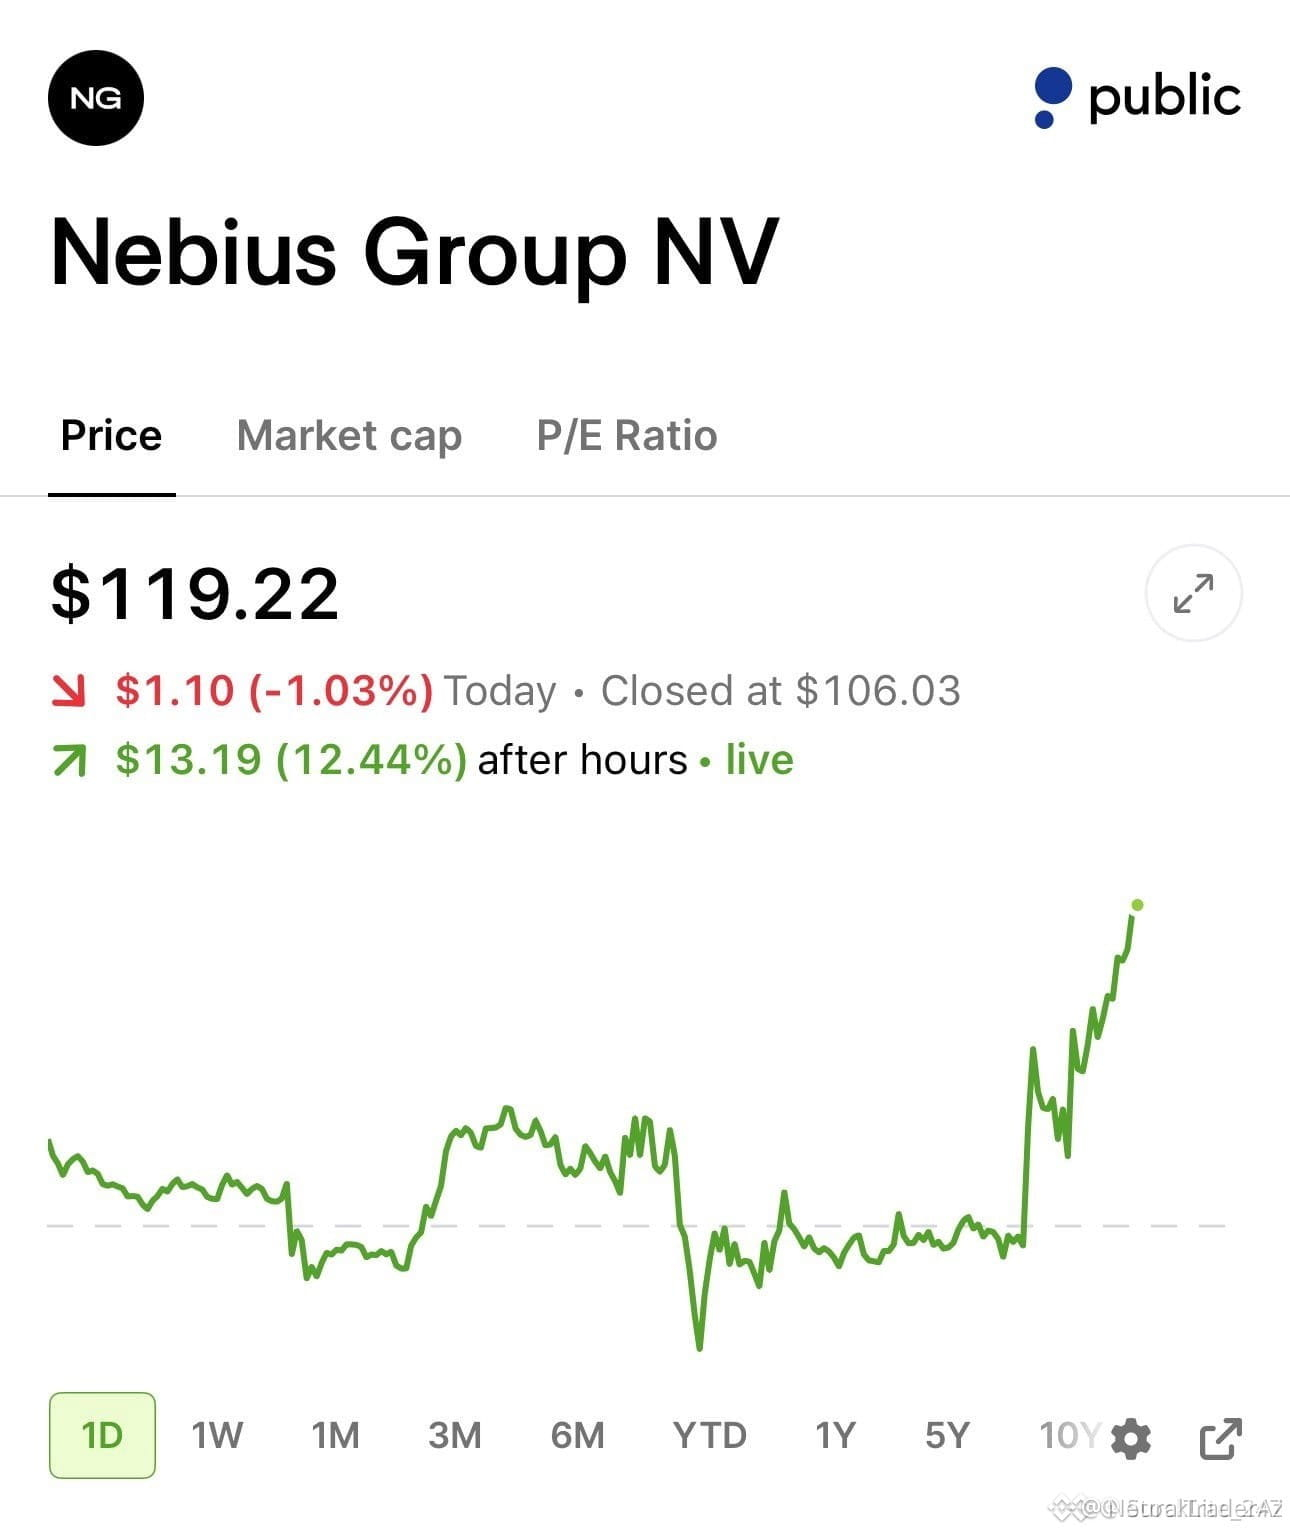
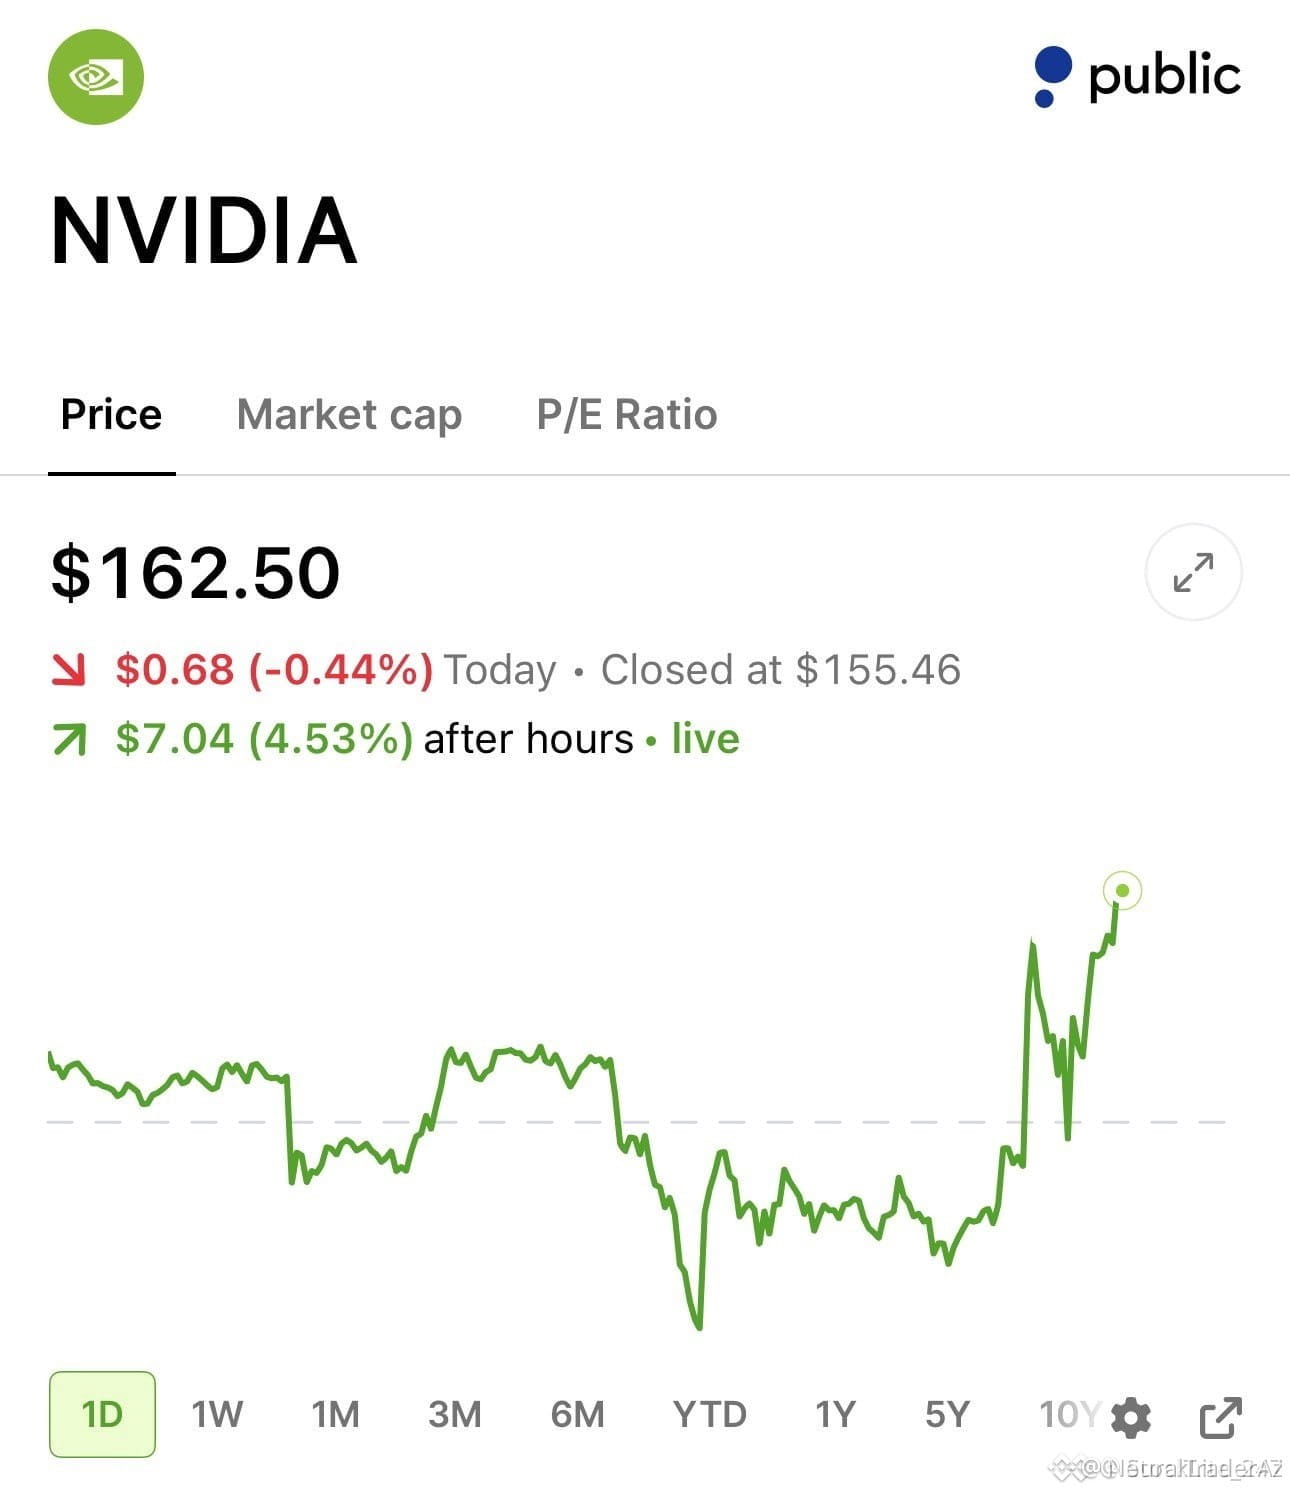
🚨 $NBIS SURGES 12% AS INSTITUTIONAL DEMAND FOR NEOCLOUD COMPUTE ACCELERATES! 💥
The structural narrative around infrastructure plays is shifting rapidly as $NVDA confirms Hopper recontracting at twice original rates and B300 utilization climbs 60 percent. 📊 This completely dismantles the legacy depreciation bear case, revealing fierce institutional accumulation across tight capacity. 💡
With secured power grids, cheap capital financing, and locked-in offtake agreements, $NBIS is positioned exceptionally well to capture outsized value during the upcoming Rubin ramp. ⚡ Are you positioning ahead of this structural revaluation or waiting for a deeper liquidity retracement? 🤔
⚠️ Not financial advice. Always manage your risk. 🛡️
🏷️ #NBIS #NVDA #SmartMoney #Infrastructure #Crypto
🔥 💎
🚨 $NBIS SURGES 12% AS INSTITUTIONAL DEMAND FOR NEOCLOUD COMPUTE ACCELERATES! 💥
The structural narrative around infrastructure plays is shifting rapidly as $NVDA confirms Hopper recontracting at twice original rates and B300 utilization climbs 60 percent. 📊 This completely dismantles the legacy depreciation bear case, revealing fierce institutional accumulation across tight capacity. 💡
With secured power grids, cheap capital financing, and locked-in offtake agreements, $NBIS is positioned exceptionally well to capture outsized value during the upcoming Rubin ramp. ⚡ Are you positioning ahead of this structural revaluation or waiting for a deeper liquidity retracement? 🤔
⚠️ Not financial advice. Always manage your risk. 🛡️
🏷️ #NBIS #NVDA #SmartMoney #Infrastructure #Crypto
🔥 💎
The structural narrative around infrastructure plays is shifting rapidly as $NVDA confirms Hopper recontracting at twice original rates and B300 utilization climbs 60 percent. 📊 This completely dismantles the legacy depreciation bear case, revealing fierce institutional accumulation across tight capacity. 💡
With secured power grids, cheap capital financing, and locked-in offtake agreements, $NBIS is positioned exceptionally well to capture outsized value during the upcoming Rubin ramp. ⚡ Are you positioning ahead of this structural revaluation or waiting for a deeper liquidity retracement? 🤔
⚠️ Not financial advice. Always manage your risk. 🛡️
🏷️ #NBIS #NVDA #SmartMoney #Infrastructure #Crypto
🔥 💎
17

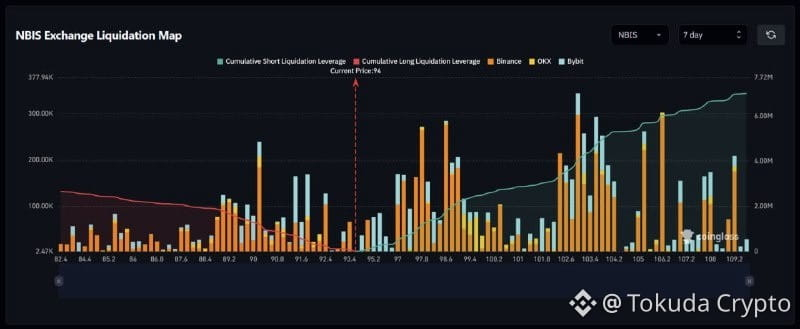
Beware the $NBIS liquidation trap! The 7-day heatmap around 94 clearly shows a possible short squeeze across 94.5–95.4 before reaching 97–99. Further up, the biggest short cluster is waiting at 103.2. On the other hand, if it breaks below 93.4, watch out for a fleet of longs drifting toward 90.0–90.4.
Who do you think will get “fleeced” first in this move—the bulls or the bears?
#NBIS #BinanceSquare #CryptoTrading #LiquidationMap
Beware the $NBIS liquidation trap! The 7-day heatmap around 94 clearly shows a possible short squeeze across 94.5–95.4 before reaching 97–99. Further up, the biggest short cluster is waiting at 103.2. On the other hand, if it breaks below 93.4, watch out for a fleet of longs drifting toward 90.0–90.4.
Who do you think will get “fleeced” first in this move—the bulls or the bears?
#NBIS #BinanceSquare #CryptoTrading #LiquidationMap
Who do you think will get “fleeced” first in this move—the bulls or the bears?
#NBIS #BinanceSquare #CryptoTrading #LiquidationMap
2

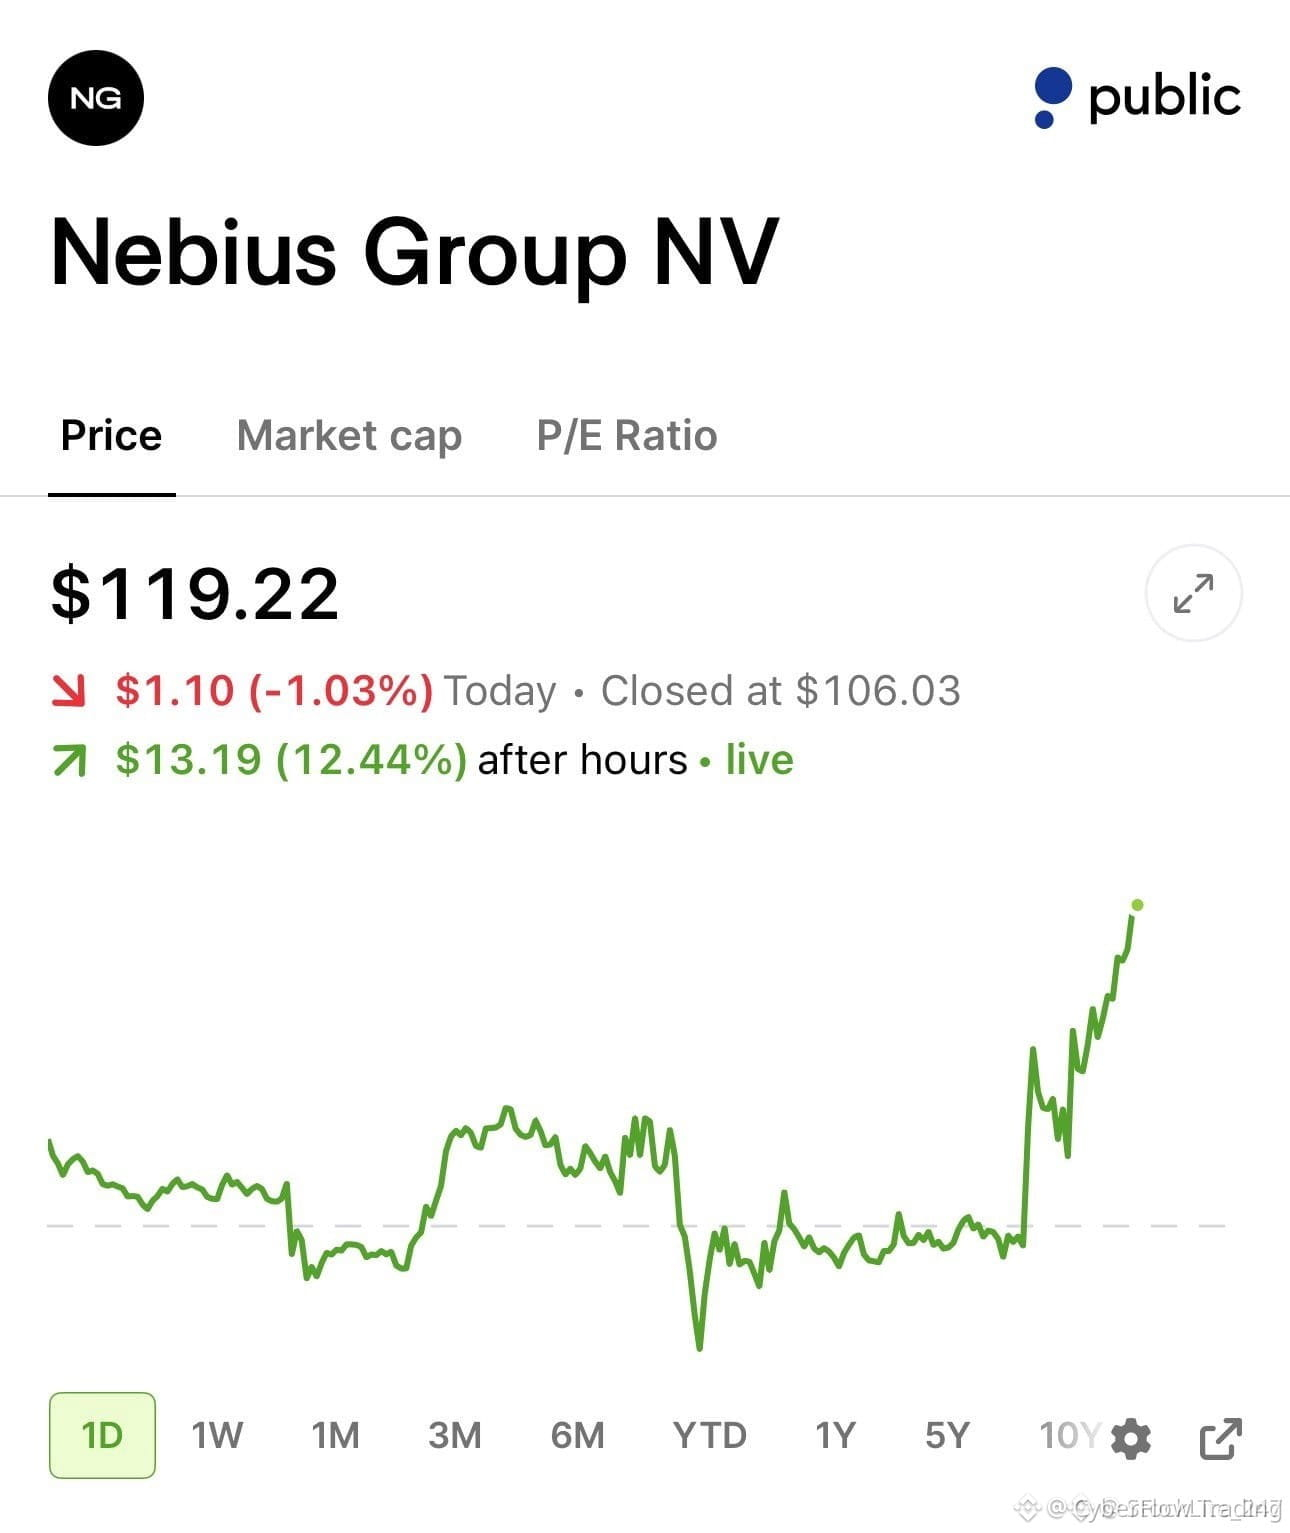
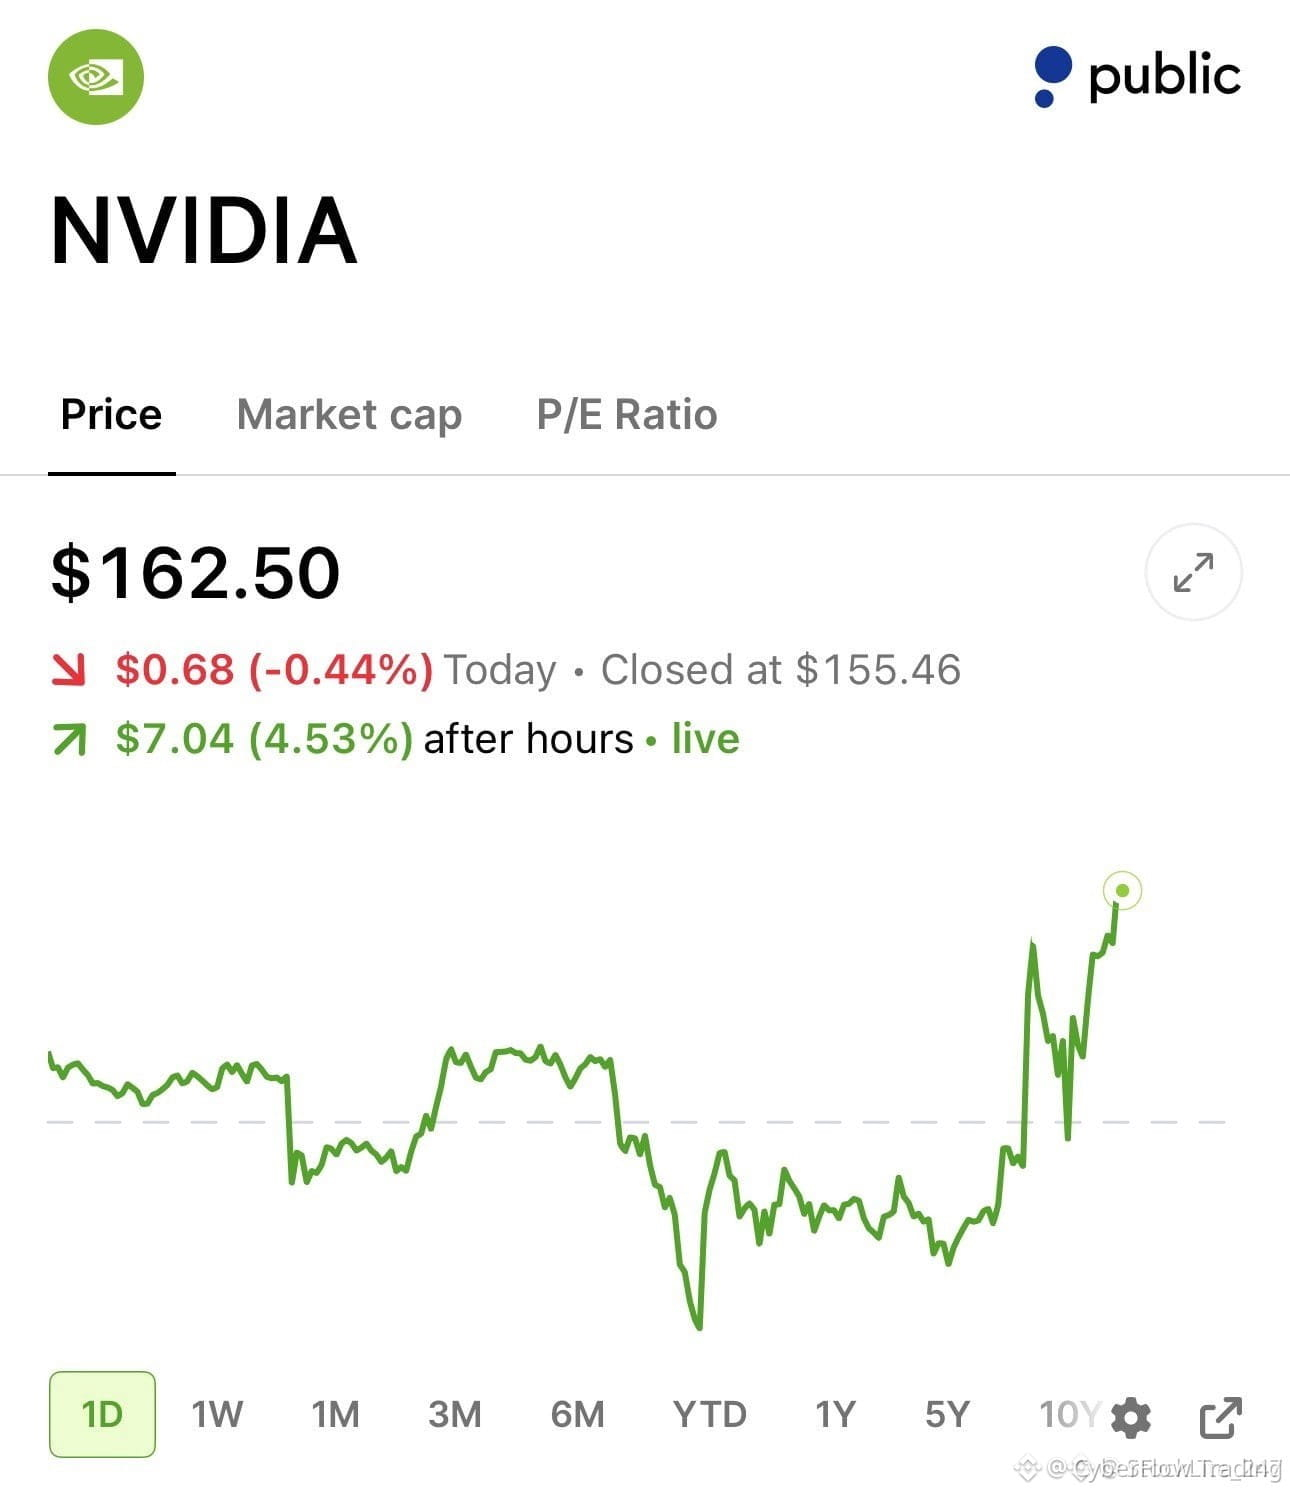
🚀 $NBIS IGNITES AS HARDWARE DEMAND CRUSHES THE BEARISH DEPRECIATION NARRATIVE! 🔥
The structural supply squeeze in enterprise hardware is rewriting the playbook for $NBIS and $NVDA ecosystem plays. With major partners locking in recontracts at double original pricing and next-gen chips commanding massive premiums, the outdated depreciation panic is officially dead on arrival. ⚡
This isn't just a routine bounce; it is a fundamental re-rating driven by secured power grids, cheap capital, and locked-in offtake. As allocation scarcity tightens across top-tier facilities, infrastructure leaders are capturing outsized value. 📊
Are you positioning ahead of the upcoming Rubin cycle, or waiting for a pullback that may never materialize? 👇
⚠️ Not financial advice. Always manage your risk. 🛡️
🏷️ #NBIS #NVDA #Breakout #Crypto
🔥 💎
🚀 $NBIS IGNITES AS HARDWARE DEMAND CRUSHES THE BEARISH DEPRECIATION NARRATIVE! 🔥
The structural supply squeeze in enterprise hardware is rewriting the playbook for $NBIS and $NVDA ecosystem plays. With major partners locking in recontracts at double original pricing and next-gen chips commanding massive premiums, the outdated depreciation panic is officially dead on arrival. ⚡
This isn't just a routine bounce; it is a fundamental re-rating driven by secured power grids, cheap capital, and locked-in offtake. As allocation scarcity tightens across top-tier facilities, infrastructure leaders are capturing outsized value. 📊
Are you positioning ahead of the upcoming Rubin cycle, or waiting for a pullback that may never materialize? 👇
⚠️ Not financial advice. Always manage your risk. 🛡️
🏷️ #NBIS #NVDA #Breakout #Crypto
🔥 💎
The structural supply squeeze in enterprise hardware is rewriting the playbook for $NBIS and $NVDA ecosystem plays. With major partners locking in recontracts at double original pricing and next-gen chips commanding massive premiums, the outdated depreciation panic is officially dead on arrival. ⚡
This isn't just a routine bounce; it is a fundamental re-rating driven by secured power grids, cheap capital, and locked-in offtake. As allocation scarcity tightens across top-tier facilities, infrastructure leaders are capturing outsized value. 📊
Are you positioning ahead of the upcoming Rubin cycle, or waiting for a pullback that may never materialize? 👇
⚠️ Not financial advice. Always manage your risk. 🛡️
🏷️ #NBIS #NVDA #Breakout #Crypto
🔥 💎
14

·
--
#NBIS $NBIS 🔴 NBIS-4-hour – Trend-following short
• Real-time price: 98.63
• Signal type: MiX trend signal
• Instrument: Nebius stock
SunspotAlgo @ 04:00:06 UTC+8
#NBIS $NBIS 🔴 NBIS-4-hour – Trend-following short
• Real-time price: 98.63
• Signal type: MiX trend signal
• Instrument: Nebius stock
SunspotAlgo @ 04:00:06 UTC+8
• Real-time price: 98.63
• Signal type: MiX trend signal
• Instrument: Nebius stock
SunspotAlgo @ 04:00:06 UTC+8
16

·
--
NBIS is down 8.20% over 24 hours, while long accounts still account for 70% and the funding rate remains at +0.0268%.
Binance TradFi Perpetuals (traditional finance assets; high gap risk outside trading hours) | NBIS remains weak intraday; any recovery first depends on whether selling pressure eases. At 2026-11-20 03:45:04 Beijing time, the price was about 99.45 (30m indicators use the 03:30 closing candle), with 24h trading volume of about 180 million; the 30m volume ratio was just 0.4x, indicating weak participation. Flows: long accounts at 70%; taker buy/sell ratio 0.93 (taker activity is close to balanced); funding rate +0.0268%.
Reference indicators: The 30m RSI is 11.81, deep in oversold territory, suggesting short-term panic is already elevated; the 30m ATR trend band reference level is 106.380613. The price is below it, indicating a weak structure; watch whether it can move back above this level.
The order book needs to answer two questions: Can the taker buy/sell ratio hold above 1.10, and can the 30m RSI climb back above 30? A recovery looks plausible only if both hold; if only one does, the market remains weak and choppy.
#NBIS #Unusual Movement Alert
NBIS is down 8.20% over 24 hours, while long accounts still account for 70% and the funding rate remains at +0.0268%.
Binance TradFi Perpetuals (traditional finance assets; high gap risk outside trading hours) | NBIS remains weak intraday; any recovery first depends on whether selling pressure eases. At 2026-11-20 03:45:04 Beijing time, the price was about 99.45 (30m indicators use the 03:30 closing candle), with 24h trading volume of about 180 million; the 30m volume ratio was just 0.4x, indicating weak participation. Flows: long accounts at 70%; taker buy/sell ratio 0.93 (taker activity is close to balanced); funding rate +0.0268%.
Reference indicators: The 30m RSI is 11.81, deep in oversold territory, suggesting short-term panic is already elevated; the 30m ATR trend band reference level is 106.380613. The price is below it, indicating a weak structure; watch whether it can move back above this level.
The order book needs to answer two questions: Can the taker buy/sell ratio hold above 1.10, and can the 30m RSI climb back above 30? A recovery looks plausible only if both hold; if only one does, the market remains weak and choppy.
#NBIS #Unusual Movement Alert
Binance TradFi Perpetuals (traditional finance assets; high gap risk outside trading hours) | NBIS remains weak intraday; any recovery first depends on whether selling pressure eases. At 2026-11-20 03:45:04 Beijing time, the price was about 99.45 (30m indicators use the 03:30 closing candle), with 24h trading volume of about 180 million; the 30m volume ratio was just 0.4x, indicating weak participation. Flows: long accounts at 70%; taker buy/sell ratio 0.93 (taker activity is close to balanced); funding rate +0.0268%.
Reference indicators: The 30m RSI is 11.81, deep in oversold territory, suggesting short-term panic is already elevated; the 30m ATR trend band reference level is 106.380613. The price is below it, indicating a weak structure; watch whether it can move back above this level.
The order book needs to answer two questions: Can the taker buy/sell ratio hold above 1.10, and can the 30m RSI climb back above 30? A recovery looks plausible only if both hold; if only one does, the market remains weak and choppy.
#NBIS #Unusual Movement Alert
4

·
--
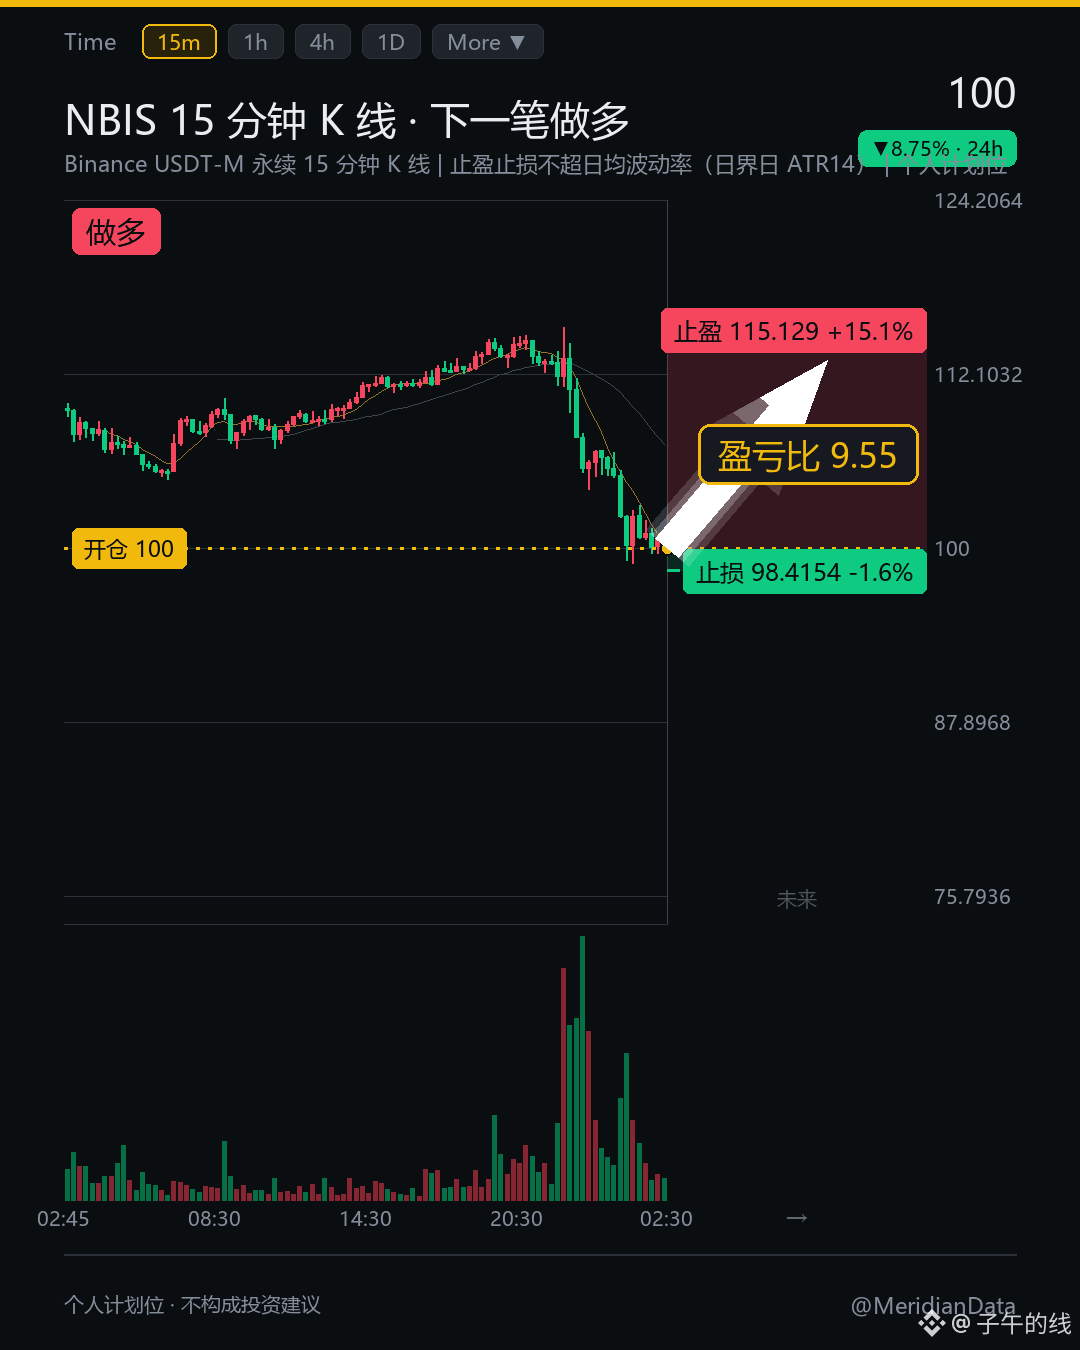
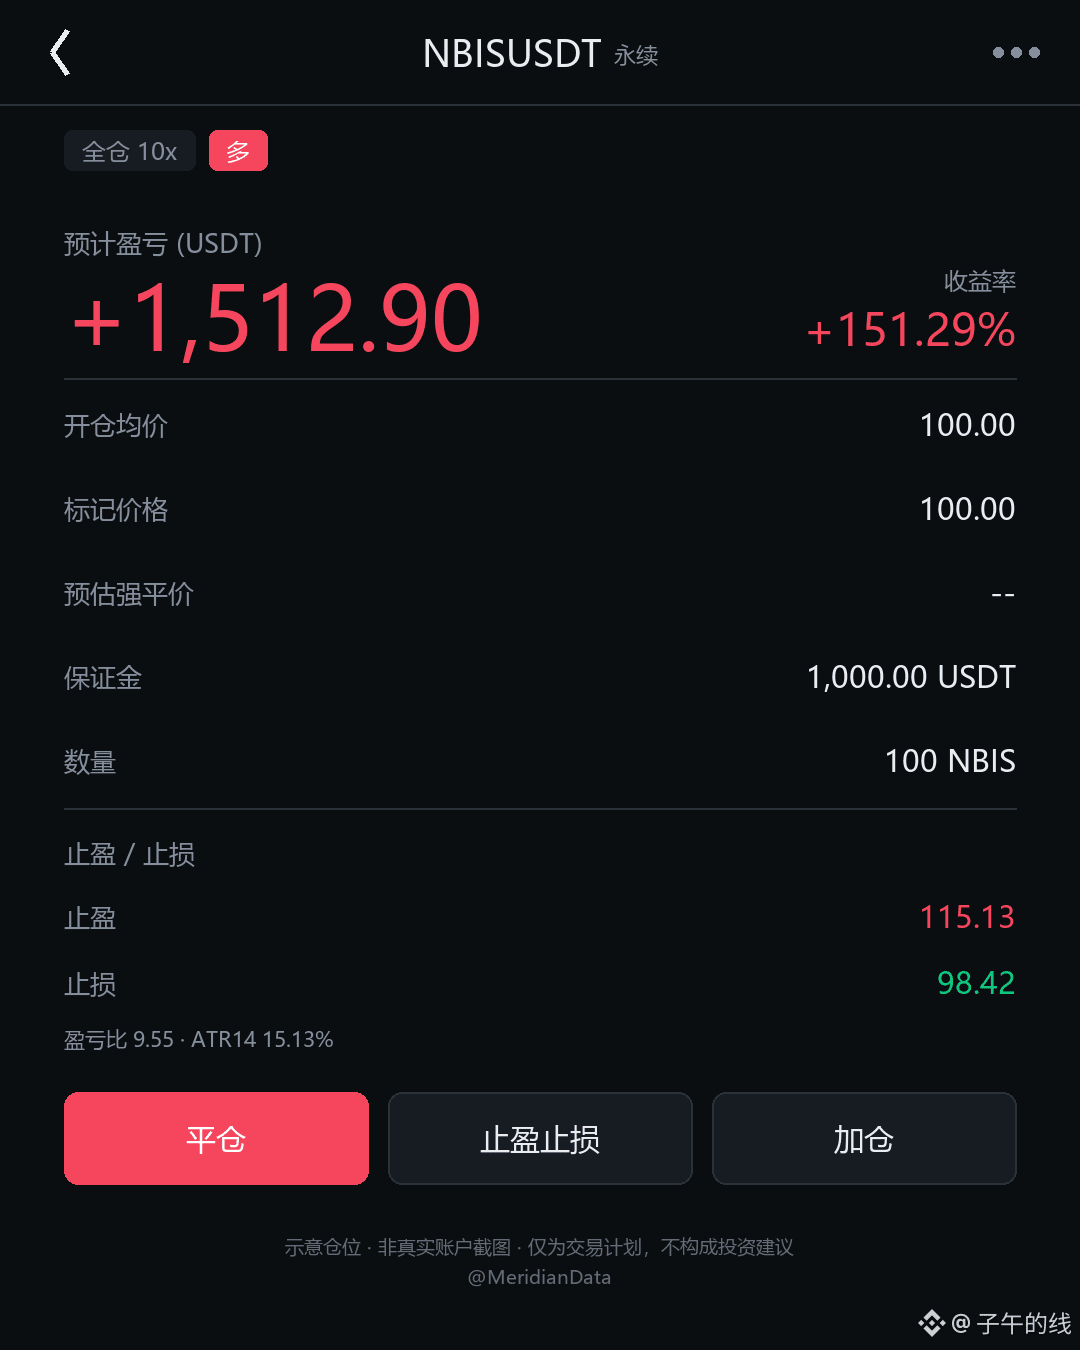
At the 1.7% quantile, I actually want to place a long position on $NBIS .
Take profit: 115.129
Stop loss: 98.4154
{future}(NBISUSDT)
You might be wondering the obvious question: why am I still going long after a drop like this?
Here’s the setup.
The 20-day range stretches from 98.91 to 164.58. The current price of 100 is right near the very bottom, with the quantile down to just 1.7%—genuinely low.
It’s down 10.39% over the past seven days. The further it gets hammered, the more I feel that the disagreement at this level is nearing its end.
I’m willing to take a chance at a level this close to the lower bound.
Position sizing is what matters.
Its average daily volatility is 15.13%, which is its normal daily swing. I only dare to take a position when both my take-profit and stop-loss are within that range; I won’t touch anything beyond it.
The take-profit target above is 15.13% higher. I’ll take the juiciest piece of the pie first. The stop loss is just 1.58% away—I’m prepared to accept that small loss right away.
I didn’t dare aim higher.
I went over the daily chart twice before settling on this tight stop. Honestly, I thought it would get hammered further this time, but after checking twice, I accepted that this was the bottom.
The risk/reward ratio is 9.55. All the chips are piled up at the bottom of the range, and buyers are holding the very lowest level. Even a thin order book can’t withstand this much crowding.
What do you think of going long this close to the 20-day lower bound? Let’s discuss in the comments.
$BNB $TRX
#NBIS #BNB #Cryptocurrency
The above is a record of my personal trading system and data observations. It does not constitute investment advice.
At the 1.7% quantile, I actually want to place a long position on $NBIS .
Take profit: 115.129
Stop loss: 98.4154
You might be wondering the obvious question: why am I still going long after a drop like this?
Here’s the setup.
The 20-day range stretches from 98.91 to 164.58. The current price of 100 is right near the very bottom, with the quantile down to just 1.7%—genuinely low.
It’s down 10.39% over the past seven days. The further it gets hammered, the more I feel that the disagreement at this level is nearing its end.
I’m willing to take a chance at a level this close to the lower bound.
Position sizing is what matters.
Its average daily volatility is 15.13%, which is its normal daily swing. I only dare to take a position when both my take-profit and stop-loss are within that range; I won’t touch anything beyond it.
The take-profit target above is 15.13% higher. I’ll take the juiciest piece of the pie first. The stop loss is just 1.58% away—I’m prepared to accept that small loss right away.
I didn’t dare aim higher.
I went over the daily chart twice before settling on this tight stop. Honestly, I thought it would get hammered further this time, but after checking twice, I accepted that this was the bottom.
The risk/reward ratio is 9.55. All the chips are piled up at the bottom of the range, and buyers are holding the very lowest level. Even a thin order book can’t withstand this much crowding.
What do you think of going long this close to the 20-day lower bound? Let’s discuss in the comments.
$BNB $TRX
#NBIS #BNB #Cryptocurrency
The above is a record of my personal trading system and data observations. It does not constitute investment advice.
Take profit: 115.129
Stop loss: 98.4154
You might be wondering the obvious question: why am I still going long after a drop like this?
Here’s the setup.
The 20-day range stretches from 98.91 to 164.58. The current price of 100 is right near the very bottom, with the quantile down to just 1.7%—genuinely low.
It’s down 10.39% over the past seven days. The further it gets hammered, the more I feel that the disagreement at this level is nearing its end.
I’m willing to take a chance at a level this close to the lower bound.
Position sizing is what matters.
Its average daily volatility is 15.13%, which is its normal daily swing. I only dare to take a position when both my take-profit and stop-loss are within that range; I won’t touch anything beyond it.
The take-profit target above is 15.13% higher. I’ll take the juiciest piece of the pie first. The stop loss is just 1.58% away—I’m prepared to accept that small loss right away.
I didn’t dare aim higher.
I went over the daily chart twice before settling on this tight stop. Honestly, I thought it would get hammered further this time, but after checking twice, I accepted that this was the bottom.
The risk/reward ratio is 9.55. All the chips are piled up at the bottom of the range, and buyers are holding the very lowest level. Even a thin order book can’t withstand this much crowding.
What do you think of going long this close to the 20-day lower bound? Let’s discuss in the comments.
$BNB $TRX
#NBIS #BNB #Cryptocurrency
The above is a record of my personal trading system and data observations. It does not constitute investment advice.
8
·
--
4-hour and daily-chart confluence points to shorts; bearish signals are aligned on 3 coins 🔥
════════════════════
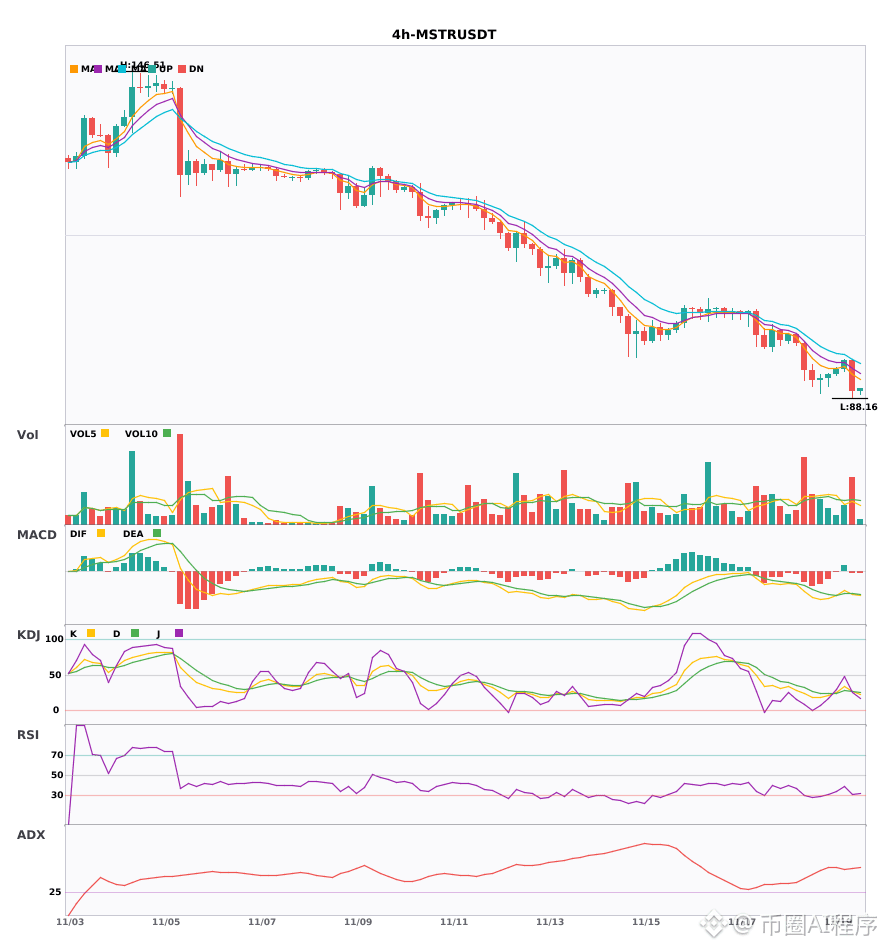
🟢 $MSTR 4-hour bearish signal
⚠️Technical analysis: 4-hour short entry, confirmed by daily bearish confluence! MACD bearish cross below zero with rising volume; moving averages are bearishly aligned; KDJ bearish cross but not oversold; volume is up 1.8x.
════════════════════
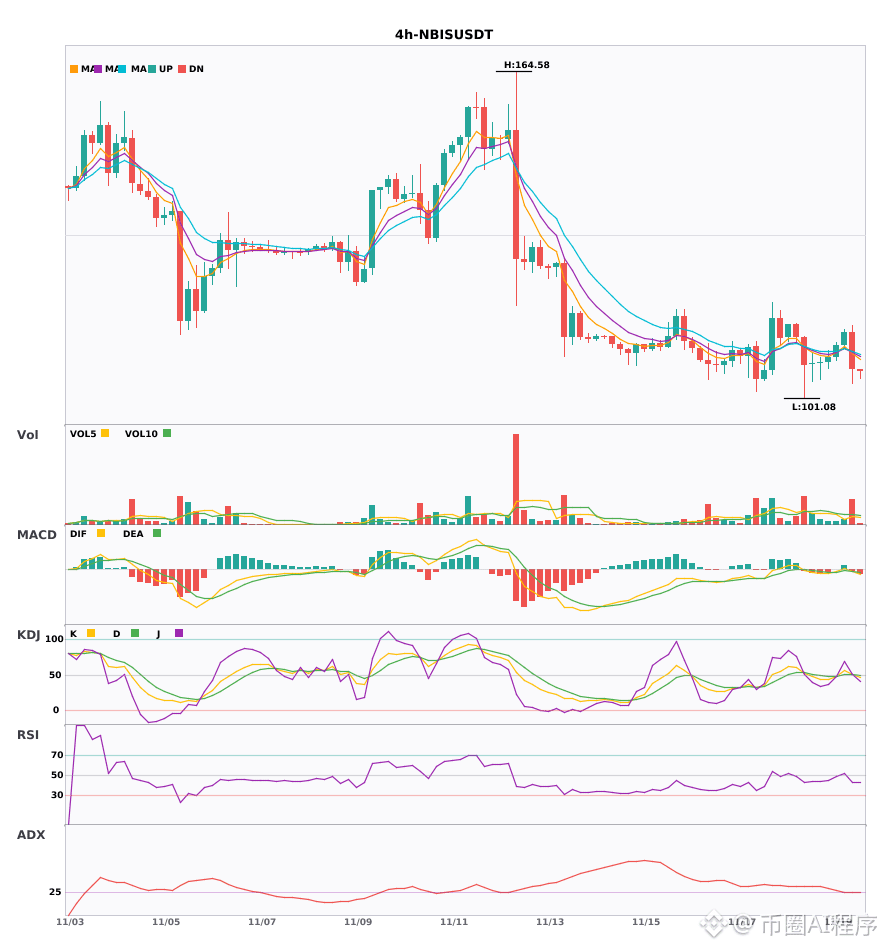
🟢 $NBIS 4-hour bearish signal
⚠️Technical analysis: 4-hour and daily bearish confluence confirmed: MACD bearish cross below zero with rising volume; EMA5 crosses below EMA8, turning bearish; KDJ K crosses above D but is not overbought (50.8/50.6); volume is up 2.5x.
════════════════════
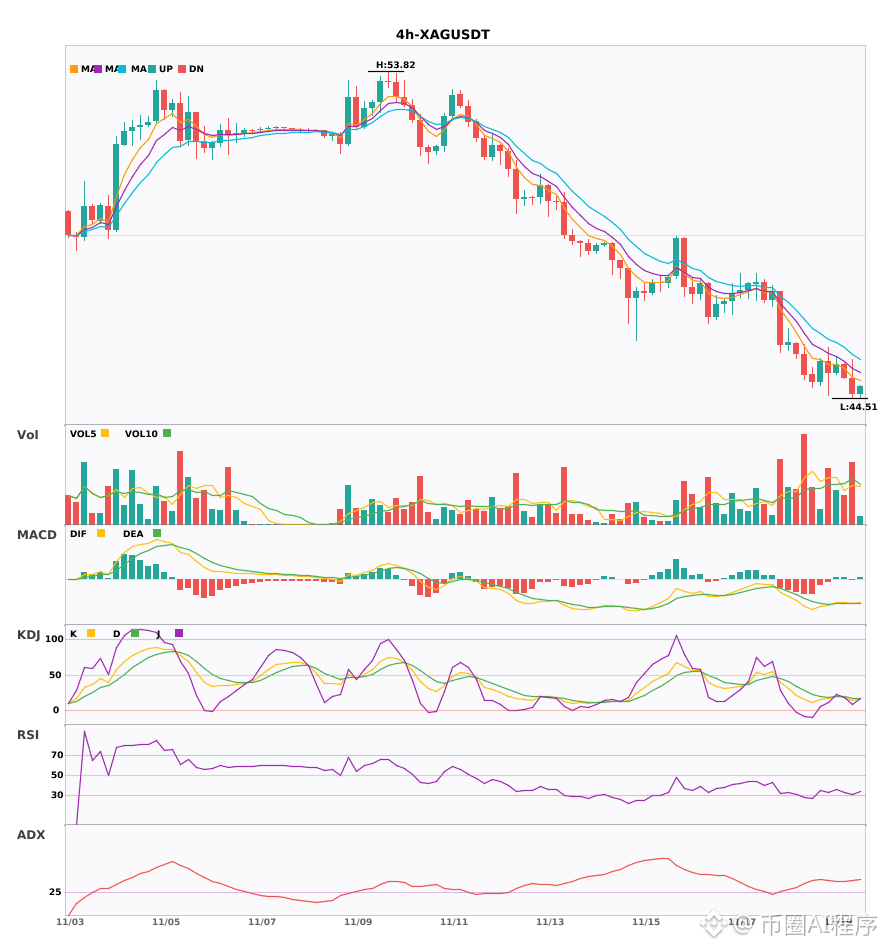
🟢 $XAG 4-hour bearish signal
⚠️Technical analysis: 4-hour entry + daily bearish confluence confirmed! MACD bearish cross drives a sharp sell-off; moving averages are bearishly aligned and diverging downward; KDJ is oversold (K14.5 D17.8)—watch for a rebound; volume is normal at 1.3x.
════════════════════
🔔 Follow for first-hand market alerts 🔔
#多周期共振 #MSTR #NBIS #XAG
📌 When trading, pay attention to whether the candlestick pattern matches the setup
4-hour and daily-chart confluence points to shorts; bearish signals are aligned on 3 coins 🔥
════════════════════
🟢 $MSTR 4-hour bearish signal
⚠️Technical analysis: 4-hour short entry, confirmed by daily bearish confluence! MACD bearish cross below zero with rising volume; moving averages are bearishly aligned; KDJ bearish cross but not oversold; volume is up 1.8x.
════════════════════
🟢 $NBIS 4-hour bearish signal
⚠️Technical analysis: 4-hour and daily bearish confluence confirmed: MACD bearish cross below zero with rising volume; EMA5 crosses below EMA8, turning bearish; KDJ K crosses above D but is not overbought (50.8/50.6); volume is up 2.5x.
════════════════════
🟢 $XAG 4-hour bearish signal
⚠️Technical analysis: 4-hour entry + daily bearish confluence confirmed! MACD bearish cross drives a sharp sell-off; moving averages are bearishly aligned and diverging downward; KDJ is oversold (K14.5 D17.8)—watch for a rebound; volume is normal at 1.3x.
════════════════════
🔔 Follow for first-hand market alerts 🔔
#多周期共振 #MSTR #NBIS #XAG
📌 When trading, pay attention to whether the candlestick pattern matches the setup
════════════════════
🟢 $MSTR 4-hour bearish signal
⚠️Technical analysis: 4-hour short entry, confirmed by daily bearish confluence! MACD bearish cross below zero with rising volume; moving averages are bearishly aligned; KDJ bearish cross but not oversold; volume is up 1.8x.
════════════════════
🟢 $NBIS 4-hour bearish signal
⚠️Technical analysis: 4-hour and daily bearish confluence confirmed: MACD bearish cross below zero with rising volume; EMA5 crosses below EMA8, turning bearish; KDJ K crosses above D but is not overbought (50.8/50.6); volume is up 2.5x.
════════════════════
🟢 $XAG 4-hour bearish signal
⚠️Technical analysis: 4-hour entry + daily bearish confluence confirmed! MACD bearish cross drives a sharp sell-off; moving averages are bearishly aligned and diverging downward; KDJ is oversold (K14.5 D17.8)—watch for a rebound; volume is normal at 1.3x.
════════════════════
🔔 Follow for first-hand market alerts 🔔
#多周期共振 #MSTR #NBIS #XAG
📌 When trading, pay attention to whether the candlestick pattern matches the setup
3

·
--
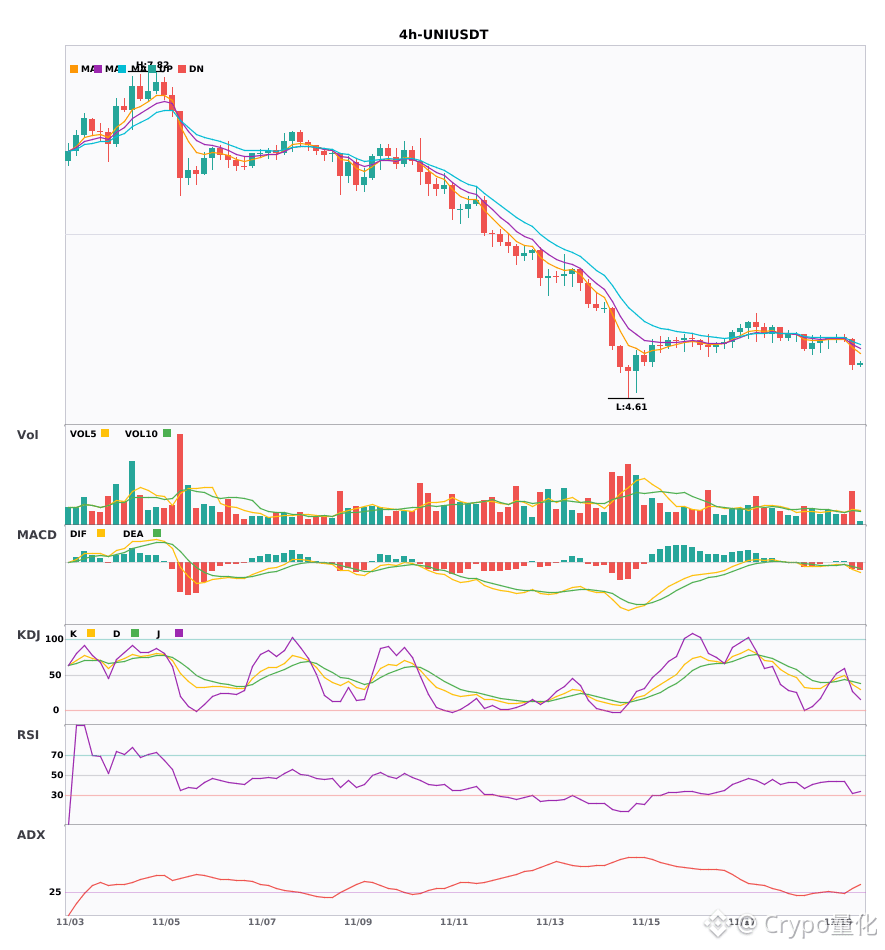
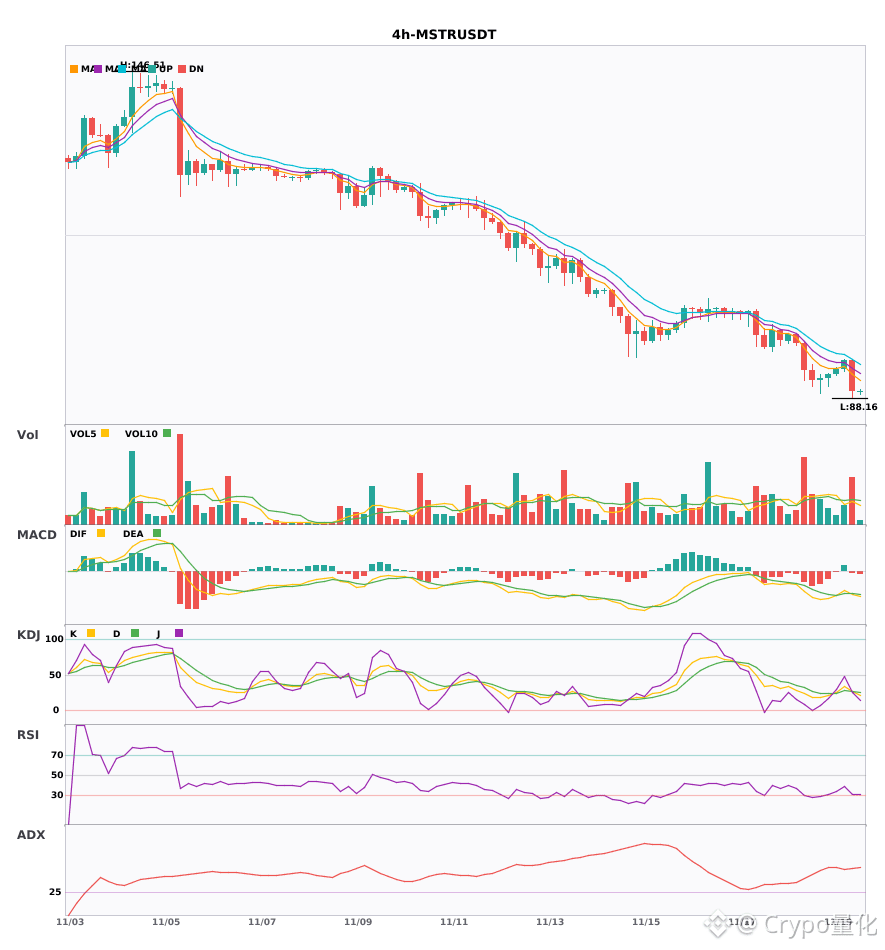
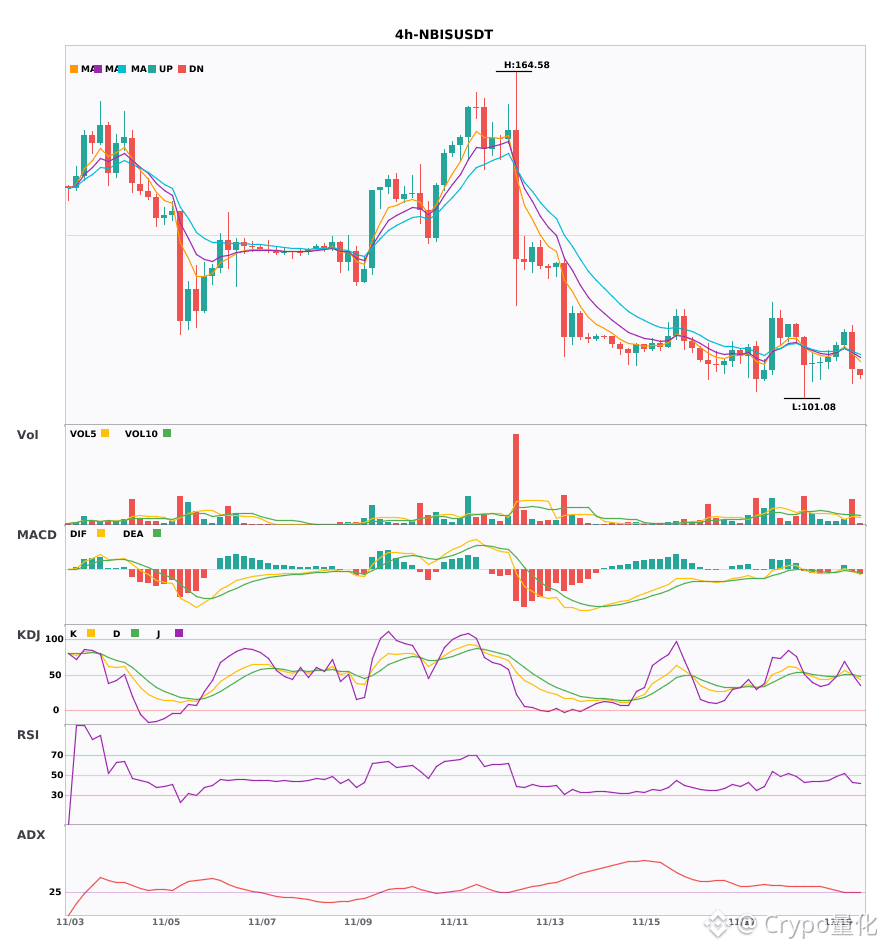
$UNI/$MSTR/$NBIS 4-hour outlook bearish, with significant short-term pressure 🔥
════════════════════
🟢 $UNI 4-hour bearish signal
⚠️ Technical analysis: ADX at 32 indicates a clear trend; MACD has formed a death cross below zero, accelerating the bearish momentum; moving averages are bearishly aligned and trending downward; KDJ death cross signals a bearish short-term outlook; volume is up 2.3x.
════════════════════
🟢 $MSTR 4-hour bearish signal
⚠️ Technical analysis: ADX at 53 indicates a very strong trend, but don't chase it—beware of a pullback after overbought conditions. MACD death cross is accelerating the bearish momentum; moving averages are bearishly aligned and trending down; KDJ death cross points to a bearish short-term outlook, with K crossing below D but not yet oversold; volume is up 1.8x.
════════════════════
🟢 $NBIS 4-hour bearish signal
⚠️ Technical analysis: ADX indicates the trend is just starting, so you can follow it; MACD has formed a death cross below zero, and bearish momentum is accelerating; short-term moving averages have just turned bearish; for KDJ, K has crossed above D and is still mid-move, so bulls have the advantage; volume has clearly increased by 2.5x.
════════════════════
🔔 Follow for first-hand market alerts 🔔
#技术分析 #UNI #MSTR #NBIS
📌 When trading, pay attention to whether the candlestick pattern confirms the setup
$UNI /$MSTR /$NBIS 4-hour outlook bearish, with significant short-term pressure 🔥
════════════════════
🟢 $UNI 4-hour bearish signal
⚠️ Technical analysis: ADX at 32 indicates a clear trend; MACD has formed a death cross below zero, accelerating the bearish momentum; moving averages are bearishly aligned and trending downward; KDJ death cross signals a bearish short-term outlook; volume is up 2.3x.
════════════════════
🟢 $MSTR 4-hour bearish signal
⚠️ Technical analysis: ADX at 53 indicates a very strong trend, but don't chase it—beware of a pullback after overbought conditions. MACD death cross is accelerating the bearish momentum; moving averages are bearishly aligned and trending down; KDJ death cross points to a bearish short-term outlook, with K crossing below D but not yet oversold; volume is up 1.8x.
════════════════════
🟢 $NBIS 4-hour bearish signal
⚠️ Technical analysis: ADX indicates the trend is just starting, so you can follow it; MACD has formed a death cross below zero, and bearish momentum is accelerating; short-term moving averages have just turned bearish; for KDJ, K has crossed above D and is still mid-move, so bulls have the advantage; volume has clearly increased by 2.5x.
════════════════════
🔔 Follow for first-hand market alerts 🔔
#技术分析 #UNI #MSTR #NBIS
📌 When trading, pay attention to whether the candlestick pattern confirms the setup
════════════════════
🟢 $UNI 4-hour bearish signal
⚠️ Technical analysis: ADX at 32 indicates a clear trend; MACD has formed a death cross below zero, accelerating the bearish momentum; moving averages are bearishly aligned and trending downward; KDJ death cross signals a bearish short-term outlook; volume is up 2.3x.
════════════════════
🟢 $MSTR 4-hour bearish signal
⚠️ Technical analysis: ADX at 53 indicates a very strong trend, but don't chase it—beware of a pullback after overbought conditions. MACD death cross is accelerating the bearish momentum; moving averages are bearishly aligned and trending down; KDJ death cross points to a bearish short-term outlook, with K crossing below D but not yet oversold; volume is up 1.8x.
════════════════════
🟢 $NBIS 4-hour bearish signal
⚠️ Technical analysis: ADX indicates the trend is just starting, so you can follow it; MACD has formed a death cross below zero, and bearish momentum is accelerating; short-term moving averages have just turned bearish; for KDJ, K has crossed above D and is still mid-move, so bulls have the advantage; volume has clearly increased by 2.5x.
════════════════════
🔔 Follow for first-hand market alerts 🔔
#技术分析 #UNI #MSTR #NBIS
📌 When trading, pay attention to whether the candlestick pattern confirms the setup
26

🦈 INSTITUTIONAL FOOTPRINT DETECTED AS A MASSIVE $333M POSITION BUILDS IN $NBIS 💥
Smart money positioning rarely leaves subtle footprints when capital allocation reaches nine figures. The newly disclosed $333M call exposure in $NBIS signals heavy institutional conviction accumulating below the radar. 🦈
Large-scale options positioning often precedes aggressive structural expansions as market makers hedge delta imbalances. Tracking these institutional order flow footprints gives us a clear window into where smart money expects the next major liquidity sweep. 📊
💬 Are you adjusting your positioning ahead of this massive institutional footprint or waiting for confirmation on the charts? 👇
⚠️ Not financial advice. Always manage your risk. 🛡️
🏷️ #NBIS #SmartMoney #OptionsFlow #MarketStructure #Crypto
🎯 🦈
🦈 INSTITUTIONAL FOOTPRINT DETECTED AS A MASSIVE $333M POSITION BUILDS IN $NBIS 💥
Smart money positioning rarely leaves subtle footprints when capital allocation reaches nine figures. The newly disclosed $333M call exposure in $NBIS signals heavy institutional conviction accumulating below the radar. 🦈
Large-scale options positioning often precedes aggressive structural expansions as market makers hedge delta imbalances. Tracking these institutional order flow footprints gives us a clear window into where smart money expects the next major liquidity sweep. 📊
💬 Are you adjusting your positioning ahead of this massive institutional footprint or waiting for confirmation on the charts? 👇
⚠️ Not financial advice. Always manage your risk. 🛡️
🏷️ #NBIS #SmartMoney #OptionsFlow #MarketStructure #Crypto
🎯 🦈
Smart money positioning rarely leaves subtle footprints when capital allocation reaches nine figures. The newly disclosed $333M call exposure in $NBIS signals heavy institutional conviction accumulating below the radar. 🦈
Large-scale options positioning often precedes aggressive structural expansions as market makers hedge delta imbalances. Tracking these institutional order flow footprints gives us a clear window into where smart money expects the next major liquidity sweep. 📊
💬 Are you adjusting your positioning ahead of this massive institutional footprint or waiting for confirmation on the charts? 👇
⚠️ Not financial advice. Always manage your risk. 🛡️
🏷️ #NBIS #SmartMoney #OptionsFlow #MarketStructure #Crypto
🎯 🦈


13
·
--
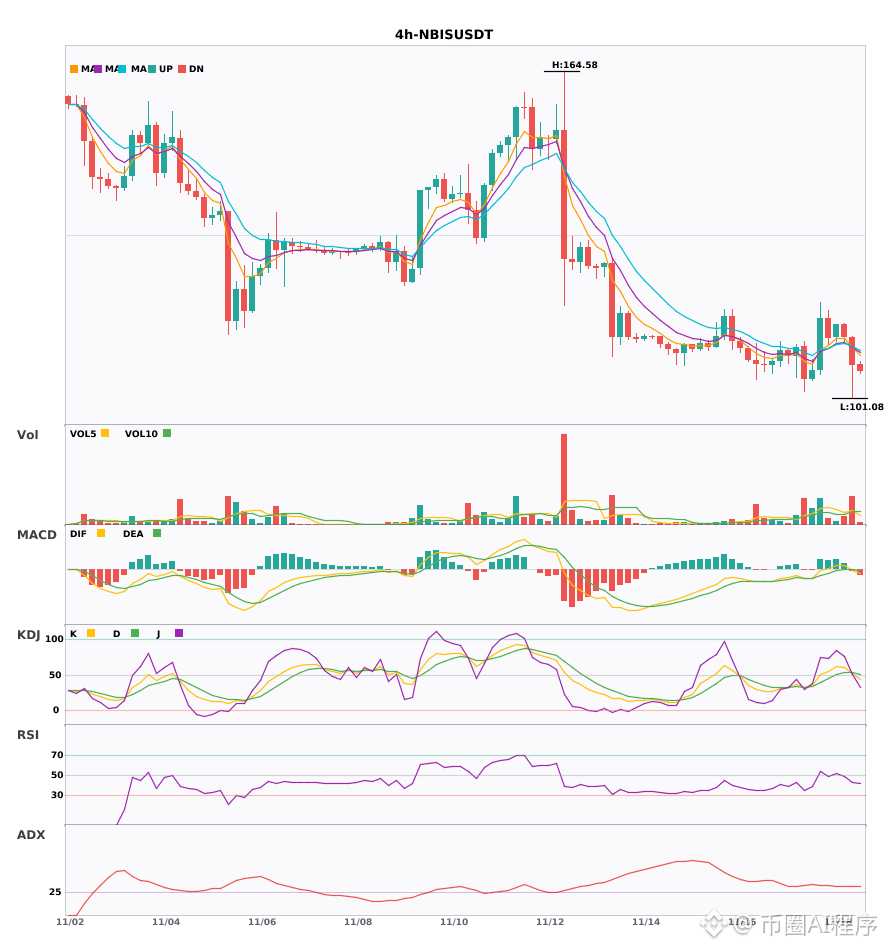
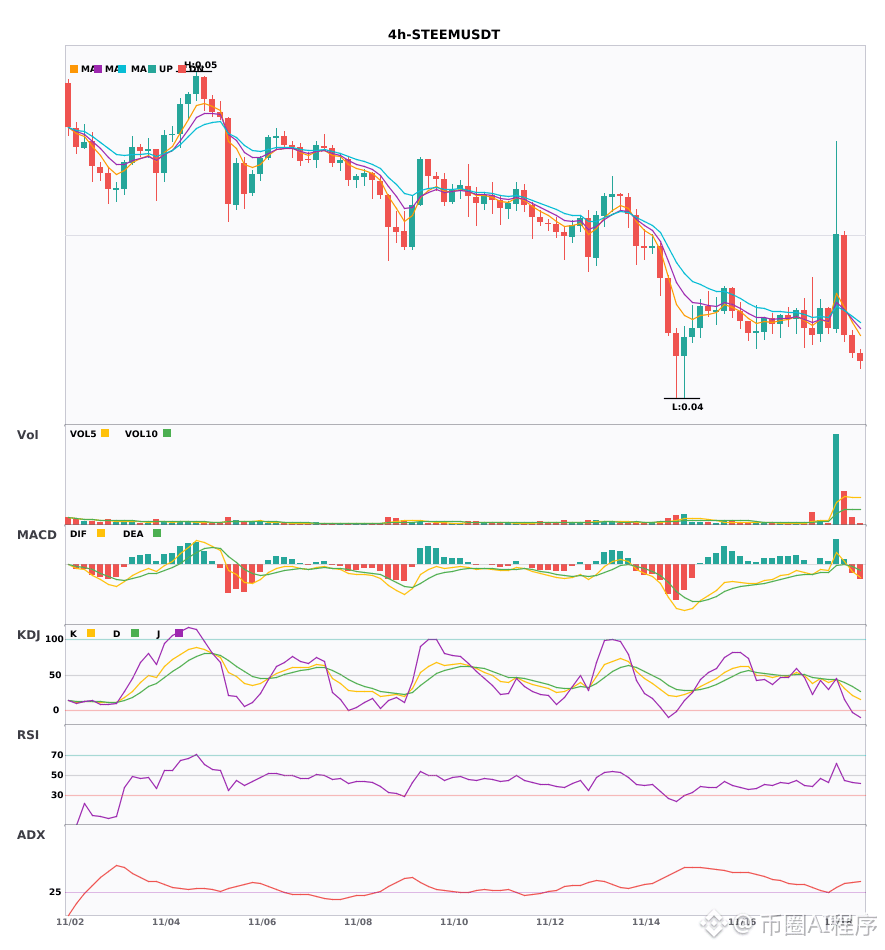
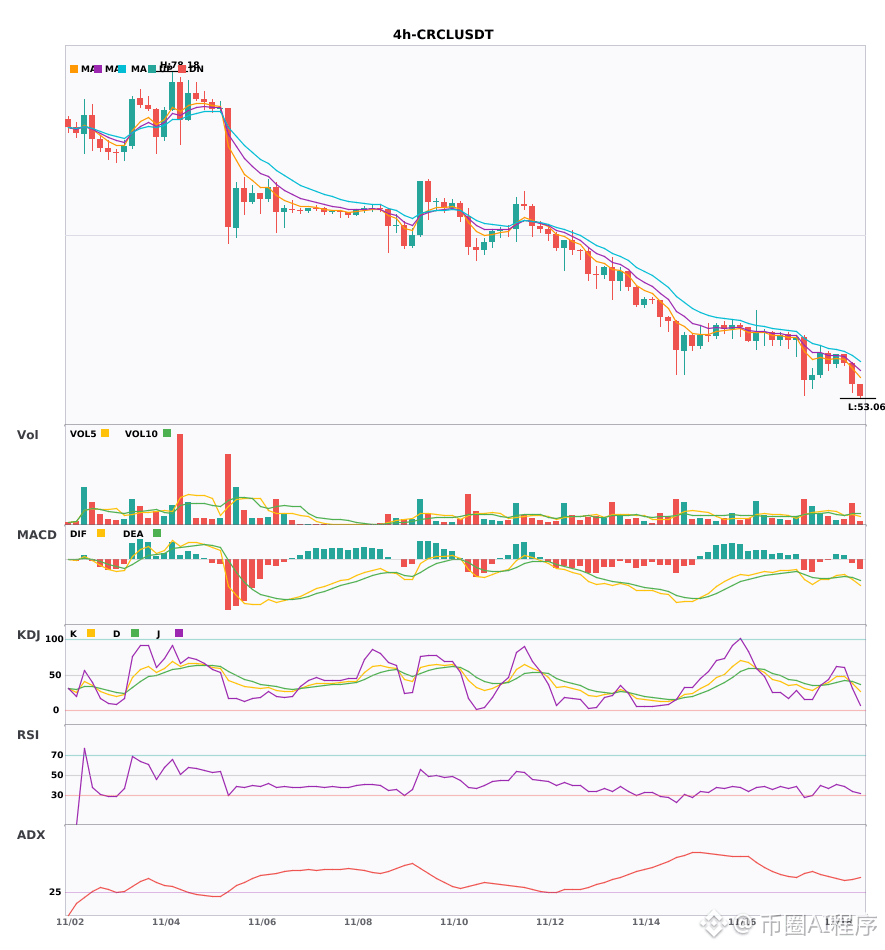
After the MACD death cross, the green histogram bars keep expanding, and the moving averages are bearishly aligned and trending downward. A multi-timeframe confluence short signal is here 🔥
════════════════════
🟢 $NBIS 4-hour short signal
⚠️Technical analysis: Multi-timeframe confluence short setup: Enter on the 4-hour death cross, confirmed by bearish confluence on the daily chart. The MACD death cross below zero comes with rising volume; moving averages are bearishly aligned and trending downward; the KDJ death cross has not entered oversold territory; volume is up 2.2x, with bearish momentum accelerating.
════════════════════
🟢 $STEEM 4-hour short signal
⚠️Technical analysis: The daily bearish trend and 4-hour chart confirm a short setup. After the 4-hour MACD death cross, the green histogram bars expand, signaling accelerating bearish momentum; the moving averages have just formed a bearish alignment; KDJ is weak, with K crossing below D and not yet oversold; volume is up 2.2x, with sellers in control.
════════════════════
🟢 $CRCL 4-hour short signal
⚠️Technical analysis: Multi-timeframe confluence short signal: 4-hour entry signal confirmed by a matching trend on the daily chart. The MACD death cross below zero comes with rising volume, signaling accelerating bearish momentum; the moving averages are bearishly aligned and spreading downward; the KDJ death cross has not entered oversold territory; volume is up 1.9x, indicating a short-term bearish outlook.
════════════════════
🔔 Follow for first-hand market alerts 🔔
#多周期共振 #NBIS #STEEM #CRCL
📌 When trading, watch whether the candlestick pattern confirms the setup
After the MACD death cross, the green histogram bars keep expanding, and the moving averages are bearishly aligned and trending downward. A multi-timeframe confluence short signal is here 🔥
════════════════════
🟢 $NBIS 4-hour short signal
⚠️Technical analysis: Multi-timeframe confluence short setup: Enter on the 4-hour death cross, confirmed by bearish confluence on the daily chart. The MACD death cross below zero comes with rising volume; moving averages are bearishly aligned and trending downward; the KDJ death cross has not entered oversold territory; volume is up 2.2x, with bearish momentum accelerating.
════════════════════
🟢 $STEEM 4-hour short signal
⚠️Technical analysis: The daily bearish trend and 4-hour chart confirm a short setup. After the 4-hour MACD death cross, the green histogram bars expand, signaling accelerating bearish momentum; the moving averages have just formed a bearish alignment; KDJ is weak, with K crossing below D and not yet oversold; volume is up 2.2x, with sellers in control.
════════════════════
🟢 $CRCL 4-hour short signal
⚠️Technical analysis: Multi-timeframe confluence short signal: 4-hour entry signal confirmed by a matching trend on the daily chart. The MACD death cross below zero comes with rising volume, signaling accelerating bearish momentum; the moving averages are bearishly aligned and spreading downward; the KDJ death cross has not entered oversold territory; volume is up 1.9x, indicating a short-term bearish outlook.
════════════════════
🔔 Follow for first-hand market alerts 🔔
#多周期共振 #NBIS #STEEM #CRCL
📌 When trading, watch whether the candlestick pattern confirms the setup
════════════════════
🟢 $NBIS 4-hour short signal
⚠️Technical analysis: Multi-timeframe confluence short setup: Enter on the 4-hour death cross, confirmed by bearish confluence on the daily chart. The MACD death cross below zero comes with rising volume; moving averages are bearishly aligned and trending downward; the KDJ death cross has not entered oversold territory; volume is up 2.2x, with bearish momentum accelerating.
════════════════════
🟢 $STEEM 4-hour short signal
⚠️Technical analysis: The daily bearish trend and 4-hour chart confirm a short setup. After the 4-hour MACD death cross, the green histogram bars expand, signaling accelerating bearish momentum; the moving averages have just formed a bearish alignment; KDJ is weak, with K crossing below D and not yet oversold; volume is up 2.2x, with sellers in control.
════════════════════
🟢 $CRCL 4-hour short signal
⚠️Technical analysis: Multi-timeframe confluence short signal: 4-hour entry signal confirmed by a matching trend on the daily chart. The MACD death cross below zero comes with rising volume, signaling accelerating bearish momentum; the moving averages are bearishly aligned and spreading downward; the KDJ death cross has not entered oversold territory; volume is up 1.9x, indicating a short-term bearish outlook.
════════════════════
🔔 Follow for first-hand market alerts 🔔
#多周期共振 #NBIS #STEEM #CRCL
📌 When trading, watch whether the candlestick pattern confirms the setup
11

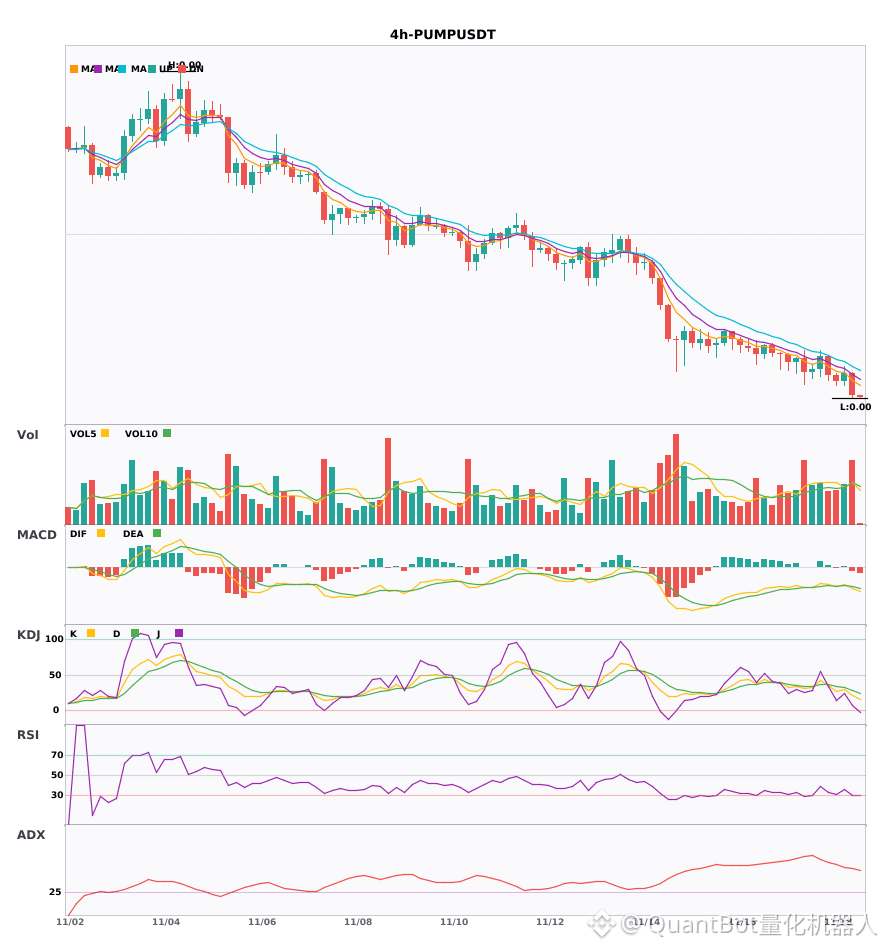
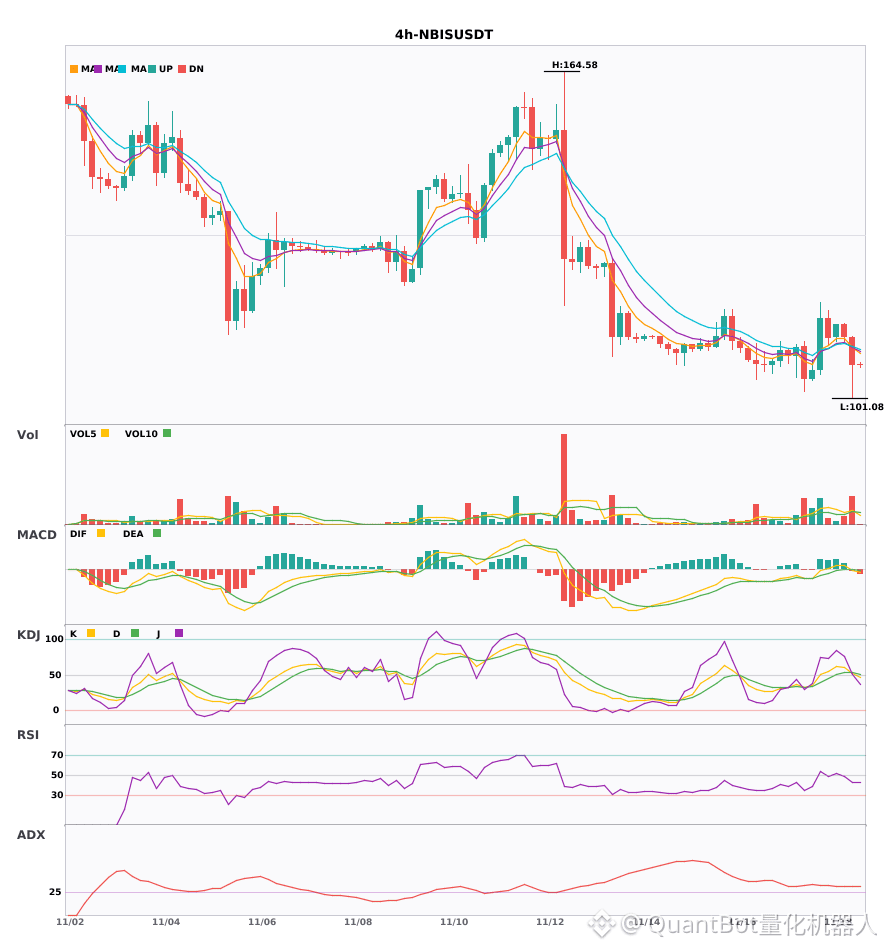
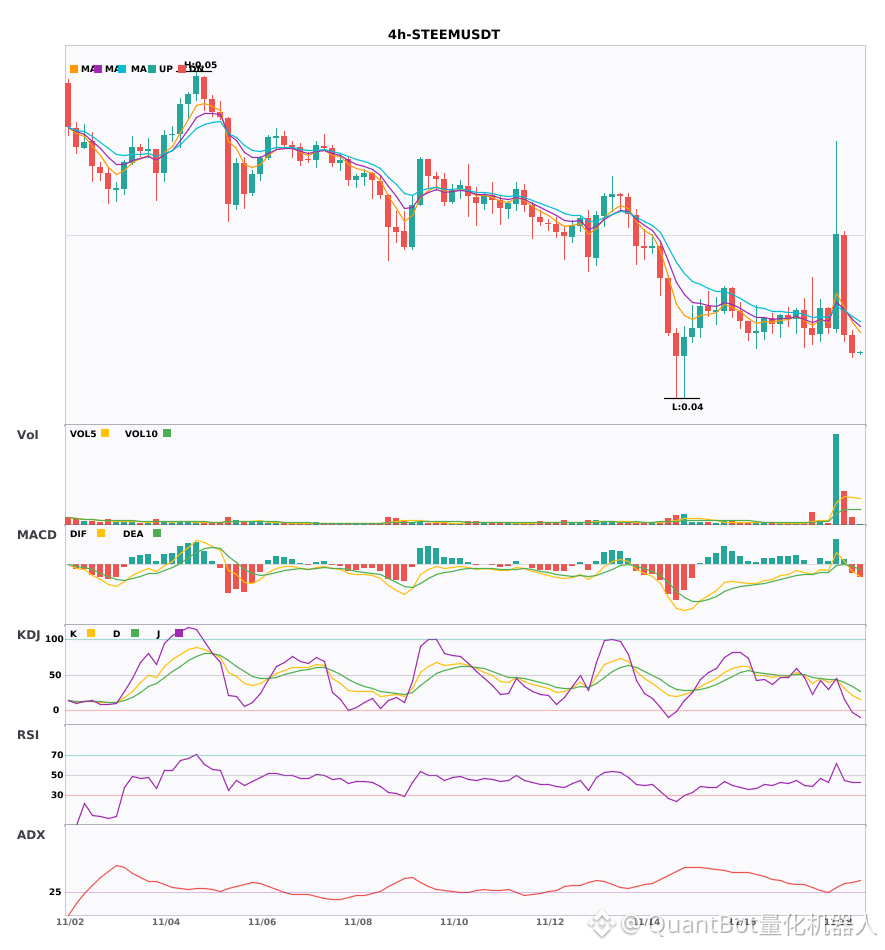
$PUMP $NBIS $STEEM 4H Bearish bias, under pressure in the short term
📉 $PUMP | 4-hour bearish signal
━━━━━━━━━━━━━━━━━━
Technical analysis: ADX(49) indicates an extremely strong trend; beware of a pullback from overbought levels; MACD death cross below zero; EMA5<8<13 bearish alignment; weak KDJ (K21.6/D28.5); volume up 1.5x.
Price change: -4.9800%
📉 $NBIS | 4-hour bearish signal
━━━━━━━━━━━━━━━━━━
Technical analysis: ADX(33) indicates a strong trend; MACD death cross below zero, EMA5 falls below EMA8, KDJ death cross (K52.4/D53.3), volume up 2.2x, with bears in control in the short term.
Price change: -4.6800%
📉 $STEEM | 4-hour bearish signal
━━━━━━━━━━━━━━━━━━
Technical analysis: ADX(36) indicates a clear trend; MACD death cross below zero, with bearish momentum strengthening; EMA5 falls below EMA8, signaling a short-term bearish turn; weak KDJ (K21.7/D33.7), with bears in control; trading volume up 2.2x.
Price change: -1.3200%
━━━━━━━━━━━━━━━━━━
#技术分析 #PUMP #NBIS #STEEM
📌 The above content is for reference only and does not constitute investment advice
$PUMP $NBIS $STEEM 4H Bearish bias, under pressure in the short term
📉 $PUMP | 4-hour bearish signal
━━━━━━━━━━━━━━━━━━
Technical analysis: ADX(49) indicates an extremely strong trend; beware of a pullback from overbought levels; MACD death cross below zero; EMA5<8<13 bearish alignment; weak KDJ (K21.6/D28.5); volume up 1.5x.
Price change: -4.9800%
📉 $NBIS | 4-hour bearish signal
━━━━━━━━━━━━━━━━━━
Technical analysis: ADX(33) indicates a strong trend; MACD death cross below zero, EMA5 falls below EMA8, KDJ death cross (K52.4/D53.3), volume up 2.2x, with bears in control in the short term.
Price change: -4.6800%
📉 $STEEM | 4-hour bearish signal
━━━━━━━━━━━━━━━━━━
Technical analysis: ADX(36) indicates a clear trend; MACD death cross below zero, with bearish momentum strengthening; EMA5 falls below EMA8, signaling a short-term bearish turn; weak KDJ (K21.7/D33.7), with bears in control; trading volume up 2.2x.
Price change: -1.3200%
━━━━━━━━━━━━━━━━━━
#技术分析 #PUMP #NBIS #STEEM
📌 The above content is for reference only and does not constitute investment advice
📉 $PUMP | 4-hour bearish signal
━━━━━━━━━━━━━━━━━━
Technical analysis: ADX(49) indicates an extremely strong trend; beware of a pullback from overbought levels; MACD death cross below zero; EMA5<8<13 bearish alignment; weak KDJ (K21.6/D28.5); volume up 1.5x.
Price change: -4.9800%
📉 $NBIS | 4-hour bearish signal
━━━━━━━━━━━━━━━━━━
Technical analysis: ADX(33) indicates a strong trend; MACD death cross below zero, EMA5 falls below EMA8, KDJ death cross (K52.4/D53.3), volume up 2.2x, with bears in control in the short term.
Price change: -4.6800%
📉 $STEEM | 4-hour bearish signal
━━━━━━━━━━━━━━━━━━
Technical analysis: ADX(36) indicates a clear trend; MACD death cross below zero, with bearish momentum strengthening; EMA5 falls below EMA8, signaling a short-term bearish turn; weak KDJ (K21.7/D33.7), with bears in control; trading volume up 2.2x.
Price change: -1.3200%
━━━━━━━━━━━━━━━━━━
#技术分析 #PUMP #NBIS #STEEM
📌 The above content is for reference only and does not constitute investment advice
21
·
--
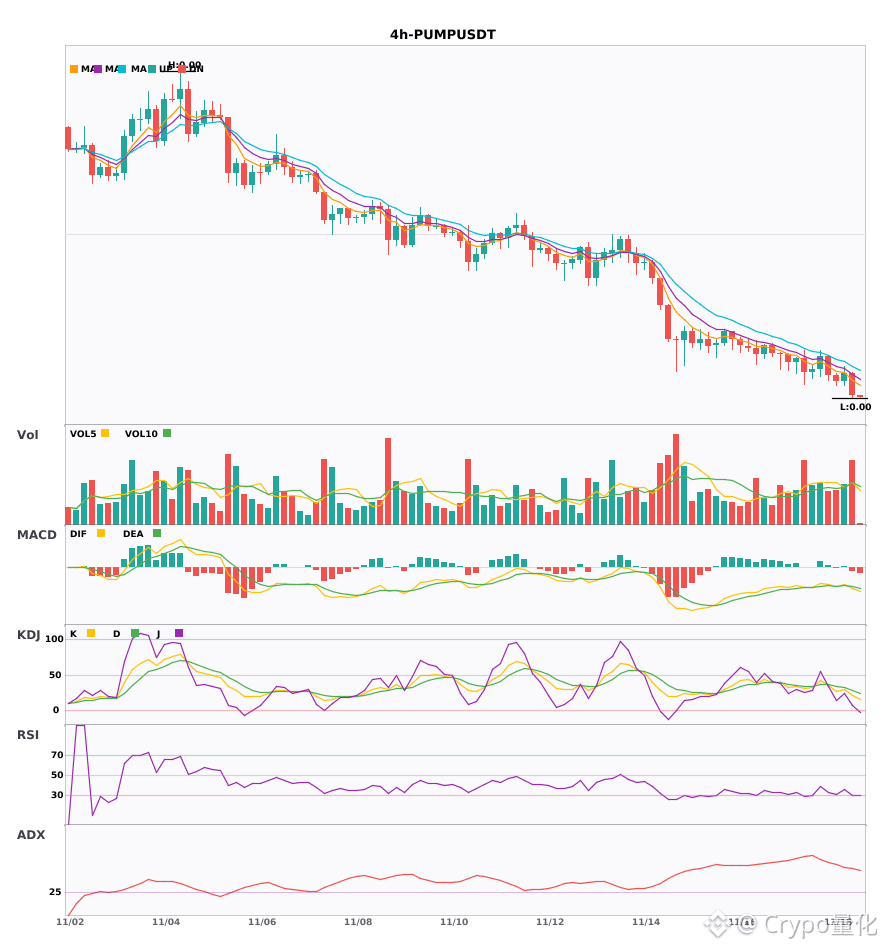
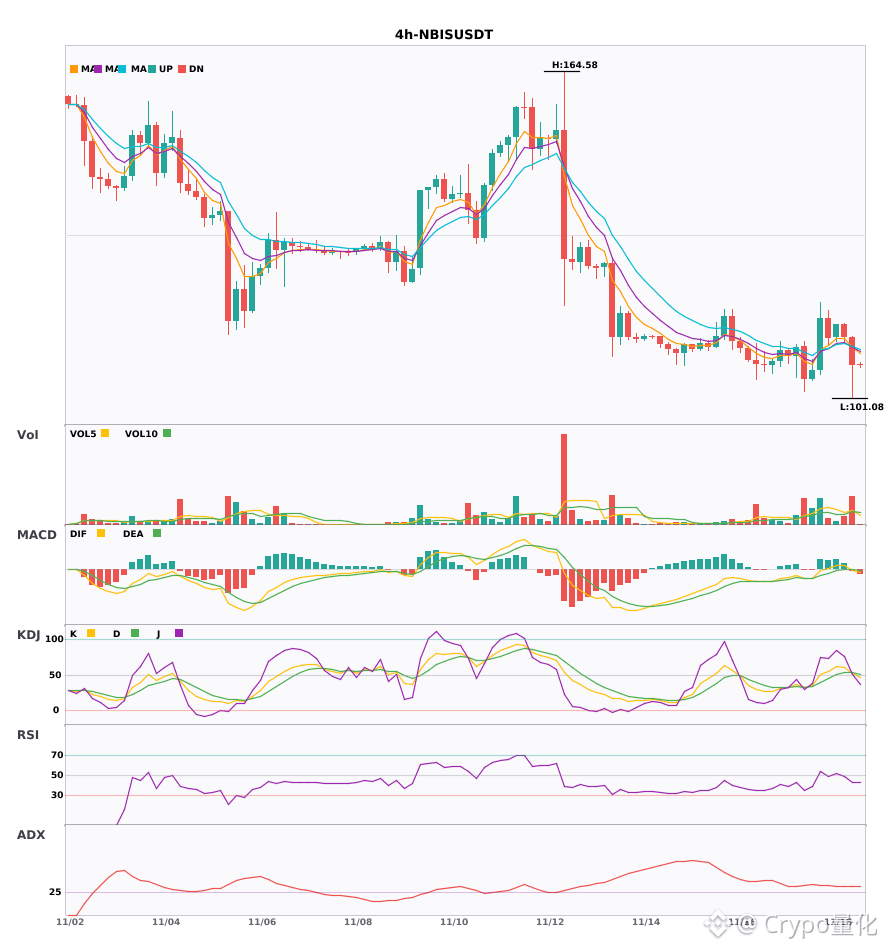
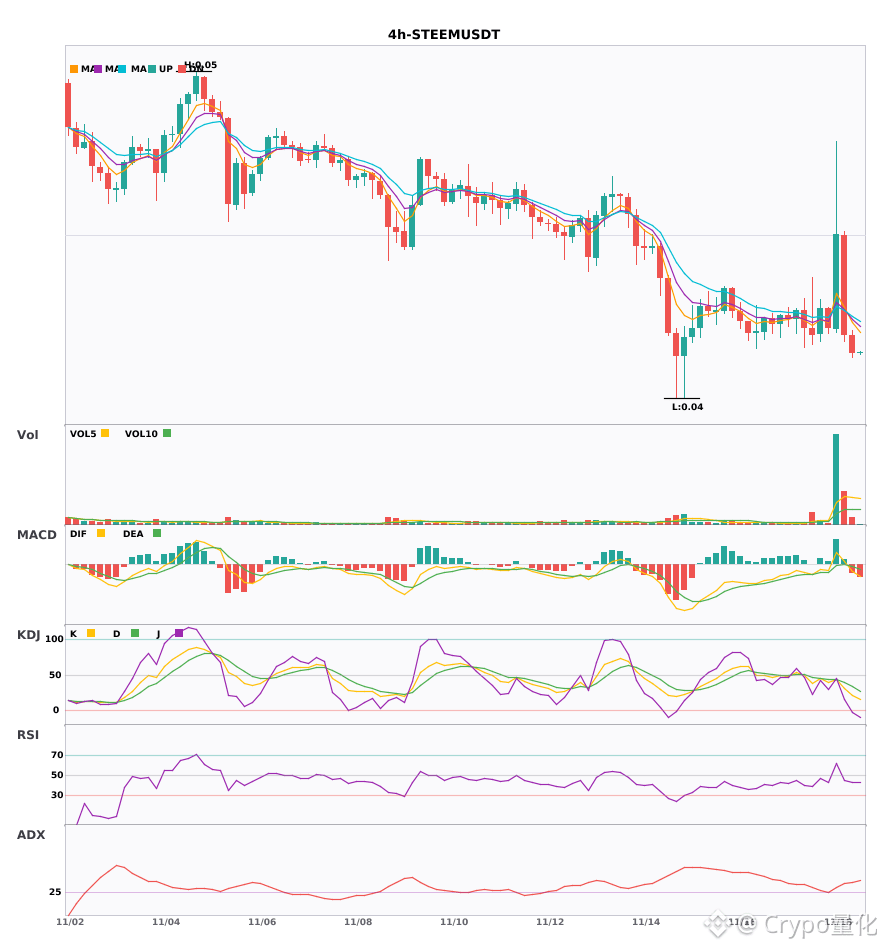
The 4-hour short warning is here. Be careful with these 3 coins: $PUMP $NBIS $STEEM🔥
════════════════════
🟢 $PUMP 4-hour short signal
⚠️ Technicals: ADX has reached 49, the trend is very strong, but watch for a pullback. MACD bearish crossover is accelerating, moving averages are in a bearish alignment downward, KDJ is weak, K has crossed below D, and volume has expanded by 1.5x.
════════════════════
🟢 $NBIS 4-hour short signal
⚠️ Technicals: The trend is very clear | MACD bearish crossover below zero, bearish momentum accelerating | moving averages bearish crossover downward, short-term turning bearish | KDJ has also formed a bearish crossover, K is below D (52.4/53.3) | volume increased by 2.2x
════════════════════
🟢 $STEEM 4-hour short signal
⚠️ Technicals: The trend is quite clear, MACD bearish crossover below zero, bearish momentum is accelerating, EMA5 has just crossed below EMA8, short-term turning bearish, KDJ is running weakly, K has crossed below D but has not yet reached oversold levels, bears are dominant, and volume has increased by 2.2x.
════════════════════
🔔 Follow for first-hand market moves 🔔
#技术分析 #PUMP #NBIS #STEEM
📌 When trading, pay attention to whether the candlestick pattern matches
The 4-hour short warning is here. Be careful with these 3 coins: $PUMP $NBIS $STEEM 🔥
════════════════════
🟢 $PUMP 4-hour short signal
⚠️ Technicals: ADX has reached 49, the trend is very strong, but watch for a pullback. MACD bearish crossover is accelerating, moving averages are in a bearish alignment downward, KDJ is weak, K has crossed below D, and volume has expanded by 1.5x.
════════════════════
🟢 $NBIS 4-hour short signal
⚠️ Technicals: The trend is very clear | MACD bearish crossover below zero, bearish momentum accelerating | moving averages bearish crossover downward, short-term turning bearish | KDJ has also formed a bearish crossover, K is below D (52.4/53.3) | volume increased by 2.2x
════════════════════
🟢 $STEEM 4-hour short signal
⚠️ Technicals: The trend is quite clear, MACD bearish crossover below zero, bearish momentum is accelerating, EMA5 has just crossed below EMA8, short-term turning bearish, KDJ is running weakly, K has crossed below D but has not yet reached oversold levels, bears are dominant, and volume has increased by 2.2x.
════════════════════
🔔 Follow for first-hand market moves 🔔
#技术分析 #PUMP #NBIS #STEEM
📌 When trading, pay attention to whether the candlestick pattern matches
════════════════════
🟢 $PUMP 4-hour short signal
⚠️ Technicals: ADX has reached 49, the trend is very strong, but watch for a pullback. MACD bearish crossover is accelerating, moving averages are in a bearish alignment downward, KDJ is weak, K has crossed below D, and volume has expanded by 1.5x.
════════════════════
🟢 $NBIS 4-hour short signal
⚠️ Technicals: The trend is very clear | MACD bearish crossover below zero, bearish momentum accelerating | moving averages bearish crossover downward, short-term turning bearish | KDJ has also formed a bearish crossover, K is below D (52.4/53.3) | volume increased by 2.2x
════════════════════
🟢 $STEEM 4-hour short signal
⚠️ Technicals: The trend is quite clear, MACD bearish crossover below zero, bearish momentum is accelerating, EMA5 has just crossed below EMA8, short-term turning bearish, KDJ is running weakly, K has crossed below D but has not yet reached oversold levels, bears are dominant, and volume has increased by 2.2x.
════════════════════
🔔 Follow for first-hand market moves 🔔
#技术分析 #PUMP #NBIS #STEEM
📌 When trading, pay attention to whether the candlestick pattern matches
15

🦈 $NBIS ATTRACTS A MASSIVE $333M INSTITUTIONAL CALL SWEEP AS SMART MONEY POSITIONS EARLY 💥
Institutional footprints don't hide well when size enters the board through heavy derivatives flow. A fresh $333M call positioning on $NBIS reveals elite conviction betting on asymmetric expansion. 🦈
When heavy hitters start front-running structural shifts with nine-figure options plays, retail should take notice of the underlying order book mechanics. Smart money is quietly securing exposure before the broader market recognizes the catalyst unfolding. 📊
Are you tracking this institutional whale flow or waiting for confirmation higher up? 👇
⚠️ Not financial advice. Always manage your risk. 🛡️
🏷️ #NBIS #SmartMoney #Derivatives #Crypto #OptionsFlow
🔥 💎
🦈 $NBIS ATTRACTS A MASSIVE $333M INSTITUTIONAL CALL SWEEP AS SMART MONEY POSITIONS EARLY 💥
Institutional footprints don't hide well when size enters the board through heavy derivatives flow. A fresh $333M call positioning on $NBIS reveals elite conviction betting on asymmetric expansion. 🦈
When heavy hitters start front-running structural shifts with nine-figure options plays, retail should take notice of the underlying order book mechanics. Smart money is quietly securing exposure before the broader market recognizes the catalyst unfolding. 📊
Are you tracking this institutional whale flow or waiting for confirmation higher up? 👇
⚠️ Not financial advice. Always manage your risk. 🛡️
🏷️ #NBIS #SmartMoney #Derivatives #Crypto #OptionsFlow
🔥 💎
Institutional footprints don't hide well when size enters the board through heavy derivatives flow. A fresh $333M call positioning on $NBIS reveals elite conviction betting on asymmetric expansion. 🦈
When heavy hitters start front-running structural shifts with nine-figure options plays, retail should take notice of the underlying order book mechanics. Smart money is quietly securing exposure before the broader market recognizes the catalyst unfolding. 📊
Are you tracking this institutional whale flow or waiting for confirmation higher up? 👇
⚠️ Not financial advice. Always manage your risk. 🛡️
🏷️ #NBIS #SmartMoney #Derivatives #Crypto #OptionsFlow
🔥 💎


2


·
--
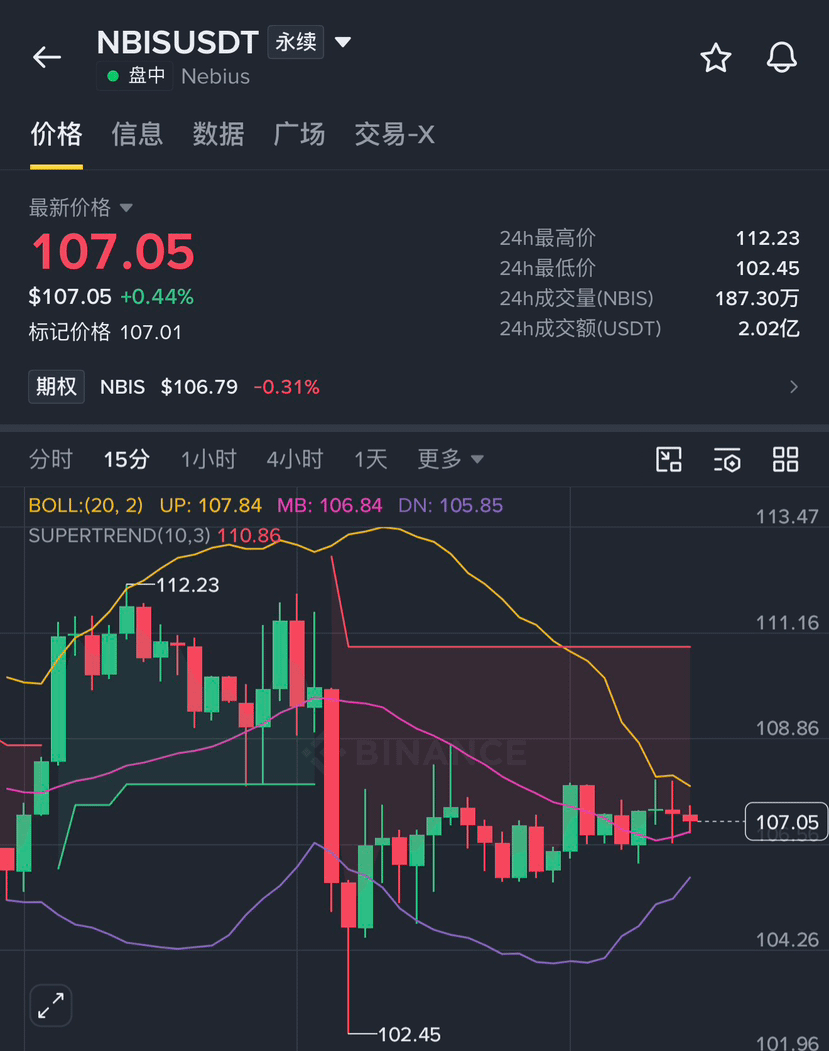
$NBIS For the past few days, it’s been hovering around 110, so much that I’m almost numb to it.
On Sunday morning, I wrote about it at 111.58. It lay there for a day and a half. I said it had been dumped for a day and a half, and it’s been languishing ever since, with not a single decent bounce.
Then it finally gave us one. On Monday, it climbed steadily to around 118. I thought to myself: this time it might finally recover and head toward 120, then 125.
But it didn’t happen. A bearish candle pushed it back down, and then it drifted lower for two straight days. 110 was gone, then 108. Last night, a long bearish candle plunged straight to 102.39, breaking below even last Sunday’s 107.52. It’s now just after four on Wednesday morning, and it’s at 107.21, up 4.7% from 102.39.
From around 131.53, it’s down 18.5%. From its high of 164.18, it’s already fallen 34.7%.
The hardest part is that it’s neither crashing outright nor really bouncing back: every time it climbs, the high is lower than the last—118, 112—and every time it tests the bottom, it sinks lower than before—109.20, 107.52, 102.39.
It’s like rolling back and forth in a dish that’s tilted downward.
Did you buy in around 102, or are you like me, watching it roll and wondering when this dish will finally reach the bottom?
#nebius #NBIS #英伟达财报夜!预期营收超千亿,AI股或迎大变盘 #本周财报与宏观事件密集,市场再迎波动考验
{future}(NBISUSDT)
$NBIS For the past few days, it’s been hovering around 110, so much that I’m almost numb to it.
On Sunday morning, I wrote about it at 111.58. It lay there for a day and a half. I said it had been dumped for a day and a half, and it’s been languishing ever since, with not a single decent bounce.
Then it finally gave us one. On Monday, it climbed steadily to around 118. I thought to myself: this time it might finally recover and head toward 120, then 125.
But it didn’t happen. A bearish candle pushed it back down, and then it drifted lower for two straight days. 110 was gone, then 108. Last night, a long bearish candle plunged straight to 102.39, breaking below even last Sunday’s 107.52. It’s now just after four on Wednesday morning, and it’s at 107.21, up 4.7% from 102.39.
From around 131.53, it’s down 18.5%. From its high of 164.18, it’s already fallen 34.7%.
The hardest part is that it’s neither crashing outright nor really bouncing back: every time it climbs, the high is lower than the last—118, 112—and every time it tests the bottom, it sinks lower than before—109.20, 107.52, 102.39.
It’s like rolling back and forth in a dish that’s tilted downward.
Did you buy in around 102, or are you like me, watching it roll and wondering when this dish will finally reach the bottom?
#nebius #NBIS #英伟达财报夜!预期营收超千亿,AI股或迎大变盘 #本周财报与宏观事件密集,市场再迎波动考验
On Sunday morning, I wrote about it at 111.58. It lay there for a day and a half. I said it had been dumped for a day and a half, and it’s been languishing ever since, with not a single decent bounce.
Then it finally gave us one. On Monday, it climbed steadily to around 118. I thought to myself: this time it might finally recover and head toward 120, then 125.
But it didn’t happen. A bearish candle pushed it back down, and then it drifted lower for two straight days. 110 was gone, then 108. Last night, a long bearish candle plunged straight to 102.39, breaking below even last Sunday’s 107.52. It’s now just after four on Wednesday morning, and it’s at 107.21, up 4.7% from 102.39.
From around 131.53, it’s down 18.5%. From its high of 164.18, it’s already fallen 34.7%.
The hardest part is that it’s neither crashing outright nor really bouncing back: every time it climbs, the high is lower than the last—118, 112—and every time it tests the bottom, it sinks lower than before—109.20, 107.52, 102.39.
It’s like rolling back and forth in a dish that’s tilted downward.
Did you buy in around 102, or are you like me, watching it roll and wondering when this dish will finally reach the bottom?
#nebius #NBIS #英伟达财报夜!预期营收超千亿,AI股或迎大变盘 #本周财报与宏观事件密集,市场再迎波动考验
1
772
·
--
Seasoned traders watching NBIS don’t just look at the leaderboard; they first check whether the pullback finds support.
Binance TradFi perpetuals (traditional finance assets, with high gap risk outside trading hours) | NBIS is up 10.01% over the past 24 hours, and momentum remains strong. For follow-through, watch the pullback first. Current price is around 118.33, with 24-hour trading volume of about 271 million; absolute trading volume does not necessarily mean relatively higher volume. Positioning: 69% of accounts are long; the active buy/sell ratio is 0.96 (aggressive trading is close to balanced); funding rate is +0.0180%.
Reference indicators: The 30m RSI at 78.5 is overheated, suggesting that buying enthusiasm is stretched. The 30m ATR trend-band reference is 105.952729; the current price is above it, indicating that the structure favors trend continuation.
The order book needs to provide two answers: Can the active buy/sell ratio of 0.96 move away from the balance zone around 1, and can the 30m RSI at 78.5 first fall back below 70? If both hold, this move is worth discussing further; if only one does, treat it as sentiment-driven volatility.
#NBIS #UnusualMoveAlert
Seasoned traders watching NBIS don’t just look at the leaderboard; they first check whether the pullback finds support.
Binance TradFi perpetuals (traditional finance assets, with high gap risk outside trading hours) | NBIS is up 10.01% over the past 24 hours, and momentum remains strong. For follow-through, watch the pullback first. Current price is around 118.33, with 24-hour trading volume of about 271 million; absolute trading volume does not necessarily mean relatively higher volume. Positioning: 69% of accounts are long; the active buy/sell ratio is 0.96 (aggressive trading is close to balanced); funding rate is +0.0180%.
Reference indicators: The 30m RSI at 78.5 is overheated, suggesting that buying enthusiasm is stretched. The 30m ATR trend-band reference is 105.952729; the current price is above it, indicating that the structure favors trend continuation.
The order book needs to provide two answers: Can the active buy/sell ratio of 0.96 move away from the balance zone around 1, and can the 30m RSI at 78.5 first fall back below 70? If both hold, this move is worth discussing further; if only one does, treat it as sentiment-driven volatility.
#NBIS #UnusualMoveAlert
Binance TradFi perpetuals (traditional finance assets, with high gap risk outside trading hours) | NBIS is up 10.01% over the past 24 hours, and momentum remains strong. For follow-through, watch the pullback first. Current price is around 118.33, with 24-hour trading volume of about 271 million; absolute trading volume does not necessarily mean relatively higher volume. Positioning: 69% of accounts are long; the active buy/sell ratio is 0.96 (aggressive trading is close to balanced); funding rate is +0.0180%.
Reference indicators: The 30m RSI at 78.5 is overheated, suggesting that buying enthusiasm is stretched. The 30m ATR trend-band reference is 105.952729; the current price is above it, indicating that the structure favors trend continuation.
The order book needs to provide two answers: Can the active buy/sell ratio of 0.96 move away from the balance zone around 1, and can the 30m RSI at 78.5 first fall back below 70? If both hold, this move is worth discussing further; if only one does, treat it as sentiment-driven volatility.
#NBIS #UnusualMoveAlert
5
Log in to explore more content
Join global crypto users on Binance Square
⚡️ Get latest and useful information about crypto.
💬 Trusted by the world’s largest crypto exchange.
👍 Discover real insights from verified creators.
Email / Phone number
Trending Topics
1
#BTCReboundsAbove$60KAmidWhaleDipBuying
30,403 views
180 Discussing
2
#SolanaSets2027RoadmapToDoubleComputeCapacity
13,790 views
391 Discussing
3
#CaliforniaNvidiaProbeExaminesPotentialCriminalViolations
4,431 views
59 Discussing
4
#BlackRockLaunchesHKDollarDigitalLiquidityFund
10,789 views
332 Discussing
5
#NvidiaLoses$2.7TrillionInMonthAndAHalf
58,402 views
262 Discussing
6
#GlobalStocksFaceLongestLosingStreakSince2023
480,701 views
3,065 Discussing
7
#BlackRockIBITPostsRecord$541MSingleDayOutflow
76,298 views
159 Discussing
8
#AnthropicPlungesTowardIPOPriceonDay2
260,744 views
2,031 Discussing
9
#TwentyOneCapitalAdds172.25BTC
130,606 views
1,369 Discussing
10
#HKBillWouldExcludeTokenizedDepositsFromVirtualAssets
16,188 views
95 Discussing