
#nanotrading
nanotrading
34,648 views
236 Discussing
Hot
Latest

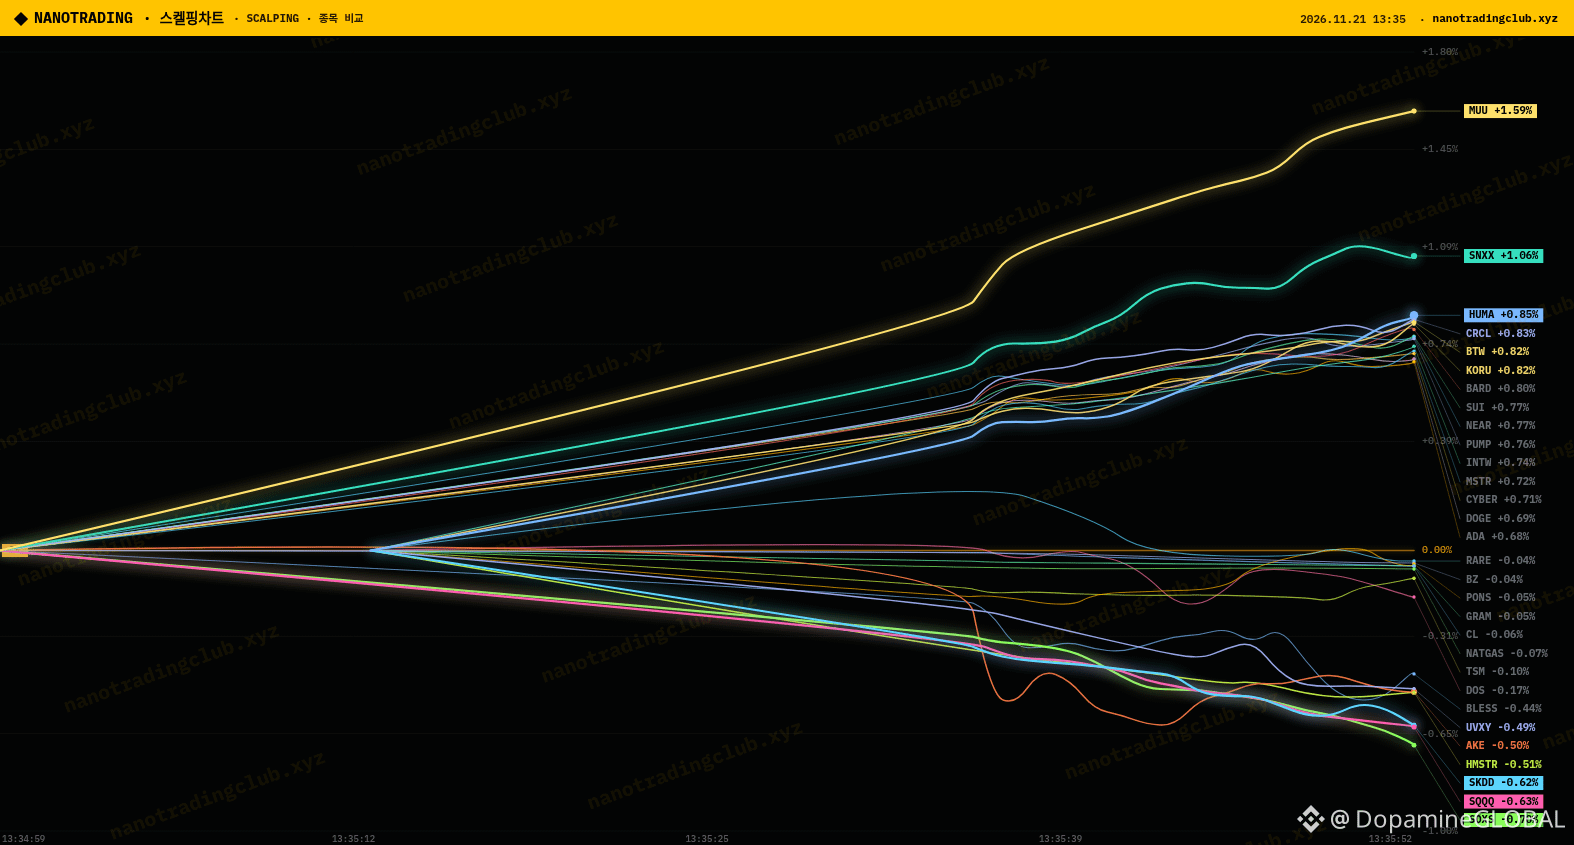
Brutal tape right now. NanoTrading's scalp board shows $BTC at 56,134.5 (-8.69%), with only 33 of 250 perp pairs green and 217 red. Fear & Greed is sitting at 12 and BTC dominance at 57.2%.
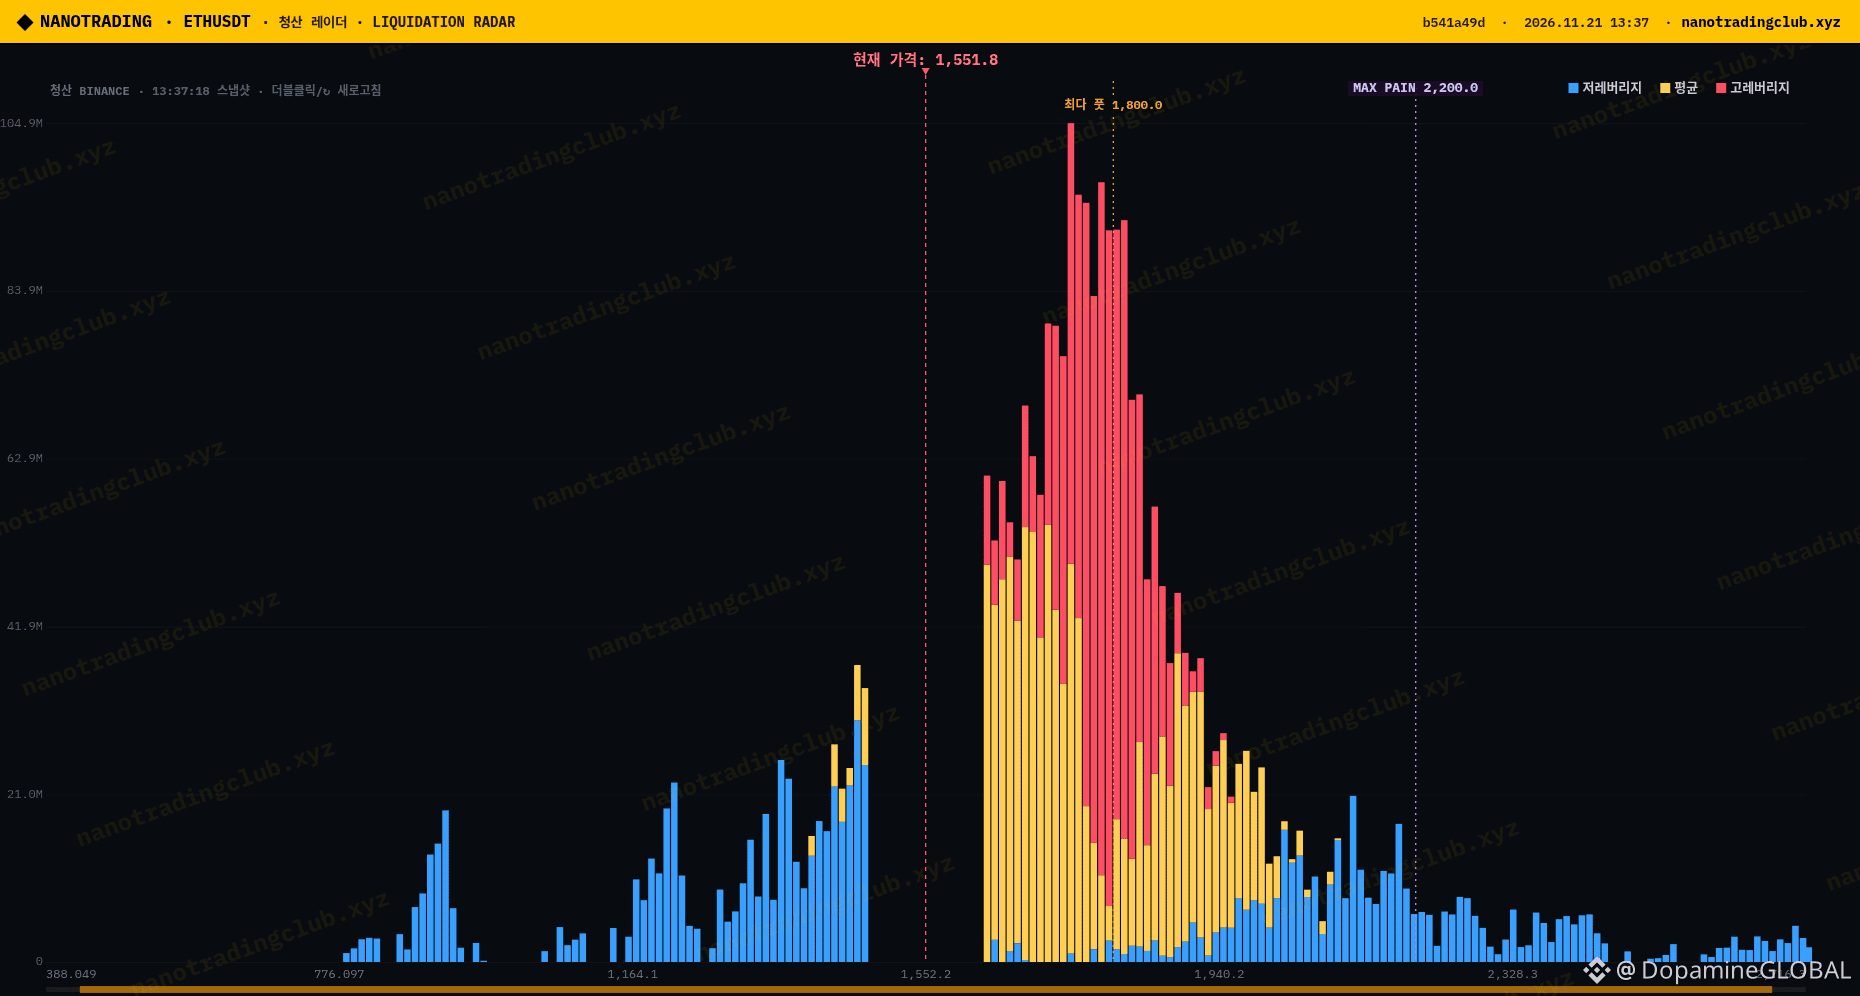
$ETH is getting hit harder, down 9.85% to around 1,554. The liquidation radar puts the most longs stacked at 1,800, and options max pain is way up at 2,200. That's a big gap from where price is now.
What I'm watching are the bid walls on the scanner: BTC has a $57.22M buy wall at 54,997 (-1.81% away), ETH $13.74M at 1,499, and $BNB $3.12M at 499.9. If those get eaten, the flush probably isn't done.
Do you think those walls hold, or is this the kind of day where they get pulled? 👀
NFA, just how I'm reading it.
Source: NanoTrading scalp chart + liquidation radar/wall scanner (nanotradingclub.xyz)
#NanoTrading #BTC #ETH #CryptoMarket #FearAndGreed
Brutal tape right now. NanoTrading's scalp board shows $BTC at 56,134.5 (-8.69%), with only 33 of 250 perp pairs green and 217 red. Fear & Greed is sitting at 12 and BTC dominance at 57.2%.
$ETH is getting hit harder, down 9.85% to around 1,554. The liquidation radar puts the most longs stacked at 1,800, and options max pain is way up at 2,200. That's a big gap from where price is now.
What I'm watching are the bid walls on the scanner: BTC has a $57.22M buy wall at 54,997 (-1.81% away), ETH $13.74M at 1,499, and $BNB $3.12M at 499.9. If those get eaten, the flush probably isn't done.
Do you think those walls hold, or is this the kind of day where they get pulled? 👀
NFA, just how I'm reading it.
Source: NanoTrading scalp chart + liquidation radar/wall scanner (nanotradingclub.xyz)
#NanoTrading #BTC #ETH #CryptoMarket #FearAndGreed
$ETH is getting hit harder, down 9.85% to around 1,554. The liquidation radar puts the most longs stacked at 1,800, and options max pain is way up at 2,200. That's a big gap from where price is now.
What I'm watching are the bid walls on the scanner: BTC has a $57.22M buy wall at 54,997 (-1.81% away), ETH $13.74M at 1,499, and $BNB $3.12M at 499.9. If those get eaten, the flush probably isn't done.
Do you think those walls hold, or is this the kind of day where they get pulled? 👀
NFA, just how I'm reading it.
Source: NanoTrading scalp chart + liquidation radar/wall scanner (nanotradingclub.xyz)
#NanoTrading #BTC #ETH #CryptoMarket #FearAndGreed
112
Quick tip on reading a liquidation radar, using $ETH right now as the example.
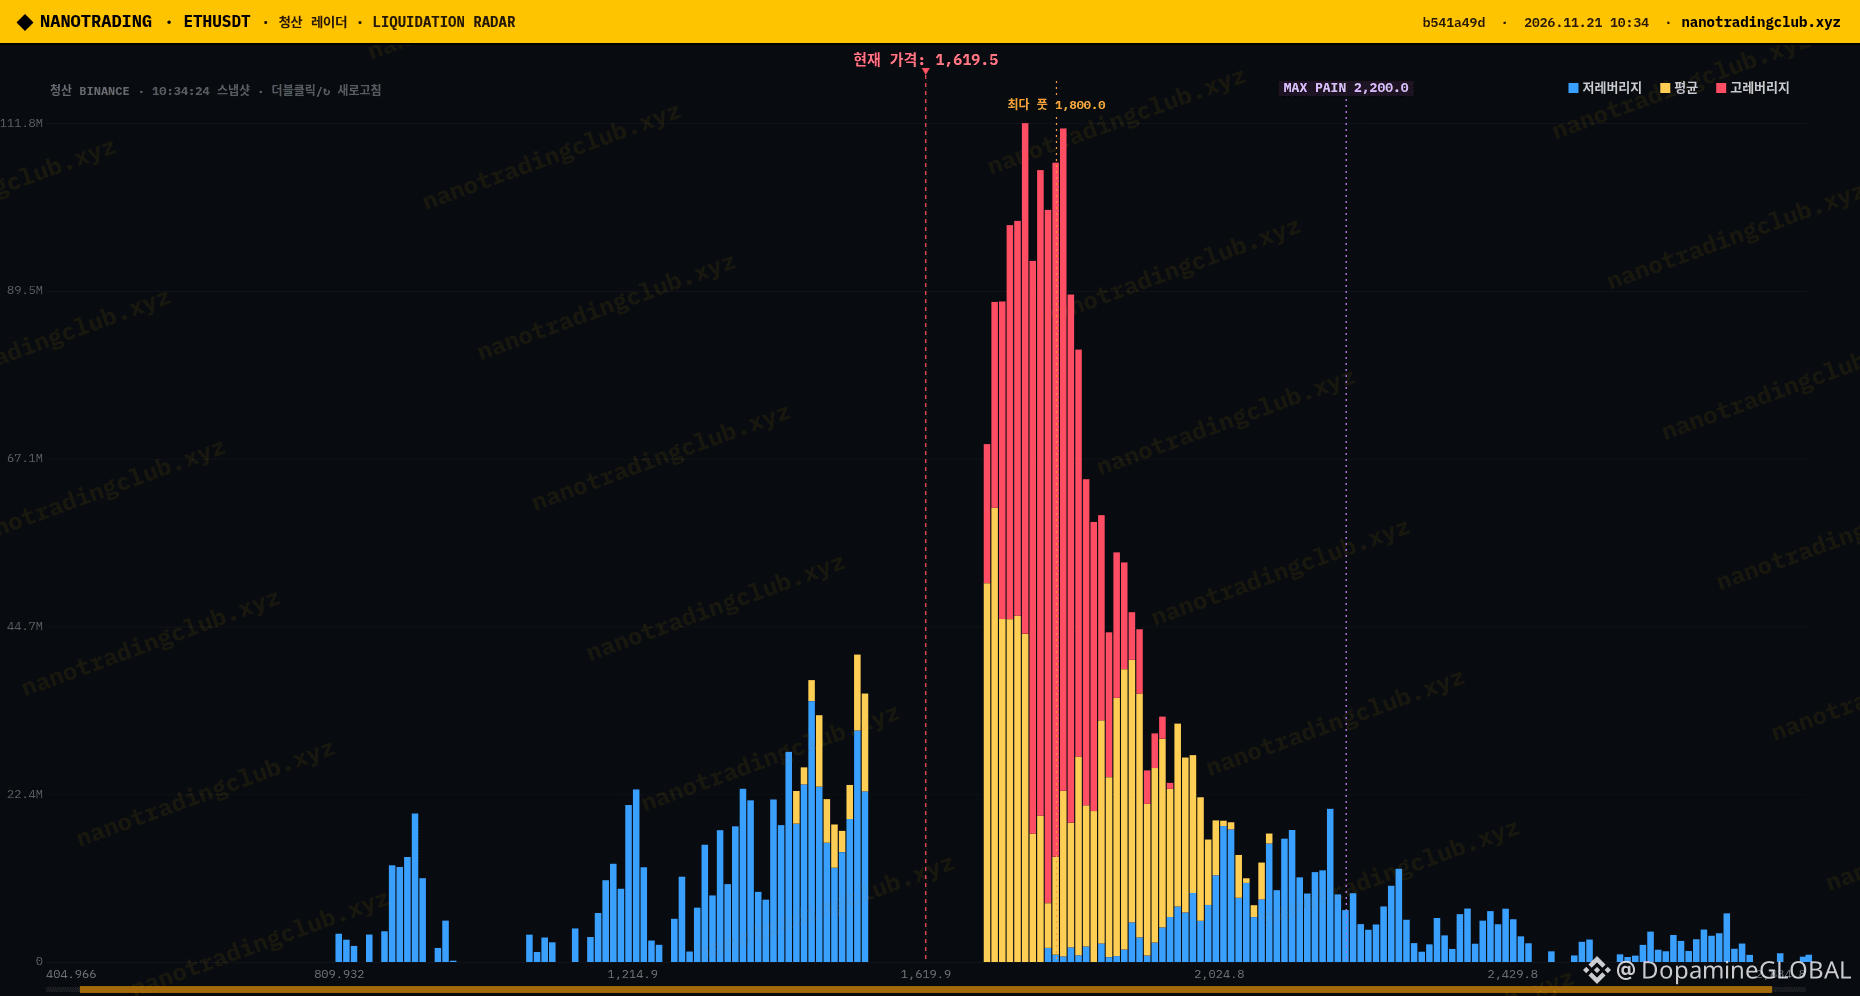
On NanoTrading's radar the x-axis is price and the bar height is estimated liquidation size. The colors are leverage tiers: blue is low leverage, yellow is average, red is high leverage. The dashed line is current price, around 1,619 for $ETH.
What I look at first is where the red sits. Right now the tallest stack is above price, roughly 1,750-1,850 and peaking at 1,800. It's mostly red, so that's high-leverage shorts that get forced out if price runs there. Below price it's mostly blue bars of ~20-30M around 1,350-1,550, which is low-leverage stuff that doesn't cascade the same way.
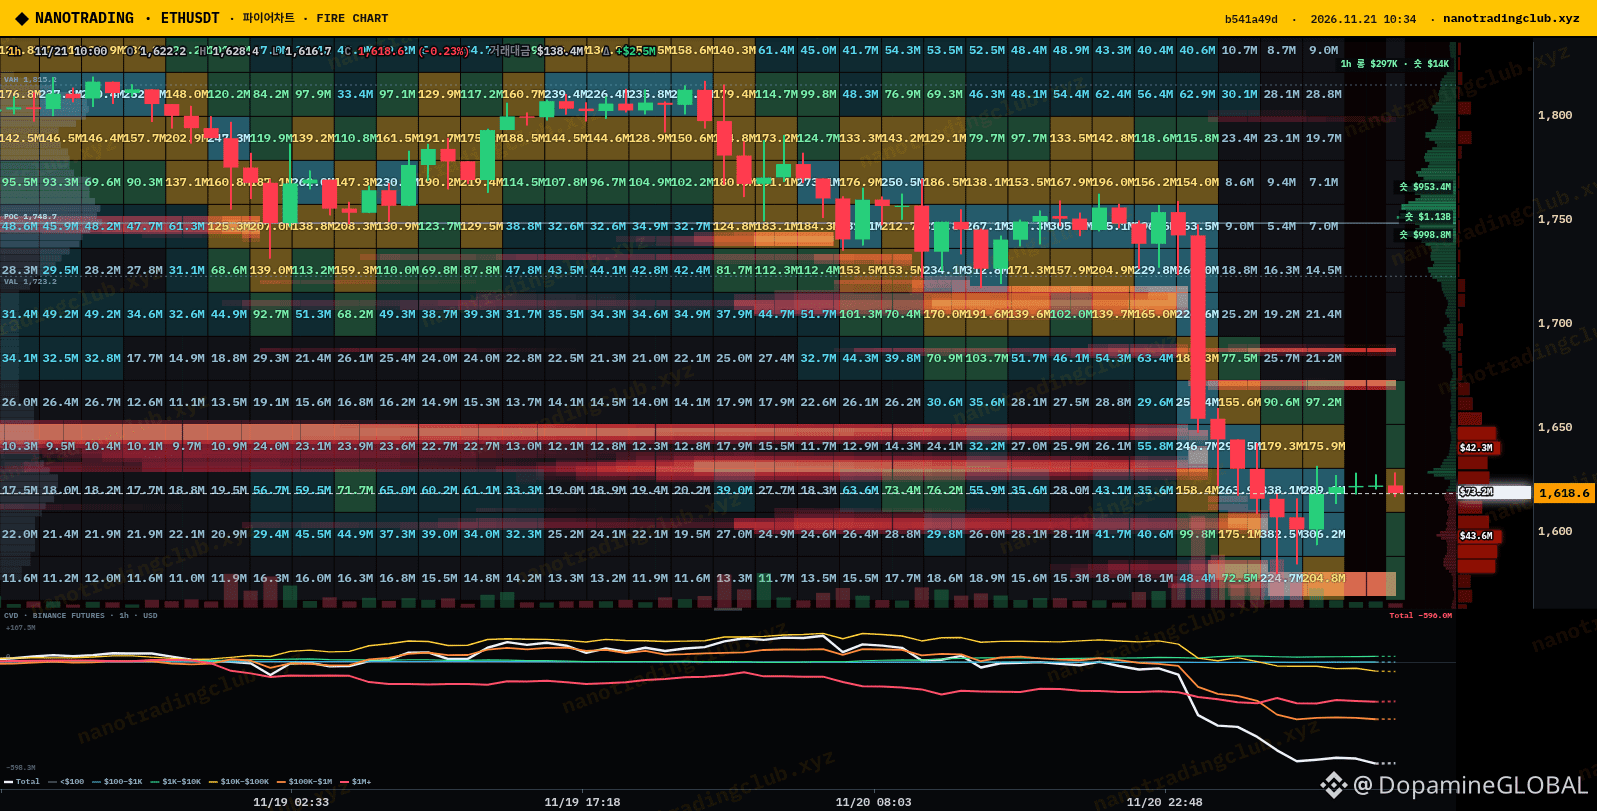
So the radar reads lopsided: more forced-buying fuel above than forced selling below. That doesn't call the direction, it just shows where a move could speed up. The second image is the 1h Fire chart with integrated orderbook liquidity for context.
Do you check liquidation maps before entries, or just price action?
NFA, just how I read it.
Source: NanoTrading liquidation radar + Fire chart (nanotradingclub.xyz)
#NanoTrading #ETH #Ethereum #TradingTips
Quick tip on reading a liquidation radar, using $ETH right now as the example.
On NanoTrading's radar the x-axis is price and the bar height is estimated liquidation size. The colors are leverage tiers: blue is low leverage, yellow is average, red is high leverage. The dashed line is current price, around 1,619 for $ETH .
What I look at first is where the red sits. Right now the tallest stack is above price, roughly 1,750-1,850 and peaking at 1,800. It's mostly red, so that's high-leverage shorts that get forced out if price runs there. Below price it's mostly blue bars of ~20-30M around 1,350-1,550, which is low-leverage stuff that doesn't cascade the same way.
So the radar reads lopsided: more forced-buying fuel above than forced selling below. That doesn't call the direction, it just shows where a move could speed up. The second image is the 1h Fire chart with integrated orderbook liquidity for context.
Do you check liquidation maps before entries, or just price action?
NFA, just how I read it.
Source: NanoTrading liquidation radar + Fire chart (nanotradingclub.xyz)
#NanoTrading #ETH #Ethereum #TradingTips
On NanoTrading's radar the x-axis is price and the bar height is estimated liquidation size. The colors are leverage tiers: blue is low leverage, yellow is average, red is high leverage. The dashed line is current price, around 1,619 for $ETH .
What I look at first is where the red sits. Right now the tallest stack is above price, roughly 1,750-1,850 and peaking at 1,800. It's mostly red, so that's high-leverage shorts that get forced out if price runs there. Below price it's mostly blue bars of ~20-30M around 1,350-1,550, which is low-leverage stuff that doesn't cascade the same way.
So the radar reads lopsided: more forced-buying fuel above than forced selling below. That doesn't call the direction, it just shows where a move could speed up. The second image is the 1h Fire chart with integrated orderbook liquidity for context.
Do you check liquidation maps before entries, or just price action?
NFA, just how I read it.
Source: NanoTrading liquidation radar + Fire chart (nanotradingclub.xyz)
#NanoTrading #ETH #Ethereum #TradingTips
1
105
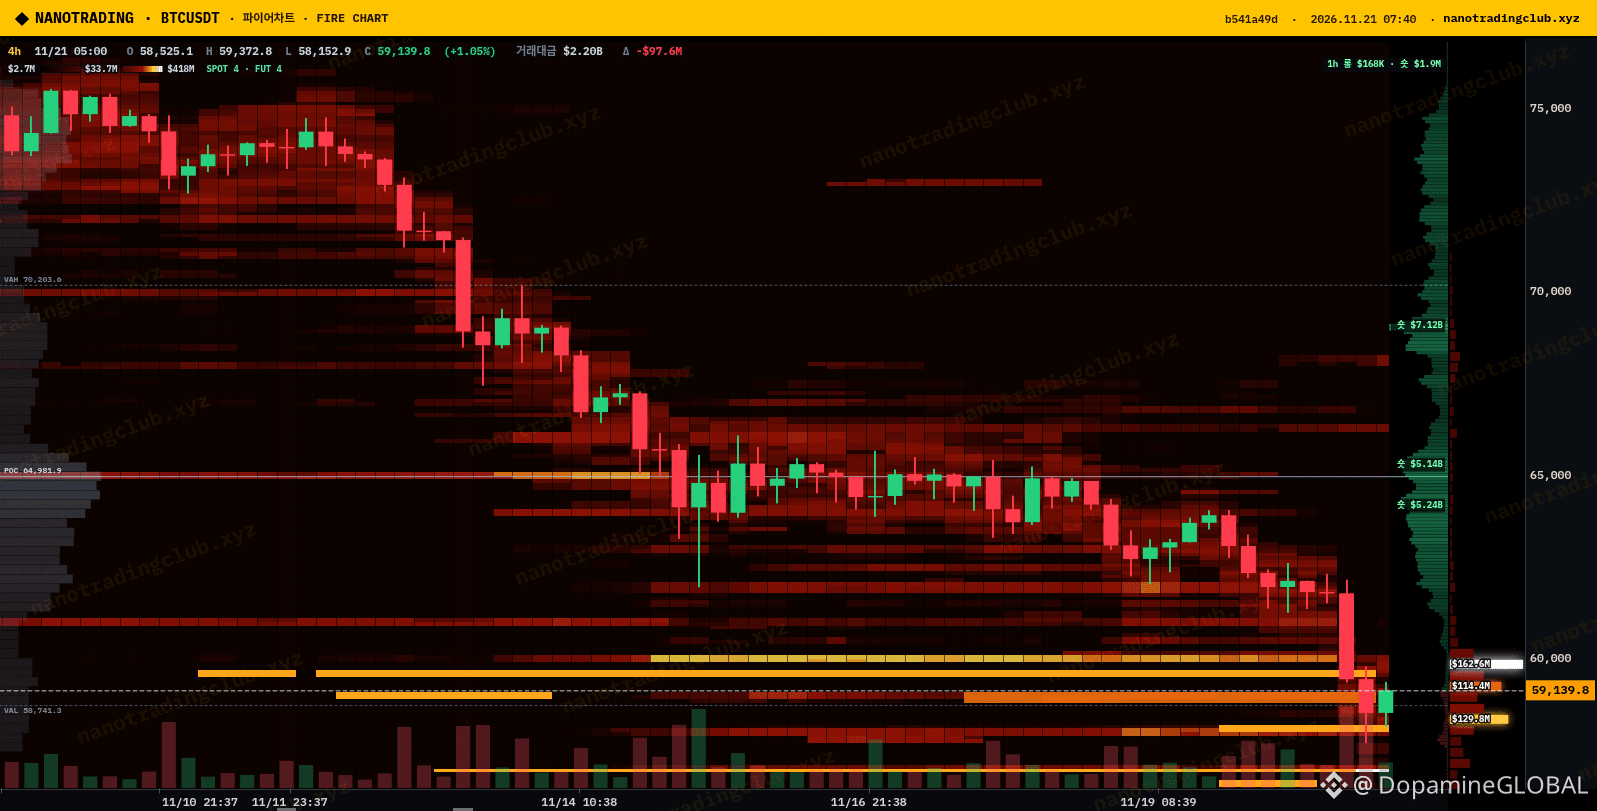
$BTC is sitting right on its own liquidity this morning, around 59.1k after another ~5% red day.
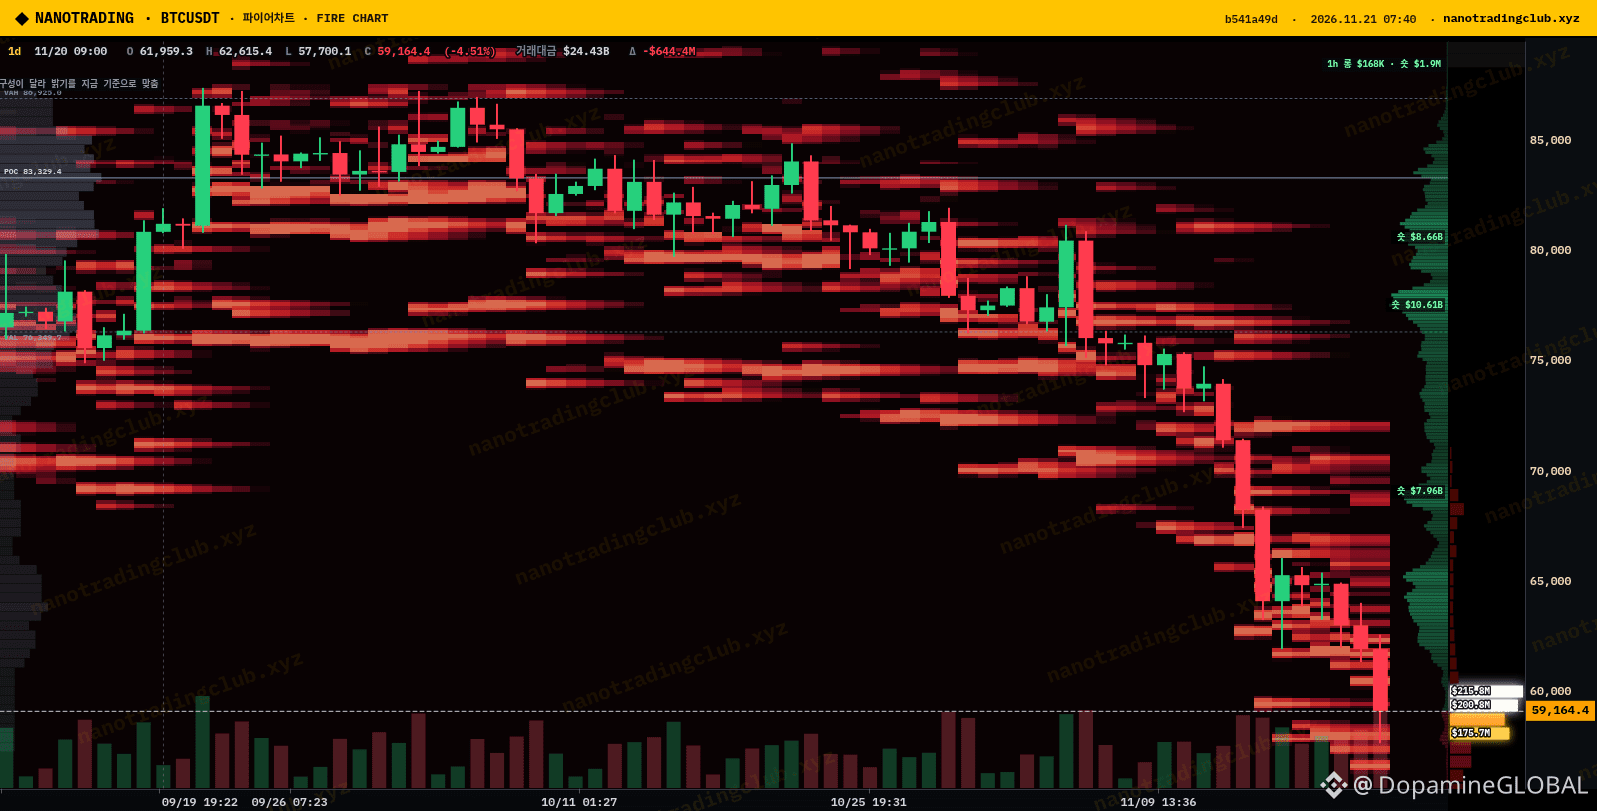
On NanoTrading's 4h Fire heatmap the bright band is 59-60k, basically under our feet. Overhead it's thin until the big short labels: ~64.5k and ~65.5k (about $5B each), then ~70.5k at ~$7.1B. The 1d liquidation view stacks even more up at 76-80k.
So two paths for me: $BTC loses the 59k band and flushes into empty space below, or it holds and grinds up toward the 64-65k short fuel first.
Which comes first, sub-58k or 64k? Drop your pick 👇
NFA, just reading the maps.
Charts: NanoTrading Fire chart, 4h liquidity heatmap + 1d liquidation heatmap (nanotradingclub.xyz)
#NanoTrading #BTC #Bitcoin #CryptoMarket
$BTC is sitting right on its own liquidity this morning, around 59.1k after another ~5% red day.
On NanoTrading's 4h Fire heatmap the bright band is 59-60k, basically under our feet. Overhead it's thin until the big short labels: ~64.5k and ~65.5k (about $5B each), then ~70.5k at ~$7.1B. The 1d liquidation view stacks even more up at 76-80k.
So two paths for me: $BTC loses the 59k band and flushes into empty space below, or it holds and grinds up toward the 64-65k short fuel first.
Which comes first, sub-58k or 64k? Drop your pick 👇
NFA, just reading the maps.
Charts: NanoTrading Fire chart, 4h liquidity heatmap + 1d liquidation heatmap (nanotradingclub.xyz)
#NanoTrading #BTC #Bitcoin #CryptoMarket
On NanoTrading's 4h Fire heatmap the bright band is 59-60k, basically under our feet. Overhead it's thin until the big short labels: ~64.5k and ~65.5k (about $5B each), then ~70.5k at ~$7.1B. The 1d liquidation view stacks even more up at 76-80k.
So two paths for me: $BTC loses the 59k band and flushes into empty space below, or it holds and grinds up toward the 64-65k short fuel first.
Which comes first, sub-58k or 64k? Drop your pick 👇
NFA, just reading the maps.
Charts: NanoTrading Fire chart, 4h liquidity heatmap + 1d liquidation heatmap (nanotradingclub.xyz)
#NanoTrading #BTC #Bitcoin #CryptoMarket
94
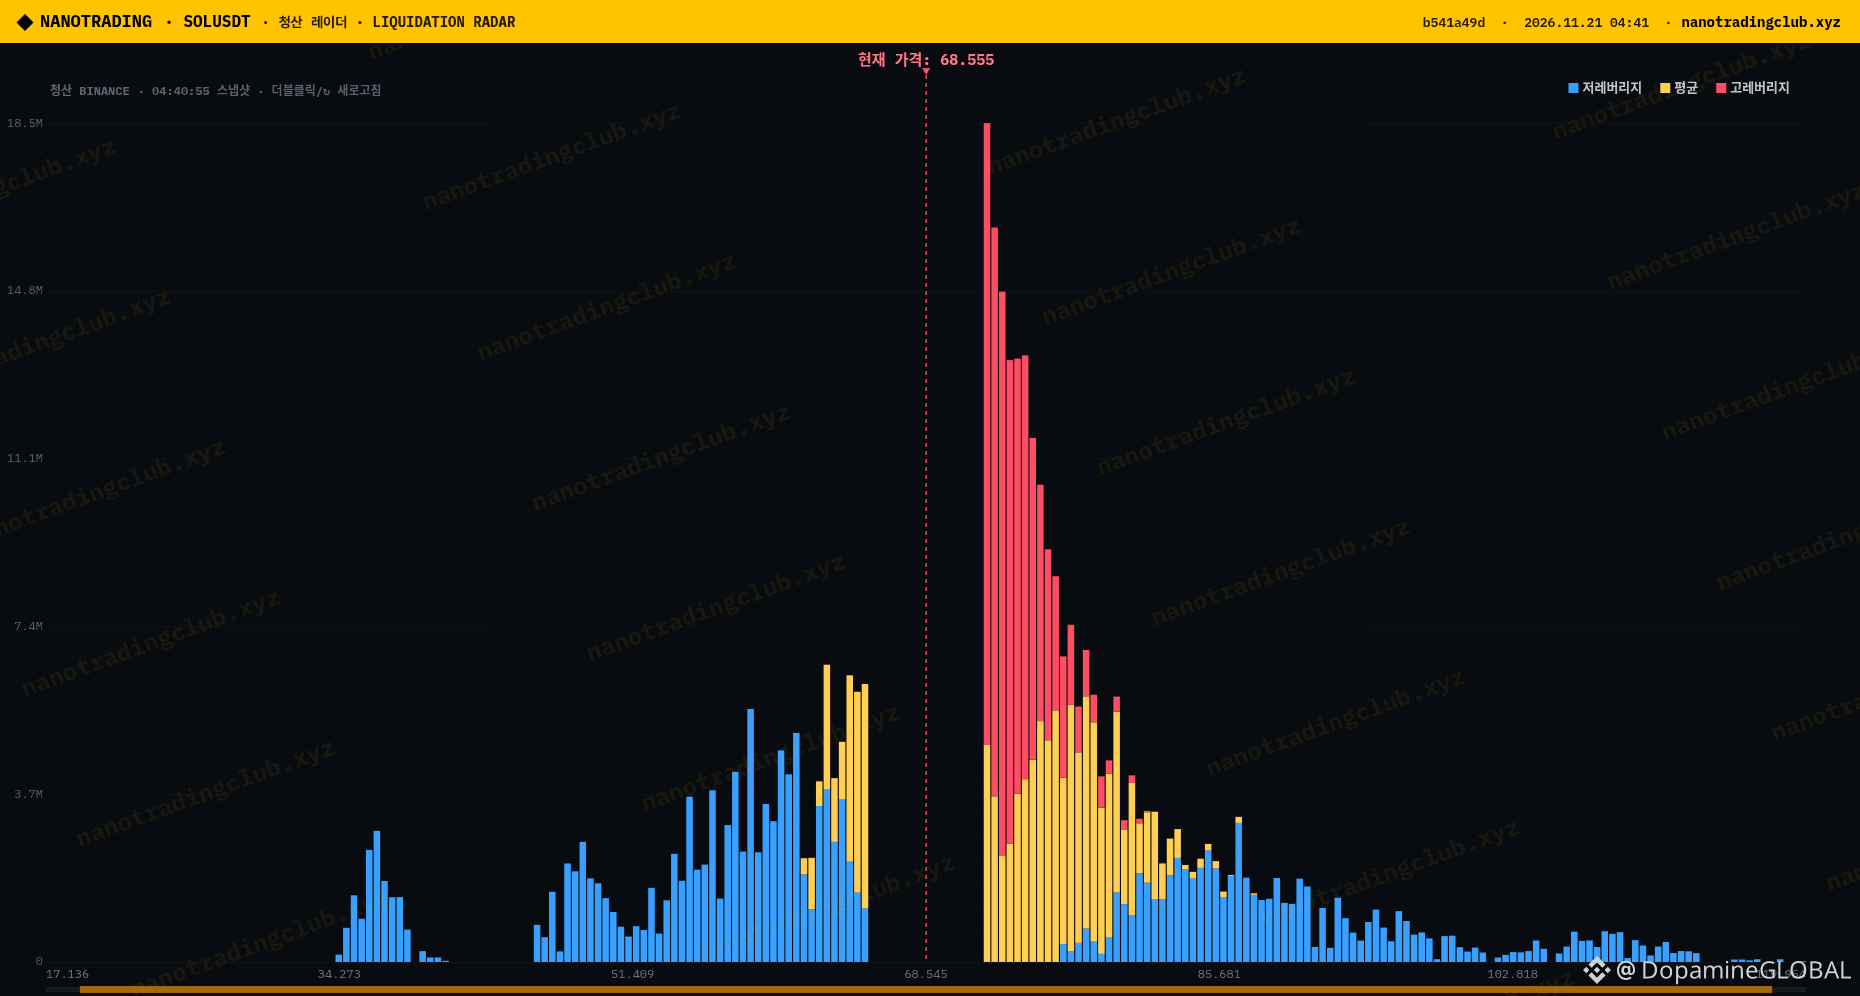
Three liquidation radars I checked tonight, and all three are lopsided the same way: the fuel sits above price.
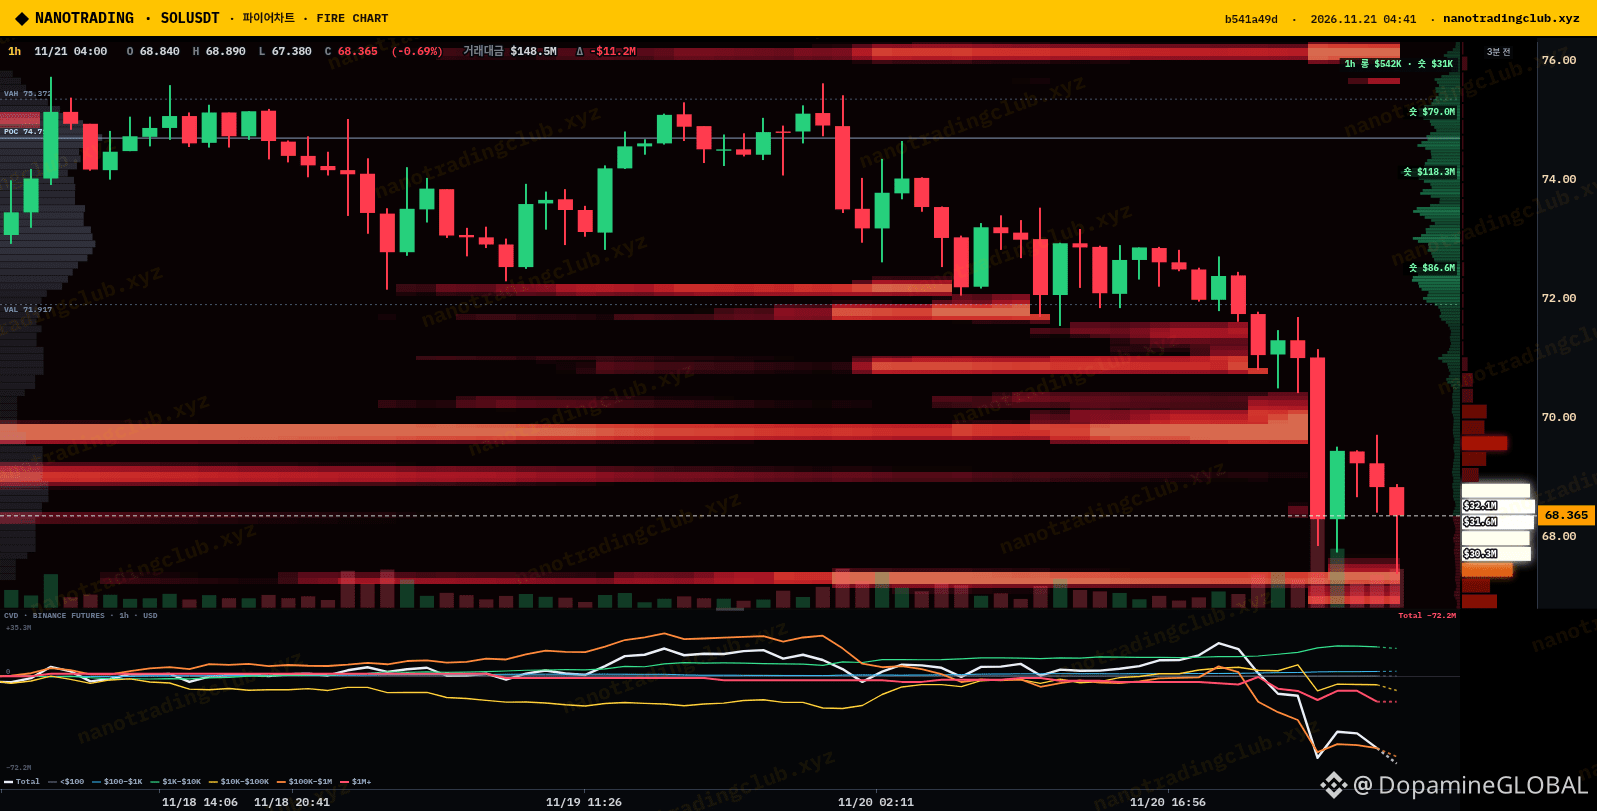
$SOL around 68.5 is the loudest. The biggest high-leverage stack starts just over price and runs up toward ~76, with the tallest bar near 18.5M on NanoTrading's radar. Below price it's mostly low-leverage stuff, much thinner. On the 1h Fire chart the heavy bands are right at 68-72.
$XRP at ~0.90 has its tallest red spike around 0.95, then layers out toward 1.1. Below, just small 2-3M bars.
$BNB at ~536 has a fat red/yellow wall roughly 565-660, peaking near 595. Downside is light by comparison.
After a dump like today, that's a lot of short liquidations stacked overhead. Squeeze magnet or do they just keep pressing? 👀 Which of the three would you watch?
NFA, just reading the maps.
Charts: NanoTrading liquidation radar + Fire chart (nanotradingclub.xyz)
#NanoTrading #SOL #XRP #BNB #CryptoMarket
Three liquidation radars I checked tonight, and all three are lopsided the same way: the fuel sits above price.
$SOL around 68.5 is the loudest. The biggest high-leverage stack starts just over price and runs up toward ~76, with the tallest bar near 18.5M on NanoTrading's radar. Below price it's mostly low-leverage stuff, much thinner. On the 1h Fire chart the heavy bands are right at 68-72.
$XRP at ~0.90 has its tallest red spike around 0.95, then layers out toward 1.1. Below, just small 2-3M bars.
$BNB at ~536 has a fat red/yellow wall roughly 565-660, peaking near 595. Downside is light by comparison.
After a dump like today, that's a lot of short liquidations stacked overhead. Squeeze magnet or do they just keep pressing? 👀 Which of the three would you watch?
NFA, just reading the maps.
Charts: NanoTrading liquidation radar + Fire chart (nanotradingclub.xyz)
#NanoTrading #SOL #XRP #BNB #CryptoMarket
$SOL around 68.5 is the loudest. The biggest high-leverage stack starts just over price and runs up toward ~76, with the tallest bar near 18.5M on NanoTrading's radar. Below price it's mostly low-leverage stuff, much thinner. On the 1h Fire chart the heavy bands are right at 68-72.
$XRP at ~0.90 has its tallest red spike around 0.95, then layers out toward 1.1. Below, just small 2-3M bars.
$BNB at ~536 has a fat red/yellow wall roughly 565-660, peaking near 595. Downside is light by comparison.
After a dump like today, that's a lot of short liquidations stacked overhead. Squeeze magnet or do they just keep pressing? 👀 Which of the three would you watch?
NFA, just reading the maps.
Charts: NanoTrading liquidation radar + Fire chart (nanotradingclub.xyz)
#NanoTrading #SOL #XRP #BNB #CryptoMarket
157
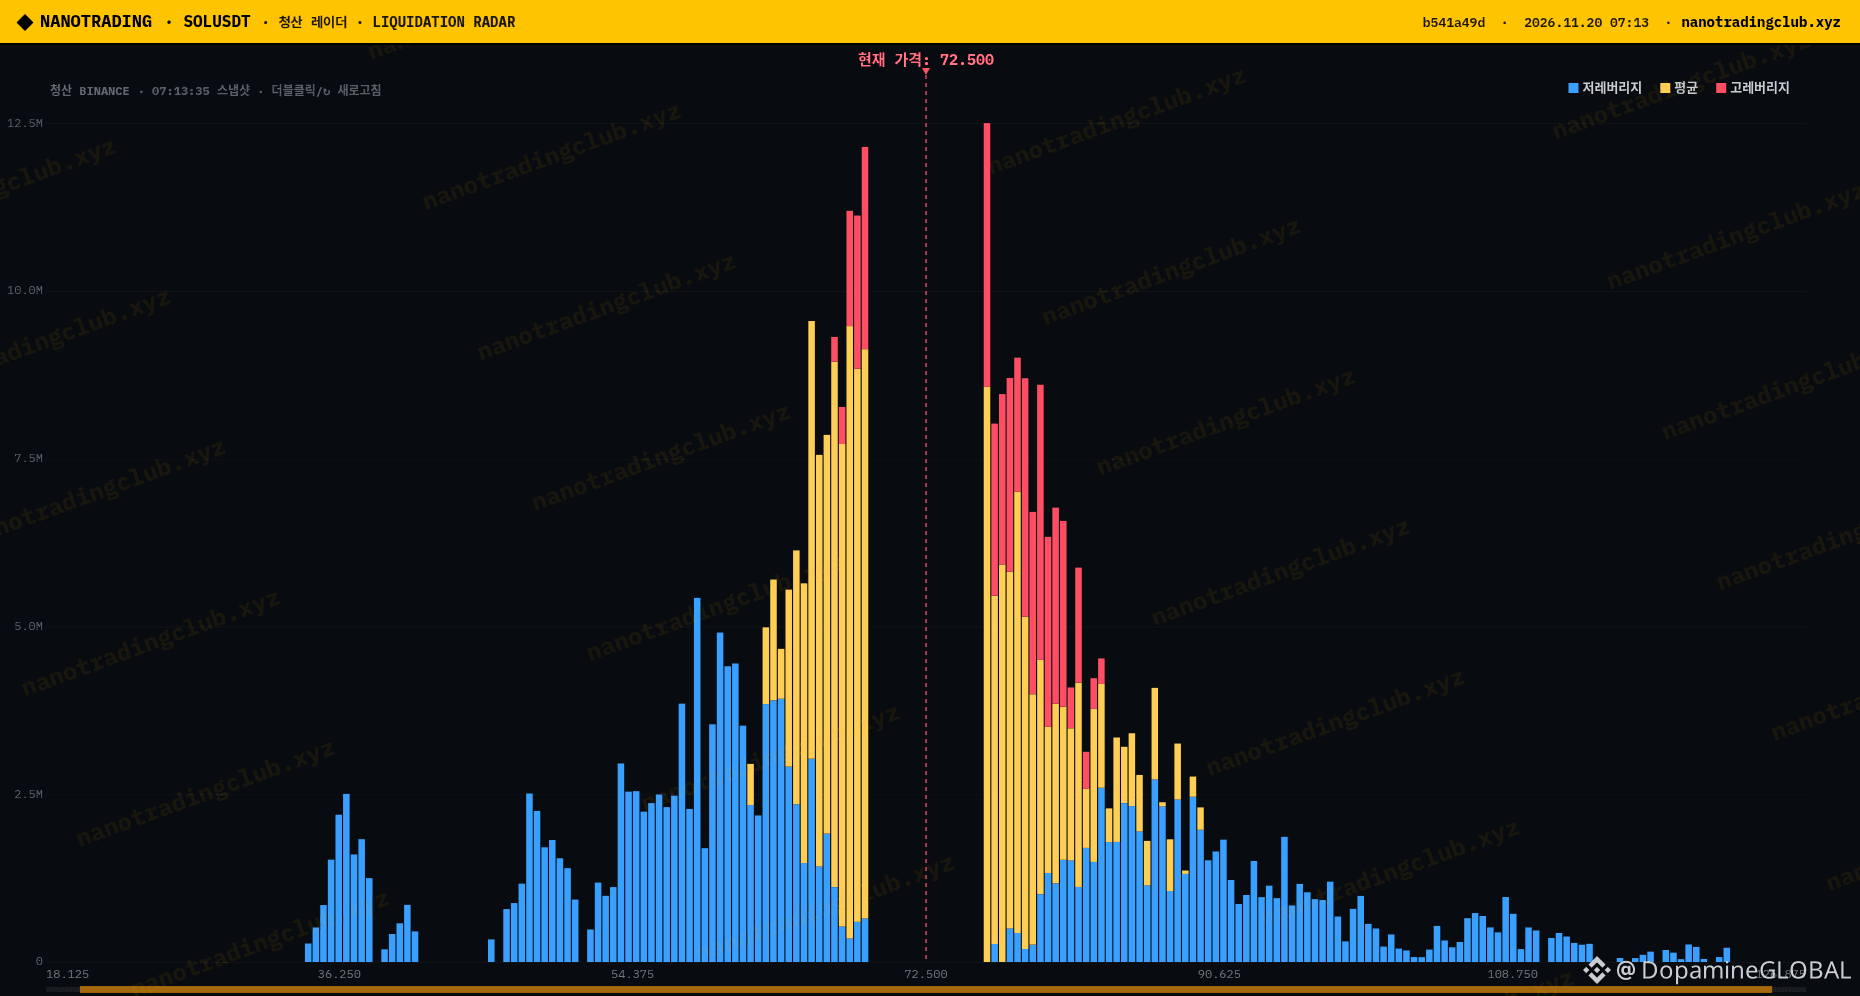
$SOL is boxed between two liquidation pockets on NanoTrading's radar and I genuinely can't call which one gets tagged first.
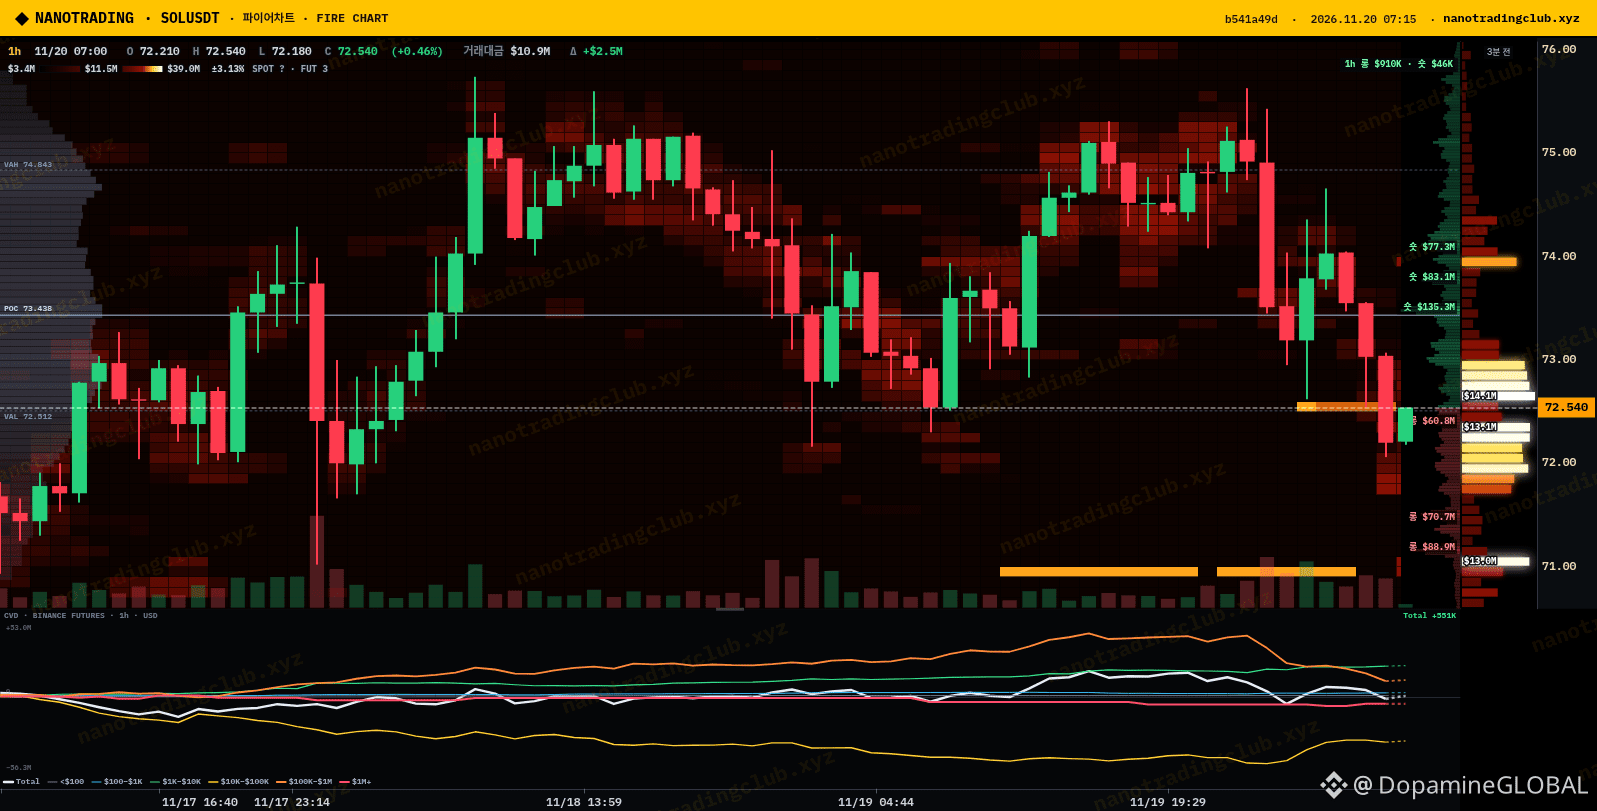
Above, the biggest short cluster sits around $76.1 (about $6.0M of shorts per the radar). Below, the long cluster at $68.7 is roughly the same size, about $6.2M. Price is chopping near $72.5 right in the middle, with $13-14M bid/ask walls stacked tight around it on the 1h heatmap.
So: does $SOL squeeze up into $76 first, or flush down to $68.7 first? Drop your pick below 👇
NFA, just a coin flip I'm watching.
Source: NanoTrading liquidation radar + Fire chart 1h heatmap (nanotradingclub.xyz)
#SOL #Solana #NanoTrading
$SOL is boxed between two liquidation pockets on NanoTrading's radar and I genuinely can't call which one gets tagged first.
Above, the biggest short cluster sits around $76.1 (about $6.0M of shorts per the radar). Below, the long cluster at $68.7 is roughly the same size, about $6.2M. Price is chopping near $72.5 right in the middle, with $13-14M bid/ask walls stacked tight around it on the 1h heatmap.
So: does $SOL squeeze up into $76 first, or flush down to $68.7 first? Drop your pick below 👇
NFA, just a coin flip I'm watching.
Source: NanoTrading liquidation radar + Fire chart 1h heatmap (nanotradingclub.xyz)
#SOL #Solana #NanoTrading
Above, the biggest short cluster sits around $76.1 (about $6.0M of shorts per the radar). Below, the long cluster at $68.7 is roughly the same size, about $6.2M. Price is chopping near $72.5 right in the middle, with $13-14M bid/ask walls stacked tight around it on the 1h heatmap.
So: does $SOL squeeze up into $76 first, or flush down to $68.7 first? Drop your pick below 👇
NFA, just a coin flip I'm watching.
Source: NanoTrading liquidation radar + Fire chart 1h heatmap (nanotradingclub.xyz)
#SOL #Solana #NanoTrading
38
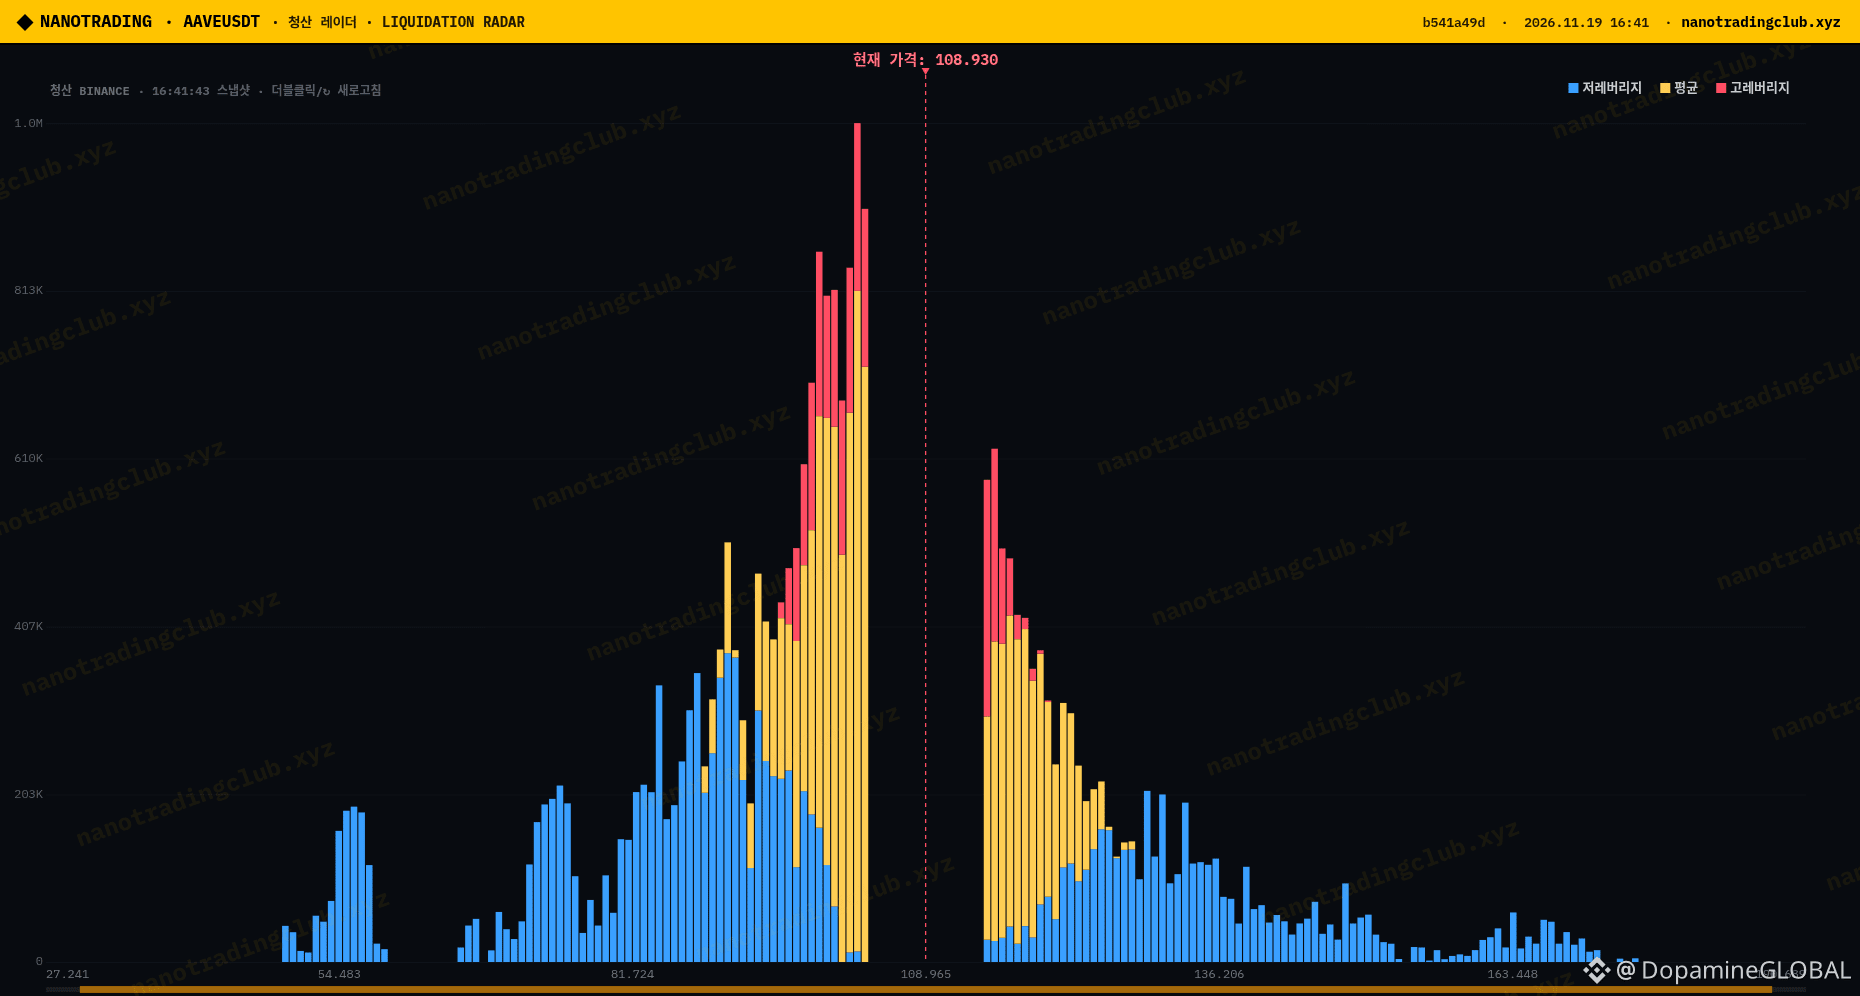
$AAVE is sitting right between two liquidation pools on the NanoTrading radar, quick poll 👇
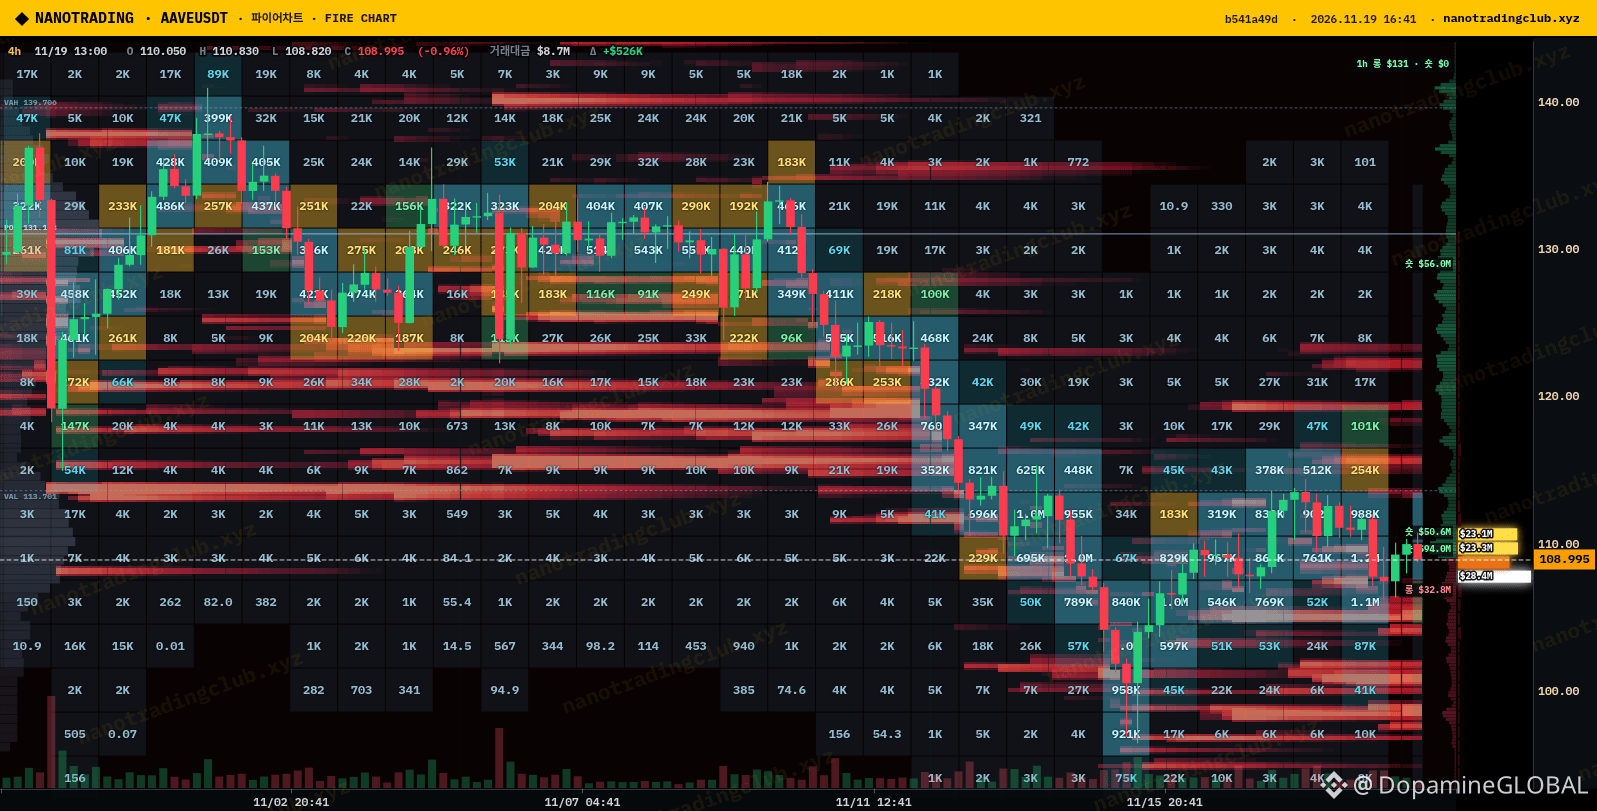
Price ~108.9. The heavier cluster is just below at roughly 107-108 (peaks near 1.0M on the radar axis, avg leverage with a high-lev top), with a second block around 95-100. Above, the pool sits at ~110-111 (about 0.7M) and thins out past ~118. On the 4h heatmap the strongest streaks are packed just under price.
Levels are read off the chart axis, so treat them as zones.
Which gets swept first?
A) down into 107-108 longs
B) up into 110-111 shorts
C) chops between both all evening
Drop A, B or C below.
Data: NanoTrading liquidation radar + 4h liq heatmap. NFA.
#NanoTrading #AAVE #DeFi #Liquidation
$AAVE is sitting right between two liquidation pools on the NanoTrading radar, quick poll 👇
Price ~108.9. The heavier cluster is just below at roughly 107-108 (peaks near 1.0M on the radar axis, avg leverage with a high-lev top), with a second block around 95-100. Above, the pool sits at ~110-111 (about 0.7M) and thins out past ~118. On the 4h heatmap the strongest streaks are packed just under price.
Levels are read off the chart axis, so treat them as zones.
Which gets swept first?
A) down into 107-108 longs
B) up into 110-111 shorts
C) chops between both all evening
Drop A, B or C below.
Data: NanoTrading liquidation radar + 4h liq heatmap. NFA.
#NanoTrading #AAVE #DeFi #Liquidation
Price ~108.9. The heavier cluster is just below at roughly 107-108 (peaks near 1.0M on the radar axis, avg leverage with a high-lev top), with a second block around 95-100. Above, the pool sits at ~110-111 (about 0.7M) and thins out past ~118. On the 4h heatmap the strongest streaks are packed just under price.
Levels are read off the chart axis, so treat them as zones.
Which gets swept first?
A) down into 107-108 longs
B) up into 110-111 shorts
C) chops between both all evening
Drop A, B or C below.
Data: NanoTrading liquidation radar + 4h liq heatmap. NFA.
#NanoTrading #AAVE #DeFi #Liquidation
22
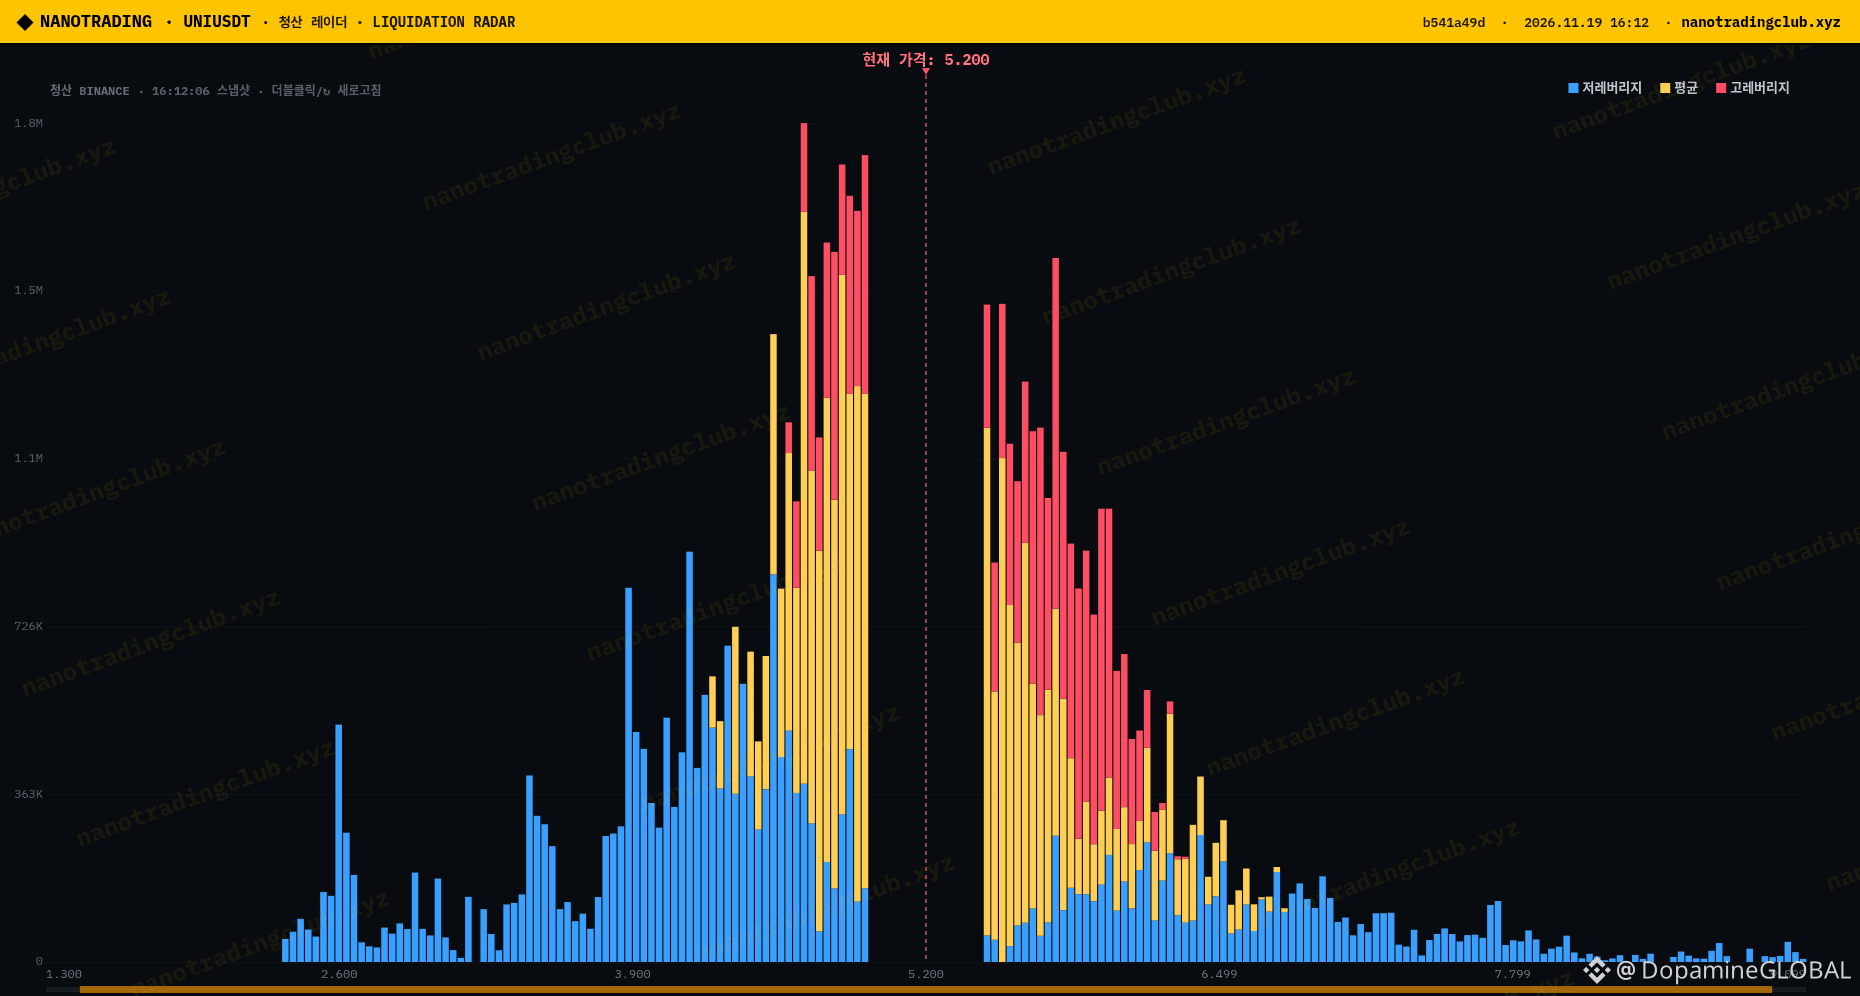
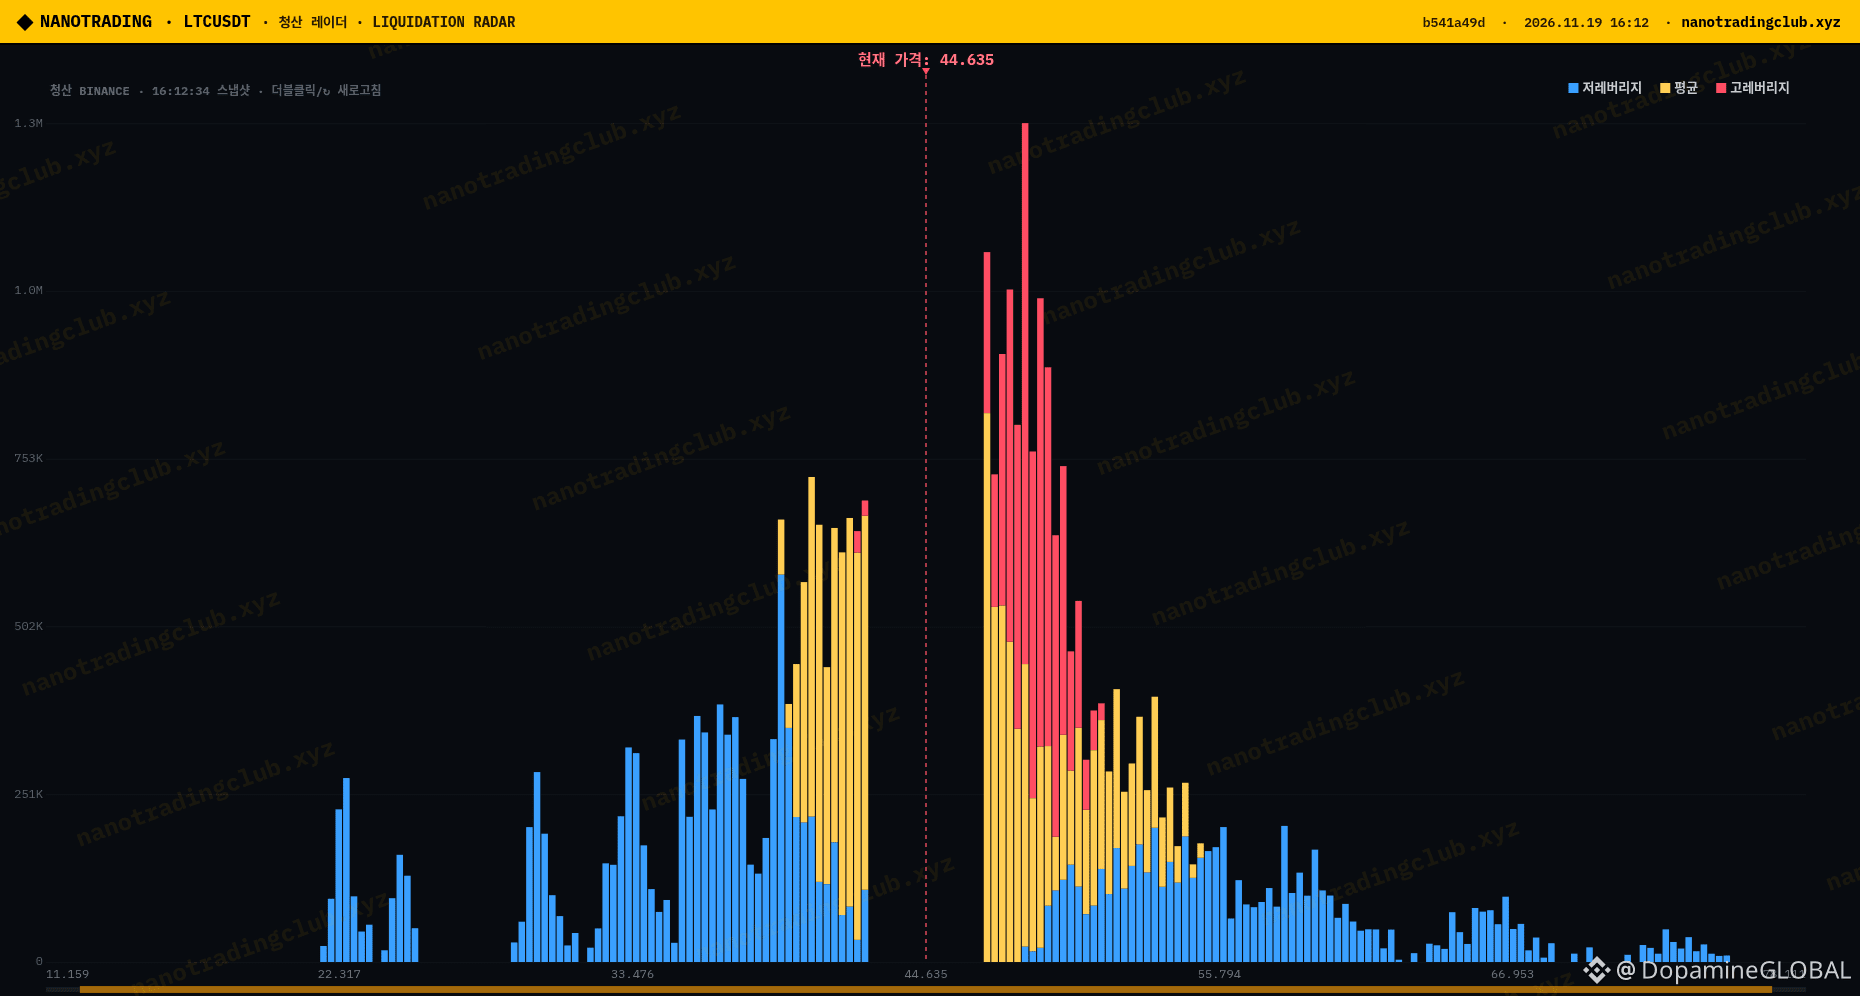
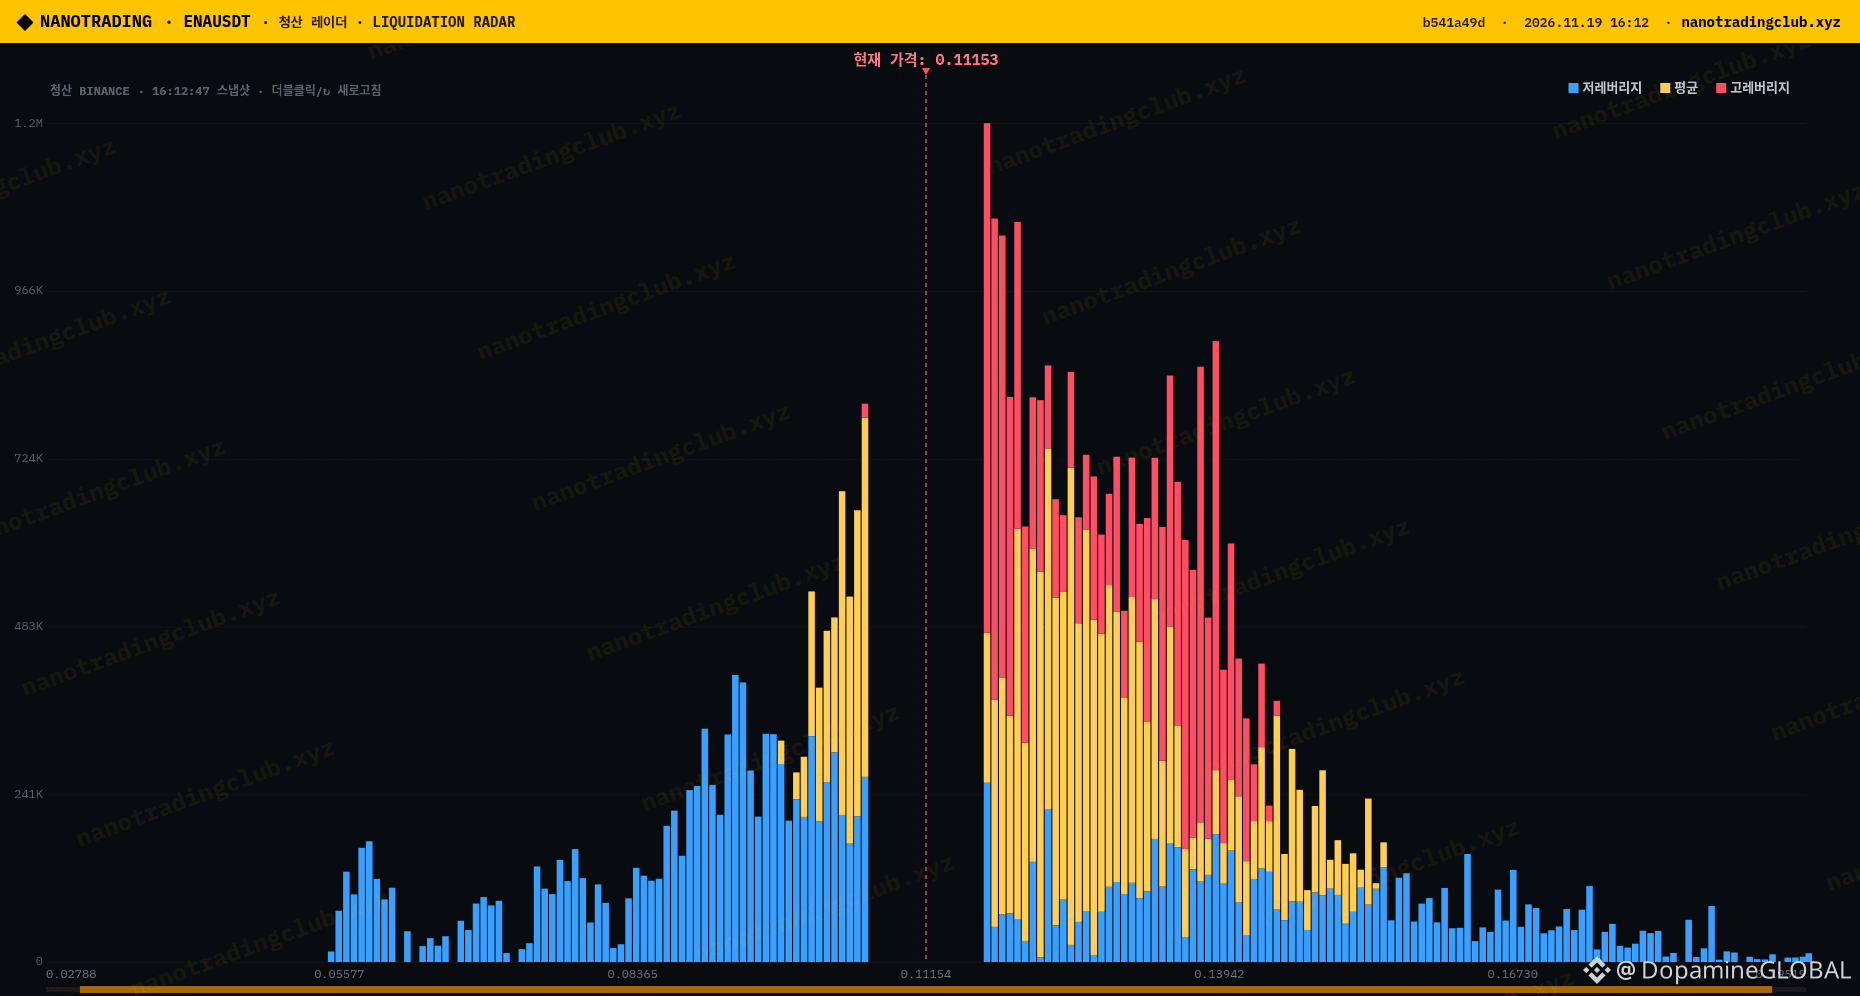
$UNI, $LTC and $ENA are the three liquidation magnets I'm watching right now on the NanoTrading radar 🧲
1) $UNI ~5.20: biggest stack sits below at roughly 4.7 (axis tops ~1.9M), mostly avg leverage with a high-lev cap. Smaller pocket above near 5.7.
2) $LTC ~44.6: the fat cluster is above, around 48-49, red bars = high leverage. A thinner pocket below near 42-43.
3) $ENA ~0.1115: wide red band just above at ~0.118. Close to price and mostly high leverage, so this one could get swept first.
Levels are read off the radar axis, so treat them as zones not exact prices. Price tends to drift toward the biggest pools, but not always.
Which one gets tagged first, UNI down to 4.7 or ENA up to 0.118?
Data: NanoTrading liquidation radar (Binance snapshot). NFA.
#NanoTrading #UNI #LTC #ENA #Liquidation
$UNI , $LTC and $ENA are the three liquidation magnets I'm watching right now on the NanoTrading radar 🧲
1) $UNI ~5.20: biggest stack sits below at roughly 4.7 (axis tops ~1.9M), mostly avg leverage with a high-lev cap. Smaller pocket above near 5.7.
2) $LTC ~44.6: the fat cluster is above, around 48-49, red bars = high leverage. A thinner pocket below near 42-43.
3) $ENA ~0.1115: wide red band just above at ~0.118. Close to price and mostly high leverage, so this one could get swept first.
Levels are read off the radar axis, so treat them as zones not exact prices. Price tends to drift toward the biggest pools, but not always.
Which one gets tagged first, UNI down to 4.7 or ENA up to 0.118?
Data: NanoTrading liquidation radar (Binance snapshot). NFA.
#NanoTrading #UNI #LTC #ENA #Liquidation
1) $UNI ~5.20: biggest stack sits below at roughly 4.7 (axis tops ~1.9M), mostly avg leverage with a high-lev cap. Smaller pocket above near 5.7.
2) $LTC ~44.6: the fat cluster is above, around 48-49, red bars = high leverage. A thinner pocket below near 42-43.
3) $ENA ~0.1115: wide red band just above at ~0.118. Close to price and mostly high leverage, so this one could get swept first.
Levels are read off the radar axis, so treat them as zones not exact prices. Price tends to drift toward the biggest pools, but not always.
Which one gets tagged first, UNI down to 4.7 or ENA up to 0.118?
Data: NanoTrading liquidation radar (Binance snapshot). NFA.
#NanoTrading #UNI #LTC #ENA #Liquidation
329
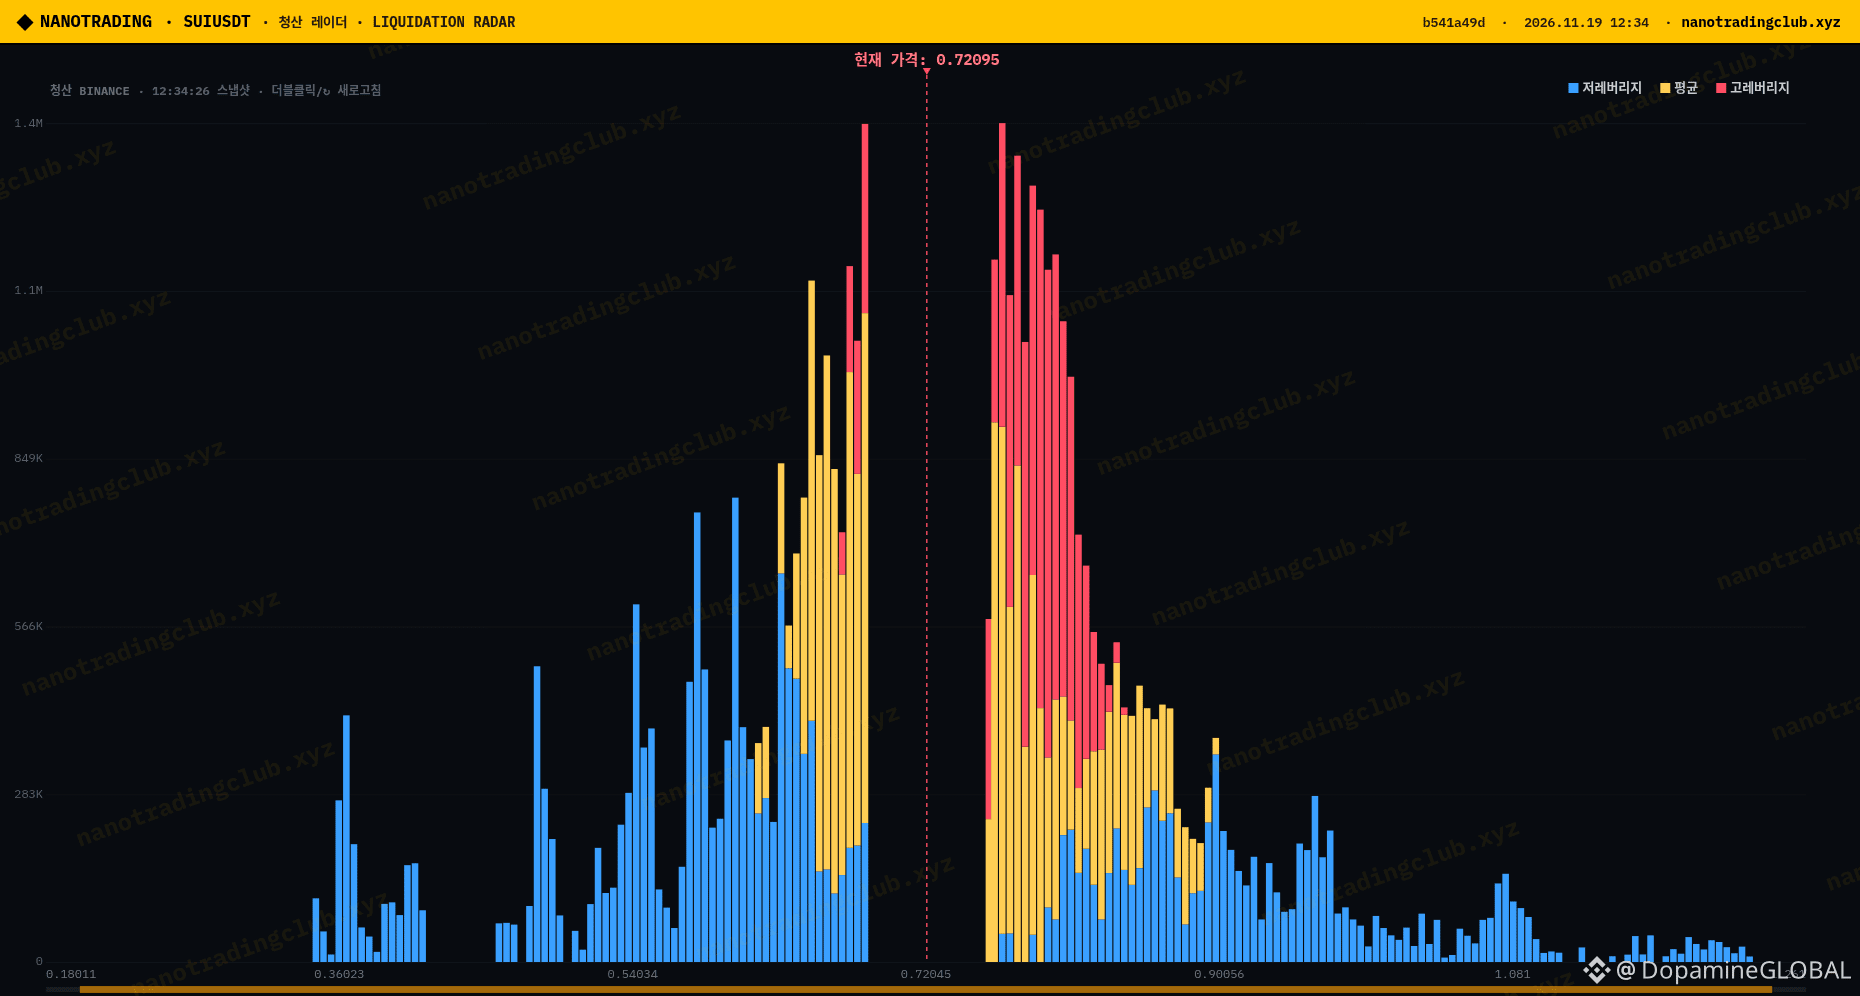
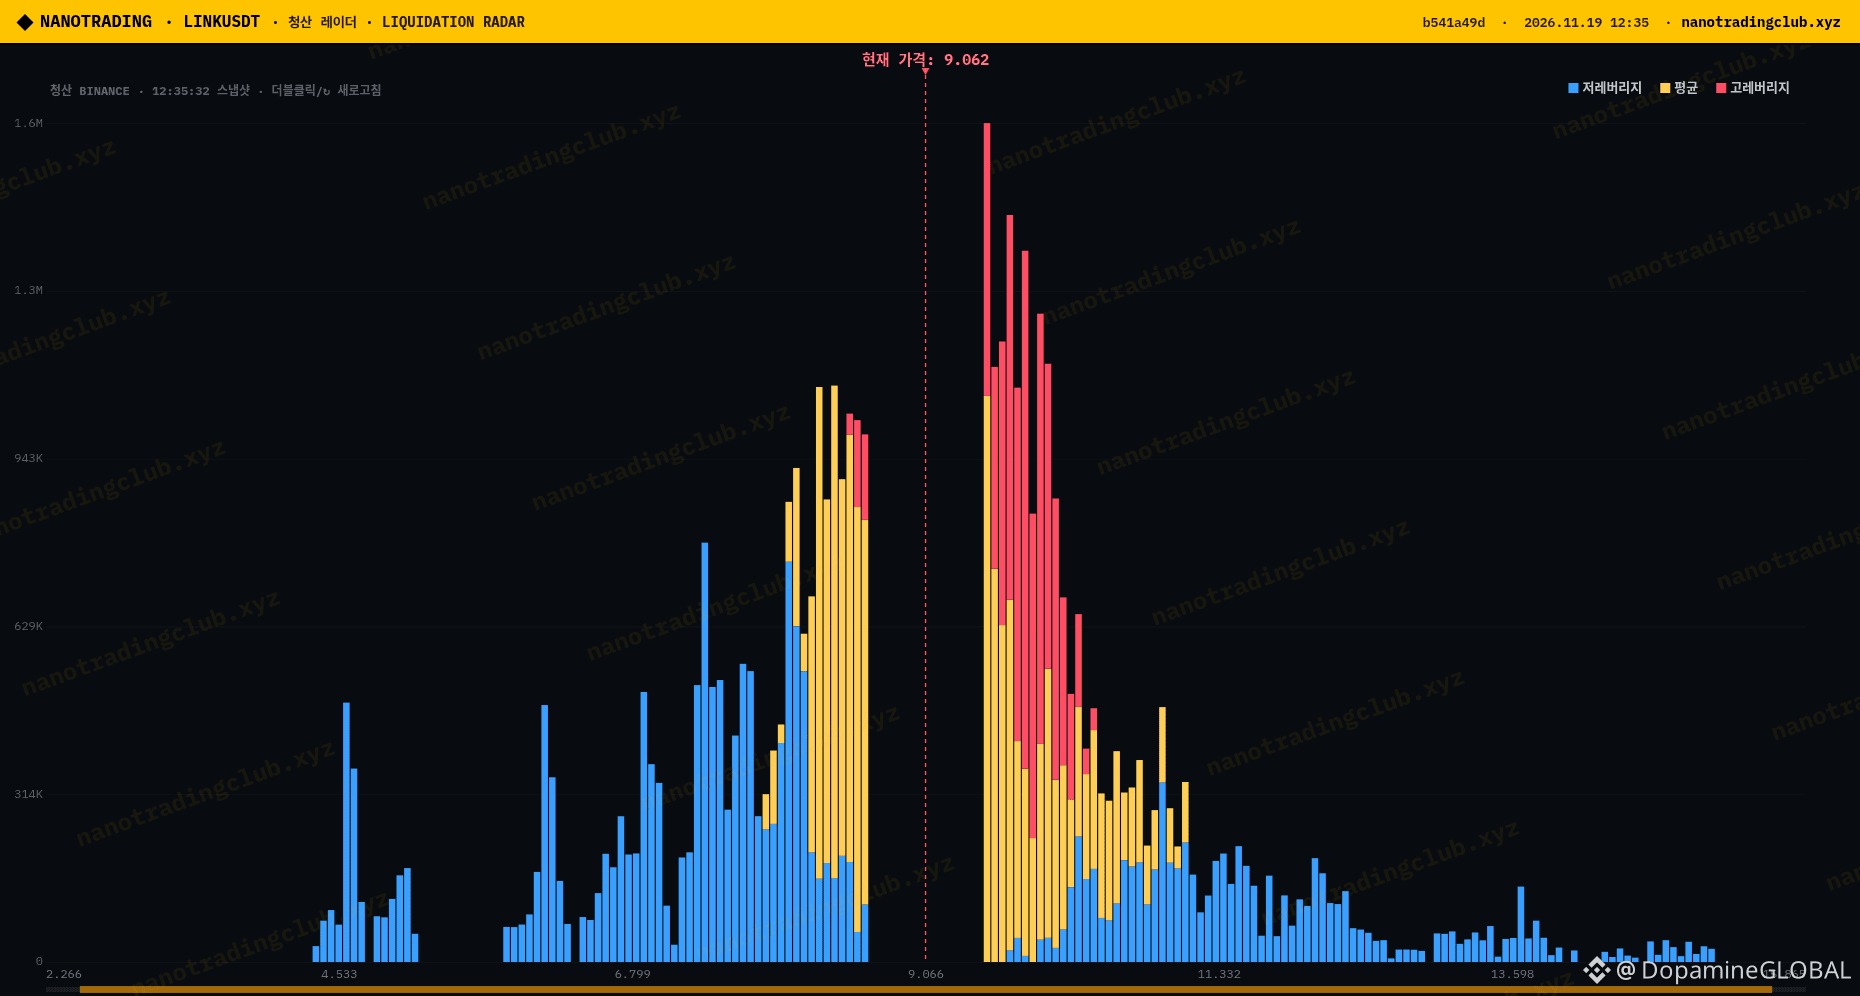
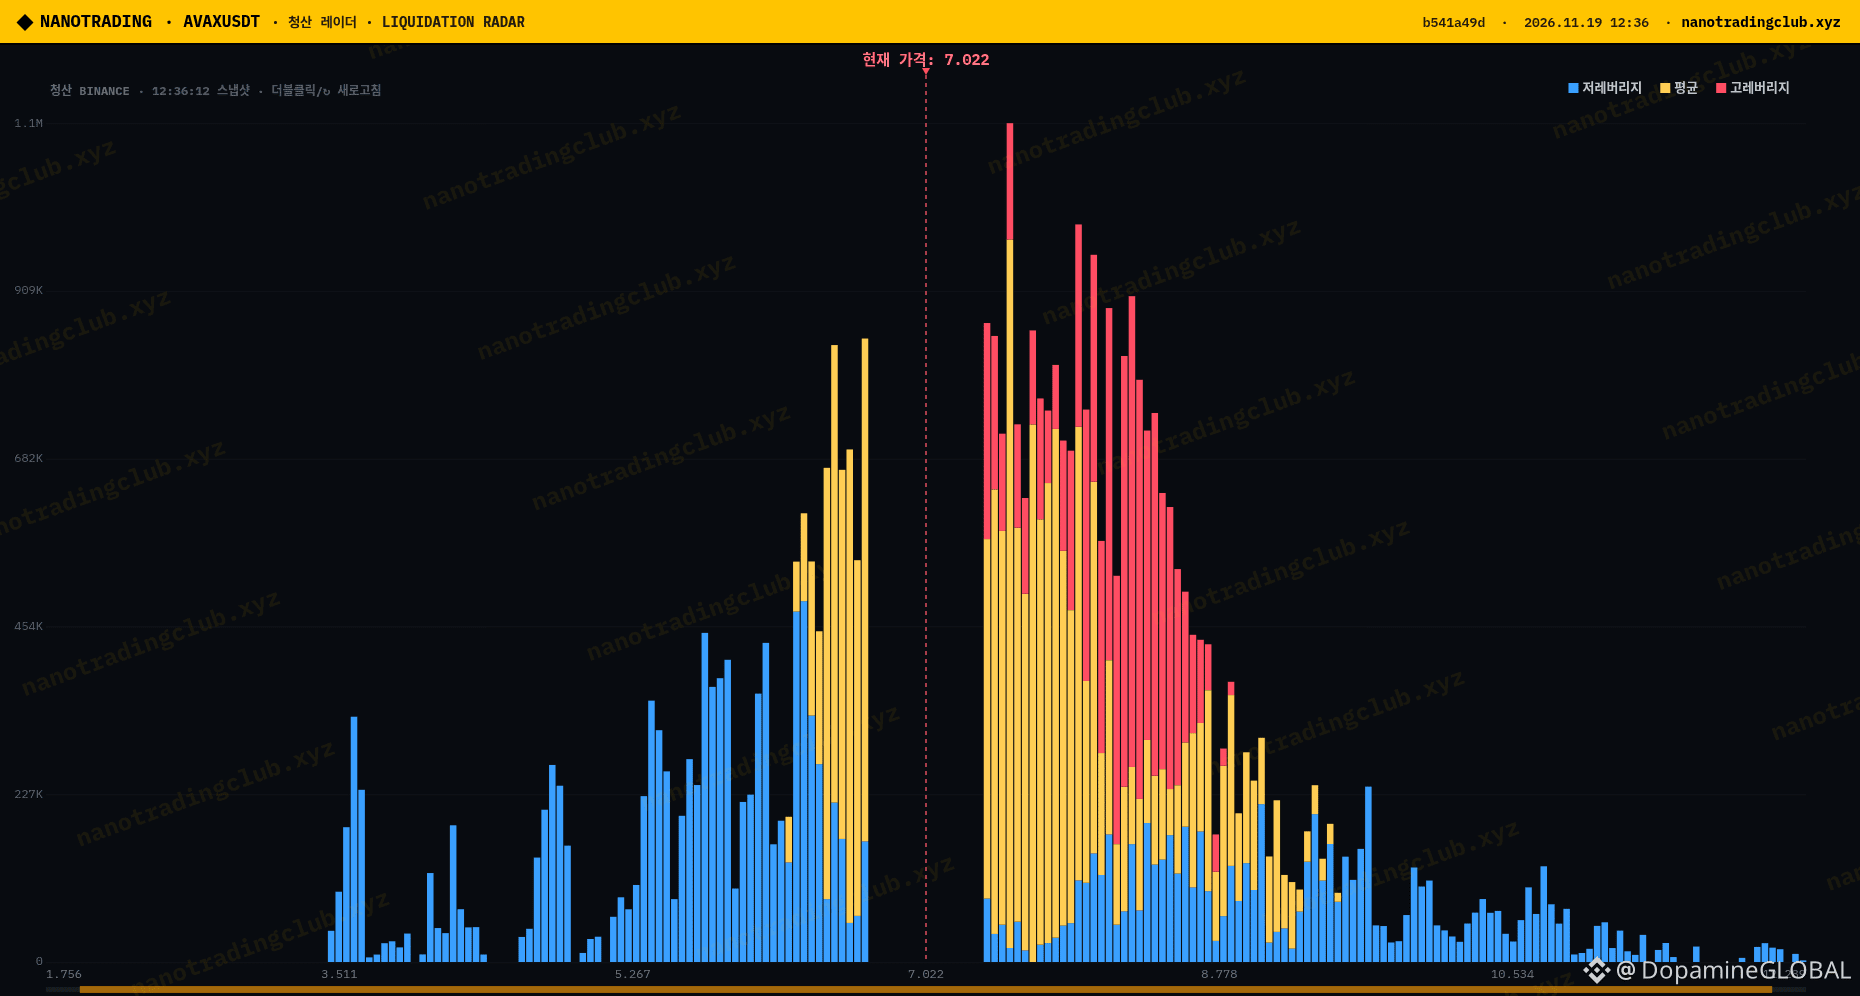
Three alt liquidation maps on NanoTrading's radar right now, and they all look pretty balanced, which usually means a range before a real move. $SUI $LINK $AVAX
$SUI (~0.721): shorts stack ~$830K at 0.767, longs ~$890K at 0.684. Slightly heavier below, so a dip to sweep 0.68 wouldn't surprise me.
$LINK (~9.07): ~$824K of shorts at 9.716 vs ~$693K of longs at 8.256. Shorts are the bigger pile here, so if it squeezes, 9.7 is the magnet.
$AVAX (~7.02): ~$484K shorts at 7.526, ~$462K longs at 6.665. Almost a coin flip, and the smallest clusters of the three.
If I had to pick one for a squeeze, it's LINK. Which of these three moves first for you?
NFA, just reading the maps.
Source: NanoTrading liquidation radar (nanotradingclub.xyz)
#SUI #LINK #AVAX #NanoTrading
Three alt liquidation maps on NanoTrading's radar right now, and they all look pretty balanced, which usually means a range before a real move. $SUI $LINK $AVAX
$SUI (~0.721): shorts stack ~$830K at 0.767, longs ~$890K at 0.684. Slightly heavier below, so a dip to sweep 0.68 wouldn't surprise me.
$LINK (~9.07): ~$824K of shorts at 9.716 vs ~$693K of longs at 8.256. Shorts are the bigger pile here, so if it squeezes, 9.7 is the magnet.
$AVAX (~7.02): ~$484K shorts at 7.526, ~$462K longs at 6.665. Almost a coin flip, and the smallest clusters of the three.
If I had to pick one for a squeeze, it's LINK. Which of these three moves first for you?
NFA, just reading the maps.
Source: NanoTrading liquidation radar (nanotradingclub.xyz)
#SUI #LINK #AVAX #NanoTrading
$SUI (~0.721): shorts stack ~$830K at 0.767, longs ~$890K at 0.684. Slightly heavier below, so a dip to sweep 0.68 wouldn't surprise me.
$LINK (~9.07): ~$824K of shorts at 9.716 vs ~$693K of longs at 8.256. Shorts are the bigger pile here, so if it squeezes, 9.7 is the magnet.
$AVAX (~7.02): ~$484K shorts at 7.526, ~$462K longs at 6.665. Almost a coin flip, and the smallest clusters of the three.
If I had to pick one for a squeeze, it's LINK. Which of these three moves first for you?
NFA, just reading the maps.
Source: NanoTrading liquidation radar (nanotradingclub.xyz)
#SUI #LINK #AVAX #NanoTrading
179
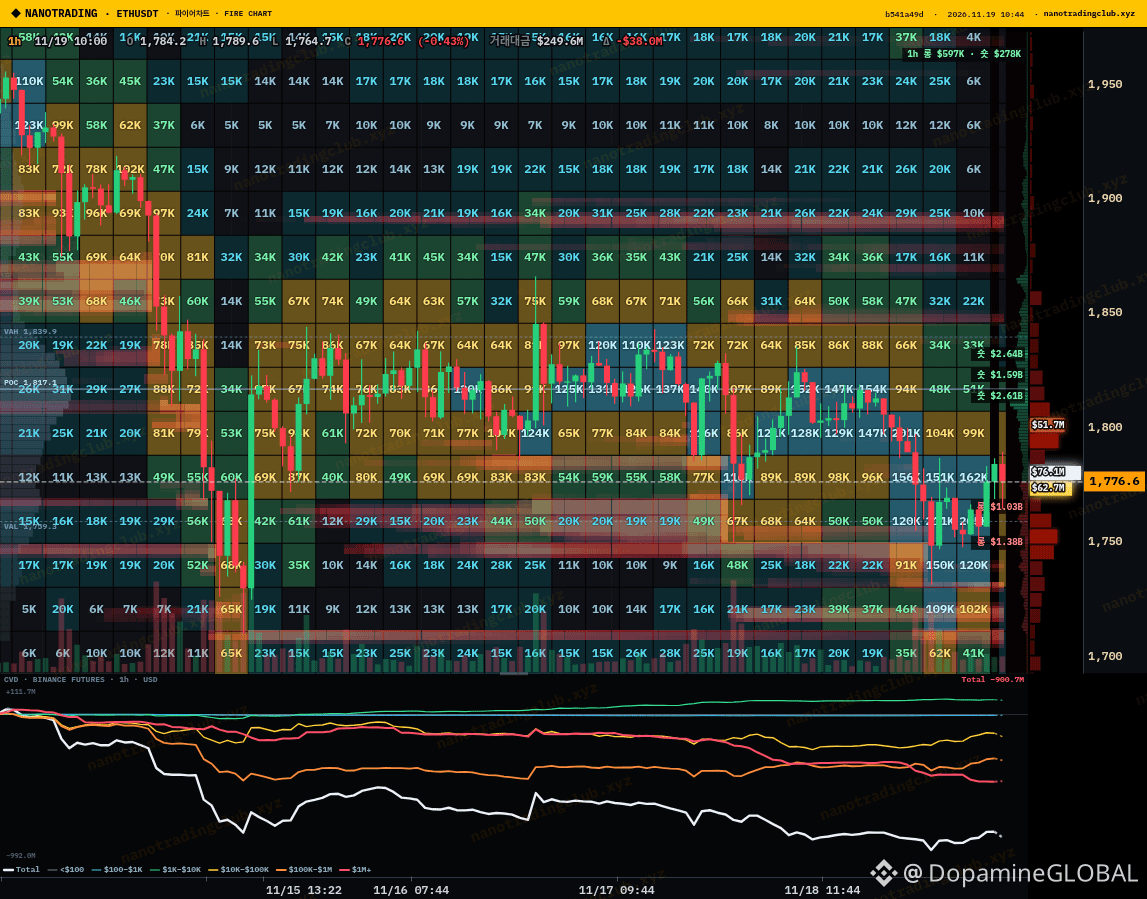
Quick tip on reading a liquidation heatmap, using $ETH right now as the example.
On NanoTrading's Fire chart, the liquidation heatmap view shows where leveraged positions are estimated to get wiped out. The bright bands are the big clusters, and a band disappears once price trades through it. Hover a level and you get the estimated amount sitting there.
$ETH is around 1,777 at the moment. The 1h view has its brightest band right overhead at 1,800 (est. ~$284.9M, the strongest level on the panel), with 1,750 (~$253.6M) just below. Price is stuck between two big magnets, so whichever one gets tagged first usually sets the next leg.
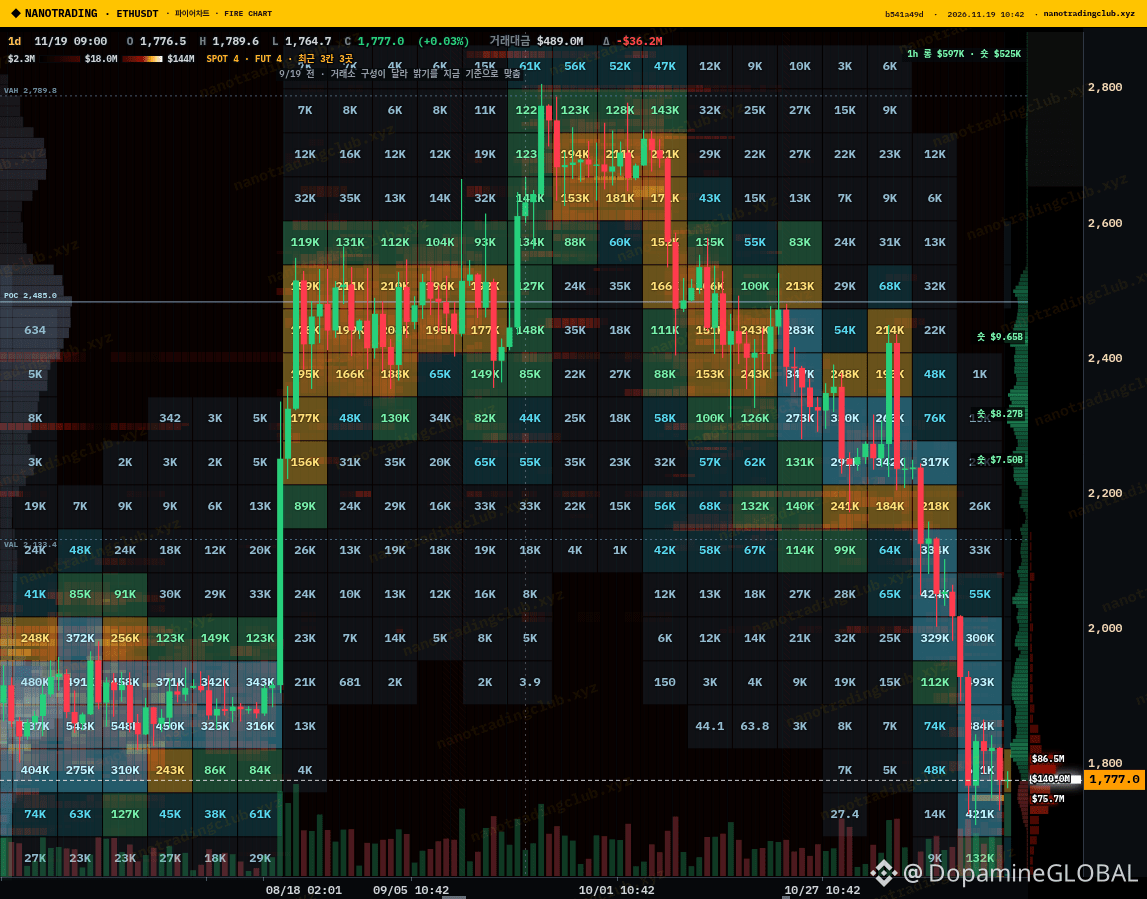
The second chart is the integrated orderbook on 1d (futures + spot combined), which is how I check whether a level actually has resting orders behind it or is just liquidation fuel.
Which one do you think $ETH sweeps first, 1,800 or 1,750?
NFA, just sharing how I read it.
Source: NanoTrading Fire chart (nanotradingclub.xyz)
#ETH #NanoTrading #TradingTips #Liquidation
Quick tip on reading a liquidation heatmap, using $ETH right now as the example.
On NanoTrading's Fire chart, the liquidation heatmap view shows where leveraged positions are estimated to get wiped out. The bright bands are the big clusters, and a band disappears once price trades through it. Hover a level and you get the estimated amount sitting there.
$ETH is around 1,777 at the moment. The 1h view has its brightest band right overhead at 1,800 (est. ~$284.9M, the strongest level on the panel), with 1,750 (~$253.6M) just below. Price is stuck between two big magnets, so whichever one gets tagged first usually sets the next leg.
The second chart is the integrated orderbook on 1d (futures + spot combined), which is how I check whether a level actually has resting orders behind it or is just liquidation fuel.
Which one do you think $ETH sweeps first, 1,800 or 1,750?
NFA, just sharing how I read it.
Source: NanoTrading Fire chart (nanotradingclub.xyz)
#ETH #NanoTrading #TradingTips #Liquidation
On NanoTrading's Fire chart, the liquidation heatmap view shows where leveraged positions are estimated to get wiped out. The bright bands are the big clusters, and a band disappears once price trades through it. Hover a level and you get the estimated amount sitting there.
$ETH is around 1,777 at the moment. The 1h view has its brightest band right overhead at 1,800 (est. ~$284.9M, the strongest level on the panel), with 1,750 (~$253.6M) just below. Price is stuck between two big magnets, so whichever one gets tagged first usually sets the next leg.
The second chart is the integrated orderbook on 1d (futures + spot combined), which is how I check whether a level actually has resting orders behind it or is just liquidation fuel.
Which one do you think $ETH sweeps first, 1,800 or 1,750?
NFA, just sharing how I read it.
Source: NanoTrading Fire chart (nanotradingclub.xyz)
#ETH #NanoTrading #TradingTips #Liquidation
60
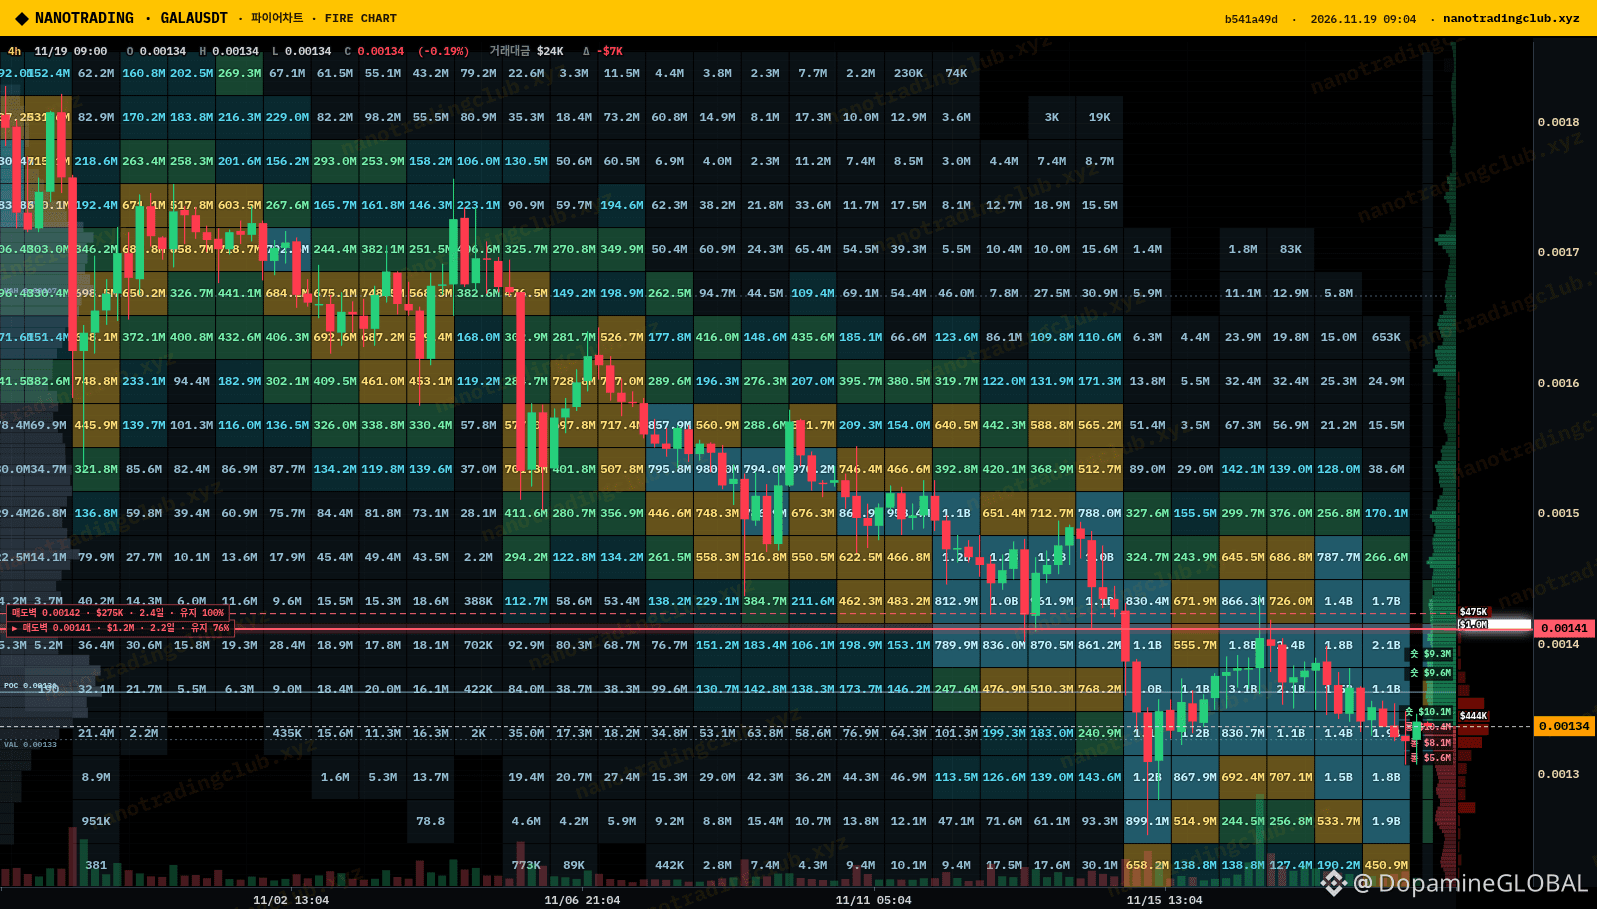
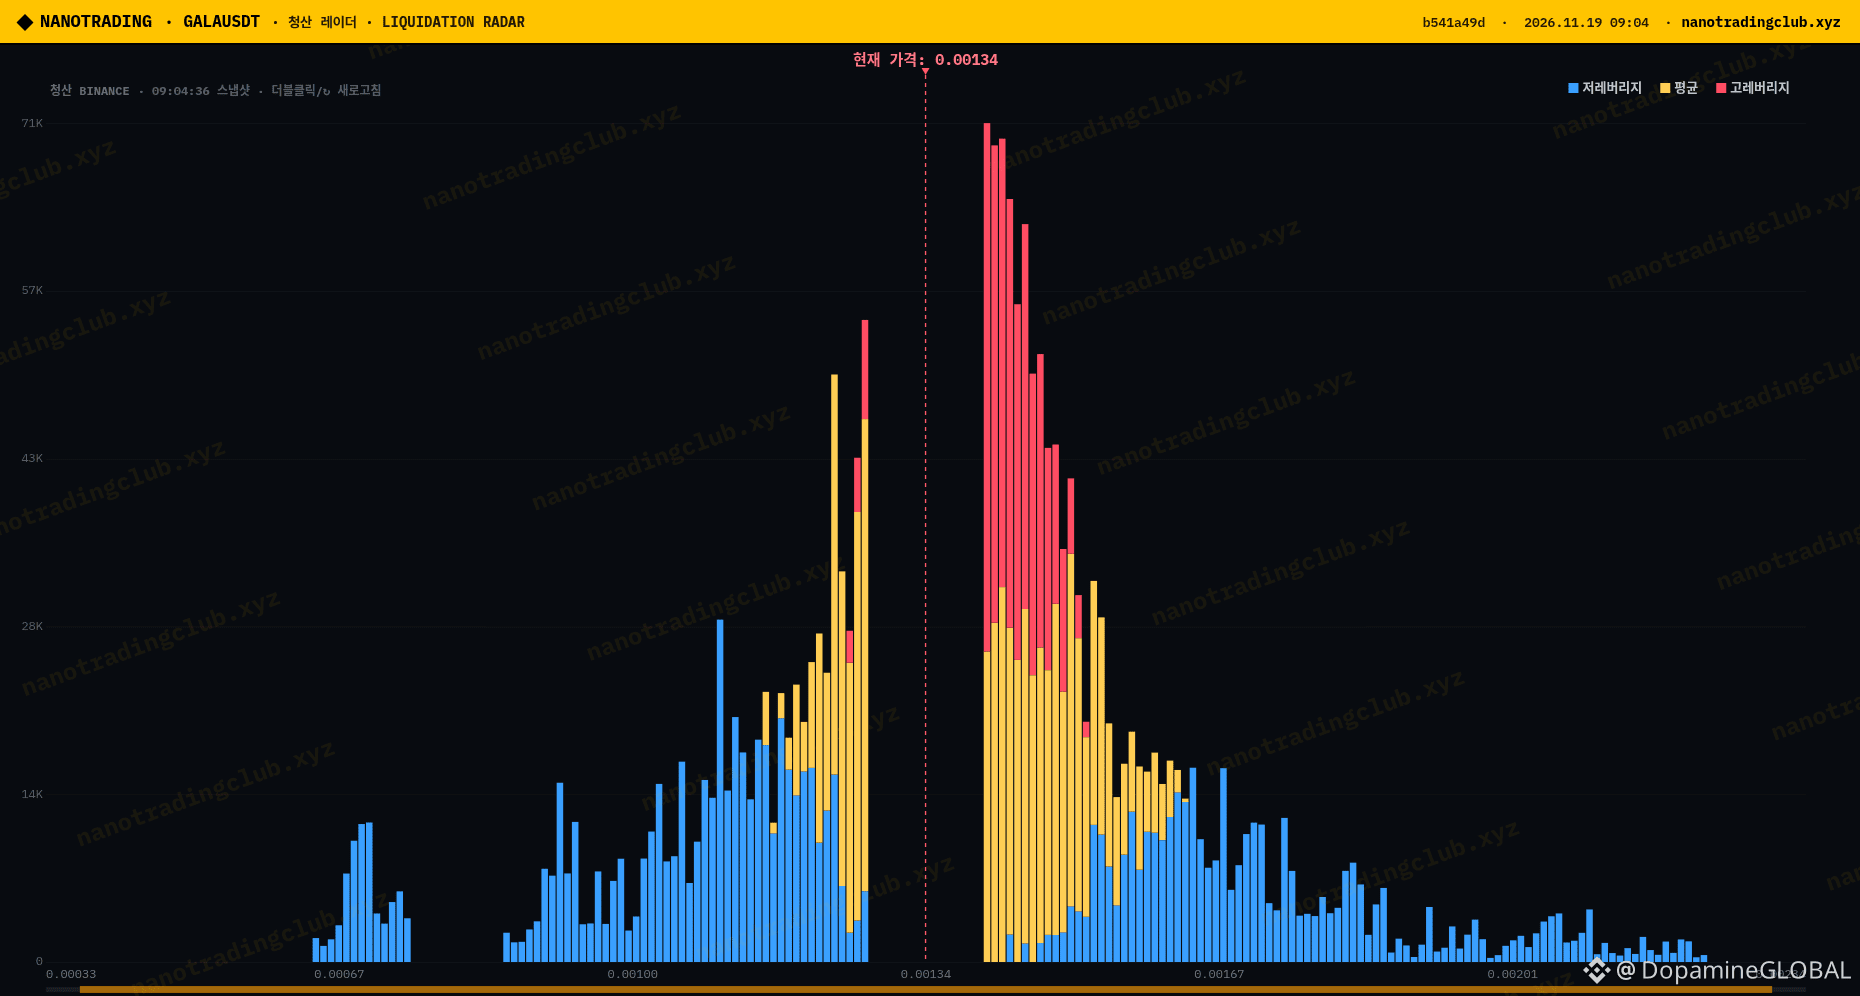
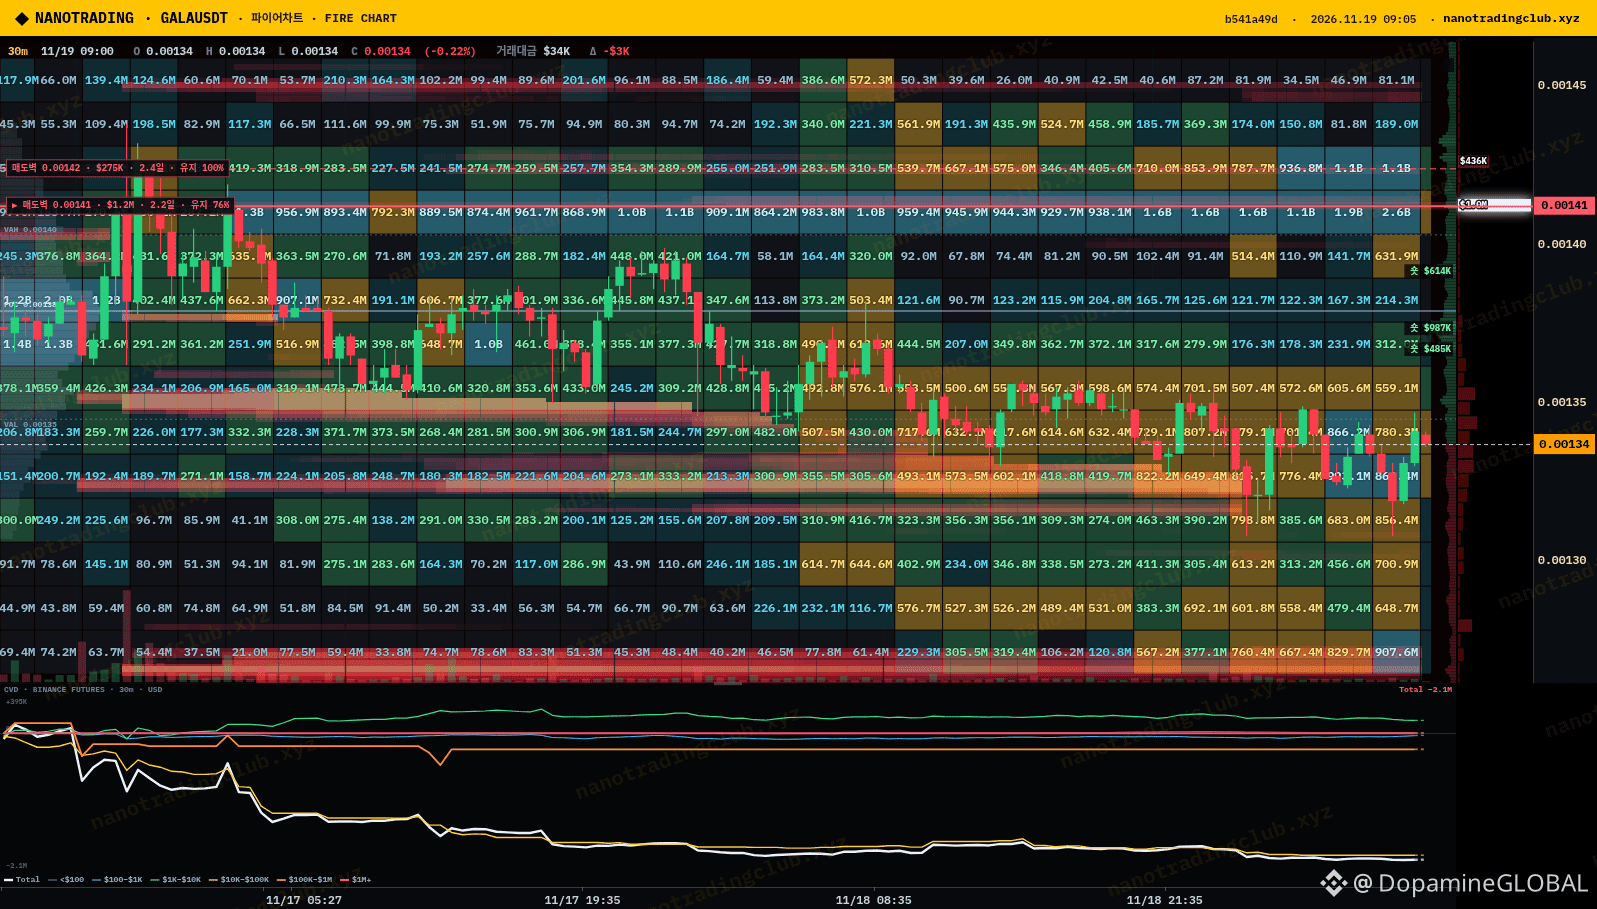
$GALA is boxed in between two walls on NanoTrading right now and I want to see which side cracks first.
The wall scanner flags a ~$1.21M sell wall at 0.0014123, about 5% above price (0.00134 when I checked). The 1d view shows a sell wall at 0.00142 that has held for 2.4 days, and the liquidation radar has the biggest short-liq stack right around 0.00141-0.00143. Below, there's a thinner buy wall at 0.00128.
So: does $GALA squeeze up into 0.00142 first, or lose 0.00128 first? Drop your pick in the comments 👇
NFA, just watching the levels.
Source: NanoTrading Fire chart, wall scanner & liquidation radar (nanotradingclub.xyz)
#GALA #NanoTrading #CryptoPoll #Altcoins
$GALA is boxed in between two walls on NanoTrading right now and I want to see which side cracks first.
The wall scanner flags a ~$1.21M sell wall at 0.0014123, about 5% above price (0.00134 when I checked). The 1d view shows a sell wall at 0.00142 that has held for 2.4 days, and the liquidation radar has the biggest short-liq stack right around 0.00141-0.00143. Below, there's a thinner buy wall at 0.00128.
So: does $GALA squeeze up into 0.00142 first, or lose 0.00128 first? Drop your pick in the comments 👇
NFA, just watching the levels.
Source: NanoTrading Fire chart, wall scanner & liquidation radar (nanotradingclub.xyz)
#GALA #NanoTrading #CryptoPoll #Altcoins
The wall scanner flags a ~$1.21M sell wall at 0.0014123, about 5% above price (0.00134 when I checked). The 1d view shows a sell wall at 0.00142 that has held for 2.4 days, and the liquidation radar has the biggest short-liq stack right around 0.00141-0.00143. Below, there's a thinner buy wall at 0.00128.
So: does $GALA squeeze up into 0.00142 first, or lose 0.00128 first? Drop your pick in the comments 👇
NFA, just watching the levels.
Source: NanoTrading Fire chart, wall scanner & liquidation radar (nanotradingclub.xyz)
#GALA #NanoTrading #CryptoPoll #Altcoins
1
593
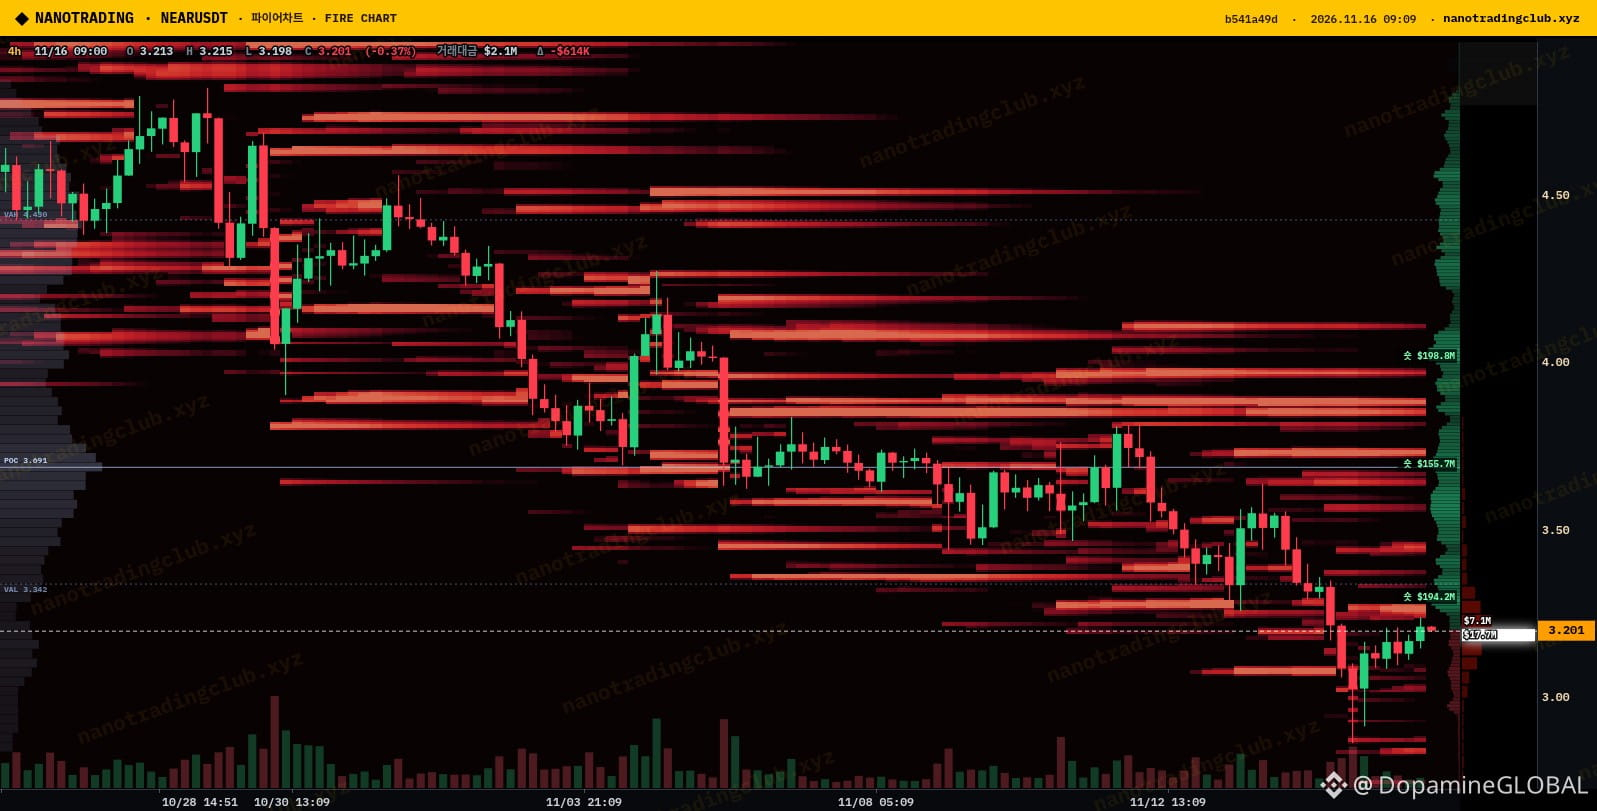
$NEAR is up about 6.6% in 24h, climbing from $2.915 to a $3.24 high and holding around $3.20 now. On the 4h it's the first decent push off the lows after a long grind down from the $4.50 area.
The NanoTrading Fire chart puts the first test very close. There's a short liquidation cluster of about $194M near $3.30, right where the value-area low sits (VAL ~$3.34). After that, the next short clusters are ~$156M around $3.69 (also the POC) and ~$199M near $4.02. Below price, the support bands are mostly in the $3.00-3.15 zone.
Binance futures: OI is basically flat at ~$152-162M over 24h, funding slightly positive, ~58% of accounts long and top traders ~2.1x long by position. So the bounce happened without a big rush of new leverage, but the smart-money side is clearly leaning long.
My read: a 4h close above $3.34 could pull price into those $3.30 shorts and open the way toward $3.69. If $3.00 breaks, I'm out of the idea. Is $NEAR finally bottoming, or is this just another lower high?
Source: NanoTrading Fire chart (nanotradingclub.xyz)
NFA, just my read.
#NEAR #NanoTrading #CryptoMarket #Altcoins
$NEAR is up about 6.6% in 24h, climbing from $2.915 to a $3.24 high and holding around $3.20 now. On the 4h it's the first decent push off the lows after a long grind down from the $4.50 area.
The NanoTrading Fire chart puts the first test very close. There's a short liquidation cluster of about $194M near $3.30, right where the value-area low sits (VAL ~$3.34). After that, the next short clusters are ~$156M around $3.69 (also the POC) and ~$199M near $4.02. Below price, the support bands are mostly in the $3.00-3.15 zone.
Binance futures: OI is basically flat at ~$152-162M over 24h, funding slightly positive, ~58% of accounts long and top traders ~2.1x long by position. So the bounce happened without a big rush of new leverage, but the smart-money side is clearly leaning long.
My read: a 4h close above $3.34 could pull price into those $3.30 shorts and open the way toward $3.69. If $3.00 breaks, I'm out of the idea. Is $NEAR finally bottoming, or is this just another lower high?
Source: NanoTrading Fire chart (nanotradingclub.xyz)
NFA, just my read.
#NEAR #NanoTrading #CryptoMarket #Altcoins
The NanoTrading Fire chart puts the first test very close. There's a short liquidation cluster of about $194M near $3.30, right where the value-area low sits (VAL ~$3.34). After that, the next short clusters are ~$156M around $3.69 (also the POC) and ~$199M near $4.02. Below price, the support bands are mostly in the $3.00-3.15 zone.
Binance futures: OI is basically flat at ~$152-162M over 24h, funding slightly positive, ~58% of accounts long and top traders ~2.1x long by position. So the bounce happened without a big rush of new leverage, but the smart-money side is clearly leaning long.
My read: a 4h close above $3.34 could pull price into those $3.30 shorts and open the way toward $3.69. If $3.00 breaks, I'm out of the idea. Is $NEAR finally bottoming, or is this just another lower high?
Source: NanoTrading Fire chart (nanotradingclub.xyz)
NFA, just my read.
#NEAR #NanoTrading #CryptoMarket #Altcoins
2
1.9k
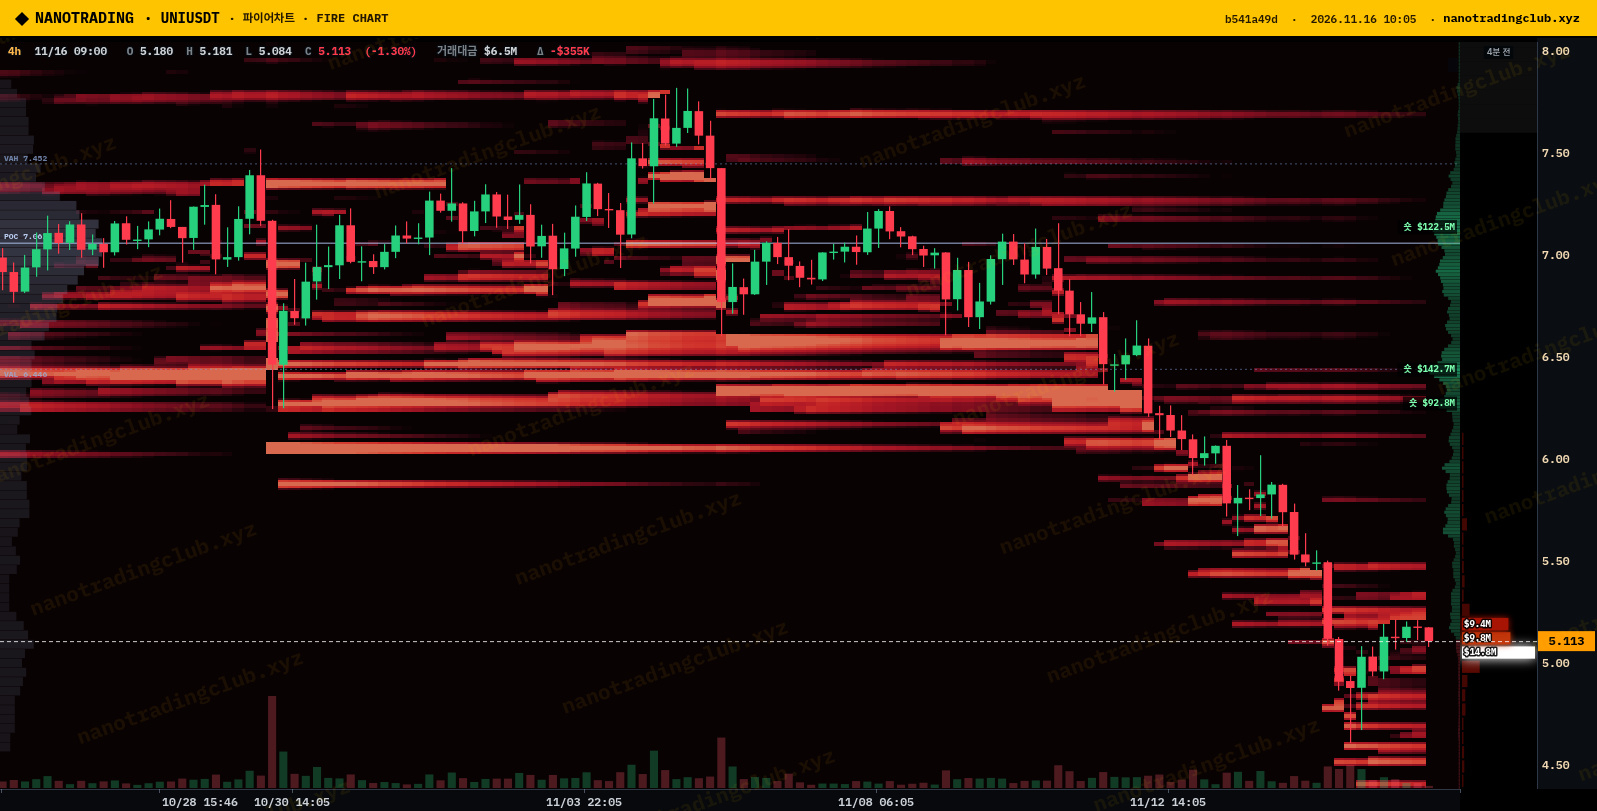
$UNI pushed about 7.7% in 24h, from $4.68 up to a $5.22 high, and it's now trading around $5.11. It's one of the stronger large caps today, but the 4h chart still has a lot of history stacked above it.
On the NanoTrading Fire chart the first heavy band is around $5.40-5.50. Above that, the whole $6.20-7.00 area is thick with old heat from the October range, which is where the price broke down. The labeled short liquidation clusters only start up there: ~$93M near $6.28, ~$143M near $6.45 and ~$123M around $7.05.
Binance futures doesn't show much excitement yet. OI is flat at about $91-96M all day, funding is slightly negative, ~55% of accounts are long and top traders are ~2.06x long by position. So the move isn't coming from leverage chasing, which I actually like.
My plan: a 4h close above $5.50 would make me look for a run into the $6.28-6.45 shorts. If it drops back under $4.68, the bounce failed. Do you think $UNI has a real catalyst here, or is it just riding the market bounce?
Source: NanoTrading Fire chart (nanotradingclub.xyz)
NFA, just my read.
#UNI #Uniswap #NanoTrading #DeFi
$UNI pushed about 7.7% in 24h, from $4.68 up to a $5.22 high, and it's now trading around $5.11. It's one of the stronger large caps today, but the 4h chart still has a lot of history stacked above it.
On the NanoTrading Fire chart the first heavy band is around $5.40-5.50. Above that, the whole $6.20-7.00 area is thick with old heat from the October range, which is where the price broke down. The labeled short liquidation clusters only start up there: ~$93M near $6.28, ~$143M near $6.45 and ~$123M around $7.05.
Binance futures doesn't show much excitement yet. OI is flat at about $91-96M all day, funding is slightly negative, ~55% of accounts are long and top traders are ~2.06x long by position. So the move isn't coming from leverage chasing, which I actually like.
My plan: a 4h close above $5.50 would make me look for a run into the $6.28-6.45 shorts. If it drops back under $4.68, the bounce failed. Do you think $UNI has a real catalyst here, or is it just riding the market bounce?
Source: NanoTrading Fire chart (nanotradingclub.xyz)
NFA, just my read.
#UNI #Uniswap #NanoTrading #DeFi
On the NanoTrading Fire chart the first heavy band is around $5.40-5.50. Above that, the whole $6.20-7.00 area is thick with old heat from the October range, which is where the price broke down. The labeled short liquidation clusters only start up there: ~$93M near $6.28, ~$143M near $6.45 and ~$123M around $7.05.
Binance futures doesn't show much excitement yet. OI is flat at about $91-96M all day, funding is slightly negative, ~55% of accounts are long and top traders are ~2.06x long by position. So the move isn't coming from leverage chasing, which I actually like.
My plan: a 4h close above $5.50 would make me look for a run into the $6.28-6.45 shorts. If it drops back under $4.68, the bounce failed. Do you think $UNI has a real catalyst here, or is it just riding the market bounce?
Source: NanoTrading Fire chart (nanotradingclub.xyz)
NFA, just my read.
#UNI #Uniswap #NanoTrading #DeFi
110
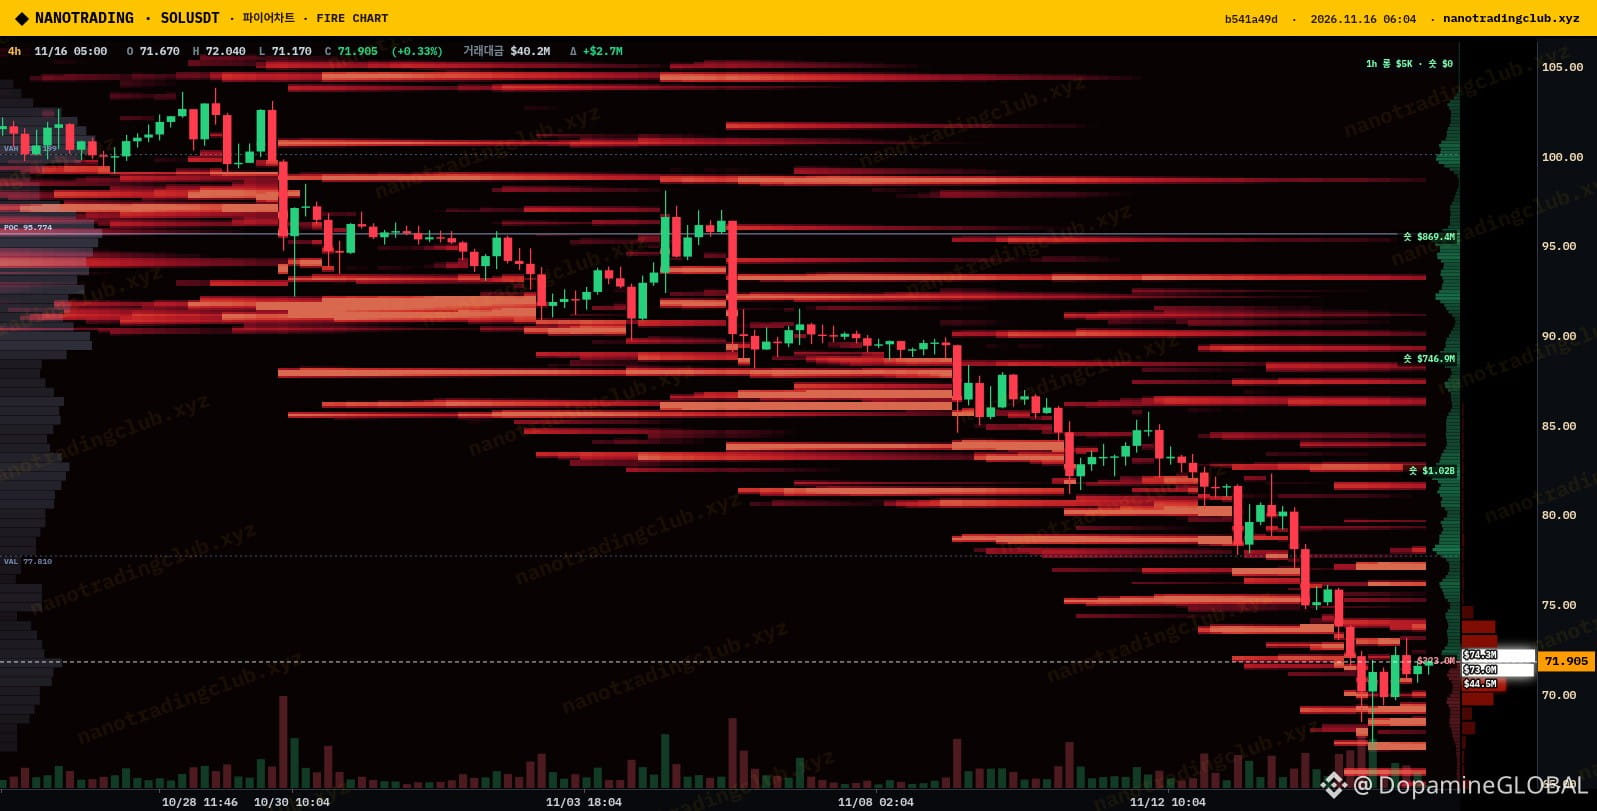
$SOL bounced from $67.35 to around $71.9 in the last 24h, but on the 4h this still looks like a relief bounce inside a downtrend that started near $104. Every lower high on the way down left heat behind it.
On the NanoTrading Fire chart the first real ceiling is the stacked bands at roughly $73-77, and price already got rejected near $73 today. Above that the liquidation map has a fat cluster around $82.3 (about $1.02B), then $88.5 and $95.5. Below, the thinner support zones sit at $70-71 and $67-69.
What bugs me is the crowd. Binance futures shows about 77.7% of accounts long (long/short ~3.48) and top traders ~1.89x long, while OI has barely moved, around $647-650M all day, with funding slightly positive. So this bounce isn't shorts getting squeezed, it's longs adding again.
My plan: I only trust $SOL above $77 on a 4h close. If it loses $70 with this many longs stacked, $67 gets retested fast. Would you buy this bounce, or wait for $67 to hold a second time?
Source: NanoTrading Fire chart (nanotradingclub.xyz)
NFA, just my read.
#SOL #Solana #NanoTrading #CryptoMarket
$SOL bounced from $67.35 to around $71.9 in the last 24h, but on the 4h this still looks like a relief bounce inside a downtrend that started near $104. Every lower high on the way down left heat behind it.
On the NanoTrading Fire chart the first real ceiling is the stacked bands at roughly $73-77, and price already got rejected near $73 today. Above that the liquidation map has a fat cluster around $82.3 (about $1.02B), then $88.5 and $95.5. Below, the thinner support zones sit at $70-71 and $67-69.
What bugs me is the crowd. Binance futures shows about 77.7% of accounts long (long/short ~3.48) and top traders ~1.89x long, while OI has barely moved, around $647-650M all day, with funding slightly positive. So this bounce isn't shorts getting squeezed, it's longs adding again.
My plan: I only trust $SOL above $77 on a 4h close. If it loses $70 with this many longs stacked, $67 gets retested fast. Would you buy this bounce, or wait for $67 to hold a second time?
Source: NanoTrading Fire chart (nanotradingclub.xyz)
NFA, just my read.
#SOL #Solana #NanoTrading #CryptoMarket
On the NanoTrading Fire chart the first real ceiling is the stacked bands at roughly $73-77, and price already got rejected near $73 today. Above that the liquidation map has a fat cluster around $82.3 (about $1.02B), then $88.5 and $95.5. Below, the thinner support zones sit at $70-71 and $67-69.
What bugs me is the crowd. Binance futures shows about 77.7% of accounts long (long/short ~3.48) and top traders ~1.89x long, while OI has barely moved, around $647-650M all day, with funding slightly positive. So this bounce isn't shorts getting squeezed, it's longs adding again.
My plan: I only trust $SOL above $77 on a 4h close. If it loses $70 with this many longs stacked, $67 gets retested fast. Would you buy this bounce, or wait for $67 to hold a second time?
Source: NanoTrading Fire chart (nanotradingclub.xyz)
NFA, just my read.
#SOL #Solana #NanoTrading #CryptoMarket
128
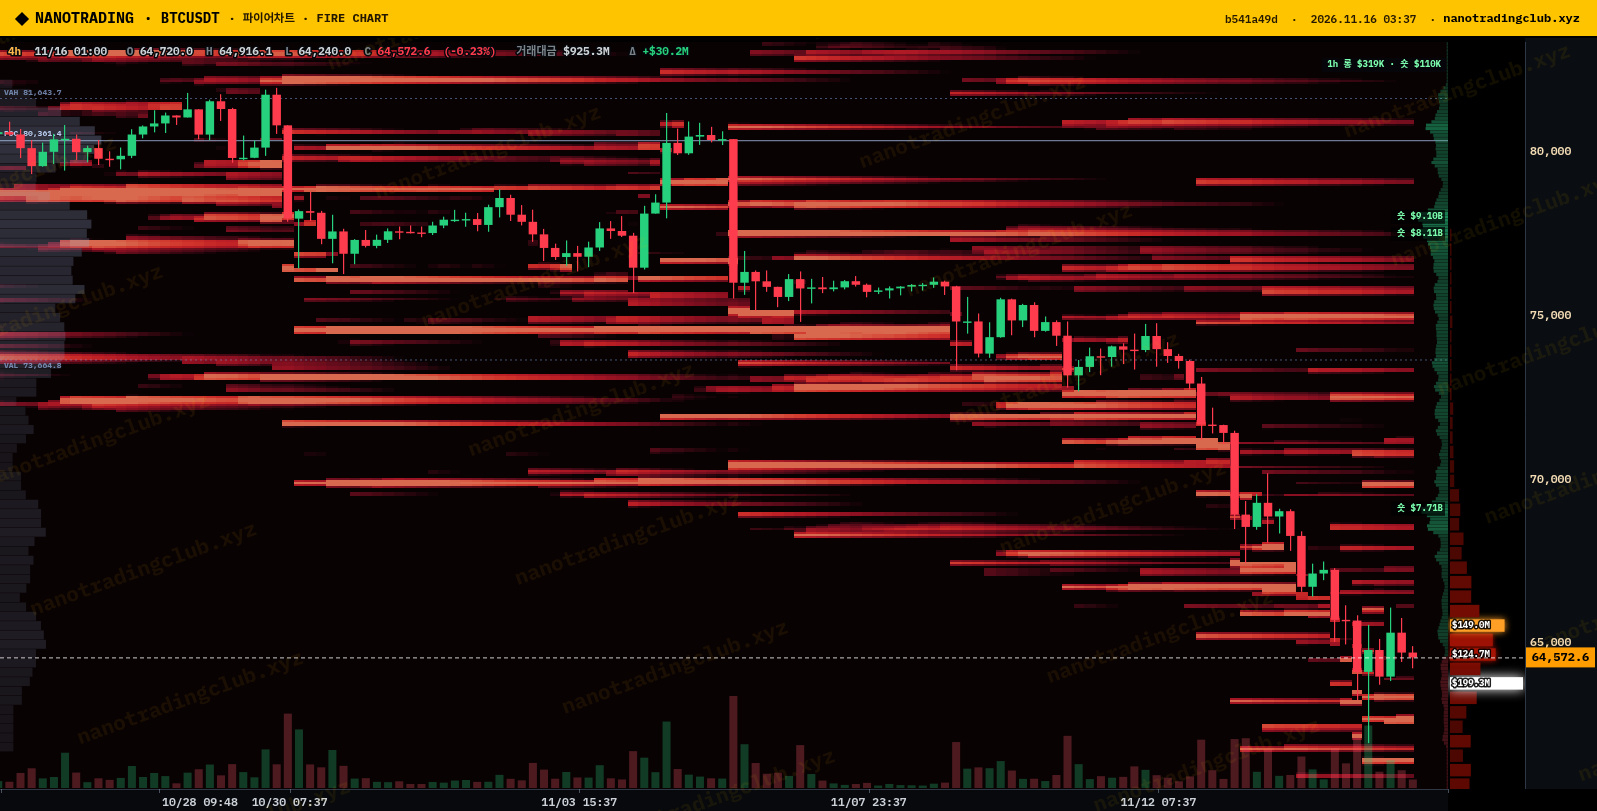
$BTC printed a low of $61,956 on Binance futures in the last 24h and is now hovering around $64,500. A week ago the daily open was near $75,800, so that's roughly a 15% slide with barely any real bounce in between.
On the NanoTrading Fire chart (4h) the staircase down is clean: lower highs, lower lows, and every bounce has died under fresh heat. The nearest band overhead sits around $65.5-67k, then a thicker zone at $69-71k where the breakdown started. Price is basically pinned right under that first band.
The positioning is what worries me. Over 73% of Binance accounts are long (long/short ratio about 2.8) and top trader positions are ~1.9x long, yet OI hasn't really dropped, still around $6.1-6.4B all day. Funding just flipped slightly negative. That's a lot of trapped longs who haven't capitulated yet.
My take: until $BTC reclaims $67k on a 4h close, I treat bounces as exits, not entries. If $62k breaks, those crowded longs become fuel for the next leg. Are you buying here or waiting for a real flush first? 🤔
Source: NanoTrading Fire chart (nanotradingclub.xyz)
NFA, just my map.
#BTC #Bitcoin #NanoTrading #CryptoMarket
$BTC printed a low of $61,956 on Binance futures in the last 24h and is now hovering around $64,500. A week ago the daily open was near $75,800, so that's roughly a 15% slide with barely any real bounce in between.
On the NanoTrading Fire chart (4h) the staircase down is clean: lower highs, lower lows, and every bounce has died under fresh heat. The nearest band overhead sits around $65.5-67k, then a thicker zone at $69-71k where the breakdown started. Price is basically pinned right under that first band.
The positioning is what worries me. Over 73% of Binance accounts are long (long/short ratio about 2.8) and top trader positions are ~1.9x long, yet OI hasn't really dropped, still around $6.1-6.4B all day. Funding just flipped slightly negative. That's a lot of trapped longs who haven't capitulated yet.
My take: until $BTC reclaims $67k on a 4h close, I treat bounces as exits, not entries. If $62k breaks, those crowded longs become fuel for the next leg. Are you buying here or waiting for a real flush first? 🤔
Source: NanoTrading Fire chart (nanotradingclub.xyz)
NFA, just my map.
#BTC #Bitcoin #NanoTrading #CryptoMarket
On the NanoTrading Fire chart (4h) the staircase down is clean: lower highs, lower lows, and every bounce has died under fresh heat. The nearest band overhead sits around $65.5-67k, then a thicker zone at $69-71k where the breakdown started. Price is basically pinned right under that first band.
The positioning is what worries me. Over 73% of Binance accounts are long (long/short ratio about 2.8) and top trader positions are ~1.9x long, yet OI hasn't really dropped, still around $6.1-6.4B all day. Funding just flipped slightly negative. That's a lot of trapped longs who haven't capitulated yet.
My take: until $BTC reclaims $67k on a 4h close, I treat bounces as exits, not entries. If $62k breaks, those crowded longs become fuel for the next leg. Are you buying here or waiting for a real flush first? 🤔
Source: NanoTrading Fire chart (nanotradingclub.xyz)
NFA, just my map.
#BTC #Bitcoin #NanoTrading #CryptoMarket
120
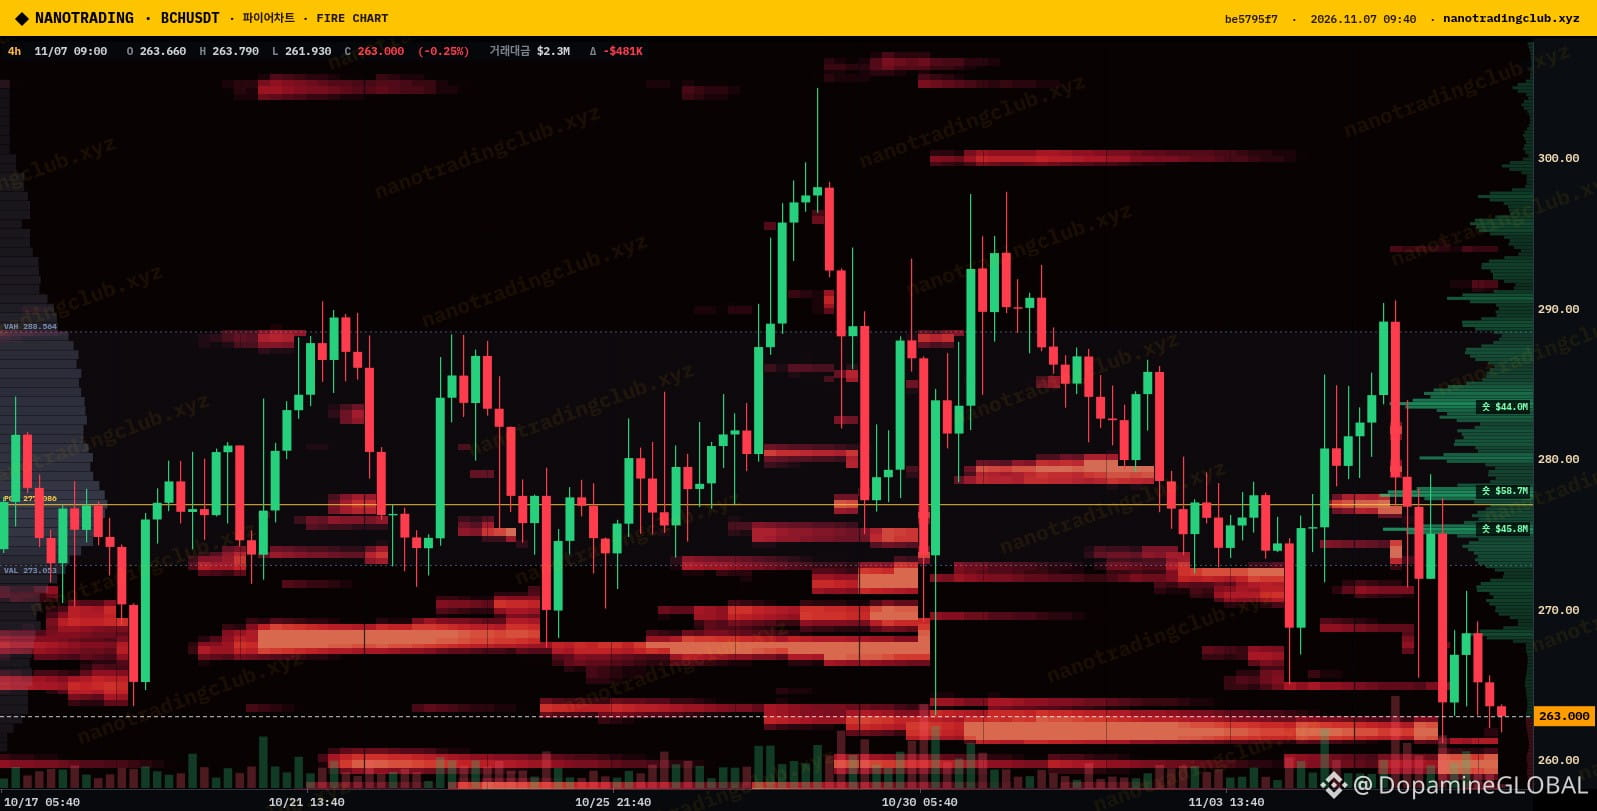
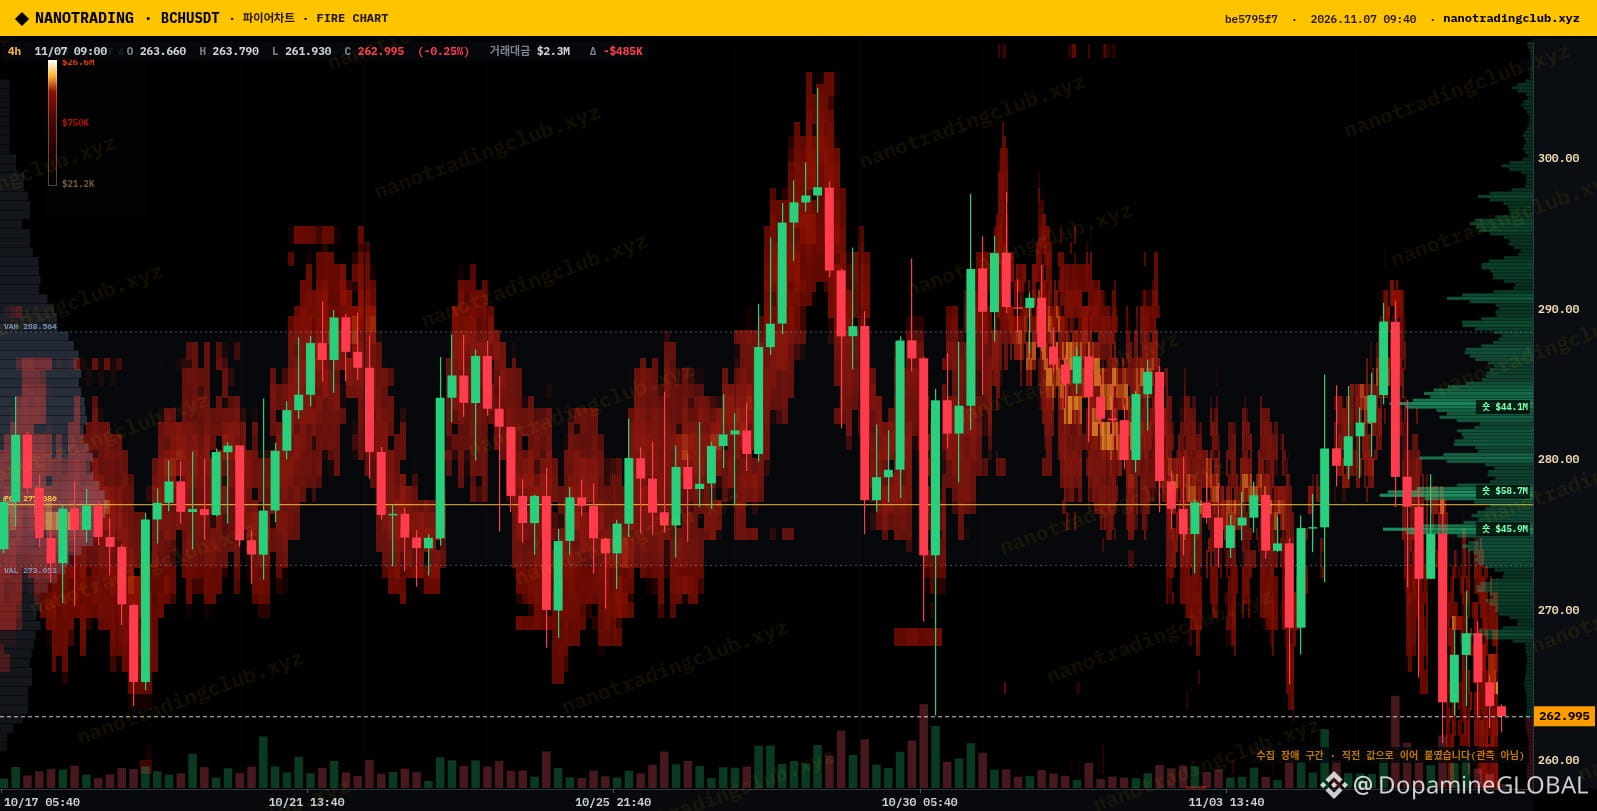
$BCH is down about 5.5% on the day after failing the 279 high, now sitting near 263 after probing a 261.2 low. Feels like a flush into the lower liquidity band rather than a clean trend day.
On the NanoTrading Fire chart (4h) price is printing around 263 with denser liquidity roughly 262-264 and again 265-267. Overhead bands thicken into 274-277 and 278-280. Liquidation side shows heavy short clusters stacked near 275 (~$46M), 277-278 (~$59M), and 283-284 (~$44M) — so any squeeze needs to chew through that wall first.
Binance perps: OI around 280k BCH (~$73M notional), funding a mild -0.01%, while accounts stay crowded long at about 59/41 (LS 1.47). Top traders even more long-biased (~1.81). Dumping into support with longs still piled in and funding barely negative — either a bounce off 261-263 or continuation if that floor breaks.
My read: hold the 262-264 band and $BCH can try back through 265-267 toward those 274-278 short walls. Lose 261 and we're opening the next leg lower. Not forcing size until the floor decides.
Anyone buying this dip into 262-264, or waiting for a reclaim of 265-267 first?
NFA, just reading the heatmaps.
Source: NanoTrading Fire chart (nanotradingclub.xyz)
#BCH #CryptoTrading #NanoTrading
$BCH is down about 5.5% on the day after failing the 279 high, now sitting near 263 after probing a 261.2 low. Feels like a flush into the lower liquidity band rather than a clean trend day.
On the NanoTrading Fire chart (4h) price is printing around 263 with denser liquidity roughly 262-264 and again 265-267. Overhead bands thicken into 274-277 and 278-280. Liquidation side shows heavy short clusters stacked near 275 (~$46M), 277-278 (~$59M), and 283-284 (~$44M) — so any squeeze needs to chew through that wall first.
Binance perps: OI around 280k BCH (~$73M notional), funding a mild -0.01%, while accounts stay crowded long at about 59/41 (LS 1.47). Top traders even more long-biased (~1.81). Dumping into support with longs still piled in and funding barely negative — either a bounce off 261-263 or continuation if that floor breaks.
My read: hold the 262-264 band and $BCH can try back through 265-267 toward those 274-278 short walls. Lose 261 and we're opening the next leg lower. Not forcing size until the floor decides.
Anyone buying this dip into 262-264, or waiting for a reclaim of 265-267 first?
NFA, just reading the heatmaps.
Source: NanoTrading Fire chart (nanotradingclub.xyz)
#BCH #CryptoTrading #NanoTrading
On the NanoTrading Fire chart (4h) price is printing around 263 with denser liquidity roughly 262-264 and again 265-267. Overhead bands thicken into 274-277 and 278-280. Liquidation side shows heavy short clusters stacked near 275 (~$46M), 277-278 (~$59M), and 283-284 (~$44M) — so any squeeze needs to chew through that wall first.
Binance perps: OI around 280k BCH (~$73M notional), funding a mild -0.01%, while accounts stay crowded long at about 59/41 (LS 1.47). Top traders even more long-biased (~1.81). Dumping into support with longs still piled in and funding barely negative — either a bounce off 261-263 or continuation if that floor breaks.
My read: hold the 262-264 band and $BCH can try back through 265-267 toward those 274-278 short walls. Lose 261 and we're opening the next leg lower. Not forcing size until the floor decides.
Anyone buying this dip into 262-264, or waiting for a reclaim of 265-267 first?
NFA, just reading the heatmaps.
Source: NanoTrading Fire chart (nanotradingclub.xyz)
#BCH #CryptoTrading #NanoTrading
2
410
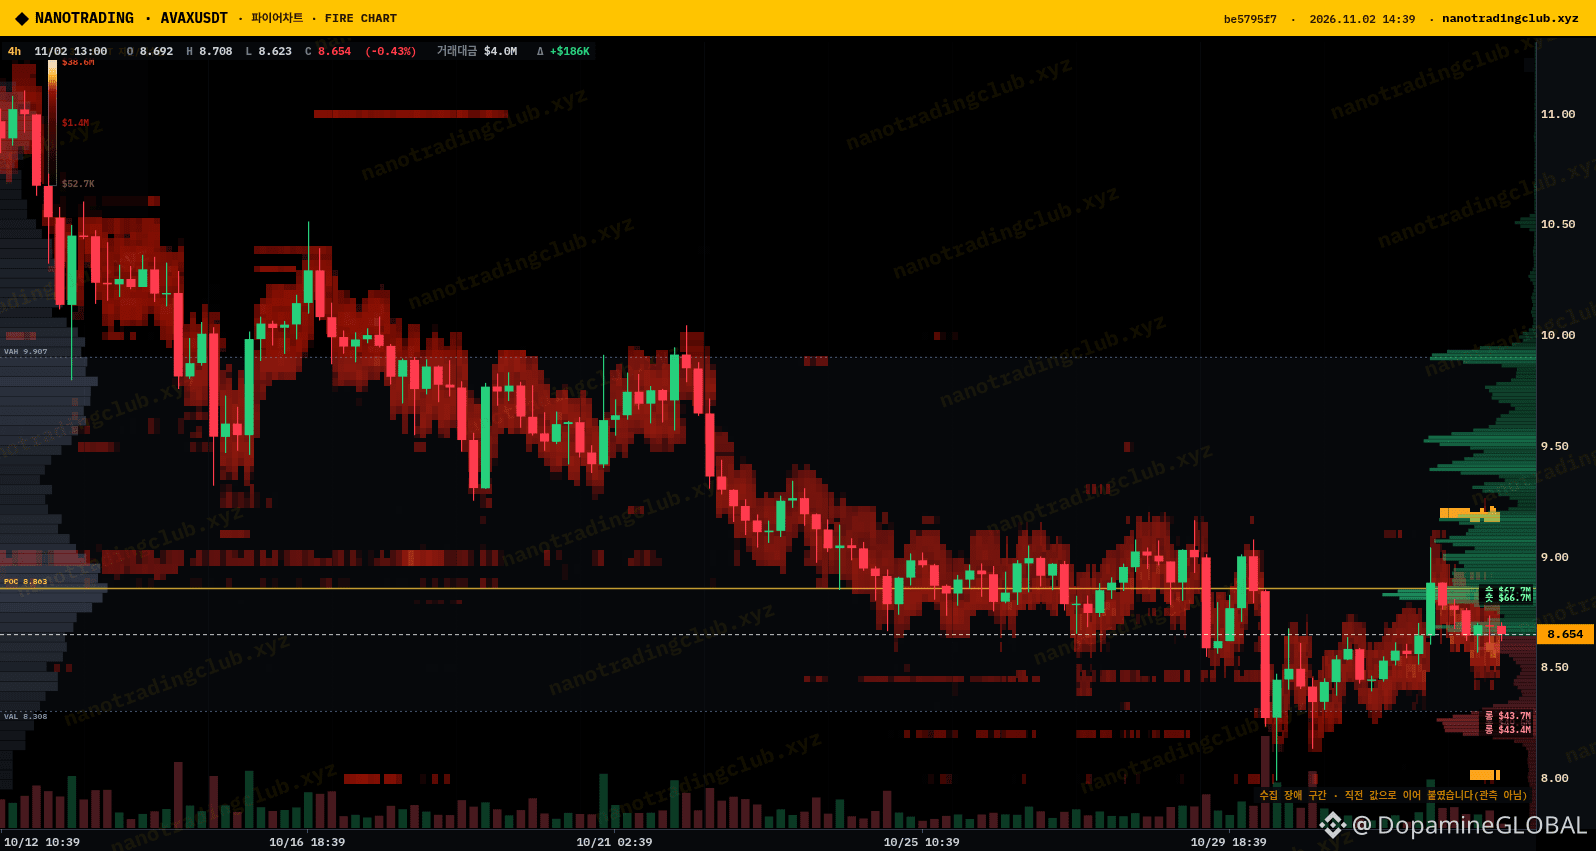
$AVAX is down about 3% today at ~8.65 and keeps getting sold right under the 4h POC at 8.86. It popped above 9 two days ago, couldn't hold it, and every bounce since has stalled below that line.
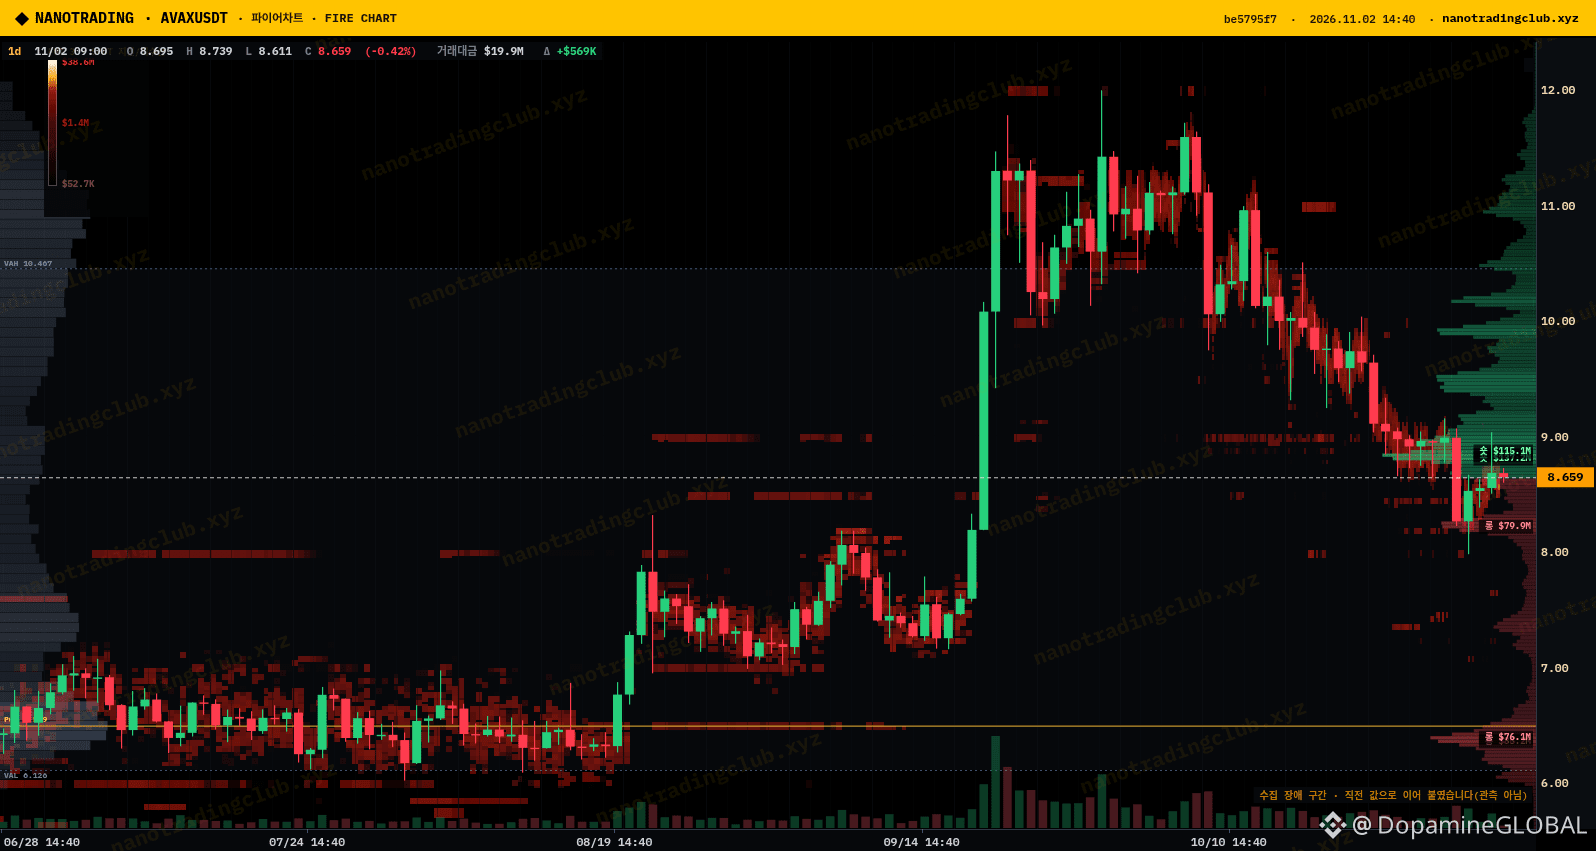
On the NanoTrading Fire chart the closest short-liq cluster sits right above price, about $67M around 8.85, with a thicker band of short liqs stacked from 9.0 up to roughly 9.9 (the VAH is 9.907). Below, the long-liq pocket is smaller, around $43M near 8.2-8.25, just under the VAL at 8.308.
Binance perps tell a funny story: OI is down from ~9.12M to ~8.71M AVAX over the last day while price bleeds, but ~65% of accounts are long (L/S 1.85, rising) and top traders sit at 2.33. Funding is just the default 0.01%. So longs keep adding into a downtrend while the overall position count shrinks.
My read: a reclaim of 8.86 squeezes that $67M short cluster fast and opens 9.5+. Until then the crowded long side makes the 8.2 pocket the easier magnet, so I'm not longing below the POC. $BTC holding 78k is what keeps the squeeze case alive.
Squeeze through 8.86 or flush to 8.2 first?
NFA, just reading the map 👀
Source: NanoTrading Fire chart (nanotradingclub.xyz)
#AVAX #NanoTrading #Altcoins
$AVAX is down about 3% today at ~8.65 and keeps getting sold right under the 4h POC at 8.86. It popped above 9 two days ago, couldn't hold it, and every bounce since has stalled below that line.
On the NanoTrading Fire chart the closest short-liq cluster sits right above price, about $67M around 8.85, with a thicker band of short liqs stacked from 9.0 up to roughly 9.9 (the VAH is 9.907). Below, the long-liq pocket is smaller, around $43M near 8.2-8.25, just under the VAL at 8.308.
Binance perps tell a funny story: OI is down from ~9.12M to ~8.71M AVAX over the last day while price bleeds, but ~65% of accounts are long (L/S 1.85, rising) and top traders sit at 2.33. Funding is just the default 0.01%. So longs keep adding into a downtrend while the overall position count shrinks.
My read: a reclaim of 8.86 squeezes that $67M short cluster fast and opens 9.5+. Until then the crowded long side makes the 8.2 pocket the easier magnet, so I'm not longing below the POC. $BTC holding 78k is what keeps the squeeze case alive.
Squeeze through 8.86 or flush to 8.2 first?
NFA, just reading the map 👀
Source: NanoTrading Fire chart (nanotradingclub.xyz)
#AVAX #NanoTrading #Altcoins
On the NanoTrading Fire chart the closest short-liq cluster sits right above price, about $67M around 8.85, with a thicker band of short liqs stacked from 9.0 up to roughly 9.9 (the VAH is 9.907). Below, the long-liq pocket is smaller, around $43M near 8.2-8.25, just under the VAL at 8.308.
Binance perps tell a funny story: OI is down from ~9.12M to ~8.71M AVAX over the last day while price bleeds, but ~65% of accounts are long (L/S 1.85, rising) and top traders sit at 2.33. Funding is just the default 0.01%. So longs keep adding into a downtrend while the overall position count shrinks.
My read: a reclaim of 8.86 squeezes that $67M short cluster fast and opens 9.5+. Until then the crowded long side makes the 8.2 pocket the easier magnet, so I'm not longing below the POC. $BTC holding 78k is what keeps the squeeze case alive.
Squeeze through 8.86 or flush to 8.2 first?
NFA, just reading the map 👀
Source: NanoTrading Fire chart (nanotradingclub.xyz)
#AVAX #NanoTrading #Altcoins
1
306
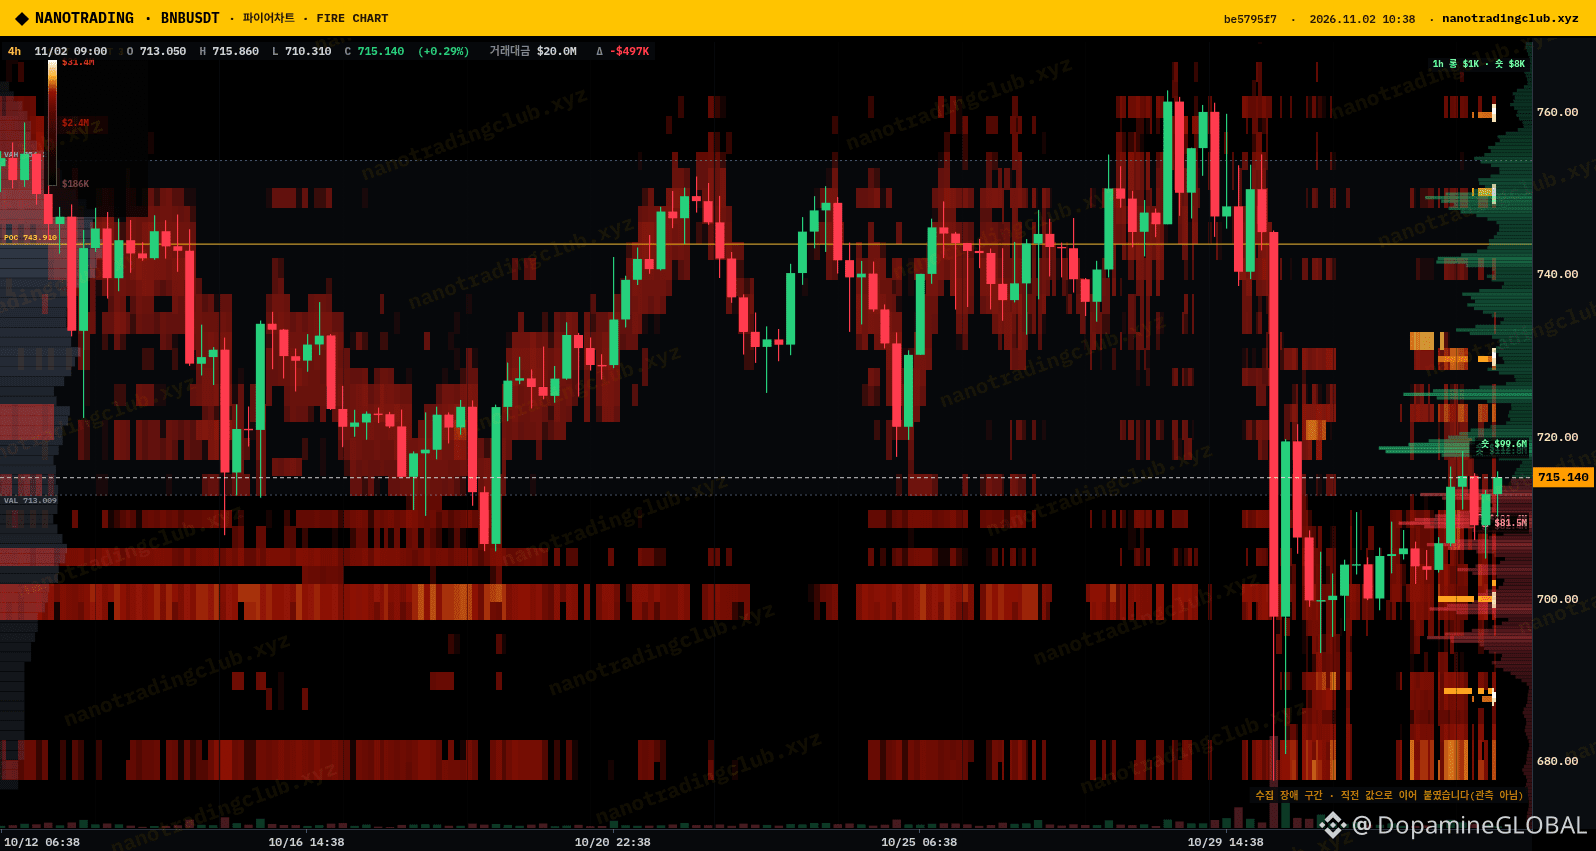
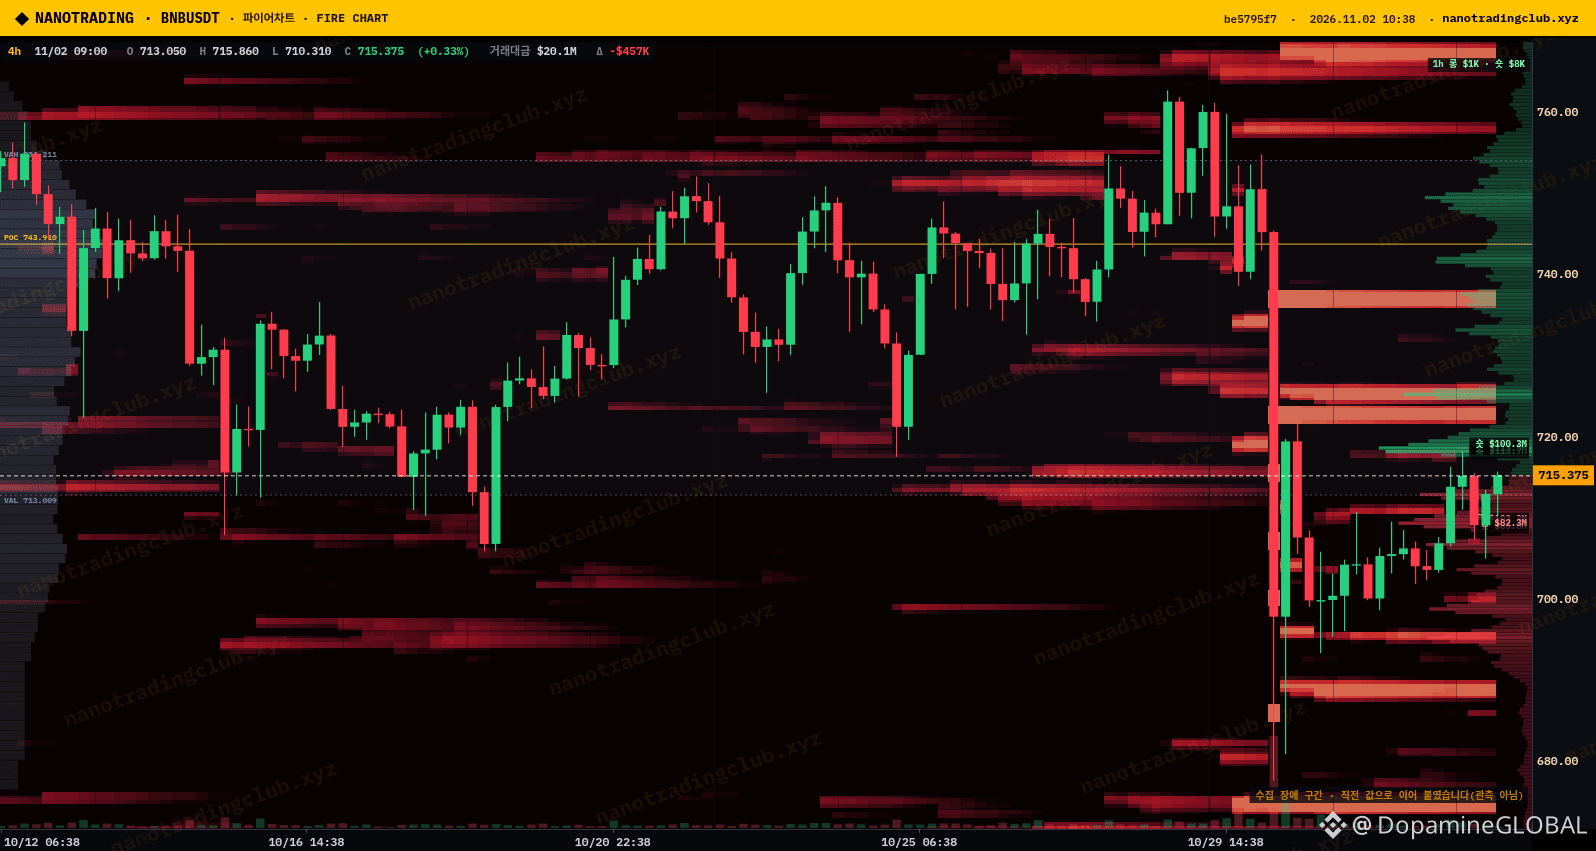
$BNB is grinding back up, ~715 now and +1.5% on the day, but it's parked right on the edge of the range it fell out of on 10/29. On the NanoTrading Fire chart (4h) the value area low sits at ~713 and the POC is all the way up at ~744, so price is barely back inside value.
What makes me cautious is the crowd split. On Binance perps ~73% of accounts are long (ratio 2.71), while top traders are basically flat at ~53% long. Funding went from 0 to ~0.007% over the last few 8h prints, yet OI on BNBUSDT slipped from ~583K to ~572K BNB. Retail leaning long into a move that isn't adding real OI is not my favourite setup.
Order book on the chart: ~$100M of asks stacked just above, around 717-720, and ~$82M of bids right under at ~712. Liquidation heatmap shows thick bands at ~725-728 and ~737 overhead, and another fat pocket down near 690.
My plan: a clean 4h close above 720 opens 725-728 quickly, and that's where I'd take profits. Lose 712 and I think $BNB goes hunting those 705 and 690 liquidations before any real push to the POC. 🧐
Are you buying this dip-recovery or waiting for 712 to break first?
NFA, just how I'm reading it.
Source: NanoTrading Fire chart (nanotradingclub.xyz)
#BNB #CryptoTrading #NanoTrading
$BNB is grinding back up, ~715 now and +1.5% on the day, but it's parked right on the edge of the range it fell out of on 10/29. On the NanoTrading Fire chart (4h) the value area low sits at ~713 and the POC is all the way up at ~744, so price is barely back inside value.
What makes me cautious is the crowd split. On Binance perps ~73% of accounts are long (ratio 2.71), while top traders are basically flat at ~53% long. Funding went from 0 to ~0.007% over the last few 8h prints, yet OI on BNBUSDT slipped from ~583K to ~572K BNB. Retail leaning long into a move that isn't adding real OI is not my favourite setup.
Order book on the chart: ~$100M of asks stacked just above, around 717-720, and ~$82M of bids right under at ~712. Liquidation heatmap shows thick bands at ~725-728 and ~737 overhead, and another fat pocket down near 690.
My plan: a clean 4h close above 720 opens 725-728 quickly, and that's where I'd take profits. Lose 712 and I think $BNB goes hunting those 705 and 690 liquidations before any real push to the POC. 🧐
Are you buying this dip-recovery or waiting for 712 to break first?
NFA, just how I'm reading it.
Source: NanoTrading Fire chart (nanotradingclub.xyz)
#BNB #CryptoTrading #NanoTrading
What makes me cautious is the crowd split. On Binance perps ~73% of accounts are long (ratio 2.71), while top traders are basically flat at ~53% long. Funding went from 0 to ~0.007% over the last few 8h prints, yet OI on BNBUSDT slipped from ~583K to ~572K BNB. Retail leaning long into a move that isn't adding real OI is not my favourite setup.
Order book on the chart: ~$100M of asks stacked just above, around 717-720, and ~$82M of bids right under at ~712. Liquidation heatmap shows thick bands at ~725-728 and ~737 overhead, and another fat pocket down near 690.
My plan: a clean 4h close above 720 opens 725-728 quickly, and that's where I'd take profits. Lose 712 and I think $BNB goes hunting those 705 and 690 liquidations before any real push to the POC. 🧐
Are you buying this dip-recovery or waiting for 712 to break first?
NFA, just how I'm reading it.
Source: NanoTrading Fire chart (nanotradingclub.xyz)
#BNB #CryptoTrading #NanoTrading
1
112
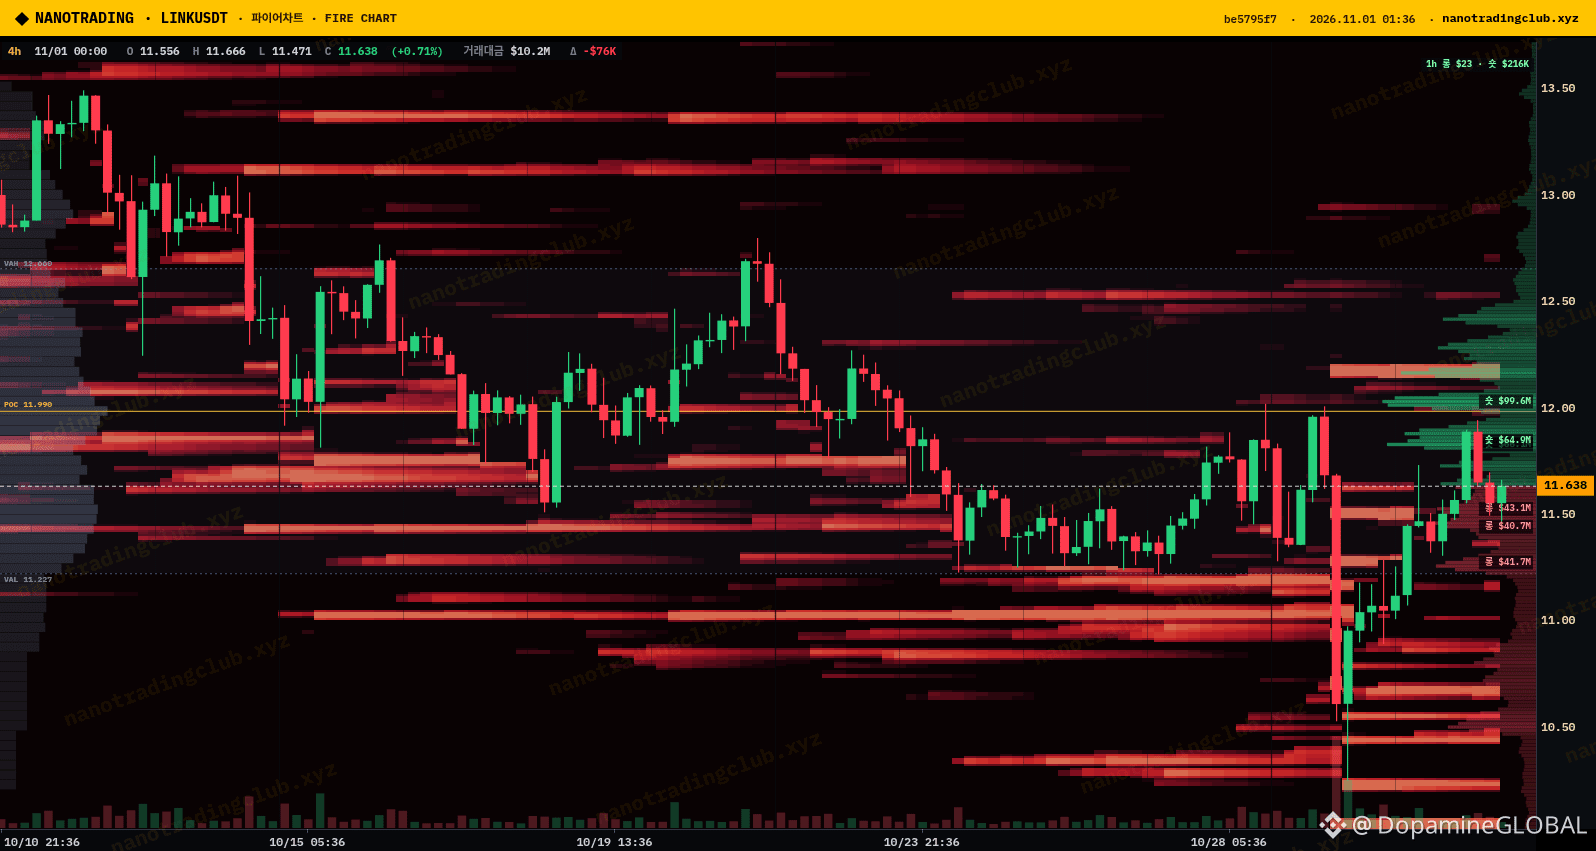
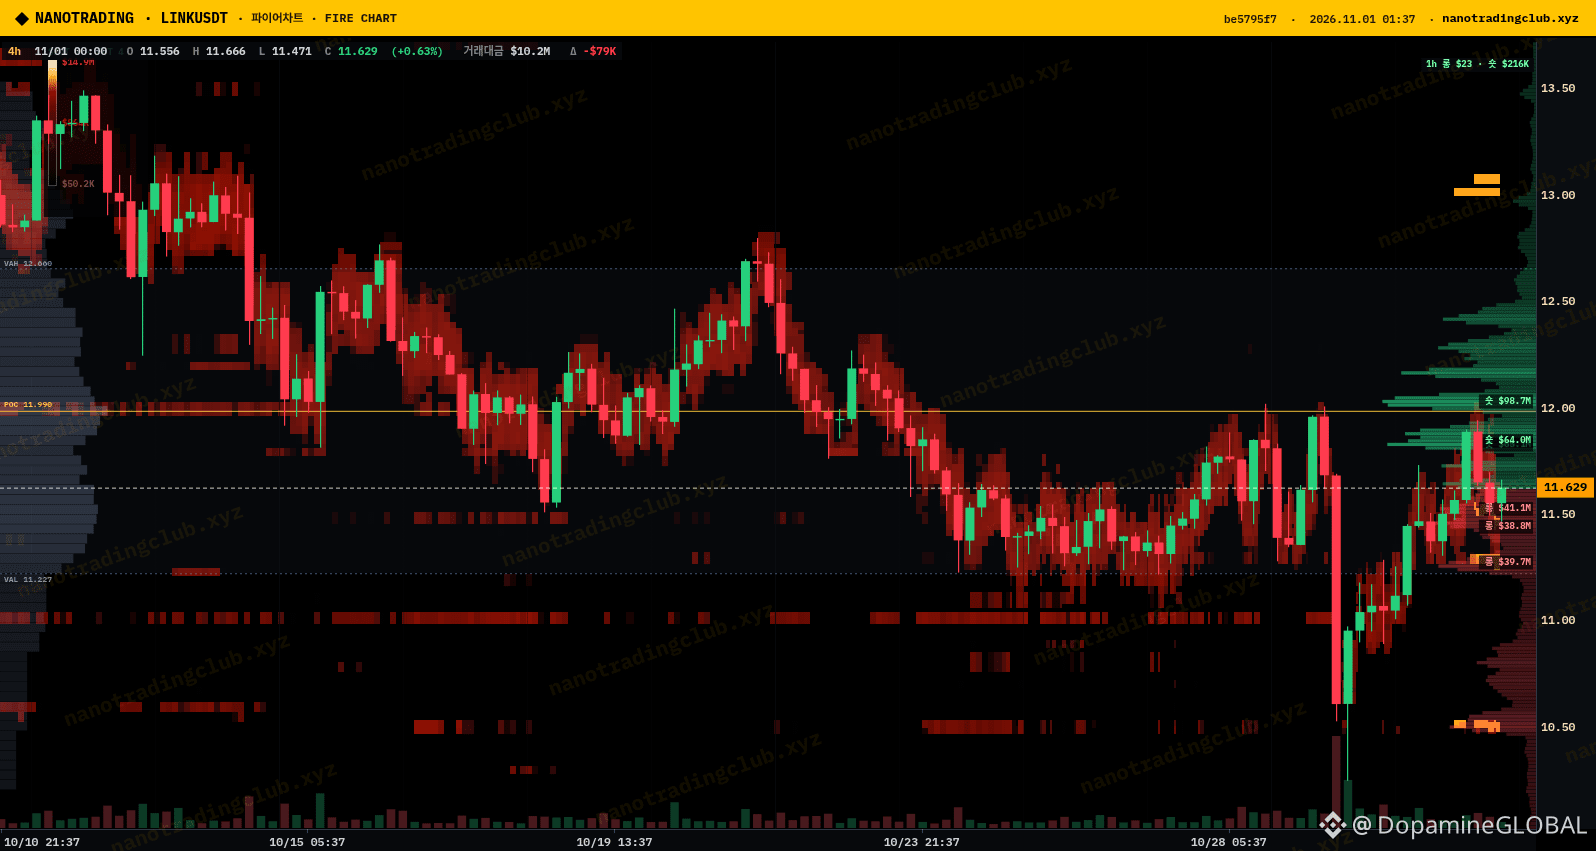
$LINK bounced from the 10.9 flush earlier this week and is now grinding around 11.65, up about 2% on the day. On the NanoTrading Fire chart the 4h POC sits at 11.99, and that's exactly where the biggest pocket of short liquidations is parked, roughly $99.6M near 12.00 with another ~$64.9M around 11.8.
Under price the long side is thinner and split up: about $43M and $41M stacked around 11.45-11.55, and another ~$42M near 11.3, just above the value area low at 11.23.
Binance perps are slowly loading up. OI went from about 7.90M to 8.14M LINK (~$94M) over the last day, funding is the default 0.01%, and ~66% of accounts are long (L/S 1.97), with top traders even more long at 2.41.
My read: $LINK holding 11.45 keeps the magnet pointed at that 11.8-12.0 short stack, and a clean 4h close above 12 is where it gets interesting. Lose 11.45 and those long clusters down to 11.3 probably get cleaned up first.
Do you think 12 gets tagged this week, or is the crowd too long here?
NFA, just my read of the map.
Source: NanoTrading Fire chart (nanotradingclub.xyz)
#LINK #NanoTrading #CryptoTrading
$LINK bounced from the 10.9 flush earlier this week and is now grinding around 11.65, up about 2% on the day. On the NanoTrading Fire chart the 4h POC sits at 11.99, and that's exactly where the biggest pocket of short liquidations is parked, roughly $99.6M near 12.00 with another ~$64.9M around 11.8.
Under price the long side is thinner and split up: about $43M and $41M stacked around 11.45-11.55, and another ~$42M near 11.3, just above the value area low at 11.23.
Binance perps are slowly loading up. OI went from about 7.90M to 8.14M LINK (~$94M) over the last day, funding is the default 0.01%, and ~66% of accounts are long (L/S 1.97), with top traders even more long at 2.41.
My read: $LINK holding 11.45 keeps the magnet pointed at that 11.8-12.0 short stack, and a clean 4h close above 12 is where it gets interesting. Lose 11.45 and those long clusters down to 11.3 probably get cleaned up first.
Do you think 12 gets tagged this week, or is the crowd too long here?
NFA, just my read of the map.
Source: NanoTrading Fire chart (nanotradingclub.xyz)
#LINK #NanoTrading #CryptoTrading
Under price the long side is thinner and split up: about $43M and $41M stacked around 11.45-11.55, and another ~$42M near 11.3, just above the value area low at 11.23.
Binance perps are slowly loading up. OI went from about 7.90M to 8.14M LINK (~$94M) over the last day, funding is the default 0.01%, and ~66% of accounts are long (L/S 1.97), with top traders even more long at 2.41.
My read: $LINK holding 11.45 keeps the magnet pointed at that 11.8-12.0 short stack, and a clean 4h close above 12 is where it gets interesting. Lose 11.45 and those long clusters down to 11.3 probably get cleaned up first.
Do you think 12 gets tagged this week, or is the crowd too long here?
NFA, just my read of the map.
Source: NanoTrading Fire chart (nanotradingclub.xyz)
#LINK #NanoTrading #CryptoTrading
422
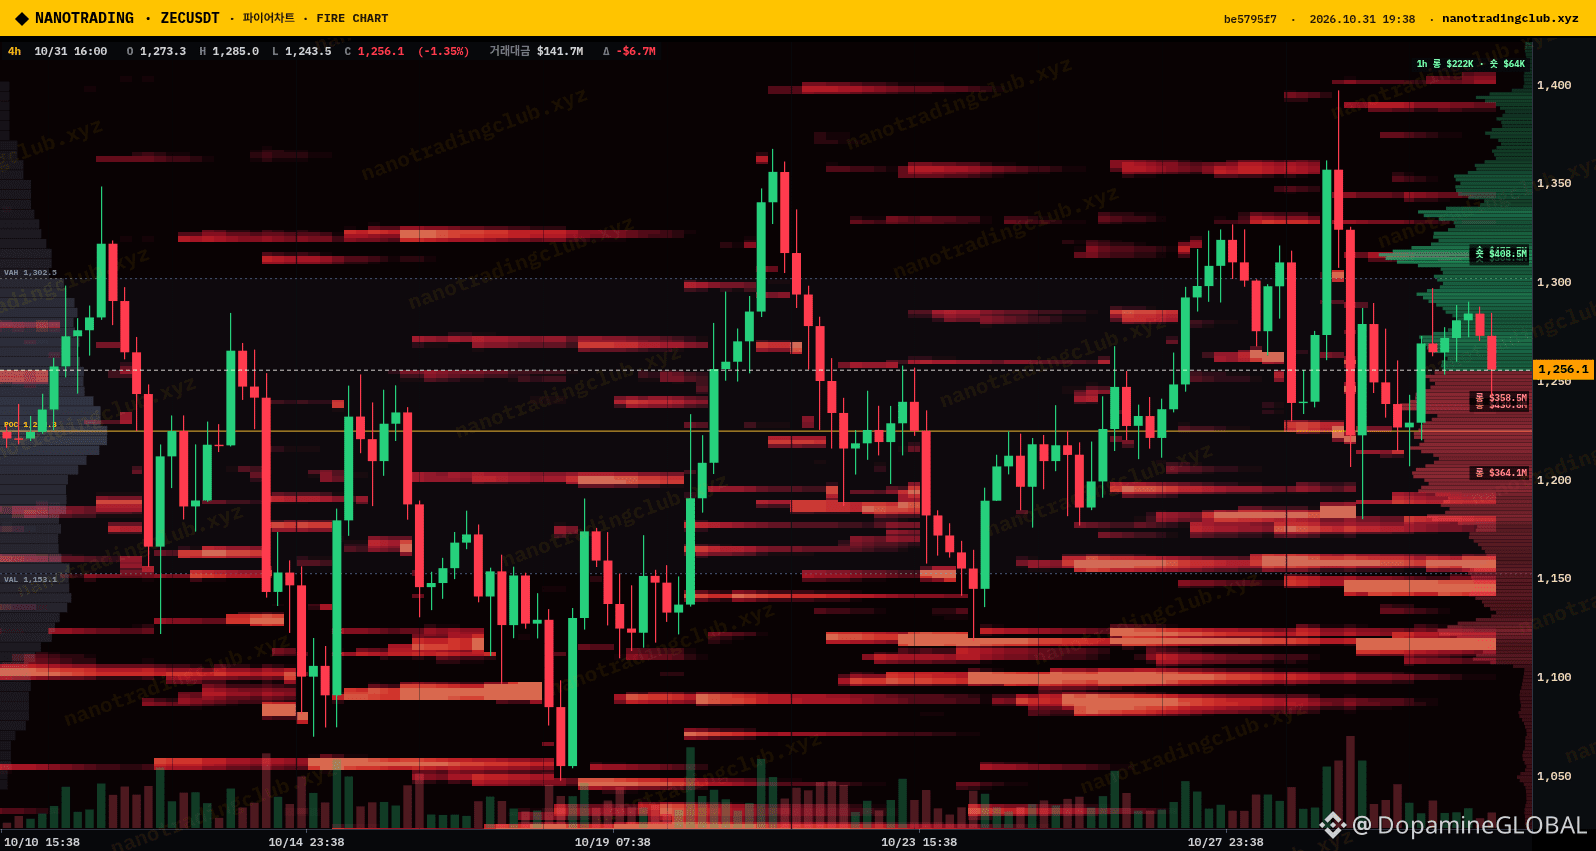
$ZEC slipped to about 1,256 this morning after getting rejected at 1,297 yesterday, and it's now sitting right on top of a stack of long liquidations.
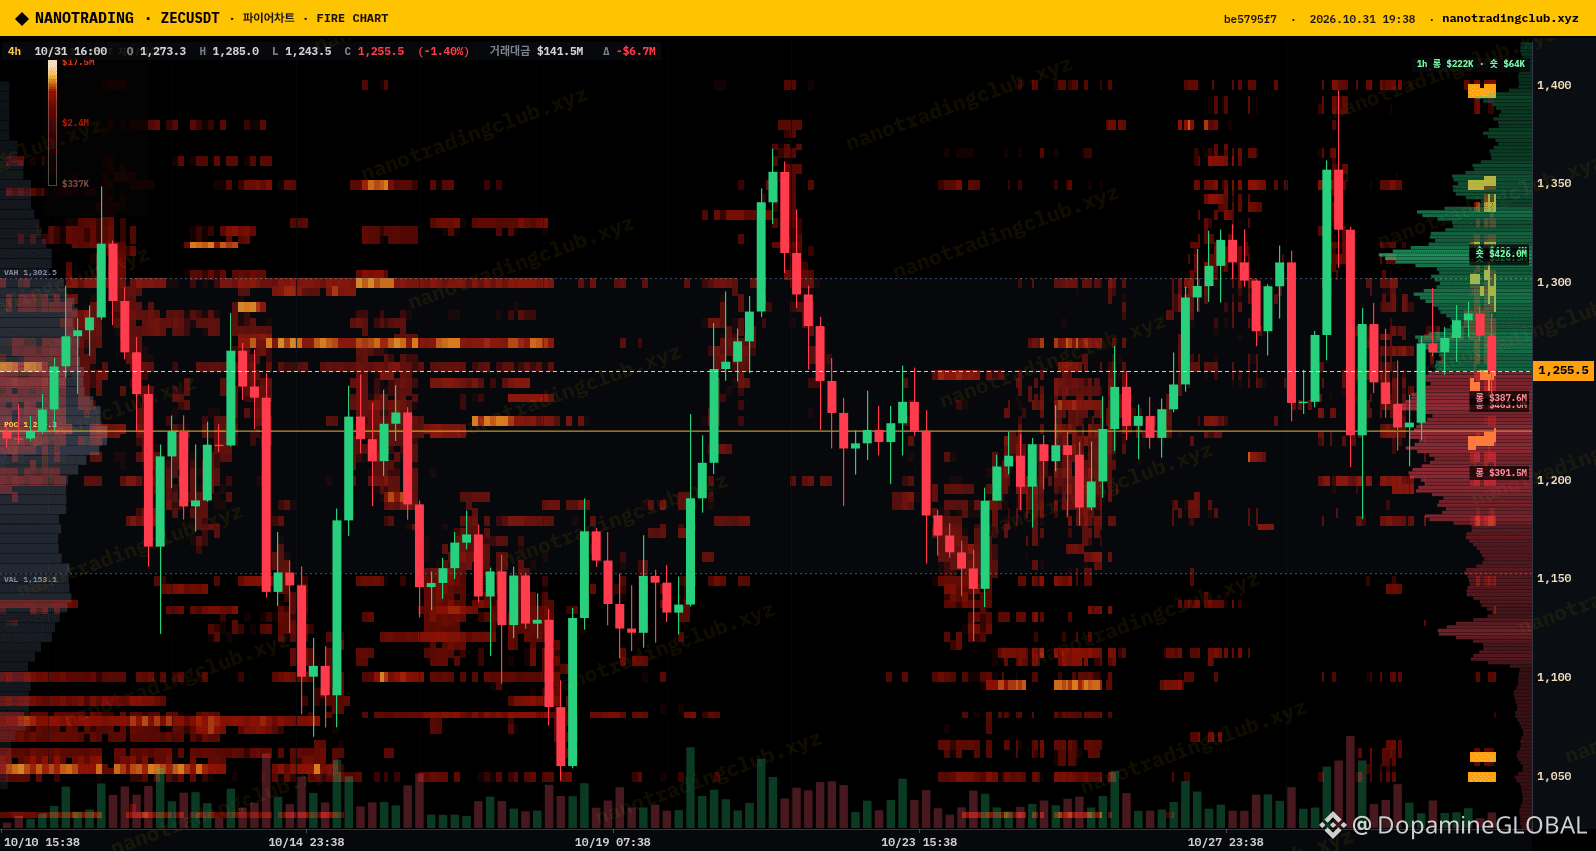
The NanoTrading Fire chart (4h) puts value between the VAH at 1,302.5 and the VAL at 1,153.1, with the POC just under price in the low 1,220s. Right below us the chart tags long clusters of about $387.6M near 1,240 and $391.5M near 1,205. Above, the short side is around $426M, sitting just over 1,300.
Funding just flipped negative to roughly -0.004% per 8h after a week of positive prints, and retail accounts on Binance are leaning short at a 0.84 long/short ratio. Top traders are still about 56% long by position, and OI has been flat around 429K ZEC, so this looks like positioning shuffling rather than new money.
My plan: if 1,240 gives way on a 4h close I expect a quick sweep into the 1,205 pocket before any bounce. Reclaim 1,300 and those $426M of shorts become the target instead.
Does $ZEC sweep the 1,205 longs first, or squeeze the shorts above 1,300?
NFA, just my read 🔥
Source: NanoTrading Fire chart (nanotradingclub.xyz)
#ZEC #Zcash #NanoTrading
$ZEC slipped to about 1,256 this morning after getting rejected at 1,297 yesterday, and it's now sitting right on top of a stack of long liquidations.
The NanoTrading Fire chart (4h) puts value between the VAH at 1,302.5 and the VAL at 1,153.1, with the POC just under price in the low 1,220s. Right below us the chart tags long clusters of about $387.6M near 1,240 and $391.5M near 1,205. Above, the short side is around $426M, sitting just over 1,300.
Funding just flipped negative to roughly -0.004% per 8h after a week of positive prints, and retail accounts on Binance are leaning short at a 0.84 long/short ratio. Top traders are still about 56% long by position, and OI has been flat around 429K ZEC, so this looks like positioning shuffling rather than new money.
My plan: if 1,240 gives way on a 4h close I expect a quick sweep into the 1,205 pocket before any bounce. Reclaim 1,300 and those $426M of shorts become the target instead.
Does $ZEC sweep the 1,205 longs first, or squeeze the shorts above 1,300?
NFA, just my read 🔥
Source: NanoTrading Fire chart (nanotradingclub.xyz)
#ZEC #Zcash #NanoTrading
The NanoTrading Fire chart (4h) puts value between the VAH at 1,302.5 and the VAL at 1,153.1, with the POC just under price in the low 1,220s. Right below us the chart tags long clusters of about $387.6M near 1,240 and $391.5M near 1,205. Above, the short side is around $426M, sitting just over 1,300.
Funding just flipped negative to roughly -0.004% per 8h after a week of positive prints, and retail accounts on Binance are leaning short at a 0.84 long/short ratio. Top traders are still about 56% long by position, and OI has been flat around 429K ZEC, so this looks like positioning shuffling rather than new money.
My plan: if 1,240 gives way on a 4h close I expect a quick sweep into the 1,205 pocket before any bounce. Reclaim 1,300 and those $426M of shorts become the target instead.
Does $ZEC sweep the 1,205 longs first, or squeeze the shorts above 1,300?
NFA, just my read 🔥
Source: NanoTrading Fire chart (nanotradingclub.xyz)
#ZEC #Zcash #NanoTrading
560
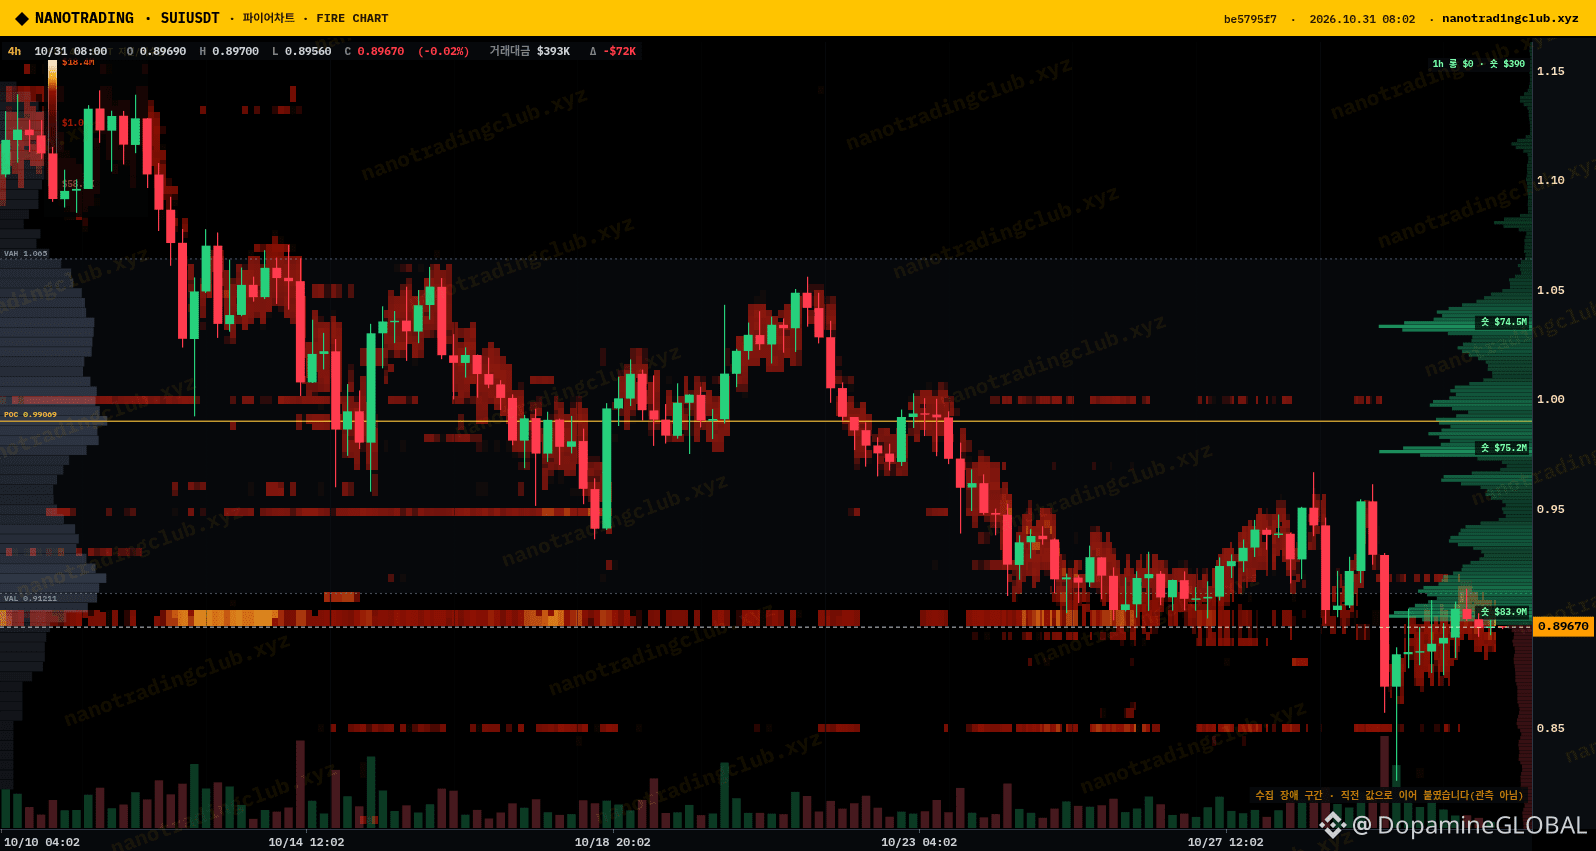
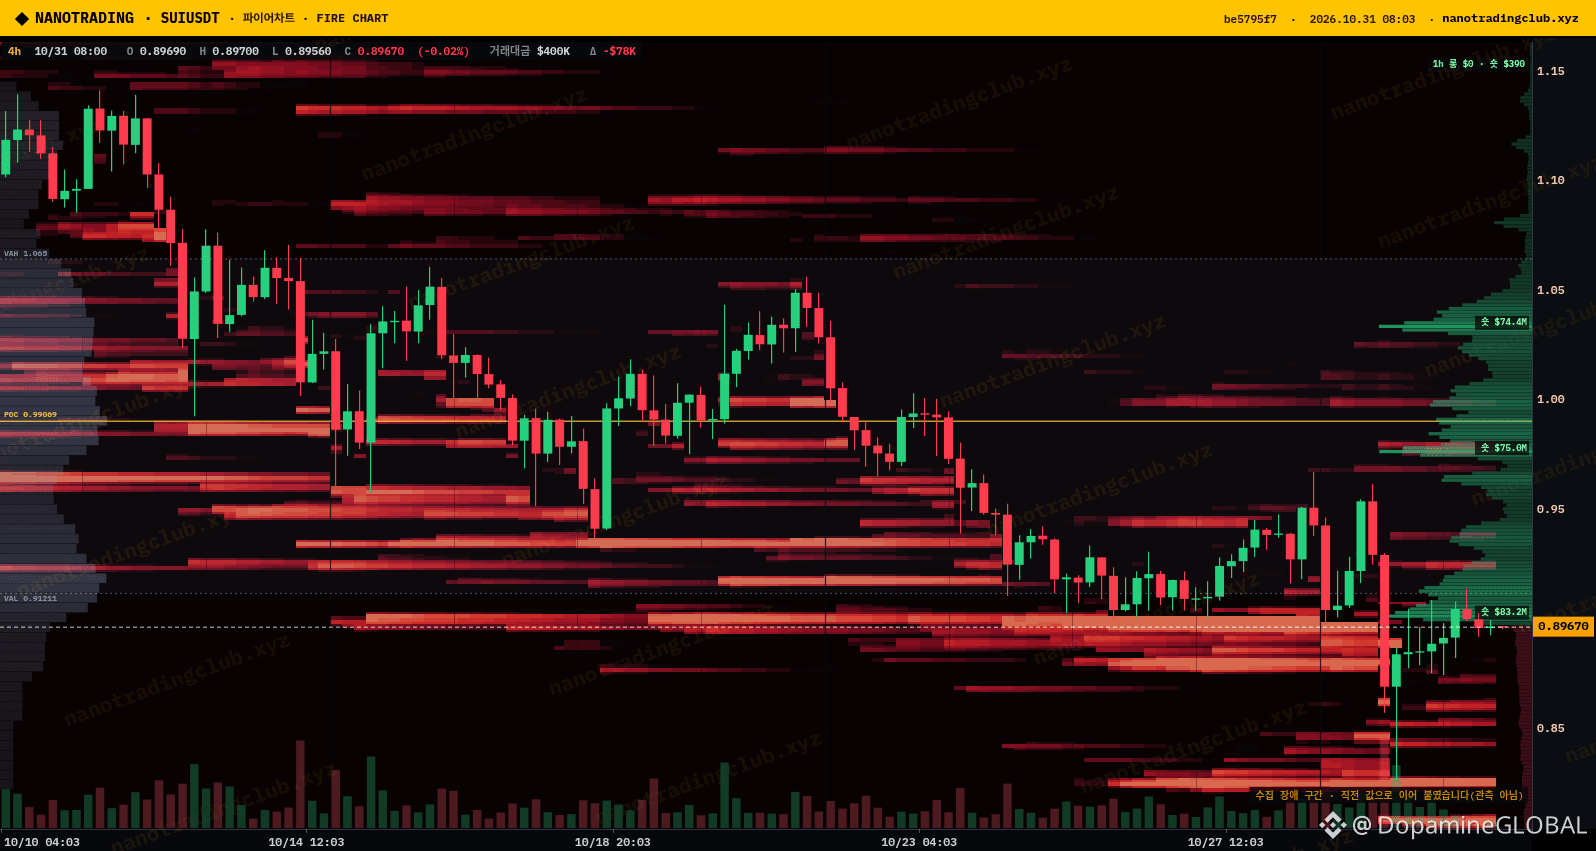
$SUI has been stuck under 0.90 all day after the flush from 0.96 down to 0.826 earlier this week. It's sitting at 0.896 now, and the last few 4h candles keep stalling between 0.892 and 0.914.
On the NanoTrading Fire chart (4h) the brightest liquidation band is right on price at 0.89-0.90, with more thick bands stacked below at 0.86-0.88, 0.85 and 0.82-0.83. Above price it's thinner, mostly 0.92-0.95. The volume POC is up near 0.99 and the value area low is around 0.912, so price is still trading below value.
Futures crowd is leaning long. About 67% of accounts are long (L/S 2.02), top traders around 66% long, and funding is pinned at 0.01%. OI crept up from about $88M to $91.5M over the last day while price went nowhere, so new longs are getting trapped in this range.
My read: with that much liquidation stacked underneath, I think $SUI sweeps 0.86-0.87 before it gets back into value. A 4h close above 0.914 flips that and opens 0.95.
Do you think the 0.86 area gets tagged first, or does it reclaim 0.91 straight away?
NFA, just my read 📉
Source: NanoTrading Fire chart (nanotradingclub.xyz)
#SUI #Sui #NanoTrading
$SUI has been stuck under 0.90 all day after the flush from 0.96 down to 0.826 earlier this week. It's sitting at 0.896 now, and the last few 4h candles keep stalling between 0.892 and 0.914.
On the NanoTrading Fire chart (4h) the brightest liquidation band is right on price at 0.89-0.90, with more thick bands stacked below at 0.86-0.88, 0.85 and 0.82-0.83. Above price it's thinner, mostly 0.92-0.95. The volume POC is up near 0.99 and the value area low is around 0.912, so price is still trading below value.
Futures crowd is leaning long. About 67% of accounts are long (L/S 2.02), top traders around 66% long, and funding is pinned at 0.01%. OI crept up from about $88M to $91.5M over the last day while price went nowhere, so new longs are getting trapped in this range.
My read: with that much liquidation stacked underneath, I think $SUI sweeps 0.86-0.87 before it gets back into value. A 4h close above 0.914 flips that and opens 0.95.
Do you think the 0.86 area gets tagged first, or does it reclaim 0.91 straight away?
NFA, just my read 📉
Source: NanoTrading Fire chart (nanotradingclub.xyz)
#SUI #Sui #NanoTrading
On the NanoTrading Fire chart (4h) the brightest liquidation band is right on price at 0.89-0.90, with more thick bands stacked below at 0.86-0.88, 0.85 and 0.82-0.83. Above price it's thinner, mostly 0.92-0.95. The volume POC is up near 0.99 and the value area low is around 0.912, so price is still trading below value.
Futures crowd is leaning long. About 67% of accounts are long (L/S 2.02), top traders around 66% long, and funding is pinned at 0.01%. OI crept up from about $88M to $91.5M over the last day while price went nowhere, so new longs are getting trapped in this range.
My read: with that much liquidation stacked underneath, I think $SUI sweeps 0.86-0.87 before it gets back into value. A 4h close above 0.914 flips that and opens 0.95.
Do you think the 0.86 area gets tagged first, or does it reclaim 0.91 straight away?
NFA, just my read 📉
Source: NanoTrading Fire chart (nanotradingclub.xyz)
#SUI #Sui #NanoTrading
4
1.4k
Log in to explore more content
Join global crypto users on Binance Square
⚡️ Get latest and useful information about crypto.
💬 Trusted by the world’s largest crypto exchange.
👍 Discover real insights from verified creators.
Email / Phone number
Trending Topics
1
#BTCReboundsAbove$60KAmidWhaleDipBuying
74,830 views
346 Discussing
2
#SolanaSets2027RoadmapToDoubleComputeCapacity
59,204 views
1,006 Discussing
3
#CaliforniaNvidiaProbeExaminesPotentialCriminalViolations
15,851 views
137 Discussing
4
#BlackRockLaunchesHKDollarDigitalLiquidityFund
48,687 views
776 Discussing
5
#NvidiaLoses$2.7TrillionInMonthAndAHalf
77,266 views
314 Discussing
6
#GlobalStocksFaceLongestLosingStreakSince2023
569,332 views
3,492 Discussing
7
#BlackRockIBITPostsRecord$541MSingleDayOutflow
94,834 views
186 Discussing
8
#AnthropicPlungesTowardIPOPriceonDay2
315,838 views
2,345 Discussing
9
#TwentyOneCapitalAdds172.25BTC
167,632 views
1,654 Discussing
10
#HKBillWouldExcludeTokenizedDepositsFromVirtualAssets
18,375 views
106 Discussing