
#pol
pol
7.5M views
16,729 Discussing
Hot
Latest


Article
What If You Found a Forgotten 2021 Wallet? $1,000 in DOT Is Now About $13 😳You're cleaning your room one morning and find an old phone. You turn it on, open the wallet, and see your 2021 bag of $DOT and $POL. 🤯
Sounds like a dream, right? Maybe it is. But crypto has a long history of surprising people, in good ways and bad ways.
Here's what that forgotten wallet would show today (approx. prices):
🔴 $DOT: $1,000 bought at the 2021 peak (about $55) would now be worth about $13
🟣 $POL (ex-MATIC): $1,000 bought at its 2021 peak (about $2.92) would now be worth about $32
Ouch. But here's the real twist: 👀 both coins still have loyal communities and active developers, and both still trade in the market today. A big drop doesn't always mean the story is over, but it also doesn't mean a comeback is guaranteed.
🎯 What recovery would look like from here:
$DOT back to $1: about +37%
$DOT back to $10: about 13.7x
$POL back to $0.50: about 5.3x
⚠️ The reality check: coins that fall 97% or more can stay low for years, and some never return. Waiting for a comeback is not a plan. Choose your position size, know your exit, and never invest money you can't afford to lose.
This is a "what if" story, not a prediction. Always DYOR.
Be honest: if you found your forgotten wallet tomorrow, would you hold, sell, or frame the screenshot? 👇 Tell me in the comments
$DOT $POL #dot #pol #BinanceSquare
What If You Found a Forgotten 2021 Wallet? $1,000 in DOT Is Now About $13 😳
You're cleaning your room one morning and find an old phone. You turn it on, open the wallet, and see your 2021 bag of $DOT and $POL . 🤯
Sounds like a dream, right? Maybe it is. But crypto has a long history of surprising people, in good ways and bad ways.
Here's what that forgotten wallet would show today (approx. prices):
🔴 $DOT: $1,000 bought at the 2021 peak (about $55) would now be worth about $13
🟣 $POL (ex-MATIC): $1,000 bought at its 2021 peak (about $2.92) would now be worth about $32
Ouch. But here's the real twist: 👀 both coins still have loyal communities and active developers, and both still trade in the market today. A big drop doesn't always mean the story is over, but it also doesn't mean a comeback is guaranteed.
🎯 What recovery would look like from here:
$DOT back to $1: about +37%
$DOT back to $10: about 13.7x
$POL back to $0.50: about 5.3x
⚠️ The reality check: coins that fall 97% or more can stay low for years, and some never return. Waiting for a comeback is not a plan. Choose your position size, know your exit, and never invest money you can't afford to lose.
This is a "what if" story, not a prediction. Always DYOR.
Be honest: if you found your forgotten wallet tomorrow, would you hold, sell, or frame the screenshot? 👇 Tell me in the comments
$DOT $POL #dot #pol #BinanceSquare
Sounds like a dream, right? Maybe it is. But crypto has a long history of surprising people, in good ways and bad ways.
Here's what that forgotten wallet would show today (approx. prices):
🔴 $DOT: $1,000 bought at the 2021 peak (about $55) would now be worth about $13
🟣 $POL (ex-MATIC): $1,000 bought at its 2021 peak (about $2.92) would now be worth about $32
Ouch. But here's the real twist: 👀 both coins still have loyal communities and active developers, and both still trade in the market today. A big drop doesn't always mean the story is over, but it also doesn't mean a comeback is guaranteed.
🎯 What recovery would look like from here:
$DOT back to $1: about +37%
$DOT back to $10: about 13.7x
$POL back to $0.50: about 5.3x
⚠️ The reality check: coins that fall 97% or more can stay low for years, and some never return. Waiting for a comeback is not a plan. Choose your position size, know your exit, and never invest money you can't afford to lose.
This is a "what if" story, not a prediction. Always DYOR.
Be honest: if you found your forgotten wallet tomorrow, would you hold, sell, or frame the screenshot? 👇 Tell me in the comments
$DOT $POL #dot #pol #BinanceSquare
1.2k

·
--
Bullish
🚨 Polygon ($POL ) Network Update!
Polygon has activated its Purley Hard Fork, marking an important network upgrade.
🔹 Network: Polygon
🔹 Token: $POL
🔹 Update: Purley Hard Fork
🔹 Focus: Network development & infrastructure
Network upgrades are an important part of blockchain evolution. 👀
#Polygon #pol #CryptoNews #blockchain #BinanceSquare
{spot}(POLUSDT)
🚨 Polygon ($POL ) Network Update!
Polygon has activated its Purley Hard Fork, marking an important network upgrade.
🔹 Network: Polygon
🔹 Token: $POL
🔹 Update: Purley Hard Fork
🔹 Focus: Network development & infrastructure
Network upgrades are an important part of blockchain evolution. 👀
#Polygon #pol #CryptoNews #blockchain #BinanceSquare
Polygon has activated its Purley Hard Fork, marking an important network upgrade.
🔹 Network: Polygon
🔹 Token: $POL
🔹 Update: Purley Hard Fork
🔹 Focus: Network development & infrastructure
Network upgrades are an important part of blockchain evolution. 👀
#Polygon #pol #CryptoNews #blockchain #BinanceSquare
Aziz1221:
0.056 0.044 net rakamlar
2
1
445

·
--
$POL
Polygon continues developing infrastructure aimed at making blockchain applications more accessible and scalable. Its progress depends on developer activity, network usage, and ecosystem adoption. Watch real transaction demand and application growth to understand how its technology is being used.
#POL #Polygon #Layer2
$POL
Polygon continues developing infrastructure aimed at making blockchain applications more accessible and scalable. Its progress depends on developer activity, network usage, and ecosystem adoption. Watch real transaction demand and application growth to understand how its technology is being used.
#POL #Polygon #Layer2
Polygon continues developing infrastructure aimed at making blockchain applications more accessible and scalable. Its progress depends on developer activity, network usage, and ecosystem adoption. Watch real transaction demand and application growth to understand how its technology is being used.
#POL #Polygon #Layer2
87

·
--
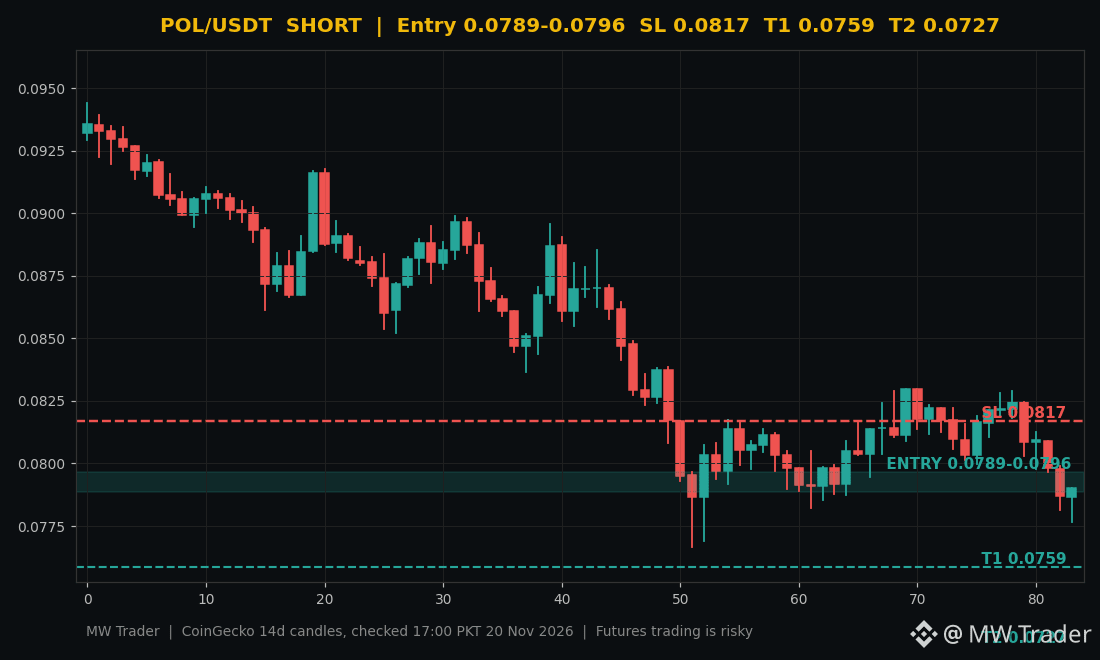
$POL #POL 📉 Polygon is down 5.22 percent today, breaking lower with the market, and I am shorting it.
Direction: SHORT 🔴
Entry zone: 0.0789 to 0.0796
Stop loss: 0.0817
Target 1: 0.0759
Target 2: 0.0727
Polygon is trading near $0.0790 after losing 5.22 percent in 24 hours, according to CoinGecko, and the live price sits right inside my entry zone of 0.0789 to 0.0796. I last posted POL on November 17, and the setup has genuinely changed, the coin has broken lower with the whole market and is now pressing toward its recent lows. My plan is short the zone, stop above $0.0817, take the first profit at $0.0759, with $0.0727 as the second target. 📉
Would you short POL here, or wait for a reclaim of $0.0817 first? 🤔
Futures trading is risky, trade small, manage risk, do your own research. ⚠️
Follow for more trades.
#Polygon #Crypto #FuturesTrading #TradingSignals
$POL #POL 📉 Polygon is down 5.22 percent today, breaking lower with the market, and I am shorting it.
Direction: SHORT 🔴
Entry zone: 0.0789 to 0.0796
Stop loss: 0.0817
Target 1: 0.0759
Target 2: 0.0727
Polygon is trading near $0.0790 after losing 5.22 percent in 24 hours, according to CoinGecko, and the live price sits right inside my entry zone of 0.0789 to 0.0796. I last posted POL on November 17, and the setup has genuinely changed, the coin has broken lower with the whole market and is now pressing toward its recent lows. My plan is short the zone, stop above $0.0817, take the first profit at $0.0759, with $0.0727 as the second target. 📉
Would you short POL here, or wait for a reclaim of $0.0817 first? 🤔
Futures trading is risky, trade small, manage risk, do your own research. ⚠️
Follow for more trades.
#Polygon #Crypto #FuturesTrading #TradingSignals
Direction: SHORT 🔴
Entry zone: 0.0789 to 0.0796
Stop loss: 0.0817
Target 1: 0.0759
Target 2: 0.0727
Polygon is trading near $0.0790 after losing 5.22 percent in 24 hours, according to CoinGecko, and the live price sits right inside my entry zone of 0.0789 to 0.0796. I last posted POL on November 17, and the setup has genuinely changed, the coin has broken lower with the whole market and is now pressing toward its recent lows. My plan is short the zone, stop above $0.0817, take the first profit at $0.0759, with $0.0727 as the second target. 📉
Would you short POL here, or wait for a reclaim of $0.0817 first? 🤔
Futures trading is risky, trade small, manage risk, do your own research. ⚠️
Follow for more trades.
#Polygon #Crypto #FuturesTrading #TradingSignals
12

·
--
🚨 $POL CAUGHT IN A MAJOR LIQUIDITY SHIFT AMID MACRO PRESSURE!
Entry: 0.0782 ⚡
Recent structural updates to collateral requirements at a major exchange are fundamentally altering how smart money handles $POL liquidity pools. As macro headwinds drive capital toward $USDC and $TRX , we are seeing a calculated institutional rotation away from high-beta risk.
At 0.0782, price action is reacting directly to shifting margin parameters rather than pure retail sentiment. 📊 Understanding these institutional footprint adjustments is critical before deploying fresh capital into the current order block.
Are you repositioning your collateral assets or staying liquid while this structure digests? 👇
⚠️ Not financial advice. Always manage your risk. 🛡️
#POL #SmartMoney #Liquidity #Crypto
🔥 💎
🚨 $POL CAUGHT IN A MAJOR LIQUIDITY SHIFT AMID MACRO PRESSURE!
Entry: 0.0782 ⚡
Recent structural updates to collateral requirements at a major exchange are fundamentally altering how smart money handles $POL liquidity pools. As macro headwinds drive capital toward $USDC and $TRX , we are seeing a calculated institutional rotation away from high-beta risk.
At 0.0782, price action is reacting directly to shifting margin parameters rather than pure retail sentiment. 📊 Understanding these institutional footprint adjustments is critical before deploying fresh capital into the current order block.
Are you repositioning your collateral assets or staying liquid while this structure digests? 👇
⚠️ Not financial advice. Always manage your risk. 🛡️
#POL #SmartMoney #Liquidity #Crypto
🔥 💎
Entry: 0.0782 ⚡
Recent structural updates to collateral requirements at a major exchange are fundamentally altering how smart money handles $POL liquidity pools. As macro headwinds drive capital toward $USDC and $TRX , we are seeing a calculated institutional rotation away from high-beta risk.
At 0.0782, price action is reacting directly to shifting margin parameters rather than pure retail sentiment. 📊 Understanding these institutional footprint adjustments is critical before deploying fresh capital into the current order block.
Are you repositioning your collateral assets or staying liquid while this structure digests? 👇
⚠️ Not financial advice. Always manage your risk. 🛡️
#POL #SmartMoney #Liquidity #Crypto
🔥 💎
4

·
--
🚨 $POL SITTING AT A PIVOT AS TOKENIZED COLLATERAL RESHAPES LIQUIDITY DYNAMICS ⚡
Entry: 0.0782 ⚡
Macro headwinds are testing altcoin structures this Friday afternoon as capital hunts for safety. 📊 Fresh collateral rules for tokenized assets on a major exchange are completely shifting how smart money manages risk across pairings like $USDC and $TRX . 🌊
While broader markets feel the strain of looming rate hikes, this specific demand node acts as a primary liquidity magnet. 💡 Institutional flows show a clear rotation toward predictable positioning while retail reacts in real-time to shifting margin requirements.
Are you locking in stablecoin protection or holding your ground through the macro chop? 👇
⚠️ Not financial advice. Always manage your risk. 🛡️
🏷️ #POL #Liquidity #Crypto #Trading #Altcoins
🔥 💎
🚨 $POL SITTING AT A PIVOT AS TOKENIZED COLLATERAL RESHAPES LIQUIDITY DYNAMICS ⚡
Entry: 0.0782 ⚡
Macro headwinds are testing altcoin structures this Friday afternoon as capital hunts for safety. 📊 Fresh collateral rules for tokenized assets on a major exchange are completely shifting how smart money manages risk across pairings like $USDC and $TRX . 🌊
While broader markets feel the strain of looming rate hikes, this specific demand node acts as a primary liquidity magnet. 💡 Institutional flows show a clear rotation toward predictable positioning while retail reacts in real-time to shifting margin requirements.
Are you locking in stablecoin protection or holding your ground through the macro chop? 👇
⚠️ Not financial advice. Always manage your risk. 🛡️
🏷️ #POL #Liquidity #Crypto #Trading #Altcoins
🔥 💎
Entry: 0.0782 ⚡
Macro headwinds are testing altcoin structures this Friday afternoon as capital hunts for safety. 📊 Fresh collateral rules for tokenized assets on a major exchange are completely shifting how smart money manages risk across pairings like $USDC and $TRX . 🌊
While broader markets feel the strain of looming rate hikes, this specific demand node acts as a primary liquidity magnet. 💡 Institutional flows show a clear rotation toward predictable positioning while retail reacts in real-time to shifting margin requirements.
Are you locking in stablecoin protection or holding your ground through the macro chop? 👇
⚠️ Not financial advice. Always manage your risk. 🛡️
🏷️ #POL #Liquidity #Crypto #Trading #Altcoins
🔥 💎
6
·
--
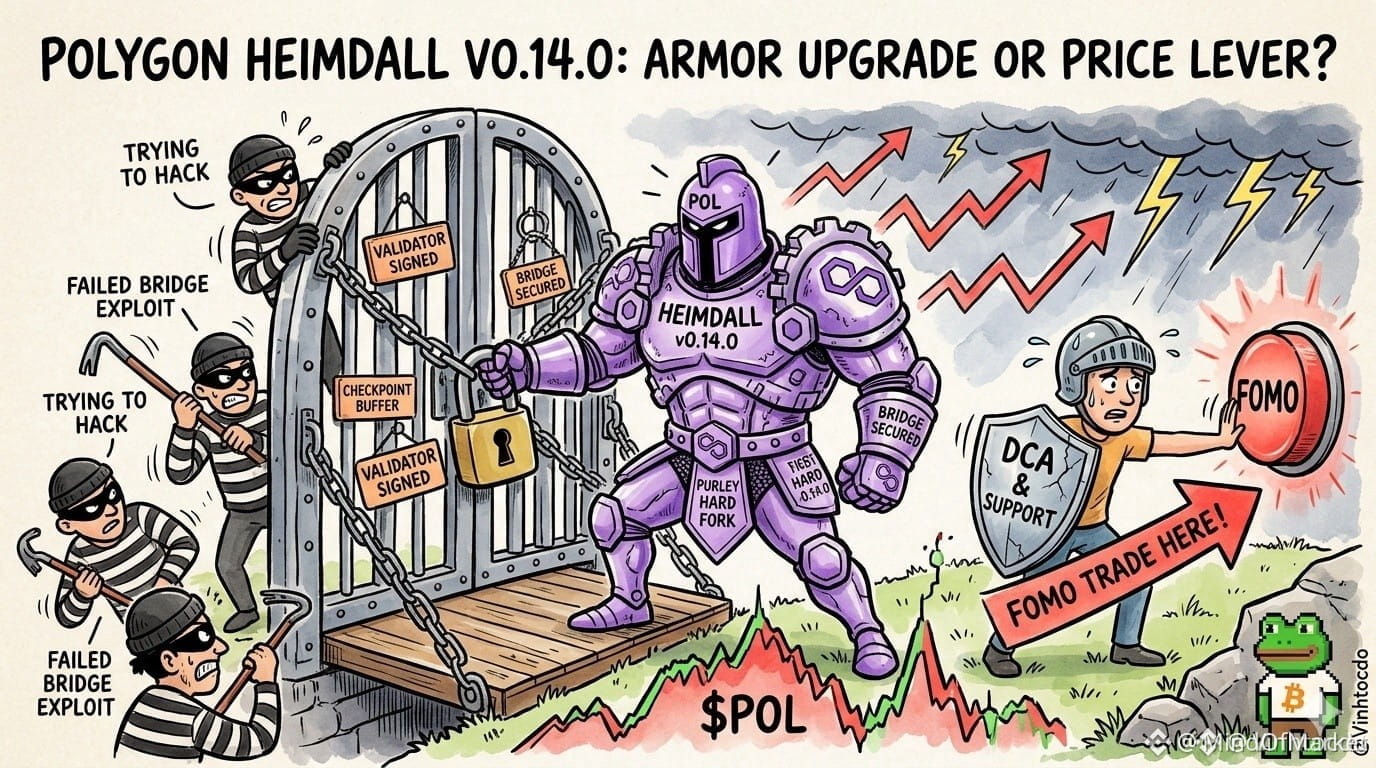
🦈 $POL DEPLOYING INSTITUTIONAL SECURITY PROTOCOLS WHILE SMART MONEY WATCHES KEY SUPPORT ⚡
The recent activation of the Purley hard fork and Heimdall v0.14.0 upgrade introduces rigorous validator signature enforcement and institutional-grade bridge verification across the network. 📊
Technical upgrades rarely trigger immediate momentum shifts during macro contractions, especially with $BTC probing liquidity beneath 62,000. Institutional order flow favors patience over retail chasing, prioritizing structural accumulation zones over emotional breakouts. 🔍
💬 Are you accumulating $POL at current structural supports or waiting for macro headwinds to clear? 👇
⚠️ Not financial advice. Always manage your risk. 🛡️
🏷️ #POL #Layer2 #Crypto #SmartMoney
🔥 🦈
🦈 $POL DEPLOYING INSTITUTIONAL SECURITY PROTOCOLS WHILE SMART MONEY WATCHES KEY SUPPORT ⚡
The recent activation of the Purley hard fork and Heimdall v0.14.0 upgrade introduces rigorous validator signature enforcement and institutional-grade bridge verification across the network. 📊
Technical upgrades rarely trigger immediate momentum shifts during macro contractions, especially with $BTC probing liquidity beneath 62,000. Institutional order flow favors patience over retail chasing, prioritizing structural accumulation zones over emotional breakouts. 🔍
💬 Are you accumulating $POL at current structural supports or waiting for macro headwinds to clear? 👇
⚠️ Not financial advice. Always manage your risk. 🛡️
🏷️ #POL #Layer2 #Crypto #SmartMoney
🔥 🦈
The recent activation of the Purley hard fork and Heimdall v0.14.0 upgrade introduces rigorous validator signature enforcement and institutional-grade bridge verification across the network. 📊
Technical upgrades rarely trigger immediate momentum shifts during macro contractions, especially with $BTC probing liquidity beneath 62,000. Institutional order flow favors patience over retail chasing, prioritizing structural accumulation zones over emotional breakouts. 🔍
💬 Are you accumulating $POL at current structural supports or waiting for macro headwinds to clear? 👇
⚠️ Not financial advice. Always manage your risk. 🛡️
🏷️ #POL #Layer2 #Crypto #SmartMoney
🔥 🦈
7


$POL: When the Checklist Stays on the Desk and the Excitement Takes the Car Keys
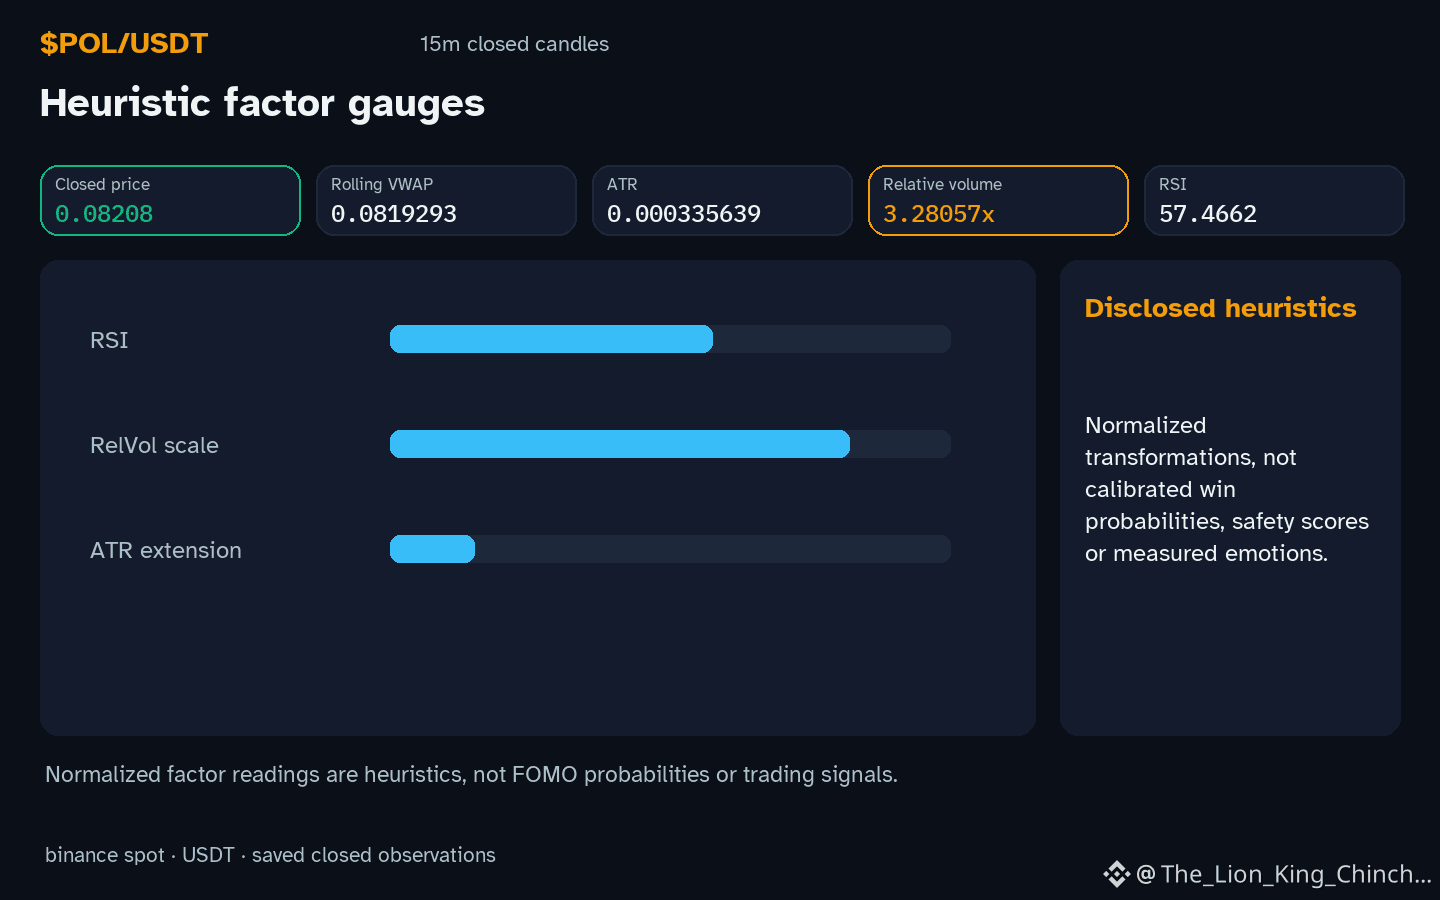
Why does $POL often feel like a sprint when the candle burns fast? The observation shows an hourly direction up and volume above baseline, a classic high‑energy scenario. Imagine a researcher who writes a checklist, then forgets it as soon as the first green bar appears – the mind races, the watchlist stays calm.
One way to guard against that rush is to treat the rapid candle as a hypothesis test. The fast move suggests momentum, but the relative volume 3.28x baseline reminds us that sheer activity can be misleading. A simple mechanism: pause after the candle closes, compare the price to the local support 0.0813 and resistance 0.08223 levels, and note the RSI 57.5. If RSI is still in a neutral band, the move may lack conviction.
A counterexample appears when the same setup repeats with a lower volume spike; the momentum fades and price reverts toward the support zone. The self‑check is straightforward: after a fast candle, wait one more hourly bar and see if price respects the earlier support or breaks it. If the next bar closes below 0.0813, the initial excitement was likely premature, and the checklist should be revisited.
Probabilistic market research, not a recommendation or guaranteed return.
For a wider view: $BTC has hourly direction down and volume above its baseline; $ZKC has hourly direction down and volume not above its baseline. This alone does not establish correlation.
#POL #BTC #ZKC #LearnCrypto
$POL : When the Checklist Stays on the Desk and the Excitement Takes the Car Keys
Why does $POL often feel like a sprint when the candle burns fast? The observation shows an hourly direction up and volume above baseline, a classic high‑energy scenario. Imagine a researcher who writes a checklist, then forgets it as soon as the first green bar appears – the mind races, the watchlist stays calm.
One way to guard against that rush is to treat the rapid candle as a hypothesis test. The fast move suggests momentum, but the relative volume 3.28x baseline reminds us that sheer activity can be misleading. A simple mechanism: pause after the candle closes, compare the price to the local support 0.0813 and resistance 0.08223 levels, and note the RSI 57.5. If RSI is still in a neutral band, the move may lack conviction.
A counterexample appears when the same setup repeats with a lower volume spike; the momentum fades and price reverts toward the support zone. The self‑check is straightforward: after a fast candle, wait one more hourly bar and see if price respects the earlier support or breaks it. If the next bar closes below 0.0813, the initial excitement was likely premature, and the checklist should be revisited.
Probabilistic market research, not a recommendation or guaranteed return.
For a wider view: $BTC has hourly direction down and volume above its baseline; $ZKC has hourly direction down and volume not above its baseline. This alone does not establish correlation.
#POL #BTC #ZKC #LearnCrypto
Why does $POL often feel like a sprint when the candle burns fast? The observation shows an hourly direction up and volume above baseline, a classic high‑energy scenario. Imagine a researcher who writes a checklist, then forgets it as soon as the first green bar appears – the mind races, the watchlist stays calm.
One way to guard against that rush is to treat the rapid candle as a hypothesis test. The fast move suggests momentum, but the relative volume 3.28x baseline reminds us that sheer activity can be misleading. A simple mechanism: pause after the candle closes, compare the price to the local support 0.0813 and resistance 0.08223 levels, and note the RSI 57.5. If RSI is still in a neutral band, the move may lack conviction.
A counterexample appears when the same setup repeats with a lower volume spike; the momentum fades and price reverts toward the support zone. The self‑check is straightforward: after a fast candle, wait one more hourly bar and see if price respects the earlier support or breaks it. If the next bar closes below 0.0813, the initial excitement was likely premature, and the checklist should be revisited.
Probabilistic market research, not a recommendation or guaranteed return.
For a wider view: $BTC has hourly direction down and volume above its baseline; $ZKC has hourly direction down and volume not above its baseline. This alone does not establish correlation.
#POL #BTC #ZKC #LearnCrypto
25

$POL is reaching an active decision zone where momentum can expand quickly.
$POL is sitting close to support, and the next reaction here can define the next intraday move.
Setup LONG $POL (max 10x)
🎯 Entry: 0.08156 - 0.08221
🛑 SL: 0.08118
✅ TP1: 0.08303
✅ TP2: 0.0841
✅ TP3: 0.08533
• Hyperliquid’s Policy Group Asks the CFTC for One Line Separating Event Contracts From Bets
Do you prefer the breakout on $POL, or the retest entry?
Trade $POL here 👇
#POL #MarketStructure #TradingSetup
$POL is reaching an active decision zone where momentum can expand quickly.
$POL is sitting close to support, and the next reaction here can define the next intraday move.
Setup LONG $POL (max 10x)
🎯 Entry: 0.08156 - 0.08221
🛑 SL: 0.08118
✅ TP1: 0.08303
✅ TP2: 0.0841
✅ TP3: 0.08533
• Hyperliquid’s Policy Group Asks the CFTC for One Line Separating Event Contracts From Bets
Do you prefer the breakout on $POL , or the retest entry?
Trade $POL here 👇
#POL #MarketStructure #TradingSetup
$POL is sitting close to support, and the next reaction here can define the next intraday move.
Setup LONG $POL (max 10x)
🎯 Entry: 0.08156 - 0.08221
🛑 SL: 0.08118
✅ TP1: 0.08303
✅ TP2: 0.0841
✅ TP3: 0.08533
• Hyperliquid’s Policy Group Asks the CFTC for One Line Separating Event Contracts From Bets
Do you prefer the breakout on $POL , or the retest entry?
Trade $POL here 👇
#POL #MarketStructure #TradingSetup
71

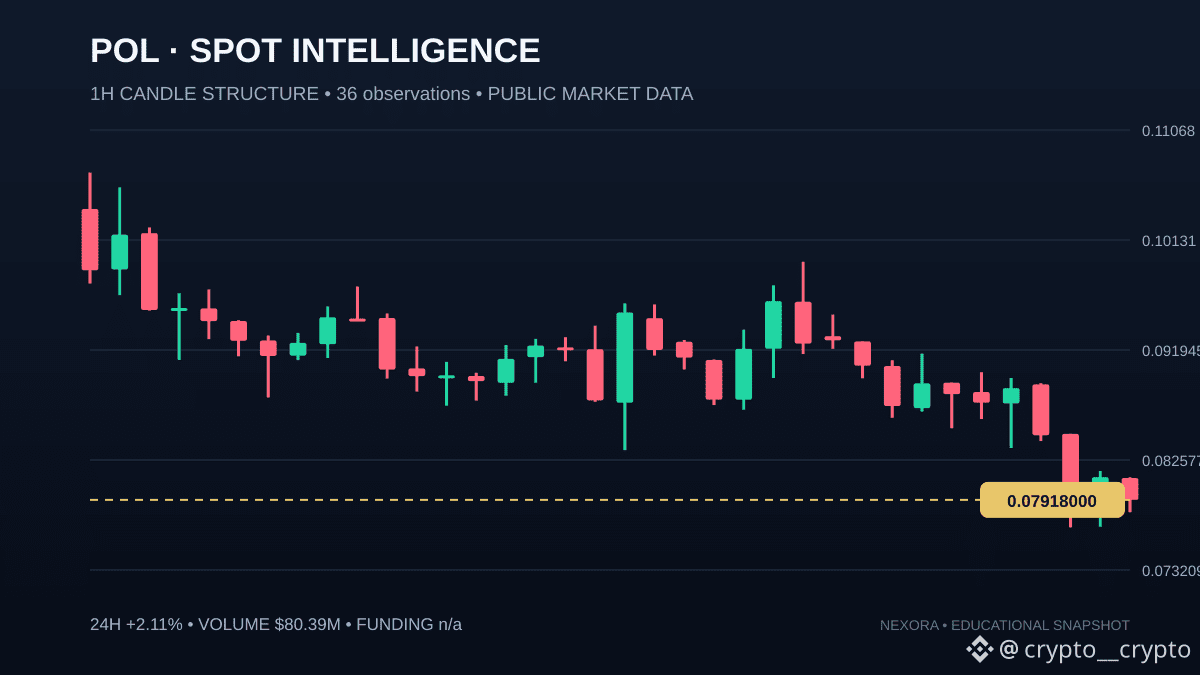
NEXORA // THE STRUCTURE CHECK
━━━━━━━━━━━━━━━━━━━━
Polygon (prev. MATIC) / POL • SPOT MARKET
PRICE $0.081163231
24H MOVE +2.11%
24H VOLUME $80.39M
MARKET CAP $864.50M
MARKET RANK #60
LATEST DAILY RANGE 3.81%
A single percentage change is not a complete market read. Compare the latest daily candle with the broader sequence.
CHART READ: The latest daily close is below the first candle's open across the displayed sample. This is historical context, not a forecast.
DATA: CoinMarketCap market snapshot + CoinLore daily OHLCV. Captured 18 Nov 2026, 00:44 IST.
Research snapshot only — not a trade signal or financial advice.
#NEXORA #CryptoMarket #POL
NEXORA // THE STRUCTURE CHECK
━━━━━━━━━━━━━━━━━━━━
Polygon (prev. MATIC) / POL • SPOT MARKET
PRICE $0.081163231
24H MOVE +2.11%
24H VOLUME $80.39M
MARKET CAP $864.50M
MARKET RANK #60
LATEST DAILY RANGE 3.81%
A single percentage change is not a complete market read. Compare the latest daily candle with the broader sequence.
CHART READ: The latest daily close is below the first candle's open across the displayed sample. This is historical context, not a forecast.
DATA: CoinMarketCap market snapshot + CoinLore daily OHLCV. Captured 18 Nov 2026, 00:44 IST.
Research snapshot only — not a trade signal or financial advice.
#NEXORA #CryptoMarket #POL
━━━━━━━━━━━━━━━━━━━━
Polygon (prev. MATIC) / POL • SPOT MARKET
PRICE $0.081163231
24H MOVE +2.11%
24H VOLUME $80.39M
MARKET CAP $864.50M
MARKET RANK #60
LATEST DAILY RANGE 3.81%
A single percentage change is not a complete market read. Compare the latest daily candle with the broader sequence.
CHART READ: The latest daily close is below the first candle's open across the displayed sample. This is historical context, not a forecast.
DATA: CoinMarketCap market snapshot + CoinLore daily OHLCV. Captured 18 Nov 2026, 00:44 IST.
Research snapshot only — not a trade signal or financial advice.
#NEXORA #CryptoMarket #POL
41

·
--
Bullish
$POL
#pol
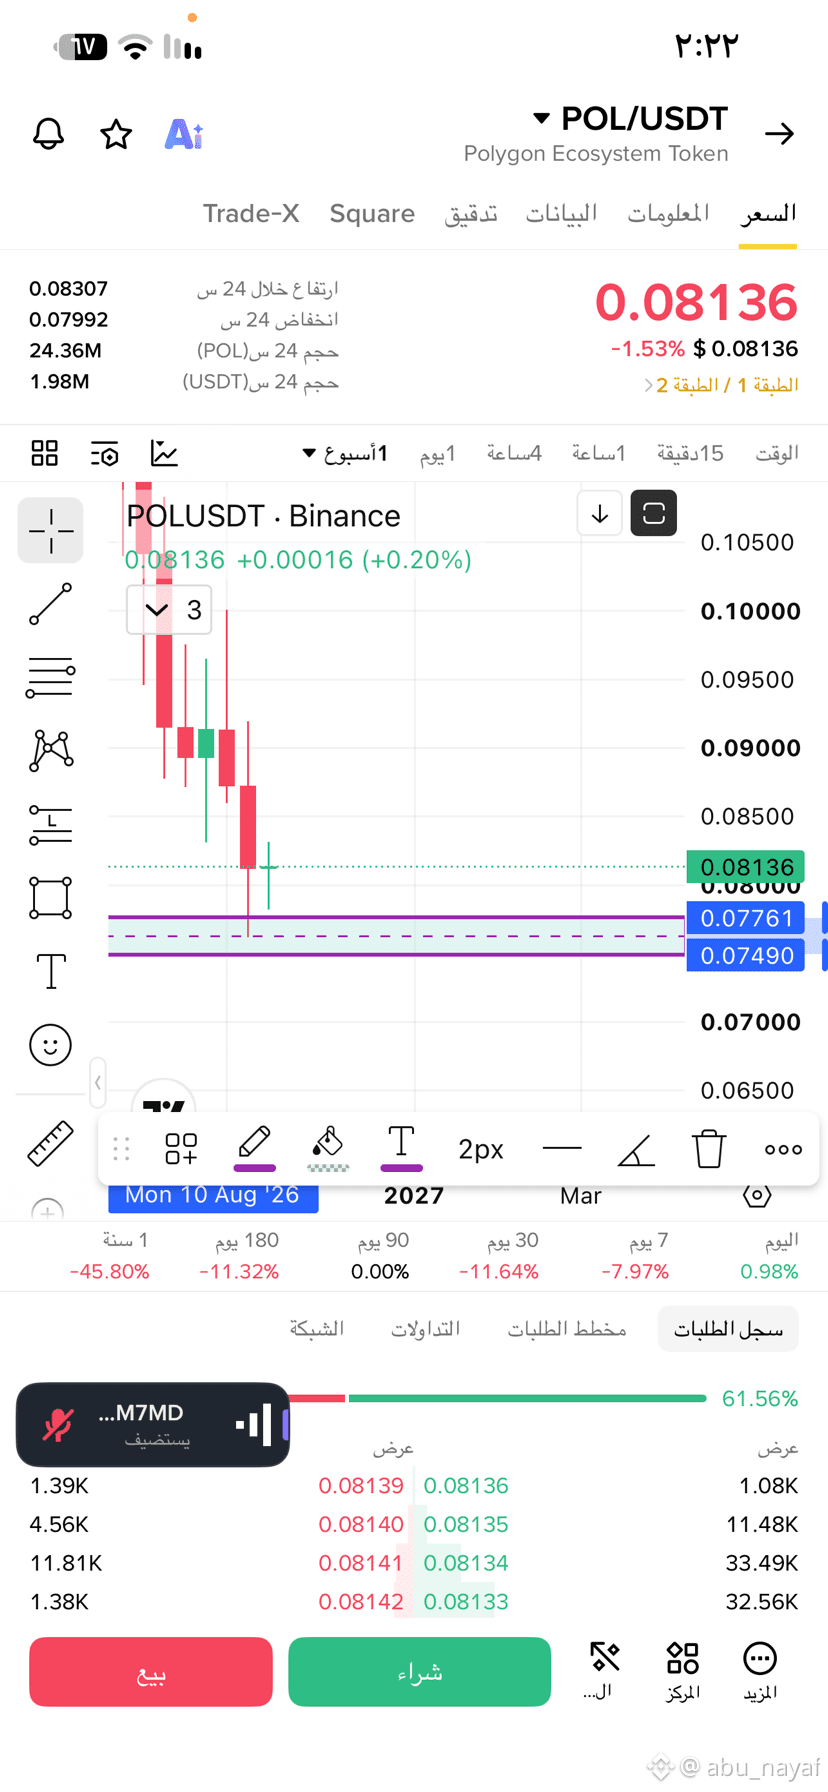
Worth taking a chance
And if you entered around 0.080, it’s worth it too
Weekly golden order block
$POL
#pol
Worth taking a chance
And if you entered around 0.080, it’s worth it too
Weekly golden order block
#pol
Worth taking a chance
And if you entered around 0.080, it’s worth it too
Weekly golden order block
abo_nayaf
·
--
Bullish$HBAR
#hbar
It deserves accumulation within the golden weekly order block.
The numbers between the two numbers are in blue.
#hbar
It deserves accumulation within the golden weekly order block.
The numbers between the two numbers are in blue.
ابو سلطان بندر المالكي:
ابداع استاذ ابو نياف 🌹
4
1
8
1.2k
$POL: Bandwagon Effect: When High Social Volume Peaks Right at Structural Resistance
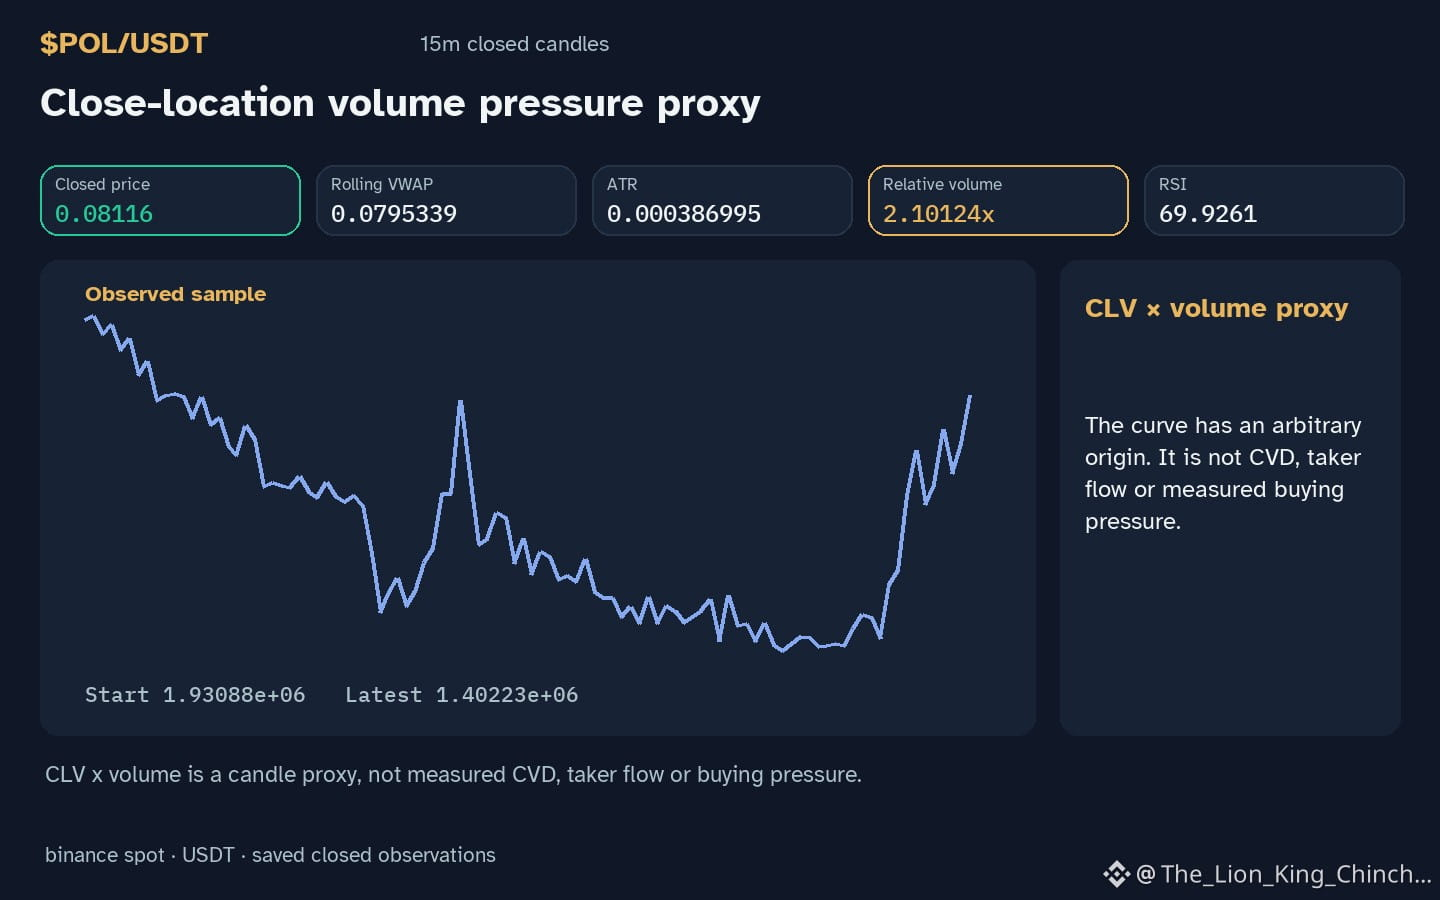
Does $POL volume above baseline signal strength or a trap? Anchoring bias asks if we fixate on the recent high instead of the full range. Imagine a hypothetical trader who sees relative volume at 2.10x baseline and assumes enthusiastic buying supports the price. This mental shortcut ignores that the price is currently above resistance. The enthusiasm peaks exactly where structural limits are tested. If the crowd believes the high is permanent, they may enter late. This describes a potential psychological reaction, not actual trader motives. Candles alone cannot prove who is buying or why. The tension lies in how attention focuses on visible activity rather than context. A practical self-check asks whether your decision relies on one data point. Consider how the RSI reading 69.9261 reflects momentum but does not guarantee continuation. If the next closed candle closes below support, the initial enthusiasm interpretation weakens. This counterexample shows why anchoring to a recent peak can be misleading. The full picture includes the local resistance level and the daily change 1.20963%. Without these context points, volume alone lacks meaning. This hypothetical mechanism helps explain why people might feel pressure to join a move. It fails when the market rejects the level, rendering the earlier excitement irrelevant. Use the saved observation to test your own bias, not as a prediction. The market may behave differently than the narrative suggests. Focus on what closed candles confirm over time.
Probabilistic market research, not a recommendation or guaranteed return.
#POL #TradingPsychology #CryptoLearning
$POL : Bandwagon Effect: When High Social Volume Peaks Right at Structural Resistance
Does $POL volume above baseline signal strength or a trap? Anchoring bias asks if we fixate on the recent high instead of the full range. Imagine a hypothetical trader who sees relative volume at 2.10x baseline and assumes enthusiastic buying supports the price. This mental shortcut ignores that the price is currently above resistance. The enthusiasm peaks exactly where structural limits are tested. If the crowd believes the high is permanent, they may enter late. This describes a potential psychological reaction, not actual trader motives. Candles alone cannot prove who is buying or why. The tension lies in how attention focuses on visible activity rather than context. A practical self-check asks whether your decision relies on one data point. Consider how the RSI reading 69.9261 reflects momentum but does not guarantee continuation. If the next closed candle closes below support, the initial enthusiasm interpretation weakens. This counterexample shows why anchoring to a recent peak can be misleading. The full picture includes the local resistance level and the daily change 1.20963%. Without these context points, volume alone lacks meaning. This hypothetical mechanism helps explain why people might feel pressure to join a move. It fails when the market rejects the level, rendering the earlier excitement irrelevant. Use the saved observation to test your own bias, not as a prediction. The market may behave differently than the narrative suggests. Focus on what closed candles confirm over time.
Probabilistic market research, not a recommendation or guaranteed return.
#POL #TradingPsychology #CryptoLearning
Does $POL volume above baseline signal strength or a trap? Anchoring bias asks if we fixate on the recent high instead of the full range. Imagine a hypothetical trader who sees relative volume at 2.10x baseline and assumes enthusiastic buying supports the price. This mental shortcut ignores that the price is currently above resistance. The enthusiasm peaks exactly where structural limits are tested. If the crowd believes the high is permanent, they may enter late. This describes a potential psychological reaction, not actual trader motives. Candles alone cannot prove who is buying or why. The tension lies in how attention focuses on visible activity rather than context. A practical self-check asks whether your decision relies on one data point. Consider how the RSI reading 69.9261 reflects momentum but does not guarantee continuation. If the next closed candle closes below support, the initial enthusiasm interpretation weakens. This counterexample shows why anchoring to a recent peak can be misleading. The full picture includes the local resistance level and the daily change 1.20963%. Without these context points, volume alone lacks meaning. This hypothetical mechanism helps explain why people might feel pressure to join a move. It fails when the market rejects the level, rendering the earlier excitement irrelevant. Use the saved observation to test your own bias, not as a prediction. The market may behave differently than the narrative suggests. Focus on what closed candles confirm over time.
Probabilistic market research, not a recommendation or guaranteed return.
#POL #TradingPsychology #CryptoLearning
52

💰🏦 Polygon plans to enter the banking and payments market
Polygon co-founder Sandeep Nailwal announced that the company plans to obtain payment and banking licenses within two years through acquisitions in the US, EU, Brazil, Mexico, and Southeast Asia. The budget is $50–100 million per deal.
🇺🇸 Polygon is also considering obtaining a banking license in the US. The company previously announced the acquisition of payment provider Coinme and wallet infrastructure developer Sequence for approximately $250 million.
The company intends to move from developing blockchain infrastructure to providing comprehensive financial and payment services.
#POL
💰🏦 Polygon plans to enter the banking and payments market
Polygon co-founder Sandeep Nailwal announced that the company plans to obtain payment and banking licenses within two years through acquisitions in the US, EU, Brazil, Mexico, and Southeast Asia. The budget is $50–100 million per deal.
🇺🇸 Polygon is also considering obtaining a banking license in the US. The company previously announced the acquisition of payment provider Coinme and wallet infrastructure developer Sequence for approximately $250 million.
The company intends to move from developing blockchain infrastructure to providing comprehensive financial and payment services.
#POL
Polygon co-founder Sandeep Nailwal announced that the company plans to obtain payment and banking licenses within two years through acquisitions in the US, EU, Brazil, Mexico, and Southeast Asia. The budget is $50–100 million per deal.
🇺🇸 Polygon is also considering obtaining a banking license in the US. The company previously announced the acquisition of payment provider Coinme and wallet infrastructure developer Sequence for approximately $250 million.
The company intends to move from developing blockchain infrastructure to providing comprehensive financial and payment services.
#POL
1
215

·
--
One thing I noticed just now: Polygon plans to spend $50 million to $100 million to acquire a payment license.
The news is fairly neutral and won’t have much impact on the plan, so it’s just good to know. It reminds me of a similar piece of news from before, when the price reaction was quite different from what many people expected.
$POL I’ll wait and see.
#POL
One thing I noticed just now: Polygon plans to spend $50 million to $100 million to acquire a payment license.
The news is fairly neutral and won’t have much impact on the plan, so it’s just good to know. It reminds me of a similar piece of news from before, when the price reaction was quite different from what many people expected.
$POL I’ll wait and see.
#POL
The news is fairly neutral and won’t have much impact on the plan, so it’s just good to know. It reminds me of a similar piece of news from before, when the price reaction was quite different from what many people expected.
$POL I’ll wait and see.
#POL
2

·
--
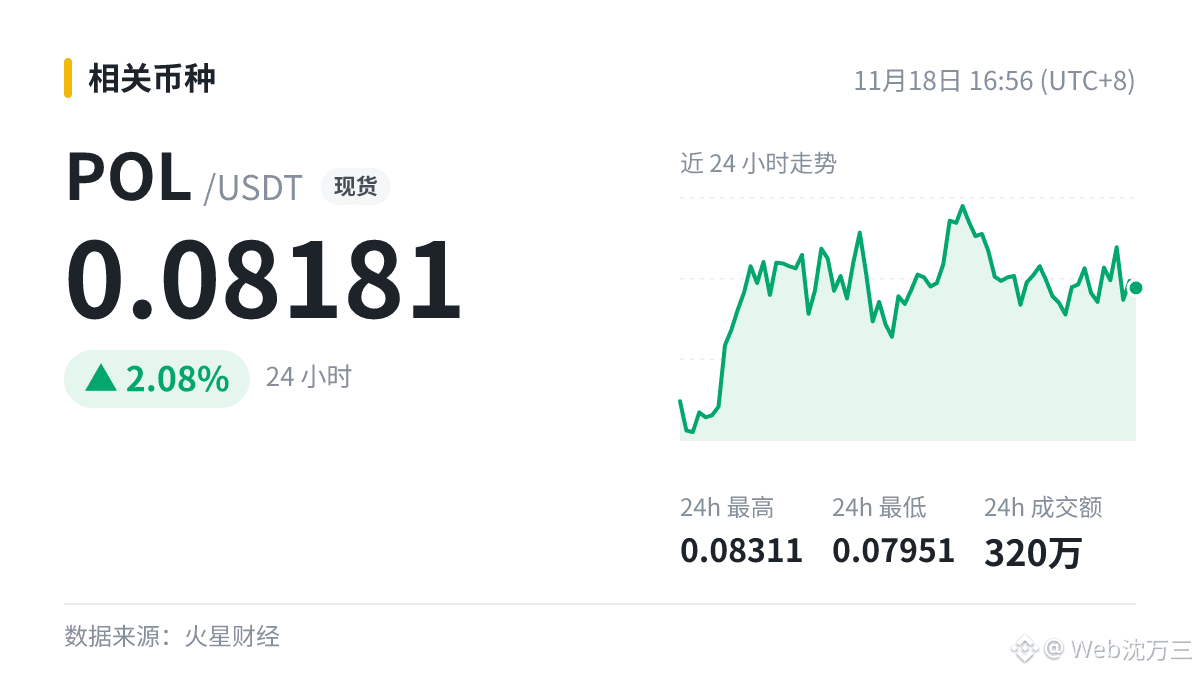
$POL It's at 0.08181 right now.
There's some regulatory news: Polygon plans to spend $50 million to $100 million to acquire a payments license.
If you ask me, with regulatory matters, a decision being made doesn't mean money will flow in immediately; there's still a process to go through.
Let's not say whether it's good or bad for now. Let's see how the market reacts.
I'll take a look first—no rush. Do you think this will have a big impact?
#POL
$POL It's at 0.08181 right now.
There's some regulatory news: Polygon plans to spend $50 million to $100 million to acquire a payments license.
If you ask me, with regulatory matters, a decision being made doesn't mean money will flow in immediately; there's still a process to go through.
Let's not say whether it's good or bad for now. Let's see how the market reacts.
I'll take a look first—no rush. Do you think this will have a big impact?
#POL
There's some regulatory news: Polygon plans to spend $50 million to $100 million to acquire a payments license.
If you ask me, with regulatory matters, a decision being made doesn't mean money will flow in immediately; there's still a process to go through.
Let's not say whether it's good or bad for now. Let's see how the market reacts.
I'll take a look first—no rush. Do you think this will have a big impact?
#POL
1
8

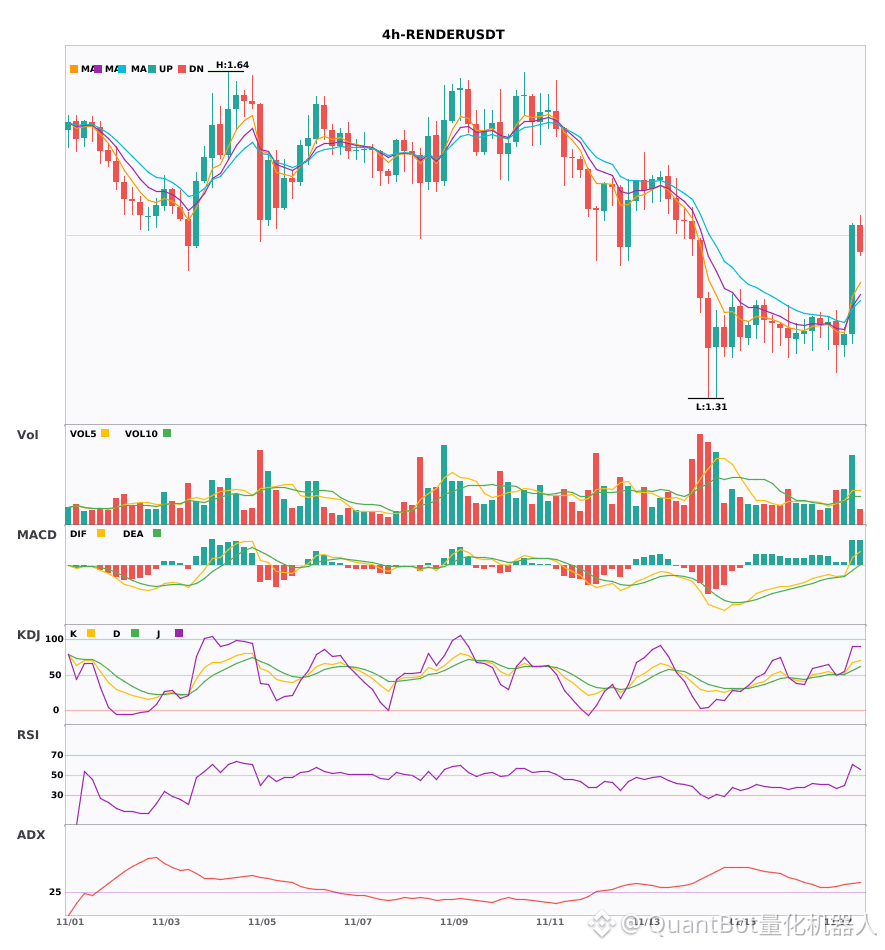
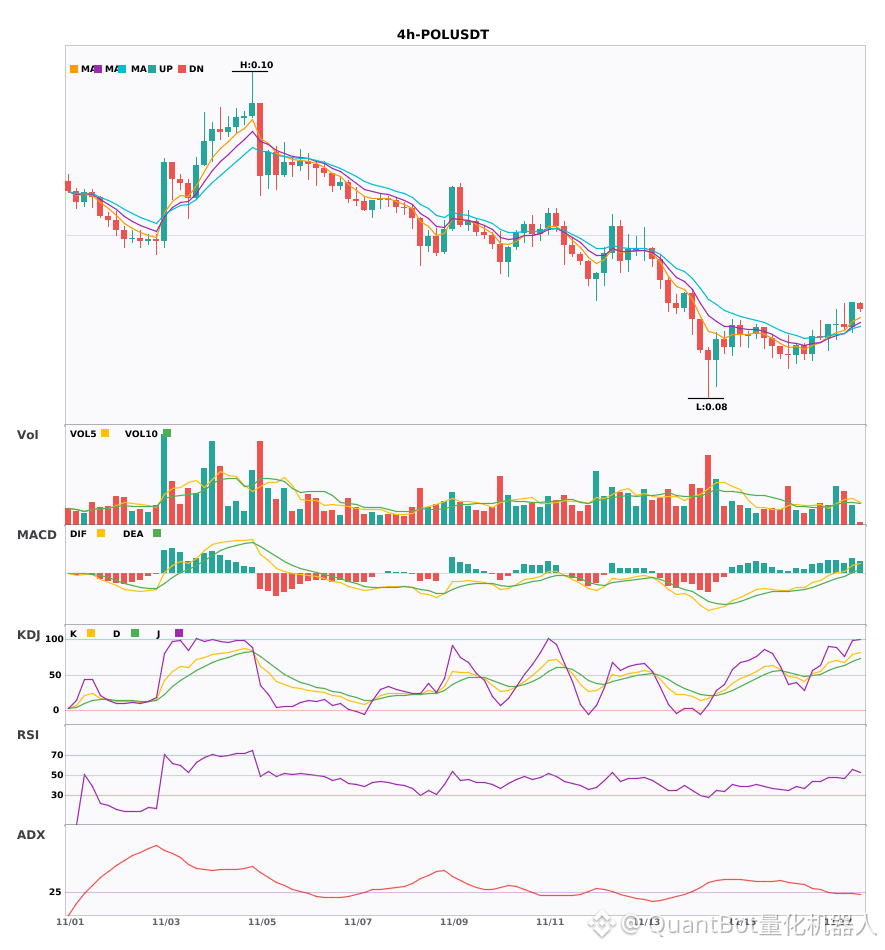
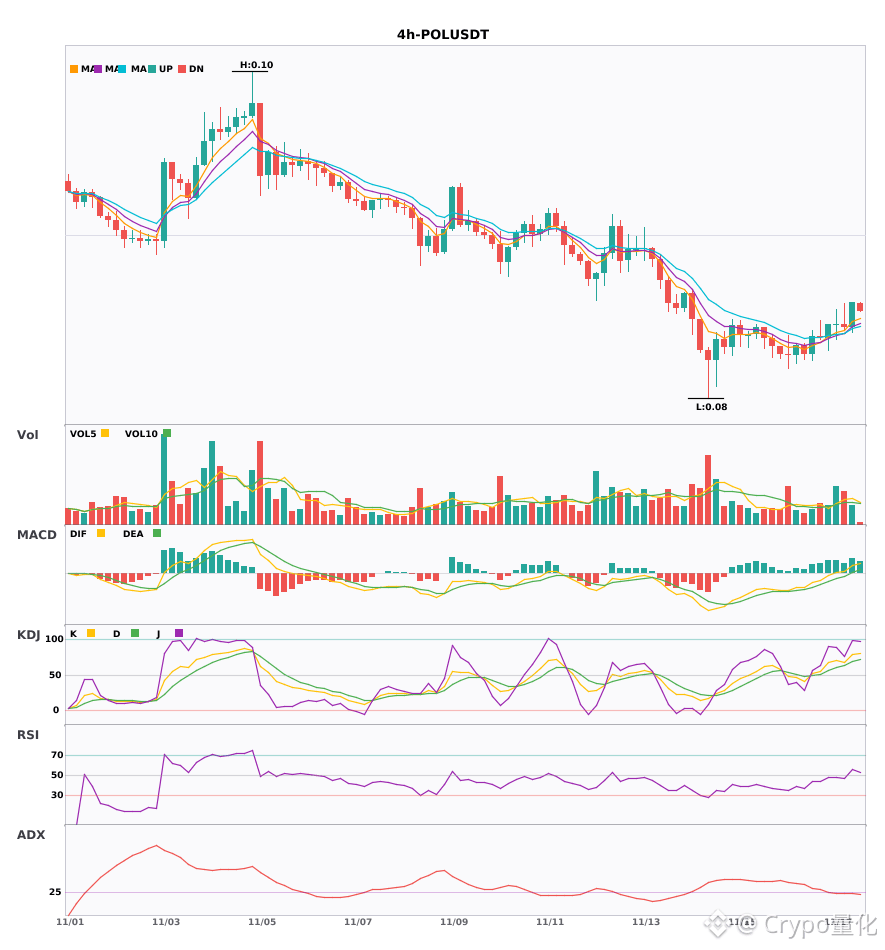
$RENDER/$SPX/$POL 4H strengthening in tandem, momentum comparison
📈 $RENDER | 4-hour bullish signal
━━━━━━━━━━━━━━━━━━
Technical analysis: ADX(33) indicates a clear trend; DIF crossed above the zero line, turning MACD bullish; EMA5 crossed above EMA8, favoring the short term; strong KDJ (K67.8/D56.6); volume increased 2.4x.
Price change: 8.0100%
📈 $SPX | 4-hour bullish signal
━━━━━━━━━━━━━━━━━━
Technical analysis: ADX(28) indicates a developing trend; MACD DIF crossed above the zero line, turning bullish; EMA5/8/13 are aligned bullishly; KDJ golden cross (K72.6/D69.5) signals a bullish short-term outlook; trading volume increased 1.5x, participation is possible.
Price change: 5.1000%
📈 $POL | 4-hour bullish signal
━━━━━━━━━━━━━━━━━━
Technical analysis: ADX(25) indicates a developing trend; bullish MACD momentum is strengthening; EMA5>8>13 are aligned bullishly; strong KDJ (K78.2/D68.2); volume increased 1.5x, moderate participation is possible.
Price change: 2.2800%
━━━━━━━━━━━━━━━━━━
#技术分析 #RENDER #SPX #POL
📌 The above content is for reference only and does not constitute investment advice
$RENDER /$SPX /$POL 4H strengthening in tandem, momentum comparison
📈 $RENDER | 4-hour bullish signal
━━━━━━━━━━━━━━━━━━
Technical analysis: ADX(33) indicates a clear trend; DIF crossed above the zero line, turning MACD bullish; EMA5 crossed above EMA8, favoring the short term; strong KDJ (K67.8/D56.6); volume increased 2.4x.
Price change: 8.0100%
📈 $SPX | 4-hour bullish signal
━━━━━━━━━━━━━━━━━━
Technical analysis: ADX(28) indicates a developing trend; MACD DIF crossed above the zero line, turning bullish; EMA5/8/13 are aligned bullishly; KDJ golden cross (K72.6/D69.5) signals a bullish short-term outlook; trading volume increased 1.5x, participation is possible.
Price change: 5.1000%
📈 $POL | 4-hour bullish signal
━━━━━━━━━━━━━━━━━━
Technical analysis: ADX(25) indicates a developing trend; bullish MACD momentum is strengthening; EMA5>8>13 are aligned bullishly; strong KDJ (K78.2/D68.2); volume increased 1.5x, moderate participation is possible.
Price change: 2.2800%
━━━━━━━━━━━━━━━━━━
#技术分析 #RENDER #SPX #POL
📌 The above content is for reference only and does not constitute investment advice
📈 $RENDER | 4-hour bullish signal
━━━━━━━━━━━━━━━━━━
Technical analysis: ADX(33) indicates a clear trend; DIF crossed above the zero line, turning MACD bullish; EMA5 crossed above EMA8, favoring the short term; strong KDJ (K67.8/D56.6); volume increased 2.4x.
Price change: 8.0100%
📈 $SPX | 4-hour bullish signal
━━━━━━━━━━━━━━━━━━
Technical analysis: ADX(28) indicates a developing trend; MACD DIF crossed above the zero line, turning bullish; EMA5/8/13 are aligned bullishly; KDJ golden cross (K72.6/D69.5) signals a bullish short-term outlook; trading volume increased 1.5x, participation is possible.
Price change: 5.1000%
📈 $POL | 4-hour bullish signal
━━━━━━━━━━━━━━━━━━
Technical analysis: ADX(25) indicates a developing trend; bullish MACD momentum is strengthening; EMA5>8>13 are aligned bullishly; strong KDJ (K78.2/D68.2); volume increased 1.5x, moderate participation is possible.
Price change: 2.2800%
━━━━━━━━━━━━━━━━━━
#技术分析 #RENDER #SPX #POL
📌 The above content is for reference only and does not constitute investment advice
55

·
--
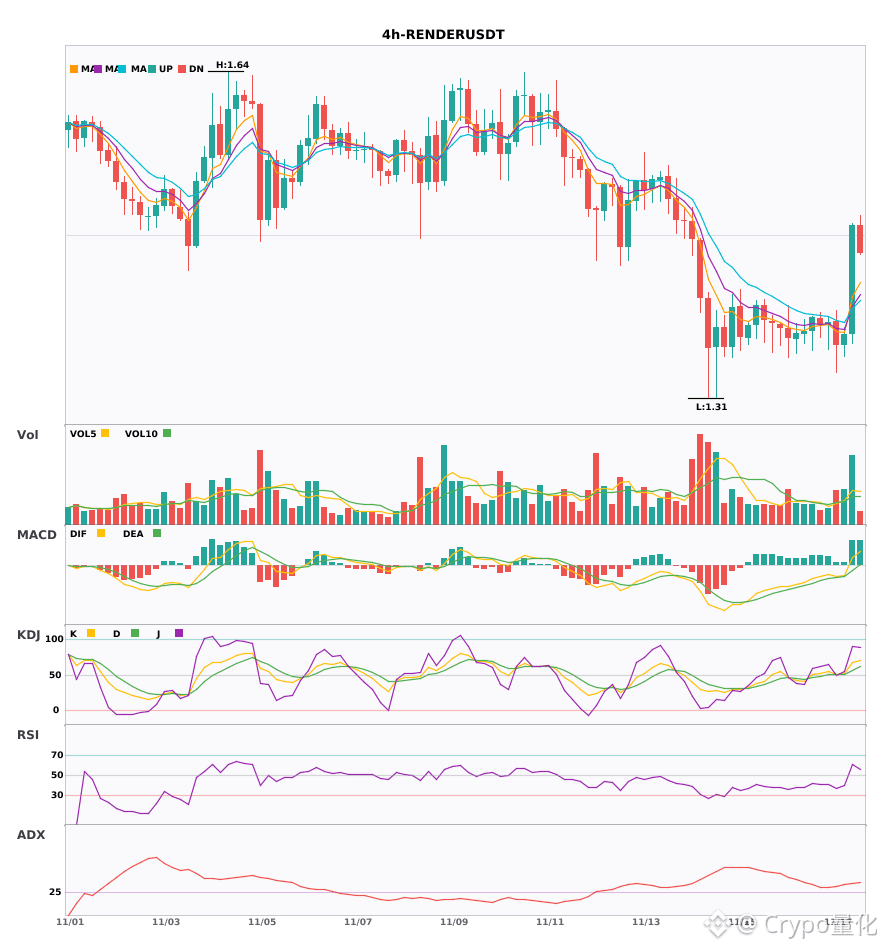
$RENDER $SPX $POL 4-hour bullish bias; short-term confluence favors longs 🔥
════════════════════
🔴 $RENDER 4-hour bullish signal
⚠️ Technical analysis: ADX at 33 indicates a clear trend; MACD golden cross breaks above the zero line, turning bullish; moving averages have just formed a bullish alignment; KDJ K has crossed above D without being overbought; volume is up 2.4x
════════════════════
🔴 $SPX 4-hour bullish signal
⚠️ Technical analysis: ADX trend is just getting started—entry is possible; MACD golden cross with rising volume turns bullish; moving averages are aligned bullishly and pointing upward; KDJ golden cross, not overbought—bullish outlook.
════════════════════
🔴 $POL 4-hour bullish signal
⚠️ Technical analysis: The trend is just starting, so it can be followed; after the MACD golden cross, volume is rising and the red bars are growing; moving averages have just formed a bullish alignment and are diverging upward; K has crossed above D and has not yet entered the overbought zone; trading volume is up 1.5x
════════════════════
🔔 Follow for first-hand market updates 🔔
#技术分析 #RENDER #SPX #POL
📌 When trading, pay attention to whether the candlestick pattern is consistent
$RENDER $SPX $POL 4-hour bullish bias; short-term confluence favors longs 🔥
════════════════════
🔴 $RENDER 4-hour bullish signal
⚠️ Technical analysis: ADX at 33 indicates a clear trend; MACD golden cross breaks above the zero line, turning bullish; moving averages have just formed a bullish alignment; KDJ K has crossed above D without being overbought; volume is up 2.4x
════════════════════
🔴 $SPX 4-hour bullish signal
⚠️ Technical analysis: ADX trend is just getting started—entry is possible; MACD golden cross with rising volume turns bullish; moving averages are aligned bullishly and pointing upward; KDJ golden cross, not overbought—bullish outlook.
════════════════════
🔴 $POL 4-hour bullish signal
⚠️ Technical analysis: The trend is just starting, so it can be followed; after the MACD golden cross, volume is rising and the red bars are growing; moving averages have just formed a bullish alignment and are diverging upward; K has crossed above D and has not yet entered the overbought zone; trading volume is up 1.5x
════════════════════
🔔 Follow for first-hand market updates 🔔
#技术分析 #RENDER #SPX #POL
📌 When trading, pay attention to whether the candlestick pattern is consistent
════════════════════
🔴 $RENDER 4-hour bullish signal
⚠️ Technical analysis: ADX at 33 indicates a clear trend; MACD golden cross breaks above the zero line, turning bullish; moving averages have just formed a bullish alignment; KDJ K has crossed above D without being overbought; volume is up 2.4x
════════════════════
🔴 $SPX 4-hour bullish signal
⚠️ Technical analysis: ADX trend is just getting started—entry is possible; MACD golden cross with rising volume turns bullish; moving averages are aligned bullishly and pointing upward; KDJ golden cross, not overbought—bullish outlook.
════════════════════
🔴 $POL 4-hour bullish signal
⚠️ Technical analysis: The trend is just starting, so it can be followed; after the MACD golden cross, volume is rising and the red bars are growing; moving averages have just formed a bullish alignment and are diverging upward; K has crossed above D and has not yet entered the overbought zone; trading volume is up 1.5x
════════════════════
🔔 Follow for first-hand market updates 🔔
#技术分析 #RENDER #SPX #POL
📌 When trading, pay attention to whether the candlestick pattern is consistent
49

·
--
Bullish
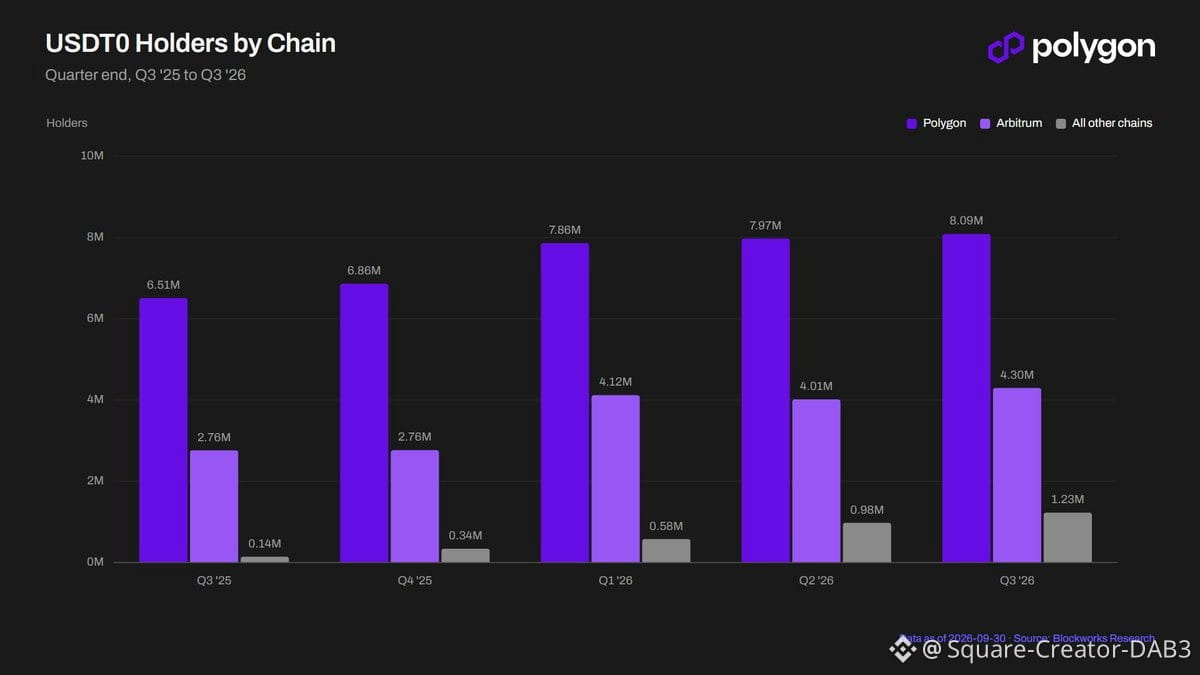
Polygon leads blockchain networks in the number of USDT0 holders, surpassing all other networks combined by more than 8.09 million wallets at the end of Q3!
📊 Impact on POL:
Strong fundamental support: The massive expansion in the use of the Polygon network as a primary platform for transactions and stablecoins boosts network activity and liquidity.
Adoption and uptake: High liquidity and huge transaction volumes increase the network’s economic value, positively affecting demand for POL as a core asset for operations and gas fees.
Market outlook: Polygon’s continued outperformance in the payments sector provides positive momentum for investor sentiment in the medium and long term.
#pol #Polygon #BinanceSquare #crypto
#DAB3_1997 $POL
{spot}(POLUSDT)
Polygon leads blockchain networks in the number of USDT0 holders, surpassing all other networks combined by more than 8.09 million wallets at the end of Q3!
📊 Impact on POL:
Strong fundamental support: The massive expansion in the use of the Polygon network as a primary platform for transactions and stablecoins boosts network activity and liquidity.
Adoption and uptake: High liquidity and huge transaction volumes increase the network’s economic value, positively affecting demand for POL as a core asset for operations and gas fees.
Market outlook: Polygon’s continued outperformance in the payments sector provides positive momentum for investor sentiment in the medium and long term.
#pol #Polygon #BinanceSquare #crypto
#DAB3_1997 $POL
📊 Impact on POL:
Strong fundamental support: The massive expansion in the use of the Polygon network as a primary platform for transactions and stablecoins boosts network activity and liquidity.
Adoption and uptake: High liquidity and huge transaction volumes increase the network’s economic value, positively affecting demand for POL as a core asset for operations and gas fees.
Market outlook: Polygon’s continued outperformance in the payments sector provides positive momentum for investor sentiment in the medium and long term.
#pol #Polygon #BinanceSquare #crypto
#DAB3_1997 $POL
1
23

·
--
【$POL Bulls vs. Bears: What Do RSI/MACD/Moving Averages Say?】
【Trending Event】
I just came across this news and immediately pulled up the POLUSDT chart to compare.
“Google says hackers use AI agents to find and exploit software flaws” — Cointelegraph reports that Google says attackers are using AI agents to find and exploit software flaws automatically, reducing the time…
The biggest risk with event-driven markets is that sentiment gets exhausted, so whether key levels hold matters more than the news itself.
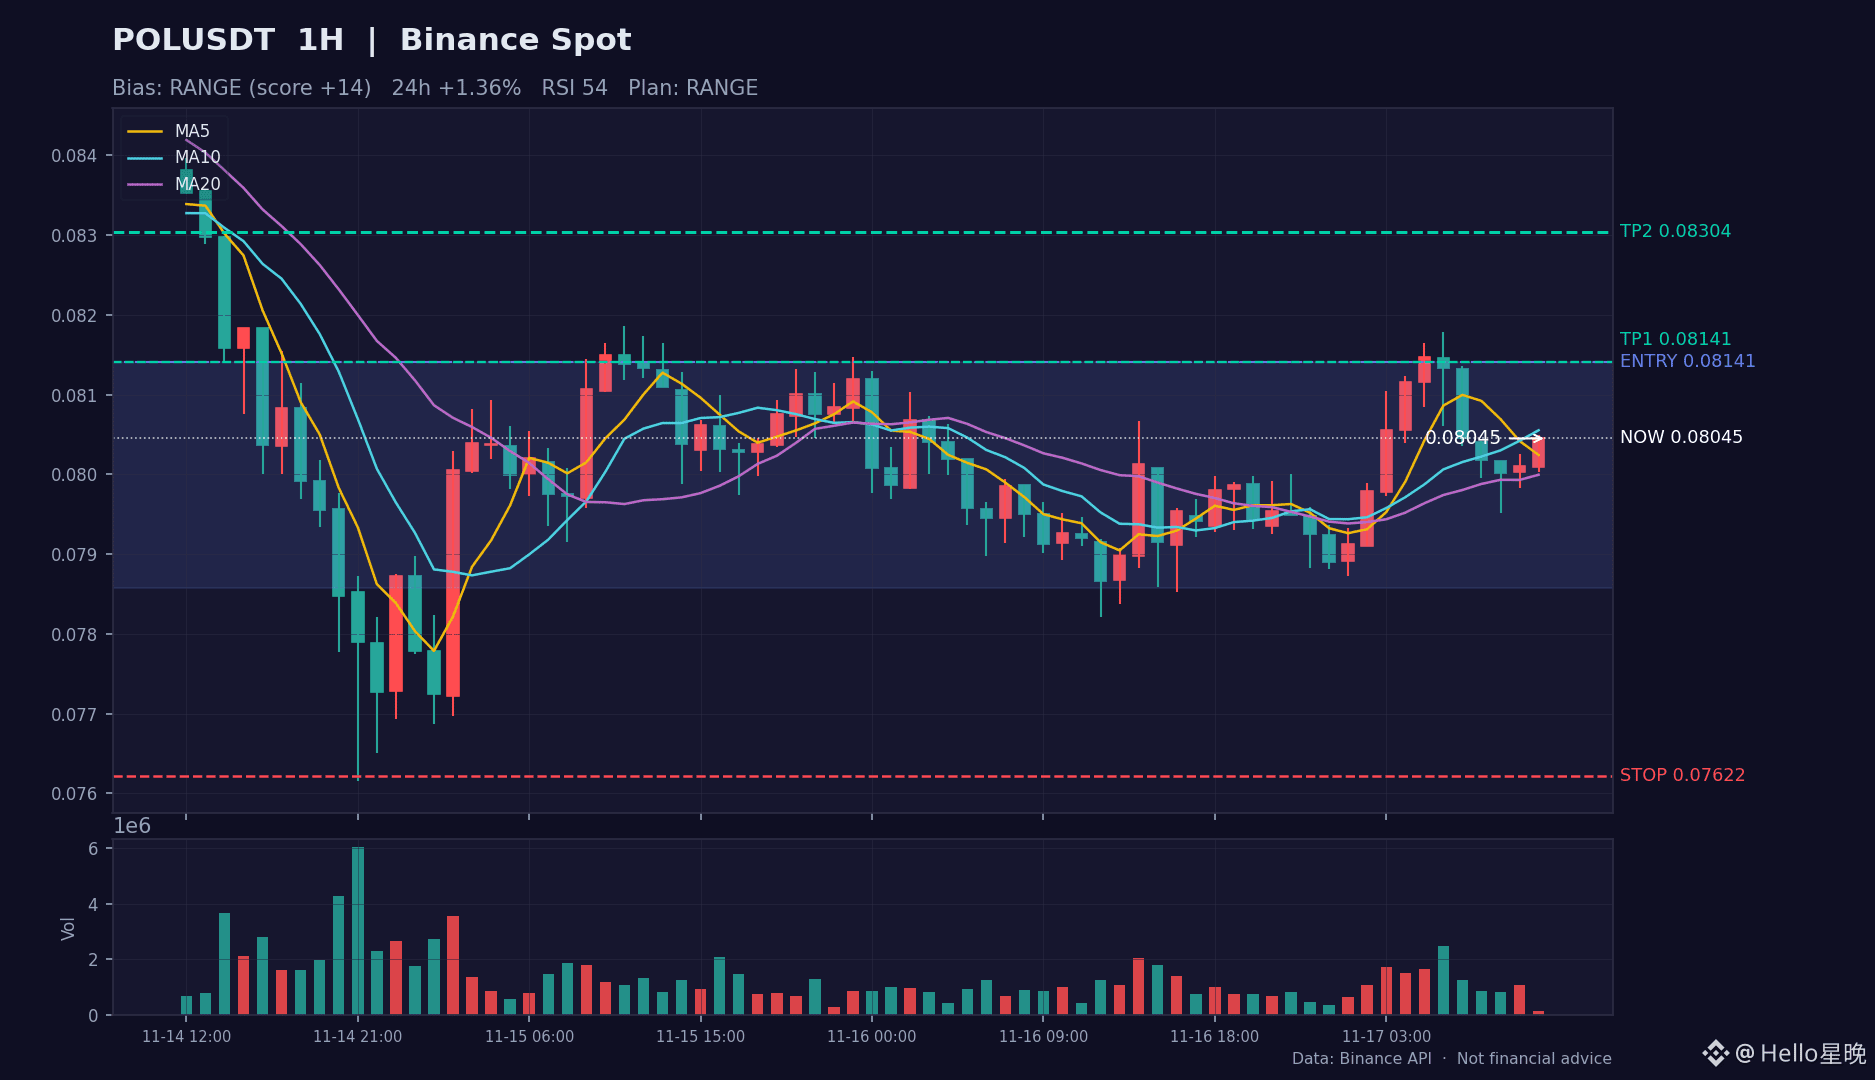
【Market Snapshot】
$POL is currently at 0.08045, up 1.36% over 24 hours, with 24-hour trading volume of approximately 2.1M USDT.
【Technical Breakdown】
· Moving averages: The moving averages are tangled; a directional move needs volume confirmation.
· Momentum: The MACD fast line is above the zero line, with red bars dominant, so bullish momentum is still continuing; RSI (54) is neutral to slightly weak, with bulls and bears still struggling for control.
· Pattern: Price is hovering near the Bollinger midline, and whether it holds will determine the short-term pace; volume is shrinking (0.1 times average volume), so directional signals should be treated with caution in this low-volume environment.
【Directional Outlook】
Overall score: 14/100. Bulls and bears are locked in a tug-of-war, with indicators contradicting one another. Avoid chasing trades at this point. Consider trading the range by selling near the top and buying near the bottom with a small position, then follow the trend once direction is confirmed (a high-volume breakout above or below the range).
【Trade Plan Reference】
· Strategy: Range-bound
· Entry zone: 0.07858 ~ 0.08141
· Take profit: First target 0.08141, second target 0.08304
· Stop loss: 0.07622
· Position sizing: For a range-bound strategy, sell near the top and buy near the bottom with a small position; follow the trend after a breakout.
· Chart: The candlestick analysis chart is included in the post (1-hour chart, red for up and green for down; the entry zone, take-profit, and stop-loss levels are marked with colored lines).
【Risk Warning】Small-cap coins are highly volatile, and event-driven moves can reverse quickly. Keep position sizes under control.
The above is solely my personal review and technical analysis, and does not constitute investment advice. DYOR.
$POL #POL #加密货币 #Market Analysis
【$POL Bulls vs. Bears: What Do RSI/MACD/Moving Averages Say?】
【Trending Event】
I just came across this news and immediately pulled up the POLUSDT chart to compare.
“Google says hackers use AI agents to find and exploit software flaws” — Cointelegraph reports that Google says attackers are using AI agents to find and exploit software flaws automatically, reducing the time…
The biggest risk with event-driven markets is that sentiment gets exhausted, so whether key levels hold matters more than the news itself.
【Market Snapshot】
$POL is currently at 0.08045, up 1.36% over 24 hours, with 24-hour trading volume of approximately 2.1M USDT.
【Technical Breakdown】
· Moving averages: The moving averages are tangled; a directional move needs volume confirmation.
· Momentum: The MACD fast line is above the zero line, with red bars dominant, so bullish momentum is still continuing; RSI (54) is neutral to slightly weak, with bulls and bears still struggling for control.
· Pattern: Price is hovering near the Bollinger midline, and whether it holds will determine the short-term pace; volume is shrinking (0.1 times average volume), so directional signals should be treated with caution in this low-volume environment.
【Directional Outlook】
Overall score: 14/100. Bulls and bears are locked in a tug-of-war, with indicators contradicting one another. Avoid chasing trades at this point. Consider trading the range by selling near the top and buying near the bottom with a small position, then follow the trend once direction is confirmed (a high-volume breakout above or below the range).
【Trade Plan Reference】
· Strategy: Range-bound
· Entry zone: 0.07858 ~ 0.08141
· Take profit: First target 0.08141, second target 0.08304
· Stop loss: 0.07622
· Position sizing: For a range-bound strategy, sell near the top and buy near the bottom with a small position; follow the trend after a breakout.
· Chart: The candlestick analysis chart is included in the post (1-hour chart, red for up and green for down; the entry zone, take-profit, and stop-loss levels are marked with colored lines).
【Risk Warning】Small-cap coins are highly volatile, and event-driven moves can reverse quickly. Keep position sizes under control.
The above is solely my personal review and technical analysis, and does not constitute investment advice. DYOR.
$POL #POL #加密货币 #Market Analysis
【Trending Event】
I just came across this news and immediately pulled up the POLUSDT chart to compare.
“Google says hackers use AI agents to find and exploit software flaws” — Cointelegraph reports that Google says attackers are using AI agents to find and exploit software flaws automatically, reducing the time…
The biggest risk with event-driven markets is that sentiment gets exhausted, so whether key levels hold matters more than the news itself.
【Market Snapshot】
$POL is currently at 0.08045, up 1.36% over 24 hours, with 24-hour trading volume of approximately 2.1M USDT.
【Technical Breakdown】
· Moving averages: The moving averages are tangled; a directional move needs volume confirmation.
· Momentum: The MACD fast line is above the zero line, with red bars dominant, so bullish momentum is still continuing; RSI (54) is neutral to slightly weak, with bulls and bears still struggling for control.
· Pattern: Price is hovering near the Bollinger midline, and whether it holds will determine the short-term pace; volume is shrinking (0.1 times average volume), so directional signals should be treated with caution in this low-volume environment.
【Directional Outlook】
Overall score: 14/100. Bulls and bears are locked in a tug-of-war, with indicators contradicting one another. Avoid chasing trades at this point. Consider trading the range by selling near the top and buying near the bottom with a small position, then follow the trend once direction is confirmed (a high-volume breakout above or below the range).
【Trade Plan Reference】
· Strategy: Range-bound
· Entry zone: 0.07858 ~ 0.08141
· Take profit: First target 0.08141, second target 0.08304
· Stop loss: 0.07622
· Position sizing: For a range-bound strategy, sell near the top and buy near the bottom with a small position; follow the trend after a breakout.
· Chart: The candlestick analysis chart is included in the post (1-hour chart, red for up and green for down; the entry zone, take-profit, and stop-loss levels are marked with colored lines).
【Risk Warning】Small-cap coins are highly volatile, and event-driven moves can reverse quickly. Keep position sizes under control.
The above is solely my personal review and technical analysis, and does not constitute investment advice. DYOR.
$POL #POL #加密货币 #Market Analysis
5
·
--
【Elon Musk Joins 160,000 Ba!Where does $POL go next? Technical analysis gives these key levels】
【Hot Topic】
I just saw this news and immediately pulled up the POLUSDT chart to compare.
「Elon Musk Joins 160,000 Backing Petition to Bring Jensen Huang Back to Nvidia」—Decrypt reports that Huang has reportedly discussed a comeback with confidants, but Treasury Secretary Scott Bessent says Nvidia ne…
The news is just a catalyst; ultimately, pricing depends on how order flow and volume align.
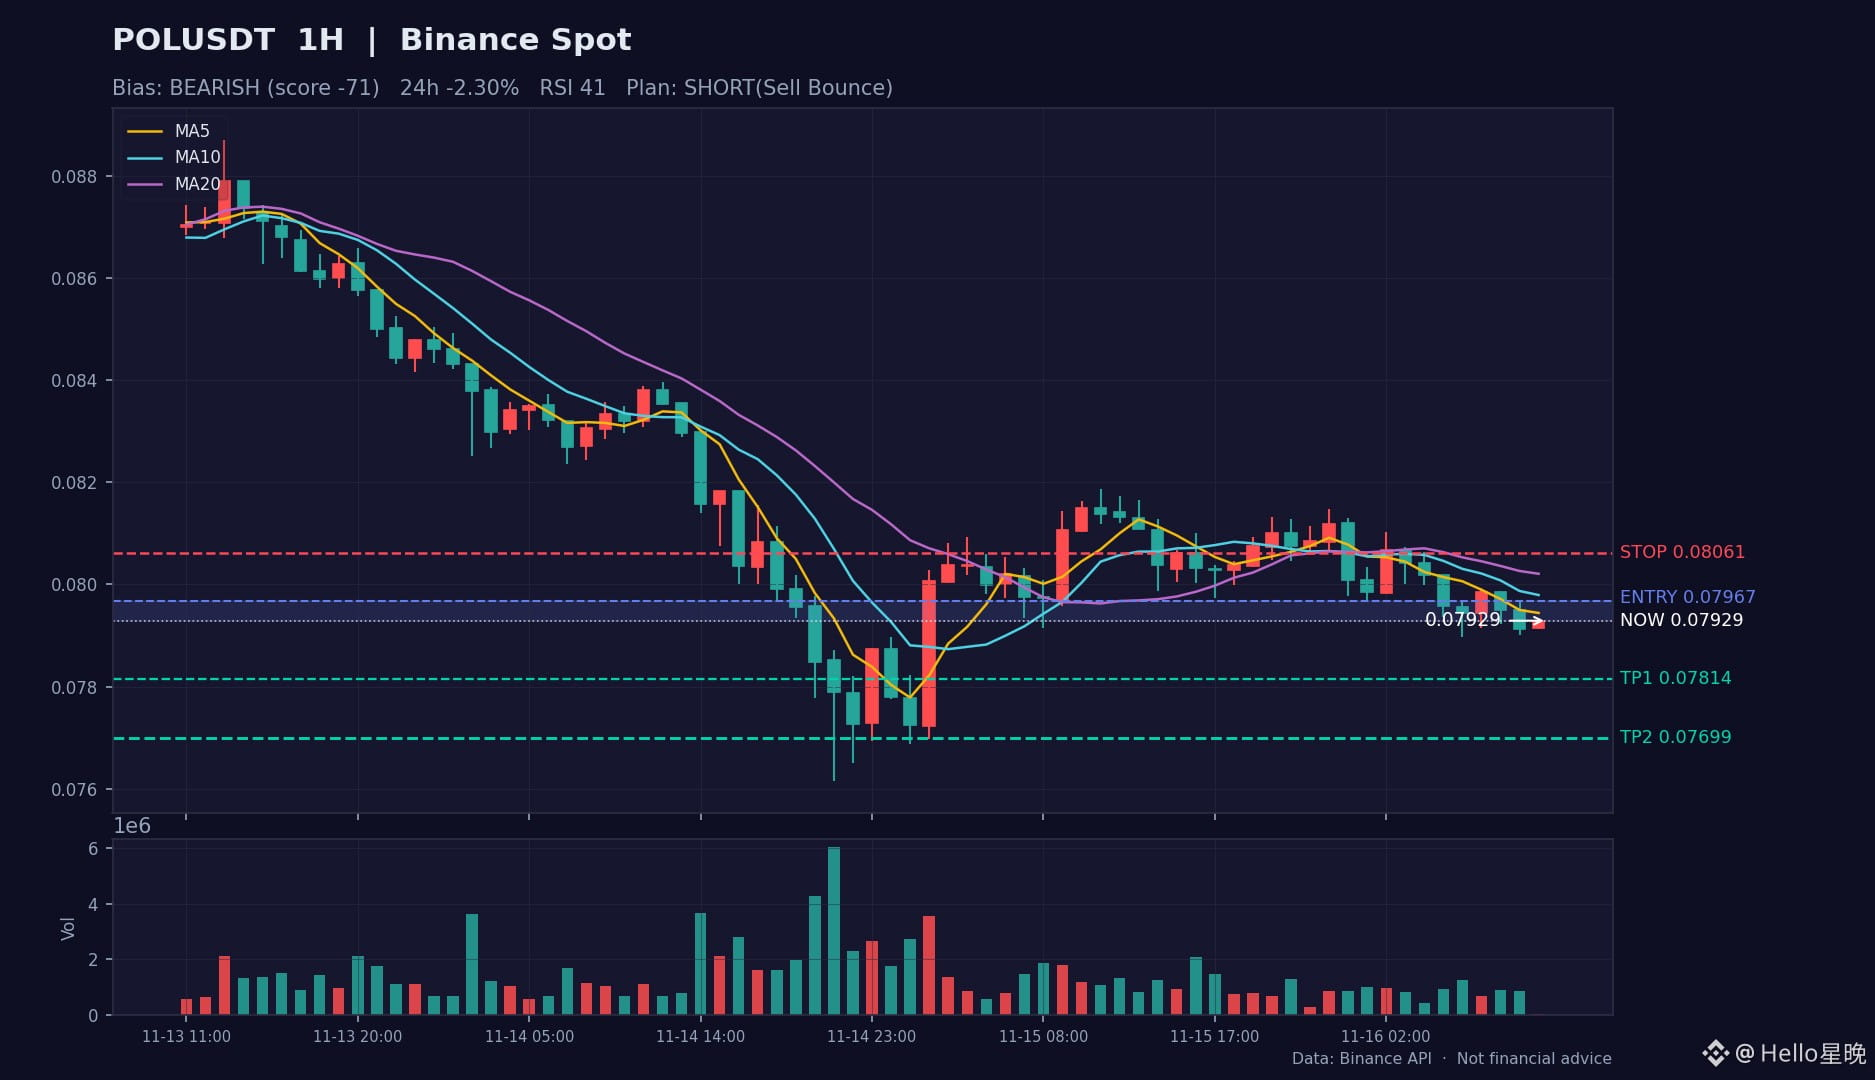
【Market Snapshot】
$POL is currently at 0.07929, down 2.30% over 24 hours, with 24-hour trading volume of approximately 1.9M USDT.
【Technical Analysis】
· Moving averages: MA5\u003cMA10\u003cMA20\u003cMA60, in a bearish alignment; any rebound faces resistance from the moving averages
· Momentum: The MACD fast line is below the zero line, and the green bars have not faded, so bearish momentum has not yet run its course; RSI(41) is weak, and a rebound needs confirmation from increased volume
· Pattern: Price is tracking the lower Bollinger Band, with an oversold bounce potentially building; volume is contracting (0.1 times the average), so directional signals should be treated with caution in a low-volume environment
【Directional View】
Overall score: -71/100. The structure is bearish: moving-average resistance and weakening momentum make the area near the upper edge of the entry zone on a rebound a good level to consider a defensive short; first target is below. A high-volume recovery above the stop-loss level would invalidate the bearish thesis.
【Trade Plan Reference】
· Strategy: Short the rebound
· Entry zone: 0.07929 ~ 0.07967
· Take profit: First target 0.07814, second target 0.07699
· Stop loss: 0.08061
· Position size: Small, 5%-10%; strictly exit if the stop-loss level is breached
· Chart: The candlestick analysis chart is included in the post (1-hour chart, red for rising and green for falling; entry zone/take-profit/stop-loss levels are marked with colored lines)
【Risk Warning】Small-cap coins are highly volatile, and event-driven moves can reverse quickly, so keep position sizes under control.
The above is only my personal review and technical analysis, and does not constitute investment advice. DYOR.
$POL #POL #加密货币 #Market Analysis
【Elon Musk Joins 160,000 Ba!Where does $POL go next? Technical analysis gives these key levels】
【Hot Topic】
I just saw this news and immediately pulled up the POLUSDT chart to compare.
「Elon Musk Joins 160,000 Backing Petition to Bring Jensen Huang Back to Nvidia」—Decrypt reports that Huang has reportedly discussed a comeback with confidants, but Treasury Secretary Scott Bessent says Nvidia ne…
The news is just a catalyst; ultimately, pricing depends on how order flow and volume align.
【Market Snapshot】
$POL is currently at 0.07929, down 2.30% over 24 hours, with 24-hour trading volume of approximately 1.9M USDT.
【Technical Analysis】
· Moving averages: MA5\u003cMA10\u003cMA20\u003cMA60, in a bearish alignment; any rebound faces resistance from the moving averages
· Momentum: The MACD fast line is below the zero line, and the green bars have not faded, so bearish momentum has not yet run its course; RSI(41) is weak, and a rebound needs confirmation from increased volume
· Pattern: Price is tracking the lower Bollinger Band, with an oversold bounce potentially building; volume is contracting (0.1 times the average), so directional signals should be treated with caution in a low-volume environment
【Directional View】
Overall score: -71/100. The structure is bearish: moving-average resistance and weakening momentum make the area near the upper edge of the entry zone on a rebound a good level to consider a defensive short; first target is below. A high-volume recovery above the stop-loss level would invalidate the bearish thesis.
【Trade Plan Reference】
· Strategy: Short the rebound
· Entry zone: 0.07929 ~ 0.07967
· Take profit: First target 0.07814, second target 0.07699
· Stop loss: 0.08061
· Position size: Small, 5%-10%; strictly exit if the stop-loss level is breached
· Chart: The candlestick analysis chart is included in the post (1-hour chart, red for rising and green for falling; entry zone/take-profit/stop-loss levels are marked with colored lines)
【Risk Warning】Small-cap coins are highly volatile, and event-driven moves can reverse quickly, so keep position sizes under control.
The above is only my personal review and technical analysis, and does not constitute investment advice. DYOR.
$POL #POL #加密货币 #Market Analysis
【Hot Topic】
I just saw this news and immediately pulled up the POLUSDT chart to compare.
「Elon Musk Joins 160,000 Backing Petition to Bring Jensen Huang Back to Nvidia」—Decrypt reports that Huang has reportedly discussed a comeback with confidants, but Treasury Secretary Scott Bessent says Nvidia ne…
The news is just a catalyst; ultimately, pricing depends on how order flow and volume align.
【Market Snapshot】
$POL is currently at 0.07929, down 2.30% over 24 hours, with 24-hour trading volume of approximately 1.9M USDT.
【Technical Analysis】
· Moving averages: MA5\u003cMA10\u003cMA20\u003cMA60, in a bearish alignment; any rebound faces resistance from the moving averages
· Momentum: The MACD fast line is below the zero line, and the green bars have not faded, so bearish momentum has not yet run its course; RSI(41) is weak, and a rebound needs confirmation from increased volume
· Pattern: Price is tracking the lower Bollinger Band, with an oversold bounce potentially building; volume is contracting (0.1 times the average), so directional signals should be treated with caution in a low-volume environment
【Directional View】
Overall score: -71/100. The structure is bearish: moving-average resistance and weakening momentum make the area near the upper edge of the entry zone on a rebound a good level to consider a defensive short; first target is below. A high-volume recovery above the stop-loss level would invalidate the bearish thesis.
【Trade Plan Reference】
· Strategy: Short the rebound
· Entry zone: 0.07929 ~ 0.07967
· Take profit: First target 0.07814, second target 0.07699
· Stop loss: 0.08061
· Position size: Small, 5%-10%; strictly exit if the stop-loss level is breached
· Chart: The candlestick analysis chart is included in the post (1-hour chart, red for rising and green for falling; entry zone/take-profit/stop-loss levels are marked with colored lines)
【Risk Warning】Small-cap coins are highly volatile, and event-driven moves can reverse quickly, so keep position sizes under control.
The above is only my personal review and technical analysis, and does not constitute investment advice. DYOR.
$POL #POL #加密货币 #Market Analysis
12
Log in to explore more content
Join global crypto users on Binance Square
⚡️ Get latest and useful information about crypto.
💬 Trusted by the world’s largest crypto exchange.
👍 Discover real insights from verified creators.
Email / Phone number
Trending Topics
1
#CanBTCReboundAfterFallingBelow60K?
114,729 views
507 Discussing
2
#GlobalStocksFaceLongestLosingStreakSince2023
49,971 views
497 Discussing
3
#AnthropicPlungesTowardIPOPriceonDay2
16,643 views
198 Discussing
4
#GaoTengBitcoinETFListsOnHKEX
36,832 views
386 Discussing
5
#TradFiForBeginners
1M views
5,819 Discussing
6
#NvidiaBoardReportedlySplitOverHuang’sReturn
397,953 views
2,580 Discussing
7
#TetherBurns8BillionUSDTInPast20Days
43,598 views
159 Discussing
8
#BitcoinWalletSignatureFlawExploitableWithinSeconds
12,195 views
76 Discussing
9
#CanGTA6'sLaunchLiftTTWOShares?
335,473 views
1,807 Discussing
10
#HongKongProposesSFCLicensingForFourVirtualAssetServices
2,141 views
36 Discussing