
#ppireport
ppireport
10,491 views
24 Discussing
Hot
Latest

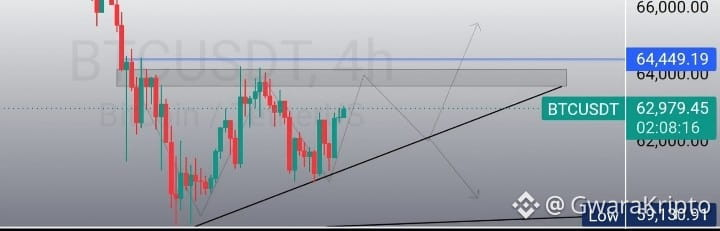
$BTC is forming an ascending triangle on the 4-hour chart.
If the PPI data at 5:30 PM comes in strong, we're looking at a retest of 64500...💥
If the data is poor, we might drop back down to 59k.
If it’s favorable, 70k is a solid target.
$XAU
#PPIReport #PPIData #SECChairAtkinsReformsIPOAccess #VanceDeclaresUSGoalsInIranAchieved #RussiaAddsUSDCToApprovedCryptoList
$BNB
$BTC is forming an ascending triangle on the 4-hour chart.
If the PPI data at 5:30 PM comes in strong, we're looking at a retest of 64500...💥
If the data is poor, we might drop back down to 59k.
If it’s favorable, 70k is a solid target.
$XAU
#PPIReport #PPIData #SECChairAtkinsReformsIPOAccess #VanceDeclaresUSGoalsInIranAchieved #RussiaAddsUSDCToApprovedCryptoList
$BNB
If the PPI data at 5:30 PM comes in strong, we're looking at a retest of 64500...💥
If the data is poor, we might drop back down to 59k.
If it’s favorable, 70k is a solid target.
$XAU
#PPIReport #PPIData #SECChairAtkinsReformsIPOAccess #VanceDeclaresUSGoalsInIranAchieved #RussiaAddsUSDCToApprovedCryptoList
$BNB
49

·
--
Bullish
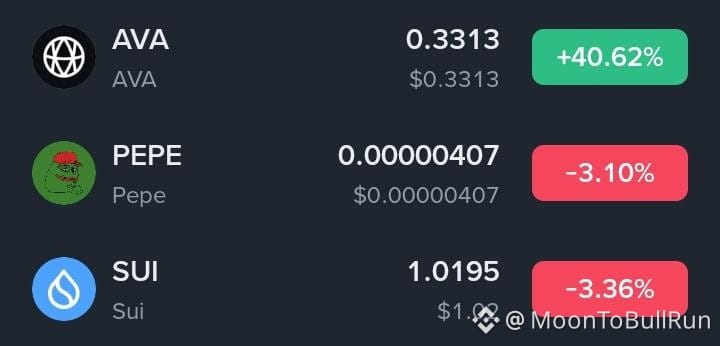
3 coins 1 winner 2 losers - but story is deeper:
$AVA $0.3313 +40.62%
- The Only Green Soldier
While BTC ETH all red, AVA up 40%. Why? AVA pumping on real travel bookings + BNB chain hype. $0.3313 breaking $0.30 is big. If AVA holds $0.30 till PPI, target $0.45. This is the WAL of today - money rotating to low caps during fear. Don't FOMO at 40%, wait for pullback to $0.29 if you missed. Volume high so pump real, not fake.
$PEPE
$0.00000407 -3.10% -
Meme Pain
PEPE -3.10% actually holding better than SUI and NEAR. Meme coins bleed slow but bounce fast. $0.00000407 support is $0.00000400 - if holds, good. If BTC goes $80k after PPI, PEPE goes $0.00000380 then bounce 15%. PEPE is sentiment indicator - if PEPE green, altseason coming. Tonight red means traders scared. Wait for PEPE green for all-clear signal.
$SUI
$1.0195 -3.36% -
The L1 Under Pressure
SUI -3.36% at $1.02. SUI was $1.10 yesterday, now $1.01 - lost $1.05 support. SUI needs BTC $82k back to hold $1.02. Next support $0.98. SUI has unlock fear + market fear double hit. If PPI bullish, SUI to $1.12 quick. If PPI bearish, SUI to $0.95. Not buy zone yet, wait for $1.00 test.
Smart take:
In red market only AVA type coins pump. PEPE and SUI are followers - they will pump only after BTC pumps after PPI.
Today winner AVA, tomorrow maybe SUI if PPI <0.5%.
You holding any of these 3?
#CPIWatch
#PPIReport
3 coins 1 winner 2 losers - but story is deeper:
$AVA $0.3313 +40.62%
- The Only Green Soldier
While BTC ETH all red, AVA up 40%. Why? AVA pumping on real travel bookings + BNB chain hype. $0.3313 breaking $0.30 is big. If AVA holds $0.30 till PPI, target $0.45. This is the WAL of today - money rotating to low caps during fear. Don't FOMO at 40%, wait for pullback to $0.29 if you missed. Volume high so pump real, not fake.
$PEPE
$0.00000407 -3.10% -
Meme Pain
PEPE -3.10% actually holding better than SUI and NEAR. Meme coins bleed slow but bounce fast. $0.00000407 support is $0.00000400 - if holds, good. If BTC goes $80k after PPI, PEPE goes $0.00000380 then bounce 15%. PEPE is sentiment indicator - if PEPE green, altseason coming. Tonight red means traders scared. Wait for PEPE green for all-clear signal.
$SUI
$1.0195 -3.36% -
The L1 Under Pressure
SUI -3.36% at $1.02. SUI was $1.10 yesterday, now $1.01 - lost $1.05 support. SUI needs BTC $82k back to hold $1.02. Next support $0.98. SUI has unlock fear + market fear double hit. If PPI bullish, SUI to $1.12 quick. If PPI bearish, SUI to $0.95. Not buy zone yet, wait for $1.00 test.
Smart take:
In red market only AVA type coins pump. PEPE and SUI are followers - they will pump only after BTC pumps after PPI.
Today winner AVA, tomorrow maybe SUI if PPI <0.5%.
You holding any of these 3?
#CPIWatch
#PPIReport
$AVA $0.3313 +40.62%
- The Only Green Soldier
While BTC ETH all red, AVA up 40%. Why? AVA pumping on real travel bookings + BNB chain hype. $0.3313 breaking $0.30 is big. If AVA holds $0.30 till PPI, target $0.45. This is the WAL of today - money rotating to low caps during fear. Don't FOMO at 40%, wait for pullback to $0.29 if you missed. Volume high so pump real, not fake.
$PEPE
$0.00000407 -3.10% -
Meme Pain
PEPE -3.10% actually holding better than SUI and NEAR. Meme coins bleed slow but bounce fast. $0.00000407 support is $0.00000400 - if holds, good. If BTC goes $80k after PPI, PEPE goes $0.00000380 then bounce 15%. PEPE is sentiment indicator - if PEPE green, altseason coming. Tonight red means traders scared. Wait for PEPE green for all-clear signal.
$SUI
$1.0195 -3.36% -
The L1 Under Pressure
SUI -3.36% at $1.02. SUI was $1.10 yesterday, now $1.01 - lost $1.05 support. SUI needs BTC $82k back to hold $1.02. Next support $0.98. SUI has unlock fear + market fear double hit. If PPI bullish, SUI to $1.12 quick. If PPI bearish, SUI to $0.95. Not buy zone yet, wait for $1.00 test.
Smart take:
In red market only AVA type coins pump. PEPE and SUI are followers - they will pump only after BTC pumps after PPI.
Today winner AVA, tomorrow maybe SUI if PPI <0.5%.
You holding any of these 3?
#CPIWatch
#PPIReport
3
611

·
--
Bearish
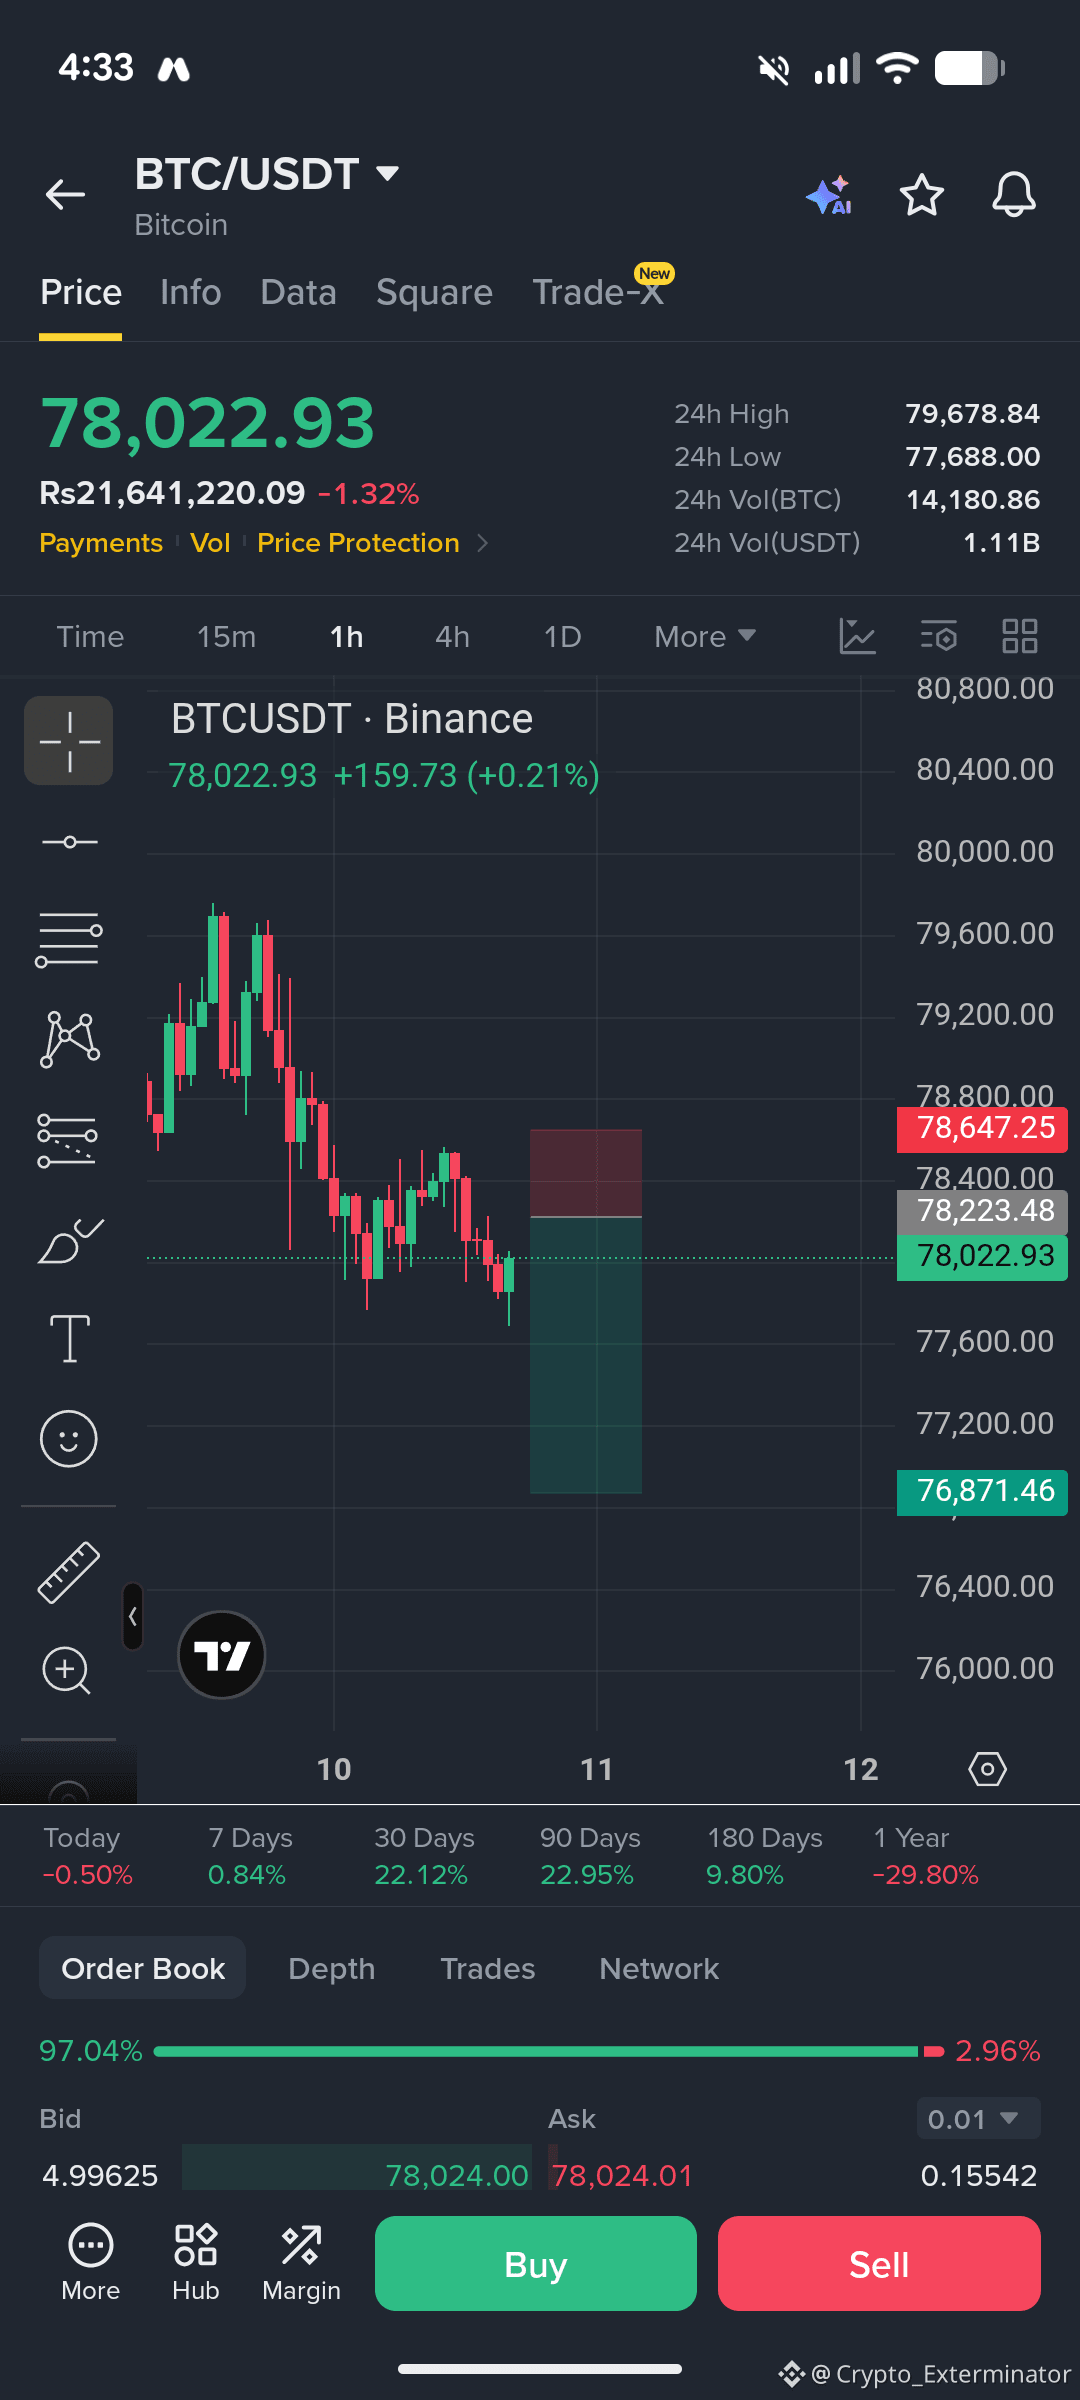
so it's one hour from the PPI news and I'm for sure bearish on it
let's go for BTC trade..
sell from where you get a chance..
trade plan..
entry: 78400-700
tp 1: 77500
tp 2: 76500
#wrtie2eran #PPIReport $BTC
{future}(BTCUSDT)
so it's one hour from the PPI news and I'm for sure bearish on it
let's go for BTC trade..
sell from where you get a chance..
trade plan..
entry: 78400-700
tp 1: 77500
tp 2: 76500
#wrtie2eran #PPIReport $BTC
let's go for BTC trade..
sell from where you get a chance..
trade plan..
entry: 78400-700
tp 1: 77500
tp 2: 76500
#wrtie2eran #PPIReport $BTC
30

Yesterday CPI gave A great push to price downside .
Today is #PPI Data Right after 4:15 Hours.At 5:30PKT What will be effect of ppi on market??
what u think ?
In my view, Market will keep bouncing a bit till 5:00pm ND then again at news time prices go down to take liquidity below 80k. Most desperate move for bears.
#PPIWatch #PPIReport
$BTC $BTW $ETH
{future}(BTCUSDT)
Yesterday CPI gave A great push to price downside .
Today is #PPI Data Right after 4:15 Hours.At 5:30PKT What will be effect of ppi on market??
what u think ?
In my view, Market will keep bouncing a bit till 5:00pm ND then again at news time prices go down to take liquidity below 80k. Most desperate move for bears.
#PPIWatch #PPIReport
$BTC $BTW $ETH
Today is #PPI Data Right after 4:15 Hours.At 5:30PKT What will be effect of ppi on market??
what u think ?
In my view, Market will keep bouncing a bit till 5:00pm ND then again at news time prices go down to take liquidity below 80k. Most desperate move for bears.
#PPIWatch #PPIReport
$BTC $BTW $ETH
146

·
--
#usppimissmayeasebtcpressure
🚨 US PPI Report: Core Price Stickiness Signals Higher For Longer Rates 📉
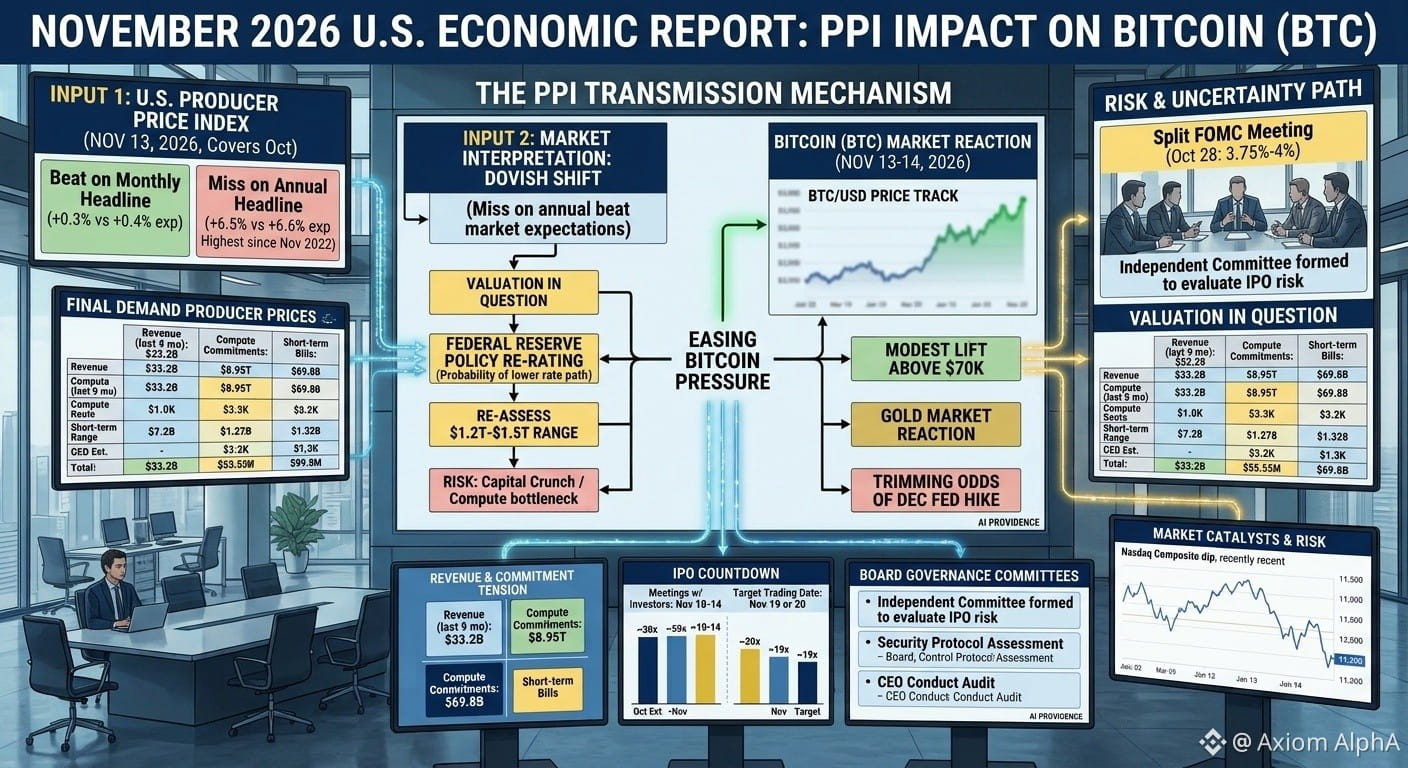
The latest U.S. Producer Price Index (PPI) report for October 2026 presents a mixed but ultimately risk-off narrative for crypto assets.
PPI Miss: Headline Final Demand PPI printed at +6.5% YoY, a notable miss against market expectations of +6.6%.
Core PPI Stickiness: While headline figures eased, core final demand inflation measures are not receding as quickly, causing the market to price in a more hawkish "Higher For Longer" stance from the Federal Reserve.
BTC Pressure Eases... Slightly: The initial market interpretation triggered a "Dovish Shift" in expectations, causing a "Federal Reserve Policy Re-Rating" and slightly trimming the odds of a December Fed hike.
This sparked an immediate "Easing Bitcoin Pressure" transmission mechanism, providing a modest lift to BTC above $70K.
However, the core stickiness means macro uncertainty remains high, placing structural support levels under scrutiny.
📉 Tradeable Coins Trade Plans ($BTC, $ETH,$SOL)
Based on this 'Mixed/Higher-For-Longer' macro catalyst, we are deploying risk-managed contingency trade plans for three major assets.
Bitcoin ($BTC )
Market Bias: Macro Support Absorption / Mean Reversion
Buy Zone: $73,500 – $74,800
Target 1 (T1): $78,500 (200-Day Moving Average Resistance)
Target 2 (T2): $82,000 (Liquidity Sweep Zone)
Stop Loss (SL): $71,800
Ethereum ($ETH )
Market Bias: Defensive Accumulation / Oversold Mean Reversion
Buy Zone: $2,420 – $2,480
Target 1 (T1): $2,650 (Local Order Block)
Target 2 (T2): $2,820 (Macro Supply Ceiling)
Stop Loss (SL): $2,350
Solana ($SOL )
Market Bias: Breakout Contingency / Momentum Trap Play
Entry Zone: Rebound & Break above $89.00 area.
Target 1 (T1): $98.50
Target 2 (T2): $108.00
Stop Loss (SL): $83.20
🛡️ Risk Management Parameters
Position Sizing: strictly enforce < 2% total portfolio risk per trade.
{spot}(BTCUSDT)
{spot}(ETHUSDT)
{spot}(SOLUSDT)
#MacroTrading #bitcoin #PPIReport #Inflation
#usppimissmayeasebtcpressure
🚨 US PPI Report: Core Price Stickiness Signals Higher For Longer Rates 📉
The latest U.S. Producer Price Index (PPI) report for October 2026 presents a mixed but ultimately risk-off narrative for crypto assets.
PPI Miss: Headline Final Demand PPI printed at +6.5% YoY, a notable miss against market expectations of +6.6%.
Core PPI Stickiness: While headline figures eased, core final demand inflation measures are not receding as quickly, causing the market to price in a more hawkish "Higher For Longer" stance from the Federal Reserve.
BTC Pressure Eases... Slightly: The initial market interpretation triggered a "Dovish Shift" in expectations, causing a "Federal Reserve Policy Re-Rating" and slightly trimming the odds of a December Fed hike.
This sparked an immediate "Easing Bitcoin Pressure" transmission mechanism, providing a modest lift to BTC above $70K.
However, the core stickiness means macro uncertainty remains high, placing structural support levels under scrutiny.
📉 Tradeable Coins Trade Plans ($BTC , $ETH ,$SOL )
Based on this 'Mixed/Higher-For-Longer' macro catalyst, we are deploying risk-managed contingency trade plans for three major assets.
Bitcoin ($BTC )
Market Bias: Macro Support Absorption / Mean Reversion
Buy Zone: $73,500 – $74,800
Target 1 (T1): $78,500 (200-Day Moving Average Resistance)
Target 2 (T2): $82,000 (Liquidity Sweep Zone)
Stop Loss (SL): $71,800
Ethereum ($ETH )
Market Bias: Defensive Accumulation / Oversold Mean Reversion
Buy Zone: $2,420 – $2,480
Target 1 (T1): $2,650 (Local Order Block)
Target 2 (T2): $2,820 (Macro Supply Ceiling)
Stop Loss (SL): $2,350
Solana ($SOL )
Market Bias: Breakout Contingency / Momentum Trap Play
Entry Zone: Rebound & Break above $89.00 area.
Target 1 (T1): $98.50
Target 2 (T2): $108.00
Stop Loss (SL): $83.20
🛡️ Risk Management Parameters
Position Sizing: strictly enforce < 2% total portfolio risk per trade.
#MacroTrading #bitcoin #PPIReport #Inflation
🚨 US PPI Report: Core Price Stickiness Signals Higher For Longer Rates 📉
The latest U.S. Producer Price Index (PPI) report for October 2026 presents a mixed but ultimately risk-off narrative for crypto assets.
PPI Miss: Headline Final Demand PPI printed at +6.5% YoY, a notable miss against market expectations of +6.6%.
Core PPI Stickiness: While headline figures eased, core final demand inflation measures are not receding as quickly, causing the market to price in a more hawkish "Higher For Longer" stance from the Federal Reserve.
BTC Pressure Eases... Slightly: The initial market interpretation triggered a "Dovish Shift" in expectations, causing a "Federal Reserve Policy Re-Rating" and slightly trimming the odds of a December Fed hike.
This sparked an immediate "Easing Bitcoin Pressure" transmission mechanism, providing a modest lift to BTC above $70K.
However, the core stickiness means macro uncertainty remains high, placing structural support levels under scrutiny.
📉 Tradeable Coins Trade Plans ($BTC , $ETH ,$SOL )
Based on this 'Mixed/Higher-For-Longer' macro catalyst, we are deploying risk-managed contingency trade plans for three major assets.
Bitcoin ($BTC )
Market Bias: Macro Support Absorption / Mean Reversion
Buy Zone: $73,500 – $74,800
Target 1 (T1): $78,500 (200-Day Moving Average Resistance)
Target 2 (T2): $82,000 (Liquidity Sweep Zone)
Stop Loss (SL): $71,800
Ethereum ($ETH )
Market Bias: Defensive Accumulation / Oversold Mean Reversion
Buy Zone: $2,420 – $2,480
Target 1 (T1): $2,650 (Local Order Block)
Target 2 (T2): $2,820 (Macro Supply Ceiling)
Stop Loss (SL): $2,350
Solana ($SOL )
Market Bias: Breakout Contingency / Momentum Trap Play
Entry Zone: Rebound & Break above $89.00 area.
Target 1 (T1): $98.50
Target 2 (T2): $108.00
Stop Loss (SL): $83.20
🛡️ Risk Management Parameters
Position Sizing: strictly enforce < 2% total portfolio risk per trade.
#MacroTrading #bitcoin #PPIReport #Inflation
160

·
--
🔥 The Secret Plot Twist Wall Street Didn't See Coming: Decoding the Latest PPI Data! 🕵️♂️📈
Forget boring textbooks. If you want to know where the economy is actually heading, you need to look at the Producer Price Index (PPI)—the ultimate behind-the-scenes villain in the financial thriller.
Before items ever hit the shelves with those painful retail price tags, producers have to buy raw materials. That is what PPI tracks: wholesale inflation. And guess what? The latest numbers just dropped a bombshell. 💣
The Quick Specs:
Monthly PPI: Up 0.4%
Annual Spike (YoY): Hit a hot 5.4%
The Prime Suspect: Energy and diesel costs acting like rocket fuel for the index. 🚀
Why Should You Care? Think of PPI as the economic equivalent of a trailer for a horror movie. If manufacturing and wholesale costs surge today, your grocery bills and everyday expenses are starring in the sequel tomorrow.
With the Federal Reserve's big interest rate decision looming, traders are currently glued to their screens eating popcorn while the charts throw a wild party. 🍿📉
What’s your game plan for this market roller coaster? Drop your thoughts below! 👇
#PPI #PPIReport #cryptouniverseofficial #TrendingTopic #foryouevr #Everyone
🔥 The Secret Plot Twist Wall Street Didn't See Coming: Decoding the Latest PPI Data! 🕵️♂️📈
Forget boring textbooks. If you want to know where the economy is actually heading, you need to look at the Producer Price Index (PPI)—the ultimate behind-the-scenes villain in the financial thriller.
Before items ever hit the shelves with those painful retail price tags, producers have to buy raw materials. That is what PPI tracks: wholesale inflation. And guess what? The latest numbers just dropped a bombshell. 💣
The Quick Specs:
Monthly PPI: Up 0.4%
Annual Spike (YoY): Hit a hot 5.4%
The Prime Suspect: Energy and diesel costs acting like rocket fuel for the index. 🚀
Why Should You Care? Think of PPI as the economic equivalent of a trailer for a horror movie. If manufacturing and wholesale costs surge today, your grocery bills and everyday expenses are starring in the sequel tomorrow.
With the Federal Reserve's big interest rate decision looming, traders are currently glued to their screens eating popcorn while the charts throw a wild party. 🍿📉
What’s your game plan for this market roller coaster? Drop your thoughts below! 👇
#PPI #PPIReport #cryptouniverseofficial #TrendingTopic #foryouevr #Everyone
Forget boring textbooks. If you want to know where the economy is actually heading, you need to look at the Producer Price Index (PPI)—the ultimate behind-the-scenes villain in the financial thriller.
Before items ever hit the shelves with those painful retail price tags, producers have to buy raw materials. That is what PPI tracks: wholesale inflation. And guess what? The latest numbers just dropped a bombshell. 💣
The Quick Specs:
Monthly PPI: Up 0.4%
Annual Spike (YoY): Hit a hot 5.4%
The Prime Suspect: Energy and diesel costs acting like rocket fuel for the index. 🚀
Why Should You Care? Think of PPI as the economic equivalent of a trailer for a horror movie. If manufacturing and wholesale costs surge today, your grocery bills and everyday expenses are starring in the sequel tomorrow.
With the Federal Reserve's big interest rate decision looming, traders are currently glued to their screens eating popcorn while the charts throw a wild party. 🍿📉
What’s your game plan for this market roller coaster? Drop your thoughts below! 👇
#PPI #PPIReport #cryptouniverseofficial #TrendingTopic #foryouevr #Everyone

1
66
·
--
Bullish
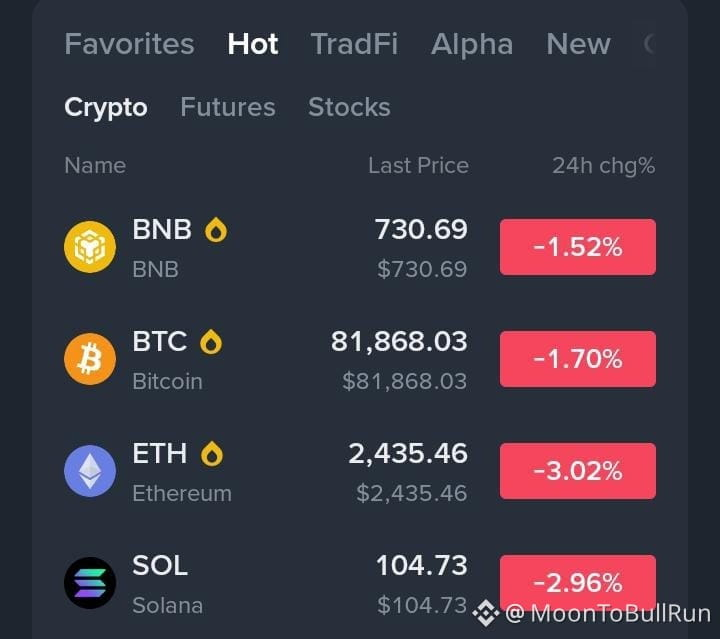
Crypto Big 4 all red but why? Super depth analysis:
1. $BTC $81,868.03 -1.70% - The King Crashed
Bitcoin fell after today CPI came 3% vs 3.1% forecast. CPI was good but PPI fear tomorrow 12:30 PM is killing it. BTC lost $82k support. Next support $80,500 - if PPI comes above 0.5% we go $79k. If below 0.5% we pump back to $84k. BTC dominance down today which is why small coins like WAL pumped 58%.
2. $ETH $2,435.46 -3.02% - Worst Hit
ETH down double than BTC. Reason - ETH/BTC ratio at yearly low. When BTC dumps, ETH dumps 2x. $2,400 is key. If ETH holds $2,400 till PPI, good sign for altseason. If breaks $2,400, next is $2,250. Gas fees low so network okay, price just following BTC fear.
3. $BNB $730.69 -1.52% - Strongest of 4
BNB only -1.52% vs ETH -3.02%. BNB holding because of Binance burn and BSC activity. $730 holding above $700 is bullish. If BTC crashes to $80k, BNB will hold $700. If PPI bullish, BNB first to go $750+. This is the safe coin in this list tonight.
4. #SOL $104.73 -2.96% - Risk On Risk Off
SOL almost same as ETH -2.96%. SOL is high beta - pumps more, dumps more. $104 is psychological. Lost $110 support after CPI. Next $100 must hold. If BTC goes $79k on hot PPI, SOL goes $96. If PPI cool, SOL goes $115 fast.
Overall market summary:
All 4 red because of PPI fear tomorrow. This is not real selling, this is hedge. Big players short before PPI 12:30 PM. If PPI comes 0.3% to 0.4%, all 4 green +5% in 1 hour. If PPI 0.6%+, add another -3% more.
My take: Market wants to go up but waiting for PPI <0.5%. BNB strongest, ETH weakest tonight.
Which one you buying in this red? Comment.
#CPIWatch
#PPIReport
#BTC #ETH #SOL
Crypto Big 4 all red but why? Super depth analysis:
1. $BTC $81,868.03 -1.70% - The King Crashed
Bitcoin fell after today CPI came 3% vs 3.1% forecast. CPI was good but PPI fear tomorrow 12:30 PM is killing it. BTC lost $82k support. Next support $80,500 - if PPI comes above 0.5% we go $79k. If below 0.5% we pump back to $84k. BTC dominance down today which is why small coins like WAL pumped 58%.
2. $ETH $2,435.46 -3.02% - Worst Hit
ETH down double than BTC. Reason - ETH/BTC ratio at yearly low. When BTC dumps, ETH dumps 2x. $2,400 is key. If ETH holds $2,400 till PPI, good sign for altseason. If breaks $2,400, next is $2,250. Gas fees low so network okay, price just following BTC fear.
3. $BNB $730.69 -1.52% - Strongest of 4
BNB only -1.52% vs ETH -3.02%. BNB holding because of Binance burn and BSC activity. $730 holding above $700 is bullish. If BTC crashes to $80k, BNB will hold $700. If PPI bullish, BNB first to go $750+. This is the safe coin in this list tonight.
4. #SOL $104.73 -2.96% - Risk On Risk Off
SOL almost same as ETH -2.96%. SOL is high beta - pumps more, dumps more. $104 is psychological. Lost $110 support after CPI. Next $100 must hold. If BTC goes $79k on hot PPI, SOL goes $96. If PPI cool, SOL goes $115 fast.
Overall market summary:
All 4 red because of PPI fear tomorrow. This is not real selling, this is hedge. Big players short before PPI 12:30 PM. If PPI comes 0.3% to 0.4%, all 4 green +5% in 1 hour. If PPI 0.6%+, add another -3% more.
My take: Market wants to go up but waiting for PPI <0.5%. BNB strongest, ETH weakest tonight.
Which one you buying in this red? Comment.
#CPIWatch
#PPIReport
#BTC #ETH #SOL
1. $BTC $81,868.03 -1.70% - The King Crashed
Bitcoin fell after today CPI came 3% vs 3.1% forecast. CPI was good but PPI fear tomorrow 12:30 PM is killing it. BTC lost $82k support. Next support $80,500 - if PPI comes above 0.5% we go $79k. If below 0.5% we pump back to $84k. BTC dominance down today which is why small coins like WAL pumped 58%.
2. $ETH $2,435.46 -3.02% - Worst Hit
ETH down double than BTC. Reason - ETH/BTC ratio at yearly low. When BTC dumps, ETH dumps 2x. $2,400 is key. If ETH holds $2,400 till PPI, good sign for altseason. If breaks $2,400, next is $2,250. Gas fees low so network okay, price just following BTC fear.
3. $BNB $730.69 -1.52% - Strongest of 4
BNB only -1.52% vs ETH -3.02%. BNB holding because of Binance burn and BSC activity. $730 holding above $700 is bullish. If BTC crashes to $80k, BNB will hold $700. If PPI bullish, BNB first to go $750+. This is the safe coin in this list tonight.
4. #SOL $104.73 -2.96% - Risk On Risk Off
SOL almost same as ETH -2.96%. SOL is high beta - pumps more, dumps more. $104 is psychological. Lost $110 support after CPI. Next $100 must hold. If BTC goes $79k on hot PPI, SOL goes $96. If PPI cool, SOL goes $115 fast.
Overall market summary:
All 4 red because of PPI fear tomorrow. This is not real selling, this is hedge. Big players short before PPI 12:30 PM. If PPI comes 0.3% to 0.4%, all 4 green +5% in 1 hour. If PPI 0.6%+, add another -3% more.
My take: Market wants to go up but waiting for PPI <0.5%. BNB strongest, ETH weakest tonight.
Which one you buying in this red? Comment.
#CPIWatch
#PPIReport
#BTC #ETH #SOL
1
191
Log in to explore more content
Join global crypto users on Binance Square
⚡️ Get latest and useful information about crypto.
💬 Trusted by the world’s largest crypto exchange.
👍 Discover real insights from verified creators.
Email / Phone number
Trending Topics
1
#BTCReboundsAbove$60KAmidWhaleDipBuying
81,456 views
356 Discussing
2
#SolanaSets2027RoadmapToDoubleComputeCapacity
65,102 views
1,041 Discussing
3
#CaliforniaNvidiaProbeExaminesPotentialCriminalViolations
17,580 views
141 Discussing
4
#BlackRockLaunchesHKDollarDigitalLiquidityFund
54,757 views
795 Discussing
5
#NvidiaLoses$2.7TrillionInMonthAndAHalf
79,559 views
315 Discussing
6
#GlobalStocksFaceLongestLosingStreakSince2023
580,802 views
3,511 Discussing
7
#BlackRockIBITPostsRecord$541MSingleDayOutflow
97,262 views
186 Discussing
8
#AnthropicPlungesTowardIPOPriceonDay2
321,891 views
2,356 Discussing
9
#TwentyOneCapitalAdds172.25BTC
172,356 views
1,664 Discussing
10
#HKBillWouldExcludeTokenizedDepositsFromVirtualAssets
18,747 views
108 Discussing