
#priceactionnotes
priceactionnotes
1,396 views
38 Discussing
Hot
Latest

·
--
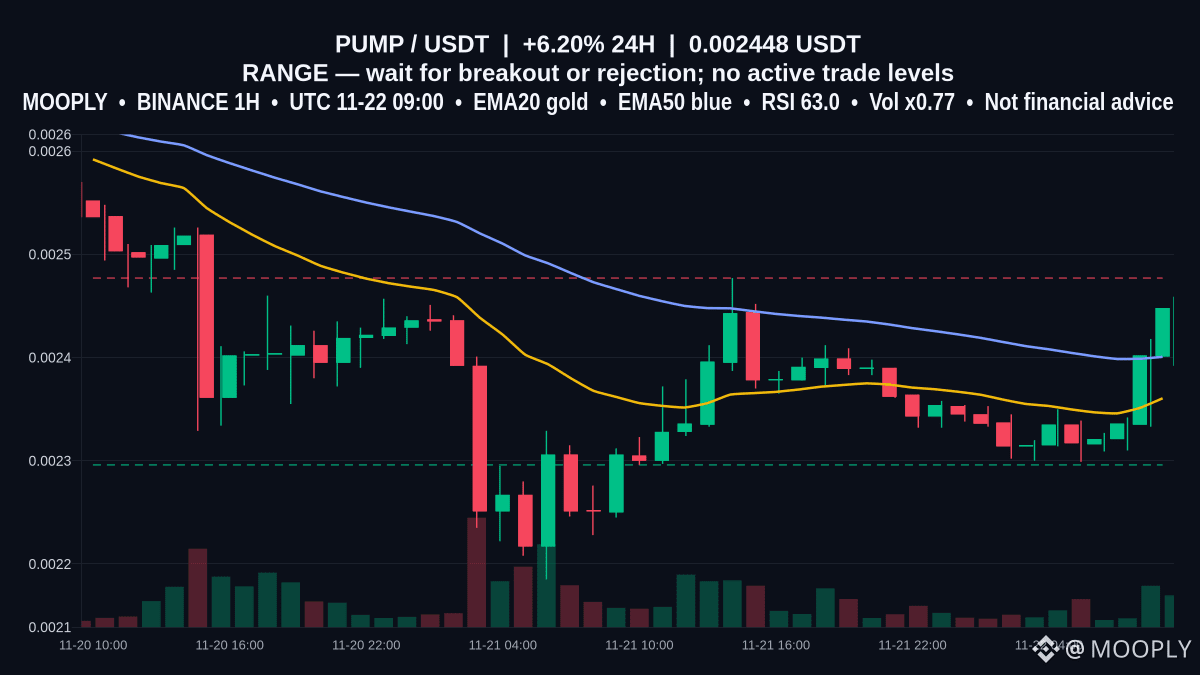
At 0.002448 with ATR14 0.0000342, treat this 1h setup like a lesson in patience.
RSI 62.99 and MACD near zero while EMA20 vs EMA50 are tight — indicators conflict, so bias is RANGE. Price sits between support 0.002296 and resistance 0.002477. For $PUMP watch for a volume-confirmed breakout above resistance or a clean rejection/break below support; use ATR-based entries and the plan’s invalidation.
Will a sustained volume push above the current volRatio 0.77 validate a breakout above 0.002477?
↔ RANGE watch
Support: 0.0022960 | Resistance: 0.0024770
Bull scenario: confirmation above resistance
Bear scenario: confirmation below support
Entry: N/A | TP1: N/A | TP2: N/A | TP3: N/A | SL: N/A
No confirmed trade until a breakout or rejection.
Not financial advice.
#PUMPTargets #PriceActionNotes #BreakoutWatchNotes
At 0.002448 with ATR14 0.0000342, treat this 1h setup like a lesson in patience.
RSI 62.99 and MACD near zero while EMA20 vs EMA50 are tight — indicators conflict, so bias is RANGE. Price sits between support 0.002296 and resistance 0.002477. For $PUMP watch for a volume-confirmed breakout above resistance or a clean rejection/break below support; use ATR-based entries and the plan’s invalidation.
Will a sustained volume push above the current volRatio 0.77 validate a breakout above 0.002477?
↔ RANGE watch
Support: 0.0022960 | Resistance: 0.0024770
Bull scenario: confirmation above resistance
Bear scenario: confirmation below support
Entry: N/A | TP1: N/A | TP2: N/A | TP3: N/A | SL: N/A
No confirmed trade until a breakout or rejection.
Not financial advice.
#PUMPTargets #PriceActionNotes #BreakoutWatchNotes
RSI 62.99 and MACD near zero while EMA20 vs EMA50 are tight — indicators conflict, so bias is RANGE. Price sits between support 0.002296 and resistance 0.002477. For $PUMP watch for a volume-confirmed breakout above resistance or a clean rejection/break below support; use ATR-based entries and the plan’s invalidation.
Will a sustained volume push above the current volRatio 0.77 validate a breakout above 0.002477?
↔ RANGE watch
Support: 0.0022960 | Resistance: 0.0024770
Bull scenario: confirmation above resistance
Bear scenario: confirmation below support
Entry: N/A | TP1: N/A | TP2: N/A | TP3: N/A | SL: N/A
No confirmed trade until a breakout or rejection.
Not financial advice.
#PUMPTargets #PriceActionNotes #BreakoutWatchNotes
4
·
--
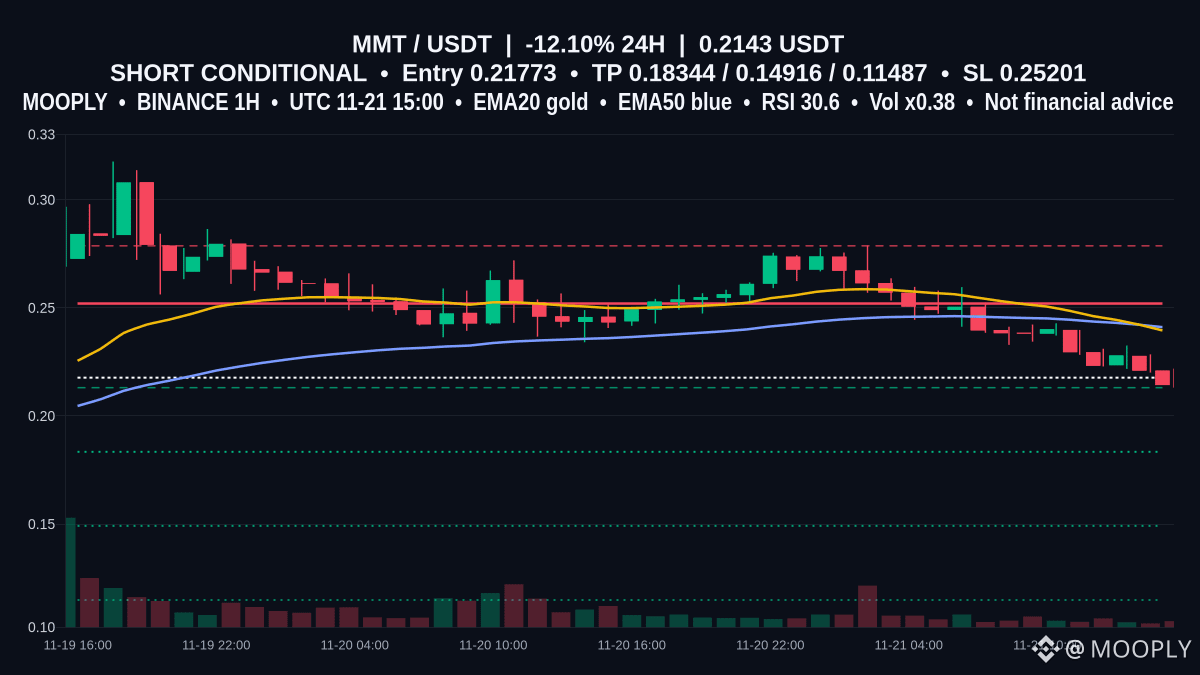
Short-story hook: 48 completed 1h candles show $MMT at 0.2143 (-12.1% 24h); RSI 30.64 with EMA20 0.23956 below EMA50 0.24111 and MACD negative — momentum tilting down.
Price is hovering just above support 0.2131 on low volume (volRatio 0.38). The verified plan is SHORT with entry near 0.21773 and invalidation above the stop; this feels like a pulled-back short aiming for deeper targets. Will a decisive break below 0.2131 with rising volume confirm the short?
Setup: SHORT 📉
— Entry zone: 0.21773
— Target 1: 0.18344
— Target 2: 0.14916
— Target 3: 0.11487
— Stop: 0.25201 (the idea is wrong beyond this)
Not financial advice.
#MMTZones #PriceActionNotes #PullbackShortIdeas
Short-story hook: 48 completed 1h candles show $MMT at 0.2143 (-12.1% 24h); RSI 30.64 with EMA20 0.23956 below EMA50 0.24111 and MACD negative — momentum tilting down.
Price is hovering just above support 0.2131 on low volume (volRatio 0.38). The verified plan is SHORT with entry near 0.21773 and invalidation above the stop; this feels like a pulled-back short aiming for deeper targets. Will a decisive break below 0.2131 with rising volume confirm the short?
Setup: SHORT 📉
— Entry zone: 0.21773
— Target 1: 0.18344
— Target 2: 0.14916
— Target 3: 0.11487
— Stop: 0.25201 (the idea is wrong beyond this)
Not financial advice.
#MMTZones #PriceActionNotes #PullbackShortIdeas
Price is hovering just above support 0.2131 on low volume (volRatio 0.38). The verified plan is SHORT with entry near 0.21773 and invalidation above the stop; this feels like a pulled-back short aiming for deeper targets. Will a decisive break below 0.2131 with rising volume confirm the short?
Setup: SHORT 📉
— Entry zone: 0.21773
— Target 1: 0.18344
— Target 2: 0.14916
— Target 3: 0.11487
— Stop: 0.25201 (the idea is wrong beyond this)
Not financial advice.
#MMTZones #PriceActionNotes #PullbackShortIdeas
5
·
--
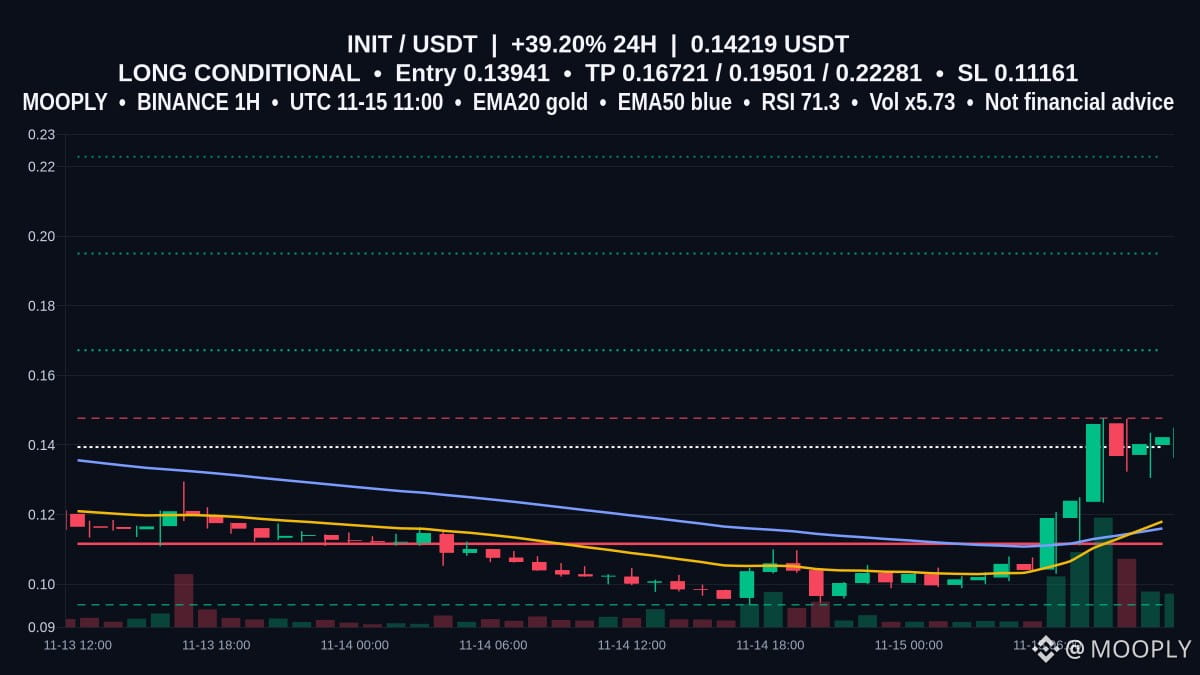
Could $INIT's 0.14219 price, a 39.197% 24h surge and 5.73x vol ratio be a breakout setup?
EMA20 0.11802 and EMA50 0.11602 sit below price; RSI 71.28 and MACD above its signal point to momentum. Resistance 0.1477, support 0.09409. Entry 0.13941, SL 0.11161, TPs 0.16721 / 0.19501 / 0.22281 — ATR14-based, confidence high.
Require a clean close above 0.1477 on matching volume to treat the entry as valid?
🟢 LONG PLAN
▫️ Entry 0.13941
▫️ TP1 0.16721
▫️ TP2 0.19501
▫️ TP3 0.22281
🛑 SL 0.11161
Not financial advice.
#INITChartNotes #PriceActionNotes #BullishSetupWatch
Could $INIT 's 0.14219 price, a 39.197% 24h surge and 5.73x vol ratio be a breakout setup?
EMA20 0.11802 and EMA50 0.11602 sit below price; RSI 71.28 and MACD above its signal point to momentum. Resistance 0.1477, support 0.09409. Entry 0.13941, SL 0.11161, TPs 0.16721 / 0.19501 / 0.22281 — ATR14-based, confidence high.
Require a clean close above 0.1477 on matching volume to treat the entry as valid?
🟢 LONG PLAN
▫️ Entry 0.13941
▫️ TP1 0.16721
▫️ TP2 0.19501
▫️ TP3 0.22281
🛑 SL 0.11161
Not financial advice.
#INITChartNotes #PriceActionNotes #BullishSetupWatch
EMA20 0.11802 and EMA50 0.11602 sit below price; RSI 71.28 and MACD above its signal point to momentum. Resistance 0.1477, support 0.09409. Entry 0.13941, SL 0.11161, TPs 0.16721 / 0.19501 / 0.22281 — ATR14-based, confidence high.
Require a clean close above 0.1477 on matching volume to treat the entry as valid?
🟢 LONG PLAN
▫️ Entry 0.13941
▫️ TP1 0.16721
▫️ TP2 0.19501
▫️ TP3 0.22281
🛑 SL 0.11161
Not financial advice.
#INITChartNotes #PriceActionNotes #BullishSetupWatch
·
--
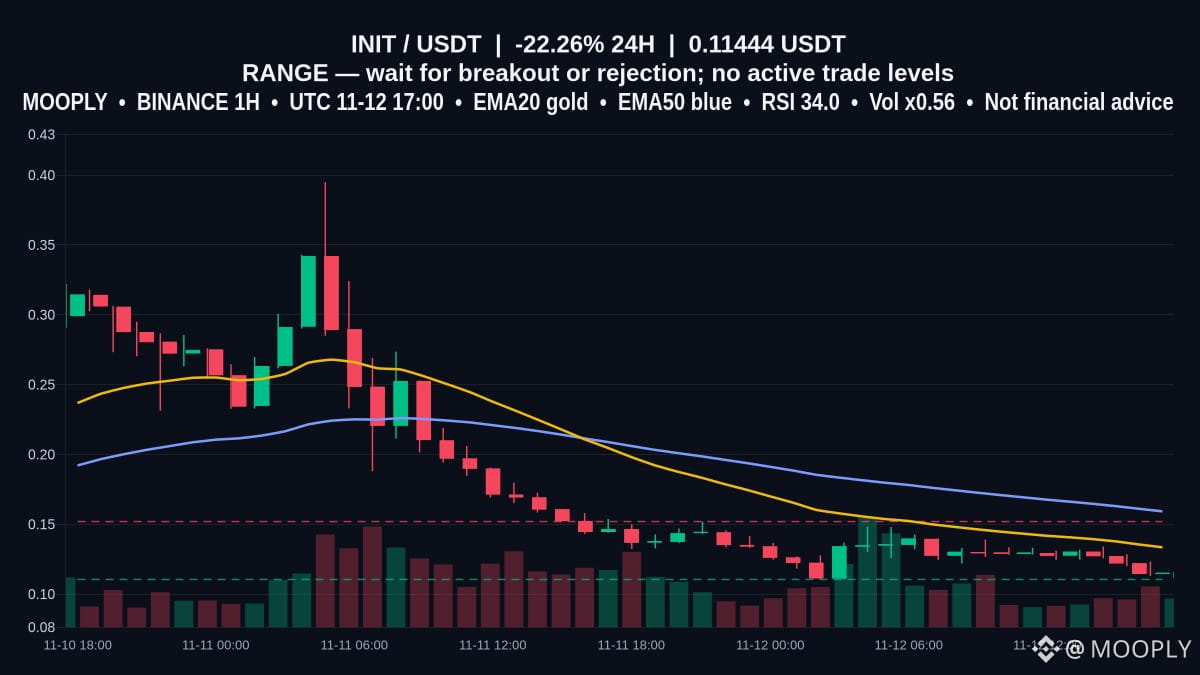
$INIT — Contrarian: a 22.257% 24h drop to 0.11444 with low volRatio 0.56 and RSI 33.96 looks like capitulation, yet the 1h chart keeps a range profile — EMA20 0.13348 below EMA50 0.15921 while MACD sits just above its signal.
Support 0.11046 and resistance 0.15196 are intact on completed 1h candles. ATR14 0.01041 and muted volume (24h 19389720.419603) argue for waiting: rejection at resistance keeps the short-case; a decisive hourly close above resistance with rising volume flips bias.
Do you want an hourly close above 0.15196 with volume above 19389720.419603 to validate a breakout?
↔ RANGE watch
Support: 0.11046 | Resistance: 0.15196
Bull scenario: confirmation above resistance
Bear scenario: confirmation below support
Entry: N/A | TP1: N/A | TP2: N/A | TP3: N/A | SL: N/A
No confirmed trade until a breakout or rejection.
Not financial advice.
#INITWatch #PriceActionNotes #SupportResistanceMap
$INIT — Contrarian: a 22.257% 24h drop to 0.11444 with low volRatio 0.56 and RSI 33.96 looks like capitulation, yet the 1h chart keeps a range profile — EMA20 0.13348 below EMA50 0.15921 while MACD sits just above its signal.
Support 0.11046 and resistance 0.15196 are intact on completed 1h candles. ATR14 0.01041 and muted volume (24h 19389720.419603) argue for waiting: rejection at resistance keeps the short-case; a decisive hourly close above resistance with rising volume flips bias.
Do you want an hourly close above 0.15196 with volume above 19389720.419603 to validate a breakout?
↔ RANGE watch
Support: 0.11046 | Resistance: 0.15196
Bull scenario: confirmation above resistance
Bear scenario: confirmation below support
Entry: N/A | TP1: N/A | TP2: N/A | TP3: N/A | SL: N/A
No confirmed trade until a breakout or rejection.
Not financial advice.
#INITWatch #PriceActionNotes #SupportResistanceMap
Support 0.11046 and resistance 0.15196 are intact on completed 1h candles. ATR14 0.01041 and muted volume (24h 19389720.419603) argue for waiting: rejection at resistance keeps the short-case; a decisive hourly close above resistance with rising volume flips bias.
Do you want an hourly close above 0.15196 with volume above 19389720.419603 to validate a breakout?
↔ RANGE watch
Support: 0.11046 | Resistance: 0.15196
Bull scenario: confirmation above resistance
Bear scenario: confirmation below support
Entry: N/A | TP1: N/A | TP2: N/A | TP3: N/A | SL: N/A
No confirmed trade until a breakout or rejection.
Not financial advice.
#INITWatch #PriceActionNotes #SupportResistanceMap
333
·
--
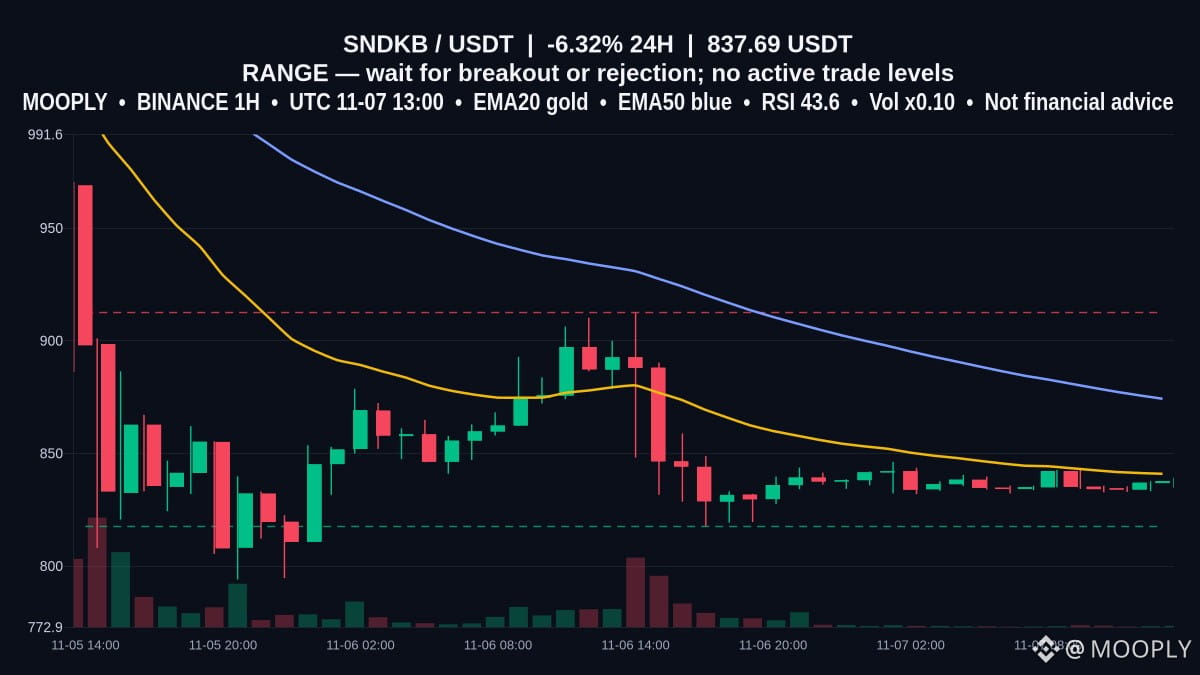
Six-hour story: $SNDKB sits at 837.69, trading just under EMA20 (840.93) while EMA50 holds at 874.23; RSI 43.6 and the MACD histogram is positive (MACD -8.17 vs signal -10.59).
Bias is RANGE: support 817.56, resistance 912.51. Volume is muted (volRatio 0.1) so the plan waits for a confirmed breakout or rejection; ATR14 is 5.99. Entry is a limit on a slight pullback, SL = invalidation, TPs are risk-multiple targets.
Is a volume spike required to validate a breakout above 912.51?
↔ RANGE watch
Support: 817.56 | Resistance: 912.51
Bull scenario: confirmation above resistance
Bear scenario: confirmation below support
Entry: N/A | TP1: N/A | TP2: N/A | TP3: N/A | SL: N/A
No confirmed trade until a breakout or rejection.
Not financial advice.
#SNDKBSetup #PriceActionNotes #RangeTradingNotes
Six-hour story: $SNDKB sits at 837.69, trading just under EMA20 (840.93) while EMA50 holds at 874.23; RSI 43.6 and the MACD histogram is positive (MACD -8.17 vs signal -10.59).
Bias is RANGE: support 817.56, resistance 912.51. Volume is muted (volRatio 0.1) so the plan waits for a confirmed breakout or rejection; ATR14 is 5.99. Entry is a limit on a slight pullback, SL = invalidation, TPs are risk-multiple targets.
Is a volume spike required to validate a breakout above 912.51?
↔ RANGE watch
Support: 817.56 | Resistance: 912.51
Bull scenario: confirmation above resistance
Bear scenario: confirmation below support
Entry: N/A | TP1: N/A | TP2: N/A | TP3: N/A | SL: N/A
No confirmed trade until a breakout or rejection.
Not financial advice.
#SNDKBSetup #PriceActionNotes #RangeTradingNotes
Bias is RANGE: support 817.56, resistance 912.51. Volume is muted (volRatio 0.1) so the plan waits for a confirmed breakout or rejection; ATR14 is 5.99. Entry is a limit on a slight pullback, SL = invalidation, TPs are risk-multiple targets.
Is a volume spike required to validate a breakout above 912.51?
↔ RANGE watch
Support: 817.56 | Resistance: 912.51
Bull scenario: confirmation above resistance
Bear scenario: confirmation below support
Entry: N/A | TP1: N/A | TP2: N/A | TP3: N/A | SL: N/A
No confirmed trade until a breakout or rejection.
Not financial advice.
#SNDKBSetup #PriceActionNotes #RangeTradingNotes
12
·
--
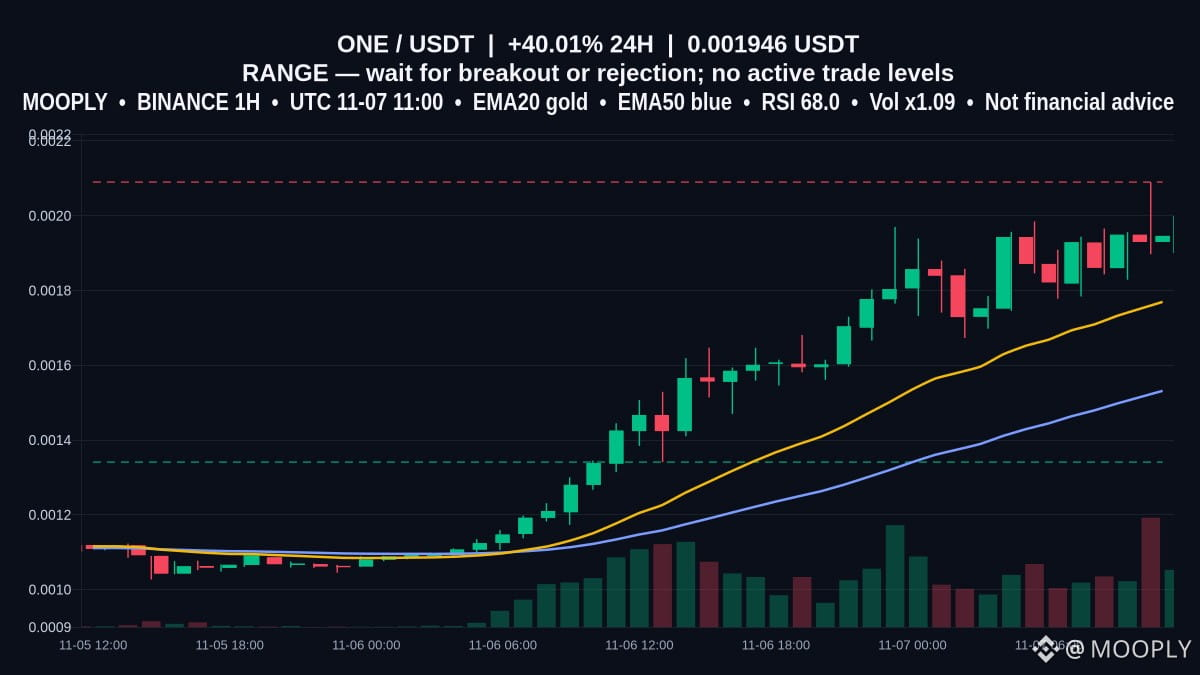
Chart walkthrough: $ONE at 0.001946 after a 40% 24h surge — on the 48 completed 1h candles EMA20 sits above EMA50 and price is trading squarely between the drawn support and resistance.
This is a RANGE setup: support at 0.001341 and resistance at 0.00209. Breakout with confirmed volume favors continuation; rejection or a close below support points to range re-test.
Do you need volume confirmation above 0.00209 to treat a breakout as valid?
↔ RANGE watch
Support: 0.0013410 | Resistance: 0.0020900
Bull scenario: confirmation above resistance
Bear scenario: confirmation below support
Entry: N/A | TP1: N/A | TP2: N/A | TP3: N/A | SL: N/A
No confirmed trade until a breakout or rejection.
Not financial advice.
#ONETargets #PriceActionNotes #RangeTradingNotes
Chart walkthrough: $ONE at 0.001946 after a 40% 24h surge — on the 48 completed 1h candles EMA20 sits above EMA50 and price is trading squarely between the drawn support and resistance.
This is a RANGE setup: support at 0.001341 and resistance at 0.00209. Breakout with confirmed volume favors continuation; rejection or a close below support points to range re-test.
Do you need volume confirmation above 0.00209 to treat a breakout as valid?
↔ RANGE watch
Support: 0.0013410 | Resistance: 0.0020900
Bull scenario: confirmation above resistance
Bear scenario: confirmation below support
Entry: N/A | TP1: N/A | TP2: N/A | TP3: N/A | SL: N/A
No confirmed trade until a breakout or rejection.
Not financial advice.
#ONETargets #PriceActionNotes #RangeTradingNotes
This is a RANGE setup: support at 0.001341 and resistance at 0.00209. Breakout with confirmed volume favors continuation; rejection or a close below support points to range re-test.
Do you need volume confirmation above 0.00209 to treat a breakout as valid?
↔ RANGE watch
Support: 0.0013410 | Resistance: 0.0020900
Bull scenario: confirmation above resistance
Bear scenario: confirmation below support
Entry: N/A | TP1: N/A | TP2: N/A | TP3: N/A | SL: N/A
No confirmed trade until a breakout or rejection.
Not financial advice.
#ONETargets #PriceActionNotes #RangeTradingNotes
75
·
--
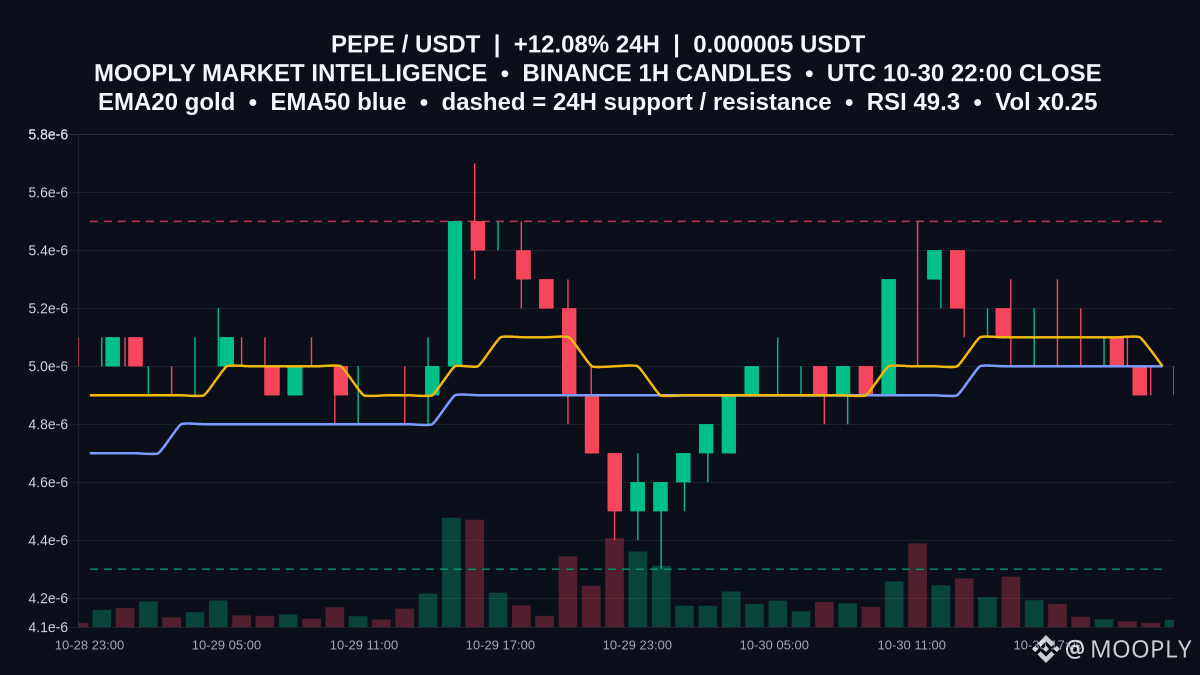
Range-bound session for $PEPE as price hovers at 0.00000502 after a 12.081% 24h gain.
EMA20 and EMA50 are both 0.000005 while RSI at 49.29 signals balance; ATR at 0.0000002 points to tight, repeatable swings that favor fading extremes rather than chasing moves.
This is a defined box: support at 0.0000043 and resistance at 0.0000055. With price near the midpoint and last 6h at -2.33, patience pays—participation is light around 0.25 of baseline.
Confirmation would be a 1h close above 0.0000055 with expanding volume; a 1h close below 0.0000043 would shift risk lower as that level flips to resistance. Which side of 0.0000043–0.0000055 do you expect the next hourly candle to probe first?
Not financial advice.
#PEPE #PriceActionNotes #RangeLevels
Range-bound session for $PEPE as price hovers at 0.00000502 after a 12.081% 24h gain.
EMA20 and EMA50 are both 0.000005 while RSI at 49.29 signals balance; ATR at 0.0000002 points to tight, repeatable swings that favor fading extremes rather than chasing moves.
This is a defined box: support at 0.0000043 and resistance at 0.0000055. With price near the midpoint and last 6h at -2.33, patience pays—participation is light around 0.25 of baseline.
Confirmation would be a 1h close above 0.0000055 with expanding volume; a 1h close below 0.0000043 would shift risk lower as that level flips to resistance. Which side of 0.0000043–0.0000055 do you expect the next hourly candle to probe first?
Not financial advice.
#PEPE #PriceActionNotes #RangeLevels
EMA20 and EMA50 are both 0.000005 while RSI at 49.29 signals balance; ATR at 0.0000002 points to tight, repeatable swings that favor fading extremes rather than chasing moves.
This is a defined box: support at 0.0000043 and resistance at 0.0000055. With price near the midpoint and last 6h at -2.33, patience pays—participation is light around 0.25 of baseline.
Confirmation would be a 1h close above 0.0000055 with expanding volume; a 1h close below 0.0000043 would shift risk lower as that level flips to resistance. Which side of 0.0000043–0.0000055 do you expect the next hourly candle to probe first?
Not financial advice.
#PEPE #PriceActionNotes #RangeLevels
17
·
--
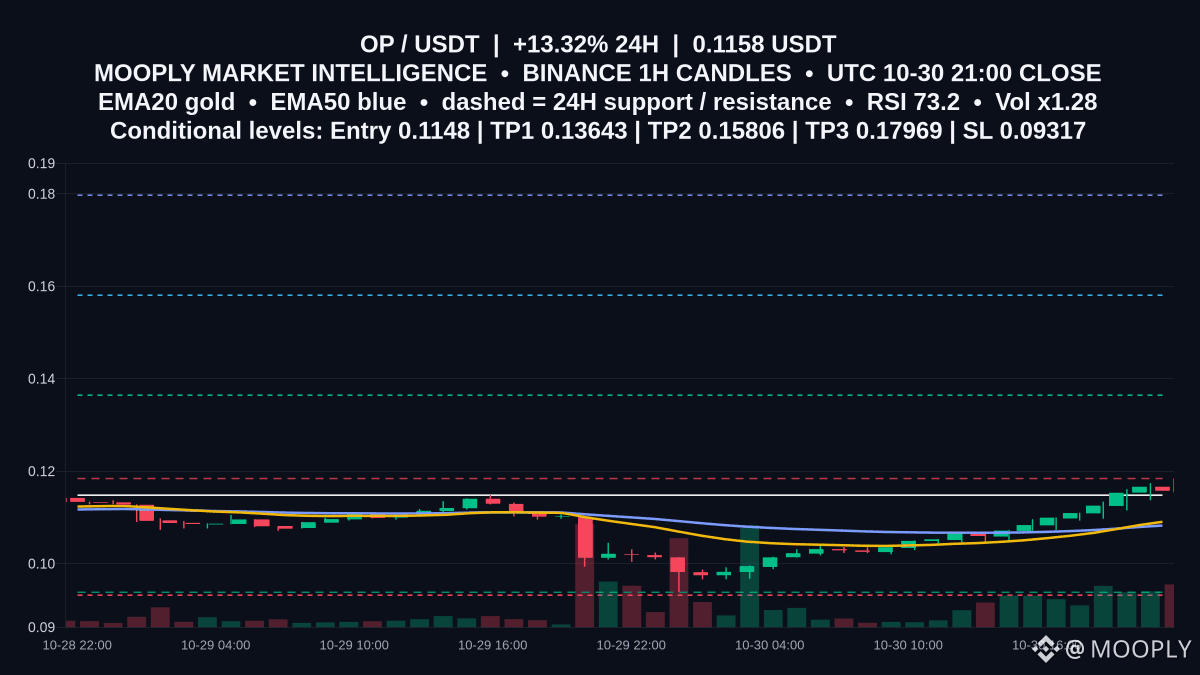
After a +13.32% day, $OP trades at 0.1158 and sits just below the 0.1184 cap.
EMA20 (0.10904) above EMA50 (0.10823) with MACD positive supports momentum, but RSI 73.17 into resistance makes 0.1184 the key decision point.
📍 Potential entry: 0.1148
🎯 Target 1: 0.13643
🎯 Target 2: 0.15806
🛑 Stop / invalidation: 0.09317
Confirmation comes on a 1h close and hold above 0.1184, opening room toward the targets. A rejection at 0.1184 and slip back through 0.1148 would warn of a deeper move toward the 0.0938 support and invalidate the scenario.
Do you want an alert if the next 1h candle closes above 0.1184 or taps 0.1148 first?
Not financial advice.
#OP #PriceActionNotes #UpsideLevels
After a +13.32% day, $OP trades at 0.1158 and sits just below the 0.1184 cap.
EMA20 (0.10904) above EMA50 (0.10823) with MACD positive supports momentum, but RSI 73.17 into resistance makes 0.1184 the key decision point.
📍 Potential entry: 0.1148
🎯 Target 1: 0.13643
🎯 Target 2: 0.15806
🛑 Stop / invalidation: 0.09317
Confirmation comes on a 1h close and hold above 0.1184, opening room toward the targets. A rejection at 0.1184 and slip back through 0.1148 would warn of a deeper move toward the 0.0938 support and invalidate the scenario.
Do you want an alert if the next 1h candle closes above 0.1184 or taps 0.1148 first?
Not financial advice.
#OP #PriceActionNotes #UpsideLevels
EMA20 (0.10904) above EMA50 (0.10823) with MACD positive supports momentum, but RSI 73.17 into resistance makes 0.1184 the key decision point.
📍 Potential entry: 0.1148
🎯 Target 1: 0.13643
🎯 Target 2: 0.15806
🛑 Stop / invalidation: 0.09317
Confirmation comes on a 1h close and hold above 0.1184, opening room toward the targets. A rejection at 0.1184 and slip back through 0.1148 would warn of a deeper move toward the 0.0938 support and invalidate the scenario.
Do you want an alert if the next 1h candle closes above 0.1184 or taps 0.1148 first?
Not financial advice.
#OP #PriceActionNotes #UpsideLevels
10
·
--
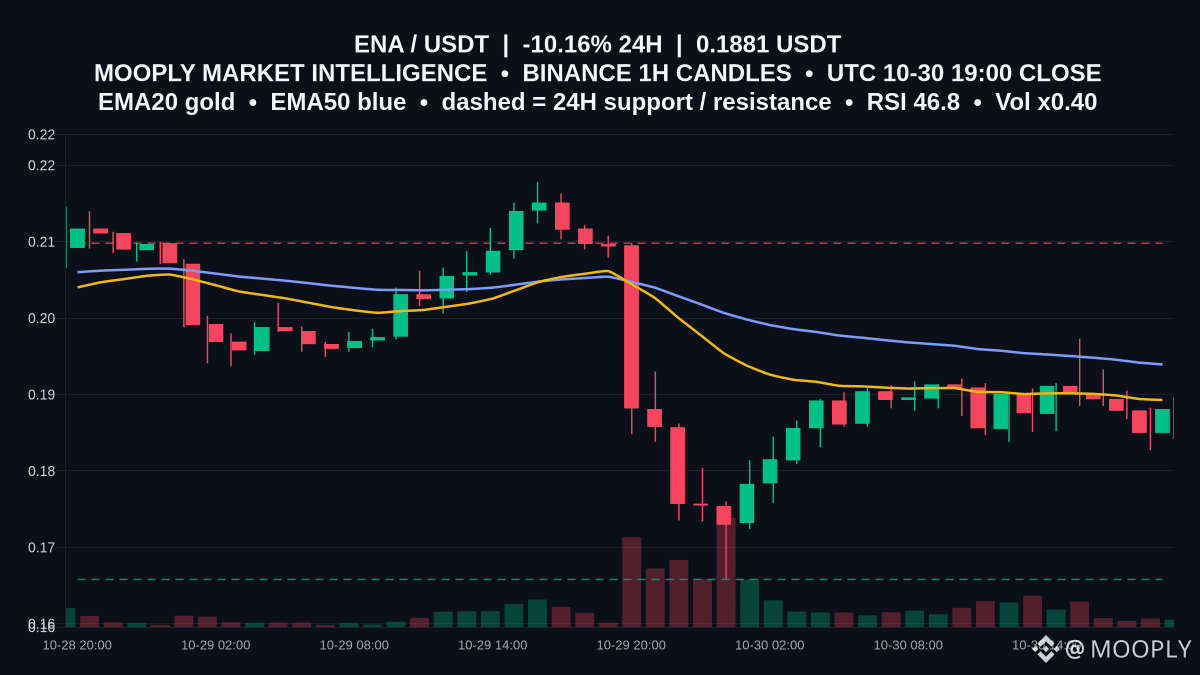
Range-bound but bruised: $ENA is trading at 0.1881 after a -10.157% 24h move, with activity muted at 0.4x recent volume.
Price sits just under EMA20 at 0.18929 and below EMA50 at 0.19394. MACD remains below zero but is above its signal, hinting momentum stabilization if 0.18929 is reclaimed. ATR at 0.00526 frames typical hourly swings.
Direction is RANGE. Resistance is 0.2098 and support is 0.1658; price is holding mid-band after a sharp dip and bounce.
The range view holds while hourly closes stay between 0.1658 and 0.2098, ideally with repeated defenses of 0.1658; it’s invalidated on a decisive 1h close above 0.2098 or below 0.1658. Are you watching for a clean reclaim of 0.18929 before any attempt toward 0.2098?
Not financial advice.
#ENA #PriceActionNotes #RangeLevels
Range-bound but bruised: $ENA is trading at 0.1881 after a -10.157% 24h move, with activity muted at 0.4x recent volume.
Price sits just under EMA20 at 0.18929 and below EMA50 at 0.19394. MACD remains below zero but is above its signal, hinting momentum stabilization if 0.18929 is reclaimed. ATR at 0.00526 frames typical hourly swings.
Direction is RANGE. Resistance is 0.2098 and support is 0.1658; price is holding mid-band after a sharp dip and bounce.
The range view holds while hourly closes stay between 0.1658 and 0.2098, ideally with repeated defenses of 0.1658; it’s invalidated on a decisive 1h close above 0.2098 or below 0.1658. Are you watching for a clean reclaim of 0.18929 before any attempt toward 0.2098?
Not financial advice.
#ENA #PriceActionNotes #RangeLevels
Price sits just under EMA20 at 0.18929 and below EMA50 at 0.19394. MACD remains below zero but is above its signal, hinting momentum stabilization if 0.18929 is reclaimed. ATR at 0.00526 frames typical hourly swings.
Direction is RANGE. Resistance is 0.2098 and support is 0.1658; price is holding mid-band after a sharp dip and bounce.
The range view holds while hourly closes stay between 0.1658 and 0.2098, ideally with repeated defenses of 0.1658; it’s invalidated on a decisive 1h close above 0.2098 or below 0.1658. Are you watching for a clean reclaim of 0.18929 before any attempt toward 0.2098?
Not financial advice.
#ENA #PriceActionNotes #RangeLevels
17
·
--
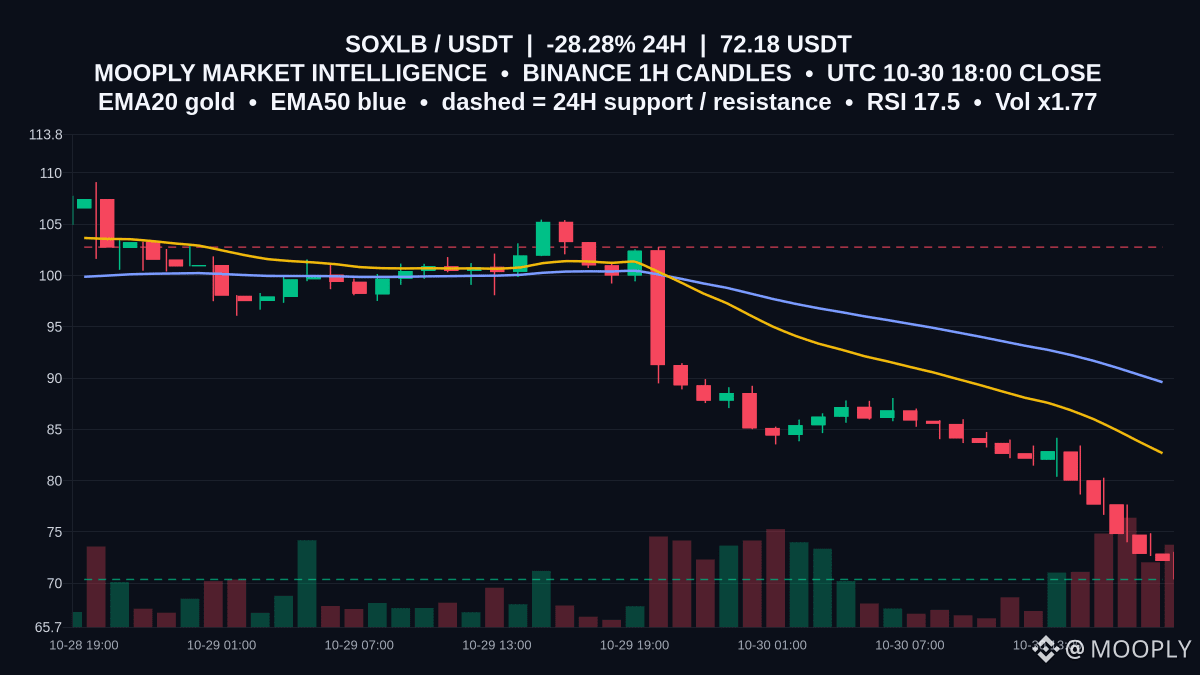
Whipsawed and deeply oversold, $SOXLB sits at 72.18 after a -28.283% day.
RSI 17.5 flags seller exhaustion, but price is well beneath a falling EMA20 at 82.675 and EMA50 at 89.599, so any bounce runs into layered resistance fast.
This reads as a range: 70.37 support versus 102.77 resistance. With ATR 2.579 and volume elevated (x1.77), probes of the floor can be noisy before direction is clear.
Confirmation looks like repeated 1h holds above 70.37 and a reclaim of 82.675; losing 70.37 would invalidate the range idea. A sustained push over 89.599 would put 102.77 back in play.
Are you waiting for a clean 1h close holding 70.37 before eyeing a mean‑reversion attempt?
Not financial advice.
#SOXLB #PriceActionNotes #RangeLevels
Whipsawed and deeply oversold, $SOXLB sits at 72.18 after a -28.283% day.
RSI 17.5 flags seller exhaustion, but price is well beneath a falling EMA20 at 82.675 and EMA50 at 89.599, so any bounce runs into layered resistance fast.
This reads as a range: 70.37 support versus 102.77 resistance. With ATR 2.579 and volume elevated (x1.77), probes of the floor can be noisy before direction is clear.
Confirmation looks like repeated 1h holds above 70.37 and a reclaim of 82.675; losing 70.37 would invalidate the range idea. A sustained push over 89.599 would put 102.77 back in play.
Are you waiting for a clean 1h close holding 70.37 before eyeing a mean‑reversion attempt?
Not financial advice.
#SOXLB #PriceActionNotes #RangeLevels
RSI 17.5 flags seller exhaustion, but price is well beneath a falling EMA20 at 82.675 and EMA50 at 89.599, so any bounce runs into layered resistance fast.
This reads as a range: 70.37 support versus 102.77 resistance. With ATR 2.579 and volume elevated (x1.77), probes of the floor can be noisy before direction is clear.
Confirmation looks like repeated 1h holds above 70.37 and a reclaim of 82.675; losing 70.37 would invalidate the range idea. A sustained push over 89.599 would put 102.77 back in play.
Are you waiting for a clean 1h close holding 70.37 before eyeing a mean‑reversion attempt?
Not financial advice.
#SOXLB #PriceActionNotes #RangeLevels
11
·
--
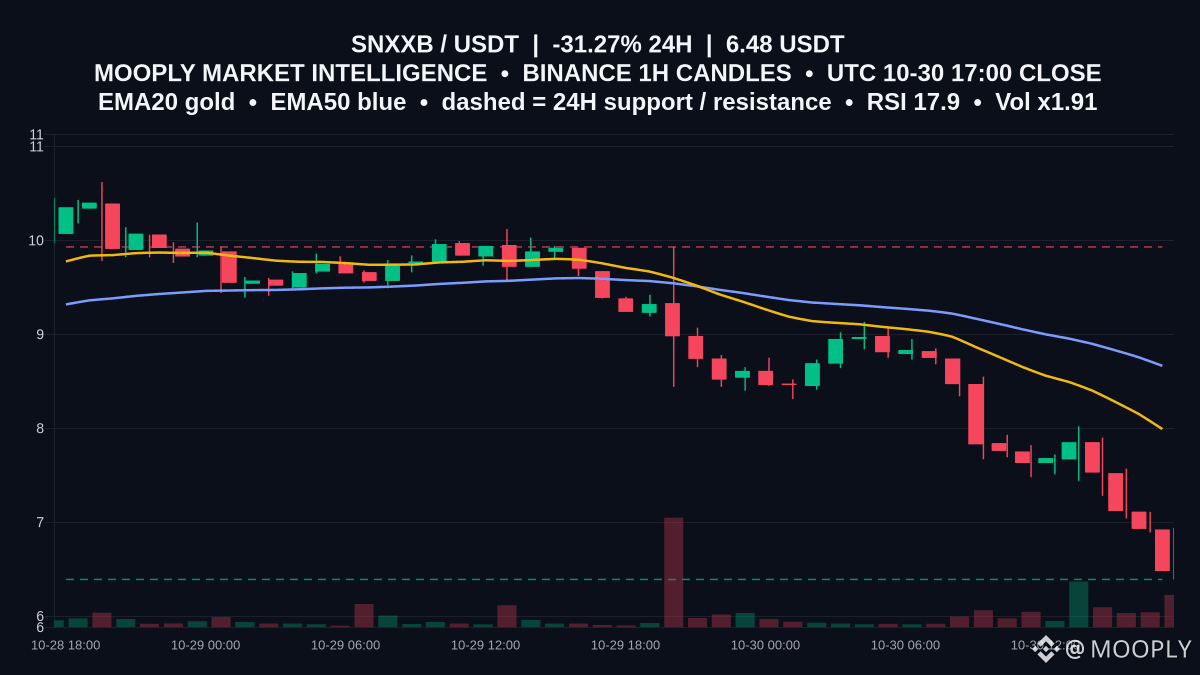
Volatility squeezed $SNXXB to 6.48 (-31.27% 24h) on 13,104,153.5594 volume across 46,667 trades.
RSI 17.86 flags oversold, but the tape is boxed between 6.39 support and 9.93 resistance. With EMA20 at 7.991 and EMA50 at 8.664 trending lower, rallies toward those averages often meet supply; MACD below signal (-0.61068942 vs -0.46382454) underscores momentum risk.
Range view: defend 6.39 on hourly closes to keep mean-reversion bounces toward 7.991/8.664 in play; a 1h close below 6.39 would undermine the floor, while only strength through 9.93 would shift control. ATR 0.399 frames 1h moves, and participation is elevated at 1.91x; the last 6h drop of -15.07 urges caution into spikes.
Which comes first on your watch: a hold at 6.39 or a retest of the EMA20 at 7.991?
Not financial advice.
#SNXXB #PriceActionNotes #RangeLevels
Volatility squeezed $SNXXB to 6.48 (-31.27% 24h) on 13,104,153.5594 volume across 46,667 trades.
RSI 17.86 flags oversold, but the tape is boxed between 6.39 support and 9.93 resistance. With EMA20 at 7.991 and EMA50 at 8.664 trending lower, rallies toward those averages often meet supply; MACD below signal (-0.61068942 vs -0.46382454) underscores momentum risk.
Range view: defend 6.39 on hourly closes to keep mean-reversion bounces toward 7.991/8.664 in play; a 1h close below 6.39 would undermine the floor, while only strength through 9.93 would shift control. ATR 0.399 frames 1h moves, and participation is elevated at 1.91x; the last 6h drop of -15.07 urges caution into spikes.
Which comes first on your watch: a hold at 6.39 or a retest of the EMA20 at 7.991?
Not financial advice.
#SNXXB #PriceActionNotes #RangeLevels
RSI 17.86 flags oversold, but the tape is boxed between 6.39 support and 9.93 resistance. With EMA20 at 7.991 and EMA50 at 8.664 trending lower, rallies toward those averages often meet supply; MACD below signal (-0.61068942 vs -0.46382454) underscores momentum risk.
Range view: defend 6.39 on hourly closes to keep mean-reversion bounces toward 7.991/8.664 in play; a 1h close below 6.39 would undermine the floor, while only strength through 9.93 would shift control. ATR 0.399 frames 1h moves, and participation is elevated at 1.91x; the last 6h drop of -15.07 urges caution into spikes.
Which comes first on your watch: a hold at 6.39 or a retest of the EMA20 at 7.991?
Not financial advice.
#SNXXB #PriceActionNotes #RangeLevels
4
·
--
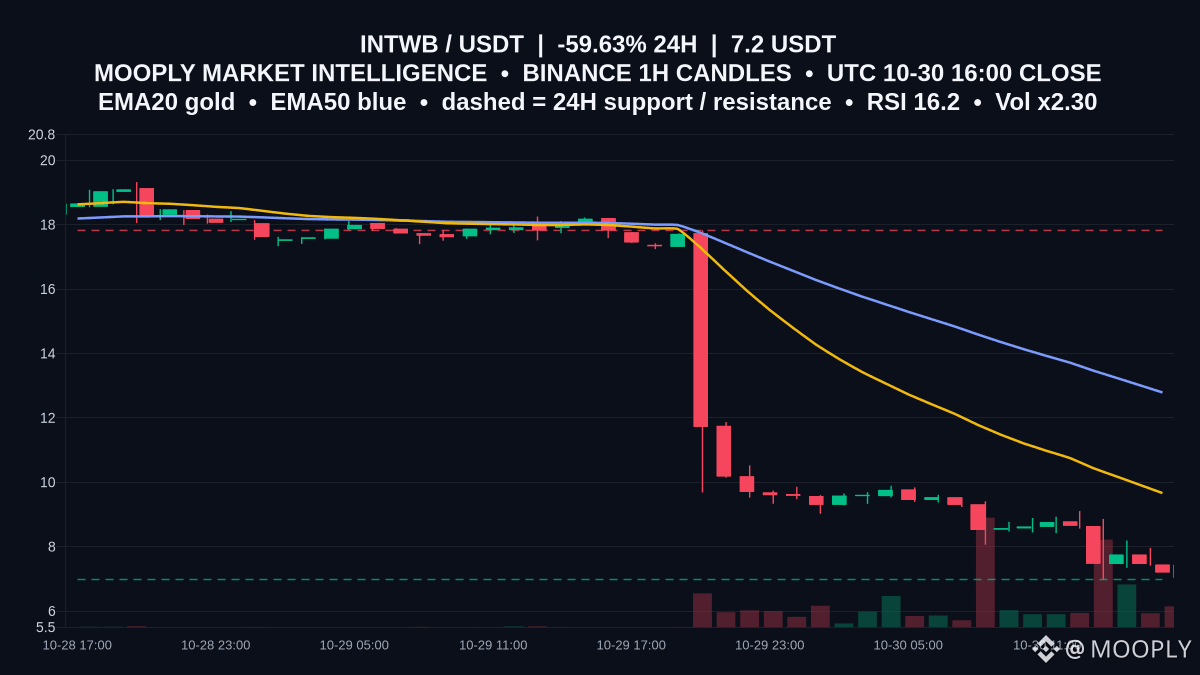
Steep slide grips $INTWB: price at 7.2, -59.628% over 24h, with 19,441,773.0223 in volume and 146,748 trades.
RSI at 16.18 flags extreme short‑term exhaustion, but price sits well below EMA20 9.662 and EMA50 12.787, keeping momentum heavy. ATR 0.612 points to brisk intraday volatility.
Direction: RANGE. Support is 6.98 and resistance is 17.82. Sitting just above 6.98, a hold can foster a rebound toward 9.662; a 1h close below 6.98 would further undermine the base. If buyers reclaim 9.662 on a close, 12.787 becomes the next pivot, while 17.82 remains the ceiling. Which level are you watching first: 6.98 holding or a close back above 9.662?
Not financial advice.
#INTWB #PriceActionNotes #RangeLevels
Steep slide grips $INTWB : price at 7.2, -59.628% over 24h, with 19,441,773.0223 in volume and 146,748 trades.
RSI at 16.18 flags extreme short‑term exhaustion, but price sits well below EMA20 9.662 and EMA50 12.787, keeping momentum heavy. ATR 0.612 points to brisk intraday volatility.
Direction: RANGE. Support is 6.98 and resistance is 17.82. Sitting just above 6.98, a hold can foster a rebound toward 9.662; a 1h close below 6.98 would further undermine the base. If buyers reclaim 9.662 on a close, 12.787 becomes the next pivot, while 17.82 remains the ceiling. Which level are you watching first: 6.98 holding or a close back above 9.662?
Not financial advice.
#INTWB #PriceActionNotes #RangeLevels
RSI at 16.18 flags extreme short‑term exhaustion, but price sits well below EMA20 9.662 and EMA50 12.787, keeping momentum heavy. ATR 0.612 points to brisk intraday volatility.
Direction: RANGE. Support is 6.98 and resistance is 17.82. Sitting just above 6.98, a hold can foster a rebound toward 9.662; a 1h close below 6.98 would further undermine the base. If buyers reclaim 9.662 on a close, 12.787 becomes the next pivot, while 17.82 remains the ceiling. Which level are you watching first: 6.98 holding or a close back above 9.662?
Not financial advice.
#INTWB #PriceActionNotes #RangeLevels
17
·
--
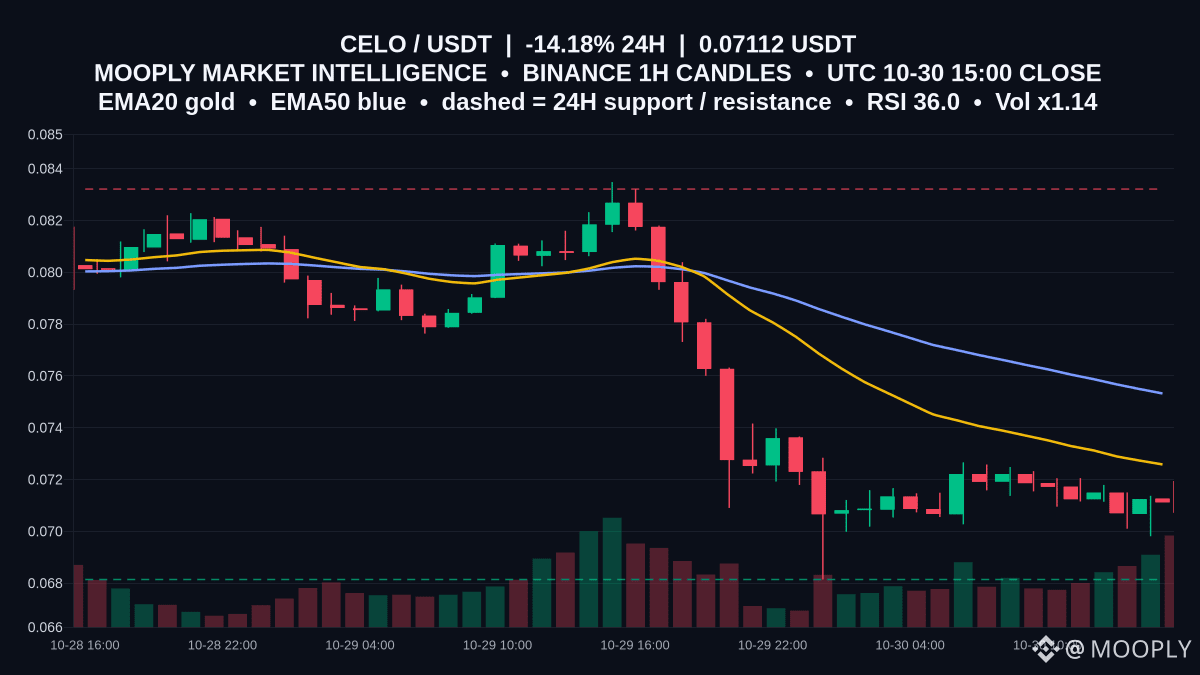
Selloff grips $CELO, trading at 0.07112, down 14.18% over 24h.
On the 1h view, price is below EMA20 at 0.07258 and EMA50 at 0.07532, with RSI at 36.04 and a negative MACD, signaling weak momentum. ATR at 0.00117 and slightly elevated turnover (1.14) point to active but contained swings.
Range context: support sits at 0.06814 and resistance at 0.08321. The range thesis holds while buyers defend 0.06814 and rallies stall beneath 0.08321; an hourly close below 0.06814 would invalidate this, while acceptance above 0.08321 would shift bias upward. Which boundary will price test first, 0.06814 or 0.08321?
Not financial advice.
#CELO #PriceActionNotes #RangeLevels
Selloff grips $CELO , trading at 0.07112, down 14.18% over 24h.
On the 1h view, price is below EMA20 at 0.07258 and EMA50 at 0.07532, with RSI at 36.04 and a negative MACD, signaling weak momentum. ATR at 0.00117 and slightly elevated turnover (1.14) point to active but contained swings.
Range context: support sits at 0.06814 and resistance at 0.08321. The range thesis holds while buyers defend 0.06814 and rallies stall beneath 0.08321; an hourly close below 0.06814 would invalidate this, while acceptance above 0.08321 would shift bias upward. Which boundary will price test first, 0.06814 or 0.08321?
Not financial advice.
#CELO #PriceActionNotes #RangeLevels
On the 1h view, price is below EMA20 at 0.07258 and EMA50 at 0.07532, with RSI at 36.04 and a negative MACD, signaling weak momentum. ATR at 0.00117 and slightly elevated turnover (1.14) point to active but contained swings.
Range context: support sits at 0.06814 and resistance at 0.08321. The range thesis holds while buyers defend 0.06814 and rallies stall beneath 0.08321; an hourly close below 0.06814 would invalidate this, while acceptance above 0.08321 would shift bias upward. Which boundary will price test first, 0.06814 or 0.08321?
Not financial advice.
#CELO #PriceActionNotes #RangeLevels
8
·
--
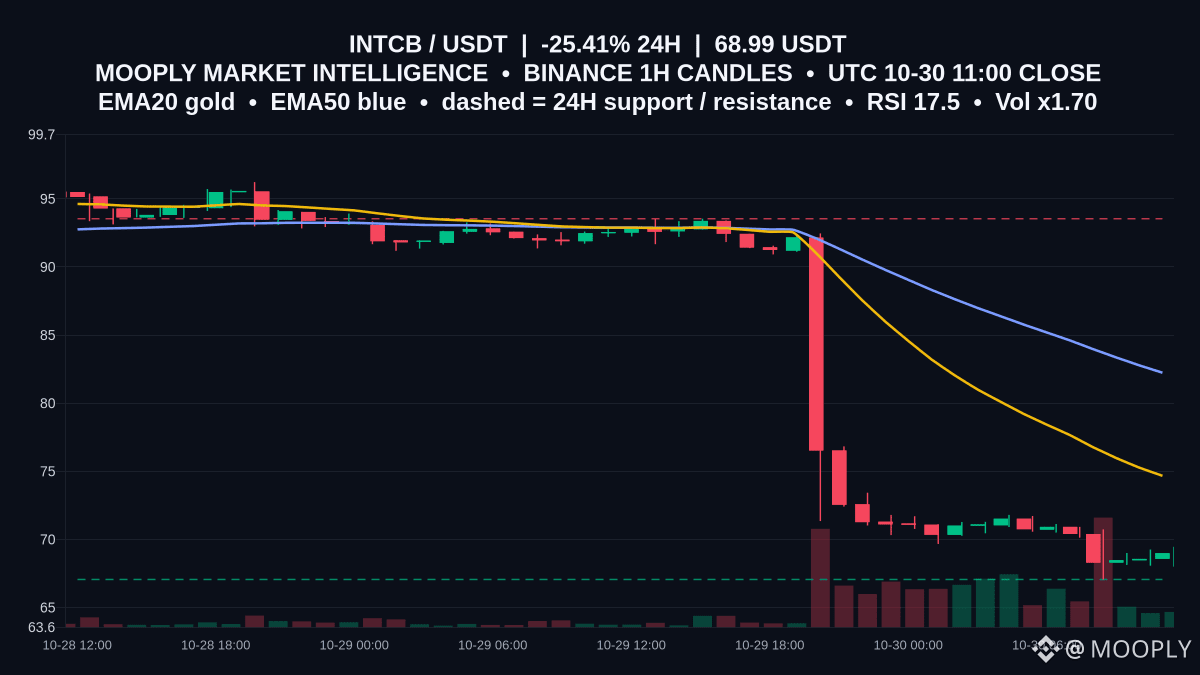
Down -25.411% in 24h, $INTCB sits at 68.99, perched just above a mapped floor.
RSI at 17.49 signals extreme short‑term exhaustion, yet the trend bias remains down with EMA20 at 74.668 below EMA50 at 82.235. That makes the nearby levels do the heavy lifting.
Range view: support at 67.06 and resistance at 93.54 define the box. Holding 67.06 keeps the base intact, while 93.54 has capped rebounds.
Confirmation comes from repeated hourly closes above 67.06 and a reclaim of 74.668; invalidation is an hourly close below 67.06. Strength toward the top requires clearing 82.235 on the way to 93.54.
Do you want updates if price tests 67.06 again or if it starts reclaiming 74.668?
Not financial advice.
#INTCB #PriceActionNotes #RangeLevels
Down -25.411% in 24h, $INTCB sits at 68.99, perched just above a mapped floor.
RSI at 17.49 signals extreme short‑term exhaustion, yet the trend bias remains down with EMA20 at 74.668 below EMA50 at 82.235. That makes the nearby levels do the heavy lifting.
Range view: support at 67.06 and resistance at 93.54 define the box. Holding 67.06 keeps the base intact, while 93.54 has capped rebounds.
Confirmation comes from repeated hourly closes above 67.06 and a reclaim of 74.668; invalidation is an hourly close below 67.06. Strength toward the top requires clearing 82.235 on the way to 93.54.
Do you want updates if price tests 67.06 again or if it starts reclaiming 74.668?
Not financial advice.
#INTCB #PriceActionNotes #RangeLevels
RSI at 17.49 signals extreme short‑term exhaustion, yet the trend bias remains down with EMA20 at 74.668 below EMA50 at 82.235. That makes the nearby levels do the heavy lifting.
Range view: support at 67.06 and resistance at 93.54 define the box. Holding 67.06 keeps the base intact, while 93.54 has capped rebounds.
Confirmation comes from repeated hourly closes above 67.06 and a reclaim of 74.668; invalidation is an hourly close below 67.06. Strength toward the top requires clearing 82.235 on the way to 93.54.
Do you want updates if price tests 67.06 again or if it starts reclaiming 74.668?
Not financial advice.
#INTCB #PriceActionNotes #RangeLevels
8
·
--
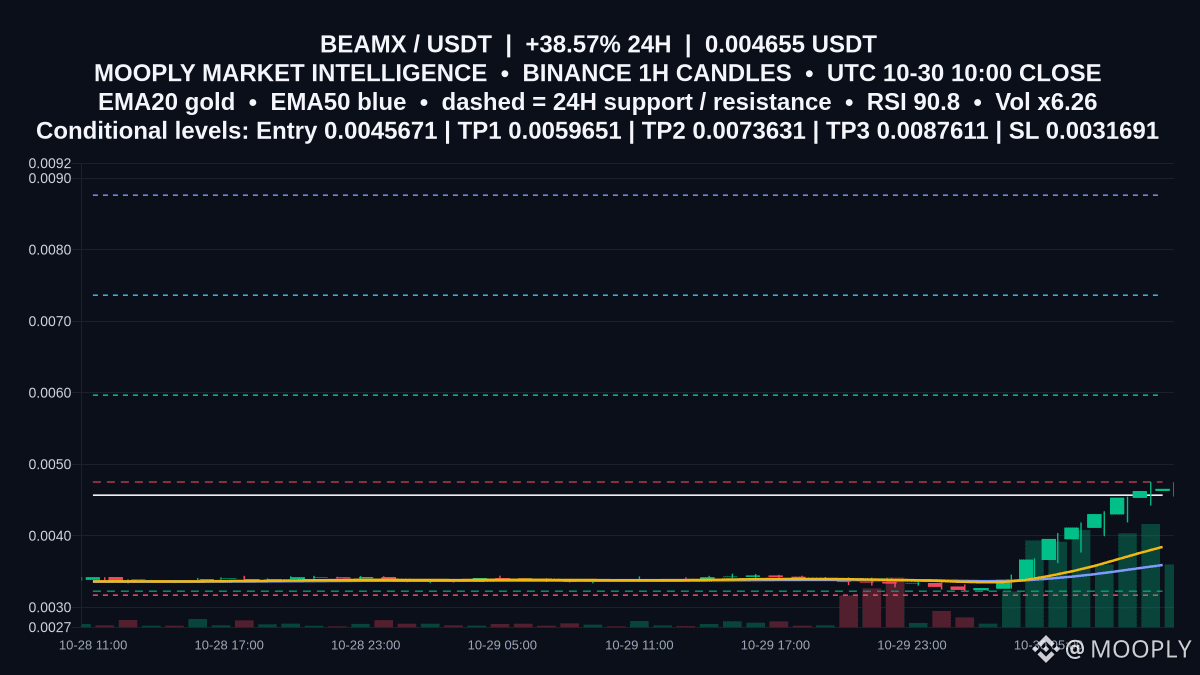
Momentum has snapped awake for $BEAMX: +38.569% in 24h to 0.004655 with volume x6.26.
RSI 90.84 flags an overextended push, yet EMA20 0.0038445 > EMA50 0.0035912 and a positive MACD keep trend bias constructive. The nearby 0.004751 resistance is the key pivot; 0.003224 is the support to defend.
📍 Potential entry: 0.0045671
🎯 Target 1: 0.0059651
🎯 Target 2: 0.0073631
🛑 Stop / invalidation: 0.0031691
Confirmation would be a clean 1h close and hold above 0.004751, opening room toward 0.0059651 and 0.0073631. Failure to reclaim 0.0045671 with drift toward 0.003224 warns of exhaustion; below 0.0031691 the scenario is invalid.
Want an alert on the next hourly close relative to 0.004751?
Not financial advice.
#BEAMX #PriceActionNotes #UpsideLevels
Momentum has snapped awake for $BEAMX : +38.569% in 24h to 0.004655 with volume x6.26.
RSI 90.84 flags an overextended push, yet EMA20 0.0038445 > EMA50 0.0035912 and a positive MACD keep trend bias constructive. The nearby 0.004751 resistance is the key pivot; 0.003224 is the support to defend.
📍 Potential entry: 0.0045671
🎯 Target 1: 0.0059651
🎯 Target 2: 0.0073631
🛑 Stop / invalidation: 0.0031691
Confirmation would be a clean 1h close and hold above 0.004751, opening room toward 0.0059651 and 0.0073631. Failure to reclaim 0.0045671 with drift toward 0.003224 warns of exhaustion; below 0.0031691 the scenario is invalid.
Want an alert on the next hourly close relative to 0.004751?
Not financial advice.
#BEAMX #PriceActionNotes #UpsideLevels
RSI 90.84 flags an overextended push, yet EMA20 0.0038445 > EMA50 0.0035912 and a positive MACD keep trend bias constructive. The nearby 0.004751 resistance is the key pivot; 0.003224 is the support to defend.
📍 Potential entry: 0.0045671
🎯 Target 1: 0.0059651
🎯 Target 2: 0.0073631
🛑 Stop / invalidation: 0.0031691
Confirmation would be a clean 1h close and hold above 0.004751, opening room toward 0.0059651 and 0.0073631. Failure to reclaim 0.0045671 with drift toward 0.003224 warns of exhaustion; below 0.0031691 the scenario is invalid.
Want an alert on the next hourly close relative to 0.004751?
Not financial advice.
#BEAMX #PriceActionNotes #UpsideLevels
8
·
--
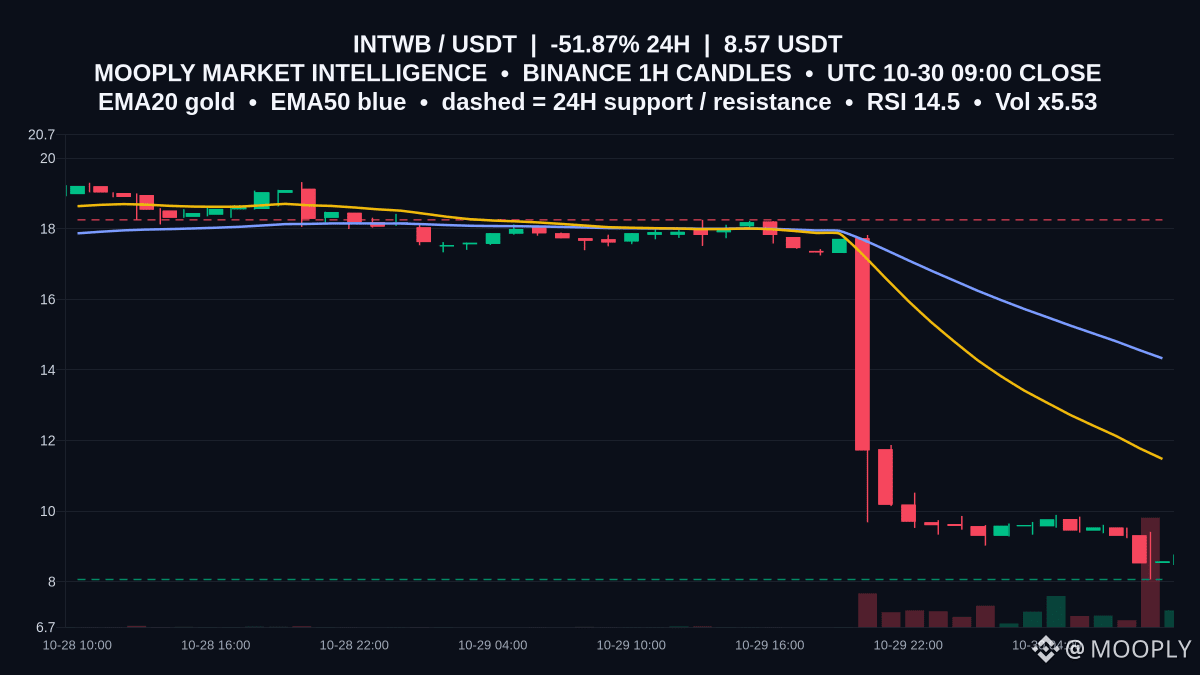
After a -51.871% 24h slide, $INTWB is parked just above a make-or-break floor.
Price at 8.57 hovers over 8.06 support, with RSI 14.53 very weak and EMA20 11.474 below EMA50 14.325. That matters because falling EMAs tend to act as layered resistance, capping rebounds until momentum steadies.
Range view: support 8.06, resistance 18.25. The range idea holds while hourly closes defend 8.06; a reclaim of 11.474, then 14.325 would be the first constructive steps toward 18.25. A decisive hourly close below 8.06 would invalidate this floor and keep downside pressure active.
Which level are you watching on the next 1h close first: 8.06 or 11.474?
Not financial advice.
#INTWB #PriceActionNotes #RangeLevels
After a -51.871% 24h slide, $INTWB is parked just above a make-or-break floor.
Price at 8.57 hovers over 8.06 support, with RSI 14.53 very weak and EMA20 11.474 below EMA50 14.325. That matters because falling EMAs tend to act as layered resistance, capping rebounds until momentum steadies.
Range view: support 8.06, resistance 18.25. The range idea holds while hourly closes defend 8.06; a reclaim of 11.474, then 14.325 would be the first constructive steps toward 18.25. A decisive hourly close below 8.06 would invalidate this floor and keep downside pressure active.
Which level are you watching on the next 1h close first: 8.06 or 11.474?
Not financial advice.
#INTWB #PriceActionNotes #RangeLevels
Price at 8.57 hovers over 8.06 support, with RSI 14.53 very weak and EMA20 11.474 below EMA50 14.325. That matters because falling EMAs tend to act as layered resistance, capping rebounds until momentum steadies.
Range view: support 8.06, resistance 18.25. The range idea holds while hourly closes defend 8.06; a reclaim of 11.474, then 14.325 would be the first constructive steps toward 18.25. A decisive hourly close below 8.06 would invalidate this floor and keep downside pressure active.
Which level are you watching on the next 1h close first: 8.06 or 11.474?
Not financial advice.
#INTWB #PriceActionNotes #RangeLevels
11
·
--
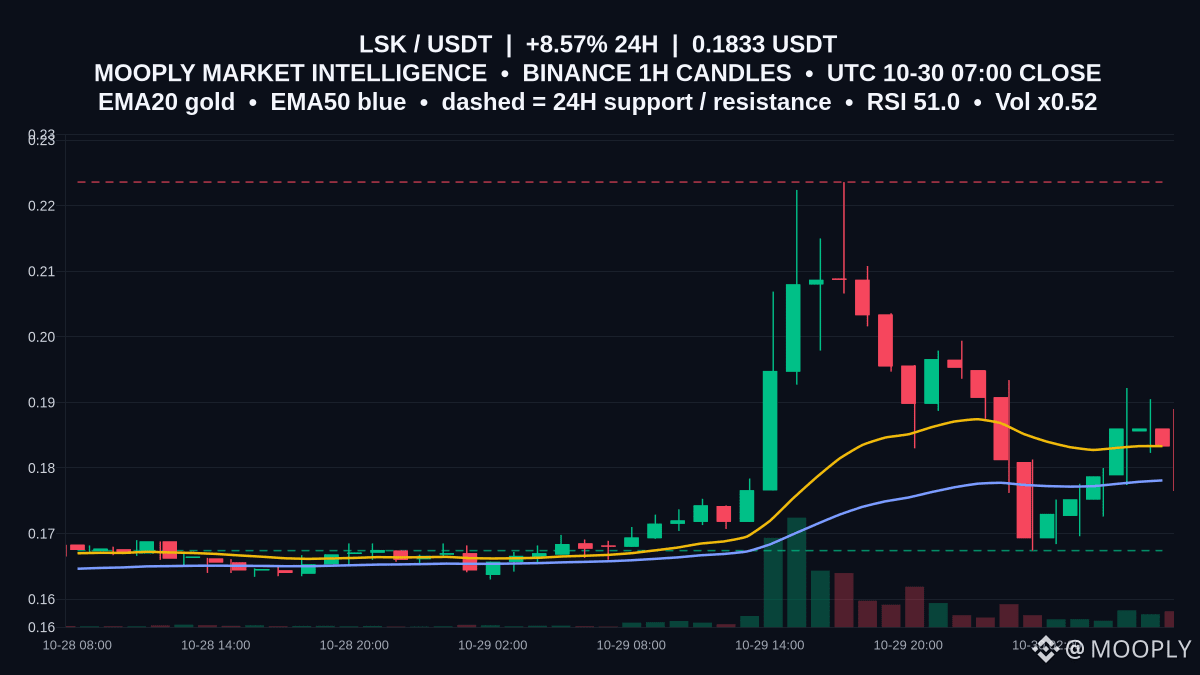
Snug against its moving pivot, $LSK is up 8.566% at 0.1833, kissing the 1h EMA20 at 0.18333.
EMA20 above EMA50 (0.18333 > 0.17811) hints at short‑term control, yet RSI 51.01, MACD below its signal (0.00121773 < 0.0027189), and a muted volume pace (x0.52) keep things balanced. That makes the band crucial: support at 0.1674 and resistance at 0.2236.
In a range context, buyers can probe toward 0.2236 while defending the 0.17811–0.1674 zone. An hourly close above 0.2236 would confirm expansion; a close beneath 0.1674 would signal a breakdown beyond support.
Are you prioritizing a clean break of 0.2236 or a retest of 0.1674 first?
Not financial advice.
#LSK #PriceActionNotes #RangeLevels
Snug against its moving pivot, $LSK is up 8.566% at 0.1833, kissing the 1h EMA20 at 0.18333.
EMA20 above EMA50 (0.18333 > 0.17811) hints at short‑term control, yet RSI 51.01, MACD below its signal (0.00121773 < 0.0027189), and a muted volume pace (x0.52) keep things balanced. That makes the band crucial: support at 0.1674 and resistance at 0.2236.
In a range context, buyers can probe toward 0.2236 while defending the 0.17811–0.1674 zone. An hourly close above 0.2236 would confirm expansion; a close beneath 0.1674 would signal a breakdown beyond support.
Are you prioritizing a clean break of 0.2236 or a retest of 0.1674 first?
Not financial advice.
#LSK #PriceActionNotes #RangeLevels
EMA20 above EMA50 (0.18333 > 0.17811) hints at short‑term control, yet RSI 51.01, MACD below its signal (0.00121773 < 0.0027189), and a muted volume pace (x0.52) keep things balanced. That makes the band crucial: support at 0.1674 and resistance at 0.2236.
In a range context, buyers can probe toward 0.2236 while defending the 0.17811–0.1674 zone. An hourly close above 0.2236 would confirm expansion; a close beneath 0.1674 would signal a breakdown beyond support.
Are you prioritizing a clean break of 0.2236 or a retest of 0.1674 first?
Not financial advice.
#LSK #PriceActionNotes #RangeLevels
100
·
--
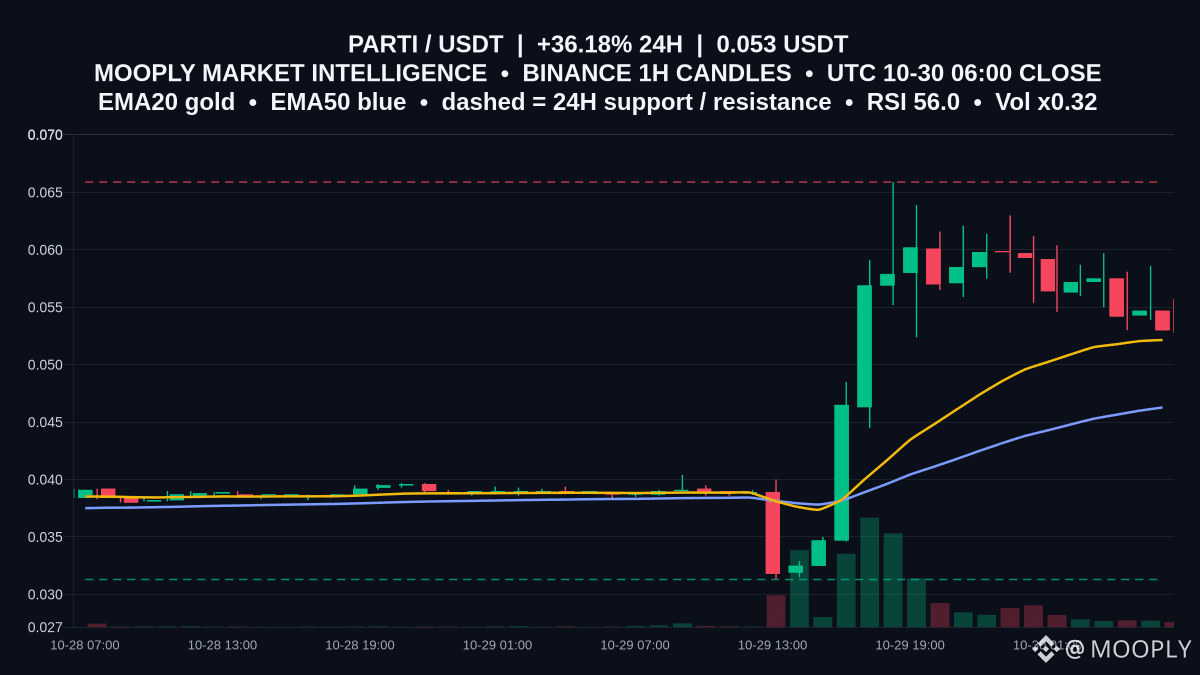
$PARTI is trading at 0.053 after a 36.176% 24h pop, but the last 6h slipped -10.62%, flagging a pause.
Why it matters: EMA20 at 0.05215 sits above EMA50 at 0.04628, a constructive short‑term tilt, yet RSI 56.01 with MACD below its signal suggests momentum is cooling rather than accelerating.
Range context: resistance stands at 0.0659 and support at 0.0313. With ATR14 at 0.00634, it likely takes multiple 1h sessions to traverse the full band, and recent wicks failed under 0.0659.
A 1h close and sustained hold above 0.0659 would shift bias higher; slipping back under 0.05215 exposes 0.04628, while losing 0.0313 would break the range idea. Which level do you expect to be tested first: 0.0659 or 0.0313?
Not financial advice.
#PARTI #PriceActionNotes #RangeLevels
$PARTI is trading at 0.053 after a 36.176% 24h pop, but the last 6h slipped -10.62%, flagging a pause.
Why it matters: EMA20 at 0.05215 sits above EMA50 at 0.04628, a constructive short‑term tilt, yet RSI 56.01 with MACD below its signal suggests momentum is cooling rather than accelerating.
Range context: resistance stands at 0.0659 and support at 0.0313. With ATR14 at 0.00634, it likely takes multiple 1h sessions to traverse the full band, and recent wicks failed under 0.0659.
A 1h close and sustained hold above 0.0659 would shift bias higher; slipping back under 0.05215 exposes 0.04628, while losing 0.0313 would break the range idea. Which level do you expect to be tested first: 0.0659 or 0.0313?
Not financial advice.
#PARTI #PriceActionNotes #RangeLevels
Why it matters: EMA20 at 0.05215 sits above EMA50 at 0.04628, a constructive short‑term tilt, yet RSI 56.01 with MACD below its signal suggests momentum is cooling rather than accelerating.
Range context: resistance stands at 0.0659 and support at 0.0313. With ATR14 at 0.00634, it likely takes multiple 1h sessions to traverse the full band, and recent wicks failed under 0.0659.
A 1h close and sustained hold above 0.0659 would shift bias higher; slipping back under 0.05215 exposes 0.04628, while losing 0.0313 would break the range idea. Which level do you expect to be tested first: 0.0659 or 0.0313?
Not financial advice.
#PARTI #PriceActionNotes #RangeLevels
161
·
--
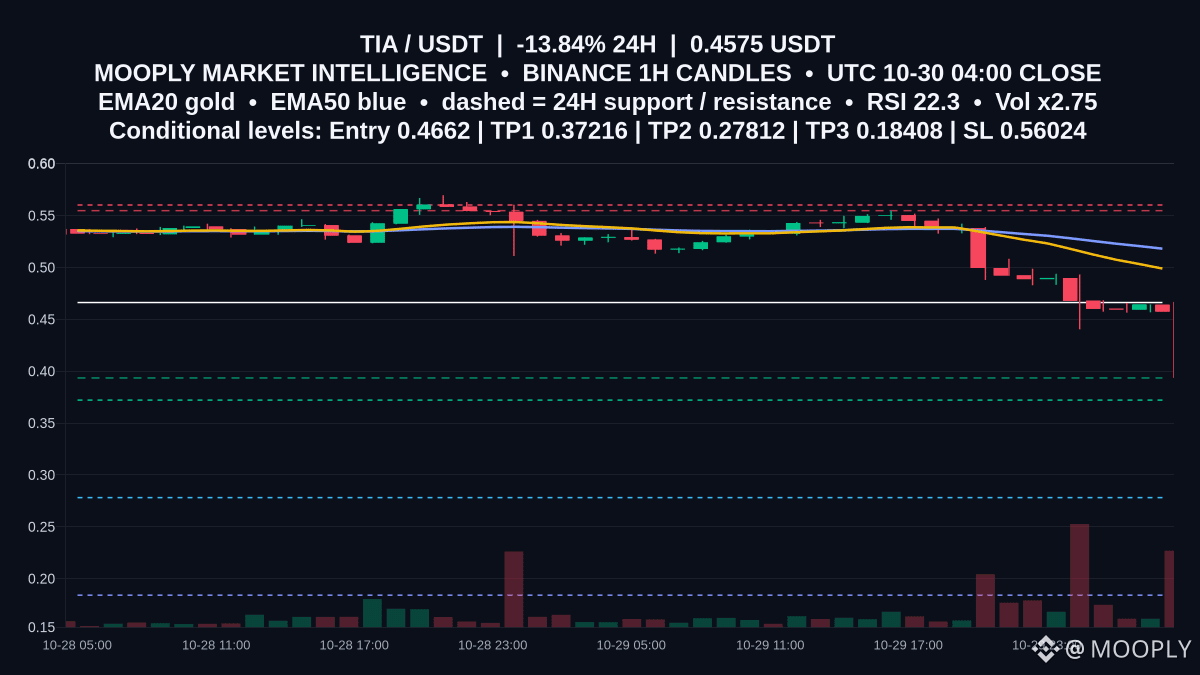
Fresh downside momentum: -13.838% in 24h puts $TIA at 0.4575, with volume running 2.75x its recent pace.
RSI 22.27 is stretched, yet price sits under EMA20 0.49896 and EMA50 0.51815—trend still skewed lower. Key resistance is 0.5548; nearest support 0.3935.
📍 Potential entry: 0.4662
🎯 Target 1: 0.37216
🎯 Target 2: 0.27812
🛑 Stop / invalidation: 0.56024
Bearish continuation is favored if a bounce toward 0.4662 fails and hourly closes stay beneath 0.49896/0.51815, keeping 0.3935 in play. A firm close above 0.5548 or a move to 0.56024 would invalidate.
Would you wait for a rejection near 0.4662, or prefer a clean breakdown toward 0.3935 before engaging?
Not financial advice.
#TIA #PriceActionNotes #DownsideLevels
Fresh downside momentum: -13.838% in 24h puts $TIA at 0.4575, with volume running 2.75x its recent pace.
RSI 22.27 is stretched, yet price sits under EMA20 0.49896 and EMA50 0.51815—trend still skewed lower. Key resistance is 0.5548; nearest support 0.3935.
📍 Potential entry: 0.4662
🎯 Target 1: 0.37216
🎯 Target 2: 0.27812
🛑 Stop / invalidation: 0.56024
Bearish continuation is favored if a bounce toward 0.4662 fails and hourly closes stay beneath 0.49896/0.51815, keeping 0.3935 in play. A firm close above 0.5548 or a move to 0.56024 would invalidate.
Would you wait for a rejection near 0.4662, or prefer a clean breakdown toward 0.3935 before engaging?
Not financial advice.
#TIA #PriceActionNotes #DownsideLevels
RSI 22.27 is stretched, yet price sits under EMA20 0.49896 and EMA50 0.51815—trend still skewed lower. Key resistance is 0.5548; nearest support 0.3935.
📍 Potential entry: 0.4662
🎯 Target 1: 0.37216
🎯 Target 2: 0.27812
🛑 Stop / invalidation: 0.56024
Bearish continuation is favored if a bounce toward 0.4662 fails and hourly closes stay beneath 0.49896/0.51815, keeping 0.3935 in play. A firm close above 0.5548 or a move to 0.56024 would invalidate.
Would you wait for a rejection near 0.4662, or prefer a clean breakdown toward 0.3935 before engaging?
Not financial advice.
#TIA #PriceActionNotes #DownsideLevels
119
·
--
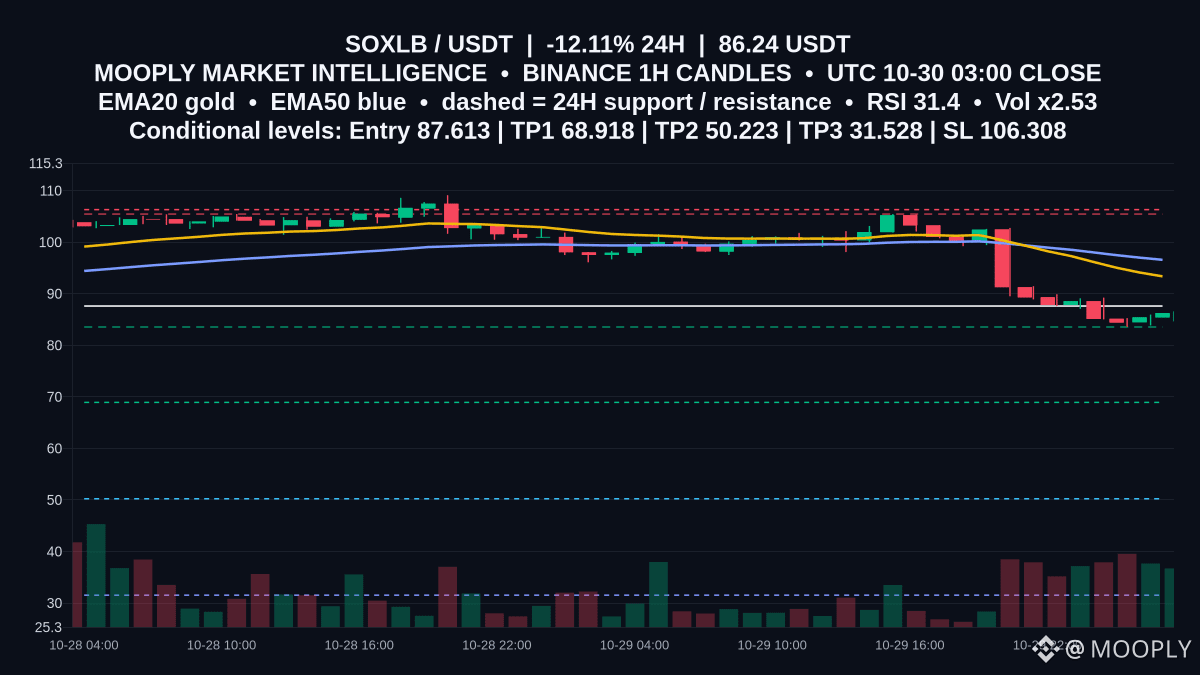
Heavy sellers clamp down on $SOXLB: -12.114% in 24h to 86.24, on 36,716,268.6982 volume and 146,125 trades.
Price sits beneath falling EMA20/EMA50 (93.365/96.58) with RSI at 31.38 and volume up 2.53x, making 83.54 a pivotal support to watch; 105.45 is the ceiling that defines the bear risk boundary.
📍 Potential entry: 87.613
🎯 Target 1: 68.918
🎯 Target 2: 50.223
🛑 Stop / invalidation: 106.308
A retest toward 87.613 that stalls below the EMAs would keep downside pressure, with a break of 83.54 opening room toward 68.918. A firm hourly close above 105.45—or tagging 106.308—would invalidate and signal momentum repair. Will buyers defend 83.54 on the next test, or does price slide toward 68.918 next?
Not financial advice.
#SOXLB #PriceActionNotes #DownsideLevels
Heavy sellers clamp down on $SOXLB : -12.114% in 24h to 86.24, on 36,716,268.6982 volume and 146,125 trades.
Price sits beneath falling EMA20/EMA50 (93.365/96.58) with RSI at 31.38 and volume up 2.53x, making 83.54 a pivotal support to watch; 105.45 is the ceiling that defines the bear risk boundary.
📍 Potential entry: 87.613
🎯 Target 1: 68.918
🎯 Target 2: 50.223
🛑 Stop / invalidation: 106.308
A retest toward 87.613 that stalls below the EMAs would keep downside pressure, with a break of 83.54 opening room toward 68.918. A firm hourly close above 105.45—or tagging 106.308—would invalidate and signal momentum repair. Will buyers defend 83.54 on the next test, or does price slide toward 68.918 next?
Not financial advice.
#SOXLB #PriceActionNotes #DownsideLevels
Price sits beneath falling EMA20/EMA50 (93.365/96.58) with RSI at 31.38 and volume up 2.53x, making 83.54 a pivotal support to watch; 105.45 is the ceiling that defines the bear risk boundary.
📍 Potential entry: 87.613
🎯 Target 1: 68.918
🎯 Target 2: 50.223
🛑 Stop / invalidation: 106.308
A retest toward 87.613 that stalls below the EMAs would keep downside pressure, with a break of 83.54 opening room toward 68.918. A firm hourly close above 105.45—or tagging 106.308—would invalidate and signal momentum repair. Will buyers defend 83.54 on the next test, or does price slide toward 68.918 next?
Not financial advice.
#SOXLB #PriceActionNotes #DownsideLevels
59
Log in to explore more content
Join global crypto users on Binance Square
⚡️ Get latest and useful information about crypto.
💬 Trusted by the world’s largest crypto exchange.
👍 Discover real insights from verified creators.
Email / Phone number
Trending Topics
1
#BTCReboundsAbove$60KAmidWhaleDipBuying
21,702 views
141 Discussing
2
#SolanaSets2027RoadmapToDoubleComputeCapacity
5,920 views
217 Discussing
3
#CaliforniaNvidiaProbeExaminesPotentialCriminalViolations
2,986 views
42 Discussing
4
#BlackRockLaunchesHKDollarDigitalLiquidityFund
6,857 views
210 Discussing
5
#NvidiaLoses$2.7TrillionInMonthAndAHalf
53,840 views
249 Discussing
6
#GlobalStocksFaceLongestLosingStreakSince2023
453,121 views
2,915 Discussing
7
#BlackRockIBITPostsRecord$541MSingleDayOutflow
70,596 views
157 Discussing
8
#AnthropicPlungesTowardIPOPriceonDay2
246,777 views
1,917 Discussing
9
#TwentyOneCapitalAdds172.25BTC
122,603 views
1,278 Discussing
10
#HKBillWouldExcludeTokenizedDepositsFromVirtualAssets
15,606 views
89 Discussing