
#spx500
spx500
20,014 views
69 Discussing
Hot
Latest

·
--
Bearish
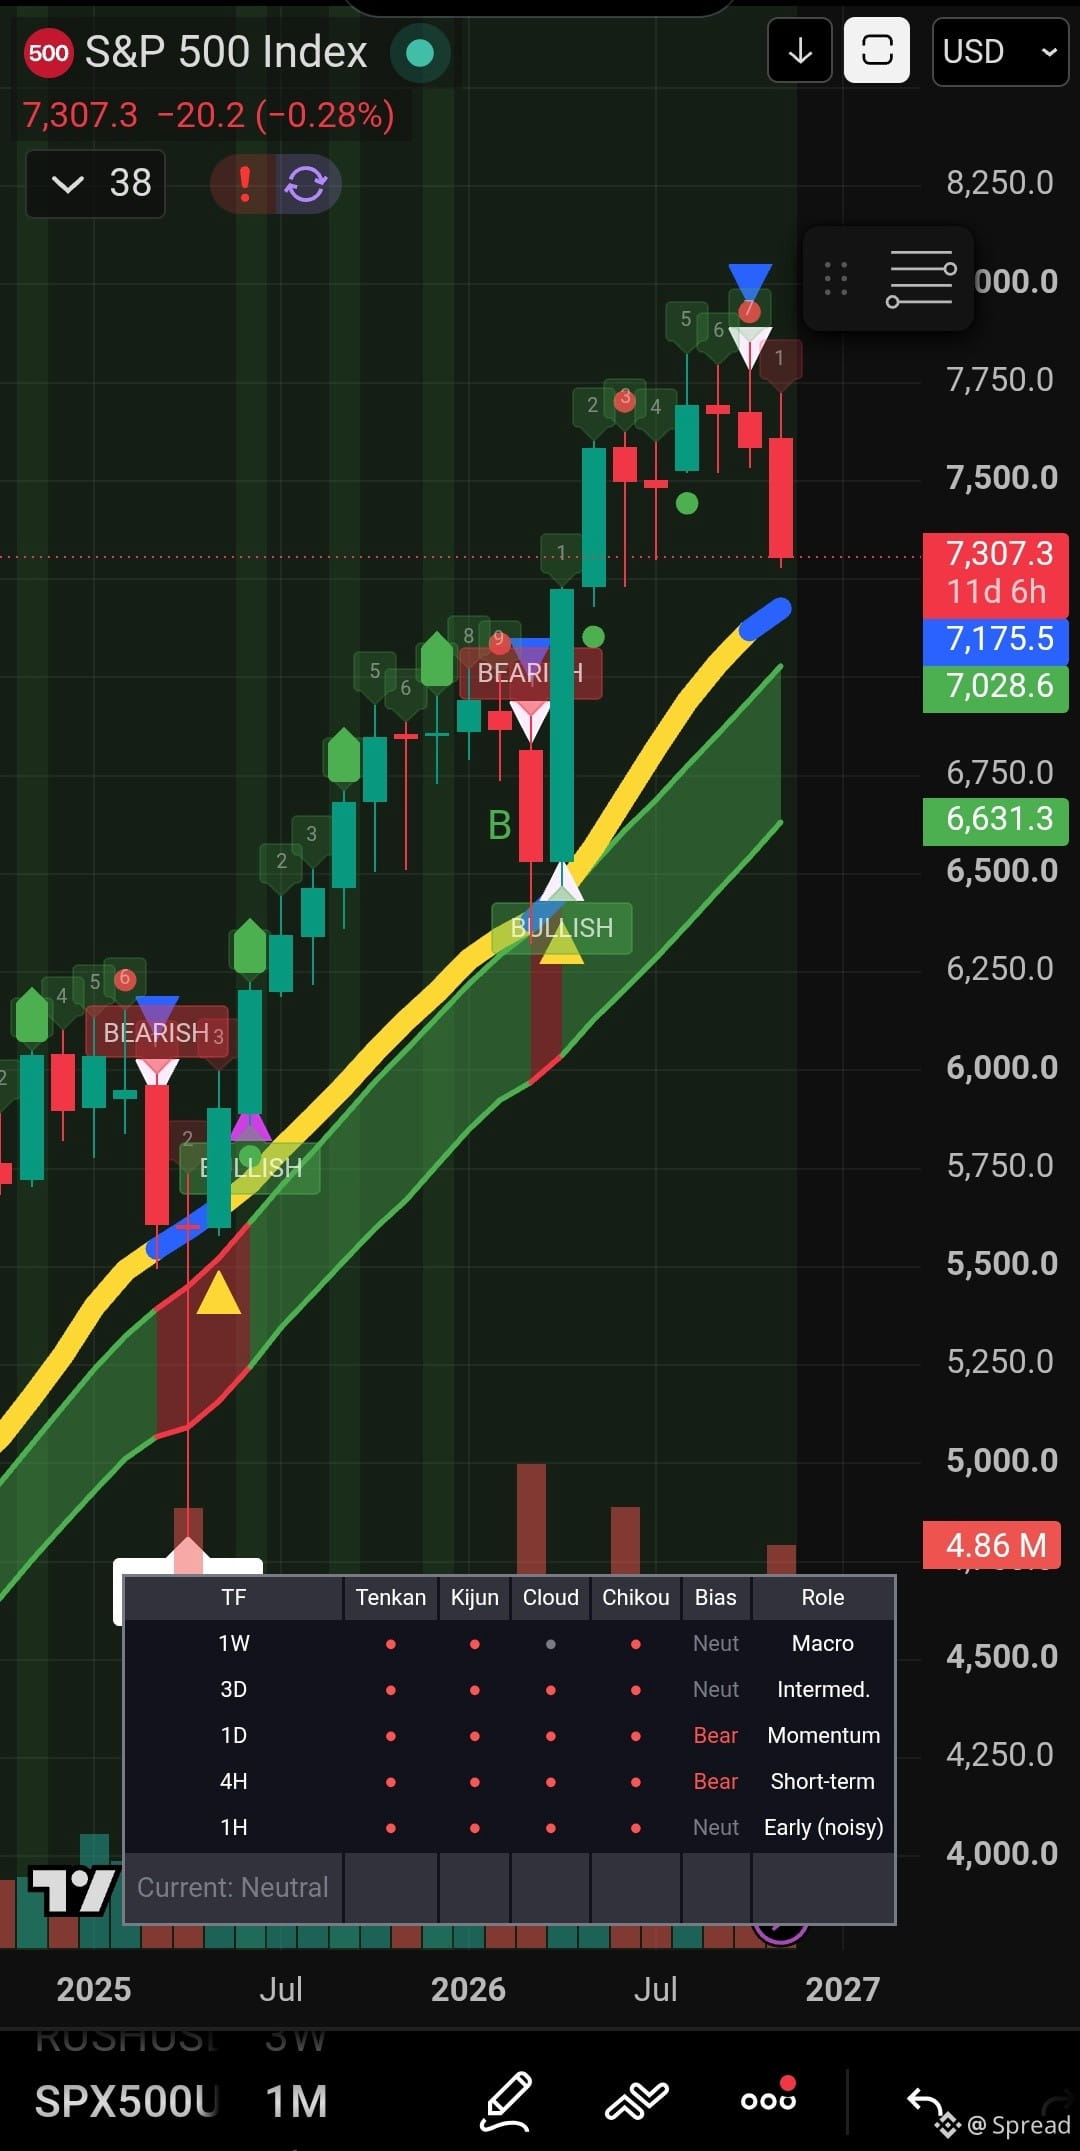
Simple indicator I use to gauge monthly sentiment.
Applied on the S&P 500 ,it shows no true bear market(6 months+ bear) has occurred since 2022.
Only corrective short-lived(2 or 3 months) trends.
Another one is about to confirm.
#SPX500
Simple indicator I use to gauge monthly sentiment.
Applied on the S&P 500 ,it shows no true bear market(6 months+ bear) has occurred since 2022.
Only corrective short-lived(2 or 3 months) trends.
Another one is about to confirm.
#SPX500
Applied on the S&P 500 ,it shows no true bear market(6 months+ bear) has occurred since 2022.
Only corrective short-lived(2 or 3 months) trends.
Another one is about to confirm.
#SPX500
105

·
--
Article
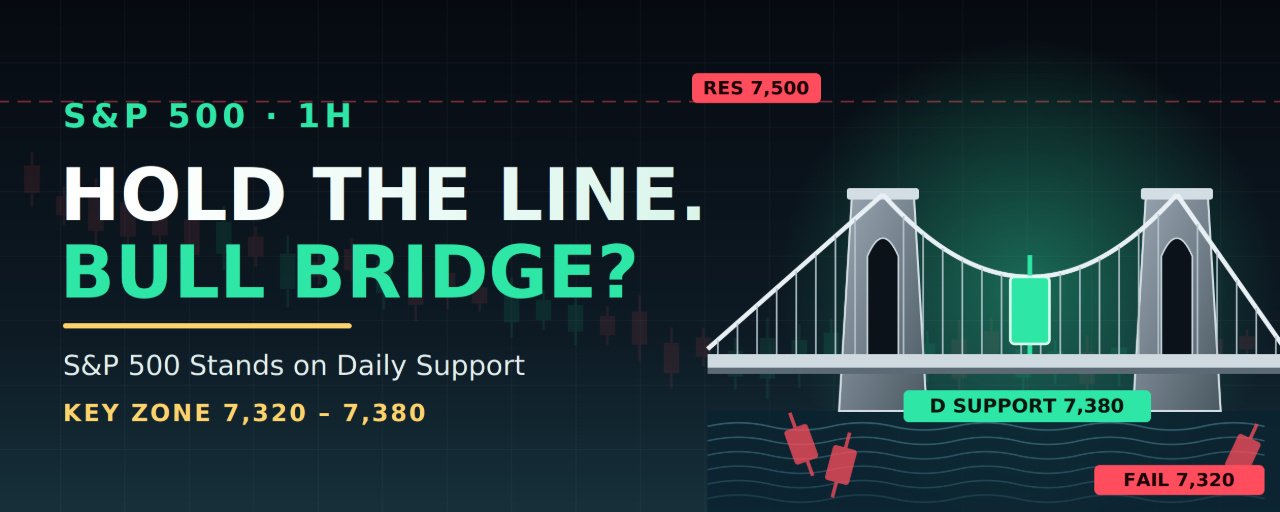
S&P 500 Stands on the Line: Can Bulls Hold 7,380 Before Tuesday’s CPI?Chart: S&P 500 Index, 1H. Last price 7,376.86, which is Friday’s (Nov 6) close. The chart was captured Nov 8, 21:08 UTC, while US markets were closed.
Short answer: a bullish bounce is possible from here, but it is a bounce from support, not a trend change yet. Price sits right on a key level, and Tuesday’s inflation report could decide which way it breaks.
What happened this week
The S&P 500 fell about 2.7% in the week ending November 6, its worst week since the April 2025 tariff crash and its fourth straight weekly loss. The damage came on Thursday, November 5, when the index dropped about 4.4%, its biggest one-day fall since April 3, 2025. Reports tie the selloff to fears of tougher AI regulation after Democratic midterm wins, and chip and AI names led the declines.
Friday brought a bounce led by tech, but a hot October jobs report (unemployment 4.1%) pushed Fed rate-hike odds and the dollar higher. That kept stocks from recovering much.
What the chart shows
Downtrend since early October: the index peaked near 7,840 on October 6 and then made lower highs inside a descending channel.Trendline broken: the white support line fell on November 5 when price gapped hard through it. That line, near 7,470–7,500 now, acts as resistance.Bounce failed at 7,715: the labelled HH near 7,715 on November 3–4 was a rally within the downtrend, not a break of it, since it sits well below the 7,840 high.Supply gaps overhead: the crash left red FVGs around 7,510–7,690, so sellers have unfinished business there.Swing low and key level: the low sits near 7,360, and the green daily (“D”) level at about 7,380 is where price is now standing. Analysts also point to the 7,320–7,360 zone, where the long-term moving average sits, as the line in the sand.
Bull vs. bear read
The bullish case: price is on a daily level and on long-term average support after a sharp, news-driven flush. Some strategists, such as Truist’s CIO, call the AI selloff a likely long-term buying opportunity, and LPL called it a knee-jerk reaction to the midterms.
The bearish case: the structure is still lower highs, the trendline is broken, and the index has fallen four weeks in a row. Until price reclaims about 7,500, a bounce is just a bounce.
The catalyst: Tuesday’s CPI
October CPI is due Tuesday, November 10, at 8:30 a.m. ET. The previous report was hot, with September CPI up 0.6% on the month and 3.7% on the year, and one report put the 10-year yield above 5.3%. A cool core print would take pressure off the Fed and likely lift stocks. A hot one would raise hike odds and could turn Thursday’s rout into a warm-up. Expect gaps, so size positions accordingly or wait for the print.
Trade plan (long bias)
These levels are in index points. If you trade through futures, a CFD or a perpetual contract, check the equivalent levels on that instrument, since prices can differ slightly.
Setup A: support bounce (preferred)
Entry zone: 7,360–7,385, the daily level and the swing lowStop loss: 7,315, below the 7,320 supportTP1: 7,420TP2: 7,500, the trendline and the main resistanceTP3: 7,620TP4: 7,690, near the top of the red gap
Setup B: breakout entry (confirmation)
Entry: a 1H candle close above 7,500, then a retest as supportStop loss: 7,440Targets: 7,620, then 7,690, then 7,715
Measured from 7,375 to the 7,315 stop, TP1 pays about 0.75R, so take partial profit there. TP2 pays about 2.1R, TP3 about 4.1R and TP4 about 5.3R. After TP1, consider moving the stop to breakeven.
Bearish alternative: if support fails
Trigger: a 1H close below 7,320, then a failed retestEntry: 7,320–7,335Stop loss: 7,380Targets: 7,225, then 7,125, then 7,000
What invalidates the bullish idea
A 1H close below 7,320 means the long-term average zone failed.A close below 7,250 would put the bear scenario in play: one weekly outlook sets that level with the VIX above 30 as the bear case.A hot core CPI, at or above 0.3% on the month, would likely send price through support.
Live cross-check
The chart matches reality. Multiple sources, including Yahoo Finance, report the S&P 500 closed Friday at 7,376.86, the same figure as your chart. I could not pull a reliable Monday quote or the latest futures moves, so check the open before acting.
Bottom line
Bullish, with conditions. The S&P 500 is standing on a daily level and the long-term average after the biggest drop in over a year. The best long is a bounce at 7,360–7,385 with a tight stop under 7,315, then a take-profit ladder toward 7,500. Treat 7,420 as the first test and 7,500 as the real break. A close below 7,320 flips the bias, and CPI on Tuesday could make that call.
⚠️ Disclaimer: This is not financial advice. This analysis is for educational and informational purposes only. Financial markets are highly volatile, and you can lose your capital. Always do your own research, manage your risk, and never trade with money you can’t afford to lose.
@Binance_Square_Official #SPX500 #BinanceReopensWithdrawalsForHYPE&APT #SouthKoreaDraftLawTargets15To20%ShareholderCap #Binance #ChartSniper
S&P 500 Stands on the Line: Can Bulls Hold 7,380 Before Tuesday’s CPI?
Chart: S&P 500 Index, 1H. Last price 7,376.86, which is Friday’s (Nov 6) close. The chart was captured Nov 8, 21:08 UTC, while US markets were closed.
Short answer: a bullish bounce is possible from here, but it is a bounce from support, not a trend change yet. Price sits right on a key level, and Tuesday’s inflation report could decide which way it breaks.
What happened this week
The S&P 500 fell about 2.7% in the week ending November 6, its worst week since the April 2025 tariff crash and its fourth straight weekly loss. The damage came on Thursday, November 5, when the index dropped about 4.4%, its biggest one-day fall since April 3, 2025. Reports tie the selloff to fears of tougher AI regulation after Democratic midterm wins, and chip and AI names led the declines.
Friday brought a bounce led by tech, but a hot October jobs report (unemployment 4.1%) pushed Fed rate-hike odds and the dollar higher. That kept stocks from recovering much.
What the chart shows
Downtrend since early October: the index peaked near 7,840 on October 6 and then made lower highs inside a descending channel.Trendline broken: the white support line fell on November 5 when price gapped hard through it. That line, near 7,470–7,500 now, acts as resistance.Bounce failed at 7,715: the labelled HH near 7,715 on November 3–4 was a rally within the downtrend, not a break of it, since it sits well below the 7,840 high.Supply gaps overhead: the crash left red FVGs around 7,510–7,690, so sellers have unfinished business there.Swing low and key level: the low sits near 7,360, and the green daily (“D”) level at about 7,380 is where price is now standing. Analysts also point to the 7,320–7,360 zone, where the long-term moving average sits, as the line in the sand.
Bull vs. bear read
The bullish case: price is on a daily level and on long-term average support after a sharp, news-driven flush. Some strategists, such as Truist’s CIO, call the AI selloff a likely long-term buying opportunity, and LPL called it a knee-jerk reaction to the midterms.
The bearish case: the structure is still lower highs, the trendline is broken, and the index has fallen four weeks in a row. Until price reclaims about 7,500, a bounce is just a bounce.
The catalyst: Tuesday’s CPI
October CPI is due Tuesday, November 10, at 8:30 a.m. ET. The previous report was hot, with September CPI up 0.6% on the month and 3.7% on the year, and one report put the 10-year yield above 5.3%. A cool core print would take pressure off the Fed and likely lift stocks. A hot one would raise hike odds and could turn Thursday’s rout into a warm-up. Expect gaps, so size positions accordingly or wait for the print.
Trade plan (long bias)
These levels are in index points. If you trade through futures, a CFD or a perpetual contract, check the equivalent levels on that instrument, since prices can differ slightly.
Setup A: support bounce (preferred)
Entry zone: 7,360–7,385, the daily level and the swing lowStop loss: 7,315, below the 7,320 supportTP1: 7,420TP2: 7,500, the trendline and the main resistanceTP3: 7,620TP4: 7,690, near the top of the red gap
Setup B: breakout entry (confirmation)
Entry: a 1H candle close above 7,500, then a retest as supportStop loss: 7,440Targets: 7,620, then 7,690, then 7,715
Measured from 7,375 to the 7,315 stop, TP1 pays about 0.75R, so take partial profit there. TP2 pays about 2.1R, TP3 about 4.1R and TP4 about 5.3R. After TP1, consider moving the stop to breakeven.
Bearish alternative: if support fails
Trigger: a 1H close below 7,320, then a failed retestEntry: 7,320–7,335Stop loss: 7,380Targets: 7,225, then 7,125, then 7,000
What invalidates the bullish idea
A 1H close below 7,320 means the long-term average zone failed.A close below 7,250 would put the bear scenario in play: one weekly outlook sets that level with the VIX above 30 as the bear case.A hot core CPI, at or above 0.3% on the month, would likely send price through support.
Live cross-check
The chart matches reality. Multiple sources, including Yahoo Finance, report the S&P 500 closed Friday at 7,376.86, the same figure as your chart. I could not pull a reliable Monday quote or the latest futures moves, so check the open before acting.
Bottom line
Bullish, with conditions. The S&P 500 is standing on a daily level and the long-term average after the biggest drop in over a year. The best long is a bounce at 7,360–7,385 with a tight stop under 7,315, then a take-profit ladder toward 7,500. Treat 7,420 as the first test and 7,500 as the real break. A close below 7,320 flips the bias, and CPI on Tuesday could make that call.
⚠️ Disclaimer: This is not financial advice. This analysis is for educational and informational purposes only. Financial markets are highly volatile, and you can lose your capital. Always do your own research, manage your risk, and never trade with money you can’t afford to lose.
@Binance Square Official #SPX500 #BinanceReopensWithdrawalsForHYPE&APT #SouthKoreaDraftLawTargets15To20%ShareholderCap #Binance #ChartSniper
Short answer: a bullish bounce is possible from here, but it is a bounce from support, not a trend change yet. Price sits right on a key level, and Tuesday’s inflation report could decide which way it breaks.
What happened this week
The S&P 500 fell about 2.7% in the week ending November 6, its worst week since the April 2025 tariff crash and its fourth straight weekly loss. The damage came on Thursday, November 5, when the index dropped about 4.4%, its biggest one-day fall since April 3, 2025. Reports tie the selloff to fears of tougher AI regulation after Democratic midterm wins, and chip and AI names led the declines.
Friday brought a bounce led by tech, but a hot October jobs report (unemployment 4.1%) pushed Fed rate-hike odds and the dollar higher. That kept stocks from recovering much.
What the chart shows
Downtrend since early October: the index peaked near 7,840 on October 6 and then made lower highs inside a descending channel.Trendline broken: the white support line fell on November 5 when price gapped hard through it. That line, near 7,470–7,500 now, acts as resistance.Bounce failed at 7,715: the labelled HH near 7,715 on November 3–4 was a rally within the downtrend, not a break of it, since it sits well below the 7,840 high.Supply gaps overhead: the crash left red FVGs around 7,510–7,690, so sellers have unfinished business there.Swing low and key level: the low sits near 7,360, and the green daily (“D”) level at about 7,380 is where price is now standing. Analysts also point to the 7,320–7,360 zone, where the long-term moving average sits, as the line in the sand.
Bull vs. bear read
The bullish case: price is on a daily level and on long-term average support after a sharp, news-driven flush. Some strategists, such as Truist’s CIO, call the AI selloff a likely long-term buying opportunity, and LPL called it a knee-jerk reaction to the midterms.
The bearish case: the structure is still lower highs, the trendline is broken, and the index has fallen four weeks in a row. Until price reclaims about 7,500, a bounce is just a bounce.
The catalyst: Tuesday’s CPI
October CPI is due Tuesday, November 10, at 8:30 a.m. ET. The previous report was hot, with September CPI up 0.6% on the month and 3.7% on the year, and one report put the 10-year yield above 5.3%. A cool core print would take pressure off the Fed and likely lift stocks. A hot one would raise hike odds and could turn Thursday’s rout into a warm-up. Expect gaps, so size positions accordingly or wait for the print.
Trade plan (long bias)
These levels are in index points. If you trade through futures, a CFD or a perpetual contract, check the equivalent levels on that instrument, since prices can differ slightly.
Setup A: support bounce (preferred)
Entry zone: 7,360–7,385, the daily level and the swing lowStop loss: 7,315, below the 7,320 supportTP1: 7,420TP2: 7,500, the trendline and the main resistanceTP3: 7,620TP4: 7,690, near the top of the red gap
Setup B: breakout entry (confirmation)
Entry: a 1H candle close above 7,500, then a retest as supportStop loss: 7,440Targets: 7,620, then 7,690, then 7,715
Measured from 7,375 to the 7,315 stop, TP1 pays about 0.75R, so take partial profit there. TP2 pays about 2.1R, TP3 about 4.1R and TP4 about 5.3R. After TP1, consider moving the stop to breakeven.
Bearish alternative: if support fails
Trigger: a 1H close below 7,320, then a failed retestEntry: 7,320–7,335Stop loss: 7,380Targets: 7,225, then 7,125, then 7,000
What invalidates the bullish idea
A 1H close below 7,320 means the long-term average zone failed.A close below 7,250 would put the bear scenario in play: one weekly outlook sets that level with the VIX above 30 as the bear case.A hot core CPI, at or above 0.3% on the month, would likely send price through support.
Live cross-check
The chart matches reality. Multiple sources, including Yahoo Finance, report the S&P 500 closed Friday at 7,376.86, the same figure as your chart. I could not pull a reliable Monday quote or the latest futures moves, so check the open before acting.
Bottom line
Bullish, with conditions. The S&P 500 is standing on a daily level and the long-term average after the biggest drop in over a year. The best long is a bounce at 7,360–7,385 with a tight stop under 7,315, then a take-profit ladder toward 7,500. Treat 7,420 as the first test and 7,500 as the real break. A close below 7,320 flips the bias, and CPI on Tuesday could make that call.
⚠️ Disclaimer: This is not financial advice. This analysis is for educational and informational purposes only. Financial markets are highly volatile, and you can lose your capital. Always do your own research, manage your risk, and never trade with money you can’t afford to lose.
@Binance Square Official #SPX500 #BinanceReopensWithdrawalsForHYPE&APT #SouthKoreaDraftLawTargets15To20%ShareholderCap #Binance #ChartSniper
81

$SPX500 🚨 SPX500 Price Alert - Up 2.16% - Cause:
Key discussion themes on X about SPX500 in the last 24 hours:
- Rapid price action and pumping momentum: Users highlighted quick upward moves, vertical charts, exploding volume, and "pumping hard" sentiment, with calls to buy in before missing further gains.
- Trading signals and technical analysis: Posts shared pivot points, support/resistance levels, and short-term ideas (e.g., expecting pullbacks/gap fills or bullish bias tied to broader market factors like AI/economic leadership).
- Long-term Wyckoff/methodical accumulation scenarios: Detailed chart breakdowns projecting future moves for SPX500 (e.g., targeting 8000 level with phases of shakeouts and breakouts in 2026-2027).
- DeFi/perps integration for index trading: Promotion of on-chain platforms enabling perpetuals trading for SPX500 and similar indices with deep liquidity and self-custody.
- Related memecoin/token activity: Mentions of associated tokens (e.g., SPX variants) with claims, holder events, and hype around potential flips or revolutions, alongside general crypto trading chatter.
Discussions mix traditional index trading views with crypto token hype, driven by the noted rapid rise.
#SPX500
$SPX500 🚨 SPX500 Price Alert - Up 2.16% - Cause:
Key discussion themes on X about SPX500 in the last 24 hours:
- Rapid price action and pumping momentum: Users highlighted quick upward moves, vertical charts, exploding volume, and "pumping hard" sentiment, with calls to buy in before missing further gains.
- Trading signals and technical analysis: Posts shared pivot points, support/resistance levels, and short-term ideas (e.g., expecting pullbacks/gap fills or bullish bias tied to broader market factors like AI/economic leadership).
- Long-term Wyckoff/methodical accumulation scenarios: Detailed chart breakdowns projecting future moves for SPX500 (e.g., targeting 8000 level with phases of shakeouts and breakouts in 2026-2027).
- DeFi/perps integration for index trading: Promotion of on-chain platforms enabling perpetuals trading for SPX500 and similar indices with deep liquidity and self-custody.
- Related memecoin/token activity: Mentions of associated tokens (e.g., SPX variants) with claims, holder events, and hype around potential flips or revolutions, alongside general crypto trading chatter.
Discussions mix traditional index trading views with crypto token hype, driven by the noted rapid rise.
#SPX500
Key discussion themes on X about SPX500 in the last 24 hours:
- Rapid price action and pumping momentum: Users highlighted quick upward moves, vertical charts, exploding volume, and "pumping hard" sentiment, with calls to buy in before missing further gains.
- Trading signals and technical analysis: Posts shared pivot points, support/resistance levels, and short-term ideas (e.g., expecting pullbacks/gap fills or bullish bias tied to broader market factors like AI/economic leadership).
- Long-term Wyckoff/methodical accumulation scenarios: Detailed chart breakdowns projecting future moves for SPX500 (e.g., targeting 8000 level with phases of shakeouts and breakouts in 2026-2027).
- DeFi/perps integration for index trading: Promotion of on-chain platforms enabling perpetuals trading for SPX500 and similar indices with deep liquidity and self-custody.
- Related memecoin/token activity: Mentions of associated tokens (e.g., SPX variants) with claims, holder events, and hype around potential flips or revolutions, alongside general crypto trading chatter.
Discussions mix traditional index trading views with crypto token hype, driven by the noted rapid rise.
#SPX500
109

·
--
Bearish
S&P 500 Near a Major Reversal Zone — Could a Pullback Hit Bitcoin Too?
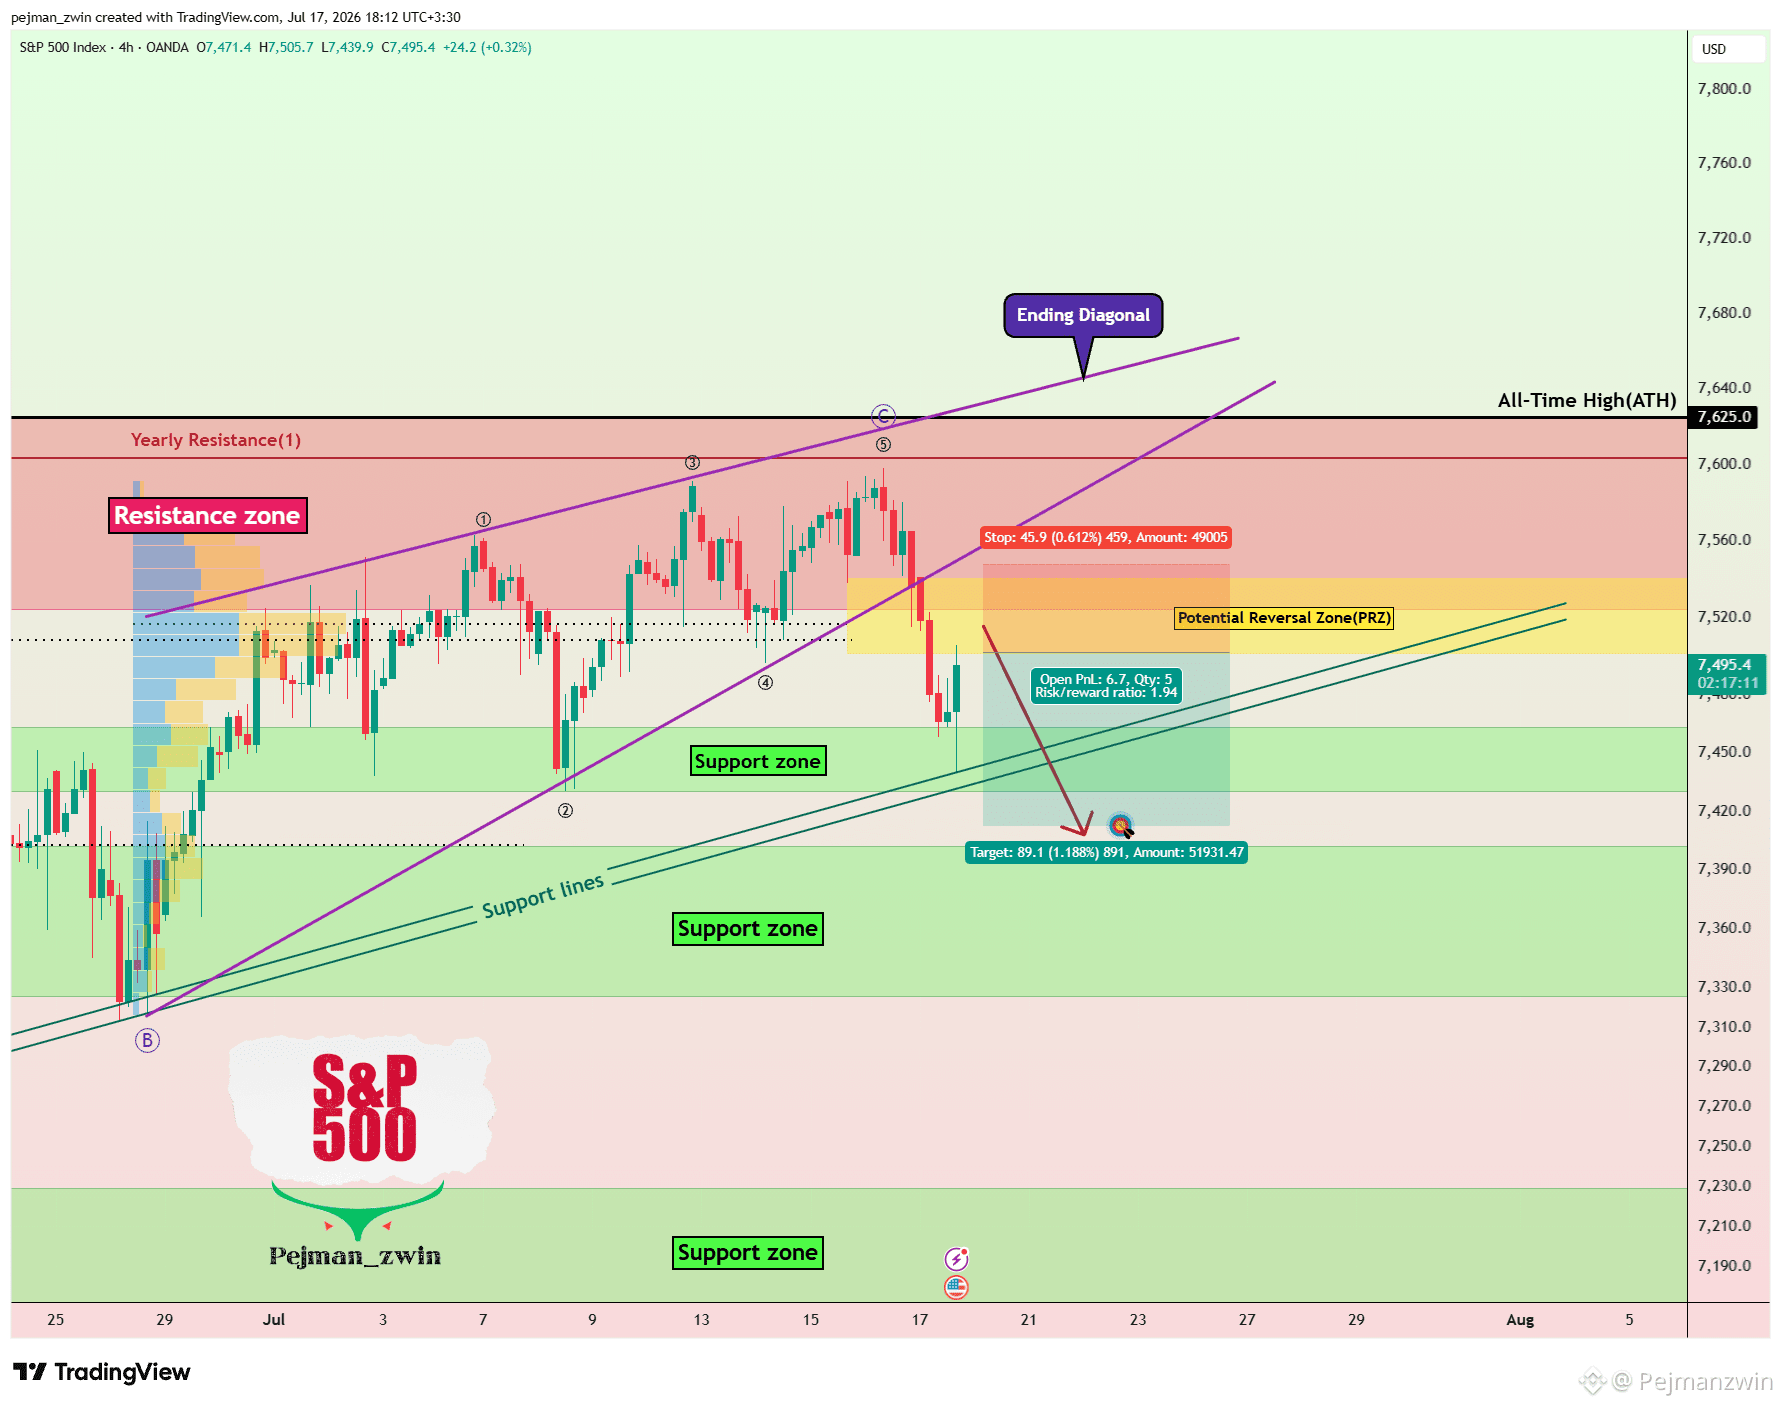
The SPX has bounced strongly from the 7,430–7,463 support zone, but the rally is now testing a critical resistance cluster around the 7,500 level and the Potential Reversal Zone (7,501–7,540).
From an Elliott Wave perspective, Wave C appears to have completed as an Ending Diagonal—a pattern that often signals trend exhaustion.
Price has already broken below the pattern's lower trendline and is now retesting it as resistance, increasing the probability of another bearish leg.
Unless buyers reclaim this resistance with strong momentum, I expect the S&P 500 to break back below the 7,430–7,463 support zone and extend its decline toward 7,413.
🎯 Target: 7,413
🛑 Stop Loss: 7,548
Why This Matters
A deeper correction in the S&P 500 could quickly spill over into other risk assets. Given the strong correlation seen in recent months, $BTC
{future}(BTCUSDT)
and the broader crypto market may also come under pressure if U.S. equities weaken.
⚠️ Risk Reminder: Markets remain highly sensitive to Middle East geopolitical developments. Unexpected headlines could rapidly change sentiment, so disciplined risk management is essential.
Do you think the S&P 500 is preparing for new all-time highs, or is a deeper correction now the more likely scenario?
#SPX500
S&P 500 Near a Major Reversal Zone — Could a Pullback Hit Bitcoin Too?
The SPX has bounced strongly from the 7,430–7,463 support zone, but the rally is now testing a critical resistance cluster around the 7,500 level and the Potential Reversal Zone (7,501–7,540).
From an Elliott Wave perspective, Wave C appears to have completed as an Ending Diagonal—a pattern that often signals trend exhaustion.
Price has already broken below the pattern's lower trendline and is now retesting it as resistance, increasing the probability of another bearish leg.
Unless buyers reclaim this resistance with strong momentum, I expect the S&P 500 to break back below the 7,430–7,463 support zone and extend its decline toward 7,413.
🎯 Target: 7,413
🛑 Stop Loss: 7,548
Why This Matters
A deeper correction in the S&P 500 could quickly spill over into other risk assets. Given the strong correlation seen in recent months, $BTC
and the broader crypto market may also come under pressure if U.S. equities weaken.
⚠️ Risk Reminder: Markets remain highly sensitive to Middle East geopolitical developments. Unexpected headlines could rapidly change sentiment, so disciplined risk management is essential.
Do you think the S&P 500 is preparing for new all-time highs, or is a deeper correction now the more likely scenario?
#SPX500
The SPX has bounced strongly from the 7,430–7,463 support zone, but the rally is now testing a critical resistance cluster around the 7,500 level and the Potential Reversal Zone (7,501–7,540).
From an Elliott Wave perspective, Wave C appears to have completed as an Ending Diagonal—a pattern that often signals trend exhaustion.
Price has already broken below the pattern's lower trendline and is now retesting it as resistance, increasing the probability of another bearish leg.
Unless buyers reclaim this resistance with strong momentum, I expect the S&P 500 to break back below the 7,430–7,463 support zone and extend its decline toward 7,413.
🎯 Target: 7,413
🛑 Stop Loss: 7,548
Why This Matters
A deeper correction in the S&P 500 could quickly spill over into other risk assets. Given the strong correlation seen in recent months, $BTC
and the broader crypto market may also come under pressure if U.S. equities weaken.
⚠️ Risk Reminder: Markets remain highly sensitive to Middle East geopolitical developments. Unexpected headlines could rapidly change sentiment, so disciplined risk management is essential.
Do you think the S&P 500 is preparing for new all-time highs, or is a deeper correction now the more likely scenario?
#SPX500
1
2
88

·
--
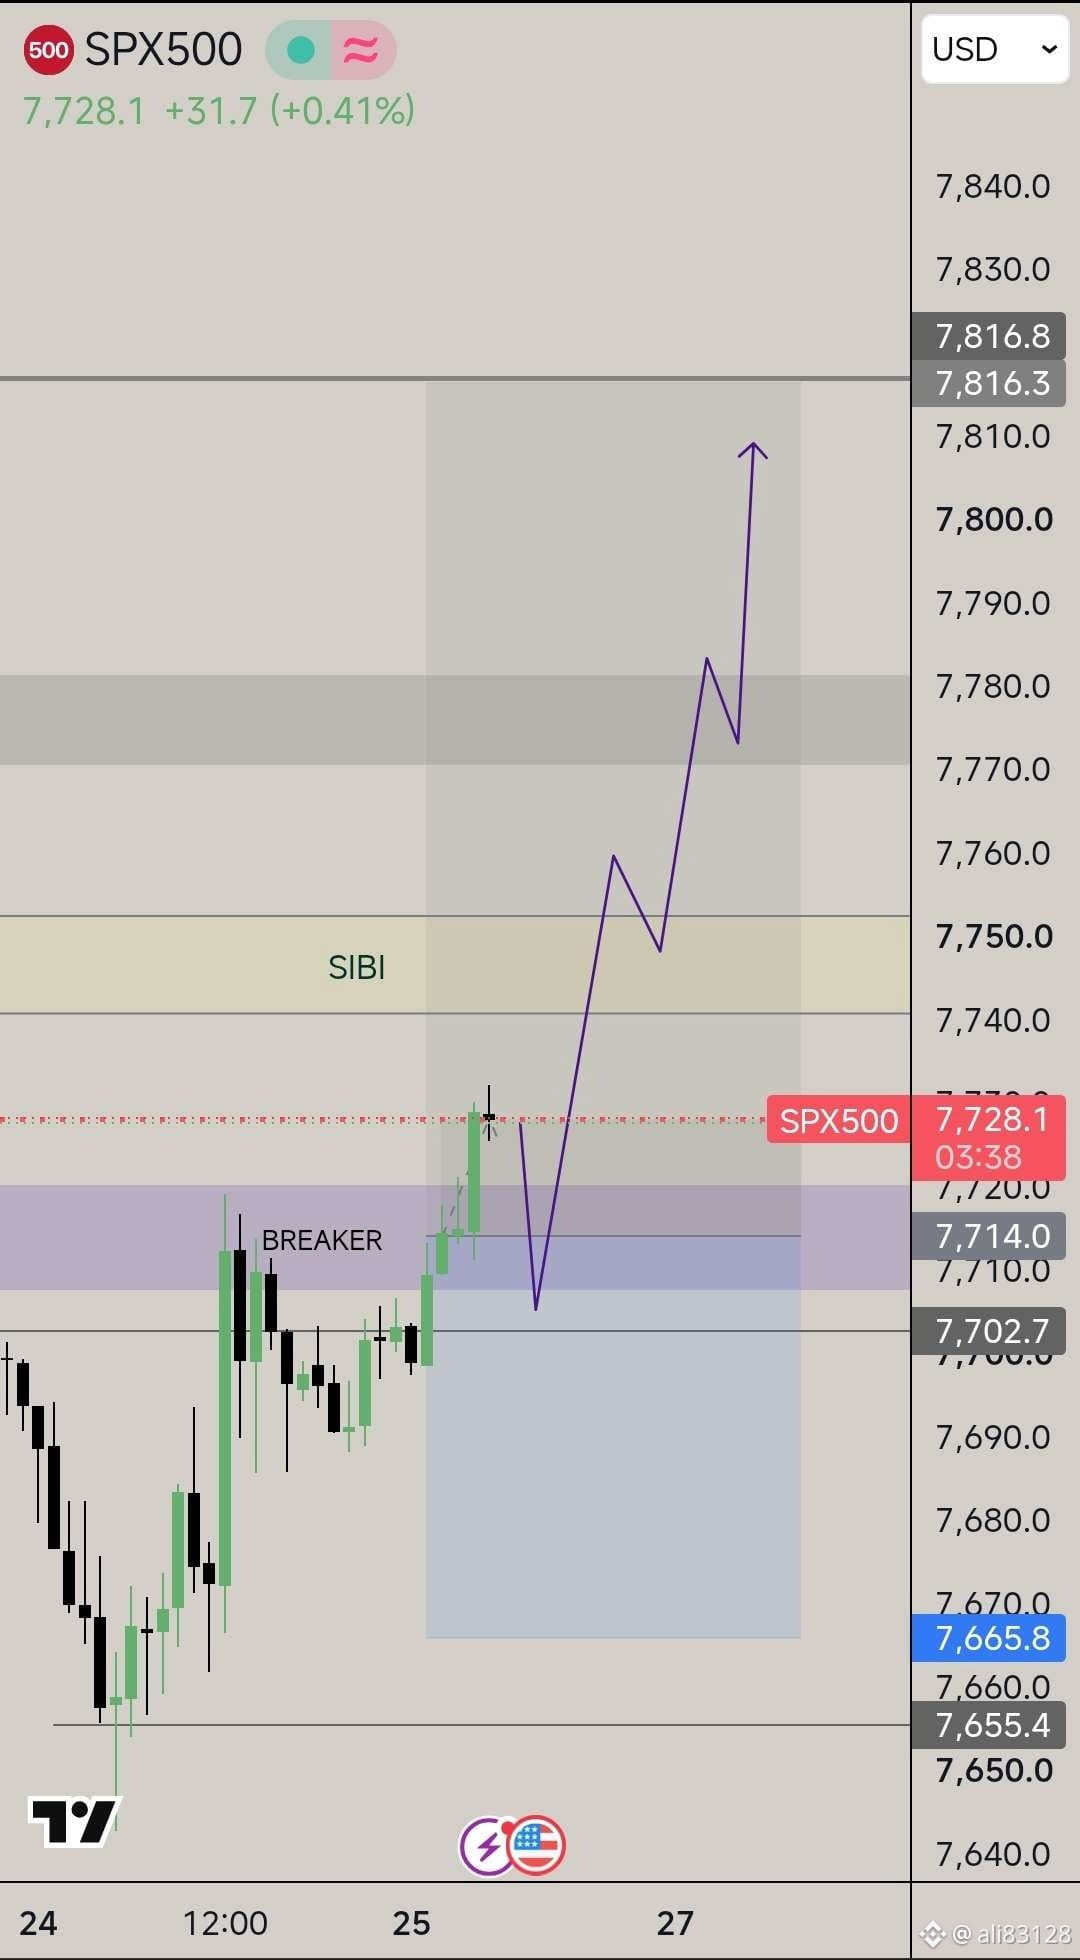
🔥 SPX500 BUY Signal
📍 Entry: 7728.1
🎯 TP1: 7800
🎯 TP2: 7852.7
🛑 SL: 7665.8
Excellent entry! SPX500 BUY ka time aagya!
⚠️ Always use proper risk management. This is not financial advice.
⚡ LIVE SIGNAL — follow it before the entry moves!
#SPX500 #Forex #TradingSignals #DayTrading
🔥 SPX500 BUY Signal
📍 Entry: 7728.1
🎯 TP1: 7800
🎯 TP2: 7852.7
🛑 SL: 7665.8
Excellent entry! SPX500 BUY ka time aagya!
⚠️ Always use proper risk management. This is not financial advice.
⚡ LIVE SIGNAL — follow it before the entry moves!
#SPX500 #Forex #TradingSignals #DayTrading
📍 Entry: 7728.1
🎯 TP1: 7800
🎯 TP2: 7852.7
🛑 SL: 7665.8
Excellent entry! SPX500 BUY ka time aagya!
⚠️ Always use proper risk management. This is not financial advice.
⚡ LIVE SIGNAL — follow it before the entry moves!
#SPX500 #Forex #TradingSignals #DayTrading
106

$SPX500 JUST WENT VERTICAL 🚨
$SPX500 is catching heat after a 2.16% move, with X chatter dominated by fast momentum, volume spikes, and bullish short-term positioning. Traders are also watching index perps, technical zones, and longer-range accumulation narratives as traditional market flow collides with crypto-style hype.
Momentum is loud right now.
When index traders and crypto degens crowd the same tape, volatility can expand fast.
Stay sharp. Do not chase blind candles.
Not financial advice. Manage your risk.
#SPX500 #Crypto #Trading #Markets
⚡
$SPX500 JUST WENT VERTICAL 🚨
$SPX500 is catching heat after a 2.16% move, with X chatter dominated by fast momentum, volume spikes, and bullish short-term positioning. Traders are also watching index perps, technical zones, and longer-range accumulation narratives as traditional market flow collides with crypto-style hype.
Momentum is loud right now.
When index traders and crypto degens crowd the same tape, volatility can expand fast.
Stay sharp. Do not chase blind candles.
Not financial advice. Manage your risk.
#SPX500 #Crypto #Trading #Markets
⚡
$SPX500 is catching heat after a 2.16% move, with X chatter dominated by fast momentum, volume spikes, and bullish short-term positioning. Traders are also watching index perps, technical zones, and longer-range accumulation narratives as traditional market flow collides with crypto-style hype.
Momentum is loud right now.
When index traders and crypto degens crowd the same tape, volatility can expand fast.
Stay sharp. Do not chase blind candles.
Not financial advice. Manage your risk.
#SPX500 #Crypto #Trading #Markets
⚡
64
·
--
Bearish
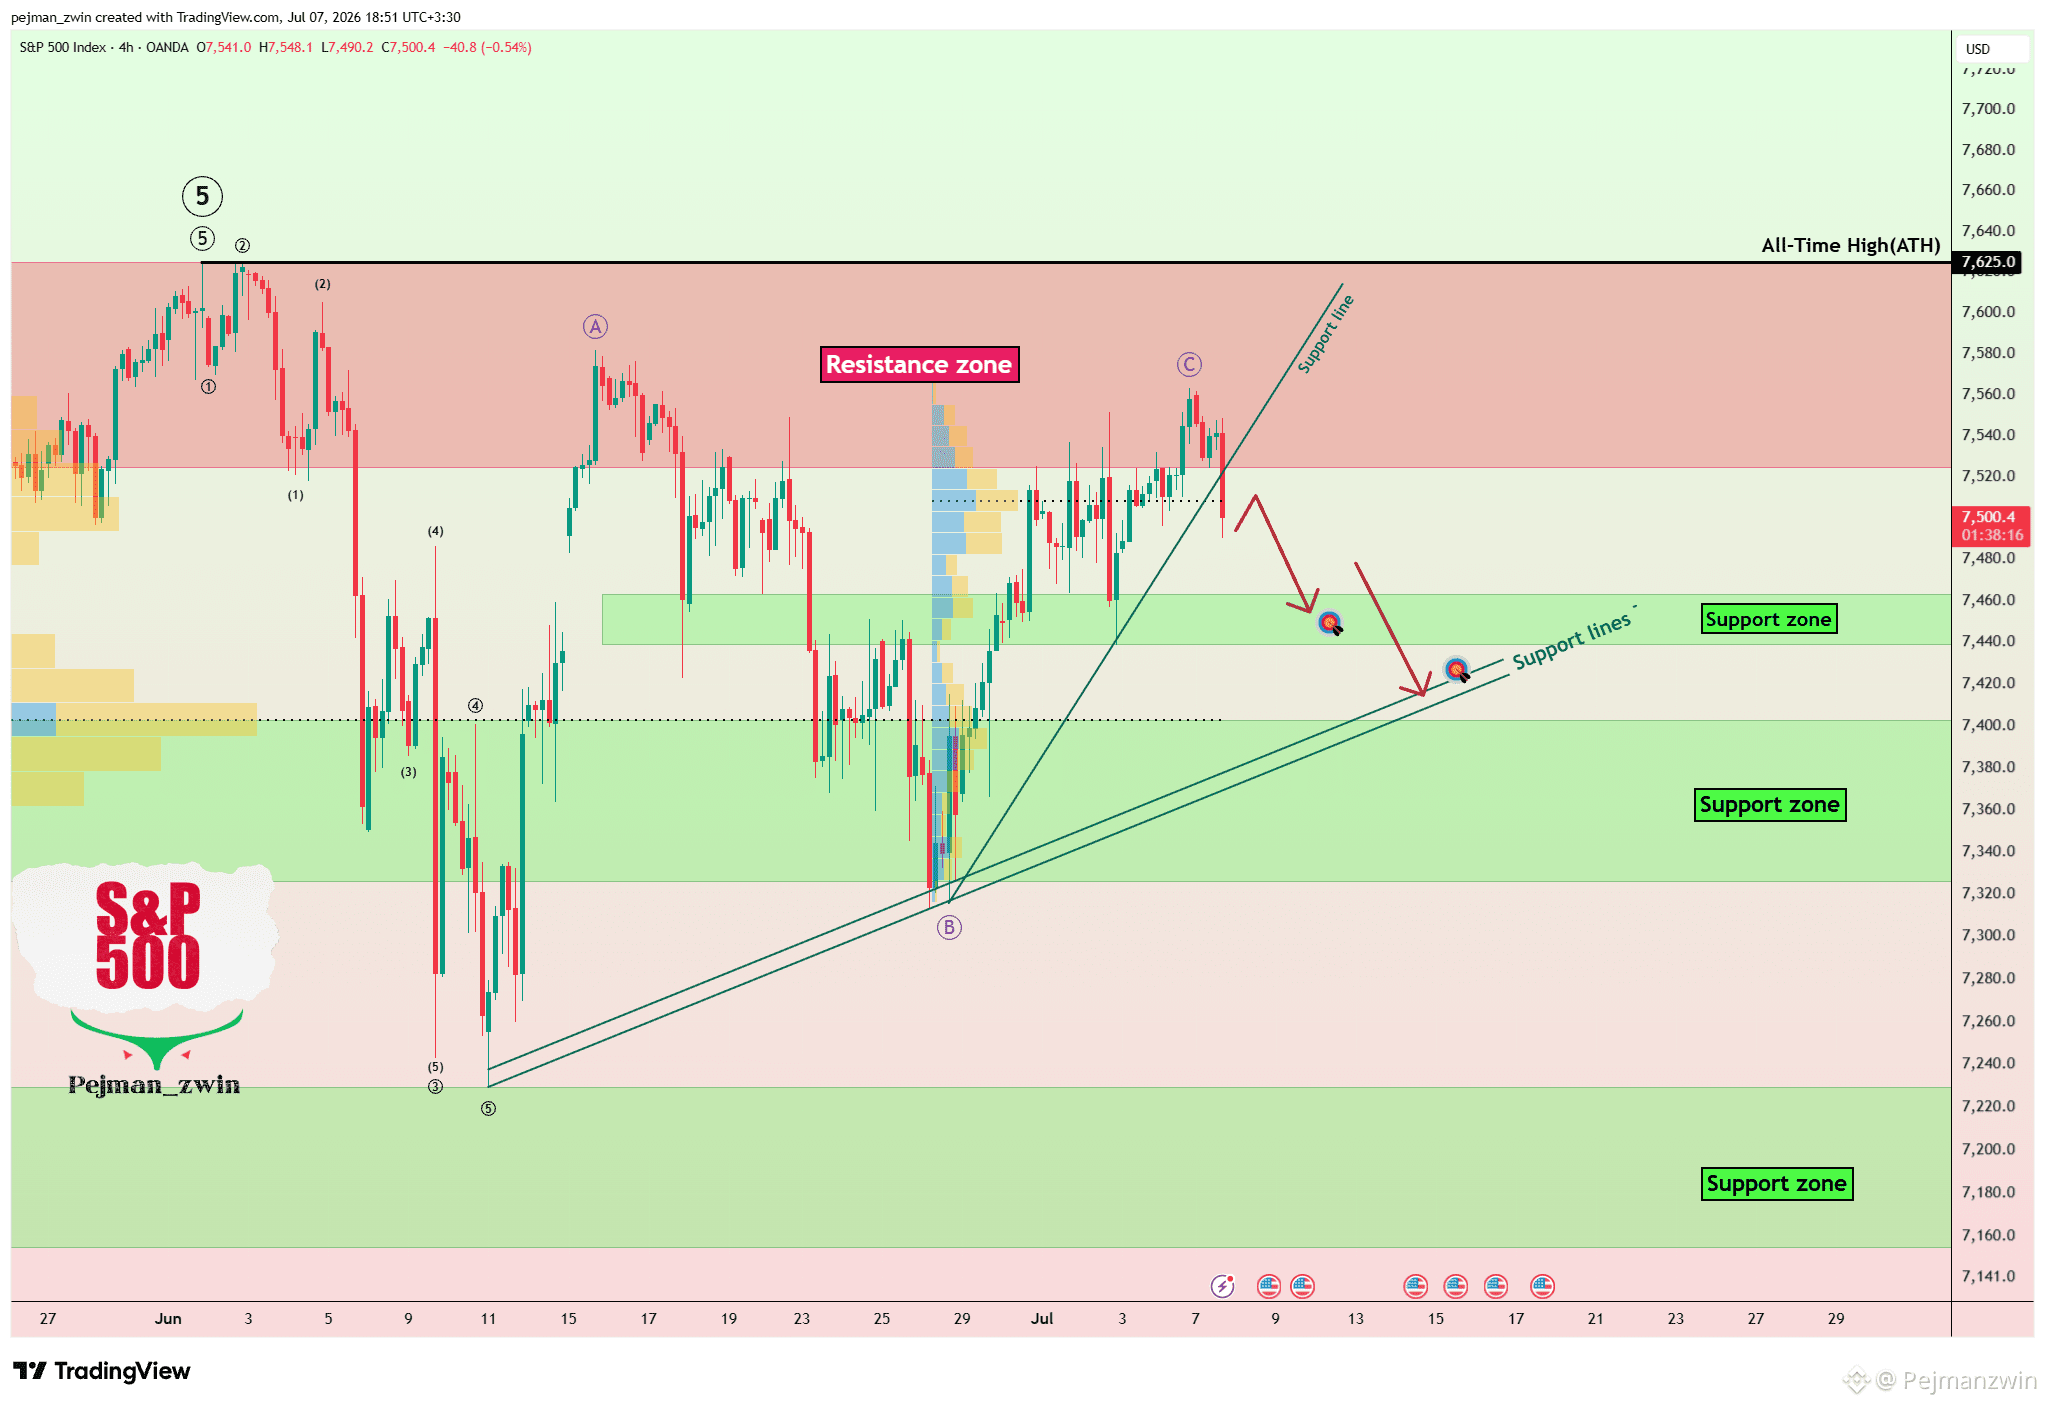
S&P 500 Loses $7,500 — Are Bears Taking Control?
The $SPX is trading near the resistance zone at $7,625-$7,524 and has broken below the key $7,500 level.
From an Elliott Wave perspective, the index appears to have completed a Zigzag correction (ABC/5-3-5) over the past month, opening the door for the next leg lower.
Given the strong recent correlation between the S&P 500 and BTC, any sharp decline in equities could quickly pressure crypto markets as well.
I expect the S&P 500 to continue its bearish move and test the $7,463-$7,438 support zone. A break below this area could open the path toward $7,400 and lower.
🎯 First Target: $7,402-$7,326 zone
🎯 Second Target: Next support lines
🛑 Stop Loss: $7,588 (Worst case)
#SPX500 #BitcoinFailsToHold$64.4K
S&P 500 Loses $7,500 — Are Bears Taking Control?
The $SPX is trading near the resistance zone at $7,625-$7,524 and has broken below the key $7,500 level.
From an Elliott Wave perspective, the index appears to have completed a Zigzag correction (ABC/5-3-5) over the past month, opening the door for the next leg lower.
Given the strong recent correlation between the S&P 500 and BTC, any sharp decline in equities could quickly pressure crypto markets as well.
I expect the S&P 500 to continue its bearish move and test the $7,463-$7,438 support zone. A break below this area could open the path toward $7,400 and lower.
🎯 First Target: $7,402-$7,326 zone
🎯 Second Target: Next support lines
🛑 Stop Loss: $7,588 (Worst case)
#SPX500 #BitcoinFailsToHold$64.4K
The $SPX is trading near the resistance zone at $7,625-$7,524 and has broken below the key $7,500 level.
From an Elliott Wave perspective, the index appears to have completed a Zigzag correction (ABC/5-3-5) over the past month, opening the door for the next leg lower.
Given the strong recent correlation between the S&P 500 and BTC, any sharp decline in equities could quickly pressure crypto markets as well.
I expect the S&P 500 to continue its bearish move and test the $7,463-$7,438 support zone. A break below this area could open the path toward $7,400 and lower.
🎯 First Target: $7,402-$7,326 zone
🎯 Second Target: Next support lines
🛑 Stop Loss: $7,588 (Worst case)
#SPX500 #BitcoinFailsToHold$64.4K
1
1
122

·
--
$SPX500 SURGE PUTS 8000 SCENARIO BACK IN FOCUS 🚨
Target: 8000 ✅
$SPX500 rose 2.16% as market discussion shifted toward momentum, volume expansion, and short-term technical setups. The 8000 level is being discussed as a longer-range Wyckoff-style scenario, not a confirmed near-term objective. Liquidity access through index perps is also drawing attention, but crypto-linked hype around related tokens raises signal noise.
Not financial advice. Manage your risk.
#SPX500 #CryptoTrading #MarketUpdate #TradingSignals
🛡️
$SPX500 SURGE PUTS 8000 SCENARIO BACK IN FOCUS 🚨
Target: 8000 ✅
$SPX500 rose 2.16% as market discussion shifted toward momentum, volume expansion, and short-term technical setups. The 8000 level is being discussed as a longer-range Wyckoff-style scenario, not a confirmed near-term objective. Liquidity access through index perps is also drawing attention, but crypto-linked hype around related tokens raises signal noise.
Not financial advice. Manage your risk.
#SPX500 #CryptoTrading #MarketUpdate #TradingSignals
🛡️
Target: 8000 ✅
$SPX500 rose 2.16% as market discussion shifted toward momentum, volume expansion, and short-term technical setups. The 8000 level is being discussed as a longer-range Wyckoff-style scenario, not a confirmed near-term objective. Liquidity access through index perps is also drawing attention, but crypto-linked hype around related tokens raises signal noise.
Not financial advice. Manage your risk.
#SPX500 #CryptoTrading #MarketUpdate #TradingSignals
🛡️
1
68

·
--
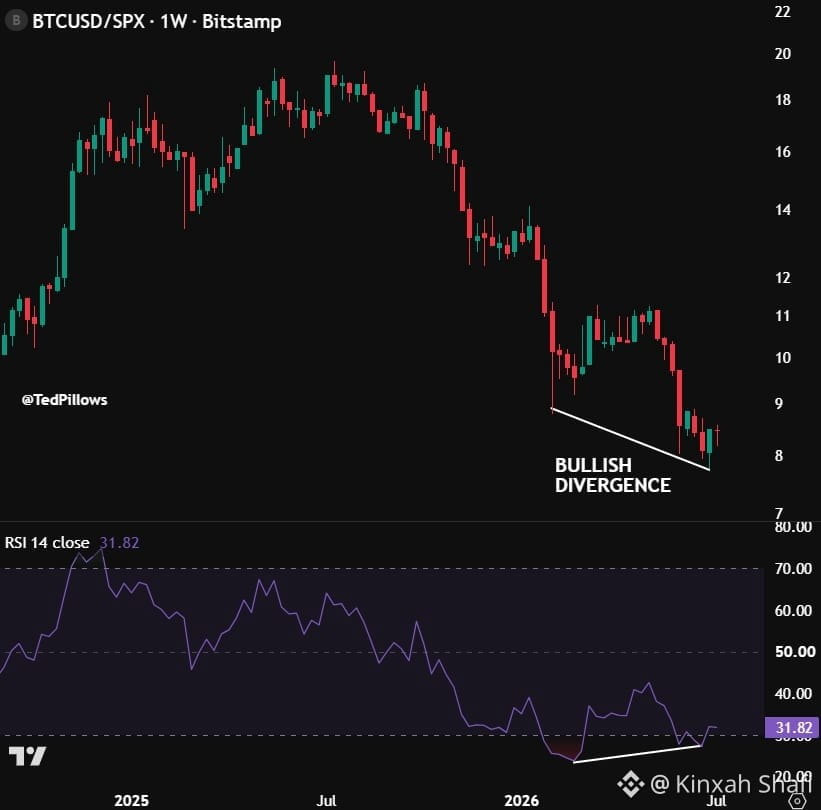
🚀 $BTC : Weekly Bullish Divergence Confirmed! 🚀
{spot}(BTCUSDT)
📊 Market Outlook:
While both assets are expected to drop over the coming months, Bitcoin (\(BTC) is highly likely to outperform the S&P 500 (\)SPX) on relative strength.
📈 Key Signal: Weekly Bullish Divergence confirmed on the RSI indicator.
#Bitcoin #BTC #SPX500 #BinanceSquare
🚀 $BTC : Weekly Bullish Divergence Confirmed! 🚀
📊 Market Outlook:
While both assets are expected to drop over the coming months, Bitcoin (\(BTC) is highly likely to outperform the S&P 500 (\)SPX) on relative strength.
📈 Key Signal: Weekly Bullish Divergence confirmed on the RSI indicator.
#Bitcoin #BTC #SPX500 #BinanceSquare
📊 Market Outlook:
While both assets are expected to drop over the coming months, Bitcoin (\(BTC) is highly likely to outperform the S&P 500 (\)SPX) on relative strength.
📈 Key Signal: Weekly Bullish Divergence confirmed on the RSI indicator.
#Bitcoin #BTC #SPX500 #BinanceSquare
1
86

·
--
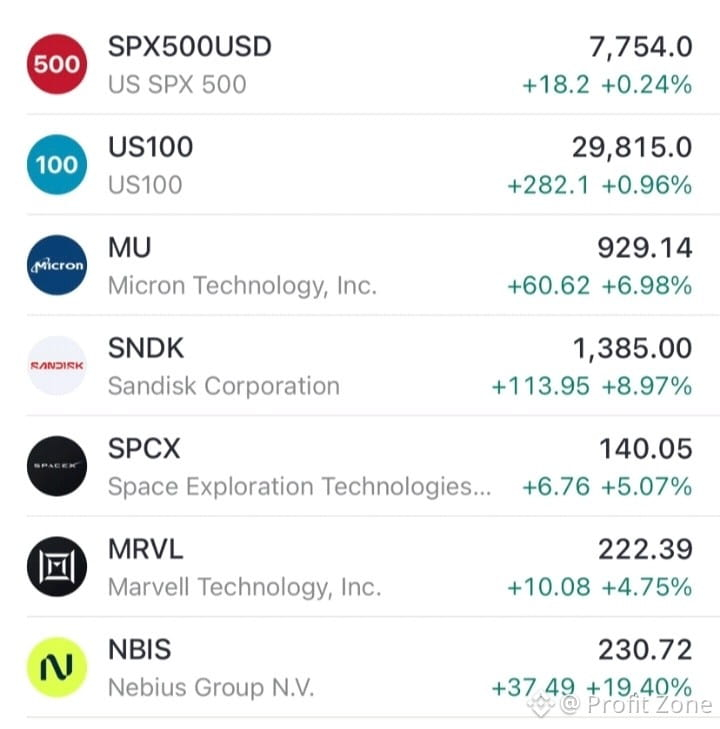
Did panic for a couple of days—then the US stock market hit new highs again, and again, and again 0.0
#SPX500
Did panic for a couple of days—then the US stock market hit new highs again, and again, and again 0.0
#SPX500
#SPX500
1
445

·
--
📢 SPX500 Update — LONG
🛡️ SL moved to breakeven — trade risk-neutral now
Safe kar liya! Ab no-risk trade — shandar move!
⚠️ DYOR. Not financial advice.
#SPX500 #Forex #TradingSignals #Trading
📢 SPX500 Update — LONG
🛡️ SL moved to breakeven — trade risk-neutral now
Safe kar liya! Ab no-risk trade — shandar move!
⚠️ DYOR. Not financial advice.
#SPX500 #Forex #TradingSignals #Trading
🛡️ SL moved to breakeven — trade risk-neutral now
Safe kar liya! Ab no-risk trade — shandar move!
⚠️ DYOR. Not financial advice.
#SPX500 #Forex #TradingSignals #Trading
29

·
--
Partly True
#globalstocksfacelongestlosingstreaksince2023
Global Markets in Freefall: Longest Losing Streak Since 2023
The data is in, and the sentiment is undeniably bearish. As seen on our trading desk, global equities are facing their most severe and prolonged synchronized downturn in over a year. The MSCI ACWI (All Country World Index) is flashing deep red, marking an extended multi-day losing streak that has erased significant value across all major sectors.
Tradeable Asset Trade Plans: NVDA, SPCX, NKE
The macro contagion is affecting every corner of the market. Here are the technical levels to watch for these three key assets:
NVIDIA ($NVDA ): The AI darling has broken below its critical $880 support level. Momentum is heavily skewed to the downside.
Action: Look for a retest of the $800–$825 psychological zone as the next major support target. A bounce from here would be a high-risk short-term play. A breakdown below $800 could open a rapid descent toward $750.
Stop-Loss: Above $900 on any short entries.
SPDR S&P 500 Cash Trust ($SPCX ): The ETF proxy for the S&P 500 is in freefall, having closed below its 50-day and 200-day moving averages.
Stop-Loss: Above $525 for any new short positions.
Nike ($NKE ): Action: NKE is currently hovering around critical support at $94.00. A sustained break below this level is disastrous, targeting the $88.00–$90.00 area. Longs are high-risk until the bleeding stops.
Stop-Loss: Tight stop just below $93.50 for a short-term bounce play; otherwise, favor downside continuation.
Trade the levels, not the hope. The trend is your friend until it bends.
{future}(NVDAUSDT)
{future}(SPCXUSDT)
#StockMarketCrash #NVDA #SPX500 #FinanceNews
#globalstocksfacelongestlosingstreaksince2023
Global Markets in Freefall: Longest Losing Streak Since 2023
The data is in, and the sentiment is undeniably bearish. As seen on our trading desk, global equities are facing their most severe and prolonged synchronized downturn in over a year. The MSCI ACWI (All Country World Index) is flashing deep red, marking an extended multi-day losing streak that has erased significant value across all major sectors.
Tradeable Asset Trade Plans: NVDA, SPCX, NKE
The macro contagion is affecting every corner of the market. Here are the technical levels to watch for these three key assets:
NVIDIA ($NVDA ): The AI darling has broken below its critical $880 support level. Momentum is heavily skewed to the downside.
Action: Look for a retest of the $800–$825 psychological zone as the next major support target. A bounce from here would be a high-risk short-term play. A breakdown below $800 could open a rapid descent toward $750.
Stop-Loss: Above $900 on any short entries.
SPDR S&P 500 Cash Trust ($SPCX ): The ETF proxy for the S&P 500 is in freefall, having closed below its 50-day and 200-day moving averages.
Stop-Loss: Above $525 for any new short positions.
Nike ($NKE ): Action: NKE is currently hovering around critical support at $94.00. A sustained break below this level is disastrous, targeting the $88.00–$90.00 area. Longs are high-risk until the bleeding stops.
Stop-Loss: Tight stop just below $93.50 for a short-term bounce play; otherwise, favor downside continuation.
Trade the levels, not the hope. The trend is your friend until it bends.
#StockMarketCrash #NVDA #SPX500 #FinanceNews
Global Markets in Freefall: Longest Losing Streak Since 2023
The data is in, and the sentiment is undeniably bearish. As seen on our trading desk, global equities are facing their most severe and prolonged synchronized downturn in over a year. The MSCI ACWI (All Country World Index) is flashing deep red, marking an extended multi-day losing streak that has erased significant value across all major sectors.
Tradeable Asset Trade Plans: NVDA, SPCX, NKE
The macro contagion is affecting every corner of the market. Here are the technical levels to watch for these three key assets:
NVIDIA ($NVDA ): The AI darling has broken below its critical $880 support level. Momentum is heavily skewed to the downside.
Action: Look for a retest of the $800–$825 psychological zone as the next major support target. A bounce from here would be a high-risk short-term play. A breakdown below $800 could open a rapid descent toward $750.
Stop-Loss: Above $900 on any short entries.
SPDR S&P 500 Cash Trust ($SPCX ): The ETF proxy for the S&P 500 is in freefall, having closed below its 50-day and 200-day moving averages.
Stop-Loss: Above $525 for any new short positions.
Nike ($NKE ): Action: NKE is currently hovering around critical support at $94.00. A sustained break below this level is disastrous, targeting the $88.00–$90.00 area. Longs are high-risk until the bleeding stops.
Stop-Loss: Tight stop just below $93.50 for a short-term bounce play; otherwise, favor downside continuation.
Trade the levels, not the hope. The trend is your friend until it bends.
#StockMarketCrash #NVDA #SPX500 #FinanceNews

1
2k

·
--
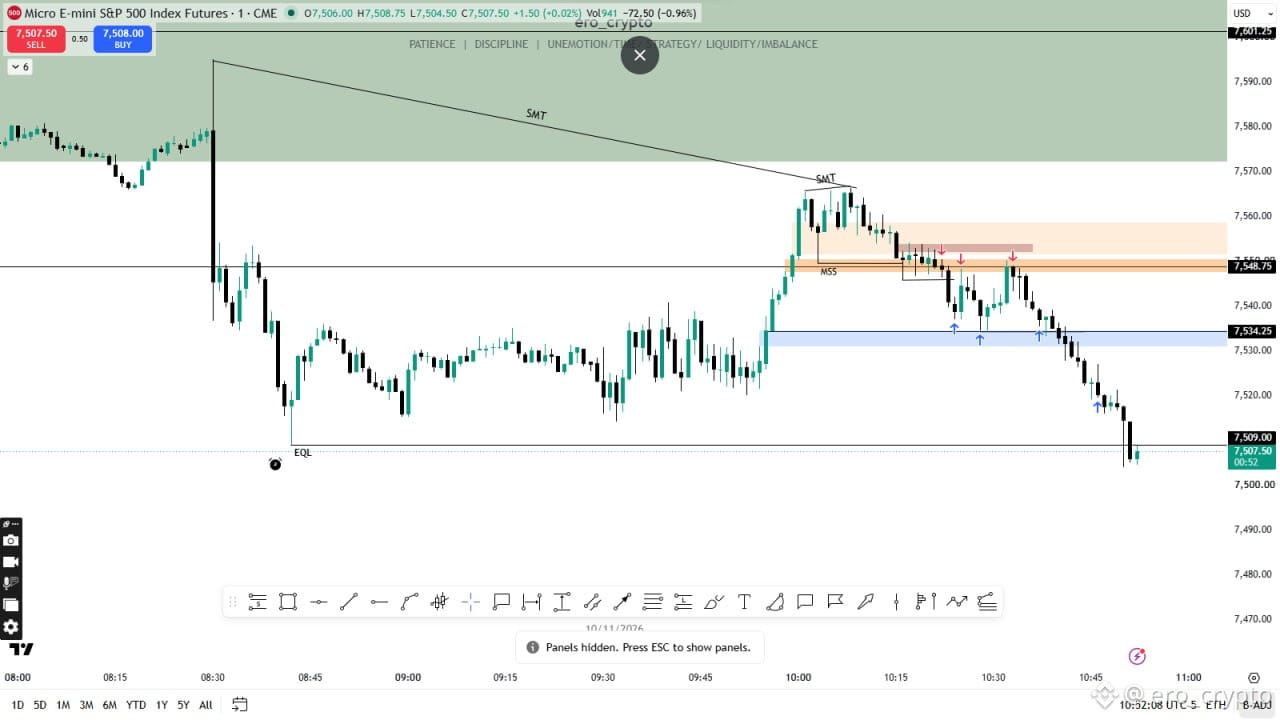
#ES - #SPX500 Even though I had this broader bearish scenario in mind, why did I decide to short earlier instead of waiting for the full move to develop?
Because scenarios are not entries.
We build scenarios based on our directional bias, identify the key liquidity levels and PD arrays, and then patiently wait for price to offer valid entry confirmations aligned with that bias.
I'll be sharing an educational video explaining exactly why I took the earlier short, how I managed the position, partially closed at the precise minor bounce zone, and re-added to my shorts at exact 1-minute rejection levels.
I repeated this process several times, managing risk and executing based on lower-timeframe price action rather than simply holding and hoping for the broader scenario to play out.
The goal is not just to predict where price might go, but to understand how to execute when the right opportunity presents itself.
#ES - #SPX500 Even though I had this broader bearish scenario in mind, why did I decide to short earlier instead of waiting for the full move to develop?
Because scenarios are not entries.
We build scenarios based on our directional bias, identify the key liquidity levels and PD arrays, and then patiently wait for price to offer valid entry confirmations aligned with that bias.
I'll be sharing an educational video explaining exactly why I took the earlier short, how I managed the position, partially closed at the precise minor bounce zone, and re-added to my shorts at exact 1-minute rejection levels.
I repeated this process several times, managing risk and executing based on lower-timeframe price action rather than simply holding and hoping for the broader scenario to play out.
The goal is not just to predict where price might go, but to understand how to execute when the right opportunity presents itself.
Because scenarios are not entries.
We build scenarios based on our directional bias, identify the key liquidity levels and PD arrays, and then patiently wait for price to offer valid entry confirmations aligned with that bias.
I'll be sharing an educational video explaining exactly why I took the earlier short, how I managed the position, partially closed at the precise minor bounce zone, and re-added to my shorts at exact 1-minute rejection levels.
I repeated this process several times, managing risk and executing based on lower-timeframe price action rather than simply holding and hoping for the broader scenario to play out.
The goal is not just to predict where price might go, but to understand how to execute when the right opportunity presents itself.
1
162

·
--
POST 25 : BITCOIN
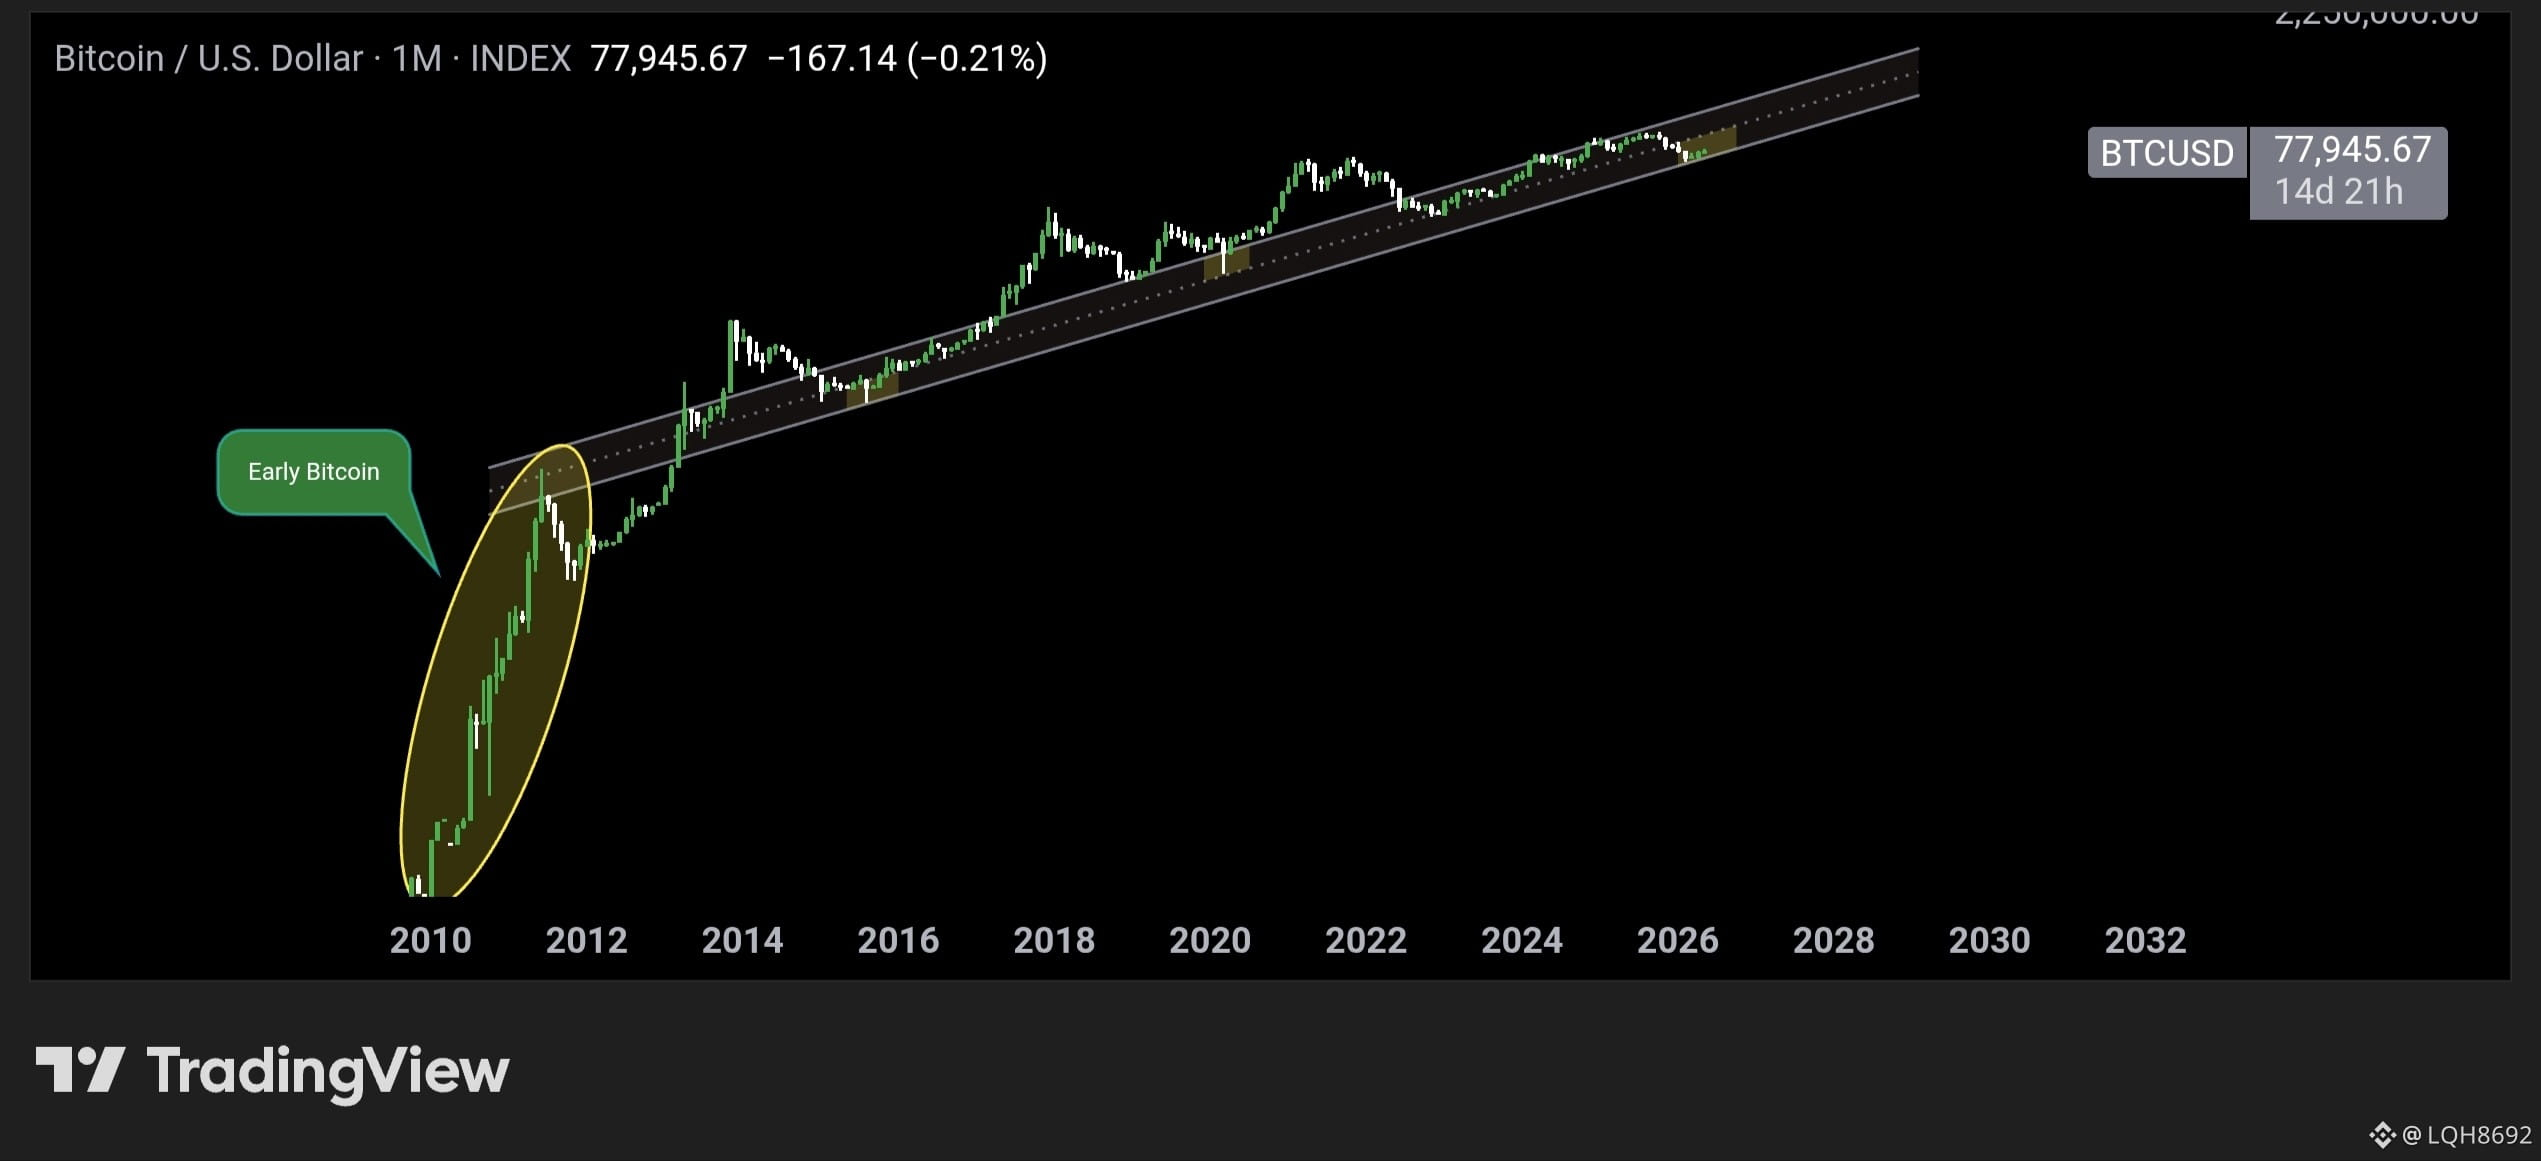
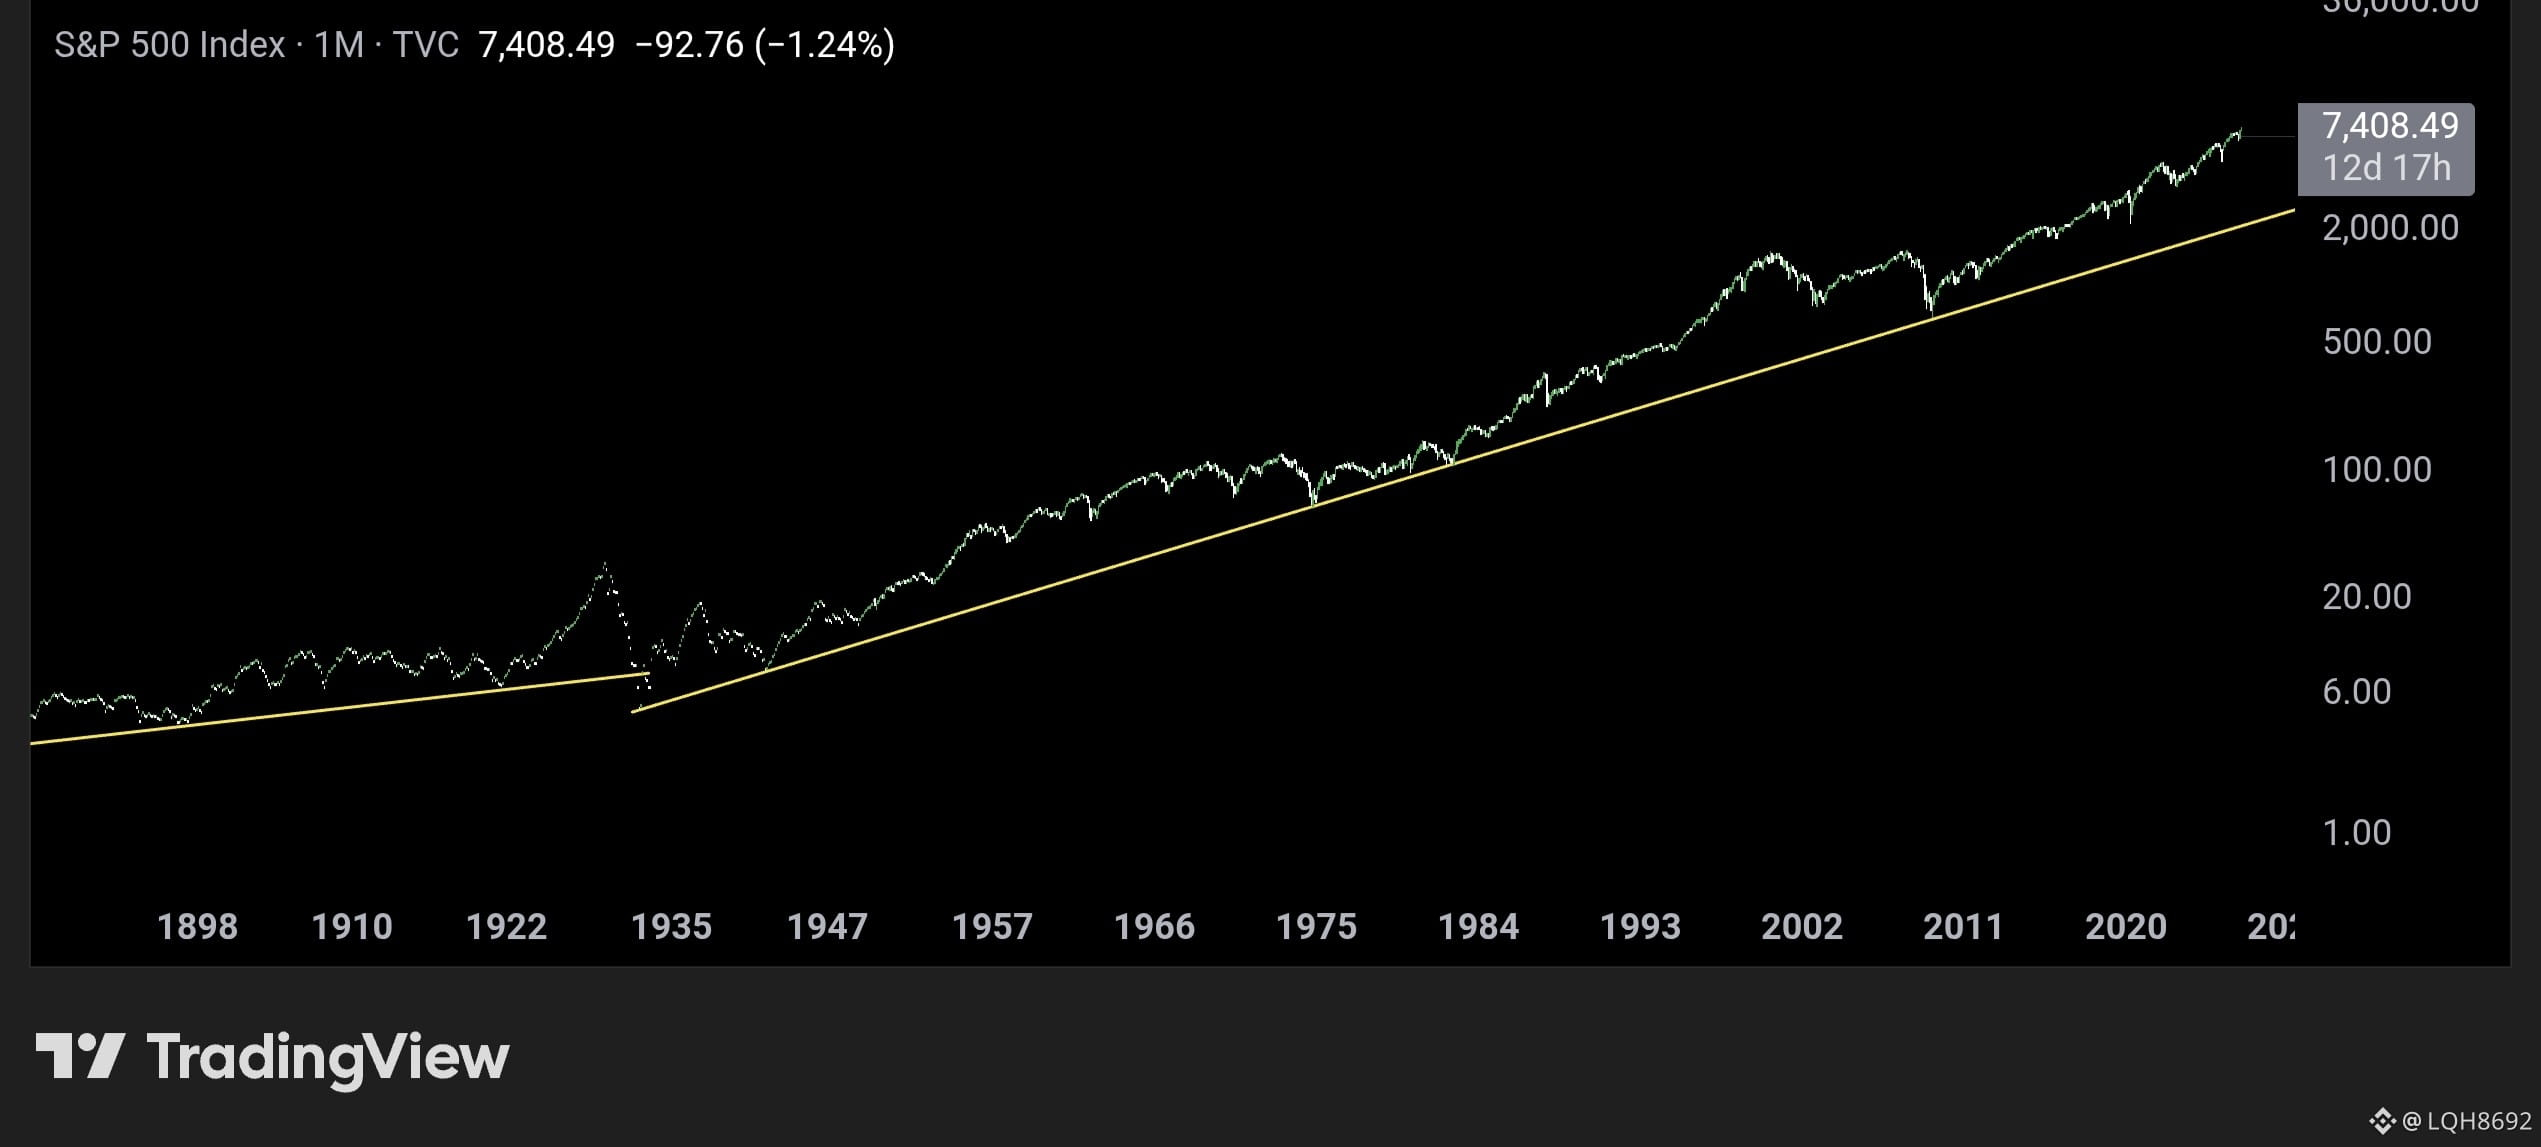
Whether we like it or not, one day Bitcoin will break out of its current trend and start a new one just like #SPX500 <a>...</a> did.
POST 25 : BITCOIN
Whether we like it or not, one day Bitcoin will break out of its current trend and start a new one just like #SPX500 <a>...</a> did.
Whether we like it or not, one day Bitcoin will break out of its current trend and start a new one just like #SPX500 <a>...</a> did.
LQH8692
·
--
POST 24 : BITCOIN
$BTC / #DXY
$BTC / #DXY
1
232


·
--
⚠️ BlackRock freezes clients — is a crisis starting?
The largest private credit funds have limited payments to investors for the first time.
Reasons: rising defaults on loans, pressure from AI on SaaS companies, and panic among depositors.
BlackRock, Blackstone, and Apollo have already shown a decline in stocks, and the market sees parallels with 2008.
A snowball of problems could hit the entire economy — from startups to banks.
#BlackRock #PrivateCredit #CrisisAlert #SPX500 #FinanceNews
⚠️ BlackRock freezes clients — is a crisis starting?
The largest private credit funds have limited payments to investors for the first time.
Reasons: rising defaults on loans, pressure from AI on SaaS companies, and panic among depositors.
BlackRock, Blackstone, and Apollo have already shown a decline in stocks, and the market sees parallels with 2008.
A snowball of problems could hit the entire economy — from startups to banks.
#BlackRock #PrivateCredit #CrisisAlert #SPX500 #FinanceNews
The largest private credit funds have limited payments to investors for the first time.
Reasons: rising defaults on loans, pressure from AI on SaaS companies, and panic among depositors.
BlackRock, Blackstone, and Apollo have already shown a decline in stocks, and the market sees parallels with 2008.
A snowball of problems could hit the entire economy — from startups to banks.
#BlackRock #PrivateCredit #CrisisAlert #SPX500 #FinanceNews
2
176

·
--
Bearish
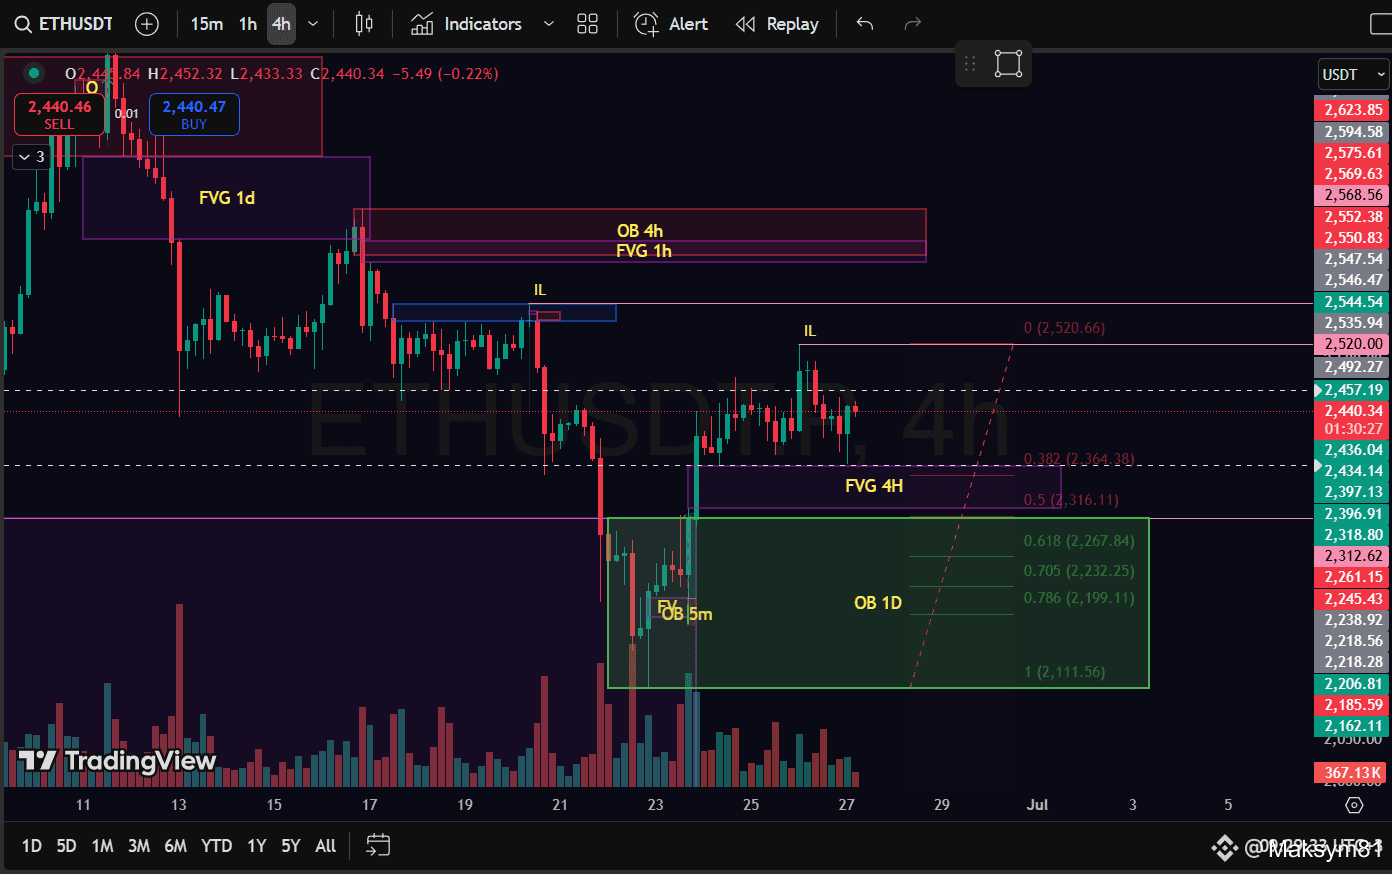
👋I want to share with you a brief overview of $ETH
Right now we are stuck between two interesting zones, and we have accumulated liquidity for both long and short setups.
🟢LONG
- First, I am interested in the double lows that formed around 2375~
- After taking out these local minima, immediately below them is an inefficiency zone (FVG 4H 2375~2325) which could serve as the first area for accumulating positions.
- There is a possibility of full filling of the inefficiency zone, and the formation of a setup.
🔴SHORT
- If we first go to take liquidity at 2520, 2568, above them is a zone that could provoke further movement downwards: an inefficiency zone on 1H+ order block at (4H 2626~2679)
- A good zone because we received a reaction from partial filling (FVG 1D 2644~2743).
👉Given such uncertainty, what should we do?
- Watch for $BTC ; this will help us adjust the picture for the future
- Watch for SPX500; the opening of funds after the withdrawal could be decisive in choosing further positions
🩸Right now, I am more inclined towards a short correction, as I hold a short position on BTC. Let's hold on, keep an eye on it, and please share your thoughts on these two assets; I would be interested to read different viewpoints
#TradersLeague #BTC #ETH #SPX500
👋I want to share with you a brief overview of $ETH
Right now we are stuck between two interesting zones, and we have accumulated liquidity for both long and short setups.
🟢LONG
- First, I am interested in the double lows that formed around 2375~
- After taking out these local minima, immediately below them is an inefficiency zone (FVG 4H 2375~2325) which could serve as the first area for accumulating positions.
- There is a possibility of full filling of the inefficiency zone, and the formation of a setup.
🔴SHORT
- If we first go to take liquidity at 2520, 2568, above them is a zone that could provoke further movement downwards: an inefficiency zone on 1H+ order block at (4H 2626~2679)
- A good zone because we received a reaction from partial filling (FVG 1D 2644~2743).
👉Given such uncertainty, what should we do?
- Watch for $BTC ; this will help us adjust the picture for the future
- Watch for SPX500; the opening of funds after the withdrawal could be decisive in choosing further positions
🩸Right now, I am more inclined towards a short correction, as I hold a short position on BTC. Let's hold on, keep an eye on it, and please share your thoughts on these two assets; I would be interested to read different viewpoints
#TradersLeague #BTC #ETH #SPX500
Right now we are stuck between two interesting zones, and we have accumulated liquidity for both long and short setups.
🟢LONG
- First, I am interested in the double lows that formed around 2375~
- After taking out these local minima, immediately below them is an inefficiency zone (FVG 4H 2375~2325) which could serve as the first area for accumulating positions.
- There is a possibility of full filling of the inefficiency zone, and the formation of a setup.
🔴SHORT
- If we first go to take liquidity at 2520, 2568, above them is a zone that could provoke further movement downwards: an inefficiency zone on 1H+ order block at (4H 2626~2679)
- A good zone because we received a reaction from partial filling (FVG 1D 2644~2743).
👉Given such uncertainty, what should we do?
- Watch for $BTC ; this will help us adjust the picture for the future
- Watch for SPX500; the opening of funds after the withdrawal could be decisive in choosing further positions
🩸Right now, I am more inclined towards a short correction, as I hold a short position on BTC. Let's hold on, keep an eye on it, and please share your thoughts on these two assets; I would be interested to read different viewpoints
#TradersLeague #BTC #ETH #SPX500
1.3k
Log in to explore more content
Join global crypto users on Binance Square
⚡️ Get latest and useful information about crypto.
💬 Trusted by the world’s largest crypto exchange.
👍 Discover real insights from verified creators.
Email / Phone number
Trending Topics
1
#BTCReboundsAbove$60KAmidWhaleDipBuying
56,871 views
293 Discussing
2
#SolanaSets2027RoadmapToDoubleComputeCapacity
41,196 views
821 Discussing
3
#CaliforniaNvidiaProbeExaminesPotentialCriminalViolations
10,942 views
104 Discussing
4
#BlackRockLaunchesHKDollarDigitalLiquidityFund
34,346 views
645 Discussing
5
#NvidiaLoses$2.7TrillionInMonthAndAHalf
71,437 views
290 Discussing
6
#GlobalStocksFaceLongestLosingStreakSince2023
537,897 views
3,370 Discussing
7
#BlackRockIBITPostsRecord$541MSingleDayOutflow
88,232 views
177 Discussing
8
#AnthropicPlungesTowardIPOPriceonDay2
295,335 views
2,261 Discussing
9
#TwentyOneCapitalAdds172.25BTC
153,820 views
1,582 Discussing
10
#HKBillWouldExcludeTokenizedDepositsFromVirtualAssets
17,392 views
102 Discussing