
#smartcryptomedia
smartcryptomedia
25,922 views
235 Discussing
Hot
Latest

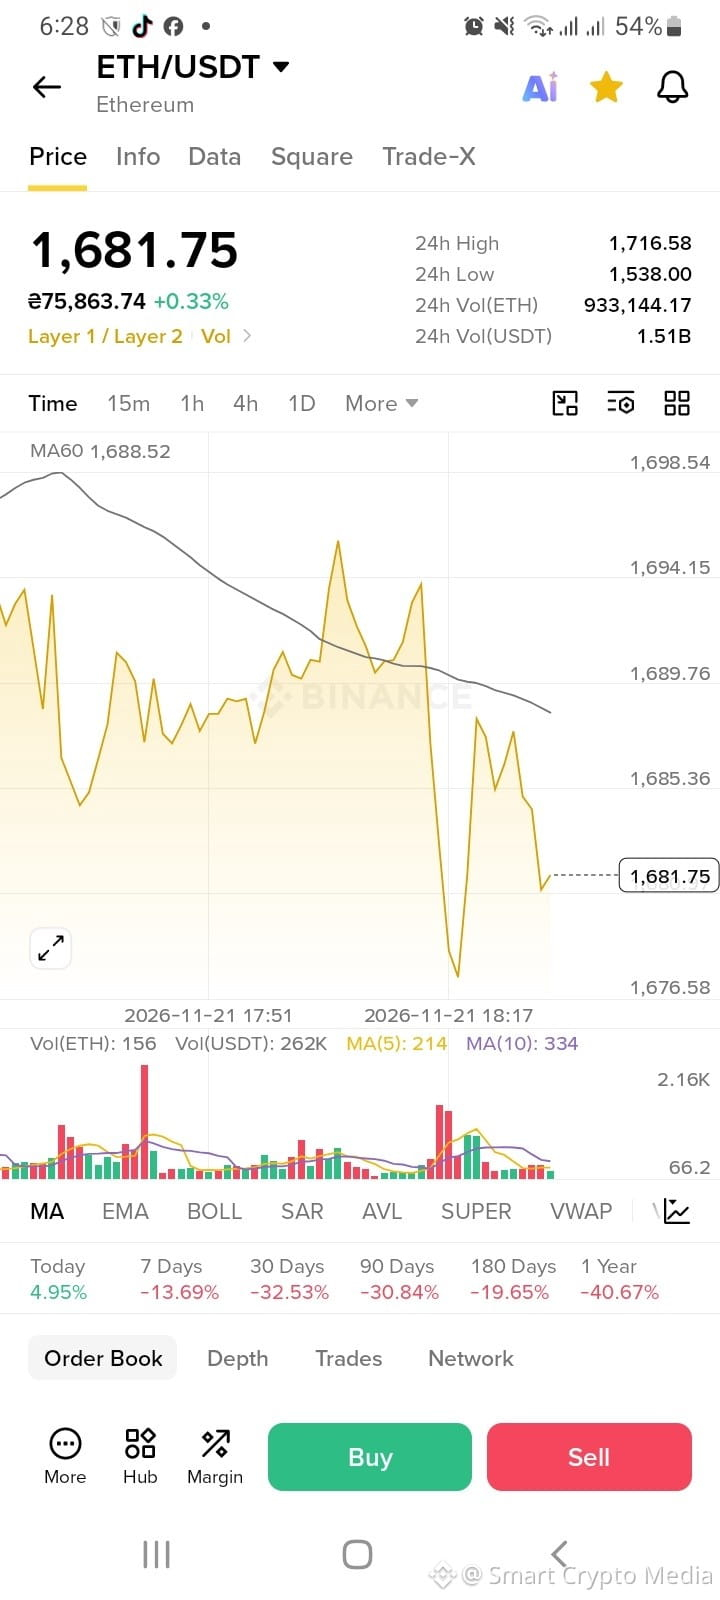
Honestly, the $ETH chart feels confusing at first glance.
The daily number is green. +0.33%.
Then I looked at the other numbers.
$1,681.75 price. The MA60 sits at $1,688.52. Seven-day performance is -13.69%, while the 30-day figure is -32.53%.
That's a very different mood from the small green number at the top.
I think this is where it's easy to become emotionally attached to the timeframe you're watching. If you're looking at the last few candles, a bounce can feel like a recovery.
Zoom out, and the damage becomes harder to ignore.
I'm not saying ETH can't recover. I just don't think this screenshot gives enough evidence to call a trend reversal yet.
Sometimes the most useful thing on a chart isn't the candle that looks exciting. It's the numbers that remind you to slow down.
When ETH makes these small rebounds after a heavy drop, do you watch the short timeframe or step back and zoom out?
#ETH #SmartCryptoMedia
Honestly, the $ETH chart feels confusing at first glance.
The daily number is green. +0.33%.
Then I looked at the other numbers.
$1,681.75 price. The MA60 sits at $1,688.52. Seven-day performance is -13.69%, while the 30-day figure is -32.53%.
That's a very different mood from the small green number at the top.
I think this is where it's easy to become emotionally attached to the timeframe you're watching. If you're looking at the last few candles, a bounce can feel like a recovery.
Zoom out, and the damage becomes harder to ignore.
I'm not saying ETH can't recover. I just don't think this screenshot gives enough evidence to call a trend reversal yet.
Sometimes the most useful thing on a chart isn't the candle that looks exciting. It's the numbers that remind you to slow down.
When ETH makes these small rebounds after a heavy drop, do you watch the short timeframe or step back and zoom out?
#ETH #SmartCryptoMedia
The daily number is green. +0.33%.
Then I looked at the other numbers.
$1,681.75 price. The MA60 sits at $1,688.52. Seven-day performance is -13.69%, while the 30-day figure is -32.53%.
That's a very different mood from the small green number at the top.
I think this is where it's easy to become emotionally attached to the timeframe you're watching. If you're looking at the last few candles, a bounce can feel like a recovery.
Zoom out, and the damage becomes harder to ignore.
I'm not saying ETH can't recover. I just don't think this screenshot gives enough evidence to call a trend reversal yet.
Sometimes the most useful thing on a chart isn't the candle that looks exciting. It's the numbers that remind you to slow down.
When ETH makes these small rebounds after a heavy drop, do you watch the short timeframe or step back and zoom out?
#ETH #SmartCryptoMedia
166
Article
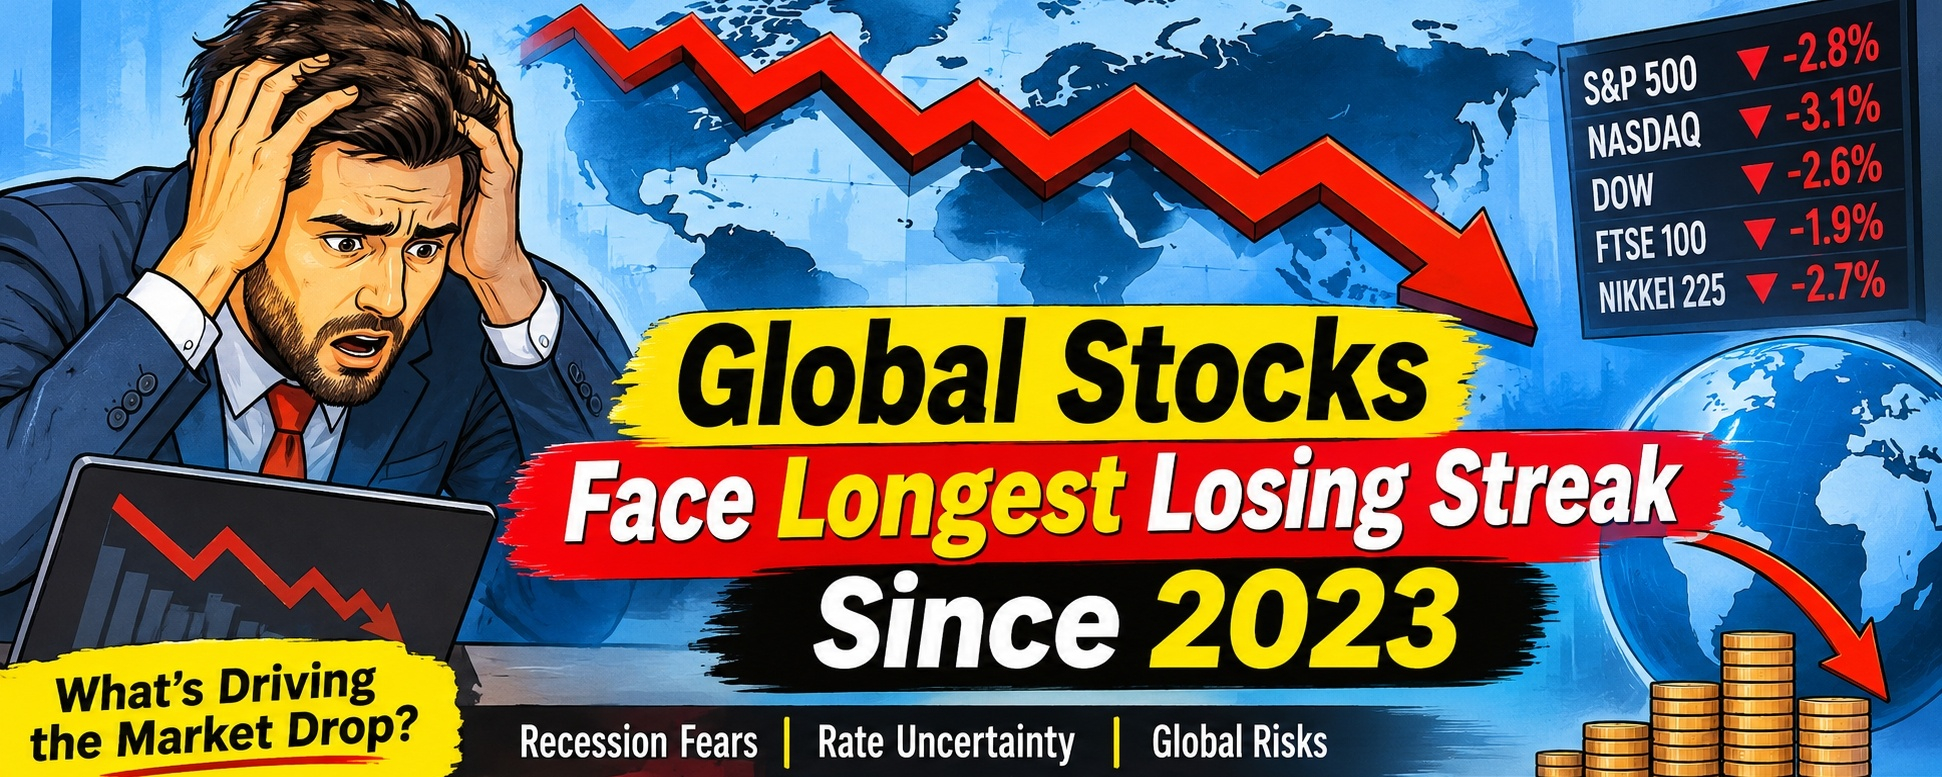
Global Stocks Just Recorded Their Longest Losing Streak Since 2023. Something Is Changing. Global Stocks Just Recorded Their Longest Losing Streak Since 2023. Something Is Changing.
Seven consecutive losing sessions.
That's where the MSCI All Country World Index stands, marking its longest losing streak since September 2023.
But honestly, the number itself isn't what interests me most.
It's what might be happening behind it.
For months, investors were willing to pay a premium for almost anything connected to artificial intelligence. Chips, data centers, computing infrastructure and AI software all benefited from expectations of enormous future growth.
And the excitement wasn't entirely unreasonable. AI is changing how businesses operate.
But there's a difference between believing in a technology and believing every investment connected to it is worth its current price.
I think that's where the market is starting to get uncomfortable.
The question is no longer just how big AI can become. It's how much money companies can actually make from it.
1. AI is growing, but the economics still have to work
Here's the part I think deserves more attention.
Building AI infrastructure requires enormous investment. Companies need computing capacity, energy, data centers, specialized hardware and ongoing development.
All of that costs money before the expected returns fully arrive.
The economic equation is relatively simple:
More investment → higher capital requirements → pressure to generate revenue → the need for sustainable profits.
If spending keeps increasing faster than the cash flows it eventually produces, investors have a reason to reconsider valuations.
And that's an important distinction.
AI adoption could continue accelerating while some AI-related stocks lose value.
Both things can happen at the same time.
The technology doesn't have to fail for investors to question whether they paid too much for the companies building it.
2. Anthropic's debut tells an interesting story
Anthropic's stock-market debut attracted considerable attention, but its strong opening performance didn't reverse the broader market weakness.
That contrast is worth looking at.
On November 19, the S&P 500 dropped 2%, extending its losing streak to six sessions. More than 90% of its constituent stocks finished lower.
Meanwhile, an individual AI-related listing could still attract buyers.
So what does that tell us?
Investors can remain interested in individual opportunities while becoming increasingly cautious about the broader market.
A successful company debut doesn't automatically mean confidence in the entire AI sector is returning.
I'd be careful about confusing enthusiasm for one company with strength across an entire investment narrative.
3. Why I'm paying attention from a crypto perspective
This is where traditional markets become relevant to cryptocurrency.
Bitcoin isn't a technology stock. Its market structure, supply dynamics and investment drivers are different.
Still, it doesn't exist in isolation from the global financial system.
When investors become less comfortable taking risks, that change in sentiment can reach multiple asset classes.
Liquidity, interest-rate expectations and institutional positioning can all influence how much exposure investors are willing to maintain.
But there's an important distinction here: Bitcoin doesn't have to follow the S&P 500.
A stock-market correction doesn't automatically invalidate a Bitcoin rally.
What matters is whether digital-asset demand remains strong enough to support its own market.
For me, that's a much more useful question than simply asking whether stocks and crypto will move in the same direction.
4. Is this just a correction, or are expectations changing?
I'm not convinced that seven consecutive losing sessions are enough to declare a structural bear market.
That would be jumping too far ahead.
There are different explanations for what we're seeing:
- Investors may simply be correcting valuations that became too optimistic.
- Companies may be struggling to convert heavy investment into sustainable earnings.
- Broader financial conditions may be making investors less willing to hold risky assets.
These possibilities can look similar on a price chart.
But they mean very different things for the months ahead.
A temporary valuation reset could create a different opportunity from a prolonged deterioration in business fundamentals.
That's why I would rather understand the reason behind the decline than rush to label the market.
5. Three things I'm watching now
There are three signals I think deserve attention.
First, market participation.
Does selling continue spreading beyond AI-related companies, or does weakness begin to narrow?
Second, AI profitability.
Are investors starting to demand actual financial returns instead of rewarding every new investment announcement?
Third, global liquidity.
Are financial conditions becoming more supportive or less supportive of risk-taking across equities and cryptocurrency?
None of these signals can tell us exactly where prices go next.
But together, they can help us understand whether the current weakness is mainly about valuation or something deeper.
My final thought
Here's what I find most interesting about this market.
AI could become one of the most important technologies of our generation, and investors could still lose confidence in the prices they're paying for AI companies today.
Those two ideas aren't contradictory.
The same principle applies to cryptocurrency: a promising long-term narrative doesn't automatically guarantee attractive valuations or uninterrupted market growth.
Perhaps the next phase won't be decided by who tells the most convincing story.
It may be decided by who can actually deliver the economic results behind it.
So I'm curious about your perspective:
If global markets are entering a more selective investment environment, what will drive the next major recovery?
A return of confidence in AI profitability, or stronger global liquidity that brings risk appetite back across financial markets?
#GlobalMarkets #Bitcoin #AI #CryptoMarket #MarketAnalysis
Global Stocks Just Recorded Their Longest Losing Streak Since 2023. Something Is Changing.
Global Stocks Just Recorded Their Longest Losing Streak Since 2023. Something Is Changing.
Seven consecutive losing sessions.
That's where the MSCI All Country World Index stands, marking its longest losing streak since September 2023.
But honestly, the number itself isn't what interests me most.
It's what might be happening behind it.
For months, investors were willing to pay a premium for almost anything connected to artificial intelligence. Chips, data centers, computing infrastructure and AI software all benefited from expectations of enormous future growth.
And the excitement wasn't entirely unreasonable. AI is changing how businesses operate.
But there's a difference between believing in a technology and believing every investment connected to it is worth its current price.
I think that's where the market is starting to get uncomfortable.
The question is no longer just how big AI can become. It's how much money companies can actually make from it.
1. AI is growing, but the economics still have to work
Here's the part I think deserves more attention.
Building AI infrastructure requires enormous investment. Companies need computing capacity, energy, data centers, specialized hardware and ongoing development.
All of that costs money before the expected returns fully arrive.
The economic equation is relatively simple:
More investment → higher capital requirements → pressure to generate revenue → the need for sustainable profits.
If spending keeps increasing faster than the cash flows it eventually produces, investors have a reason to reconsider valuations.
And that's an important distinction.
AI adoption could continue accelerating while some AI-related stocks lose value.
Both things can happen at the same time.
The technology doesn't have to fail for investors to question whether they paid too much for the companies building it.
2. Anthropic's debut tells an interesting story
Anthropic's stock-market debut attracted considerable attention, but its strong opening performance didn't reverse the broader market weakness.
That contrast is worth looking at.
On November 19, the S&P 500 dropped 2%, extending its losing streak to six sessions. More than 90% of its constituent stocks finished lower.
Meanwhile, an individual AI-related listing could still attract buyers.
So what does that tell us?
Investors can remain interested in individual opportunities while becoming increasingly cautious about the broader market.
A successful company debut doesn't automatically mean confidence in the entire AI sector is returning.
I'd be careful about confusing enthusiasm for one company with strength across an entire investment narrative.
3. Why I'm paying attention from a crypto perspective
This is where traditional markets become relevant to cryptocurrency.
Bitcoin isn't a technology stock. Its market structure, supply dynamics and investment drivers are different.
Still, it doesn't exist in isolation from the global financial system.
When investors become less comfortable taking risks, that change in sentiment can reach multiple asset classes.
Liquidity, interest-rate expectations and institutional positioning can all influence how much exposure investors are willing to maintain.
But there's an important distinction here: Bitcoin doesn't have to follow the S&P 500.
A stock-market correction doesn't automatically invalidate a Bitcoin rally.
What matters is whether digital-asset demand remains strong enough to support its own market.
For me, that's a much more useful question than simply asking whether stocks and crypto will move in the same direction.
4. Is this just a correction, or are expectations changing?
I'm not convinced that seven consecutive losing sessions are enough to declare a structural bear market.
That would be jumping too far ahead.
There are different explanations for what we're seeing:
- Investors may simply be correcting valuations that became too optimistic.
- Companies may be struggling to convert heavy investment into sustainable earnings.
- Broader financial conditions may be making investors less willing to hold risky assets.
These possibilities can look similar on a price chart.
But they mean very different things for the months ahead.
A temporary valuation reset could create a different opportunity from a prolonged deterioration in business fundamentals.
That's why I would rather understand the reason behind the decline than rush to label the market.
5. Three things I'm watching now
There are three signals I think deserve attention.
First, market participation.
Does selling continue spreading beyond AI-related companies, or does weakness begin to narrow?
Second, AI profitability.
Are investors starting to demand actual financial returns instead of rewarding every new investment announcement?
Third, global liquidity.
Are financial conditions becoming more supportive or less supportive of risk-taking across equities and cryptocurrency?
None of these signals can tell us exactly where prices go next.
But together, they can help us understand whether the current weakness is mainly about valuation or something deeper.
My final thought
Here's what I find most interesting about this market.
AI could become one of the most important technologies of our generation, and investors could still lose confidence in the prices they're paying for AI companies today.
Those two ideas aren't contradictory.
The same principle applies to cryptocurrency: a promising long-term narrative doesn't automatically guarantee attractive valuations or uninterrupted market growth.
Perhaps the next phase won't be decided by who tells the most convincing story.
It may be decided by who can actually deliver the economic results behind it.
So I'm curious about your perspective:
If global markets are entering a more selective investment environment, what will drive the next major recovery?
A return of confidence in AI profitability, or stronger global liquidity that brings risk appetite back across financial markets?
#GlobalMarkets #Bitcoin #AI #CryptoMarket #MarketAnalysis
Seven consecutive losing sessions.
That's where the MSCI All Country World Index stands, marking its longest losing streak since September 2023.
But honestly, the number itself isn't what interests me most.
It's what might be happening behind it.
For months, investors were willing to pay a premium for almost anything connected to artificial intelligence. Chips, data centers, computing infrastructure and AI software all benefited from expectations of enormous future growth.
And the excitement wasn't entirely unreasonable. AI is changing how businesses operate.
But there's a difference between believing in a technology and believing every investment connected to it is worth its current price.
I think that's where the market is starting to get uncomfortable.
The question is no longer just how big AI can become. It's how much money companies can actually make from it.
1. AI is growing, but the economics still have to work
Here's the part I think deserves more attention.
Building AI infrastructure requires enormous investment. Companies need computing capacity, energy, data centers, specialized hardware and ongoing development.
All of that costs money before the expected returns fully arrive.
The economic equation is relatively simple:
More investment → higher capital requirements → pressure to generate revenue → the need for sustainable profits.
If spending keeps increasing faster than the cash flows it eventually produces, investors have a reason to reconsider valuations.
And that's an important distinction.
AI adoption could continue accelerating while some AI-related stocks lose value.
Both things can happen at the same time.
The technology doesn't have to fail for investors to question whether they paid too much for the companies building it.
2. Anthropic's debut tells an interesting story
Anthropic's stock-market debut attracted considerable attention, but its strong opening performance didn't reverse the broader market weakness.
That contrast is worth looking at.
On November 19, the S&P 500 dropped 2%, extending its losing streak to six sessions. More than 90% of its constituent stocks finished lower.
Meanwhile, an individual AI-related listing could still attract buyers.
So what does that tell us?
Investors can remain interested in individual opportunities while becoming increasingly cautious about the broader market.
A successful company debut doesn't automatically mean confidence in the entire AI sector is returning.
I'd be careful about confusing enthusiasm for one company with strength across an entire investment narrative.
3. Why I'm paying attention from a crypto perspective
This is where traditional markets become relevant to cryptocurrency.
Bitcoin isn't a technology stock. Its market structure, supply dynamics and investment drivers are different.
Still, it doesn't exist in isolation from the global financial system.
When investors become less comfortable taking risks, that change in sentiment can reach multiple asset classes.
Liquidity, interest-rate expectations and institutional positioning can all influence how much exposure investors are willing to maintain.
But there's an important distinction here: Bitcoin doesn't have to follow the S&P 500.
A stock-market correction doesn't automatically invalidate a Bitcoin rally.
What matters is whether digital-asset demand remains strong enough to support its own market.
For me, that's a much more useful question than simply asking whether stocks and crypto will move in the same direction.
4. Is this just a correction, or are expectations changing?
I'm not convinced that seven consecutive losing sessions are enough to declare a structural bear market.
That would be jumping too far ahead.
There are different explanations for what we're seeing:
- Investors may simply be correcting valuations that became too optimistic.
- Companies may be struggling to convert heavy investment into sustainable earnings.
- Broader financial conditions may be making investors less willing to hold risky assets.
These possibilities can look similar on a price chart.
But they mean very different things for the months ahead.
A temporary valuation reset could create a different opportunity from a prolonged deterioration in business fundamentals.
That's why I would rather understand the reason behind the decline than rush to label the market.
5. Three things I'm watching now
There are three signals I think deserve attention.
First, market participation.
Does selling continue spreading beyond AI-related companies, or does weakness begin to narrow?
Second, AI profitability.
Are investors starting to demand actual financial returns instead of rewarding every new investment announcement?
Third, global liquidity.
Are financial conditions becoming more supportive or less supportive of risk-taking across equities and cryptocurrency?
None of these signals can tell us exactly where prices go next.
But together, they can help us understand whether the current weakness is mainly about valuation or something deeper.
My final thought
Here's what I find most interesting about this market.
AI could become one of the most important technologies of our generation, and investors could still lose confidence in the prices they're paying for AI companies today.
Those two ideas aren't contradictory.
The same principle applies to cryptocurrency: a promising long-term narrative doesn't automatically guarantee attractive valuations or uninterrupted market growth.
Perhaps the next phase won't be decided by who tells the most convincing story.
It may be decided by who can actually deliver the economic results behind it.
So I'm curious about your perspective:
If global markets are entering a more selective investment environment, what will drive the next major recovery?
A return of confidence in AI profitability, or stronger global liquidity that brings risk appetite back across financial markets?
#GlobalMarkets #Bitcoin #AI #CryptoMarket #MarketAnalysis
1
166
$ANTHROPIC I keep coming back to one question: what exactly are investors paying $1.75 trillion for?
Anthropic's first trading day was impressive. Its shares closed at $97.17 after an $83 IPO, putting its fully diluted valuation at roughly $1.75 trillion.
But the number that interests me more is its $81 billion annualized revenue run rate in October.
That's serious commercial demand. Claude is no longer just an interesting AI product. Businesses are paying to use it at scale.
Still, there's another side to this story.
AI growth isn't free. Anthropic spent nearly $9 billion on computing infrastructure in the first half of 2026, followed by another $5 billion in Q3.
Interestingly, its compute efficiency has improved more than fourfold since Q1 2025. But Q3 also showed how expensive additional computing capacity can become.
And this is where I think the real valuation debate begins.
Anthropic has nearly $900 billion in computing commitments with infrastructure partners. It must turn that capacity into revenue while managing costs, competition and execution risks.
So, I'm not convinced that revenue growth alone justifies a trillion-dollar valuation.
The real test is whether improving AI efficiency can keep pace with the enormous cost of scaling.
Would you value Anthropic primarily on its future AI dominance, or wait until its profitability proves the business model can support that valuation?
#Anthropic #AI #SmartCryptoMedia
$ANTHROPIC I keep coming back to one question: what exactly are investors paying $1.75 trillion for?
Anthropic's first trading day was impressive. Its shares closed at $97.17 after an $83 IPO, putting its fully diluted valuation at roughly $1.75 trillion.
But the number that interests me more is its $81 billion annualized revenue run rate in October.
That's serious commercial demand. Claude is no longer just an interesting AI product. Businesses are paying to use it at scale.
Still, there's another side to this story.
AI growth isn't free. Anthropic spent nearly $9 billion on computing infrastructure in the first half of 2026, followed by another $5 billion in Q3.
Interestingly, its compute efficiency has improved more than fourfold since Q1 2025. But Q3 also showed how expensive additional computing capacity can become.
And this is where I think the real valuation debate begins.
Anthropic has nearly $900 billion in computing commitments with infrastructure partners. It must turn that capacity into revenue while managing costs, competition and execution risks.
So, I'm not convinced that revenue growth alone justifies a trillion-dollar valuation.
The real test is whether improving AI efficiency can keep pace with the enormous cost of scaling.
Would you value Anthropic primarily on its future AI dominance, or wait until its profitability proves the business model can support that valuation?
#Anthropic #AI #SmartCryptoMedia
Anthropic's first trading day was impressive. Its shares closed at $97.17 after an $83 IPO, putting its fully diluted valuation at roughly $1.75 trillion.
But the number that interests me more is its $81 billion annualized revenue run rate in October.
That's serious commercial demand. Claude is no longer just an interesting AI product. Businesses are paying to use it at scale.
Still, there's another side to this story.
AI growth isn't free. Anthropic spent nearly $9 billion on computing infrastructure in the first half of 2026, followed by another $5 billion in Q3.
Interestingly, its compute efficiency has improved more than fourfold since Q1 2025. But Q3 also showed how expensive additional computing capacity can become.
And this is where I think the real valuation debate begins.
Anthropic has nearly $900 billion in computing commitments with infrastructure partners. It must turn that capacity into revenue while managing costs, competition and execution risks.
So, I'm not convinced that revenue growth alone justifies a trillion-dollar valuation.
The real test is whether improving AI efficiency can keep pace with the enormous cost of scaling.
Would you value Anthropic primarily on its future AI dominance, or wait until its profitability proves the business model can support that valuation?
#Anthropic #AI #SmartCryptoMedia

133
Verified
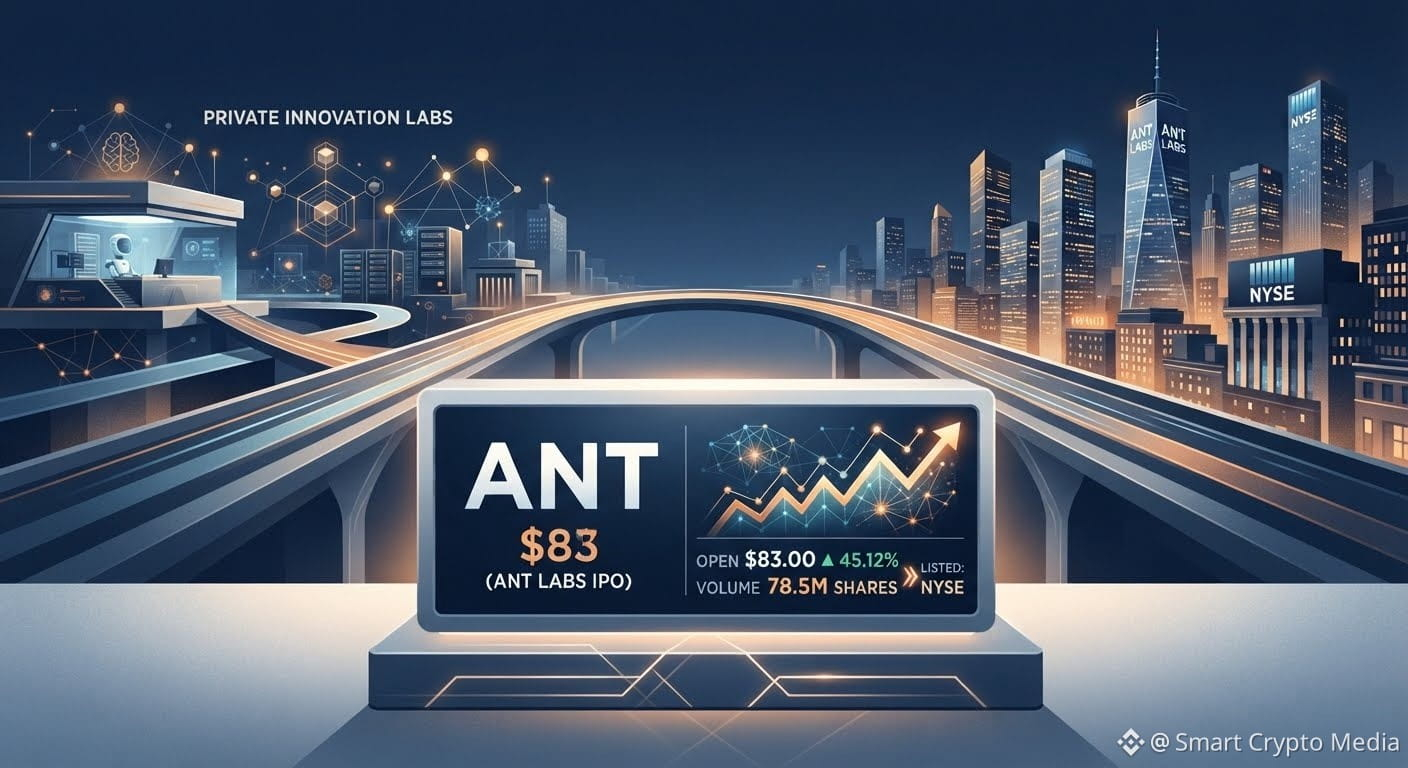
$ANT I keep coming back to one thing about Anthropic's IPO: the timing.
An $83 opening price.
Approximately $81.3 billion raised.
A major AI company preparing to enter public markets under the ticker ANT.
It's a remarkable moment for the AI industry.
But there's something interesting about the bigger picture.
We're watching AI move beyond private-company fundraising and into an environment where ordinary public-market investors can follow its financial performance.
That changes the conversation.
Until now, much of the discussion has centered on model capabilities, AI adoption, partnerships and future potential.
Now, revenue growth, infrastructure expenses, competition and profitability will receive even more attention.
And honestly, I think that transition is worth watching more closely than the IPO headline itself.
The next chapter will tell us whether public-market expectations match the realities of building frontier AI technology.
I'm curious about how people approach moments like this.
What did you do when a major technology company you followed finally moved from private markets to a public listing: study its financials first, or wait to see how the market responds?
#AI #SmartCryptoMedia
$ANT I keep coming back to one thing about Anthropic's IPO: the timing.
An $83 opening price.
Approximately $81.3 billion raised.
A major AI company preparing to enter public markets under the ticker ANT.
It's a remarkable moment for the AI industry.
But there's something interesting about the bigger picture.
We're watching AI move beyond private-company fundraising and into an environment where ordinary public-market investors can follow its financial performance.
That changes the conversation.
Until now, much of the discussion has centered on model capabilities, AI adoption, partnerships and future potential.
Now, revenue growth, infrastructure expenses, competition and profitability will receive even more attention.
And honestly, I think that transition is worth watching more closely than the IPO headline itself.
The next chapter will tell us whether public-market expectations match the realities of building frontier AI technology.
I'm curious about how people approach moments like this.
What did you do when a major technology company you followed finally moved from private markets to a public listing: study its financials first, or wait to see how the market responds?
#AI #SmartCryptoMedia
An $83 opening price.
Approximately $81.3 billion raised.
A major AI company preparing to enter public markets under the ticker ANT.
It's a remarkable moment for the AI industry.
But there's something interesting about the bigger picture.
We're watching AI move beyond private-company fundraising and into an environment where ordinary public-market investors can follow its financial performance.
That changes the conversation.
Until now, much of the discussion has centered on model capabilities, AI adoption, partnerships and future potential.
Now, revenue growth, infrastructure expenses, competition and profitability will receive even more attention.
And honestly, I think that transition is worth watching more closely than the IPO headline itself.
The next chapter will tell us whether public-market expectations match the realities of building frontier AI technology.
I'm curious about how people approach moments like this.
What did you do when a major technology company you followed finally moved from private markets to a public listing: study its financials first, or wait to see how the market responds?
#AI #SmartCryptoMedia
804
$BTC Moves Fast. Understanding What Happens Between Those Moves Is Harder.
There's something interesting about watching Bitcoin during a volatile session.
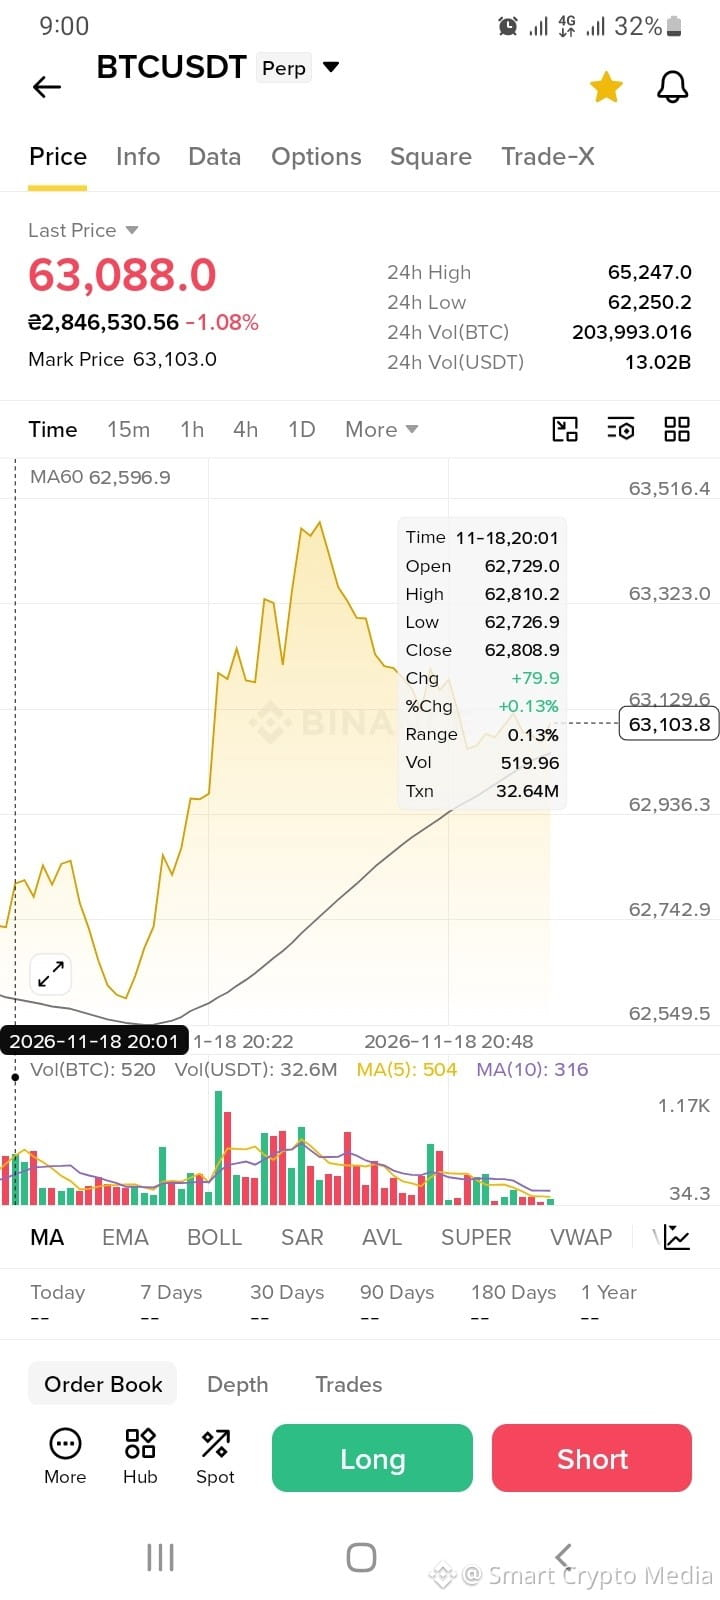
One moment, BTC is struggling around the lower $62,000 area. Then buying activity increases, price moves sharply upward, and suddenly everyone starts paying attention.
But after that?
The market becomes quieter.
That's what caught my attention in this chart.
Bitcoin climbed toward $63,500 before pulling back toward $63,088. The move above the MA60 is encouraging, but the declining volume during the later part of the movement makes the picture less straightforward.
And honestly, that's where market analysis gets interesting.
Not every upward move needs to become a major rally. Not every pullback means the recovery has failed.
Sometimes the market simply needs time to establish its next direction.
The 24-hour high of $65,247 and low of $62,250 show how much uncertainty has been present.
For me, the important lesson here is patience.
It's easy to become excited when green candles appear. It's equally easy to become pessimistic when the price starts falling.
But neither reaction explains what the market is actually doing.
Bitcoin is currently giving us a situation worth observing, not a guaranteed outcome.
Do you prefer analyzing the first breakout, or waiting to see whether Bitcoin can actually maintain its momentum?
#Bitcoin #BTCUSDT #SmartCryptoMedia
$BTC Moves Fast. Understanding What Happens Between Those Moves Is Harder.
There's something interesting about watching Bitcoin during a volatile session.
One moment, BTC is struggling around the lower $62,000 area. Then buying activity increases, price moves sharply upward, and suddenly everyone starts paying attention.
But after that?
The market becomes quieter.
That's what caught my attention in this chart.
Bitcoin climbed toward $63,500 before pulling back toward $63,088. The move above the MA60 is encouraging, but the declining volume during the later part of the movement makes the picture less straightforward.
And honestly, that's where market analysis gets interesting.
Not every upward move needs to become a major rally. Not every pullback means the recovery has failed.
Sometimes the market simply needs time to establish its next direction.
The 24-hour high of $65,247 and low of $62,250 show how much uncertainty has been present.
For me, the important lesson here is patience.
It's easy to become excited when green candles appear. It's equally easy to become pessimistic when the price starts falling.
But neither reaction explains what the market is actually doing.
Bitcoin is currently giving us a situation worth observing, not a guaranteed outcome.
Do you prefer analyzing the first breakout, or waiting to see whether Bitcoin can actually maintain its momentum?
#Bitcoin #BTCUSDT #SmartCryptoMedia
There's something interesting about watching Bitcoin during a volatile session.
One moment, BTC is struggling around the lower $62,000 area. Then buying activity increases, price moves sharply upward, and suddenly everyone starts paying attention.
But after that?
The market becomes quieter.
That's what caught my attention in this chart.
Bitcoin climbed toward $63,500 before pulling back toward $63,088. The move above the MA60 is encouraging, but the declining volume during the later part of the movement makes the picture less straightforward.
And honestly, that's where market analysis gets interesting.
Not every upward move needs to become a major rally. Not every pullback means the recovery has failed.
Sometimes the market simply needs time to establish its next direction.
The 24-hour high of $65,247 and low of $62,250 show how much uncertainty has been present.
For me, the important lesson here is patience.
It's easy to become excited when green candles appear. It's equally easy to become pessimistic when the price starts falling.
But neither reaction explains what the market is actually doing.
Bitcoin is currently giving us a situation worth observing, not a guaranteed outcome.
Do you prefer analyzing the first breakout, or waiting to see whether Bitcoin can actually maintain its momentum?
#Bitcoin #BTCUSDT #SmartCryptoMedia
190
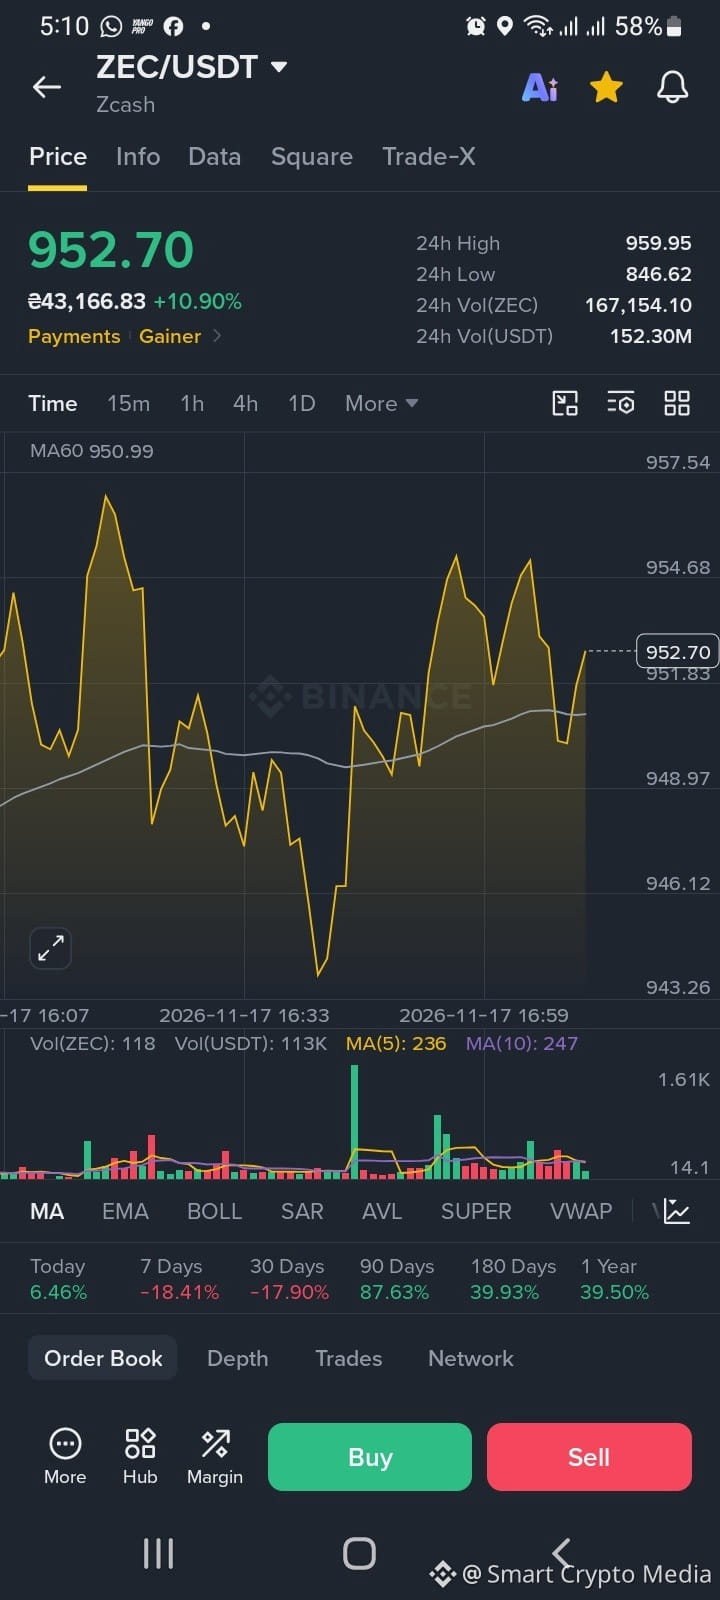
$ZEC Is Green Today. But the Market Story Is Not That Simple.
There is something interesting about watching Zcash right now.
One day, the market looks weak. Then suddenly, a strong recovery appears, and everyone starts paying attention again.
ZEC is currently around $952.70, showing a 10.90% daily increase.
That is a significant move.
But when I look beyond today's chart, the picture becomes less straightforward.
Seven-day performance: -18.41%.
Thirty-day performance: -17.90%.
Ninety-day performance: +87.63%.
Three different timeframes. Three different stories.
And that is probably what makes this market interesting.
Short-term price movements can completely change how people feel about an asset. A green chart creates excitement. A red chart creates doubt. Sometimes both reactions happen within the same week.
The current price is also slightly above the displayed MA60, which adds another interesting detail to the short-term picture.
Still, I wouldn't rush to label this a confirmed trend reversal.
Markets need more than one strong session to establish a sustainable direction.
For now, ZEC is worth watching from a market-structure perspective.
I am curious about how other people interpret this move.
Are you focusing on today's recovery, or are the negative weekly and monthly numbers more important to your analysis?
#ZEC #SmartCryptoMedia
Not financial advice.
$ZEC Is Green Today. But the Market Story Is Not That Simple.
There is something interesting about watching Zcash right now.
One day, the market looks weak. Then suddenly, a strong recovery appears, and everyone starts paying attention again.
ZEC is currently around $952.70, showing a 10.90% daily increase.
That is a significant move.
But when I look beyond today's chart, the picture becomes less straightforward.
Seven-day performance: -18.41%.
Thirty-day performance: -17.90%.
Ninety-day performance: +87.63%.
Three different timeframes. Three different stories.
And that is probably what makes this market interesting.
Short-term price movements can completely change how people feel about an asset. A green chart creates excitement. A red chart creates doubt. Sometimes both reactions happen within the same week.
The current price is also slightly above the displayed MA60, which adds another interesting detail to the short-term picture.
Still, I wouldn't rush to label this a confirmed trend reversal.
Markets need more than one strong session to establish a sustainable direction.
For now, ZEC is worth watching from a market-structure perspective.
I am curious about how other people interpret this move.
Are you focusing on today's recovery, or are the negative weekly and monthly numbers more important to your analysis?
#ZEC #SmartCryptoMedia
Not financial advice.
There is something interesting about watching Zcash right now.
One day, the market looks weak. Then suddenly, a strong recovery appears, and everyone starts paying attention again.
ZEC is currently around $952.70, showing a 10.90% daily increase.
That is a significant move.
But when I look beyond today's chart, the picture becomes less straightforward.
Seven-day performance: -18.41%.
Thirty-day performance: -17.90%.
Ninety-day performance: +87.63%.
Three different timeframes. Three different stories.
And that is probably what makes this market interesting.
Short-term price movements can completely change how people feel about an asset. A green chart creates excitement. A red chart creates doubt. Sometimes both reactions happen within the same week.
The current price is also slightly above the displayed MA60, which adds another interesting detail to the short-term picture.
Still, I wouldn't rush to label this a confirmed trend reversal.
Markets need more than one strong session to establish a sustainable direction.
For now, ZEC is worth watching from a market-structure perspective.
I am curious about how other people interpret this move.
Are you focusing on today's recovery, or are the negative weekly and monthly numbers more important to your analysis?
#ZEC #SmartCryptoMedia
Not financial advice.
2
303
Everyone Is Watching Ethereum's Price. But Is That Really the Most Important Signal?
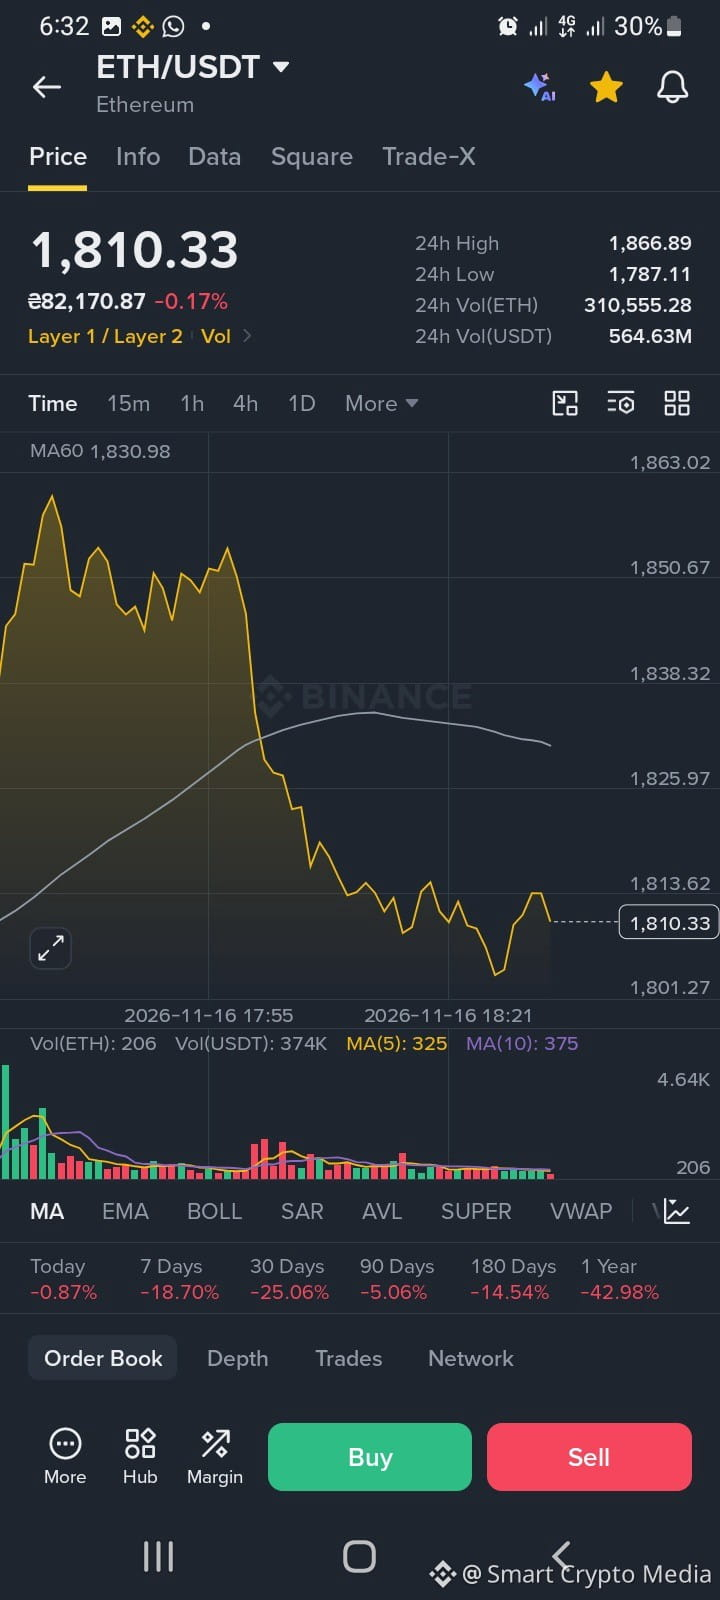
$ETH is sitting around $1,810 in the latest chart, and the overall picture looks uncomfortable.
The seven-day performance shows a decline of 18.70%. The 30-day figure is even more concerning at -25.06%.
But here's something worth questioning.
Are people paying too much attention to individual price levels while ignoring the bigger problem: momentum?
ETH is trading below its MA60, currently displayed around $1,831. The recent bounce from approximately $1,802 looks relatively weak compared with the preceding downward move.
That doesn't establish that another decline is coming. It simply means a recovery has not been confirmed by this chart.
And this is where market commentary often becomes misleading.
A bounce is not automatically a trend reversal. A support level is not a guarantee. Even a strong green candle can fail to change the broader structure.
I would rather see Ethereum establish a stronger recovery and challenge the moving average before calling this a meaningful change in direction.
The market doesn't owe anyone a quick recovery.
Sometimes the most useful analysis is admitting that the evidence is still incomplete.
My question: Are ETH observers looking for genuine momentum confirmation, or are they simply hoping for a bounce?
#ETH #EthereumAnalysis #TradingPsychology
#SmartCryptoMedia
Everyone Is Watching Ethereum's Price. But Is That Really the Most Important Signal?
$ETH is sitting around $1,810 in the latest chart, and the overall picture looks uncomfortable.
The seven-day performance shows a decline of 18.70%. The 30-day figure is even more concerning at -25.06%.
But here's something worth questioning.
Are people paying too much attention to individual price levels while ignoring the bigger problem: momentum?
ETH is trading below its MA60, currently displayed around $1,831. The recent bounce from approximately $1,802 looks relatively weak compared with the preceding downward move.
That doesn't establish that another decline is coming. It simply means a recovery has not been confirmed by this chart.
And this is where market commentary often becomes misleading.
A bounce is not automatically a trend reversal. A support level is not a guarantee. Even a strong green candle can fail to change the broader structure.
I would rather see Ethereum establish a stronger recovery and challenge the moving average before calling this a meaningful change in direction.
The market doesn't owe anyone a quick recovery.
Sometimes the most useful analysis is admitting that the evidence is still incomplete.
My question: Are ETH observers looking for genuine momentum confirmation, or are they simply hoping for a bounce?
#ETH #EthereumAnalysis #TradingPsychology
#SmartCryptoMedia
$ETH is sitting around $1,810 in the latest chart, and the overall picture looks uncomfortable.
The seven-day performance shows a decline of 18.70%. The 30-day figure is even more concerning at -25.06%.
But here's something worth questioning.
Are people paying too much attention to individual price levels while ignoring the bigger problem: momentum?
ETH is trading below its MA60, currently displayed around $1,831. The recent bounce from approximately $1,802 looks relatively weak compared with the preceding downward move.
That doesn't establish that another decline is coming. It simply means a recovery has not been confirmed by this chart.
And this is where market commentary often becomes misleading.
A bounce is not automatically a trend reversal. A support level is not a guarantee. Even a strong green candle can fail to change the broader structure.
I would rather see Ethereum establish a stronger recovery and challenge the moving average before calling this a meaningful change in direction.
The market doesn't owe anyone a quick recovery.
Sometimes the most useful analysis is admitting that the evidence is still incomplete.
My question: Are ETH observers looking for genuine momentum confirmation, or are they simply hoping for a bounce?
#ETH #EthereumAnalysis #TradingPsychology
#SmartCryptoMedia
1
562
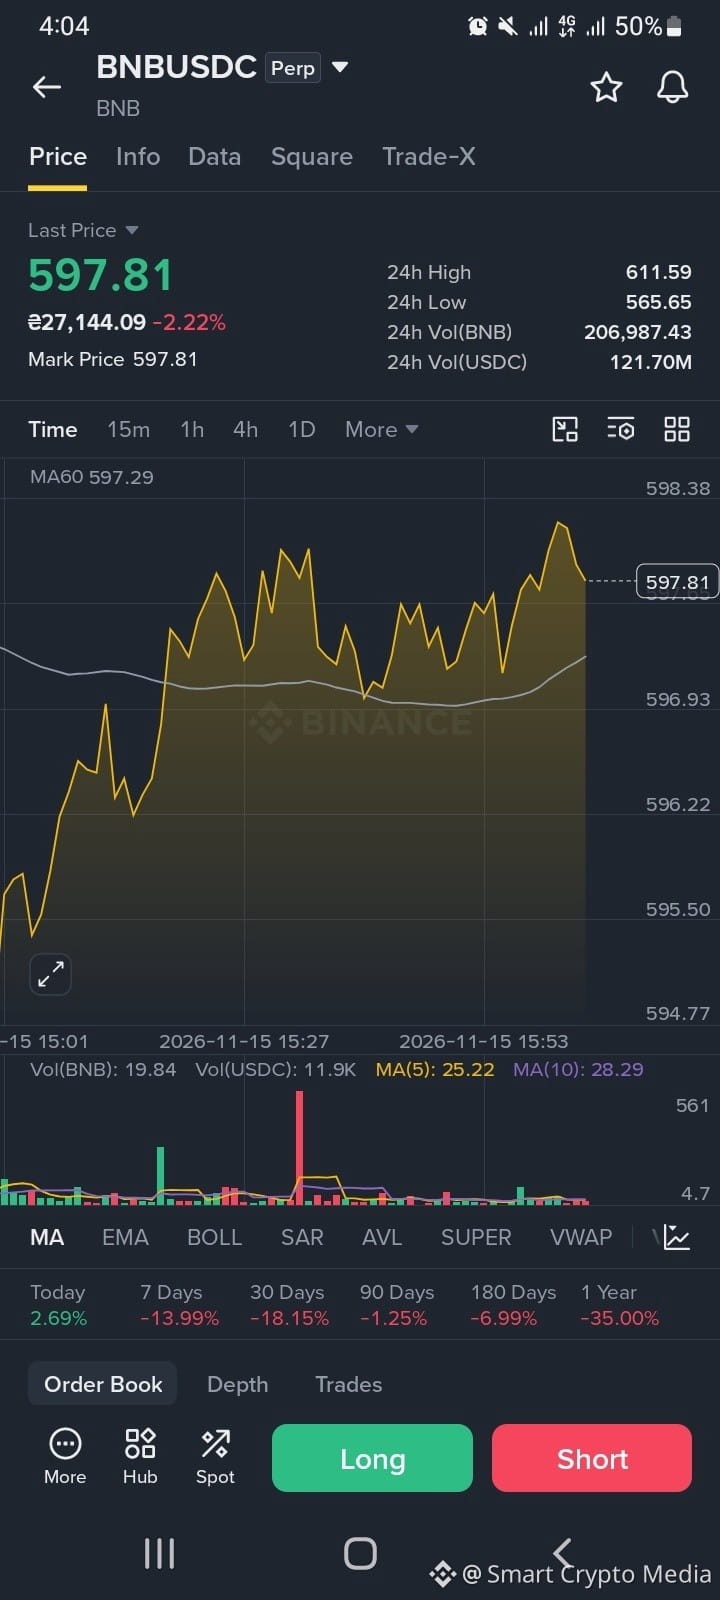
$BNB is showing an interesting market structure, but the bigger picture deserves attention.
At the time of this snapshot, BNB is trading around $597.81, down 2.22% over 24 hours. However, today's performance tells a slightly different story, showing a 2.69% gain.
There are two different signals here.
First, the short-term chart shows BNB recovering from lower levels around $594 and moving toward $598. The price is currently sitting slightly above its MA60 at $597.29. That's a small positive observation, although it doesn't confirm a sustained bullish trend.
Second, the broader performance remains challenging.
BNB is down:
- 13.99% over seven days.
- 18.15% over 30 days.
- 35% over one year.
This creates an important distinction between a short-term recovery and a genuine trend reversal.
The $600 area is worth watching psychologically, while the 24-hour high of $611.59 provides another reference point. On the downside, $565.65 is the recorded 24-hour low.
My interpretation: BNB is attempting to stabilize, but the larger market structure still needs confirmation.
A few green candles don't automatically change the bigger picture.
What matters now is whether price stability can develop into sustained strength.
#BNB #SmartCryptoMedia
Not financial advice.
$BNB is showing an interesting market structure, but the bigger picture deserves attention.
At the time of this snapshot, BNB is trading around $597.81, down 2.22% over 24 hours. However, today's performance tells a slightly different story, showing a 2.69% gain.
There are two different signals here.
First, the short-term chart shows BNB recovering from lower levels around $594 and moving toward $598. The price is currently sitting slightly above its MA60 at $597.29. That's a small positive observation, although it doesn't confirm a sustained bullish trend.
Second, the broader performance remains challenging.
BNB is down:
- 13.99% over seven days.
- 18.15% over 30 days.
- 35% over one year.
This creates an important distinction between a short-term recovery and a genuine trend reversal.
The $600 area is worth watching psychologically, while the 24-hour high of $611.59 provides another reference point. On the downside, $565.65 is the recorded 24-hour low.
My interpretation: BNB is attempting to stabilize, but the larger market structure still needs confirmation.
A few green candles don't automatically change the bigger picture.
What matters now is whether price stability can develop into sustained strength.
#BNB #SmartCryptoMedia
Not financial advice.
At the time of this snapshot, BNB is trading around $597.81, down 2.22% over 24 hours. However, today's performance tells a slightly different story, showing a 2.69% gain.
There are two different signals here.
First, the short-term chart shows BNB recovering from lower levels around $594 and moving toward $598. The price is currently sitting slightly above its MA60 at $597.29. That's a small positive observation, although it doesn't confirm a sustained bullish trend.
Second, the broader performance remains challenging.
BNB is down:
- 13.99% over seven days.
- 18.15% over 30 days.
- 35% over one year.
This creates an important distinction between a short-term recovery and a genuine trend reversal.
The $600 area is worth watching psychologically, while the 24-hour high of $611.59 provides another reference point. On the downside, $565.65 is the recorded 24-hour low.
My interpretation: BNB is attempting to stabilize, but the larger market structure still needs confirmation.
A few green candles don't automatically change the bigger picture.
What matters now is whether price stability can develop into sustained strength.
#BNB #SmartCryptoMedia
Not financial advice.
1
471
$SOL at $73.73. Sometimes the Market Doesn't Give Clear Answers.
There is something interesting about watching SOL during a difficult market session.
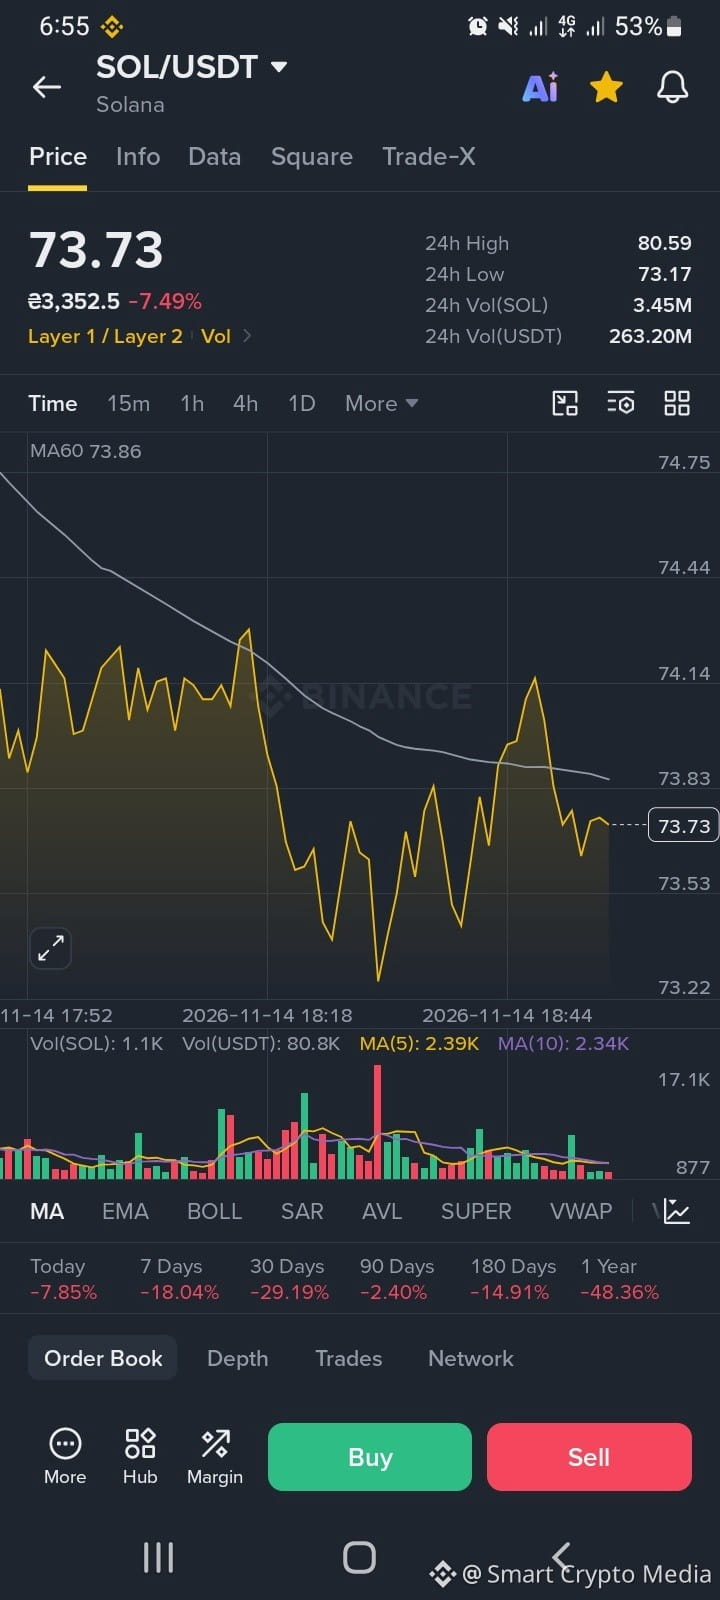
A few hours ago, the market was trading much higher. Now, the Binance snapshot shows SOL around $73.73, with a 24-hour decline of approximately 7.49%.
And honestly, this is where market psychology becomes interesting.
Some traders see a falling price and immediately become bearish.
Others see a lower price and start looking for a recovery.
But neither reaction tells us what happens next.
Looking at the chart, SOL has moved between approximately $73.17 and $74.14 during the displayed period, with several attempts to recover.
The MA60 is still sitting slightly above the current price.
That detail matters.
Buyers have something to prove before we can confidently describe this as a recovery.
And sellers? They also need to show that they can maintain control.
One thing I keep coming back to is the difference between a temporary bounce and a genuine change in momentum.
They can look similar at first.
The market needs confirmation.
For now, Solana remains an interesting asset to watch, especially around the recent low and moving-average level.
Sometimes the smartest market observation is simply admitting that the next move is not confirmed yet.
What is your reading of SOL right now: temporary weakness or a deeper correction?
#Solana #SOLUSDT #SmartCryptoMedia
$SOL at $73.73. Sometimes the Market Doesn't Give Clear Answers.
There is something interesting about watching SOL during a difficult market session.
A few hours ago, the market was trading much higher. Now, the Binance snapshot shows SOL around $73.73, with a 24-hour decline of approximately 7.49%.
And honestly, this is where market psychology becomes interesting.
Some traders see a falling price and immediately become bearish.
Others see a lower price and start looking for a recovery.
But neither reaction tells us what happens next.
Looking at the chart, SOL has moved between approximately $73.17 and $74.14 during the displayed period, with several attempts to recover.
The MA60 is still sitting slightly above the current price.
That detail matters.
Buyers have something to prove before we can confidently describe this as a recovery.
And sellers? They also need to show that they can maintain control.
One thing I keep coming back to is the difference between a temporary bounce and a genuine change in momentum.
They can look similar at first.
The market needs confirmation.
For now, Solana remains an interesting asset to watch, especially around the recent low and moving-average level.
Sometimes the smartest market observation is simply admitting that the next move is not confirmed yet.
What is your reading of SOL right now: temporary weakness or a deeper correction?
#Solana #SOLUSDT #SmartCryptoMedia
There is something interesting about watching SOL during a difficult market session.
A few hours ago, the market was trading much higher. Now, the Binance snapshot shows SOL around $73.73, with a 24-hour decline of approximately 7.49%.
And honestly, this is where market psychology becomes interesting.
Some traders see a falling price and immediately become bearish.
Others see a lower price and start looking for a recovery.
But neither reaction tells us what happens next.
Looking at the chart, SOL has moved between approximately $73.17 and $74.14 during the displayed period, with several attempts to recover.
The MA60 is still sitting slightly above the current price.
That detail matters.
Buyers have something to prove before we can confidently describe this as a recovery.
And sellers? They also need to show that they can maintain control.
One thing I keep coming back to is the difference between a temporary bounce and a genuine change in momentum.
They can look similar at first.
The market needs confirmation.
For now, Solana remains an interesting asset to watch, especially around the recent low and moving-average level.
Sometimes the smartest market observation is simply admitting that the next move is not confirmed yet.
What is your reading of SOL right now: temporary weakness or a deeper correction?
#Solana #SOLUSDT #SmartCryptoMedia
1
605
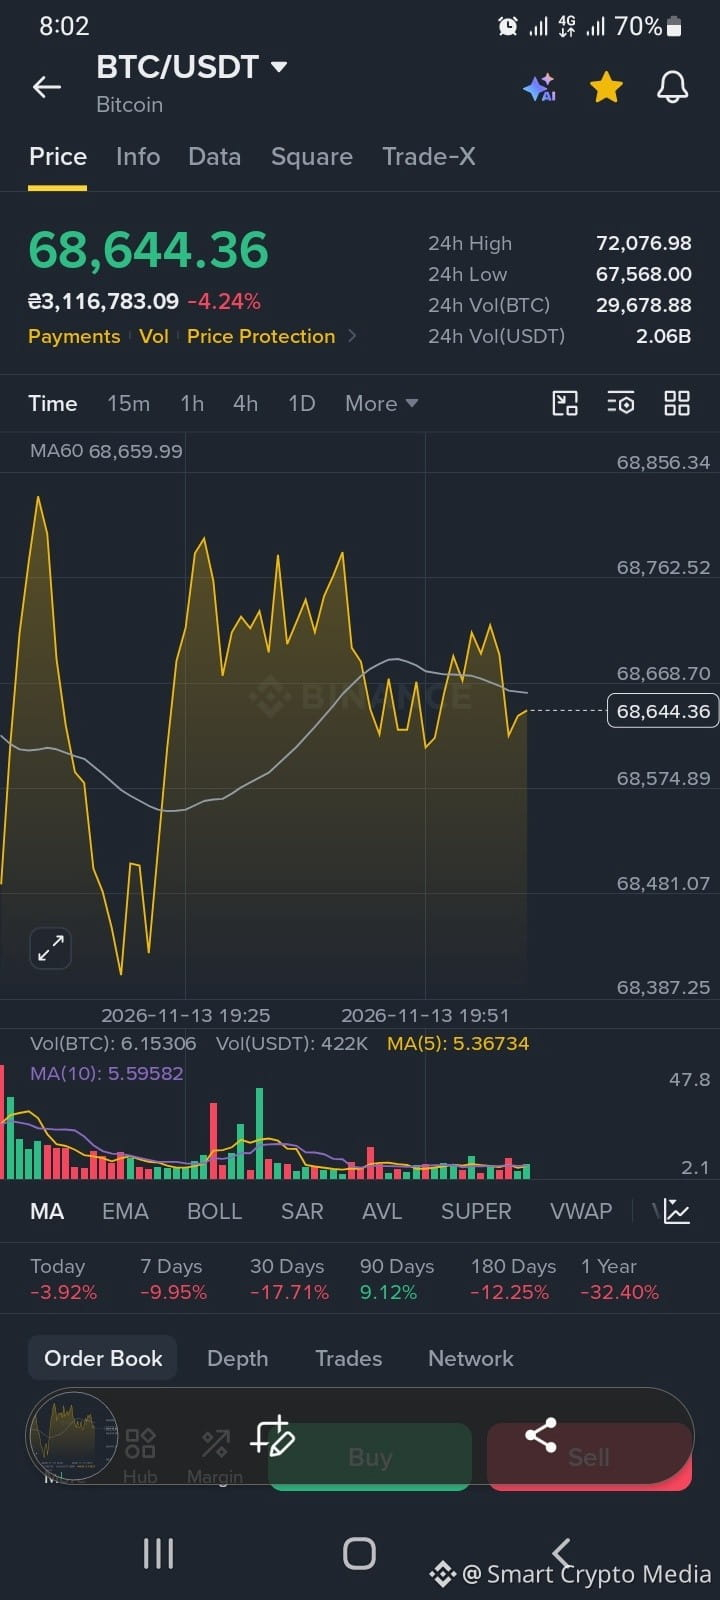
$BTC Around $68K... Something About This Market Feels Uncertain.
There are moments in crypto when the market moves so quickly that everyone suddenly becomes an expert.
Then comes a different phase.
Bitcoin drops. The chart becomes messy. Buyers attempt to recover, sellers push back, and nobody seems completely confident about what comes next.
That's what this BTC/USDT snapshot makes me think about.
Price is around $68,644, down 4.24% over 24 hours.
The market has already tested $67,568, but the recovery hasn't produced a convincing breakout.
And there's another small detail.
Bitcoin is trading just below its MA60, around $68,660.
It's not a massive difference, but it tells us that short-term momentum still needs to prove itself.
Personally, I think the most interesting part of this situation is the uncertainty.
Will buyers defend the recent low?
Will sellers use every recovery attempt as another opportunity to apply pressure?
Or will Bitcoin simply continue moving sideways while the market waits for a clearer signal?
Honestly, the chart doesn't give us a definitive answer yet.
Sometimes the most valuable observation isn't predicting the next candle. It's recognizing when the market hasn't made up its mind.
What do you think BTC needs first: stronger buying volume or a clean move above the MA60?
#BTCUSDT #SmartCryptoMedia
Not financial advice.
$BTC Around $68K... Something About This Market Feels Uncertain.
There are moments in crypto when the market moves so quickly that everyone suddenly becomes an expert.
Then comes a different phase.
Bitcoin drops. The chart becomes messy. Buyers attempt to recover, sellers push back, and nobody seems completely confident about what comes next.
That's what this BTC/USDT snapshot makes me think about.
Price is around $68,644, down 4.24% over 24 hours.
The market has already tested $67,568, but the recovery hasn't produced a convincing breakout.
And there's another small detail.
Bitcoin is trading just below its MA60, around $68,660.
It's not a massive difference, but it tells us that short-term momentum still needs to prove itself.
Personally, I think the most interesting part of this situation is the uncertainty.
Will buyers defend the recent low?
Will sellers use every recovery attempt as another opportunity to apply pressure?
Or will Bitcoin simply continue moving sideways while the market waits for a clearer signal?
Honestly, the chart doesn't give us a definitive answer yet.
Sometimes the most valuable observation isn't predicting the next candle. It's recognizing when the market hasn't made up its mind.
What do you think BTC needs first: stronger buying volume or a clean move above the MA60?
#BTCUSDT #SmartCryptoMedia
Not financial advice.
There are moments in crypto when the market moves so quickly that everyone suddenly becomes an expert.
Then comes a different phase.
Bitcoin drops. The chart becomes messy. Buyers attempt to recover, sellers push back, and nobody seems completely confident about what comes next.
That's what this BTC/USDT snapshot makes me think about.
Price is around $68,644, down 4.24% over 24 hours.
The market has already tested $67,568, but the recovery hasn't produced a convincing breakout.
And there's another small detail.
Bitcoin is trading just below its MA60, around $68,660.
It's not a massive difference, but it tells us that short-term momentum still needs to prove itself.
Personally, I think the most interesting part of this situation is the uncertainty.
Will buyers defend the recent low?
Will sellers use every recovery attempt as another opportunity to apply pressure?
Or will Bitcoin simply continue moving sideways while the market waits for a clearer signal?
Honestly, the chart doesn't give us a definitive answer yet.
Sometimes the most valuable observation isn't predicting the next candle. It's recognizing when the market hasn't made up its mind.
What do you think BTC needs first: stronger buying volume or a clean move above the MA60?
#BTCUSDT #SmartCryptoMedia
Not financial advice.
338
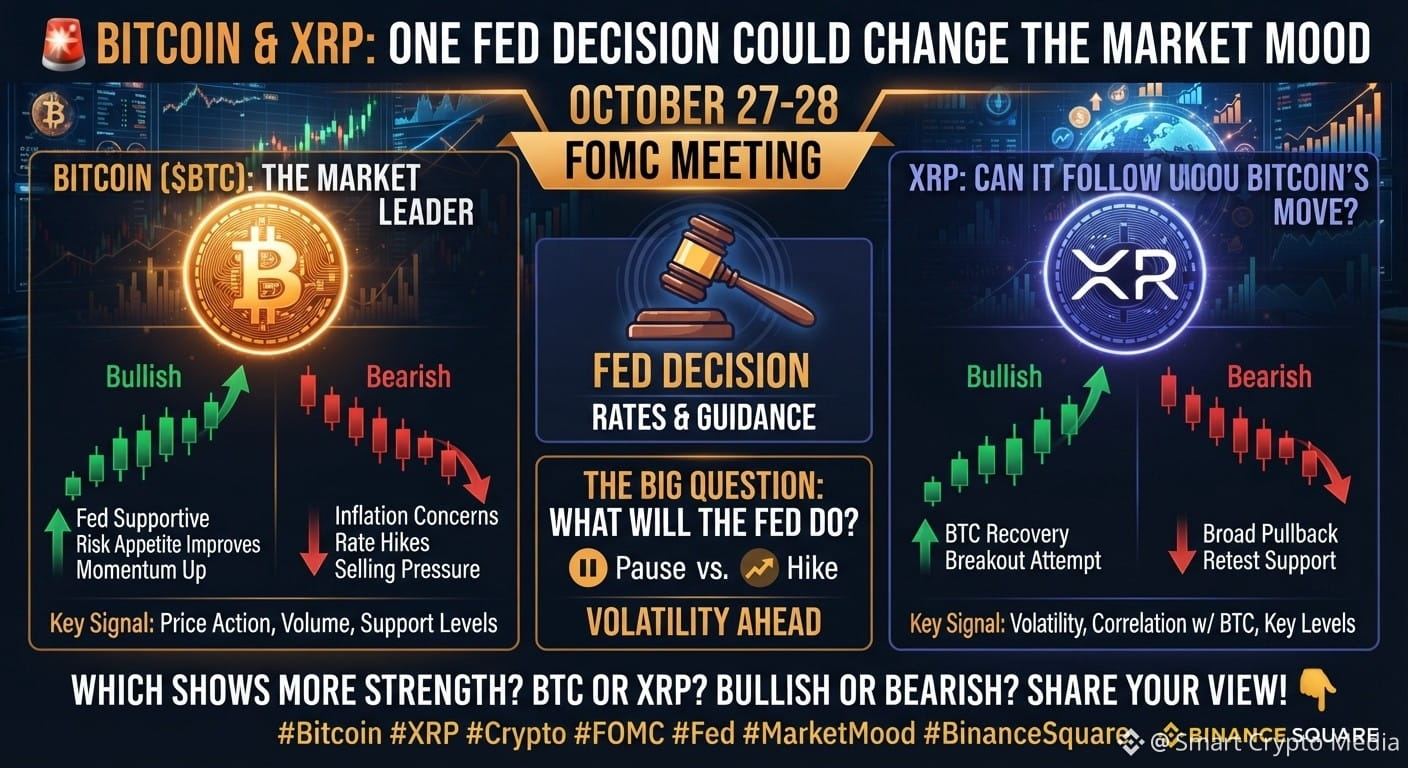
🚨 Bitcoin & XRP: One Fed Decision Could Change the Market Mood
The crypto market is approaching a major macro event. 👀
On October 27–28, the Federal Reserve’s FOMC meeting could influence the next move for Bitcoin ($BTC) and XRP. Traders are watching interest-rate expectations, inflation, and the Fed’s message about future monetary policy.
📊 ₿ BITCOIN ($BTC): The Market Leader
Bitcoin remains the asset to watch for broader crypto sentiment.
• Bullish scenario: If the Fed signals a more supportive policy outlook, risk appetite could improve and BTC may gain upward momentum.
• Bearish scenario: If policymakers sound more concerned about persistent inflation or future rate hikes, selling pressure could return.
• Key signal: Watch price reaction, trading volume, and whether BTC can maintain its important support levels.
💧 XRP: Can It Follow Bitcoin’s Move?
XRP could react to the same macroeconomic forces, but its price action may differ from Bitcoin’s.
• Bullish scenario: Strong buying pressure and a sustained BTC recovery could help XRP attempt a breakout.
• Bearish scenario: A broad crypto pullback could put XRP under pressure, especially if it fails to hold nearby support.
• Key signal: Watch XRP’s support and resistance levels, volume, and relative strength against BTC.
🧠 THE BIG QUESTION: WHAT WILL THE FED DO?
The market is weighing a possible pause against the risk of further tightening. Recent inflation concerns mean that even if rates remain unchanged, the Fed’s guidance could still trigger volatility.
📌 My approach: Avoid treating the meeting as a guaranteed bullish or bearish catalyst. Watch the announcement, market reaction, and confirmation from price action before drawing conclusions.
🔥 Let’s discuss:
Which asset do you think will show greater strength after the FOMC meeting — Bitcoin ($BTC) or XRP? And are you expecting a bullish breakout or a bearish correction?
Share your view in the comments! 👇
#BTC #XRP #SmartCryptoMedia
🚨 Bitcoin & XRP: One Fed Decision Could Change the Market Mood
The crypto market is approaching a major macro event. 👀
On October 27–28, the Federal Reserve’s FOMC meeting could influence the next move for Bitcoin ($BTC) and XRP. Traders are watching interest-rate expectations, inflation, and the Fed’s message about future monetary policy.
📊 ₿ BITCOIN ($BTC): The Market Leader
Bitcoin remains the asset to watch for broader crypto sentiment.
• Bullish scenario: If the Fed signals a more supportive policy outlook, risk appetite could improve and BTC may gain upward momentum.
• Bearish scenario: If policymakers sound more concerned about persistent inflation or future rate hikes, selling pressure could return.
• Key signal: Watch price reaction, trading volume, and whether BTC can maintain its important support levels.
💧 XRP: Can It Follow Bitcoin’s Move?
XRP could react to the same macroeconomic forces, but its price action may differ from Bitcoin’s.
• Bullish scenario: Strong buying pressure and a sustained BTC recovery could help XRP attempt a breakout.
• Bearish scenario: A broad crypto pullback could put XRP under pressure, especially if it fails to hold nearby support.
• Key signal: Watch XRP’s support and resistance levels, volume, and relative strength against BTC.
🧠 THE BIG QUESTION: WHAT WILL THE FED DO?
The market is weighing a possible pause against the risk of further tightening. Recent inflation concerns mean that even if rates remain unchanged, the Fed’s guidance could still trigger volatility.
📌 My approach: Avoid treating the meeting as a guaranteed bullish or bearish catalyst. Watch the announcement, market reaction, and confirmation from price action before drawing conclusions.
🔥 Let’s discuss:
Which asset do you think will show greater strength after the FOMC meeting — Bitcoin ($BTC) or XRP? And are you expecting a bullish breakout or a bearish correction?
Share your view in the comments! 👇
#BTC #XRP #SmartCryptoMedia
The crypto market is approaching a major macro event. 👀
On October 27–28, the Federal Reserve’s FOMC meeting could influence the next move for Bitcoin ($BTC) and XRP. Traders are watching interest-rate expectations, inflation, and the Fed’s message about future monetary policy.
📊 ₿ BITCOIN ($BTC): The Market Leader
Bitcoin remains the asset to watch for broader crypto sentiment.
• Bullish scenario: If the Fed signals a more supportive policy outlook, risk appetite could improve and BTC may gain upward momentum.
• Bearish scenario: If policymakers sound more concerned about persistent inflation or future rate hikes, selling pressure could return.
• Key signal: Watch price reaction, trading volume, and whether BTC can maintain its important support levels.
💧 XRP: Can It Follow Bitcoin’s Move?
XRP could react to the same macroeconomic forces, but its price action may differ from Bitcoin’s.
• Bullish scenario: Strong buying pressure and a sustained BTC recovery could help XRP attempt a breakout.
• Bearish scenario: A broad crypto pullback could put XRP under pressure, especially if it fails to hold nearby support.
• Key signal: Watch XRP’s support and resistance levels, volume, and relative strength against BTC.
🧠 THE BIG QUESTION: WHAT WILL THE FED DO?
The market is weighing a possible pause against the risk of further tightening. Recent inflation concerns mean that even if rates remain unchanged, the Fed’s guidance could still trigger volatility.
📌 My approach: Avoid treating the meeting as a guaranteed bullish or bearish catalyst. Watch the announcement, market reaction, and confirmation from price action before drawing conclusions.
🔥 Let’s discuss:
Which asset do you think will show greater strength after the FOMC meeting — Bitcoin ($BTC) or XRP? And are you expecting a bullish breakout or a bearish correction?
Share your view in the comments! 👇
#BTC #XRP #SmartCryptoMedia
400

Article
Berkshire’s Bigger Bet on Alphabet: What Investors Might Be Missing#BerkshireHeavilyIncreasesAlphabetStake #SmartCryptoMedia #write2earn
Berkshire’s Bigger Bet on Alphabet: What Investors Might Be Missing
Berkshire Hathaway increasing its stake in Alphabet caught the market’s attention for a reason. Warren Buffett’s company has traditionally leaned toward stable, predictable businesses. So when Berkshire adds more exposure to a tech giant like Google’s parent company, investors usually take notice.
This move may signal growing confidence in Alphabet’s ability to stay dominant during the next phase of the AI race.
Alphabet still controls some of the internet’s most powerful platforms — Google Search, YouTube, Android, and Google Cloud. Even with rising competition in artificial intelligence, the company continues generating massive cash flow while investing heavily in future technologies.
What makes this interesting is timing.
Many tech stocks have already rallied sharply this year, yet Berkshire appears comfortable increasing exposure instead of reducing risk. That suggests the company may still see long-term value rather than short-term hype.
For crypto investors, there’s another angle worth watching. Big institutional interest in AI-related companies often spills into blockchain sectors connected to AI infrastructure, decentralized computing, and data services. Markets rarely move in isolation.
Still, Berkshire’s strategy is usually built around patience, not momentum. That’s an important distinction many retail traders overlook.
Berkshire’s larger Alphabet position isn’t just a headline about stocks. It reflects how major investors are thinking about AI, digital infrastructure, and long-term growth in today’s market.
Are institutional investors quietly positioning for the next AI-driven cycle? And could crypto markets eventually follow that trend? Share your thoughts below.
Why is Berkshire investing more in Alphabet?
Likely because of Alphabet’s strong cash flow, AI potential, and dominant market position.
Does this impact crypto markets?
Indirectly, yes. AI and tech investment trends often influence sentiment across digital assets.
Is Alphabet still considered undervalued?
Some investors believe its earnings strength and AI growth still offer long-term upside.
Institutional capital continues flowing toward AI-focused companies as markets look beyond short-term volatility.
Disclaimer: Not Financial Advice.
Berkshire’s Bigger Bet on Alphabet: What Investors Might Be Missing
#BerkshireHeavilyIncreasesAlphabetStake #SmartCryptoMedia #write2earn
Berkshire’s Bigger Bet on Alphabet: What Investors Might Be Missing
Berkshire Hathaway increasing its stake in Alphabet caught the market’s attention for a reason. Warren Buffett’s company has traditionally leaned toward stable, predictable businesses. So when Berkshire adds more exposure to a tech giant like Google’s parent company, investors usually take notice.
This move may signal growing confidence in Alphabet’s ability to stay dominant during the next phase of the AI race.
Alphabet still controls some of the internet’s most powerful platforms — Google Search, YouTube, Android, and Google Cloud. Even with rising competition in artificial intelligence, the company continues generating massive cash flow while investing heavily in future technologies.
What makes this interesting is timing.
Many tech stocks have already rallied sharply this year, yet Berkshire appears comfortable increasing exposure instead of reducing risk. That suggests the company may still see long-term value rather than short-term hype.
For crypto investors, there’s another angle worth watching. Big institutional interest in AI-related companies often spills into blockchain sectors connected to AI infrastructure, decentralized computing, and data services. Markets rarely move in isolation.
Still, Berkshire’s strategy is usually built around patience, not momentum. That’s an important distinction many retail traders overlook.
Berkshire’s larger Alphabet position isn’t just a headline about stocks. It reflects how major investors are thinking about AI, digital infrastructure, and long-term growth in today’s market.
Are institutional investors quietly positioning for the next AI-driven cycle? And could crypto markets eventually follow that trend? Share your thoughts below.
Why is Berkshire investing more in Alphabet?
Likely because of Alphabet’s strong cash flow, AI potential, and dominant market position.
Does this impact crypto markets?
Indirectly, yes. AI and tech investment trends often influence sentiment across digital assets.
Is Alphabet still considered undervalued?
Some investors believe its earnings strength and AI growth still offer long-term upside.
Institutional capital continues flowing toward AI-focused companies as markets look beyond short-term volatility.
Disclaimer: Not Financial Advice.
Berkshire’s Bigger Bet on Alphabet: What Investors Might Be Missing
Berkshire Hathaway increasing its stake in Alphabet caught the market’s attention for a reason. Warren Buffett’s company has traditionally leaned toward stable, predictable businesses. So when Berkshire adds more exposure to a tech giant like Google’s parent company, investors usually take notice.
This move may signal growing confidence in Alphabet’s ability to stay dominant during the next phase of the AI race.
Alphabet still controls some of the internet’s most powerful platforms — Google Search, YouTube, Android, and Google Cloud. Even with rising competition in artificial intelligence, the company continues generating massive cash flow while investing heavily in future technologies.
What makes this interesting is timing.
Many tech stocks have already rallied sharply this year, yet Berkshire appears comfortable increasing exposure instead of reducing risk. That suggests the company may still see long-term value rather than short-term hype.
For crypto investors, there’s another angle worth watching. Big institutional interest in AI-related companies often spills into blockchain sectors connected to AI infrastructure, decentralized computing, and data services. Markets rarely move in isolation.
Still, Berkshire’s strategy is usually built around patience, not momentum. That’s an important distinction many retail traders overlook.
Berkshire’s larger Alphabet position isn’t just a headline about stocks. It reflects how major investors are thinking about AI, digital infrastructure, and long-term growth in today’s market.
Are institutional investors quietly positioning for the next AI-driven cycle? And could crypto markets eventually follow that trend? Share your thoughts below.
Why is Berkshire investing more in Alphabet?
Likely because of Alphabet’s strong cash flow, AI potential, and dominant market position.
Does this impact crypto markets?
Indirectly, yes. AI and tech investment trends often influence sentiment across digital assets.
Is Alphabet still considered undervalued?
Some investors believe its earnings strength and AI growth still offer long-term upside.
Institutional capital continues flowing toward AI-focused companies as markets look beyond short-term volatility.
Disclaimer: Not Financial Advice.
2
178
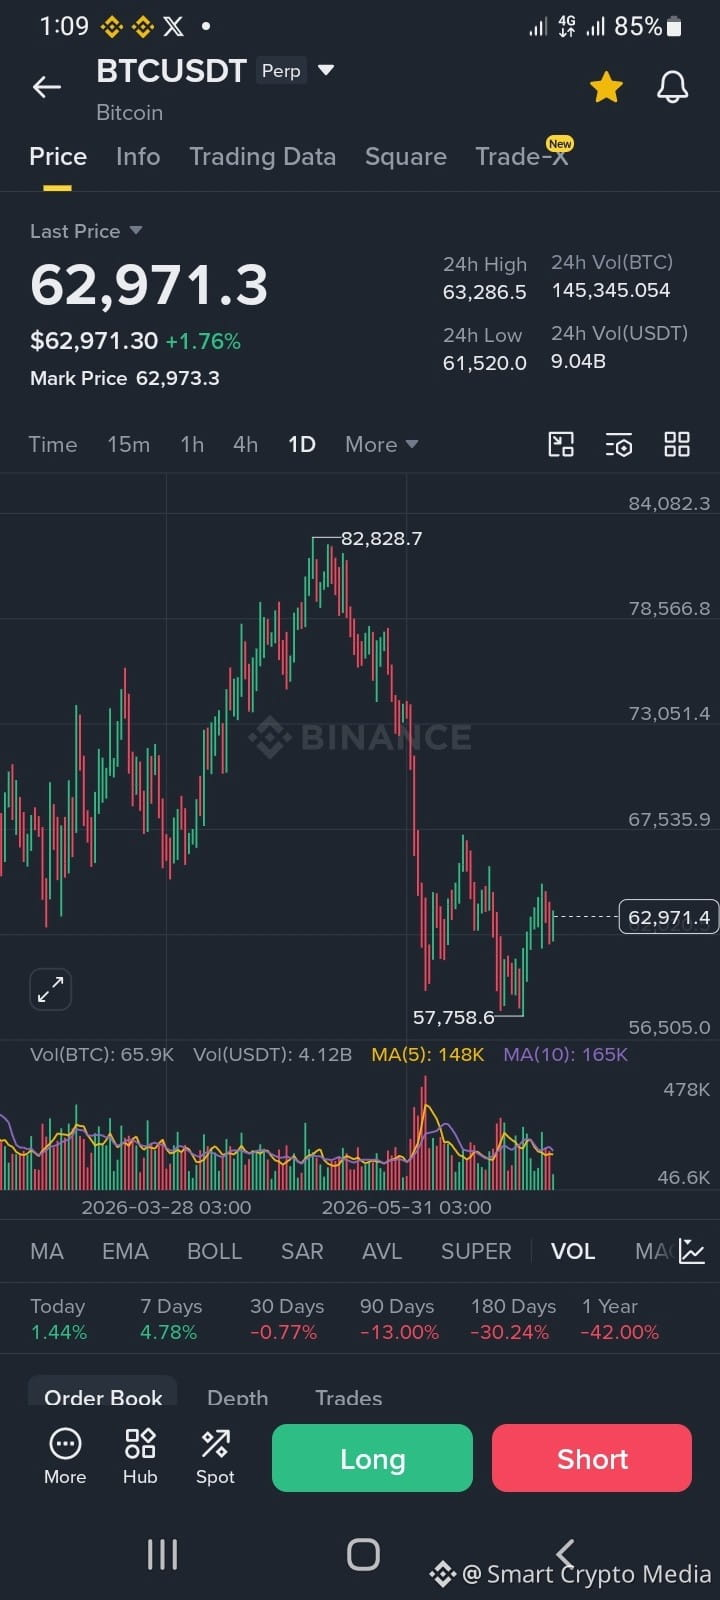
$BTC Been watching this chart longer than I probably should today. $62,971. Up almost 2%. And somehow I still don't know how I feel about it.
Six months ago this thing was pushing $83k on my screen. Now a bounce off $58k gets treated like a victory. Funny how the goalposts move — a year-over-year loss of 42% and we're out here calling +1.76% a good day. Maybe that's just what surviving a drawdown does to your sense of scale.
Part of me wants to trust the setup — softer jobs numbers, a Fed chair sounding less hawkish, on-chain stress readings that look like past bottoms. The other part remembers this exact channel has broken down three separate times this year already. Twice it looked like recovery. Twice it wasn't.
I'm not trying to call a top or a bottom here, honestly don't think anyone reliably can. Just sitting with the discomfort of not knowing whether $63,800 is a ceiling or a launchpad. Maybe that uncertainty is the actual lesson — not the price, just learning to hold a position without needing the chart to tell you a story that makes you feel okay.
Watching the 28th–29th Fed dates now. Everyone is.
#BTC #SmartCryptoMedia #Write2Earrn
$BTC Been watching this chart longer than I probably should today. $62,971. Up almost 2%. And somehow I still don't know how I feel about it.
Six months ago this thing was pushing $83k on my screen. Now a bounce off $58k gets treated like a victory. Funny how the goalposts move — a year-over-year loss of 42% and we're out here calling +1.76% a good day. Maybe that's just what surviving a drawdown does to your sense of scale.
Part of me wants to trust the setup — softer jobs numbers, a Fed chair sounding less hawkish, on-chain stress readings that look like past bottoms. The other part remembers this exact channel has broken down three separate times this year already. Twice it looked like recovery. Twice it wasn't.
I'm not trying to call a top or a bottom here, honestly don't think anyone reliably can. Just sitting with the discomfort of not knowing whether $63,800 is a ceiling or a launchpad. Maybe that uncertainty is the actual lesson — not the price, just learning to hold a position without needing the chart to tell you a story that makes you feel okay.
Watching the 28th–29th Fed dates now. Everyone is.
#BTC #SmartCryptoMedia #Write2Earrn
Six months ago this thing was pushing $83k on my screen. Now a bounce off $58k gets treated like a victory. Funny how the goalposts move — a year-over-year loss of 42% and we're out here calling +1.76% a good day. Maybe that's just what surviving a drawdown does to your sense of scale.
Part of me wants to trust the setup — softer jobs numbers, a Fed chair sounding less hawkish, on-chain stress readings that look like past bottoms. The other part remembers this exact channel has broken down three separate times this year already. Twice it looked like recovery. Twice it wasn't.
I'm not trying to call a top or a bottom here, honestly don't think anyone reliably can. Just sitting with the discomfort of not knowing whether $63,800 is a ceiling or a launchpad. Maybe that uncertainty is the actual lesson — not the price, just learning to hold a position without needing the chart to tell you a story that makes you feel okay.
Watching the 28th–29th Fed dates now. Everyone is.
#BTC #SmartCryptoMedia #Write2Earrn
329
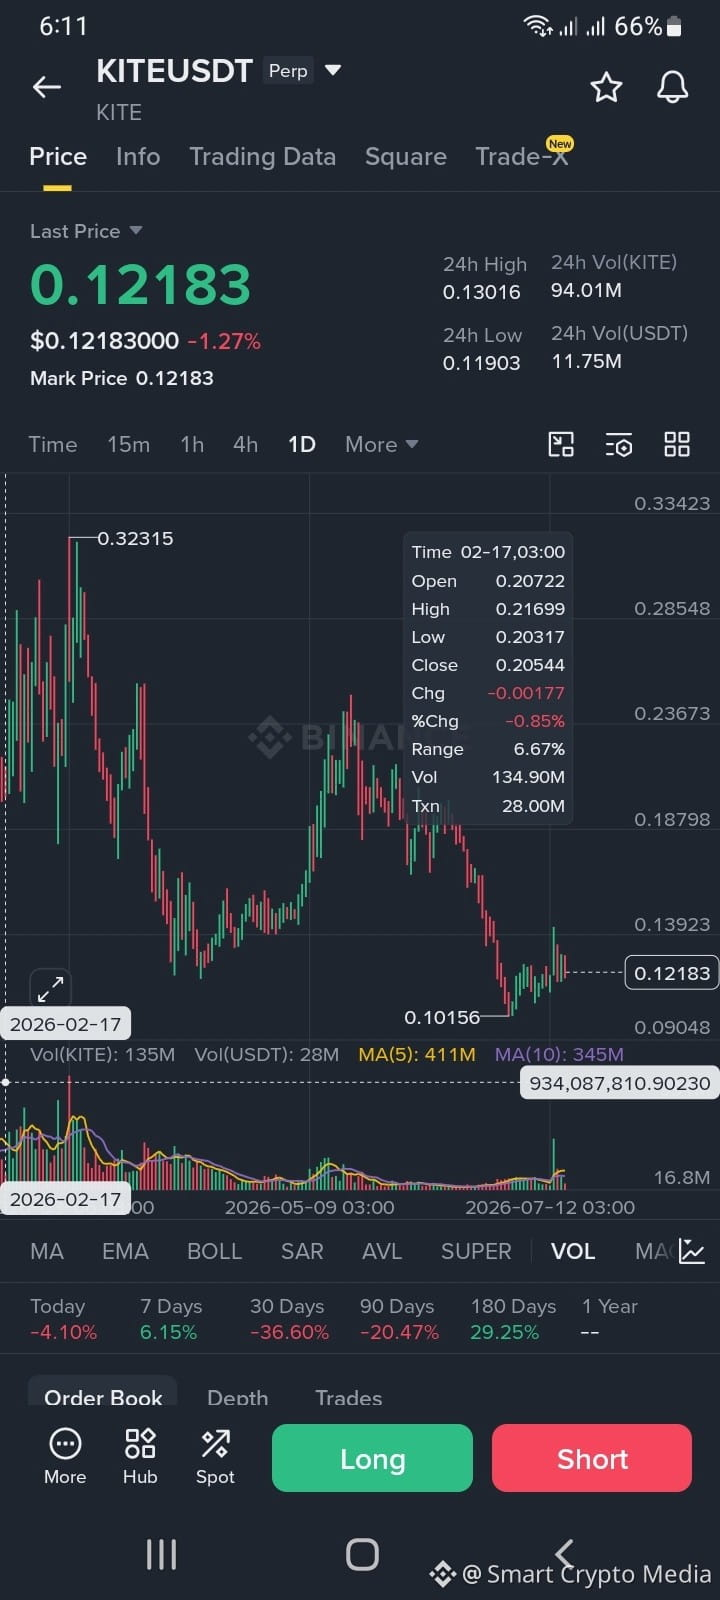
I stared at the $KITE chart longer than I expected today.
Not because I had a strong opinion.
Actually the opposite.
I couldn't decide what I was looking at.
Part of me sees exhaustion.
Months of decline. Sellers getting tired. Price finally finding somewhere to breathe.
Another part of me sees something less optimistic.
A market that keeps trying to recover but never quite escapes its past.
Maybe that's why charts are strange.
Two people can look at the same candles and walk away with completely different stories.
The recent bounce caught my attention.
Not because it looked powerful.
Because it looked uncertain.
A little messy.
Like the market itself wasn't fully convinced.
Those are usually the moments I find most interesting.
Not the obvious trends.
Not the euphoric rallies.
The awkward middle.
The period where nobody really knows whether they're witnessing the beginning of something new or just a pause before continuation.
KITE feels like it's sitting in that zone right now.
And honestly, I think many traders secretly feel the same way.
They want certainty.
The chart offers probabilities.
They want answers.
The market responds with questions.
For now, that's probably the most accurate interpretation I can make.
#KİTE #SmartCryptoMedia #writetoearn
I stared at the $KITE chart longer than I expected today.
Not because I had a strong opinion.
Actually the opposite.
I couldn't decide what I was looking at.
Part of me sees exhaustion.
Months of decline. Sellers getting tired. Price finally finding somewhere to breathe.
Another part of me sees something less optimistic.
A market that keeps trying to recover but never quite escapes its past.
Maybe that's why charts are strange.
Two people can look at the same candles and walk away with completely different stories.
The recent bounce caught my attention.
Not because it looked powerful.
Because it looked uncertain.
A little messy.
Like the market itself wasn't fully convinced.
Those are usually the moments I find most interesting.
Not the obvious trends.
Not the euphoric rallies.
The awkward middle.
The period where nobody really knows whether they're witnessing the beginning of something new or just a pause before continuation.
KITE feels like it's sitting in that zone right now.
And honestly, I think many traders secretly feel the same way.
They want certainty.
The chart offers probabilities.
They want answers.
The market responds with questions.
For now, that's probably the most accurate interpretation I can make.
#KİTE #SmartCryptoMedia #writetoearn
Not because I had a strong opinion.
Actually the opposite.
I couldn't decide what I was looking at.
Part of me sees exhaustion.
Months of decline. Sellers getting tired. Price finally finding somewhere to breathe.
Another part of me sees something less optimistic.
A market that keeps trying to recover but never quite escapes its past.
Maybe that's why charts are strange.
Two people can look at the same candles and walk away with completely different stories.
The recent bounce caught my attention.
Not because it looked powerful.
Because it looked uncertain.
A little messy.
Like the market itself wasn't fully convinced.
Those are usually the moments I find most interesting.
Not the obvious trends.
Not the euphoric rallies.
The awkward middle.
The period where nobody really knows whether they're witnessing the beginning of something new or just a pause before continuation.
KITE feels like it's sitting in that zone right now.
And honestly, I think many traders secretly feel the same way.
They want certainty.
The chart offers probabilities.
They want answers.
The market responds with questions.
For now, that's probably the most accurate interpretation I can make.
#KİTE #SmartCryptoMedia #writetoearn
162

Article
Ethereum's Staking Ratio Just Hit a Record High. Is a Supply Shock Coming?#EthereumStakingRatioRecordHigh #SmartCryptoMedia #write2earn🌐💹
# 🚀 Ethereum's Staking Ratio Just Hit a Record High. Is a Supply Shock Coming?
Most traders are focused on ETF inflows.
Whales are tracking liquidity.
Meanwhile, a much quieter story is unfolding behind the scenes:
Ethereum's staking ratio has reached a new all-time high.
That means more ETH is being locked away than ever before—and that could become a major factor in the next phase of the market.
📌 Why does this matter?
The staking ratio shows how much of Ethereum's total supply is locked in staking.
The higher it goes:
✅ Less ETH is available for trading
✅ Exchange supply gets tighter
✅ Selling pressure can decrease
✅ Demand has a stronger impact on price
In simple terms, more ETH is leaving the liquid market.
🔥 What makes this bullish?
When investors stake ETH, they're making a choice.
Instead of keeping coins ready to sell, they're locking them up to earn yield and hold for the long term.
That's important because:
• Millions of ETH become less liquid
• Buyers compete for a smaller available supply
• Market structure gradually tightens
Historically, assets tend to benefit when supply becomes scarcer while demand remains steady or grows.
📊 What's driving the staking boom?
1️⃣ Institutional adoption
Ethereum is increasingly being viewed as a productive asset rather than just a speculative one.
2️⃣ Staking rewards
Investors can earn yield while maintaining exposure to ETH's upside.
3️⃣ Long-term confidence
Ethereum continues to dominate key sectors including:
🔹 DeFi
🔹 Stablecoins
🔹 Tokenization
🔹 Layer-2 ecosystems
⚠️ But don't expect instant fireworks.
A record staking ratio doesn't guarantee ETH will surge tomorrow.
Price still depends on:
• Market sentiment
• Macro conditions
• ETF demand
• Bitcoin's direction
• Overall crypto liquidity
Still, the supply side of the equation is becoming increasingly favorable.
🎯 What I'm watching next
📍 Exchange ETH balances
📍 ETF inflows
📍 Network activity
📍 Continued staking growth
📍 Institutional participation
If staking keeps rising while demand accelerates, Ethereum could be setting up one of the strongest supply-demand dynamics we've seen in years.
💭 My takeaway:
The staking ratio isn't just another on-chain metric.
It's a signal that more ETH holders are choosing long-term participation over short-term speculation.
And when supply keeps shrinking, markets eventually pay attention.
👇 Do you think ETH's rising staking ratio will help drive new all-time highs, or is stronger demand still needed first?
Ethereum's Staking Ratio Just Hit a Record High. Is a Supply Shock Coming?
#EthereumStakingRatioRecordHigh #SmartCryptoMedia #write2earn🌐💹
# 🚀 Ethereum's Staking Ratio Just Hit a Record High. Is a Supply Shock Coming?
Most traders are focused on ETF inflows.
Whales are tracking liquidity.
Meanwhile, a much quieter story is unfolding behind the scenes:
Ethereum's staking ratio has reached a new all-time high.
That means more ETH is being locked away than ever before—and that could become a major factor in the next phase of the market.
📌 Why does this matter?
The staking ratio shows how much of Ethereum's total supply is locked in staking.
The higher it goes:
✅ Less ETH is available for trading
✅ Exchange supply gets tighter
✅ Selling pressure can decrease
✅ Demand has a stronger impact on price
In simple terms, more ETH is leaving the liquid market.
🔥 What makes this bullish?
When investors stake ETH, they're making a choice.
Instead of keeping coins ready to sell, they're locking them up to earn yield and hold for the long term.
That's important because:
• Millions of ETH become less liquid
• Buyers compete for a smaller available supply
• Market structure gradually tightens
Historically, assets tend to benefit when supply becomes scarcer while demand remains steady or grows.
📊 What's driving the staking boom?
1️⃣ Institutional adoption
Ethereum is increasingly being viewed as a productive asset rather than just a speculative one.
2️⃣ Staking rewards
Investors can earn yield while maintaining exposure to ETH's upside.
3️⃣ Long-term confidence
Ethereum continues to dominate key sectors including:
🔹 DeFi
🔹 Stablecoins
🔹 Tokenization
🔹 Layer-2 ecosystems
⚠️ But don't expect instant fireworks.
A record staking ratio doesn't guarantee ETH will surge tomorrow.
Price still depends on:
• Market sentiment
• Macro conditions
• ETF demand
• Bitcoin's direction
• Overall crypto liquidity
Still, the supply side of the equation is becoming increasingly favorable.
🎯 What I'm watching next
📍 Exchange ETH balances
📍 ETF inflows
📍 Network activity
📍 Continued staking growth
📍 Institutional participation
If staking keeps rising while demand accelerates, Ethereum could be setting up one of the strongest supply-demand dynamics we've seen in years.
💭 My takeaway:
The staking ratio isn't just another on-chain metric.
It's a signal that more ETH holders are choosing long-term participation over short-term speculation.
And when supply keeps shrinking, markets eventually pay attention.
👇 Do you think ETH's rising staking ratio will help drive new all-time highs, or is stronger demand still needed first?
# 🚀 Ethereum's Staking Ratio Just Hit a Record High. Is a Supply Shock Coming?
Most traders are focused on ETF inflows.
Whales are tracking liquidity.
Meanwhile, a much quieter story is unfolding behind the scenes:
Ethereum's staking ratio has reached a new all-time high.
That means more ETH is being locked away than ever before—and that could become a major factor in the next phase of the market.
📌 Why does this matter?
The staking ratio shows how much of Ethereum's total supply is locked in staking.
The higher it goes:
✅ Less ETH is available for trading
✅ Exchange supply gets tighter
✅ Selling pressure can decrease
✅ Demand has a stronger impact on price
In simple terms, more ETH is leaving the liquid market.
🔥 What makes this bullish?
When investors stake ETH, they're making a choice.
Instead of keeping coins ready to sell, they're locking them up to earn yield and hold for the long term.
That's important because:
• Millions of ETH become less liquid
• Buyers compete for a smaller available supply
• Market structure gradually tightens
Historically, assets tend to benefit when supply becomes scarcer while demand remains steady or grows.
📊 What's driving the staking boom?
1️⃣ Institutional adoption
Ethereum is increasingly being viewed as a productive asset rather than just a speculative one.
2️⃣ Staking rewards
Investors can earn yield while maintaining exposure to ETH's upside.
3️⃣ Long-term confidence
Ethereum continues to dominate key sectors including:
🔹 DeFi
🔹 Stablecoins
🔹 Tokenization
🔹 Layer-2 ecosystems
⚠️ But don't expect instant fireworks.
A record staking ratio doesn't guarantee ETH will surge tomorrow.
Price still depends on:
• Market sentiment
• Macro conditions
• ETF demand
• Bitcoin's direction
• Overall crypto liquidity
Still, the supply side of the equation is becoming increasingly favorable.
🎯 What I'm watching next
📍 Exchange ETH balances
📍 ETF inflows
📍 Network activity
📍 Continued staking growth
📍 Institutional participation
If staking keeps rising while demand accelerates, Ethereum could be setting up one of the strongest supply-demand dynamics we've seen in years.
💭 My takeaway:
The staking ratio isn't just another on-chain metric.
It's a signal that more ETH holders are choosing long-term participation over short-term speculation.
And when supply keeps shrinking, markets eventually pay attention.
👇 Do you think ETH's rising staking ratio will help drive new all-time highs, or is stronger demand still needed first?
5
437
Watched $ETH do that whole $1,982 to $1,820 round trip and honestly — I don't know what to make of it anymore. Every time it looks like it's breaking down, it snaps back. Every time it looks like it wants $2k, it gets rejected. Right now it's back at $1,910, basically where it keeps landing after all that noise.
I saw the Bitmine accumulation headlines. Read the exchange withdrawal thread too. Part of me wants to read that as a signal — like, okay, someone with real size thinks this is a level worth buying. But then I look at the yearly chart. Down over 50%. That number just sits there, kind of quietly undercutting every short-term "this is the bottom" feeling.
Maybe that's just what this cycle looks like — slow grind, occasional wick, repeat. Not trying to call a top or bottom here, just noticing how tiring it is to watch the same range play out on repeat. $1,850 holds, $1,900 caps, rinse.
Not financial advice, obviously. Just where my head's at watching the 4h candles today.
#ETH #SmartCryptoMedia #Write2Earrn
Watched $ETH do that whole $1,982 to $1,820 round trip and honestly — I don't know what to make of it anymore. Every time it looks like it's breaking down, it snaps back. Every time it looks like it wants $2k, it gets rejected. Right now it's back at $1,910, basically where it keeps landing after all that noise.
I saw the Bitmine accumulation headlines. Read the exchange withdrawal thread too. Part of me wants to read that as a signal — like, okay, someone with real size thinks this is a level worth buying. But then I look at the yearly chart. Down over 50%. That number just sits there, kind of quietly undercutting every short-term "this is the bottom" feeling.
Maybe that's just what this cycle looks like — slow grind, occasional wick, repeat. Not trying to call a top or bottom here, just noticing how tiring it is to watch the same range play out on repeat. $1,850 holds, $1,900 caps, rinse.
Not financial advice, obviously. Just where my head's at watching the 4h candles today.
#ETH #SmartCryptoMedia #Write2Earrn
I saw the Bitmine accumulation headlines. Read the exchange withdrawal thread too. Part of me wants to read that as a signal — like, okay, someone with real size thinks this is a level worth buying. But then I look at the yearly chart. Down over 50%. That number just sits there, kind of quietly undercutting every short-term "this is the bottom" feeling.
Maybe that's just what this cycle looks like — slow grind, occasional wick, repeat. Not trying to call a top or bottom here, just noticing how tiring it is to watch the same range play out on repeat. $1,850 holds, $1,900 caps, rinse.
Not financial advice, obviously. Just where my head's at watching the 4h candles today.
#ETH #SmartCryptoMedia #Write2Earrn
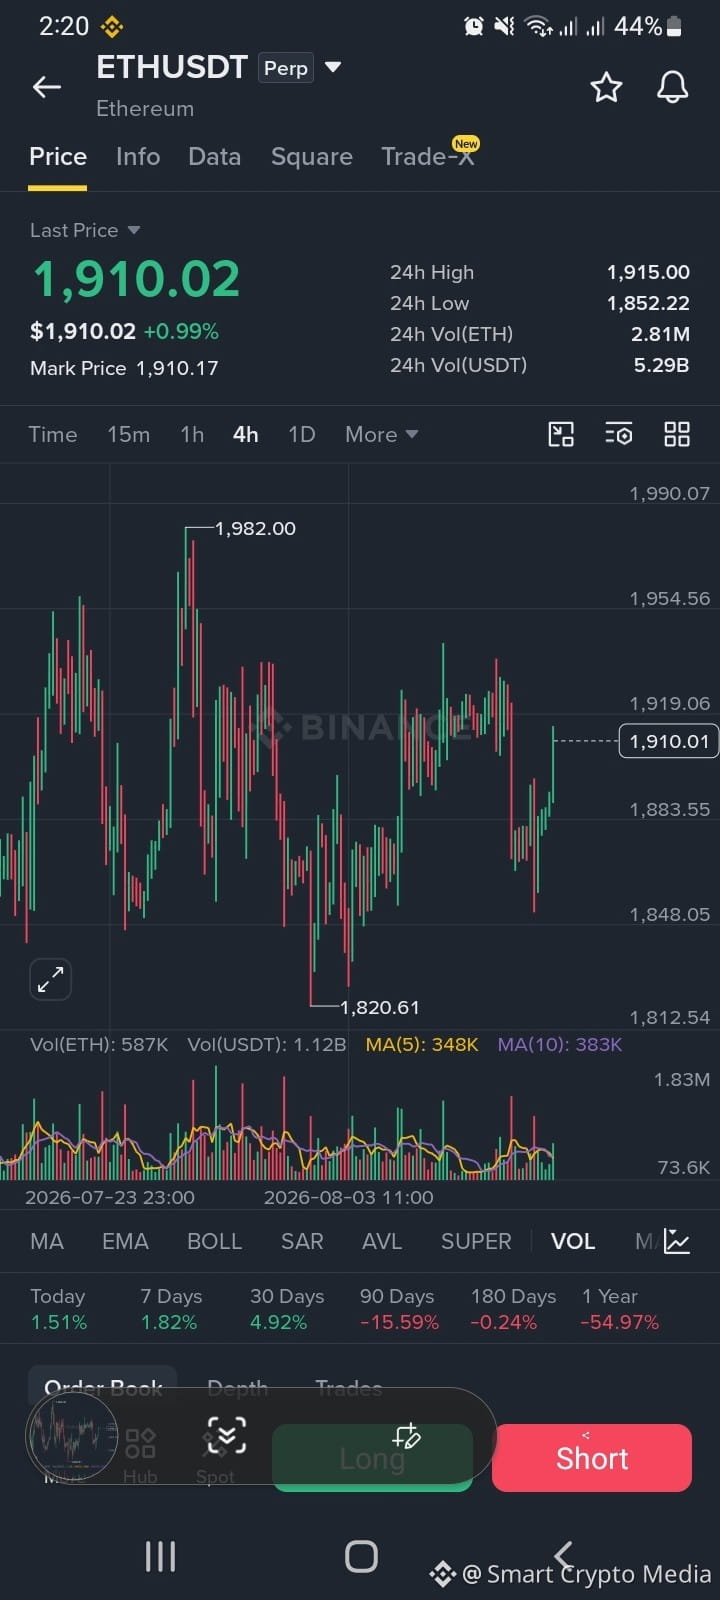
140
Been staring at this chart longer than I should admit. $XEC just went from basically forgotten to +27% and I keep asking myself if I'm seeing a real move or just watching liquidity do its thing on a small-cap pair. Two weeks ago this thing hit an all-time low. Now it's ripping. Both of those facts are true and somehow that's the part that gets me — how fast the story flips from "dead coin" to "look at this" with basically nothing fundamental changing in between. I don't have a strong conviction here, and honestly that's fine. Not every chart needs one. There's something almost funny about a payments-focused coin generating this much attention from a price spike instead of, you know, payments. Makes me wonder how much of crypto attention is actually about the thing versus about the candle. I'm not shorting it, I'm not longing it, I'm just watching how it holds after the initial spike cools — that's usually where the real information is, not in the first hour of the move. Anyone else feel like these low-cap pops are getting harder to read than they used to be, or is that just me.
#XEC #SmartCryptoMedia #writetoearn
Been staring at this chart longer than I should admit. $XEC just went from basically forgotten to +27% and I keep asking myself if I'm seeing a real move or just watching liquidity do its thing on a small-cap pair. Two weeks ago this thing hit an all-time low. Now it's ripping. Both of those facts are true and somehow that's the part that gets me — how fast the story flips from "dead coin" to "look at this" with basically nothing fundamental changing in between. I don't have a strong conviction here, and honestly that's fine. Not every chart needs one. There's something almost funny about a payments-focused coin generating this much attention from a price spike instead of, you know, payments. Makes me wonder how much of crypto attention is actually about the thing versus about the candle. I'm not shorting it, I'm not longing it, I'm just watching how it holds after the initial spike cools — that's usually where the real information is, not in the first hour of the move. Anyone else feel like these low-cap pops are getting harder to read than they used to be, or is that just me.
#XEC #SmartCryptoMedia #writetoearn
#XEC #SmartCryptoMedia #writetoearn
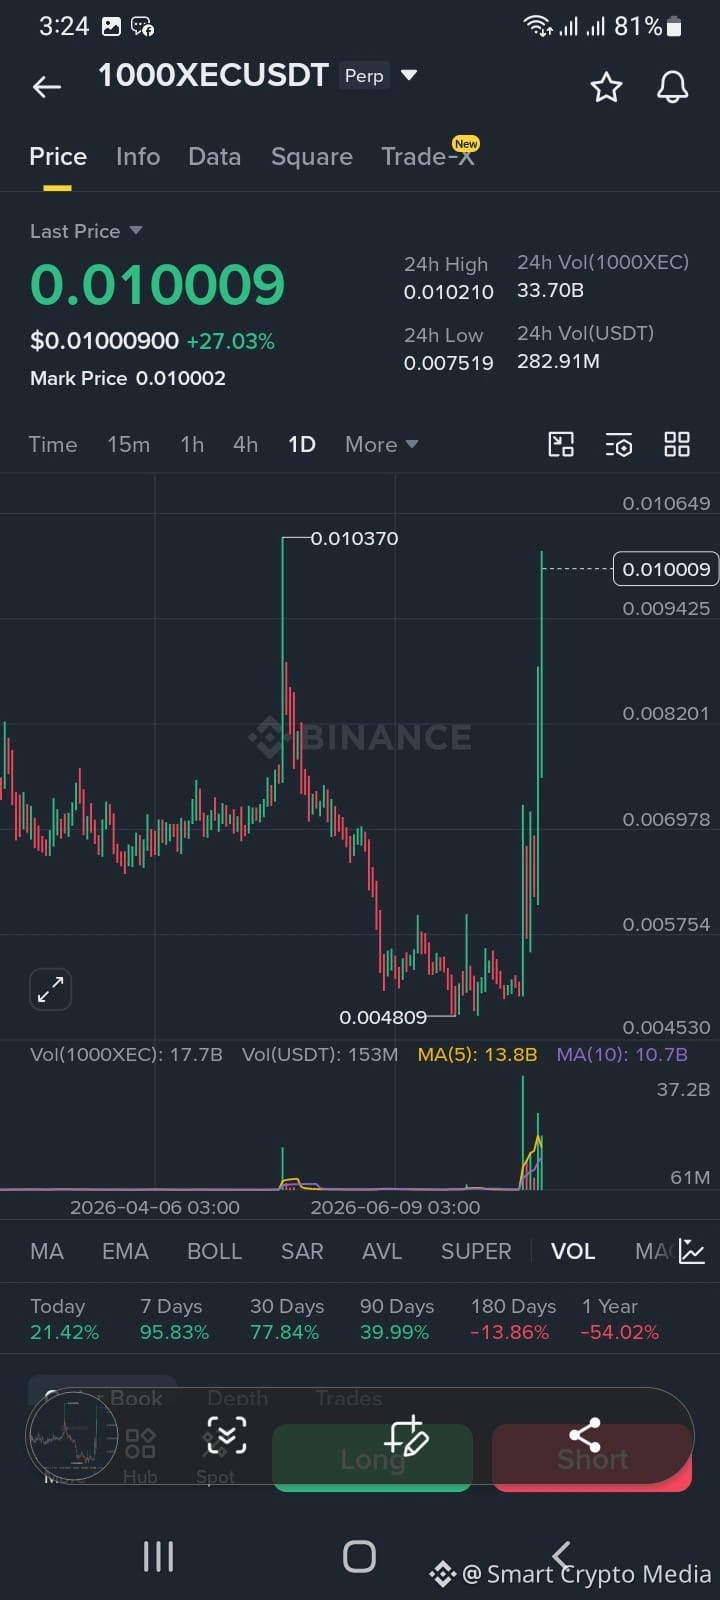
244
Been staring at the $TLM chart for a few minutes longer than I probably should. Up over 100% today, and somewhere in the middle of that candle it touched $0.0043 before giving almost half of it back. There's something almost hypnotic about watching a token do that — the green wick, then the red one right after, like the market couldn't decide what it actually believed.
I don't really have a strong read on this one, honestly. Alien Worlds isn't a new project, it's been through cycles before, and I remember it being one of those names that everyone forgot about until a chart like this drags it back into the timeline. Part of me wants to say it's just leverage and a game incentive doing their job for a week. Part of me wonders if I'm underestimating it because I've seen it disappoint before.
What I keep coming back to is how fast the retrace happened. That's usually the tell — not the size of the pump, but how quickly it gets sold into. I don't have a conclusion here, just a note to myself to watch how it behaves over the next day or two once the tournament incentives taper off, rather than reacting to the number on the screen right now.
#TLM #SmartCryptoMedia #writetoearn
Been staring at the $TLM chart for a few minutes longer than I probably should. Up over 100% today, and somewhere in the middle of that candle it touched $0.0043 before giving almost half of it back. There's something almost hypnotic about watching a token do that — the green wick, then the red one right after, like the market couldn't decide what it actually believed.
I don't really have a strong read on this one, honestly. Alien Worlds isn't a new project, it's been through cycles before, and I remember it being one of those names that everyone forgot about until a chart like this drags it back into the timeline. Part of me wants to say it's just leverage and a game incentive doing their job for a week. Part of me wonders if I'm underestimating it because I've seen it disappoint before.
What I keep coming back to is how fast the retrace happened. That's usually the tell — not the size of the pump, but how quickly it gets sold into. I don't have a conclusion here, just a note to myself to watch how it behaves over the next day or two once the tournament incentives taper off, rather than reacting to the number on the screen right now.
#TLM #SmartCryptoMedia #writetoearn
I don't really have a strong read on this one, honestly. Alien Worlds isn't a new project, it's been through cycles before, and I remember it being one of those names that everyone forgot about until a chart like this drags it back into the timeline. Part of me wants to say it's just leverage and a game incentive doing their job for a week. Part of me wonders if I'm underestimating it because I've seen it disappoint before.
What I keep coming back to is how fast the retrace happened. That's usually the tell — not the size of the pump, but how quickly it gets sold into. I don't have a conclusion here, just a note to myself to watch how it behaves over the next day or two once the tournament incentives taper off, rather than reacting to the number on the screen right now.
#TLM #SmartCryptoMedia #writetoearn
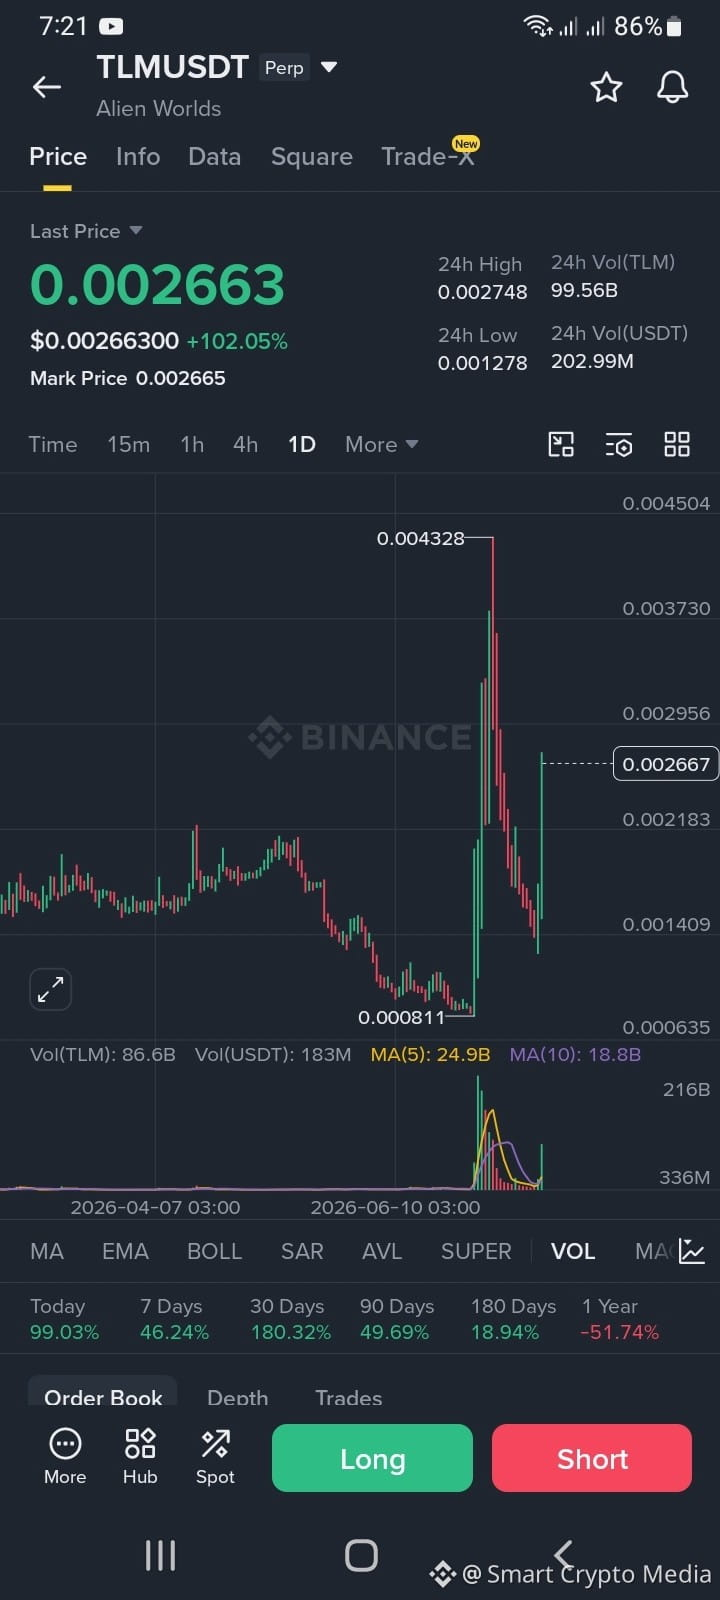
1
1
1.8k
Partly True

Article
Kioxia ADR Drops More Than 14% — Should Crypto Investors Be Paying Attention?
#KioxiaADRFallsOver14% #SmartCryptoMedia #Write2Earn
Kioxia's ADR took a heavy hit, falling more than 14% in a single session. On the surface, it might seem like just another rough day for a semiconductor company. But the move has drawn attention from investors well beyond the stock market, including those focused on crypto.
So why does this matter?
What Likely Drove the Sell-Off?
A decline of this size usually reflects growing concerns rather than a single issue. Investors may be reacting to weaker-than-expected earnings, softer guidance, slowing demand for memory chips, or simply locking in profits after a strong run.
That's fairly common in the semiconductor industry. It's a business known for its ups and downs, and even small shifts in demand can have a noticeable impact on company valuations.
Why Crypto Traders Should Care
At first glance, a memory chip manufacturer doesn't seem connected to Bitcoin or the broader crypto market. In reality, the link is stronger than many people think.
Semiconductor companies sit at the heart of the technology sector. When investors become cautious about tech stocks, that cautious mood often spreads to other risk-oriented assets. Crypto is usually part of that conversation.
It's worth keeping an eye on a few things:
· Whether weakness across semiconductor stocks starts affecting overall market sentiment.
· How the Nasdaq performs, since major cryptocurrencies like Bitcoin and Ethereum often react when tech stocks come under pressure.
· Whether AI-related crypto projects and blockchain infrastructure tokens begin to see increased volatility if investors pull back from technology-focused investments.
None of these factors guarantees that crypto prices will fall, but they can influence short-term market behavior.
What to Watch Next
Rather than focusing on one company's share price, it makes more sense to watch the bigger picture.
Pay attention to whether Bitcoin can hold important support levels. Keep an eye on sentiment across the technology sector, especially AI and semiconductor stocks. Economic data releases and central bank decisions will also play a role in shaping overall risk appetite.
A drop in one tech stock doesn't automatically translate into weakness across crypto markets. Still, it's a useful reminder that today's markets are more connected than many people realize.
Final Thoughts
The sharp decline in Kioxia's ADR highlights how quickly sentiment can shift in the technology sector. For crypto traders, the takeaway isn't to panic over a semiconductor stock. It's to recognize that broader market trends often spill across asset classes.
Following crypto alone is rarely enough. Keeping an eye on technology, equities, and macroeconomic developments can provide valuable context when market conditions start to change.
Do you think weakness in semiconductor stocks could eventually weigh on crypto, or has Bitcoin become independent enough to ignore moves like this? I'd be interested to hear your view.
Kioxia ADR Drops More Than 14% — Should Crypto Investors Be Paying Attention?
#KioxiaADRFallsOver14% #SmartCryptoMedia #Write2Earn
Kioxia's ADR took a heavy hit, falling more than 14% in a single session. On the surface, it might seem like just another rough day for a semiconductor company. But the move has drawn attention from investors well beyond the stock market, including those focused on crypto.
So why does this matter?
What Likely Drove the Sell-Off?
A decline of this size usually reflects growing concerns rather than a single issue. Investors may be reacting to weaker-than-expected earnings, softer guidance, slowing demand for memory chips, or simply locking in profits after a strong run.
That's fairly common in the semiconductor industry. It's a business known for its ups and downs, and even small shifts in demand can have a noticeable impact on company valuations.
Why Crypto Traders Should Care
At first glance, a memory chip manufacturer doesn't seem connected to Bitcoin or the broader crypto market. In reality, the link is stronger than many people think.
Semiconductor companies sit at the heart of the technology sector. When investors become cautious about tech stocks, that cautious mood often spreads to other risk-oriented assets. Crypto is usually part of that conversation.
It's worth keeping an eye on a few things:
· Whether weakness across semiconductor stocks starts affecting overall market sentiment.
· How the Nasdaq performs, since major cryptocurrencies like Bitcoin and Ethereum often react when tech stocks come under pressure.
· Whether AI-related crypto projects and blockchain infrastructure tokens begin to see increased volatility if investors pull back from technology-focused investments.
None of these factors guarantees that crypto prices will fall, but they can influence short-term market behavior.
What to Watch Next
Rather than focusing on one company's share price, it makes more sense to watch the bigger picture.
Pay attention to whether Bitcoin can hold important support levels. Keep an eye on sentiment across the technology sector, especially AI and semiconductor stocks. Economic data releases and central bank decisions will also play a role in shaping overall risk appetite.
A drop in one tech stock doesn't automatically translate into weakness across crypto markets. Still, it's a useful reminder that today's markets are more connected than many people realize.
Final Thoughts
The sharp decline in Kioxia's ADR highlights how quickly sentiment can shift in the technology sector. For crypto traders, the takeaway isn't to panic over a semiconductor stock. It's to recognize that broader market trends often spill across asset classes.
Following crypto alone is rarely enough. Keeping an eye on technology, equities, and macroeconomic developments can provide valuable context when market conditions start to change.
Do you think weakness in semiconductor stocks could eventually weigh on crypto, or has Bitcoin become independent enough to ignore moves like this? I'd be interested to hear your view.
Kioxia's ADR took a heavy hit, falling more than 14% in a single session. On the surface, it might seem like just another rough day for a semiconductor company. But the move has drawn attention from investors well beyond the stock market, including those focused on crypto.
So why does this matter?
What Likely Drove the Sell-Off?
A decline of this size usually reflects growing concerns rather than a single issue. Investors may be reacting to weaker-than-expected earnings, softer guidance, slowing demand for memory chips, or simply locking in profits after a strong run.
That's fairly common in the semiconductor industry. It's a business known for its ups and downs, and even small shifts in demand can have a noticeable impact on company valuations.
Why Crypto Traders Should Care
At first glance, a memory chip manufacturer doesn't seem connected to Bitcoin or the broader crypto market. In reality, the link is stronger than many people think.
Semiconductor companies sit at the heart of the technology sector. When investors become cautious about tech stocks, that cautious mood often spreads to other risk-oriented assets. Crypto is usually part of that conversation.
It's worth keeping an eye on a few things:
· Whether weakness across semiconductor stocks starts affecting overall market sentiment.
· How the Nasdaq performs, since major cryptocurrencies like Bitcoin and Ethereum often react when tech stocks come under pressure.
· Whether AI-related crypto projects and blockchain infrastructure tokens begin to see increased volatility if investors pull back from technology-focused investments.
None of these factors guarantees that crypto prices will fall, but they can influence short-term market behavior.
What to Watch Next
Rather than focusing on one company's share price, it makes more sense to watch the bigger picture.
Pay attention to whether Bitcoin can hold important support levels. Keep an eye on sentiment across the technology sector, especially AI and semiconductor stocks. Economic data releases and central bank decisions will also play a role in shaping overall risk appetite.
A drop in one tech stock doesn't automatically translate into weakness across crypto markets. Still, it's a useful reminder that today's markets are more connected than many people realize.
Final Thoughts
The sharp decline in Kioxia's ADR highlights how quickly sentiment can shift in the technology sector. For crypto traders, the takeaway isn't to panic over a semiconductor stock. It's to recognize that broader market trends often spill across asset classes.
Following crypto alone is rarely enough. Keeping an eye on technology, equities, and macroeconomic developments can provide valuable context when market conditions start to change.
Do you think weakness in semiconductor stocks could eventually weigh on crypto, or has Bitcoin become independent enough to ignore moves like this? I'd be interested to hear your view.
1
173
Why Crypto Is Starting to Look More Like Banking Than Trading#cryptobankingforbillioner #SmartCryptoMedia #write2earn
Why Crypto Is Starting to Look More Like Banking Than Trading
When people talk about crypto, the conversation usually goes straight to prices.
Bitcoin targets.
Memecoin rallies.
ETF headlines.
The next altseason.
That side of crypto gets most of the attention. But I think something much bigger is happening quietly in the background — and a lot of people are missing it.
For millions around the world, crypto isn’t mainly about speculation anymore. It’s becoming a practical financial tool. In some cases, it’s replacing parts of the traditional banking system entirely.
And honestly, that shift feels more important than another short-term market pump.
In many countries, basic banking still isn’t simple. Opening an account can take time, paperwork, and approvals that many people either can’t access or don’t trust. Add inflation, unstable local currencies, or expensive international transfers, and the system starts looking even more broken.
Crypto stepped into that gap.
Now, someone with just a smartphone and internet connection can:
send money across borders,
hold savings digitally,
receive payments,
store value in stablecoins,
and access financial tools at almost any time.
No branch visits. No waiting days for transfers. No bank hours.
That convenience matters more than many people in developed markets realize.
Stablecoins are probably the clearest example of this trend. Outside the crypto space, people often assume everyone is chasing risky tokens all day. In reality, a huge number of users simply want access to digital dollars.
That’s why coins like USDT and USDC became so widely used.
For some people, stablecoins are less about investing and more about stability itself. Their local currency may be losing value quickly, or sending money internationally may cost too much through traditional channels. Holding digital dollars becomes the easier option.
And in parts of Africa, Asia, and Latin America, that use case is growing fast.
Another thing that stands out to me is how universal crypto feels. The same wallet app can work for a freelancer in Southeast Asia, a small business owner in South America, or a student in Africa. Traditional banking systems are heavily tied to geography. Crypto isn’t built that way.
Of course, none of this means the industry is perfect.
There are still scams, security problems, regulation debates, and plenty of volatility. Beginners can lose money easily if they don’t understand what they’re doing. Those risks are real.
But adoption keeps moving forward anyway.
Usually, people adopt technology because it solves a problem before they care about the philosophy behind it. The internet worked the same way. Most people didn’t wait for it to become perfect before using it in everyday life.
Crypto may be following a similar path.
Personally, I don’t think the next wave of users will arrive because they suddenly want to become traders. Many will come because they need cheaper payments, protection against inflation, or easier access to global finance.
That changes the entire narrative around crypto.
It becomes less about speculation and more about infrastructure people actually use.
And if that trend keeps accelerating, the industry is probably still much earlier than most people think.
I’m curious what it looks like where you live.
Are people around you using crypto mainly for investing, or is it becoming part of everyday financial life already?
Why Crypto Is Starting to Look More Like Banking Than Trading
#cryptobankingforbillioner #SmartCryptoMedia #write2earn
Why Crypto Is Starting to Look More Like Banking Than Trading
When people talk about crypto, the conversation usually goes straight to prices.
Bitcoin targets.
Memecoin rallies.
ETF headlines.
The next altseason.
That side of crypto gets most of the attention. But I think something much bigger is happening quietly in the background — and a lot of people are missing it.
For millions around the world, crypto isn’t mainly about speculation anymore. It’s becoming a practical financial tool. In some cases, it’s replacing parts of the traditional banking system entirely.
And honestly, that shift feels more important than another short-term market pump.
In many countries, basic banking still isn’t simple. Opening an account can take time, paperwork, and approvals that many people either can’t access or don’t trust. Add inflation, unstable local currencies, or expensive international transfers, and the system starts looking even more broken.
Crypto stepped into that gap.
Now, someone with just a smartphone and internet connection can:
send money across borders,
hold savings digitally,
receive payments,
store value in stablecoins,
and access financial tools at almost any time.
No branch visits. No waiting days for transfers. No bank hours.
That convenience matters more than many people in developed markets realize.
Stablecoins are probably the clearest example of this trend. Outside the crypto space, people often assume everyone is chasing risky tokens all day. In reality, a huge number of users simply want access to digital dollars.
That’s why coins like USDT and USDC became so widely used.
For some people, stablecoins are less about investing and more about stability itself. Their local currency may be losing value quickly, or sending money internationally may cost too much through traditional channels. Holding digital dollars becomes the easier option.
And in parts of Africa, Asia, and Latin America, that use case is growing fast.
Another thing that stands out to me is how universal crypto feels. The same wallet app can work for a freelancer in Southeast Asia, a small business owner in South America, or a student in Africa. Traditional banking systems are heavily tied to geography. Crypto isn’t built that way.
Of course, none of this means the industry is perfect.
There are still scams, security problems, regulation debates, and plenty of volatility. Beginners can lose money easily if they don’t understand what they’re doing. Those risks are real.
But adoption keeps moving forward anyway.
Usually, people adopt technology because it solves a problem before they care about the philosophy behind it. The internet worked the same way. Most people didn’t wait for it to become perfect before using it in everyday life.
Crypto may be following a similar path.
Personally, I don’t think the next wave of users will arrive because they suddenly want to become traders. Many will come because they need cheaper payments, protection against inflation, or easier access to global finance.
That changes the entire narrative around crypto.
It becomes less about speculation and more about infrastructure people actually use.
And if that trend keeps accelerating, the industry is probably still much earlier than most people think.
I’m curious what it looks like where you live.
Are people around you using crypto mainly for investing, or is it becoming part of everyday financial life already?
Why Crypto Is Starting to Look More Like Banking Than Trading
When people talk about crypto, the conversation usually goes straight to prices.
Bitcoin targets.
Memecoin rallies.
ETF headlines.
The next altseason.
That side of crypto gets most of the attention. But I think something much bigger is happening quietly in the background — and a lot of people are missing it.
For millions around the world, crypto isn’t mainly about speculation anymore. It’s becoming a practical financial tool. In some cases, it’s replacing parts of the traditional banking system entirely.
And honestly, that shift feels more important than another short-term market pump.
In many countries, basic banking still isn’t simple. Opening an account can take time, paperwork, and approvals that many people either can’t access or don’t trust. Add inflation, unstable local currencies, or expensive international transfers, and the system starts looking even more broken.
Crypto stepped into that gap.
Now, someone with just a smartphone and internet connection can:
send money across borders,
hold savings digitally,
receive payments,
store value in stablecoins,
and access financial tools at almost any time.
No branch visits. No waiting days for transfers. No bank hours.
That convenience matters more than many people in developed markets realize.
Stablecoins are probably the clearest example of this trend. Outside the crypto space, people often assume everyone is chasing risky tokens all day. In reality, a huge number of users simply want access to digital dollars.
That’s why coins like USDT and USDC became so widely used.
For some people, stablecoins are less about investing and more about stability itself. Their local currency may be losing value quickly, or sending money internationally may cost too much through traditional channels. Holding digital dollars becomes the easier option.
And in parts of Africa, Asia, and Latin America, that use case is growing fast.
Another thing that stands out to me is how universal crypto feels. The same wallet app can work for a freelancer in Southeast Asia, a small business owner in South America, or a student in Africa. Traditional banking systems are heavily tied to geography. Crypto isn’t built that way.
Of course, none of this means the industry is perfect.
There are still scams, security problems, regulation debates, and plenty of volatility. Beginners can lose money easily if they don’t understand what they’re doing. Those risks are real.
But adoption keeps moving forward anyway.
Usually, people adopt technology because it solves a problem before they care about the philosophy behind it. The internet worked the same way. Most people didn’t wait for it to become perfect before using it in everyday life.
Crypto may be following a similar path.
Personally, I don’t think the next wave of users will arrive because they suddenly want to become traders. Many will come because they need cheaper payments, protection against inflation, or easier access to global finance.
That changes the entire narrative around crypto.
It becomes less about speculation and more about infrastructure people actually use.
And if that trend keeps accelerating, the industry is probably still much earlier than most people think.
I’m curious what it looks like where you live.
Are people around you using crypto mainly for investing, or is it becoming part of everyday financial life already?
2
3
726
Log in to explore more content
Join global crypto users on Binance Square
⚡️ Get latest and useful information about crypto.
💬 Trusted by the world’s largest crypto exchange.
👍 Discover real insights from verified creators.
Email / Phone number
Trending Topics
1
#NvidiaLoses$2.7TrillionInMonthAndAHalf
7,372 views
83 Discussing
2
#CanBTCReboundAfterFallingBelow60K?
611,302 views
2,676 Discussing
3
#GlobalStocksFaceLongestLosingStreakSince2023
223,671 views
1,841 Discussing
4
#BlackRockIBITPostsRecord$541MSingleDayOutflow
20,803 views
67 Discussing
5
#AnthropicPlungesTowardIPOPriceonDay2
111,174 views
1,092 Discussing
6
#TwentyOneCapitalAdds172.25BTC
47,763 views
575 Discussing
7
#HKBillWouldExcludeTokenizedDepositsFromVirtualAssets
5,423 views
48 Discussing
8
#BNBDropsBelow540USDTWith8.46%DailyDecline
63,262 views
573 Discussing
9
#HKBillProposesHK$100KFineForUnauthorizedCryptoTitles
2,119 views
21 Discussing
10
#BitMineFaces$10.1BUnrealizedETHLoss
4,366 views
25 Discussing