
#technicalanalysiss
technicalanalysiss
1.1M views
4,167 Discussing
Hot
Latest
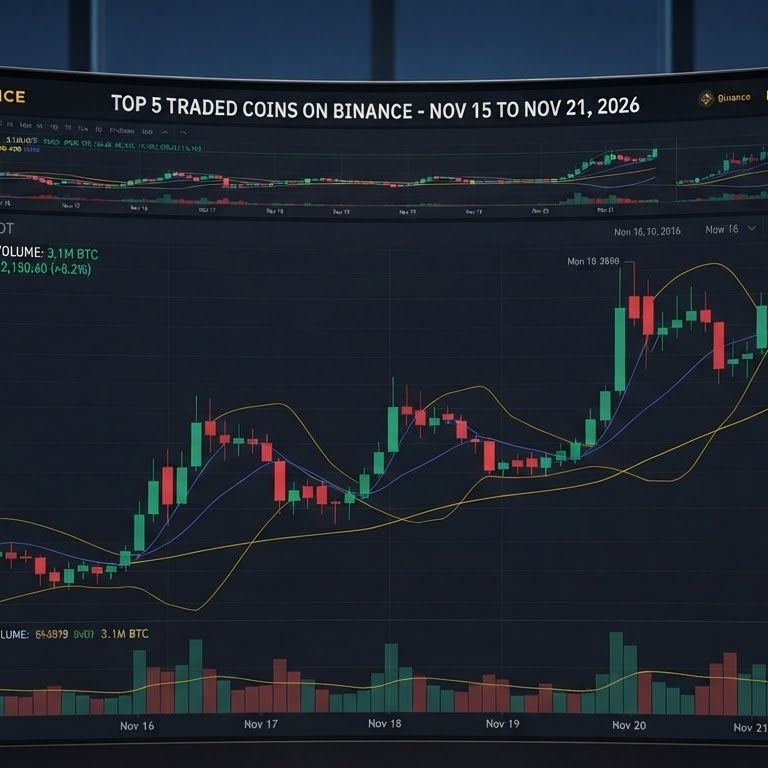
**🚨 Extreme Fear Before Monday's Open: 3 Levels Watching Tomorrow ($BTC, $ETH,$SOL)**
With market sentiment sitting in Extreme Fear ahead of the December Fed rate decision, tomorrow's Monday open is all about whether major support holds or triggers a liquidity sweep.
Here is my game plan for the top coins heading into the new week:
🔸 $BTC BTC (Bitcoin)**
• **Key Support:** $57,700 – $58,500 (must hold to avoid a deeper drop toward $55K)
• **Bounce Target:** $60,000 – $62,000
• **Setup:** Watching for a Monday open sweep below weekend lows before looking for long confirmation.
🔸 $ETH TH (Ethereum)**
• **Key Support:** $1,660 – $1,700
• **Bounce Target:** $1,800 – $1,850
• **Setup:** Heavy ETF outflows have weighed on price, so waiting for a clear base above $1,700 before stepping in.
🔸 $SOL (Solana)**
• **Key Support:** $70 – $75
• **Bounce Target:** $85 – $90
• **Setup:** Deeply oversold on higher timeframes—if $BTC stabilizes,$SOL remains a top candidate for a fast relief bounce.
⚠️ **Trading Rule for Tomorrow:** Weekend volume is thin. Don't FOMO into the first green candle—wait for US session volume and keep stop-losses tight. *(Not financial advice)*
👇 **What is your move for Monday's open—buying the fear or waiting on the sidelines? Drop your top coin below!**
#CryptoTradingPrediction #TechnicalAnalysiss #bitcoin #Write2Earn #Follow_Like_Comment
**🚨 Extreme Fear Before Monday's Open: 3 Levels Watching Tomorrow ($BTC , $ETH ,$SOL)**
With market sentiment sitting in Extreme Fear ahead of the December Fed rate decision, tomorrow's Monday open is all about whether major support holds or triggers a liquidity sweep.
Here is my game plan for the top coins heading into the new week:
🔸 $BTC BTC (Bitcoin)**
• **Key Support:** $57,700 – $58,500 (must hold to avoid a deeper drop toward $55K)
• **Bounce Target:** $60,000 – $62,000
• **Setup:** Watching for a Monday open sweep below weekend lows before looking for long confirmation.
🔸 $ETH TH (Ethereum)**
• **Key Support:** $1,660 – $1,700
• **Bounce Target:** $1,800 – $1,850
• **Setup:** Heavy ETF outflows have weighed on price, so waiting for a clear base above $1,700 before stepping in.
🔸 $SOL (Solana)**
• **Key Support:** $70 – $75
• **Bounce Target:** $85 – $90
• **Setup:** Deeply oversold on higher timeframes—if $BTC stabilizes,$SOL remains a top candidate for a fast relief bounce.
⚠️ **Trading Rule for Tomorrow:** Weekend volume is thin. Don't FOMO into the first green candle—wait for US session volume and keep stop-losses tight. *(Not financial advice)*
👇 **What is your move for Monday's open—buying the fear or waiting on the sidelines? Drop your top coin below!**
#CryptoTradingPrediction #TechnicalAnalysiss #bitcoin #Write2Earn #Follow_Like_Comment
With market sentiment sitting in Extreme Fear ahead of the December Fed rate decision, tomorrow's Monday open is all about whether major support holds or triggers a liquidity sweep.
Here is my game plan for the top coins heading into the new week:
🔸 $BTC BTC (Bitcoin)**
• **Key Support:** $57,700 – $58,500 (must hold to avoid a deeper drop toward $55K)
• **Bounce Target:** $60,000 – $62,000
• **Setup:** Watching for a Monday open sweep below weekend lows before looking for long confirmation.
🔸 $ETH TH (Ethereum)**
• **Key Support:** $1,660 – $1,700
• **Bounce Target:** $1,800 – $1,850
• **Setup:** Heavy ETF outflows have weighed on price, so waiting for a clear base above $1,700 before stepping in.
🔸 $SOL (Solana)**
• **Key Support:** $70 – $75
• **Bounce Target:** $85 – $90
• **Setup:** Deeply oversold on higher timeframes—if $BTC stabilizes,$SOL remains a top candidate for a fast relief bounce.
⚠️ **Trading Rule for Tomorrow:** Weekend volume is thin. Don't FOMO into the first green candle—wait for US session volume and keep stop-losses tight. *(Not financial advice)*
👇 **What is your move for Monday's open—buying the fear or waiting on the sidelines? Drop your top coin below!**
#CryptoTradingPrediction #TechnicalAnalysiss #bitcoin #Write2Earn #Follow_Like_Comment
96

·
--
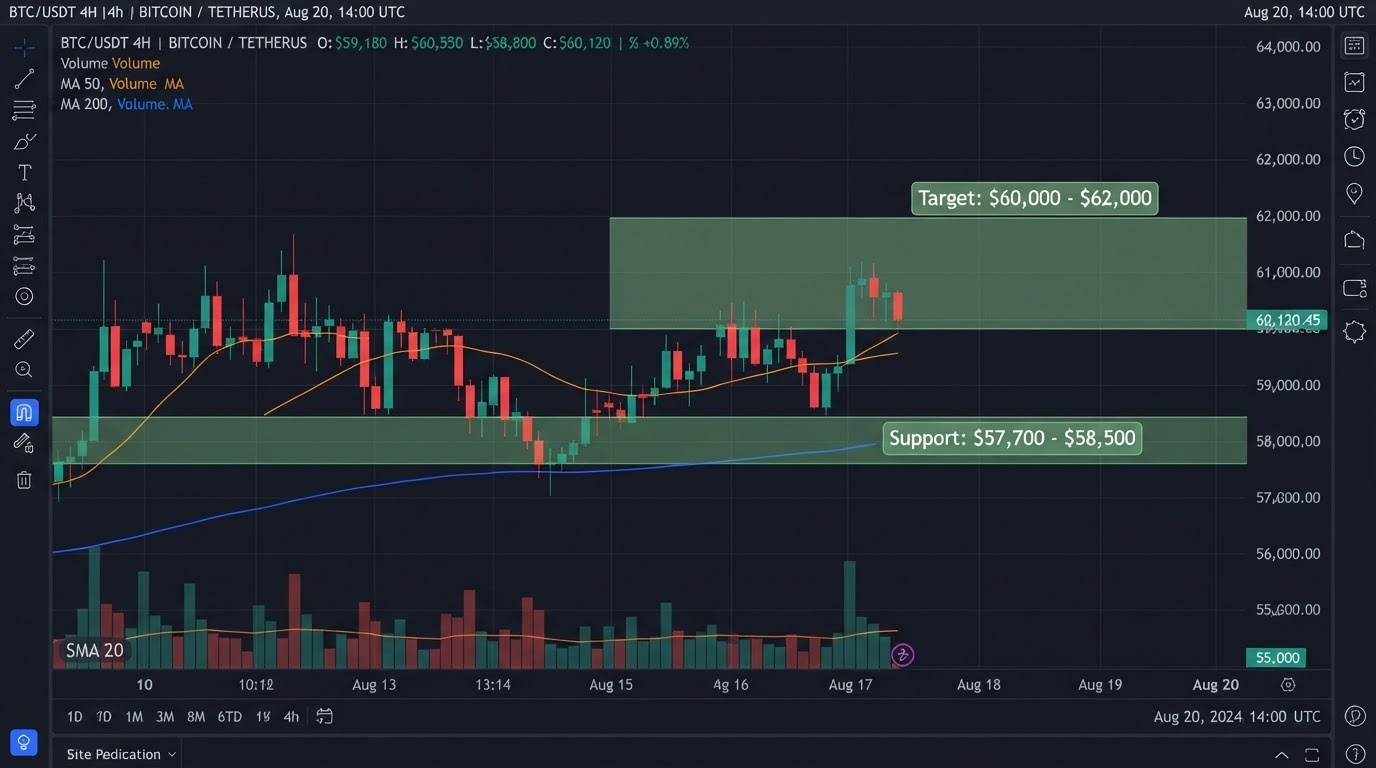
📊 Trade Idea & Key Levels to Watch on $BTC
Looking at the chart from a pure price-action perspective, $BTC just swept liquidity below $57,000 and reclaimed the psychological $60,000 level. [1]
Here are the key zones I’m watching today:
🟢 Support Zone: $57,500 – $58,000 (Must hold to keep the short-term bullish structure intact)
🔴 Resistance Zone: $61,500 – $62,000 (A clean breakout here opens the door toward $64K)
💡 Trader’s Note: Volatility is extremely high right now—over $360M in short positions were just liquidated on this bounce. Keep your leverage low, stick to strict stop-losses, and never chase green candles. [1]
Which coin are you charting today—$BTC, ETH, or SOL? Let’s discuss! 📈
#TechnicalAnalysiss #CryptoTrading. #BTC #RiskManageme
📊 Trade Idea & Key Levels to Watch on $BTC
Looking at the chart from a pure price-action perspective, $BTC just swept liquidity below $57,000 and reclaimed the psychological $60,000 level. [1]
Here are the key zones I’m watching today:
🟢 Support Zone: $57,500 – $58,000 (Must hold to keep the short-term bullish structure intact)
🔴 Resistance Zone: $61,500 – $62,000 (A clean breakout here opens the door toward $64K)
💡 Trader’s Note: Volatility is extremely high right now—over $360M in short positions were just liquidated on this bounce. Keep your leverage low, stick to strict stop-losses, and never chase green candles. [1]
Which coin are you charting today—$BTC, ETH, or SOL? Let’s discuss! 📈
#TechnicalAnalysiss #CryptoTrading. #BTC #RiskManageme
Looking at the chart from a pure price-action perspective, $BTC just swept liquidity below $57,000 and reclaimed the psychological $60,000 level. [1]
Here are the key zones I’m watching today:
🟢 Support Zone: $57,500 – $58,000 (Must hold to keep the short-term bullish structure intact)
🔴 Resistance Zone: $61,500 – $62,000 (A clean breakout here opens the door toward $64K)
💡 Trader’s Note: Volatility is extremely high right now—over $360M in short positions were just liquidated on this bounce. Keep your leverage low, stick to strict stop-losses, and never chase green candles. [1]
Which coin are you charting today—$BTC, ETH, or SOL? Let’s discuss! 📈
#TechnicalAnalysiss #CryptoTrading. #BTC #RiskManageme
70

Article
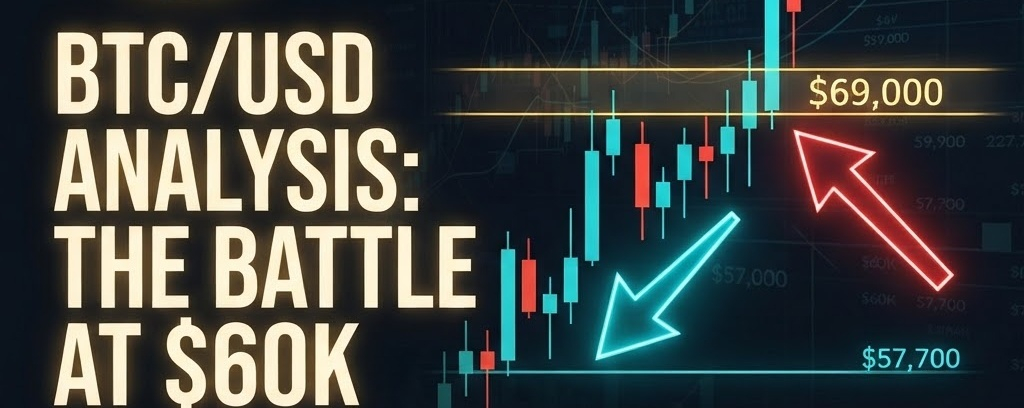
BTC/USD Market Analysis — November 22, 2026$BTC /USD Market Analysis — November 22, 2026
Current Market Snapshot
Bitcoin is trading near $58,980 – $59,000, consolidating just beneath the psychological $60,000 threshold. Macro headwinds—including a hawkish Federal Reserve outlook, elevated Treasury yields, and recent risk-off pressure across tech equities—continue to weigh on short-term momentum.
Key Technical Levels
Immediate Support ($57,700): Recent local swing low acting as the primary floor. Holding above this level keeps short-term stabilization intact.
Major Downside Support ($50,000): If $57,700 fails on high volume, liquidity opens up toward the $50,000 psychological zone.
Immediate Resistance ($59,725 – $60,000): Heavy liquidation clusters sit right below $60K. Bulls need a clean 4H/Daily close above $60,000 to shift momentum.
Secondary Resistance ($62,000): Next key supply zone if $60,000 flips into support.Trading Plan & Risk Management
Bullish Scenario: Wait for a confirmed reclaim and retest of $60,000 before targeting $62,000.
Bearish Scenario: Rejection at $60,000 combined with a breakdown below $57,700 favors short-term continuation toward lower support.
Discipline: Keep position sizes controlled and avoid high leverage inside this $57.7K–$60K chop zone until a breakout confirms direction.
Disclaimer: For educational and informational purposes only. Not financial advice. Always manage your own risk.
#Bitcoin #BTC #CryptoAnalysis #TradingStrategy #BTCUSD #BTCReboundsAbove$60KAmidWhaleDipBuying 🚨 BTC/USD Market Update: Battle at $60,000!Bitcoin is hovering around $59,000 as macro pressure and Fed rate concerns keep bulls on defense.📊 Key Levels to Watch:🟢 Support: $57,700 (Critical floor) | $50,000 (Major psychological zone)🔴 Resistance: $60,000 (Liquidation cluster) | $62,000 (Next target)💡 Game Plan: No FOMO inside the range. Wait for a clean breakout above $60K or a confirmed defense of $57.7K before committing size. Protect your capital first! 🛡️#BTC #Bitcoin #CryptoTrading#TechnicalAnalysiss #Binance #BinanceSquare
BTC/USD Market Analysis — November 22, 2026
$BTC /USD Market Analysis — November 22, 2026
Current Market Snapshot
Bitcoin is trading near $58,980 – $59,000, consolidating just beneath the psychological $60,000 threshold. Macro headwinds—including a hawkish Federal Reserve outlook, elevated Treasury yields, and recent risk-off pressure across tech equities—continue to weigh on short-term momentum.
Key Technical Levels
Immediate Support ($57,700): Recent local swing low acting as the primary floor. Holding above this level keeps short-term stabilization intact.
Major Downside Support ($50,000): If $57,700 fails on high volume, liquidity opens up toward the $50,000 psychological zone.
Immediate Resistance ($59,725 – $60,000): Heavy liquidation clusters sit right below $60K. Bulls need a clean 4H/Daily close above $60,000 to shift momentum.
Secondary Resistance ($62,000): Next key supply zone if $60,000 flips into support.Trading Plan & Risk Management
Bullish Scenario: Wait for a confirmed reclaim and retest of $60,000 before targeting $62,000.
Bearish Scenario: Rejection at $60,000 combined with a breakdown below $57,700 favors short-term continuation toward lower support.
Discipline: Keep position sizes controlled and avoid high leverage inside this $57.7K–$60K chop zone until a breakout confirms direction.
Disclaimer: For educational and informational purposes only. Not financial advice. Always manage your own risk.
#Bitcoin #BTC #CryptoAnalysis #TradingStrategy #BTCUSD #BTCReboundsAbove$60KAmidWhaleDipBuying 🚨 BTC/USD Market Update: Battle at $60,000!Bitcoin is hovering around $59,000 as macro pressure and Fed rate concerns keep bulls on defense.📊 Key Levels to Watch:🟢 Support: $57,700 (Critical floor) | $50,000 (Major psychological zone)🔴 Resistance: $60,000 (Liquidation cluster) | $62,000 (Next target)💡 Game Plan: No FOMO inside the range. Wait for a clean breakout above $60K or a confirmed defense of $57.7K before committing size. Protect your capital first! 🛡️#BTC #Bitcoin #CryptoTrading#TechnicalAnalysiss #Binance #BinanceSquare
Current Market Snapshot
Bitcoin is trading near $58,980 – $59,000, consolidating just beneath the psychological $60,000 threshold. Macro headwinds—including a hawkish Federal Reserve outlook, elevated Treasury yields, and recent risk-off pressure across tech equities—continue to weigh on short-term momentum.
Key Technical Levels
Immediate Support ($57,700): Recent local swing low acting as the primary floor. Holding above this level keeps short-term stabilization intact.
Major Downside Support ($50,000): If $57,700 fails on high volume, liquidity opens up toward the $50,000 psychological zone.
Immediate Resistance ($59,725 – $60,000): Heavy liquidation clusters sit right below $60K. Bulls need a clean 4H/Daily close above $60,000 to shift momentum.
Secondary Resistance ($62,000): Next key supply zone if $60,000 flips into support.Trading Plan & Risk Management
Bullish Scenario: Wait for a confirmed reclaim and retest of $60,000 before targeting $62,000.
Bearish Scenario: Rejection at $60,000 combined with a breakdown below $57,700 favors short-term continuation toward lower support.
Discipline: Keep position sizes controlled and avoid high leverage inside this $57.7K–$60K chop zone until a breakout confirms direction.
Disclaimer: For educational and informational purposes only. Not financial advice. Always manage your own risk.
#Bitcoin #BTC #CryptoAnalysis #TradingStrategy #BTCUSD #BTCReboundsAbove$60KAmidWhaleDipBuying 🚨 BTC/USD Market Update: Battle at $60,000!Bitcoin is hovering around $59,000 as macro pressure and Fed rate concerns keep bulls on defense.📊 Key Levels to Watch:🟢 Support: $57,700 (Critical floor) | $50,000 (Major psychological zone)🔴 Resistance: $60,000 (Liquidation cluster) | $62,000 (Next target)💡 Game Plan: No FOMO inside the range. Wait for a clean breakout above $60K or a confirmed defense of $57.7K before committing size. Protect your capital first! 🛡️#BTC #Bitcoin #CryptoTrading#TechnicalAnalysiss #Binance #BinanceSquare
76

·
--
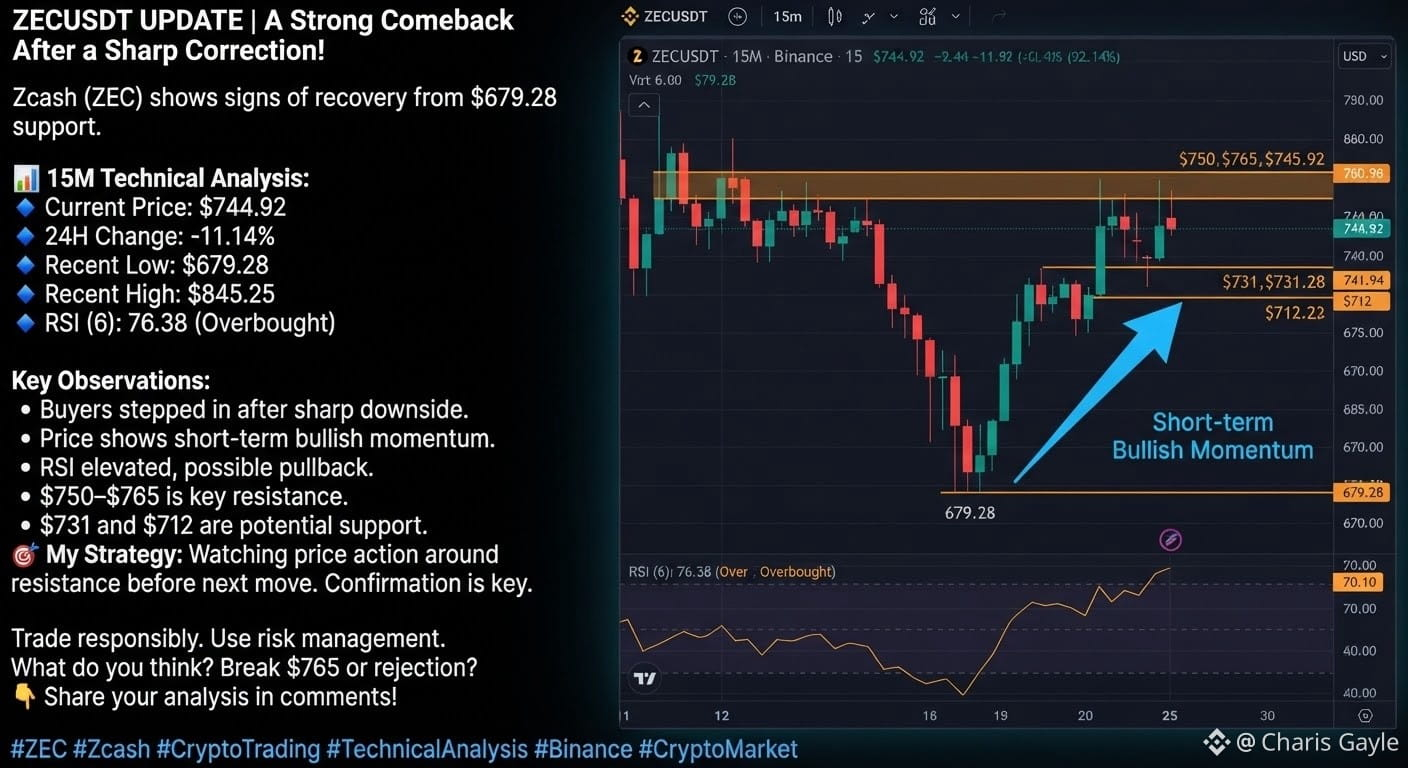
🚨 $ZEC USDT UPDATE | A Strong Comeback After a Sharp Correction!
Zcash (ZEC) is showing signs of a strong recovery after dropping to the $679.28 support zone.
📊 15M Technical Analysis:
🔹 Current Price: $744.92
🔹 24H Change: -11.14%
🔹 Recent Low: $679.28
🔹 Recent High: $845.25
🔹 RSI (6): 76.38
Key Observations:
Buyers have stepped in after the sharp downside move.
Price is showing short-term bullish momentum.
RSI is elevated, suggesting a possible short-term cooling or pullback.
$750–$765 is an important resistance area to watch.
$731 and $712 are potential support zones.
🎯 My Strategy: Watching price action around resistance before considering the next move. Confirmation is more important than chasing green candles.
⚠️ Trade responsibly. Always use proper risk management.
What do you think? Will ZEC break above $765 or face another rejection?
👇 Share your analysis in the comments!
#ZEC #ZEC #ZEC #TechnicalAnalysiss #Binance
{future}(ZECUSDT)
🚨 $ZEC USDT UPDATE | A Strong Comeback After a Sharp Correction!
Zcash (ZEC) is showing signs of a strong recovery after dropping to the $679.28 support zone.
📊 15M Technical Analysis:
🔹 Current Price: $744.92
🔹 24H Change: -11.14%
🔹 Recent Low: $679.28
🔹 Recent High: $845.25
🔹 RSI (6): 76.38
Key Observations:
Buyers have stepped in after the sharp downside move.
Price is showing short-term bullish momentum.
RSI is elevated, suggesting a possible short-term cooling or pullback.
$750–$765 is an important resistance area to watch.
$731 and $712 are potential support zones.
🎯 My Strategy: Watching price action around resistance before considering the next move. Confirmation is more important than chasing green candles.
⚠️ Trade responsibly. Always use proper risk management.
What do you think? Will ZEC break above $765 or face another rejection?
👇 Share your analysis in the comments!
#ZEC #ZEC #ZEC #TechnicalAnalysiss #Binance
Zcash (ZEC) is showing signs of a strong recovery after dropping to the $679.28 support zone.
📊 15M Technical Analysis:
🔹 Current Price: $744.92
🔹 24H Change: -11.14%
🔹 Recent Low: $679.28
🔹 Recent High: $845.25
🔹 RSI (6): 76.38
Key Observations:
Buyers have stepped in after the sharp downside move.
Price is showing short-term bullish momentum.
RSI is elevated, suggesting a possible short-term cooling or pullback.
$750–$765 is an important resistance area to watch.
$731 and $712 are potential support zones.
🎯 My Strategy: Watching price action around resistance before considering the next move. Confirmation is more important than chasing green candles.
⚠️ Trade responsibly. Always use proper risk management.
What do you think? Will ZEC break above $765 or face another rejection?
👇 Share your analysis in the comments!
#ZEC #ZEC #ZEC #TechnicalAnalysiss #Binance
614

·
--
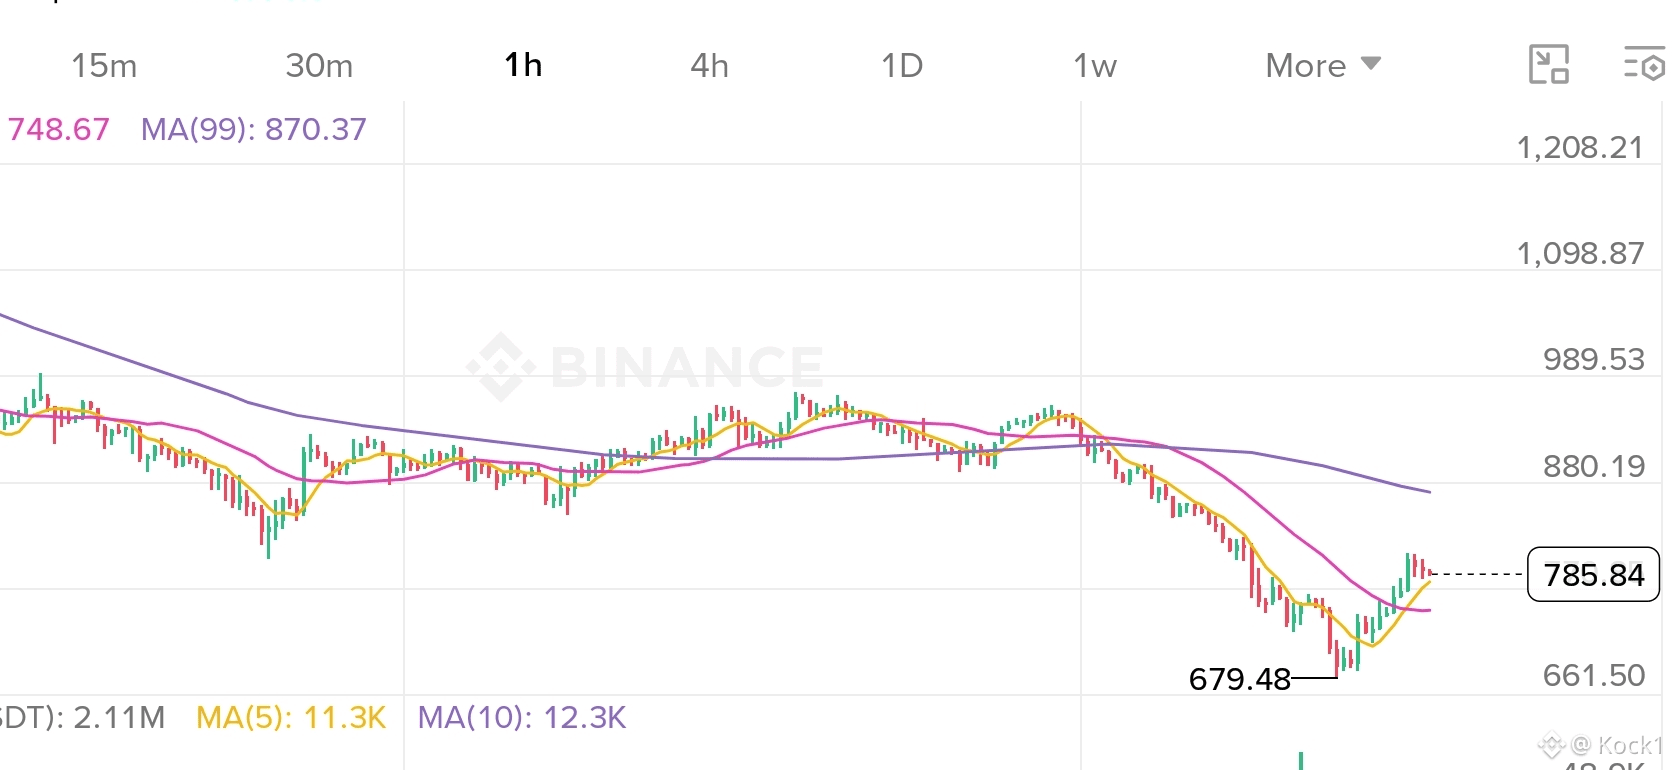
$ZEC bounced from 679.48. Can it clear 807.95?
On the 1H chart, ZEC is back above its 7-hour and 25-hour moving averages. The longer trend still looks weaker, with the 99-hour average sloping down at 870.37.
What caught my eye was the volume. The biggest spikes came near the low. The rebound toward 800 has been quieter.
I’m watching 807.95, the 24-hour high marked in red. A wick above it followed by a close below would leave that level unbroken on a closing basis. A 1H close above it on stronger volume, followed by a pullback that holds, would make the rebound more convincing.
On the downside, the 7-hour average was 778.00 when I took this chart. If price slips back below that average, I’ll be watching the 25-hour average next. It stood at 748.67 in this snapshot.
#Zcash #TechnicalAnalysiss
$ZEC bounced from 679.48. Can it clear 807.95?
On the 1H chart, ZEC is back above its 7-hour and 25-hour moving averages. The longer trend still looks weaker, with the 99-hour average sloping down at 870.37.
What caught my eye was the volume. The biggest spikes came near the low. The rebound toward 800 has been quieter.
I’m watching 807.95, the 24-hour high marked in red. A wick above it followed by a close below would leave that level unbroken on a closing basis. A 1H close above it on stronger volume, followed by a pullback that holds, would make the rebound more convincing.
On the downside, the 7-hour average was 778.00 when I took this chart. If price slips back below that average, I’ll be watching the 25-hour average next. It stood at 748.67 in this snapshot.
#Zcash #TechnicalAnalysiss
On the 1H chart, ZEC is back above its 7-hour and 25-hour moving averages. The longer trend still looks weaker, with the 99-hour average sloping down at 870.37.
What caught my eye was the volume. The biggest spikes came near the low. The rebound toward 800 has been quieter.
I’m watching 807.95, the 24-hour high marked in red. A wick above it followed by a close below would leave that level unbroken on a closing basis. A 1H close above it on stronger volume, followed by a pullback that holds, would make the rebound more convincing.
On the downside, the 7-hour average was 778.00 when I took this chart. If price slips back below that average, I’ll be watching the 25-hour average next. It stood at 748.67 in this snapshot.
#Zcash #TechnicalAnalysiss
1
373
·
--
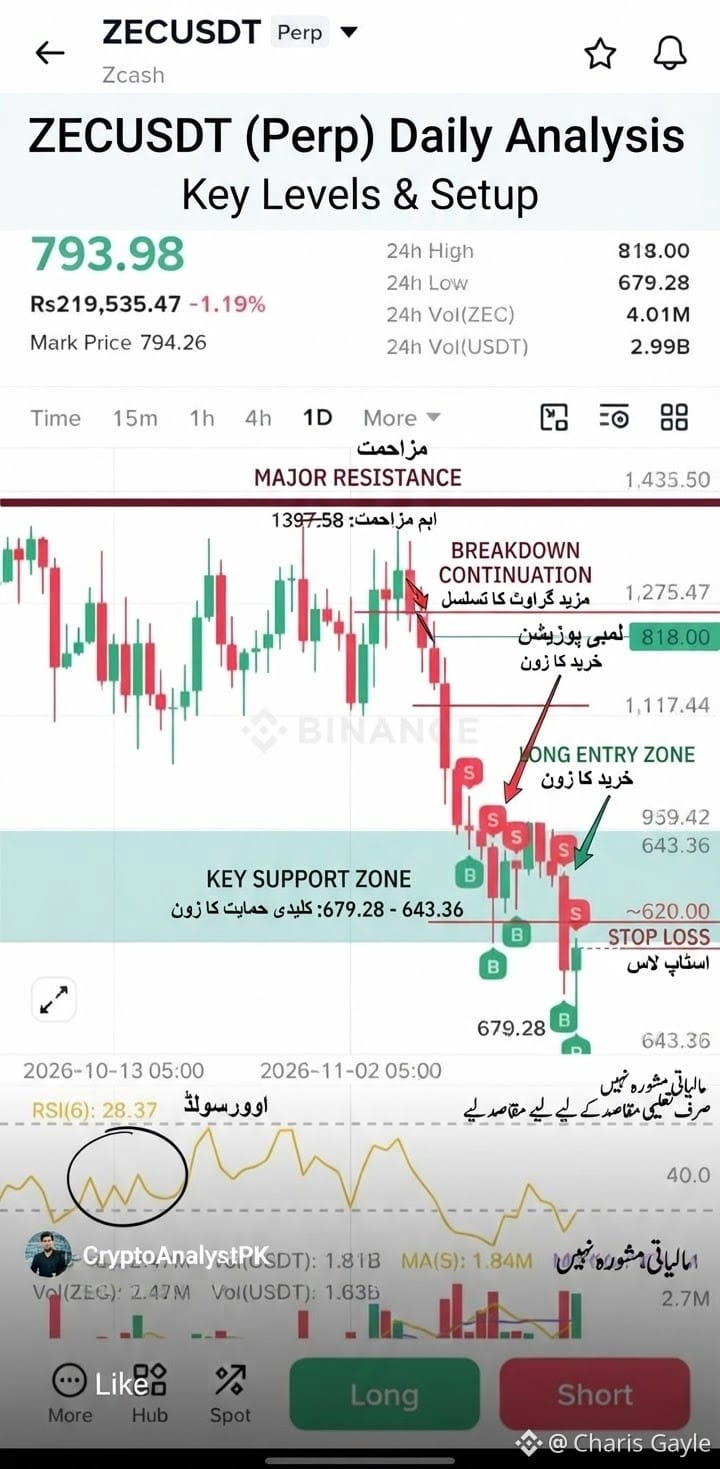
$ZEC USDT (Perp) — Daily Market Update & Key Levels
Current Price: ~793.98 USDT (-1.19%)
24h Range: 679.28 – 818.00 USDT
RSI(6): ~28.37 (Oversold territory on the daily timeframe)
📉 Chart Structure & Levels to Watch
Major Swing High / Resistance Zone: 1,397.58 USDT (prior major rejection)
Overhead Resistance Levels: ~959.42 USDT → ~1,117.44 USDT → ~1,275.47 USDT
Immediate / Local Support: ~679.28 USDT (24h / recent swing low)
Lower Support Zone: ~643.36 USDT
🎯 Trade Scenarios (Educational Levels)
Bounce / Relief Long Idea: Look for confirmation and bullish reaction near the 679.28 – 643.36 demand/support zone, especially while RSI(6) is stretched near oversold levels.
Potential Upside Targets: 818.00 → 959.42 USDT
Invalidation: Clean daily breakdown below 643.36 USDT
Trend / Breakdown Continuation: Since the higher-timeframe move shows heavy downward pressure from the 1,397.58 peak, any weak bounce into resistance zones without volume confirmation can face selling pressure.
⚠️ Risk Disclaimer: This is market analysis and level tracking for educational purposes only—not financial advice. Always manage position size, use a stop-loss, and do your own research (DYOR) before placing any trade.
💡 Tips to Help Binance Square Algorithm Push Your Post
1. Attach the chart image (IMG_20261121_194317.png) directly with clear visible levels.
2. Engage in the first 15–30 minutes after posting by replying to comments and asking a quick question (e.g., "Are you watching for a bounce from 679 or more downside?").
3. Use 3–5 relevant tags like #ZECUSDT #ZECUSDT #CryptoTradingInsights #TechnicalAnalysiss
{spot}(ZECUSDT)
$ZEC USDT (Perp) — Daily Market Update & Key Levels
Current Price: ~793.98 USDT (-1.19%)
24h Range: 679.28 – 818.00 USDT
RSI(6): ~28.37 (Oversold territory on the daily timeframe)
📉 Chart Structure & Levels to Watch
Major Swing High / Resistance Zone: 1,397.58 USDT (prior major rejection)
Overhead Resistance Levels: ~959.42 USDT → ~1,117.44 USDT → ~1,275.47 USDT
Immediate / Local Support: ~679.28 USDT (24h / recent swing low)
Lower Support Zone: ~643.36 USDT
🎯 Trade Scenarios (Educational Levels)
Bounce / Relief Long Idea: Look for confirmation and bullish reaction near the 679.28 – 643.36 demand/support zone, especially while RSI(6) is stretched near oversold levels.
Potential Upside Targets: 818.00 → 959.42 USDT
Invalidation: Clean daily breakdown below 643.36 USDT
Trend / Breakdown Continuation: Since the higher-timeframe move shows heavy downward pressure from the 1,397.58 peak, any weak bounce into resistance zones without volume confirmation can face selling pressure.
⚠️ Risk Disclaimer: This is market analysis and level tracking for educational purposes only—not financial advice. Always manage position size, use a stop-loss, and do your own research (DYOR) before placing any trade.
💡 Tips to Help Binance Square Algorithm Push Your Post
1. Attach the chart image (IMG_20261121_194317.png) directly with clear visible levels.
2. Engage in the first 15–30 minutes after posting by replying to comments and asking a quick question (e.g., "Are you watching for a bounce from 679 or more downside?").
3. Use 3–5 relevant tags like #ZECUSDT #ZECUSDT #CryptoTradingInsights #TechnicalAnalysiss
Current Price: ~793.98 USDT (-1.19%)
24h Range: 679.28 – 818.00 USDT
RSI(6): ~28.37 (Oversold territory on the daily timeframe)
📉 Chart Structure & Levels to Watch
Major Swing High / Resistance Zone: 1,397.58 USDT (prior major rejection)
Overhead Resistance Levels: ~959.42 USDT → ~1,117.44 USDT → ~1,275.47 USDT
Immediate / Local Support: ~679.28 USDT (24h / recent swing low)
Lower Support Zone: ~643.36 USDT
🎯 Trade Scenarios (Educational Levels)
Bounce / Relief Long Idea: Look for confirmation and bullish reaction near the 679.28 – 643.36 demand/support zone, especially while RSI(6) is stretched near oversold levels.
Potential Upside Targets: 818.00 → 959.42 USDT
Invalidation: Clean daily breakdown below 643.36 USDT
Trend / Breakdown Continuation: Since the higher-timeframe move shows heavy downward pressure from the 1,397.58 peak, any weak bounce into resistance zones without volume confirmation can face selling pressure.
⚠️ Risk Disclaimer: This is market analysis and level tracking for educational purposes only—not financial advice. Always manage position size, use a stop-loss, and do your own research (DYOR) before placing any trade.
💡 Tips to Help Binance Square Algorithm Push Your Post
1. Attach the chart image (IMG_20261121_194317.png) directly with clear visible levels.
2. Engage in the first 15–30 minutes after posting by replying to comments and asking a quick question (e.g., "Are you watching for a bounce from 679 or more downside?").
3. Use 3–5 relevant tags like #ZECUSDT #ZECUSDT #CryptoTradingInsights #TechnicalAnalysiss
252

·
--
Holding $AGT 1.5K USDT
$AGT $AGTUSDT 6h chart looking like it needs a nap at 0.02141 with RSI(6) at 23.17 and StochRSI around 20.96. Either a relief bounce is warming up near lower BOLL (0.02076) or it's still teasing the bulls—which way is it? 😂📉📈
#AGTUSDT #CryptoHumor #BinanceFutures #TechnicalAnalysiss
$AGT $AGTUSDT 6h chart looking like it needs a nap at 0.02141 with RSI(6) at 23.17 and StochRSI around 20.96. Either a relief bounce is warming up near lower BOLL (0.02076) or it's still teasing the bulls—which way is it? 😂📉📈
#AGTUSDT #CryptoHumor #BinanceFutures #TechnicalAnalysiss
#AGTUSDT #CryptoHumor #BinanceFutures #TechnicalAnalysiss
1
1.5k

·
--
Bearish
📉 BITCOIN: My Next Move Is Watching for a SHORT!
The bearish scenario is still worth watching.
Here's what could push BTC lower:
🔴 Support breaks with strong selling volume.
🔴 Price fails to reclaim the broken level.
🔴 A weak bounce creates another lower high.
If these signals align, another downside move could follow.
Would you consider a BTC short?
$BTC $BTCUSDT $USDT
{future}(BTCUSDT)
#BTCShort #bitcoin #ShortSetup #TechnicalAnalysiss
Follow for more crypto trading ideas!
📉 BITCOIN: My Next Move Is Watching for a SHORT!
The bearish scenario is still worth watching.
Here's what could push BTC lower:
🔴 Support breaks with strong selling volume.
🔴 Price fails to reclaim the broken level.
🔴 A weak bounce creates another lower high.
If these signals align, another downside move could follow.
Would you consider a BTC short?
$BTC $BTCUSDT $USDT
#BTCShort #bitcoin #ShortSetup #TechnicalAnalysiss
Follow for more crypto trading ideas!
The bearish scenario is still worth watching.
Here's what could push BTC lower:
🔴 Support breaks with strong selling volume.
🔴 Price fails to reclaim the broken level.
🔴 A weak bounce creates another lower high.
If these signals align, another downside move could follow.
Would you consider a BTC short?
$BTC $BTCUSDT $USDT
#BTCShort #bitcoin #ShortSetup #TechnicalAnalysiss
Follow for more crypto trading ideas!
107

Article
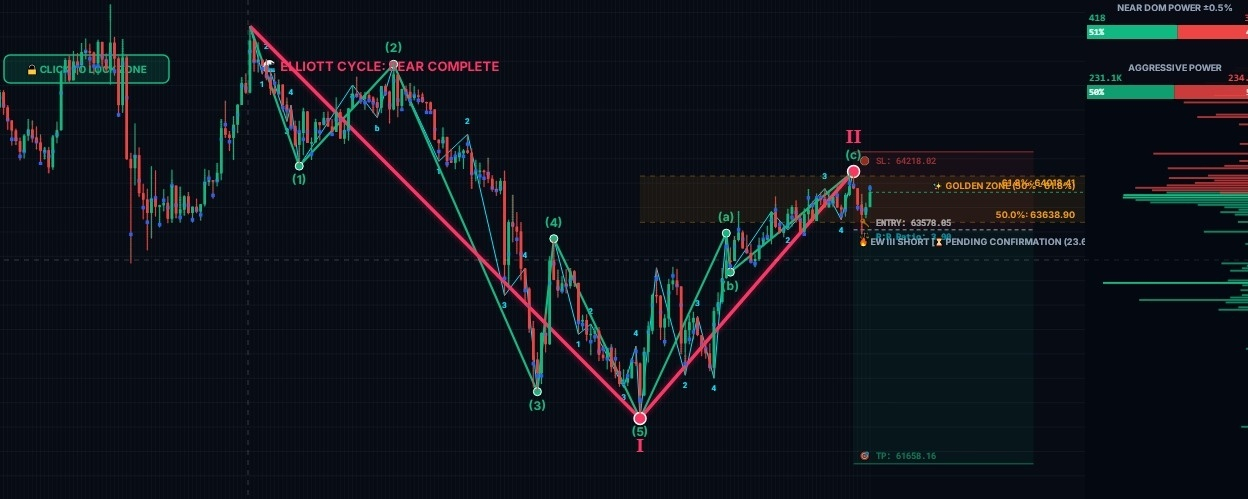
BTC Elliott Wave Alert: Wave II Retracement Complete? Major Short Setup in the Golden Zone! 📉Is Bitcoin’s recent relief bounce running out of steam? Looking closely at the Elliott Wave structure and order flow data, $BTC is flashing a textbook bearish continuation setup right inside a critical Fibonacci resistance cluster.
📊 Technical & Elliott Wave Breakdown
Completed Impulse (Wave I): Following the completion of a 5-wave bearish cycle ((1) through (5)), Bitcoin carved out a major local bottom at Wave I.
Corrective Bounce (Wave II): Price has since staged an (a)-(b)-(c) corrective rally, pushing directly into the Fibonacci Golden Zone (50.0% – 61.8% retracement) around $63,638 – $64,018.
Order Flow & DOM Context: Near DOM Power sits nearly balanced at 51% vs. 49% while Aggressive Power leans slightly bearish (50% sell pressure), indicating buyers are struggling to absorb overhead liquidity in this supply zone.
🎯 Trade Setup Parameters (Pending Confirmation)
As highlighted on the chart (EW III SHORT | PENDING CONFIRMATION), patience is key until lower-timeframe rejection confirms Wave II has topped:
Entry Zone: ~$63,576.85 (on confirmed rejection from the Golden Zone)
Stop Loss (SL): $64,218.02 (strict invalidation above the Wave (c) / Golden Zone high)
Take Profit (TP): $61,650.16 (targeting liquidity below the prior Wave I low as Wave III unfolds)
⚠️ Risk Management Note
Because Wave III moves tend to be sharp and impulsive, waiting for clear bearish candle confirmation before entering helps avoid gettingwicked out by a liquidity sweep above the 61.8% level. Always manage position sizing and stick to your invalidation level.
What’s your game plan here? Are you looking for a rejection short from the Golden Zone, or do you think bulls can reclaim $64,300 and invalidate the count? Drop your thoughts below! 👇
#BTC #ETH #TechnicalAnalysiss $BTC
BTC Elliott Wave Alert: Wave II Retracement Complete? Major Short Setup in the Golden Zone! 📉
Is Bitcoin’s recent relief bounce running out of steam? Looking closely at the Elliott Wave structure and order flow data, $BTC is flashing a textbook bearish continuation setup right inside a critical Fibonacci resistance cluster.
📊 Technical & Elliott Wave Breakdown
Completed Impulse (Wave I): Following the completion of a 5-wave bearish cycle ((1) through (5)), Bitcoin carved out a major local bottom at Wave I.
Corrective Bounce (Wave II): Price has since staged an (a)-(b)-(c) corrective rally, pushing directly into the Fibonacci Golden Zone (50.0% – 61.8% retracement) around $63,638 – $64,018.
Order Flow & DOM Context: Near DOM Power sits nearly balanced at 51% vs. 49% while Aggressive Power leans slightly bearish (50% sell pressure), indicating buyers are struggling to absorb overhead liquidity in this supply zone.
🎯 Trade Setup Parameters (Pending Confirmation)
As highlighted on the chart (EW III SHORT | PENDING CONFIRMATION), patience is key until lower-timeframe rejection confirms Wave II has topped:
Entry Zone: ~$63,576.85 (on confirmed rejection from the Golden Zone)
Stop Loss (SL): $64,218.02 (strict invalidation above the Wave (c) / Golden Zone high)
Take Profit (TP): $61,650.16 (targeting liquidity below the prior Wave I low as Wave III unfolds)
⚠️ Risk Management Note
Because Wave III moves tend to be sharp and impulsive, waiting for clear bearish candle confirmation before entering helps avoid gettingwicked out by a liquidity sweep above the 61.8% level. Always manage position sizing and stick to your invalidation level.
What’s your game plan here? Are you looking for a rejection short from the Golden Zone, or do you think bulls can reclaim $64,300 and invalidate the count? Drop your thoughts below! 👇
#BTC #ETH #TechnicalAnalysiss $BTC
📊 Technical & Elliott Wave Breakdown
Completed Impulse (Wave I): Following the completion of a 5-wave bearish cycle ((1) through (5)), Bitcoin carved out a major local bottom at Wave I.
Corrective Bounce (Wave II): Price has since staged an (a)-(b)-(c) corrective rally, pushing directly into the Fibonacci Golden Zone (50.0% – 61.8% retracement) around $63,638 – $64,018.
Order Flow & DOM Context: Near DOM Power sits nearly balanced at 51% vs. 49% while Aggressive Power leans slightly bearish (50% sell pressure), indicating buyers are struggling to absorb overhead liquidity in this supply zone.
🎯 Trade Setup Parameters (Pending Confirmation)
As highlighted on the chart (EW III SHORT | PENDING CONFIRMATION), patience is key until lower-timeframe rejection confirms Wave II has topped:
Entry Zone: ~$63,576.85 (on confirmed rejection from the Golden Zone)
Stop Loss (SL): $64,218.02 (strict invalidation above the Wave (c) / Golden Zone high)
Take Profit (TP): $61,650.16 (targeting liquidity below the prior Wave I low as Wave III unfolds)
⚠️ Risk Management Note
Because Wave III moves tend to be sharp and impulsive, waiting for clear bearish candle confirmation before entering helps avoid gettingwicked out by a liquidity sweep above the 61.8% level. Always manage position sizing and stick to your invalidation level.
What’s your game plan here? Are you looking for a rejection short from the Golden Zone, or do you think bulls can reclaim $64,300 and invalidate the count? Drop your thoughts below! 👇
#BTC #ETH #TechnicalAnalysiss $BTC
1
279

Partly True
Bearish pressure building: Is Gold heading from $3,714 down to $3,400?
🪙 Gold Market Outlook:
Looking at the current price action, Gold seems poised for a correction from $3,714 toward the $3,400 support level. 📉
Always use a proper stop-loss and manage your position size. What’s your take on Gold’s next move—bullish or bearish? Let me know below! 👇
#XAUUSD #TechnicalAnalysiss
Bearish pressure building: Is Gold heading from $3,714 down to $3,400?
🪙 Gold Market Outlook:
Looking at the current price action, Gold seems poised for a correction from $3,714 toward the $3,400 support level. 📉
Always use a proper stop-loss and manage your position size. What’s your take on Gold’s next move—bullish or bearish? Let me know below! 👇
#XAUUSD #TechnicalAnalysiss
🪙 Gold Market Outlook:
Looking at the current price action, Gold seems poised for a correction from $3,714 toward the $3,400 support level. 📉
Always use a proper stop-loss and manage your position size. What’s your take on Gold’s next move—bullish or bearish? Let me know below! 👇
#XAUUSD #TechnicalAnalysiss

1
480

·
--
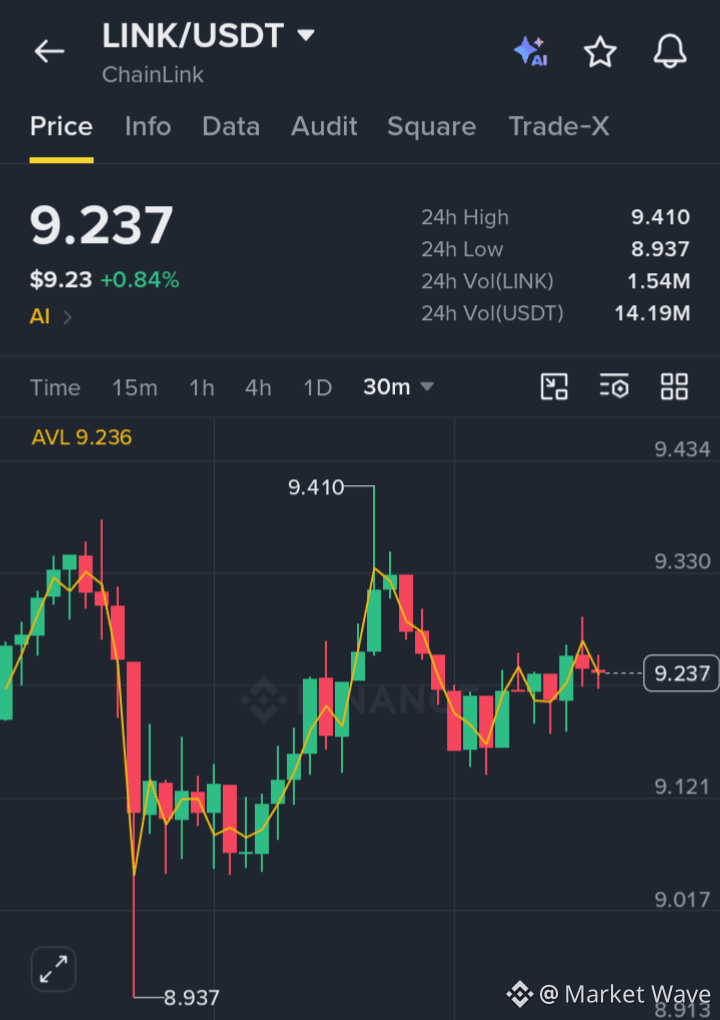
$LINK BREAKOUT CONFIRMATION AND BULLISH CONTINUATION SETUP $LINK
trade setup:
direction: long
entry zone: 9.200 - 9.250
tp1: 9.330
tp2: 9.410
tp3: 9.500
sl: 9.100
#CryptoTrends2024 #TradingCommunity #Chainlink's #TechnicalAnalysiss #bullish
$LINK BREAKOUT CONFIRMATION AND BULLISH CONTINUATION SETUP $LINK
trade setup:
direction: long
entry zone: 9.200 - 9.250
tp1: 9.330
tp2: 9.410
tp3: 9.500
sl: 9.100
#CryptoTrends2024 #TradingCommunity #Chainlink's #TechnicalAnalysiss #bullish
trade setup:
direction: long
entry zone: 9.200 - 9.250
tp1: 9.330
tp2: 9.410
tp3: 9.500
sl: 9.100
#CryptoTrends2024 #TradingCommunity #Chainlink's #TechnicalAnalysiss #bullish
43

·
--
Bullish
🛡️ ASYMMETRY IN THE STORM: Why the broad sell-off opens a tactical window in Zcash and Gold 📊⚡
When markets endure weeks of synchronized declines, panic often clouds the judgment of most people. However, for the methodical trader who filters out emotional noise, global liquidation phases purge excess leverage and create attractive discounts on assets with strong scarcity and store-of-value theses.
🔍 1. Technical analysis of accumulation zones:
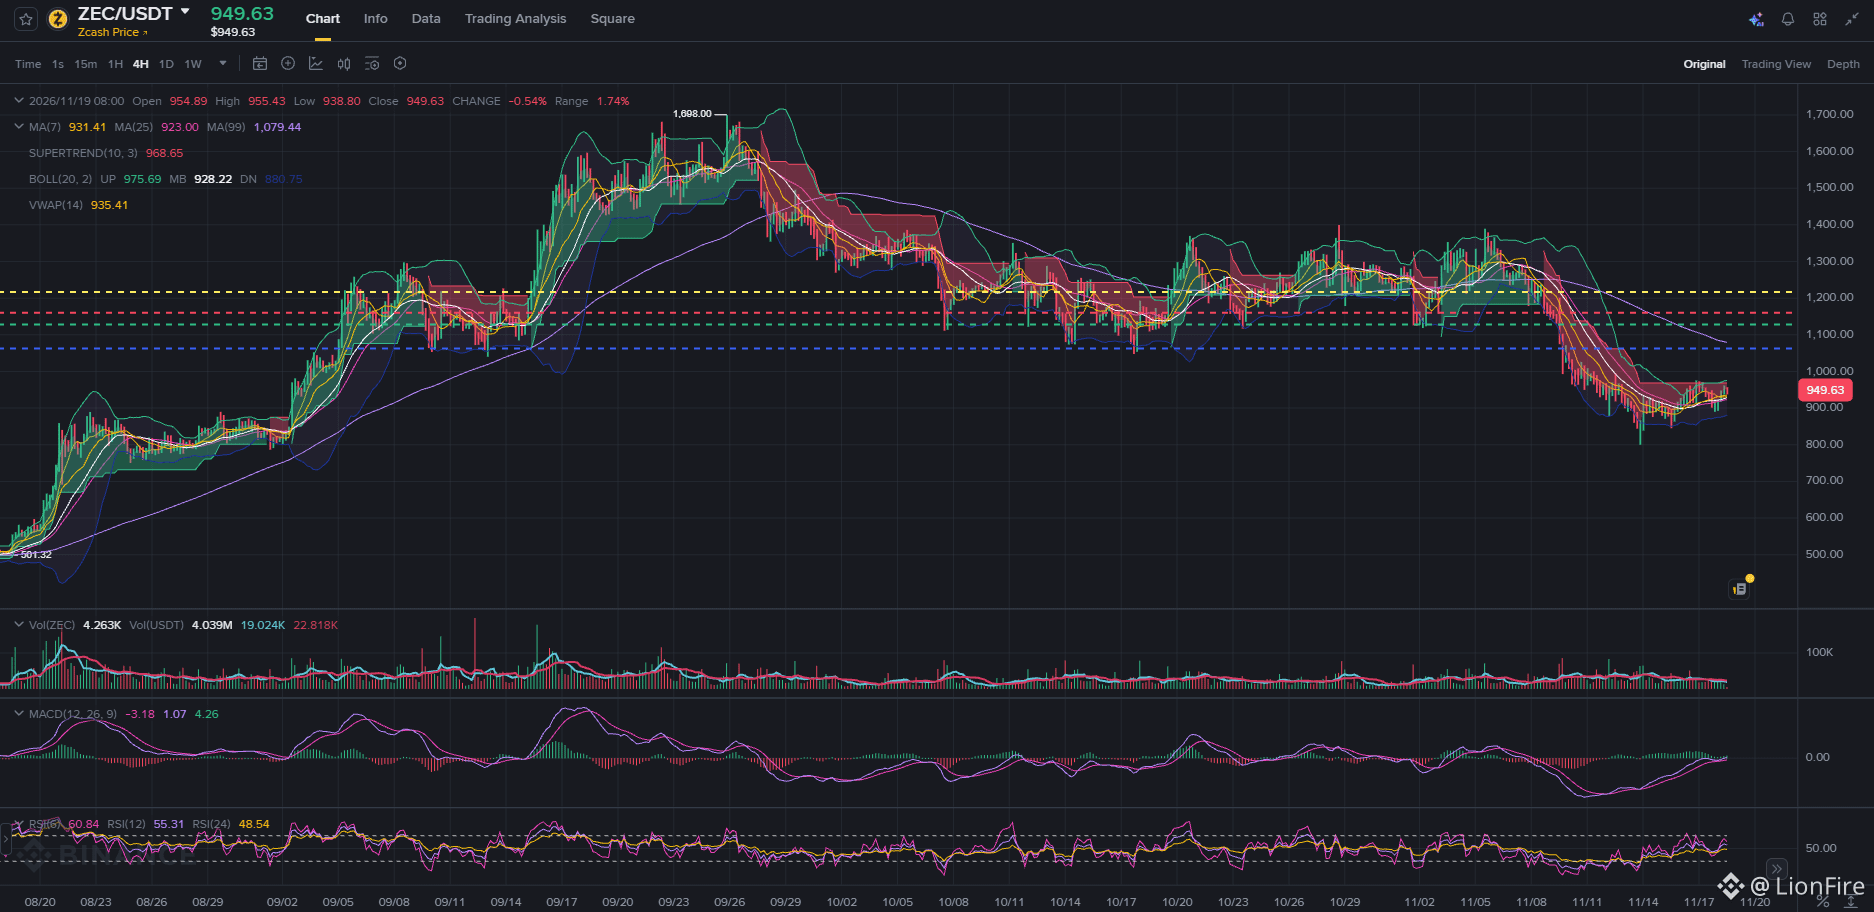
Zcash ($ZEC): After correcting from previous highs above $1,600, the price is currently trading around $949.63, showing signs of stabilization above its 25-period moving average ($923.00) and holding a neutral RSI near 55. This sideways consolidation after the liquidity sweep offers a very favorable risk-reward ratio for scaling into buys.
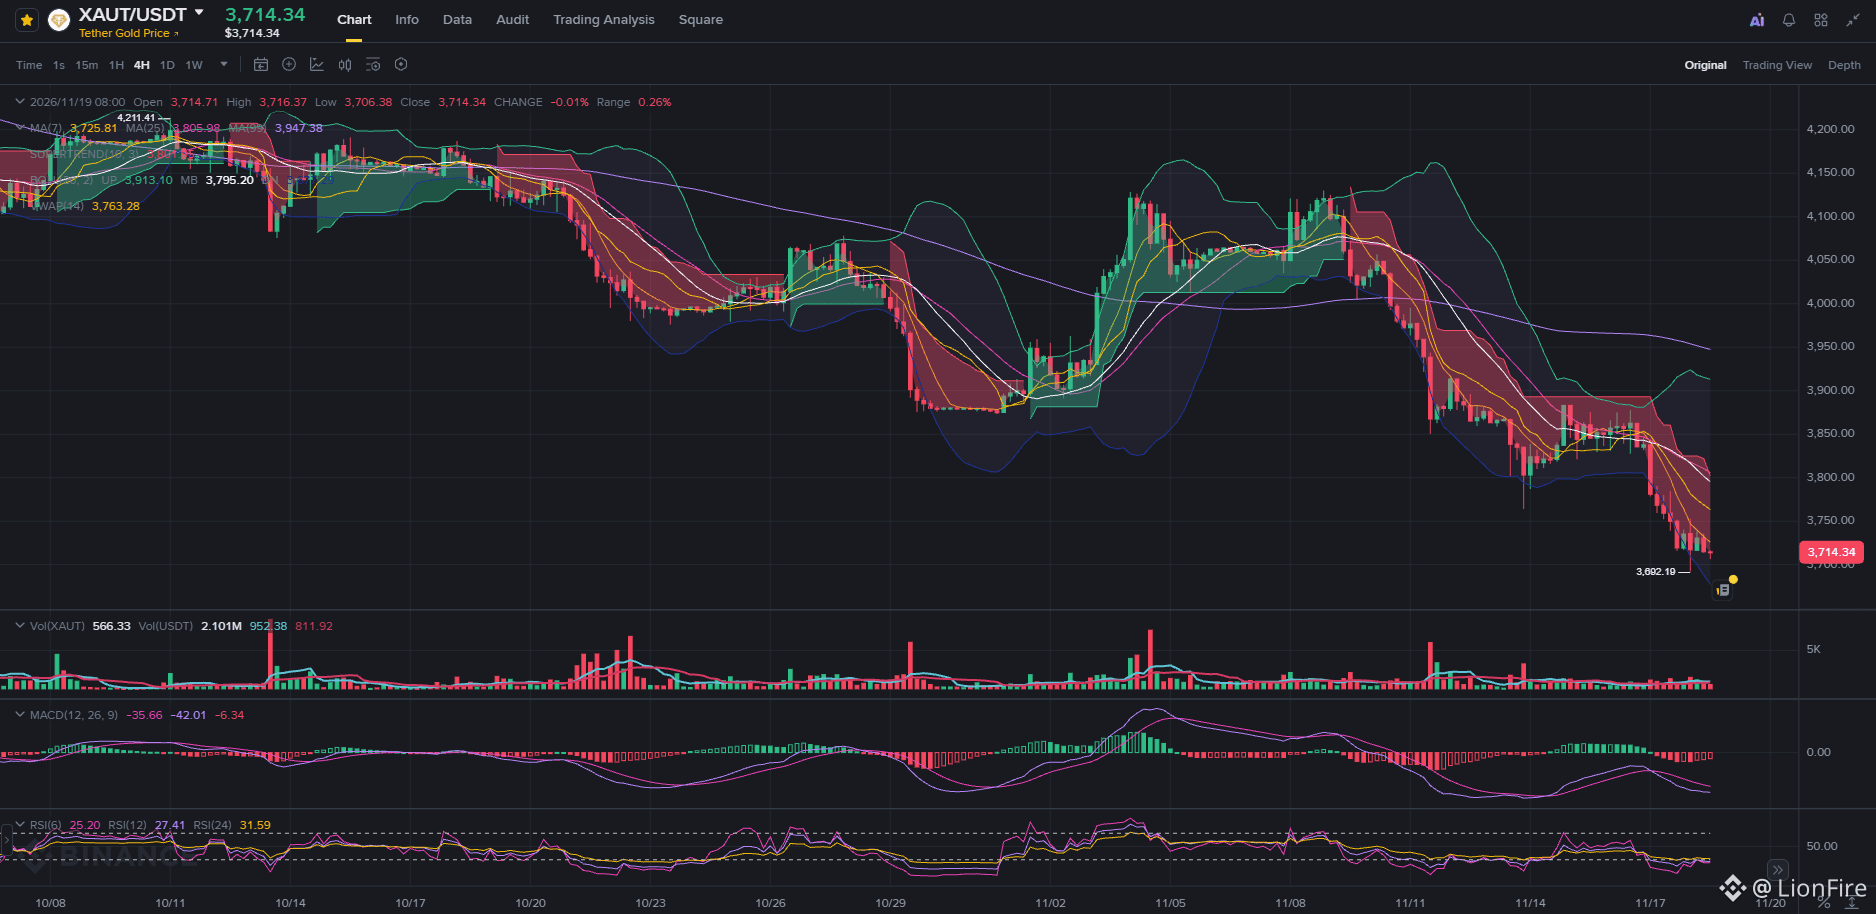
Tokenized Gold ($XAUT): The precious metal has extended its correction to $3,714.34, closely defending the recent low of $3,682.18. With the 6-period RSI entering oversold territory (25.20), selling pressure suggests we are looking at a highly significant technical floor for accumulating discounted, digitized physical safe-haven assets.
🧠 2. Tactical discipline in the face of buying opportunities during a downturn:
Identifying a good entry point does not mean investing all your capital at once or trading without a safety net. Professional accumulation requires staggered purchases, confirmation of support levels, and clear stop-losses below structural lows.
💡 The golden rule of trading remains unchanged: significant returns are built by accumulating with a cool head when the market offers discounts, always with meticulous risk management. 🧠⚡
#TechnicalAnalysiss #RiskManagement
🛡️ ASYMMETRY IN THE STORM: Why the broad sell-off opens a tactical window in Zcash and Gold 📊⚡
When markets endure weeks of synchronized declines, panic often clouds the judgment of most people. However, for the methodical trader who filters out emotional noise, global liquidation phases purge excess leverage and create attractive discounts on assets with strong scarcity and store-of-value theses.
🔍 1. Technical analysis of accumulation zones:
Zcash ($ZEC): After correcting from previous highs above $1,600, the price is currently trading around $949.63, showing signs of stabilization above its 25-period moving average ($923.00) and holding a neutral RSI near 55. This sideways consolidation after the liquidity sweep offers a very favorable risk-reward ratio for scaling into buys.
Tokenized Gold ($XAUT): The precious metal has extended its correction to $3,714.34, closely defending the recent low of $3,682.18. With the 6-period RSI entering oversold territory (25.20), selling pressure suggests we are looking at a highly significant technical floor for accumulating discounted, digitized physical safe-haven assets.
🧠 2. Tactical discipline in the face of buying opportunities during a downturn:
Identifying a good entry point does not mean investing all your capital at once or trading without a safety net. Professional accumulation requires staggered purchases, confirmation of support levels, and clear stop-losses below structural lows.
💡 The golden rule of trading remains unchanged: significant returns are built by accumulating with a cool head when the market offers discounts, always with meticulous risk management. 🧠⚡
#TechnicalAnalysiss #RiskManagement
When markets endure weeks of synchronized declines, panic often clouds the judgment of most people. However, for the methodical trader who filters out emotional noise, global liquidation phases purge excess leverage and create attractive discounts on assets with strong scarcity and store-of-value theses.
🔍 1. Technical analysis of accumulation zones:
Zcash ($ZEC): After correcting from previous highs above $1,600, the price is currently trading around $949.63, showing signs of stabilization above its 25-period moving average ($923.00) and holding a neutral RSI near 55. This sideways consolidation after the liquidity sweep offers a very favorable risk-reward ratio for scaling into buys.
Tokenized Gold ($XAUT): The precious metal has extended its correction to $3,714.34, closely defending the recent low of $3,682.18. With the 6-period RSI entering oversold territory (25.20), selling pressure suggests we are looking at a highly significant technical floor for accumulating discounted, digitized physical safe-haven assets.
🧠 2. Tactical discipline in the face of buying opportunities during a downturn:
Identifying a good entry point does not mean investing all your capital at once or trading without a safety net. Professional accumulation requires staggered purchases, confirmation of support levels, and clear stop-losses below structural lows.
💡 The golden rule of trading remains unchanged: significant returns are built by accumulating with a cool head when the market offers discounts, always with meticulous risk management. 🧠⚡
#TechnicalAnalysiss #RiskManagement
236

·
--

Article
John Murphy and the Birth of Technical Analysis: How Chart Geometry Conquered Wall StreetWhy Charts Remember Everything: How One Man Turned Price Chaos into an Exact Science
History
Until the 1970s, Wall Street considered stock buying a pure art, dependent on insider information, rumors, and newspaper macroeconomic reports. But John Murphy brought together the scattered knowledge of traders of the past into a single system—technical analysis—by writing the legendary book “Technical Analysis of the Futures Markets.”
John Murphy and the Birth of Technical Analysis: How Chart Geometry Conquered Wall Street
Why Charts Remember Everything: How One Man Turned Price Chaos into an Exact Science
History
Until the 1970s, Wall Street considered stock buying a pure art, dependent on insider information, rumors, and newspaper macroeconomic reports. But John Murphy brought together the scattered knowledge of traders of the past into a single system—technical analysis—by writing the legendary book “Technical Analysis of the Futures Markets.”
History
Until the 1970s, Wall Street considered stock buying a pure art, dependent on insider information, rumors, and newspaper macroeconomic reports. But John Murphy brought together the scattered knowledge of traders of the past into a single system—technical analysis—by writing the legendary book “Technical Analysis of the Futures Markets.”
2
115

·
--
$JCT
📊 JCTUSDT Market Update – 15 November 2026
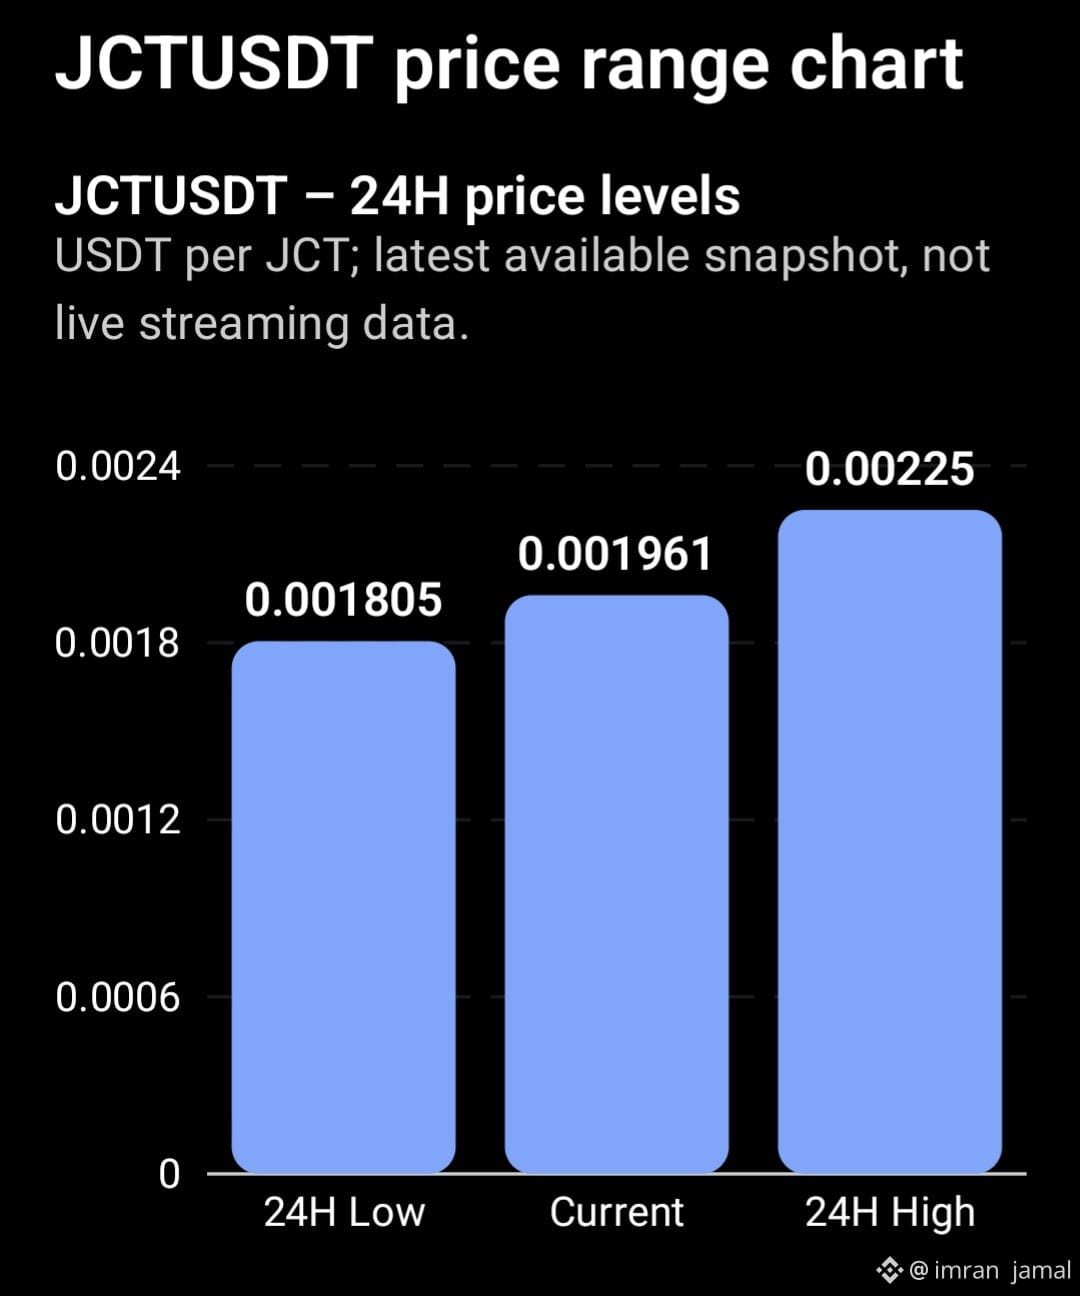
Janction (JCTUSDT) is showing strong selling pressure. The latest available Binance Futures snapshot shows JCT near 0.001961 USDT, down approximately 4.11% in 24 hours.
Key technical levels
Support: $0.00194 – $0.00188
Resistance: $0.00205 – $0.00222
Bullish confirmation: Break and hold above $0.00222.
Bearish signal: Breakdown below $0.00188.Market outlook: Sellers currently have the advantage. A recovery above $0.00222 could improve bullish momentum, while losing $0.00188 may invite further downside.
⚠️ Watch volume confirmation before entering a trade. This is a technical outlook, not a guaranteed signal.
Source: JCTUSDT market data · TradingView
#Market_Update #JCTUSDT #Benince #TechnicalAnalysiss
{future}(JCTUSDT)
$JCT
📊 JCTUSDT Market Update – 15 November 2026
Janction (JCTUSDT) is showing strong selling pressure. The latest available Binance Futures snapshot shows JCT near 0.001961 USDT, down approximately 4.11% in 24 hours.
Key technical levels
Support: $0.00194 – $0.00188
Resistance: $0.00205 – $0.00222
Bullish confirmation: Break and hold above $0.00222.
Bearish signal: Breakdown below $0.00188.Market outlook: Sellers currently have the advantage. A recovery above $0.00222 could improve bullish momentum, while losing $0.00188 may invite further downside.
⚠️ Watch volume confirmation before entering a trade. This is a technical outlook, not a guaranteed signal.
Source: JCTUSDT market data · TradingView
#Market_Update #JCTUSDT #Benince #TechnicalAnalysiss
📊 JCTUSDT Market Update – 15 November 2026
Janction (JCTUSDT) is showing strong selling pressure. The latest available Binance Futures snapshot shows JCT near 0.001961 USDT, down approximately 4.11% in 24 hours.
Key technical levels
Support: $0.00194 – $0.00188
Resistance: $0.00205 – $0.00222
Bullish confirmation: Break and hold above $0.00222.
Bearish signal: Breakdown below $0.00188.Market outlook: Sellers currently have the advantage. A recovery above $0.00222 could improve bullish momentum, while losing $0.00188 may invite further downside.
⚠️ Watch volume confirmation before entering a trade. This is a technical outlook, not a guaranteed signal.
Source: JCTUSDT market data · TradingView
#Market_Update #JCTUSDT #Benince #TechnicalAnalysiss
1
708

·
--
$BULLA is showing signs of a possible comeback! 👀
$BULLA
{future}(BULLAUSDT)
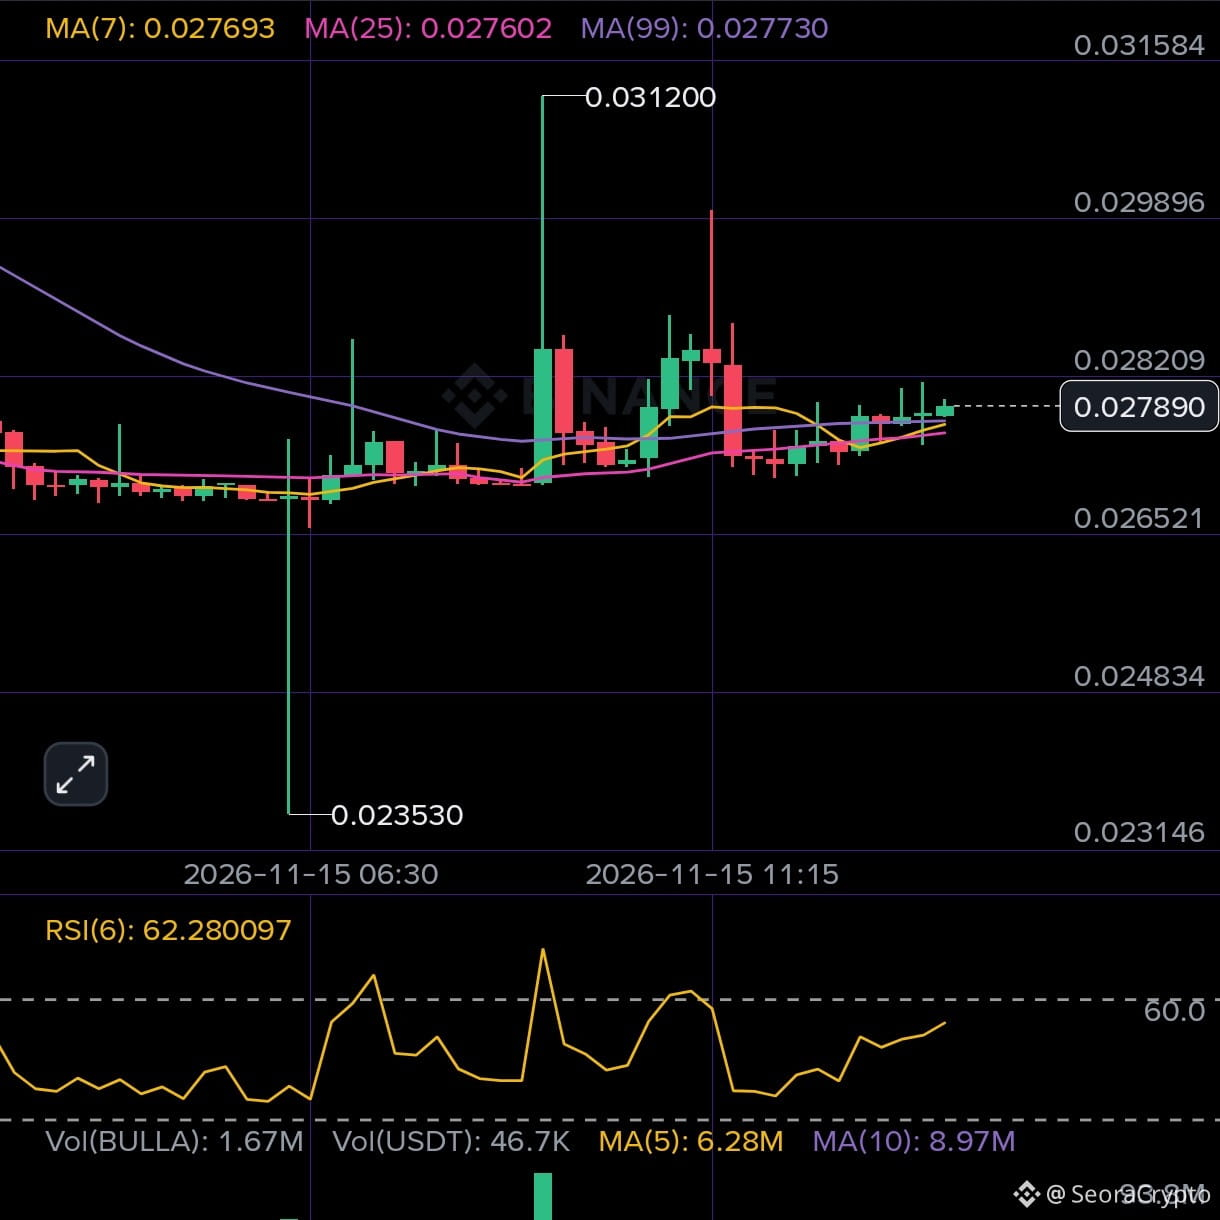
is currently trading around $0.02789, holding above its short-term moving averages on the 15-minute chart.
Here’s what caught my attention:
Technical Outlook:
- RSI is around 62, showing positive momentum.
- MA(7) and MA(25) are supporting the current price.
- Buyers are trying to build momentum near $0.0280.
- Volume has cooled down, so confirmation is still needed.
Key Levels to Watch:
- Resistance 1: $0.02820
- Resistance 2: $0.02990
- Major upside target: $0.03120
- Support: $0.02760
- Stronger support: $0.02650
My Trading Plan:
A clean 15m candle close above $0.02820 with strong volume could open the door toward $0.02990.
If price gets rejected, I'll watch $0.02760 and $0.02650 for support.
⚠️ No need to chase the pump. Let the market confirm the move first.
What do you think? Is BULLA preparing for another breakout, or will sellers take control? 👇
#bulla #TechnicalAnalysiss
$BULLA is showing signs of a possible comeback! 👀
$BULLA
is currently trading around $0.02789, holding above its short-term moving averages on the 15-minute chart.
Here’s what caught my attention:
Technical Outlook:
- RSI is around 62, showing positive momentum.
- MA(7) and MA(25) are supporting the current price.
- Buyers are trying to build momentum near $0.0280.
- Volume has cooled down, so confirmation is still needed.
Key Levels to Watch:
- Resistance 1: $0.02820
- Resistance 2: $0.02990
- Major upside target: $0.03120
- Support: $0.02760
- Stronger support: $0.02650
My Trading Plan:
A clean 15m candle close above $0.02820 with strong volume could open the door toward $0.02990.
If price gets rejected, I'll watch $0.02760 and $0.02650 for support.
⚠️ No need to chase the pump. Let the market confirm the move first.
What do you think? Is BULLA preparing for another breakout, or will sellers take control? 👇
#bulla #TechnicalAnalysiss
$BULLA
is currently trading around $0.02789, holding above its short-term moving averages on the 15-minute chart.
Here’s what caught my attention:
Technical Outlook:
- RSI is around 62, showing positive momentum.
- MA(7) and MA(25) are supporting the current price.
- Buyers are trying to build momentum near $0.0280.
- Volume has cooled down, so confirmation is still needed.
Key Levels to Watch:
- Resistance 1: $0.02820
- Resistance 2: $0.02990
- Major upside target: $0.03120
- Support: $0.02760
- Stronger support: $0.02650
My Trading Plan:
A clean 15m candle close above $0.02820 with strong volume could open the door toward $0.02990.
If price gets rejected, I'll watch $0.02760 and $0.02650 for support.
⚠️ No need to chase the pump. Let the market confirm the move first.
What do you think? Is BULLA preparing for another breakout, or will sellers take control? 👇
#bulla #TechnicalAnalysiss
人生目标一个亿:
只要不破位,绝世上涨行情即将来临
2
2
641

Verified

Article
🚀 Riding the Semiconductor Rollercoaster: Comprehensive SOXL Analysis & OutlookWhile you mentioned "SOXL coin", it is important to clarify first that $SOXL is actually a popular stock market asset rather than a cryptocurrency—specifically, the Direxion Daily Semiconductor Bull 3X Shares (NYSEARCA: SOXL), a leveraged Exchange-Traded Fund (ETF). However, it is traded heavily by retail investors and crypto enthusiasts alike due to its extreme volatility, high beta, and massive profit potential.
Below is a detailed breakdown of SOXL’s current market standing, technical positioning, and what traders need to watch out for.
📊 Current Market Snapshot
Current Price: ~$58.32 USD
Asset Class: 3x Leveraged Semiconductor ETF (tracks the NYSE Semiconductor Index)
52-Week Range: $28.12 – $302.00
Market Sentiment: High retail accumulation during pullbacks, balanced against macro semiconductor sector shifts.
🔍 Key Technical & Fundamental Analysis
1. The 3x Leverage Factor & Volatility Decay
SOXL aims to deliver 3 times (3x) the daily performance of major semiconductor giants like NVIDIA, Broadcom, AMD, and Qualcomm.
The Catch: Because of daily rebalancing, SOXL suffers from volatility decay (beta slippage) over long periods. This means if the underlying chip index chops back and forth sideways, SOXL will lose value even if the index finishes flat. It is designed primarily for swing trading and day trading, not long-term "buy-and-hold" investing.
2. Technical Indicators & Price Action
Support & Resistance: $SOXL recently tested lower boundaries around the $52 – $54 support zone, where aggressive dip-buying entered the market. On the upside, immediate resistance sits around the $65 – $70 range. A decisive break above this zone could trigger a swift recovery rally toward the mid-$80s.
Moving Averages & Oscillators: Short-term moving averages (like the 5-day and 50-day) show localized bullish bounce signals, while broader indicators signal caution due to macro sector corrections. The 14-day RSI hovers near a neutral ~45.8 level, indicating room for movement in either direction.
3. The AI Supercycle Catalyst vs. Macro Risks
The Bull Case: The ongoing global demand for AI infrastructure, next-gen data centers, and advanced processors provides a massive underlying tailwind. When major chipmakers surge, SOXL multiplies those gains exponentially.
The Bear Case: Rising interest rates, supply chain jitters, or temporary pullbacks in tech stock valuations can trigger brutal 30% to 50% drawdowns in a matter of weeks.
💡 Trading Strategy & Recommendations
For Swing Traders: Look for entries near strong structural support levels ($50–$55) with strict stop-losses. Do not hold leveraged ETFs blindly through major macroeconomic news events.
Risk Management: Because of the 3x leverage, never risk capital you cannot afford to lose, and treat position sizing with extreme discipline.
#soxl #MarketSentimentToday #TechnicalAnalysiss #btc
{future}(SOXLUSDT)
🚀 Riding the Semiconductor Rollercoaster: Comprehensive SOXL Analysis & Outlook
While you mentioned "SOXL coin", it is important to clarify first that $SOXL is actually a popular stock market asset rather than a cryptocurrency—specifically, the Direxion Daily Semiconductor Bull 3X Shares (NYSEARCA: SOXL), a leveraged Exchange-Traded Fund (ETF). However, it is traded heavily by retail investors and crypto enthusiasts alike due to its extreme volatility, high beta, and massive profit potential.
Below is a detailed breakdown of SOXL’s current market standing, technical positioning, and what traders need to watch out for.
📊 Current Market Snapshot
Current Price: ~$58.32 USD
Asset Class: 3x Leveraged Semiconductor ETF (tracks the NYSE Semiconductor Index)
52-Week Range: $28.12 – $302.00
Market Sentiment: High retail accumulation during pullbacks, balanced against macro semiconductor sector shifts.
🔍 Key Technical & Fundamental Analysis
1. The 3x Leverage Factor & Volatility Decay
SOXL aims to deliver 3 times (3x) the daily performance of major semiconductor giants like NVIDIA, Broadcom, AMD, and Qualcomm.
The Catch: Because of daily rebalancing, SOXL suffers from volatility decay (beta slippage) over long periods. This means if the underlying chip index chops back and forth sideways, SOXL will lose value even if the index finishes flat. It is designed primarily for swing trading and day trading, not long-term "buy-and-hold" investing.
2. Technical Indicators & Price Action
Support & Resistance: $SOXL recently tested lower boundaries around the $52 – $54 support zone, where aggressive dip-buying entered the market. On the upside, immediate resistance sits around the $65 – $70 range. A decisive break above this zone could trigger a swift recovery rally toward the mid-$80s.
Moving Averages & Oscillators: Short-term moving averages (like the 5-day and 50-day) show localized bullish bounce signals, while broader indicators signal caution due to macro sector corrections. The 14-day RSI hovers near a neutral ~45.8 level, indicating room for movement in either direction.
3. The AI Supercycle Catalyst vs. Macro Risks
The Bull Case: The ongoing global demand for AI infrastructure, next-gen data centers, and advanced processors provides a massive underlying tailwind. When major chipmakers surge, SOXL multiplies those gains exponentially.
The Bear Case: Rising interest rates, supply chain jitters, or temporary pullbacks in tech stock valuations can trigger brutal 30% to 50% drawdowns in a matter of weeks.
💡 Trading Strategy & Recommendations
For Swing Traders: Look for entries near strong structural support levels ($50–$55) with strict stop-losses. Do not hold leveraged ETFs blindly through major macroeconomic news events.
Risk Management: Because of the 3x leverage, never risk capital you cannot afford to lose, and treat position sizing with extreme discipline.
#soxl #MarketSentimentToday #TechnicalAnalysiss #btc
Below is a detailed breakdown of SOXL’s current market standing, technical positioning, and what traders need to watch out for.
📊 Current Market Snapshot
Current Price: ~$58.32 USD
Asset Class: 3x Leveraged Semiconductor ETF (tracks the NYSE Semiconductor Index)
52-Week Range: $28.12 – $302.00
Market Sentiment: High retail accumulation during pullbacks, balanced against macro semiconductor sector shifts.
🔍 Key Technical & Fundamental Analysis
1. The 3x Leverage Factor & Volatility Decay
SOXL aims to deliver 3 times (3x) the daily performance of major semiconductor giants like NVIDIA, Broadcom, AMD, and Qualcomm.
The Catch: Because of daily rebalancing, SOXL suffers from volatility decay (beta slippage) over long periods. This means if the underlying chip index chops back and forth sideways, SOXL will lose value even if the index finishes flat. It is designed primarily for swing trading and day trading, not long-term "buy-and-hold" investing.
2. Technical Indicators & Price Action
Support & Resistance: $SOXL recently tested lower boundaries around the $52 – $54 support zone, where aggressive dip-buying entered the market. On the upside, immediate resistance sits around the $65 – $70 range. A decisive break above this zone could trigger a swift recovery rally toward the mid-$80s.
Moving Averages & Oscillators: Short-term moving averages (like the 5-day and 50-day) show localized bullish bounce signals, while broader indicators signal caution due to macro sector corrections. The 14-day RSI hovers near a neutral ~45.8 level, indicating room for movement in either direction.
3. The AI Supercycle Catalyst vs. Macro Risks
The Bull Case: The ongoing global demand for AI infrastructure, next-gen data centers, and advanced processors provides a massive underlying tailwind. When major chipmakers surge, SOXL multiplies those gains exponentially.
The Bear Case: Rising interest rates, supply chain jitters, or temporary pullbacks in tech stock valuations can trigger brutal 30% to 50% drawdowns in a matter of weeks.
💡 Trading Strategy & Recommendations
For Swing Traders: Look for entries near strong structural support levels ($50–$55) with strict stop-losses. Do not hold leveraged ETFs blindly through major macroeconomic news events.
Risk Management: Because of the 3x leverage, never risk capital you cannot afford to lose, and treat position sizing with extreme discipline.
#soxl #MarketSentimentToday #TechnicalAnalysiss #btc
1
443

·
--
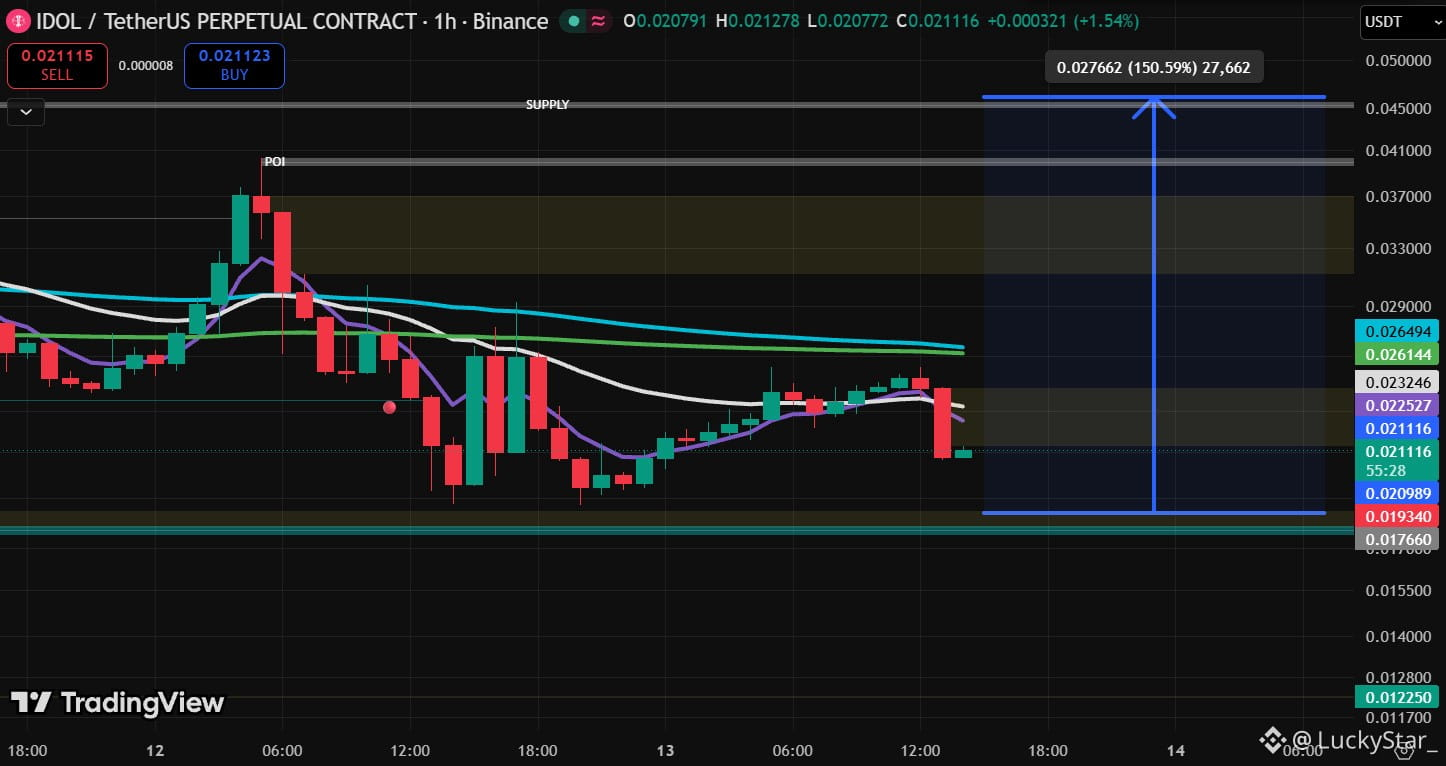
$IDOL
{future}(IDOLUSDT)
📈 IS A NEW LONG SETUP ALREADY FORMING?
The price is returning to a key support zone.
🔍 THIS IS WHERE BUYERS' INTEREST MAY APPEAR.
🕯️ A bullish candle or Engulfing can give an additional signal.
📊 VOLUME CONFIRMATION WILL MAKE THE SCENARIO EVEN STRONGER.
#IDOL #crypto #TechnicalAnalysiss
$IDOL
📈 IS A NEW LONG SETUP ALREADY FORMING?
The price is returning to a key support zone.
🔍 THIS IS WHERE BUYERS' INTEREST MAY APPEAR.
🕯️ A bullish candle or Engulfing can give an additional signal.
📊 VOLUME CONFIRMATION WILL MAKE THE SCENARIO EVEN STRONGER.
#IDOL #crypto #TechnicalAnalysiss
📈 IS A NEW LONG SETUP ALREADY FORMING?
The price is returning to a key support zone.
🔍 THIS IS WHERE BUYERS' INTEREST MAY APPEAR.
🕯️ A bullish candle or Engulfing can give an additional signal.
📊 VOLUME CONFIRMATION WILL MAKE THE SCENARIO EVEN STRONGER.
#IDOL #crypto #TechnicalAnalysiss
22

·
--
📊 AGTUSDT – Bullish, But Don't FOMO!
AGT has surged nearly 194% in 24 hours.
Technically, the 1-hour trend is still bullish. However, the 15-minute timeframe is starting to show weakening momentum, and trading volume is declining.
🎯 Areas worth watching:
🟢 LONG pullback: 0.068–0.071
🚀 Breakout: above 0.080 with strong volume
🔴 If it breaks below 0.069, watch for a correction toward 0.067–0.065.
Don't chase a price that's already taken off. Patient traders who wait for confirmation usually get into better-measured positions.
This is not a recommendation to buy or sell. Always use a stop loss!
#AGT #Crypto #BinanceSquareTalks #TechnicalAnalysiss
$AGT
{future}(AGTUSDT)
📊 AGTUSDT – Bullish, But Don't FOMO!
AGT has surged nearly 194% in 24 hours.
Technically, the 1-hour trend is still bullish. However, the 15-minute timeframe is starting to show weakening momentum, and trading volume is declining.
🎯 Areas worth watching:
🟢 LONG pullback: 0.068–0.071
🚀 Breakout: above 0.080 with strong volume
🔴 If it breaks below 0.069, watch for a correction toward 0.067–0.065.
Don't chase a price that's already taken off. Patient traders who wait for confirmation usually get into better-measured positions.
This is not a recommendation to buy or sell. Always use a stop loss!
#AGT #Crypto #BinanceSquareTalks #TechnicalAnalysiss
$AGT
AGT has surged nearly 194% in 24 hours.
Technically, the 1-hour trend is still bullish. However, the 15-minute timeframe is starting to show weakening momentum, and trading volume is declining.
🎯 Areas worth watching:
🟢 LONG pullback: 0.068–0.071
🚀 Breakout: above 0.080 with strong volume
🔴 If it breaks below 0.069, watch for a correction toward 0.067–0.065.
Don't chase a price that's already taken off. Patient traders who wait for confirmation usually get into better-measured positions.
This is not a recommendation to buy or sell. Always use a stop loss!
#AGT #Crypto #BinanceSquareTalks #TechnicalAnalysiss
$AGT
326

·
--
Key $BTC levels today: support $73.5–74K, resistance $75.8–76K. Hold support and a relief bounce gets likelier. Lose it and $72K comes into view. Plan your levels, not your feelings. #BTC
{spot}(BTCUSDT)
#TechnicalAnalysiss
Key $BTC levels today: support $73.5–74K, resistance $75.8–76K. Hold support and a relief bounce gets likelier. Lose it and $72K comes into view. Plan your levels, not your feelings. #BTC
#TechnicalAnalysiss
#TechnicalAnalysiss

100
·
--
⚠️ STOP FALLING FOR FAKE BREAKDOWNS!
A 5-minute candle closing below support doesn't guarantee a crash!
For $BTC, $ETH and $SOL, watch for:
✅ Support breakdown
✅ Failed retest
✅ Strong selling volume
🚨 If price reclaims support, the short setup may be invalid.
💬 Ever been trapped by a fake breakout? Comment below and follow for more trading tips!
#cryptotrading #TechnicalAnalysiss #BinanceSquare
⚠️ STOP FALLING FOR FAKE BREAKDOWNS!
A 5-minute candle closing below support doesn't guarantee a crash!
For $BTC, $ETH and $SOL, watch for:
✅ Support breakdown
✅ Failed retest
✅ Strong selling volume
🚨 If price reclaims support, the short setup may be invalid.
💬 Ever been trapped by a fake breakout? Comment below and follow for more trading tips!
#cryptotrading #TechnicalAnalysiss #BinanceSquare
A 5-minute candle closing below support doesn't guarantee a crash!
For $BTC, $ETH and $SOL, watch for:
✅ Support breakdown
✅ Failed retest
✅ Strong selling volume
🚨 If price reclaims support, the short setup may be invalid.
💬 Ever been trapped by a fake breakout? Comment below and follow for more trading tips!
#cryptotrading #TechnicalAnalysiss #BinanceSquare
66
Log in to explore more content
Join global crypto users on Binance Square
⚡️ Get latest and useful information about crypto.
💬 Trusted by the world’s largest crypto exchange.
👍 Discover real insights from verified creators.
Email / Phone number
Trending Topics
1
#BTCReboundsAbove$60KAmidWhaleDipBuying
59,234 views
296 Discussing
2
#SolanaSets2027RoadmapToDoubleComputeCapacity
43,825 views
850 Discussing
3
#CaliforniaNvidiaProbeExaminesPotentialCriminalViolations
11,583 views
106 Discussing
4
#BlackRockLaunchesHKDollarDigitalLiquidityFund
36,443 views
655 Discussing
5
#NvidiaLoses$2.7TrillionInMonthAndAHalf
72,325 views
292 Discussing
6
#GlobalStocksFaceLongestLosingStreakSince2023
542,341 views
3,383 Discussing
7
#BlackRockIBITPostsRecord$541MSingleDayOutflow
88,978 views
177 Discussing
8
#AnthropicPlungesTowardIPOPriceonDay2
298,370 views
2,271 Discussing
9
#TwentyOneCapitalAdds172.25BTC
155,658 views
1,592 Discussing
10
#HKBillWouldExcludeTokenizedDepositsFromVirtualAssets
17,491 views
102 Discussing