
#toploser
toploser
13,066 views
135 Discussing
Hot
Latest

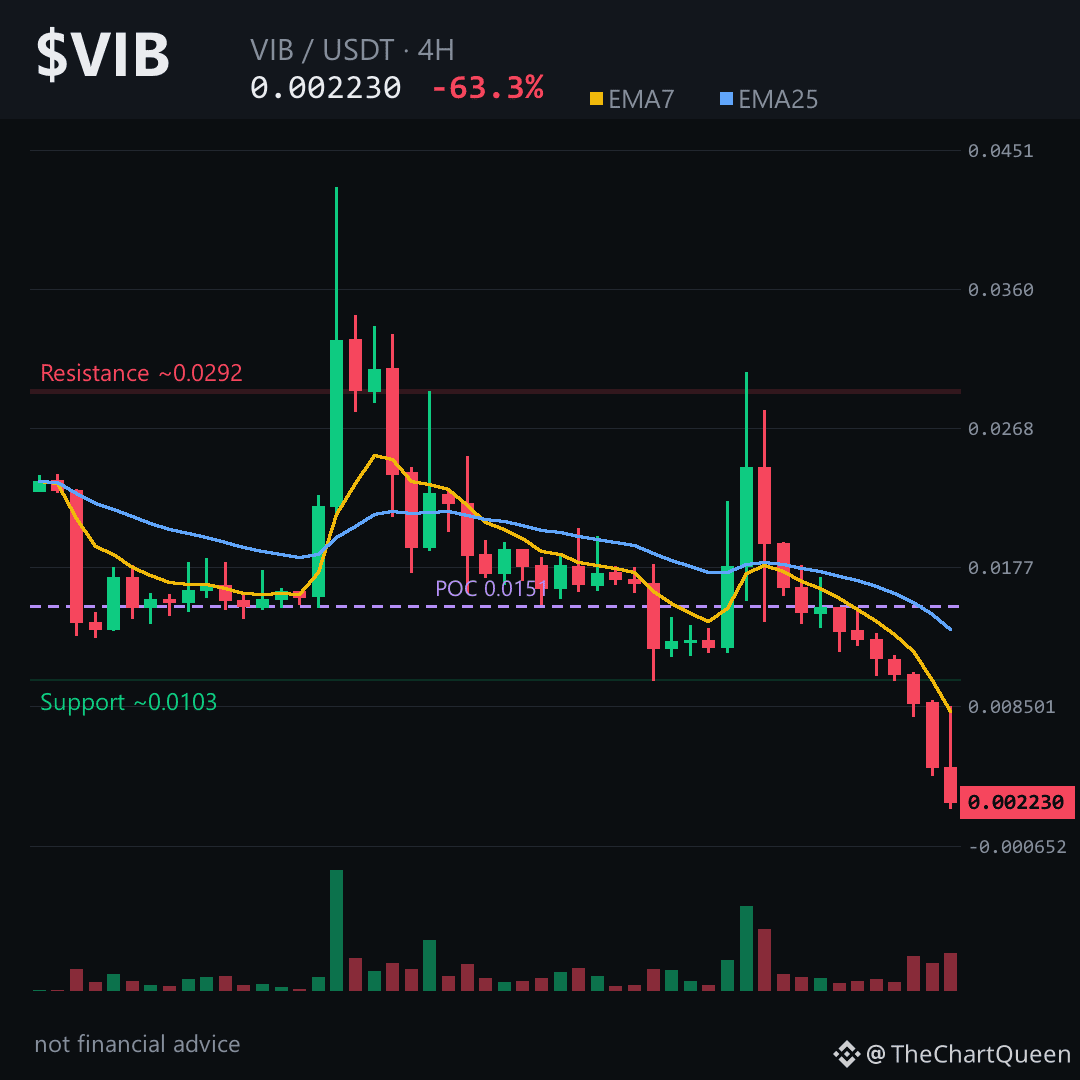
A 63% wipe in 24 hours isn’t a dip. It’s a liquidation event wearing a ticker.
That vertical candle looks like a full-blown rug — but the structure is telling a different story.
The 4H shows a brutal cascade: 0.024 to 0.0044, then one final flush to 0.0018 before a weak bounce. Eleven of twelve candles red. That’s not selling pressure — that’s forced exits and panic. But here’s the trap: after a -63% day, everyone expects a bounce. The chart says not yet.
RSI on 4H and daily is pinned in the low 20s–30s — deeply oversold, but oversold doesn’t mean over. EMAs are stacked bearish across every timeframe. The 4H EMA7 sits near 0.0082, miles above price. That’s not a gap — it’s a canyon.
Key zone: the unfilled bearish FVG between roughly 0.0089 and 0.0102. Price fell through it like nothing, and now it acts as a magnet. But before any retest, $VIB needs to reclaim 0.00235 on a 4H close. Lose that and the objective drops toward 0.0020 — already tested once at the lows.
My read: a falling knife with no confirmed floor. Any bounce toward 0.0023–0.0024 is likely to be sold until longer-term EMAs catch down. The real risk isn’t missing the bottom — it’s catching a bear flag that never flags.
Tap $VIB to pull up the chart and check these zones yourself before you make any move.
What level are you watching first — the 0.0020 retest or a reclaim of 0.00235? Drop it below 👇
Follow for the next read on this chart.
⚠️ Not financial advice. DYOR.
#VIB #Crypto #TopLoser #BinanceSquare
A 63% wipe in 24 hours isn’t a dip. It’s a liquidation event wearing a ticker.
That vertical candle looks like a full-blown rug — but the structure is telling a different story.
The 4H shows a brutal cascade: 0.024 to 0.0044, then one final flush to 0.0018 before a weak bounce. Eleven of twelve candles red. That’s not selling pressure — that’s forced exits and panic. But here’s the trap: after a -63% day, everyone expects a bounce. The chart says not yet.
RSI on 4H and daily is pinned in the low 20s–30s — deeply oversold, but oversold doesn’t mean over. EMAs are stacked bearish across every timeframe. The 4H EMA7 sits near 0.0082, miles above price. That’s not a gap — it’s a canyon.
Key zone: the unfilled bearish FVG between roughly 0.0089 and 0.0102. Price fell through it like nothing, and now it acts as a magnet. But before any retest, $VIB needs to reclaim 0.00235 on a 4H close. Lose that and the objective drops toward 0.0020 — already tested once at the lows.
My read: a falling knife with no confirmed floor. Any bounce toward 0.0023–0.0024 is likely to be sold until longer-term EMAs catch down. The real risk isn’t missing the bottom — it’s catching a bear flag that never flags.
Tap $VIB to pull up the chart and check these zones yourself before you make any move.
What level are you watching first — the 0.0020 retest or a reclaim of 0.00235? Drop it below 👇
Follow for the next read on this chart.
⚠️ Not financial advice. DYOR.
#VIB #Crypto #TopLoser #BinanceSquare
That vertical candle looks like a full-blown rug — but the structure is telling a different story.
The 4H shows a brutal cascade: 0.024 to 0.0044, then one final flush to 0.0018 before a weak bounce. Eleven of twelve candles red. That’s not selling pressure — that’s forced exits and panic. But here’s the trap: after a -63% day, everyone expects a bounce. The chart says not yet.
RSI on 4H and daily is pinned in the low 20s–30s — deeply oversold, but oversold doesn’t mean over. EMAs are stacked bearish across every timeframe. The 4H EMA7 sits near 0.0082, miles above price. That’s not a gap — it’s a canyon.
Key zone: the unfilled bearish FVG between roughly 0.0089 and 0.0102. Price fell through it like nothing, and now it acts as a magnet. But before any retest, $VIB needs to reclaim 0.00235 on a 4H close. Lose that and the objective drops toward 0.0020 — already tested once at the lows.
My read: a falling knife with no confirmed floor. Any bounce toward 0.0023–0.0024 is likely to be sold until longer-term EMAs catch down. The real risk isn’t missing the bottom — it’s catching a bear flag that never flags.
Tap $VIB to pull up the chart and check these zones yourself before you make any move.
What level are you watching first — the 0.0020 retest or a reclaim of 0.00235? Drop it below 👇
Follow for the next read on this chart.
⚠️ Not financial advice. DYOR.
#VIB #Crypto #TopLoser #BinanceSquare
4
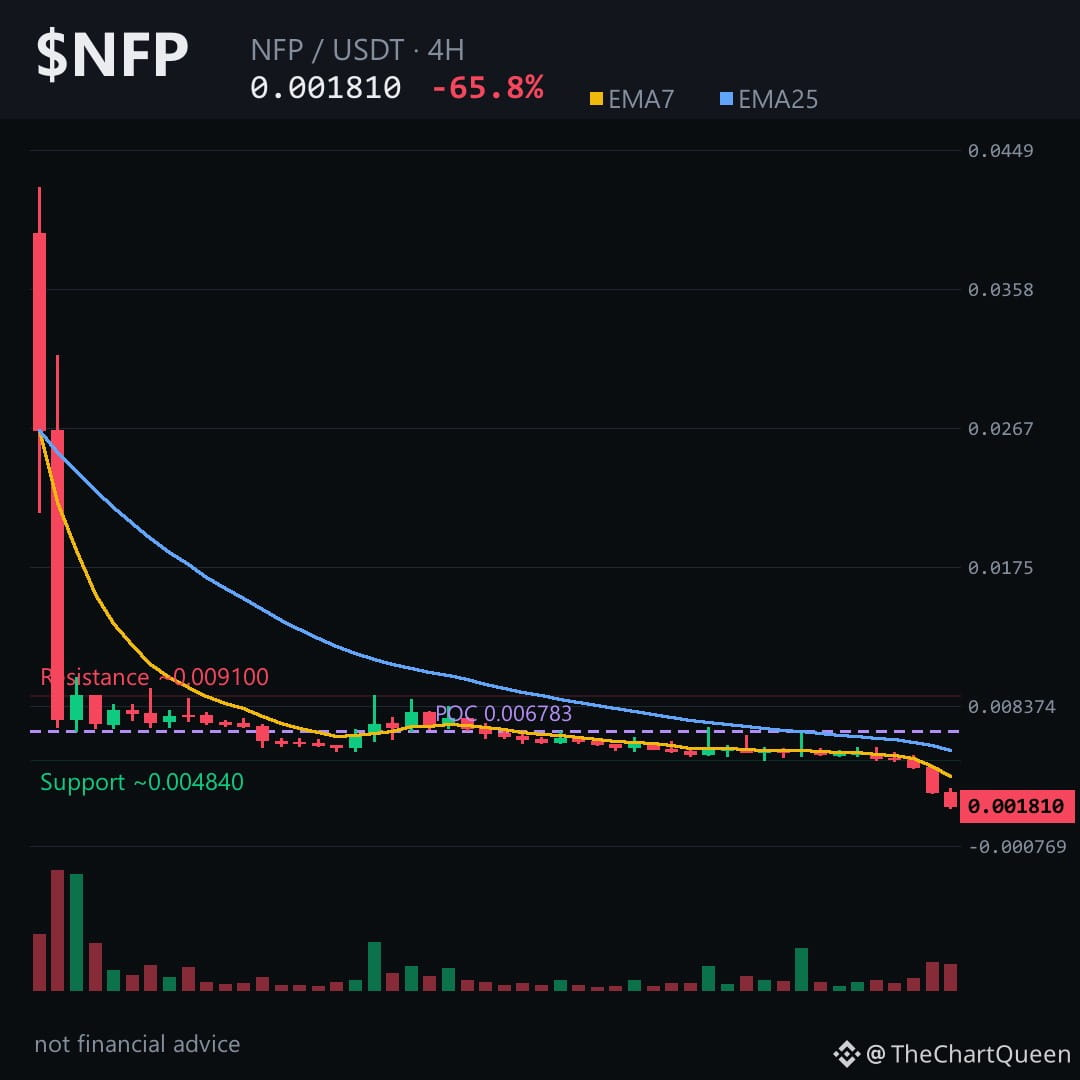
65.85% 24h plunge left $NFP barely above its 4‑hour pivot – a fragile spot you can’t ignore. 👀
Price is entrenched in bearish territory: EMA7 sits under EMA25, RSI is at a deep 12.9, and a clear bearish FVG sits between 0.00479 and 0.00445. The volume‑profile POC sits higher than the market, hinting that buying pressure has already been exhausted.
On the 4‑hour chart the key zones line up: the current pivot hovers around 0.00182; a break above ~0.00191 would nullify the bearish case, while a slide toward the ~0.00166 area could become the next demand pocket. If $NFP slips below the ~0.00166 zone, the downtrend gains a stronger foothold. Tap $NFP to pull up the chart and see these levels yourself.
My read: the market is testing the ~0.00166 demand zone; a decisive close below it would reinforce the bearish outlook, whereas a clean close above ~0.00191 would force a reassessment.
Follow me for the next update when NFP finally confirms which side of the zone it respects. Which level are you watching for NFP? 👇
⚠️ Not financial advice. DYOR.
#NFP #Crypto #BinanceSquare #TopLoser
65.85% 24h plunge left $NFP barely above its 4‑hour pivot – a fragile spot you can’t ignore. 👀
Price is entrenched in bearish territory: EMA7 sits under EMA25, RSI is at a deep 12.9, and a clear bearish FVG sits between 0.00479 and 0.00445. The volume‑profile POC sits higher than the market, hinting that buying pressure has already been exhausted.
On the 4‑hour chart the key zones line up: the current pivot hovers around 0.00182; a break above ~0.00191 would nullify the bearish case, while a slide toward the ~0.00166 area could become the next demand pocket. If $NFP slips below the ~0.00166 zone, the downtrend gains a stronger foothold. Tap $NFP to pull up the chart and see these levels yourself.
My read: the market is testing the ~0.00166 demand zone; a decisive close below it would reinforce the bearish outlook, whereas a clean close above ~0.00191 would force a reassessment.
Follow me for the next update when NFP finally confirms which side of the zone it respects. Which level are you watching for NFP? 👇
⚠️ Not financial advice. DYOR.
#NFP #Crypto #BinanceSquare #TopLoser
Price is entrenched in bearish territory: EMA7 sits under EMA25, RSI is at a deep 12.9, and a clear bearish FVG sits between 0.00479 and 0.00445. The volume‑profile POC sits higher than the market, hinting that buying pressure has already been exhausted.
On the 4‑hour chart the key zones line up: the current pivot hovers around 0.00182; a break above ~0.00191 would nullify the bearish case, while a slide toward the ~0.00166 area could become the next demand pocket. If $NFP slips below the ~0.00166 zone, the downtrend gains a stronger foothold. Tap $NFP to pull up the chart and see these levels yourself.
My read: the market is testing the ~0.00166 demand zone; a decisive close below it would reinforce the bearish outlook, whereas a clean close above ~0.00191 would force a reassessment.
Follow me for the next update when NFP finally confirms which side of the zone it respects. Which level are you watching for NFP? 👇
⚠️ Not financial advice. DYOR.
#NFP #Crypto #BinanceSquare #TopLoser
7
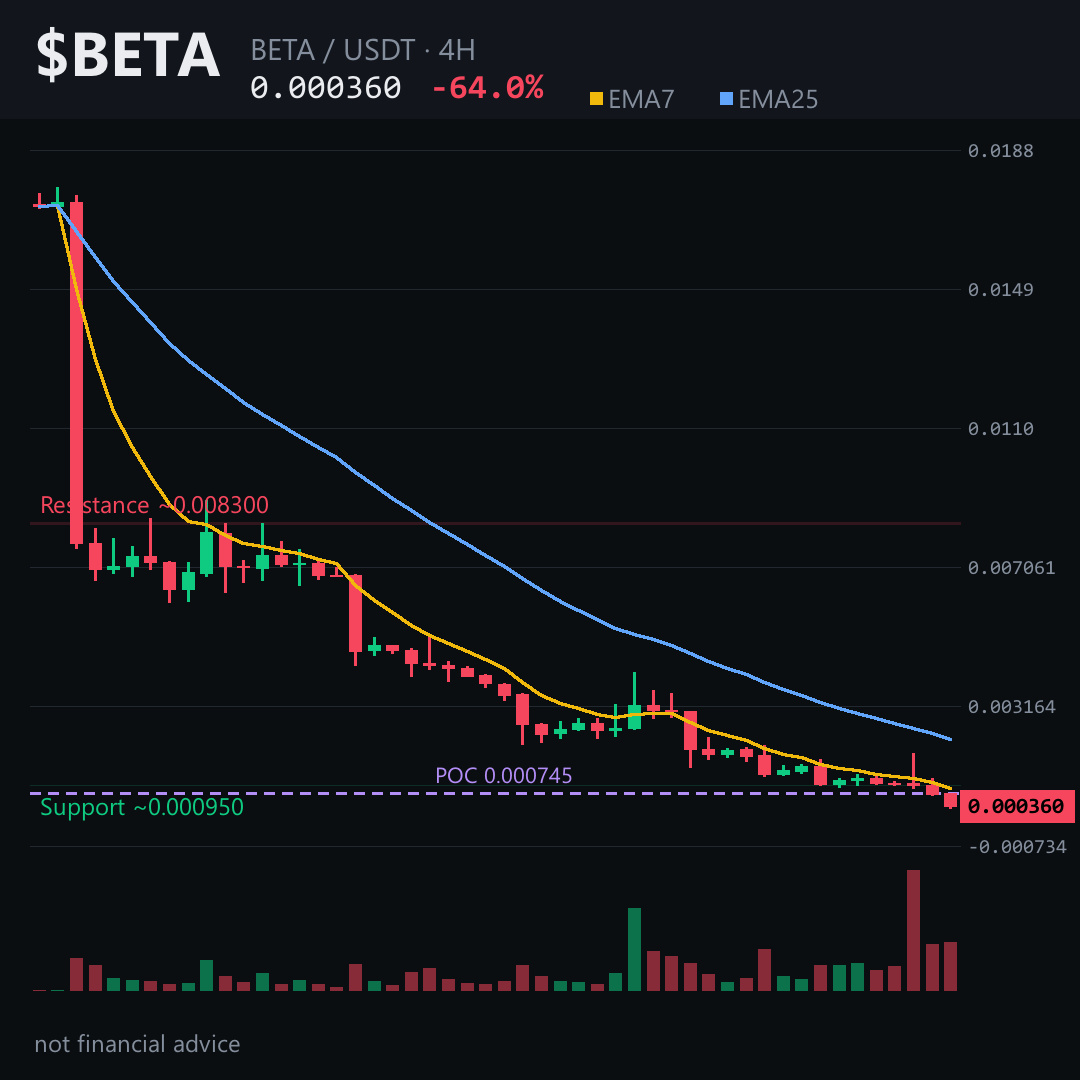
The 64% plunge has traders writing $BETA off as a dead coin.
But the 4‑hour chart still hides a slim cushion that could stall the fall.
Read the price action before you dismiss it 👇
Price is hugging the 4H pivot while RSI sits at 17.5, flagging extreme oversold.
The bearish unfilled gap above $0.0023 is already burnt, so the next swing targets the lower zone.
The current area sits around 0.000362; losing the ~0.000329 zone would confirm the downside.
If $BETA slides below that level, the bearish case strengthens.
Tap $BETA to pull up the chart and see these zones yourself.
I see a higher‑probability bounce off the 0.000362 area, with the real risk if it pierces the ~0.000380 ceiling.
Follow me for the next update when the price tests the 0.000380 barrier – I’ll break down what that means for the longer swing.
What level are you watching on BETA? 👇
⚠️ Not financial advice. DYOR.
#BETA #Crypto #BinanceSquare #TopLoser
The 64% plunge has traders writing $BETA off as a dead coin.
But the 4‑hour chart still hides a slim cushion that could stall the fall.
Read the price action before you dismiss it 👇
Price is hugging the 4H pivot while RSI sits at 17.5, flagging extreme oversold.
The bearish unfilled gap above $0.0023 is already burnt, so the next swing targets the lower zone.
The current area sits around 0.000362; losing the ~0.000329 zone would confirm the downside.
If $BETA slides below that level, the bearish case strengthens.
Tap $BETA to pull up the chart and see these zones yourself.
I see a higher‑probability bounce off the 0.000362 area, with the real risk if it pierces the ~0.000380 ceiling.
Follow me for the next update when the price tests the 0.000380 barrier – I’ll break down what that means for the longer swing.
What level are you watching on BETA? 👇
⚠️ Not financial advice. DYOR.
#BETA #Crypto #BinanceSquare #TopLoser
But the 4‑hour chart still hides a slim cushion that could stall the fall.
Read the price action before you dismiss it 👇
Price is hugging the 4H pivot while RSI sits at 17.5, flagging extreme oversold.
The bearish unfilled gap above $0.0023 is already burnt, so the next swing targets the lower zone.
The current area sits around 0.000362; losing the ~0.000329 zone would confirm the downside.
If $BETA slides below that level, the bearish case strengthens.
Tap $BETA to pull up the chart and see these zones yourself.
I see a higher‑probability bounce off the 0.000362 area, with the real risk if it pierces the ~0.000380 ceiling.
Follow me for the next update when the price tests the 0.000380 barrier – I’ll break down what that means for the longer swing.
What level are you watching on BETA? 👇
⚠️ Not financial advice. DYOR.
#BETA #Crypto #BinanceSquare #TopLoser
3
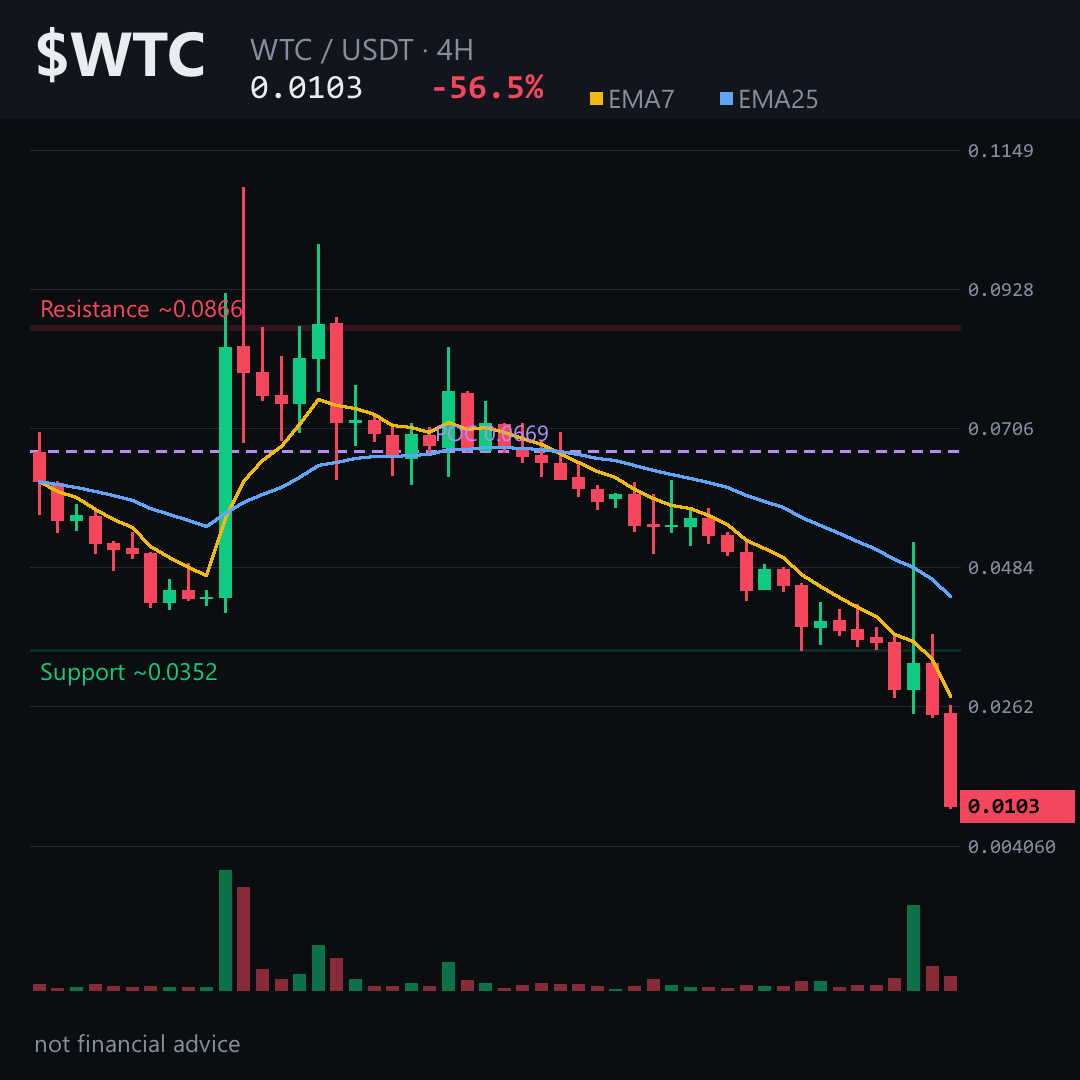
56.5% down in 24 h and the price is now hovering just 0.00005 USDT below the 4‑hour pivot. A hidden bearish pressure is building – keep reading.
🔎 The levels don’t lie 👇
Price is stuck under the 4H EMA cluster (EMA7 ≈ 0.0278 vs EMA25 ≈ 0.0434) and RSI sits at 20 — well into oversold territory, yet the candle flow is 9 red vs 3 green in the last 48 h, confirming short‑term weakness.
On the 4‑hour chart the current area clusters around $0.01035. If $WTC slides through the ~0.01087 zone, the bearish case collapses; otherwise the next likely destination is the ~0.00942 objective zone. Tap $WTC to pull up the chart and see these zones yourself.
My read: the market is testing a short‑term support that’s likely to give way, putting the next move toward the low‑0.0094 area.
Follow me for a fresh breakdown when that support finally cracks or holds – the next swing will reveal whether the downtrend can be arrested.
What level do you think will be the decisive test for $WTC today? 👇
⚠️ Not financial advice. DYOR.
#WTC #Crypto #BinanceSquare #TopLoser
56.5% down in 24 h and the price is now hovering just 0.00005 USDT below the 4‑hour pivot. A hidden bearish pressure is building – keep reading.
🔎 The levels don’t lie 👇
Price is stuck under the 4H EMA cluster (EMA7 ≈ 0.0278 vs EMA25 ≈ 0.0434) and RSI sits at 20 — well into oversold territory, yet the candle flow is 9 red vs 3 green in the last 48 h, confirming short‑term weakness.
On the 4‑hour chart the current area clusters around $0.01035. If $WTC slides through the ~0.01087 zone, the bearish case collapses; otherwise the next likely destination is the ~0.00942 objective zone. Tap $WTC to pull up the chart and see these zones yourself.
My read: the market is testing a short‑term support that’s likely to give way, putting the next move toward the low‑0.0094 area.
Follow me for a fresh breakdown when that support finally cracks or holds – the next swing will reveal whether the downtrend can be arrested.
What level do you think will be the decisive test for $WTC today? 👇
⚠️ Not financial advice. DYOR.
#WTC #Crypto #BinanceSquare #TopLoser
🔎 The levels don’t lie 👇
Price is stuck under the 4H EMA cluster (EMA7 ≈ 0.0278 vs EMA25 ≈ 0.0434) and RSI sits at 20 — well into oversold territory, yet the candle flow is 9 red vs 3 green in the last 48 h, confirming short‑term weakness.
On the 4‑hour chart the current area clusters around $0.01035. If $WTC slides through the ~0.01087 zone, the bearish case collapses; otherwise the next likely destination is the ~0.00942 objective zone. Tap $WTC to pull up the chart and see these zones yourself.
My read: the market is testing a short‑term support that’s likely to give way, putting the next move toward the low‑0.0094 area.
Follow me for a fresh breakdown when that support finally cracks or holds – the next swing will reveal whether the downtrend can be arrested.
What level do you think will be the decisive test for $WTC today? 👇
⚠️ Not financial advice. DYOR.
#WTC #Crypto #BinanceSquare #TopLoser
3
Imagine a coin that just fell 69% in a single day, and now sits at its absolute 24-hour low. Most traders see that and think "bounce."
They might be early.
$PHB futures are dead — zero funding, zero open interest. No smart money is waiting to catch a knife. The chart shows relentless rejection from $0.059, bleeding through every support with hourly red closes. After a -69% day, momentum is a freight train, not a rubber band.
The Trade
Entry $0.015300 | SL $0.016524 | TP $0.012852 | 3-5x Cross max
Sell-limit resting into first minor resistance. Clean 2.0:1 R:R. Invalidation: daily close above $0.016524.
Daily RSI is buried at 24, but in a free-fall, oversold stays oversold. The stop is tight above immediate noise, targeting a natural extension of the sell-off — not a hopeful reversal. Size so a full stop-out costs 1-2% max.
Follow me — I'll post a follow-up read the moment this level breaks or confirms, so you catch the update.
LONG or SHORT $PHB here? 👇
⚠️ Not financial advice. DYOR.
#PHB #Crypto #TopLoser #BinanceSquare
Imagine a coin that just fell 69% in a single day, and now sits at its absolute 24-hour low. Most traders see that and think "bounce."
They might be early.
$PHB futures are dead — zero funding, zero open interest. No smart money is waiting to catch a knife. The chart shows relentless rejection from $0.059, bleeding through every support with hourly red closes. After a -69% day, momentum is a freight train, not a rubber band.
The Trade
Entry $0.015300 | SL $0.016524 | TP $0.012852 | 3-5x Cross max
Sell-limit resting into first minor resistance. Clean 2.0:1 R:R. Invalidation: daily close above $0.016524.
Daily RSI is buried at 24, but in a free-fall, oversold stays oversold. The stop is tight above immediate noise, targeting a natural extension of the sell-off — not a hopeful reversal. Size so a full stop-out costs 1-2% max.
Follow me — I'll post a follow-up read the moment this level breaks or confirms, so you catch the update.
LONG or SHORT $PHB here? 👇
⚠️ Not financial advice. DYOR.
#PHB #Crypto #TopLoser #BinanceSquare
They might be early.
$PHB futures are dead — zero funding, zero open interest. No smart money is waiting to catch a knife. The chart shows relentless rejection from $0.059, bleeding through every support with hourly red closes. After a -69% day, momentum is a freight train, not a rubber band.
The Trade
Entry $0.015300 | SL $0.016524 | TP $0.012852 | 3-5x Cross max
Sell-limit resting into first minor resistance. Clean 2.0:1 R:R. Invalidation: daily close above $0.016524.
Daily RSI is buried at 24, but in a free-fall, oversold stays oversold. The stop is tight above immediate noise, targeting a natural extension of the sell-off — not a hopeful reversal. Size so a full stop-out costs 1-2% max.
Follow me — I'll post a follow-up read the moment this level breaks or confirms, so you catch the update.
LONG or SHORT $PHB here? 👇
⚠️ Not financial advice. DYOR.
#PHB #Crypto #TopLoser #BinanceSquare
37

·
--
Bearish
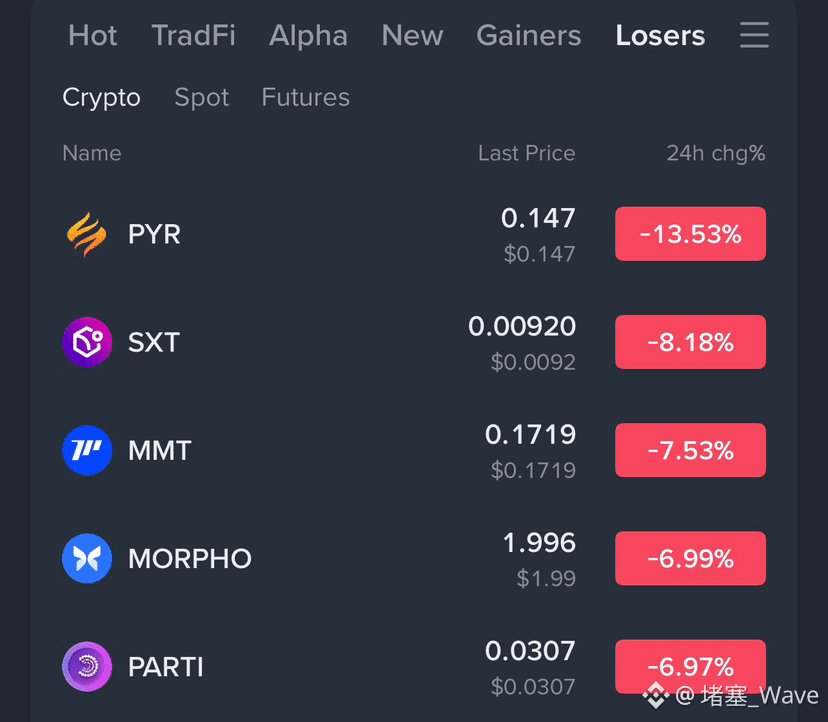
Top Crypto Losers: Market Faces Short-Term Pressure. 📉
The crypto market is seeing renewed selling pressure as several tokens record notable 24-hour declines.
Top losers:
• $PYR — Down 13.53%
• $SXT — Down 8.18%
• $MMT — Down 7.53%
• #MORPHO — Down 6.99%
• #PARTI — Down 6.97%
These moves highlight increased volatility and profit-taking across selected altcoins. Traders should watch volume, support levels, and broader market sentiment before making decisions, as sharp corrections can often create both risks and opportunities.
Follow HUSSAIN 侯赛因 for more latest updates .
{spot}(MMTUSDT)
{future}(SXTUSDT)
{spot}(PYRUSDT)
#toploser #TradingSignals #BuyTheDip
Top Crypto Losers: Market Faces Short-Term Pressure. 📉
The crypto market is seeing renewed selling pressure as several tokens record notable 24-hour declines.
Top losers:
• $PYR — Down 13.53%
• $SXT — Down 8.18%
• $MMT — Down 7.53%
• #MORPHO — Down 6.99%
• #PARTI — Down 6.97%
These moves highlight increased volatility and profit-taking across selected altcoins. Traders should watch volume, support levels, and broader market sentiment before making decisions, as sharp corrections can often create both risks and opportunities.
Follow HUSSAIN 侯赛因 for more latest updates .
#toploser #TradingSignals #BuyTheDip
The crypto market is seeing renewed selling pressure as several tokens record notable 24-hour declines.
Top losers:
• $PYR — Down 13.53%
• $SXT — Down 8.18%
• $MMT — Down 7.53%
• #MORPHO — Down 6.99%
• #PARTI — Down 6.97%
These moves highlight increased volatility and profit-taking across selected altcoins. Traders should watch volume, support levels, and broader market sentiment before making decisions, as sharp corrections can often create both risks and opportunities.
Follow HUSSAIN 侯赛因 for more latest updates .
#toploser #TradingSignals #BuyTheDip
4
508
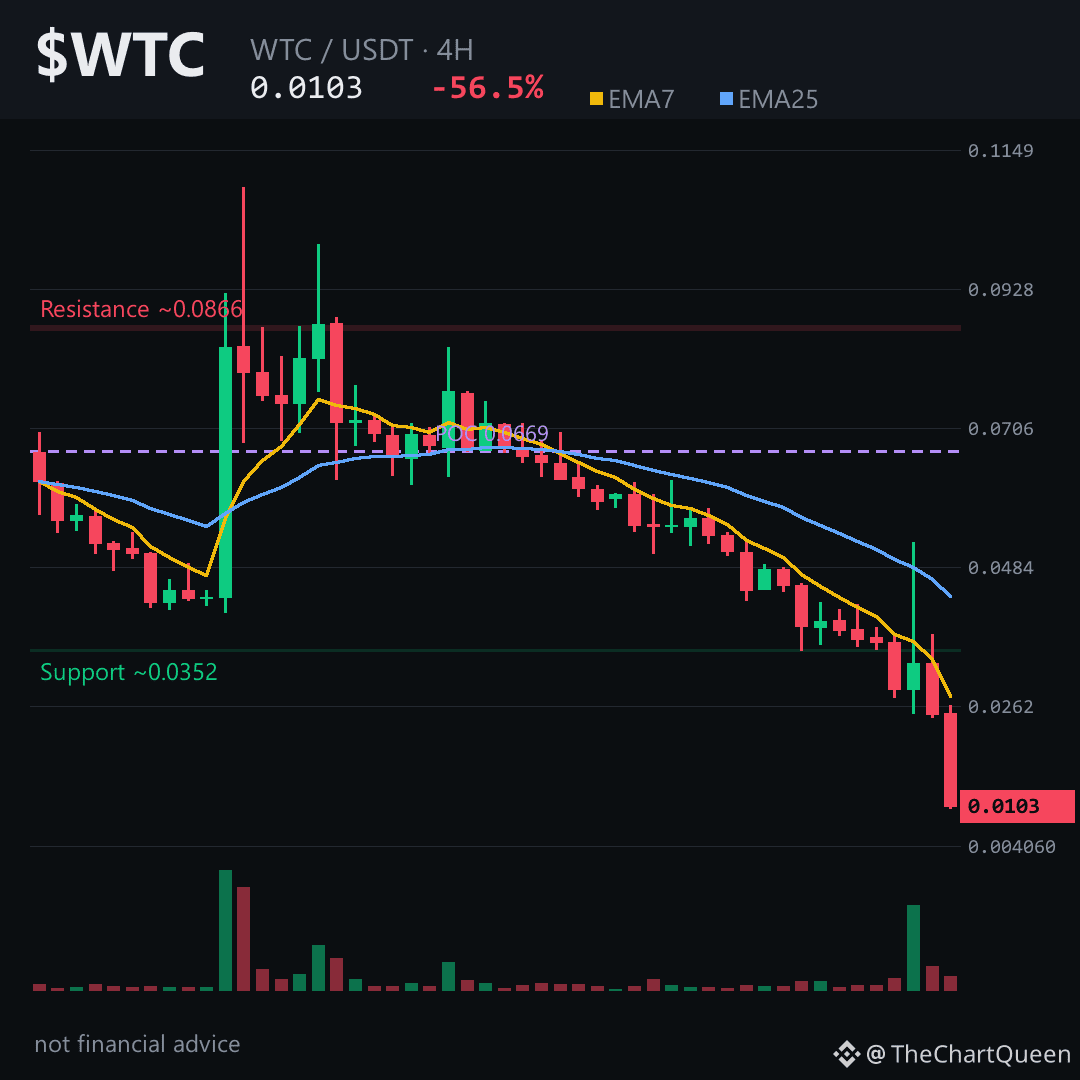
-56.54% in 24 hours.
That’s not a dip. That’s a structural collapse.
$WTC just printed a -58.96% single 4H candle after 48 hours bleeding from 0.0508 to 0.0100. The 24h range is 140%. This is what happens when liquidity vanishes.
RSI sits at 20.48 — oversold, but in a downtrend this steep, oversold can stay oversold. EMA7 (0.0278) has crashed through EMA25 (0.0434). The daily chart shows an unfilled bearish FVG between 0.0540 and 0.0577.
The level that matters: 0.0100. That’s the 24h low, and price is sitting right on it. Lose it on a 4H close, and the next objective is 0.0094 — then 0.0065.
The invalidation for this read is clean: a 4H close back above 0.0109 would tell me the flush has found a temporary floor. Until then, every bounce is suspect.
This is a falling knife with no volume support near current price. Hold 0.0100 and we might see a dead-cat bounce toward 0.012–0.014. Lose it, and the next leg down has no visible demand.
I’ll keep watching the 0.0100 area on $WTC and post an updated read if the structure shifts — follow so you don’t miss it.
What level are you watching on the 4H chart right now? 👇
⚠️ Not financial advice. DYOR.
#WTC #Crypto #TopLoser #BinanceSquare
-56.54% in 24 hours.
That’s not a dip. That’s a structural collapse.
$WTC just printed a -58.96% single 4H candle after 48 hours bleeding from 0.0508 to 0.0100. The 24h range is 140%. This is what happens when liquidity vanishes.
RSI sits at 20.48 — oversold, but in a downtrend this steep, oversold can stay oversold. EMA7 (0.0278) has crashed through EMA25 (0.0434). The daily chart shows an unfilled bearish FVG between 0.0540 and 0.0577.
The level that matters: 0.0100. That’s the 24h low, and price is sitting right on it. Lose it on a 4H close, and the next objective is 0.0094 — then 0.0065.
The invalidation for this read is clean: a 4H close back above 0.0109 would tell me the flush has found a temporary floor. Until then, every bounce is suspect.
This is a falling knife with no volume support near current price. Hold 0.0100 and we might see a dead-cat bounce toward 0.012–0.014. Lose it, and the next leg down has no visible demand.
I’ll keep watching the 0.0100 area on $WTC and post an updated read if the structure shifts — follow so you don’t miss it.
What level are you watching on the 4H chart right now? 👇
⚠️ Not financial advice. DYOR.
#WTC #Crypto #TopLoser #BinanceSquare
That’s not a dip. That’s a structural collapse.
$WTC just printed a -58.96% single 4H candle after 48 hours bleeding from 0.0508 to 0.0100. The 24h range is 140%. This is what happens when liquidity vanishes.
RSI sits at 20.48 — oversold, but in a downtrend this steep, oversold can stay oversold. EMA7 (0.0278) has crashed through EMA25 (0.0434). The daily chart shows an unfilled bearish FVG between 0.0540 and 0.0577.
The level that matters: 0.0100. That’s the 24h low, and price is sitting right on it. Lose it on a 4H close, and the next objective is 0.0094 — then 0.0065.
The invalidation for this read is clean: a 4H close back above 0.0109 would tell me the flush has found a temporary floor. Until then, every bounce is suspect.
This is a falling knife with no volume support near current price. Hold 0.0100 and we might see a dead-cat bounce toward 0.012–0.014. Lose it, and the next leg down has no visible demand.
I’ll keep watching the 0.0100 area on $WTC and post an updated read if the structure shifts — follow so you don’t miss it.
What level are you watching on the 4H chart right now? 👇
⚠️ Not financial advice. DYOR.
#WTC #Crypto #TopLoser #BinanceSquare
12

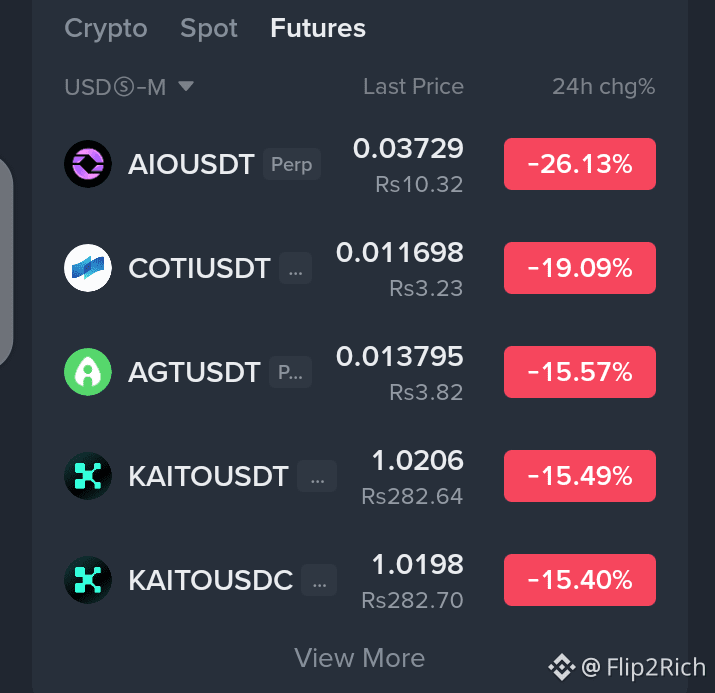
$COTI $AIO $KAITO
📉 TOP LOSER OF THE DAY 🔻
Not every day is green.
Today's biggest loser has seen heavy selling pressure as traders rushed to lock in profits and panic selling accelerated the drop. Sharp corrections like these often create opportunities—but only for patient traders.
⚠️ Don't catch a falling knife.
✅ Wait for support to hold.
✅ Let the chart confirm the reversal before entering.
Sometimes the best trade is no trade. 📊
#Crypto #TopLoser #Binance #Trading #RiskManagementMastery
$COTI $AIO $KAITO
📉 TOP LOSER OF THE DAY 🔻
Not every day is green.
Today's biggest loser has seen heavy selling pressure as traders rushed to lock in profits and panic selling accelerated the drop. Sharp corrections like these often create opportunities—but only for patient traders.
⚠️ Don't catch a falling knife.
✅ Wait for support to hold.
✅ Let the chart confirm the reversal before entering.
Sometimes the best trade is no trade. 📊
#Crypto #TopLoser #Binance #Trading #RiskManagementMastery
📉 TOP LOSER OF THE DAY 🔻
Not every day is green.
Today's biggest loser has seen heavy selling pressure as traders rushed to lock in profits and panic selling accelerated the drop. Sharp corrections like these often create opportunities—but only for patient traders.
⚠️ Don't catch a falling knife.
✅ Wait for support to hold.
✅ Let the chart confirm the reversal before entering.
Sometimes the best trade is no trade. 📊
#Crypto #TopLoser #Binance #Trading #RiskManagementMastery
279
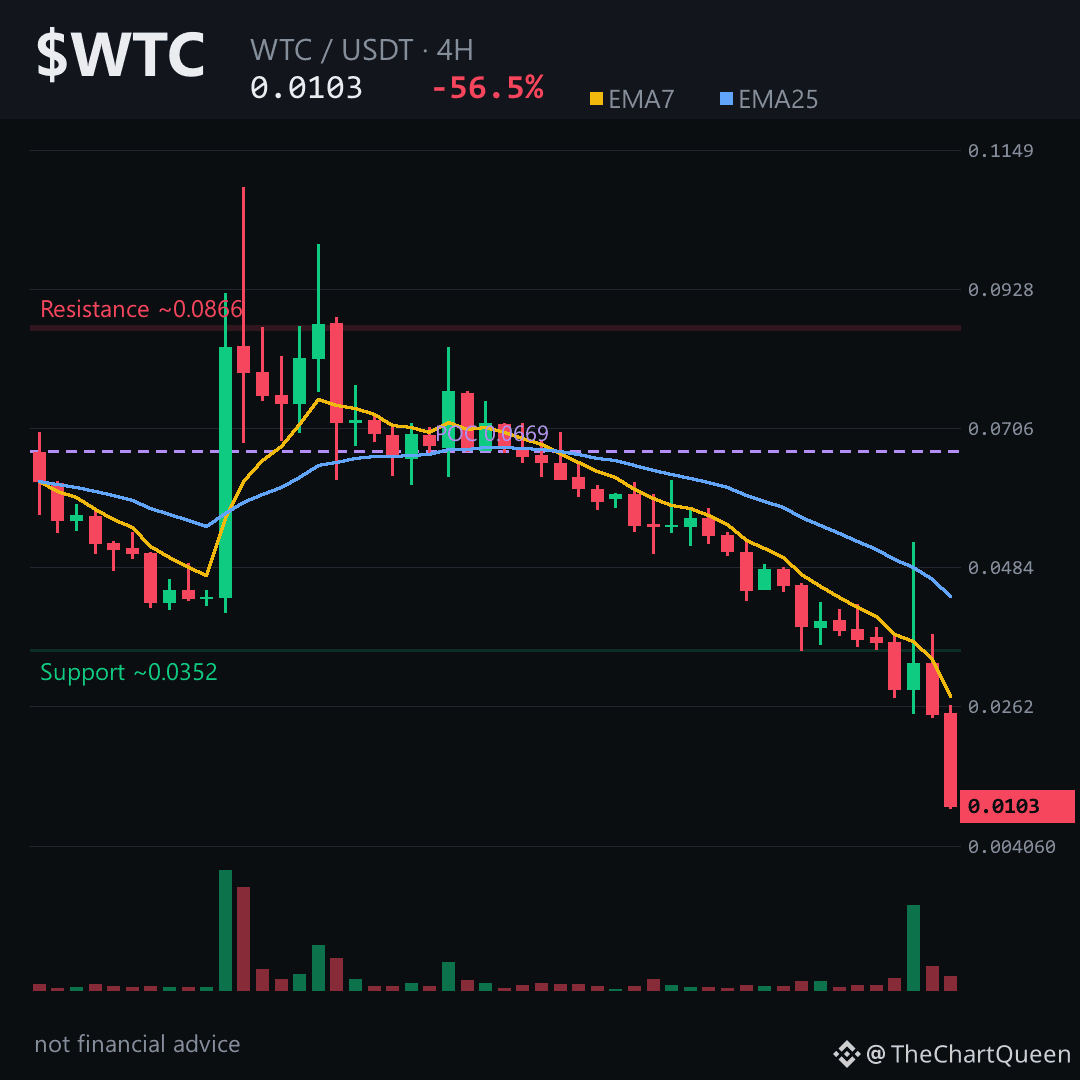
Is $WTC finally washed out — or just pausing before the next leg down?
A 56% single-day drop isn't normal even in crypto. That's a coin falling through every floor it had, with volume spiking and no bid willing to catch it.
The 4H RSI is near 20 — oversold, but on a coin losing this much momentum, oversold can stay oversold for days.
Price is trading far below both key moving averages, and the 24-hour range is 140%. That's not consolidation. That's panic.
Now the level that matters:
If $WTC can't reclaim 0.0108–0.0113 on a daily close, the path of least resistance still points lower.
Next demand zone: 0.0088.
Lose that, and the macro picture opens toward 0.0065.
There's also an unfilled bearish gap on the daily between roughly 0.054 and 0.058. If any relief bounce gets momentum, that's where sellers historically re-engage.
My read: bounce attempts are weak, and the structure hasn't shown a single higher low yet.
Until it does, this is a falling knife — not a dip.
Tap $WTC to pull up the chart and check the 0.0108 area yourself.
What's the first sign you'd need to see before trusting any bounce here? 👇
Not financial advice. DYOR.
Follow for the next read on this chart.
#WTC #Crypto #TopLoser #BinanceSquare
Is $WTC finally washed out — or just pausing before the next leg down?
A 56% single-day drop isn't normal even in crypto. That's a coin falling through every floor it had, with volume spiking and no bid willing to catch it.
The 4H RSI is near 20 — oversold, but on a coin losing this much momentum, oversold can stay oversold for days.
Price is trading far below both key moving averages, and the 24-hour range is 140%. That's not consolidation. That's panic.
Now the level that matters:
If $WTC can't reclaim 0.0108–0.0113 on a daily close, the path of least resistance still points lower.
Next demand zone: 0.0088.
Lose that, and the macro picture opens toward 0.0065.
There's also an unfilled bearish gap on the daily between roughly 0.054 and 0.058. If any relief bounce gets momentum, that's where sellers historically re-engage.
My read: bounce attempts are weak, and the structure hasn't shown a single higher low yet.
Until it does, this is a falling knife — not a dip.
Tap $WTC to pull up the chart and check the 0.0108 area yourself.
What's the first sign you'd need to see before trusting any bounce here? 👇
Not financial advice. DYOR.
Follow for the next read on this chart.
#WTC #Crypto #TopLoser #BinanceSquare
A 56% single-day drop isn't normal even in crypto. That's a coin falling through every floor it had, with volume spiking and no bid willing to catch it.
The 4H RSI is near 20 — oversold, but on a coin losing this much momentum, oversold can stay oversold for days.
Price is trading far below both key moving averages, and the 24-hour range is 140%. That's not consolidation. That's panic.
Now the level that matters:
If $WTC can't reclaim 0.0108–0.0113 on a daily close, the path of least resistance still points lower.
Next demand zone: 0.0088.
Lose that, and the macro picture opens toward 0.0065.
There's also an unfilled bearish gap on the daily between roughly 0.054 and 0.058. If any relief bounce gets momentum, that's where sellers historically re-engage.
My read: bounce attempts are weak, and the structure hasn't shown a single higher low yet.
Until it does, this is a falling knife — not a dip.
Tap $WTC to pull up the chart and check the 0.0108 area yourself.
What's the first sign you'd need to see before trusting any bounce here? 👇
Not financial advice. DYOR.
Follow for the next read on this chart.
#WTC #Crypto #TopLoser #BinanceSquare
14
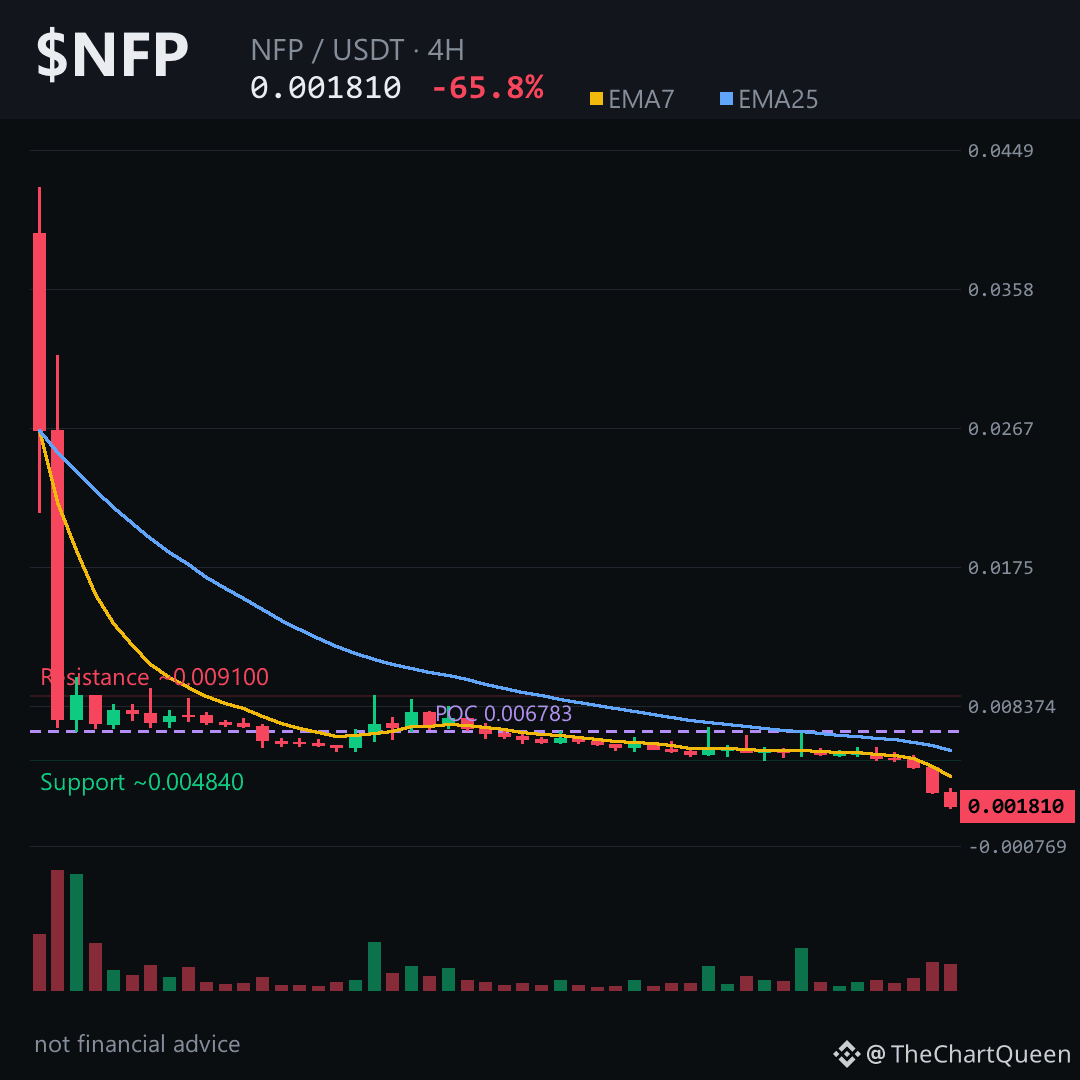
65.9% plunge in 24 h left $NFP hovering just below its 4‑hour pivot.
A silent trap is forming – read it before the slide tightens 👇
Price is deep in bearish territory (EMA7 under EMA25, RSI 12.9), yet the 4‑hour chart still cradles a tiny demand pocket at the ~0.001819 area. Below that, a bearish unfilled gap sits between 0.00479 and 0.00445, hinting at further downside pressure.
If $NFP loses the ~0.001819 zone, the next likely target is the ~0.001655 objective. The read fails only if price climbs back above the ~0.00191 invalidation level on a 4 h close. Tap $NFP to pull up the chart and verify these zones yourself.
My read: the market is primed for another leg down toward the mid‑0.0016 range, with the ~0.00191 barrier acting as the last line of defense.
Follow me for the next update when the ~0.00191 line holds or gives way.
What zone are you watching on NFP? 👇
⚠️ Not financial advice. DYOR.
#NFP #Crypto #BinanceSquare #TopLoser
65.9% plunge in 24 h left $NFP hovering just below its 4‑hour pivot.
A silent trap is forming – read it before the slide tightens 👇
Price is deep in bearish territory (EMA7 under EMA25, RSI 12.9), yet the 4‑hour chart still cradles a tiny demand pocket at the ~0.001819 area. Below that, a bearish unfilled gap sits between 0.00479 and 0.00445, hinting at further downside pressure.
If $NFP loses the ~0.001819 zone, the next likely target is the ~0.001655 objective. The read fails only if price climbs back above the ~0.00191 invalidation level on a 4 h close. Tap $NFP to pull up the chart and verify these zones yourself.
My read: the market is primed for another leg down toward the mid‑0.0016 range, with the ~0.00191 barrier acting as the last line of defense.
Follow me for the next update when the ~0.00191 line holds or gives way.
What zone are you watching on NFP? 👇
⚠️ Not financial advice. DYOR.
#NFP #Crypto #BinanceSquare #TopLoser
A silent trap is forming – read it before the slide tightens 👇
Price is deep in bearish territory (EMA7 under EMA25, RSI 12.9), yet the 4‑hour chart still cradles a tiny demand pocket at the ~0.001819 area. Below that, a bearish unfilled gap sits between 0.00479 and 0.00445, hinting at further downside pressure.
If $NFP loses the ~0.001819 zone, the next likely target is the ~0.001655 objective. The read fails only if price climbs back above the ~0.00191 invalidation level on a 4 h close. Tap $NFP to pull up the chart and verify these zones yourself.
My read: the market is primed for another leg down toward the mid‑0.0016 range, with the ~0.00191 barrier acting as the last line of defense.
Follow me for the next update when the ~0.00191 line holds or gives way.
What zone are you watching on NFP? 👇
⚠️ Not financial advice. DYOR.
#NFP #Crypto #BinanceSquare #TopLoser
28

·
--
Bearish
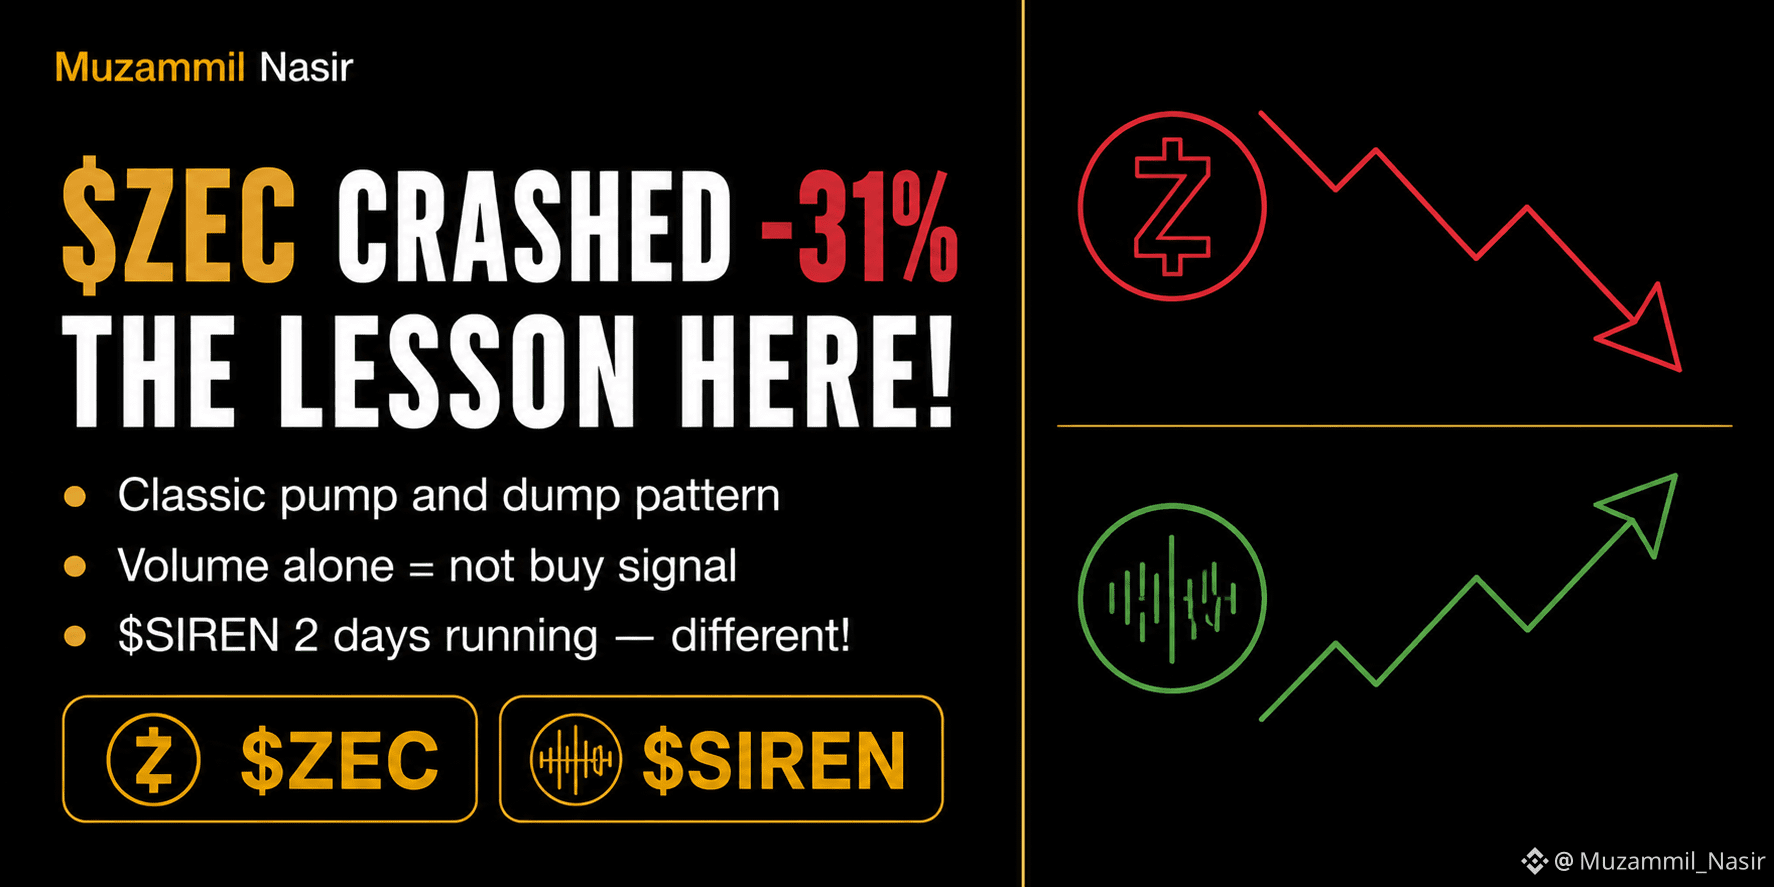
⚡ $ZEC Crashed -31% Overnight — What Just Happened?
Biggest loser today — and here is the real story! 👇
Current: $429
24h Loss: -31.25%
Volume: $1.65 BILLION 🔥
Why did $ZEC crash so hard?
ZEC had pumped +9% just 2 days ago — today the pump fully reversed!
2 days ago: +9% 📈
Today: -31% 📉
= Classic pump and dump pattern!
The lesson every trader must learn:
When a coin pumps without strong news
= The dump is coming!
Volume alone is NOT a reason to buy!
What about $SIREN +23% again?
Two days running now!
✅ AI narrative still strong
✅ Real consistent buying
✅ This feels different from ZEC pump!
My rule:
1 day pump = Maybe luck
2 day pump = Worth watching
3 day pump = Real momentum!
Which pattern are YOU following?
Comment below! 👇
$ZEC $SIREN #CryptoTrading #TopLoser #Binance2026
Not financial advice. DYOR! ⚠️
{future}(ZECUSDT)
⚡ $ZEC Crashed -31% Overnight — What Just Happened?
Biggest loser today — and here is the real story! 👇
Current: $429
24h Loss: -31.25%
Volume: $1.65 BILLION 🔥
Why did $ZEC crash so hard?
ZEC had pumped +9% just 2 days ago — today the pump fully reversed!
2 days ago: +9% 📈
Today: -31% 📉
= Classic pump and dump pattern!
The lesson every trader must learn:
When a coin pumps without strong news
= The dump is coming!
Volume alone is NOT a reason to buy!
What about $SIREN +23% again?
Two days running now!
✅ AI narrative still strong
✅ Real consistent buying
✅ This feels different from ZEC pump!
My rule:
1 day pump = Maybe luck
2 day pump = Worth watching
3 day pump = Real momentum!
Which pattern are YOU following?
Comment below! 👇
$ZEC $SIREN #CryptoTrading #TopLoser #Binance2026
Not financial advice. DYOR! ⚠️
Biggest loser today — and here is the real story! 👇
Current: $429
24h Loss: -31.25%
Volume: $1.65 BILLION 🔥
Why did $ZEC crash so hard?
ZEC had pumped +9% just 2 days ago — today the pump fully reversed!
2 days ago: +9% 📈
Today: -31% 📉
= Classic pump and dump pattern!
The lesson every trader must learn:
When a coin pumps without strong news
= The dump is coming!
Volume alone is NOT a reason to buy!
What about $SIREN +23% again?
Two days running now!
✅ AI narrative still strong
✅ Real consistent buying
✅ This feels different from ZEC pump!
My rule:
1 day pump = Maybe luck
2 day pump = Worth watching
3 day pump = Real momentum!
Which pattern are YOU following?
Comment below! 👇
$ZEC $SIREN #CryptoTrading #TopLoser #Binance2026
Not financial advice. DYOR! ⚠️
259
·
--
Bearish
📉 $JST Just Dropped -8%! Why
Buy The Dip or Avoid?
Biggest loser today — let's break it down! 👇
Current: $0.0763
Loss: -8.24%
Volume: $39M
Why dropping?
TRON ecosystem facing pressure
General market rotation today
Profit taking after recent gains
Is it a buy opportunity?
✅ TRON network still active
✅ Low price = Low risk entry
✅ Justin Sun still building
❌ No strong catalyst right now
❌ Better opportunities exist today
My honest view:
$JST is not my priority today
$SIREN and $H showing real strength
Strong coins beat weak coins always!
Levels:
🔴 Resistance: $0.085
🟢 Support: $0.065
Dip buy or avoid?
Comment below! 👇
$JST #TRON #TopLoser #CryptoTrading #Binance2026
Not financial advice. DYOR! ⚠️
{future}(JSTUSDT)
📉 $JST Just Dropped -8%! Why
Buy The Dip or Avoid?
Biggest loser today — let's break it down! 👇
Current: $0.0763
Loss: -8.24%
Volume: $39M
Why dropping?
TRON ecosystem facing pressure
General market rotation today
Profit taking after recent gains
Is it a buy opportunity?
✅ TRON network still active
✅ Low price = Low risk entry
✅ Justin Sun still building
❌ No strong catalyst right now
❌ Better opportunities exist today
My honest view:
$JST is not my priority today
$SIREN and $H showing real strength
Strong coins beat weak coins always!
Levels:
🔴 Resistance: $0.085
🟢 Support: $0.065
Dip buy or avoid?
Comment below! 👇
$JST #TRON #TopLoser #CryptoTrading #Binance2026
Not financial advice. DYOR! ⚠️
Buy The Dip or Avoid?
Biggest loser today — let's break it down! 👇
Current: $0.0763
Loss: -8.24%
Volume: $39M
Why dropping?
TRON ecosystem facing pressure
General market rotation today
Profit taking after recent gains
Is it a buy opportunity?
✅ TRON network still active
✅ Low price = Low risk entry
✅ Justin Sun still building
❌ No strong catalyst right now
❌ Better opportunities exist today
My honest view:
$JST is not my priority today
$SIREN and $H showing real strength
Strong coins beat weak coins always!
Levels:
🔴 Resistance: $0.085
🟢 Support: $0.065
Dip buy or avoid?
Comment below! 👇
$JST #TRON #TopLoser #CryptoTrading #Binance2026
Not financial advice. DYOR! ⚠️

216

·
--
🚨Market Update🚨
Guys Wait a minute and get the latest crypto news🔴🔴
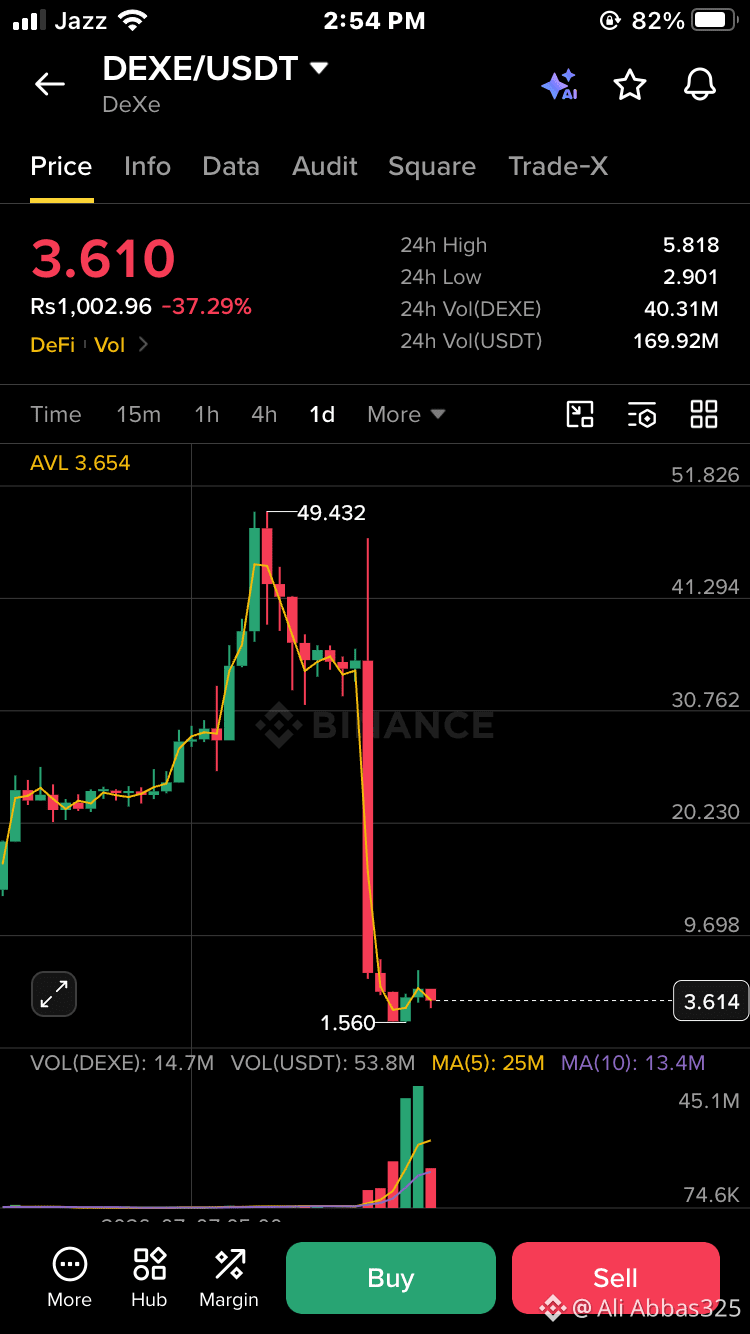
$DEXE is once again going down 📉📉📉
$DEXE is crashing with a Market Cap Of $350.79M and with a Volume of $796.93M
What do you think will #dexe be Bullish 📈📈 or Bearish 📉📉 in the next 24 Hours ❓❓❓
Tell me in comments 👇🏼👇🏼
Follow for more and stay tuned 🤗#DEXE/USDT
#TopLoser
{spot}(DEXEUSDT)
🚨Market Update🚨
Guys Wait a minute and get the latest crypto news🔴🔴
$DEXE is once again going down 📉📉📉
$DEXE is crashing with a Market Cap Of $350.79M and with a Volume of $796.93M
What do you think will #dexe be Bullish 📈📈 or Bearish 📉📉 in the next 24 Hours ❓❓❓
Tell me in comments 👇🏼👇🏼
Follow for more and stay tuned 🤗#DEXE/USDT
#TopLoser
Guys Wait a minute and get the latest crypto news🔴🔴
$DEXE is once again going down 📉📉📉
$DEXE is crashing with a Market Cap Of $350.79M and with a Volume of $796.93M
What do you think will #dexe be Bullish 📈📈 or Bearish 📉📉 in the next 24 Hours ❓❓❓
Tell me in comments 👇🏼👇🏼
Follow for more and stay tuned 🤗#DEXE/USDT
#TopLoser
143
-56.54% in 24 hours.
Price has nuked straight through the 1D fair value gap ($0.054-$0.057) — that zone is now a ceiling, not a target.
RSI is buried below 21 on both the 4H and 1D. Futures show zero open interest and flat funding — the leveraged crowd is wiped out. This is a spot-driven liquidation cascade. Volume spikes into the lows hint at absorption, but it’s still a falling knife until structure forms.
The Trade — SHORT (Swing 1D):
Entry $0.010506 | SL $0.011346 | TP $0.00882504 | 3-5x Cross max
We sell a pullback into the broken daily FVG. A limit order just above current price catches any dead-cat bounce before the next leg down. 2.0:1 R:R targets a fresh low. Size it so a full stop-out costs max 1-2% of account. Invalid if price closes above $0.011346. Tap $WTC to set the sell limit — it could fill on any micro-spike.
Path of least resistance is lower until price reclaims $0.054. We’re shorting the first weak bounce, not chasing the crash.
I’ll post the exact update when this triggers or invalidates — follow so you catch it.
LONG or SHORT $WTC here? 👇
⚠️ Not financial advice. DYOR.
#WTC #Crypto #TopLoser #BinanceSquare
-56.54% in 24 hours.
Price has nuked straight through the 1D fair value gap ($0.054-$0.057) — that zone is now a ceiling, not a target.
RSI is buried below 21 on both the 4H and 1D. Futures show zero open interest and flat funding — the leveraged crowd is wiped out. This is a spot-driven liquidation cascade. Volume spikes into the lows hint at absorption, but it’s still a falling knife until structure forms.
The Trade — SHORT (Swing 1D):
Entry $0.010506 | SL $0.011346 | TP $0.00882504 | 3-5x Cross max
We sell a pullback into the broken daily FVG. A limit order just above current price catches any dead-cat bounce before the next leg down. 2.0:1 R:R targets a fresh low. Size it so a full stop-out costs max 1-2% of account. Invalid if price closes above $0.011346. Tap $WTC to set the sell limit — it could fill on any micro-spike.
Path of least resistance is lower until price reclaims $0.054. We’re shorting the first weak bounce, not chasing the crash.
I’ll post the exact update when this triggers or invalidates — follow so you catch it.
LONG or SHORT $WTC here? 👇
⚠️ Not financial advice. DYOR.
#WTC #Crypto #TopLoser #BinanceSquare
Price has nuked straight through the 1D fair value gap ($0.054-$0.057) — that zone is now a ceiling, not a target.
RSI is buried below 21 on both the 4H and 1D. Futures show zero open interest and flat funding — the leveraged crowd is wiped out. This is a spot-driven liquidation cascade. Volume spikes into the lows hint at absorption, but it’s still a falling knife until structure forms.
The Trade — SHORT (Swing 1D):
Entry $0.010506 | SL $0.011346 | TP $0.00882504 | 3-5x Cross max
We sell a pullback into the broken daily FVG. A limit order just above current price catches any dead-cat bounce before the next leg down. 2.0:1 R:R targets a fresh low. Size it so a full stop-out costs max 1-2% of account. Invalid if price closes above $0.011346. Tap $WTC to set the sell limit — it could fill on any micro-spike.
Path of least resistance is lower until price reclaims $0.054. We’re shorting the first weak bounce, not chasing the crash.
I’ll post the exact update when this triggers or invalidates — follow so you catch it.
LONG or SHORT $WTC here? 👇
⚠️ Not financial advice. DYOR.
#WTC #Crypto #TopLoser #BinanceSquare
59
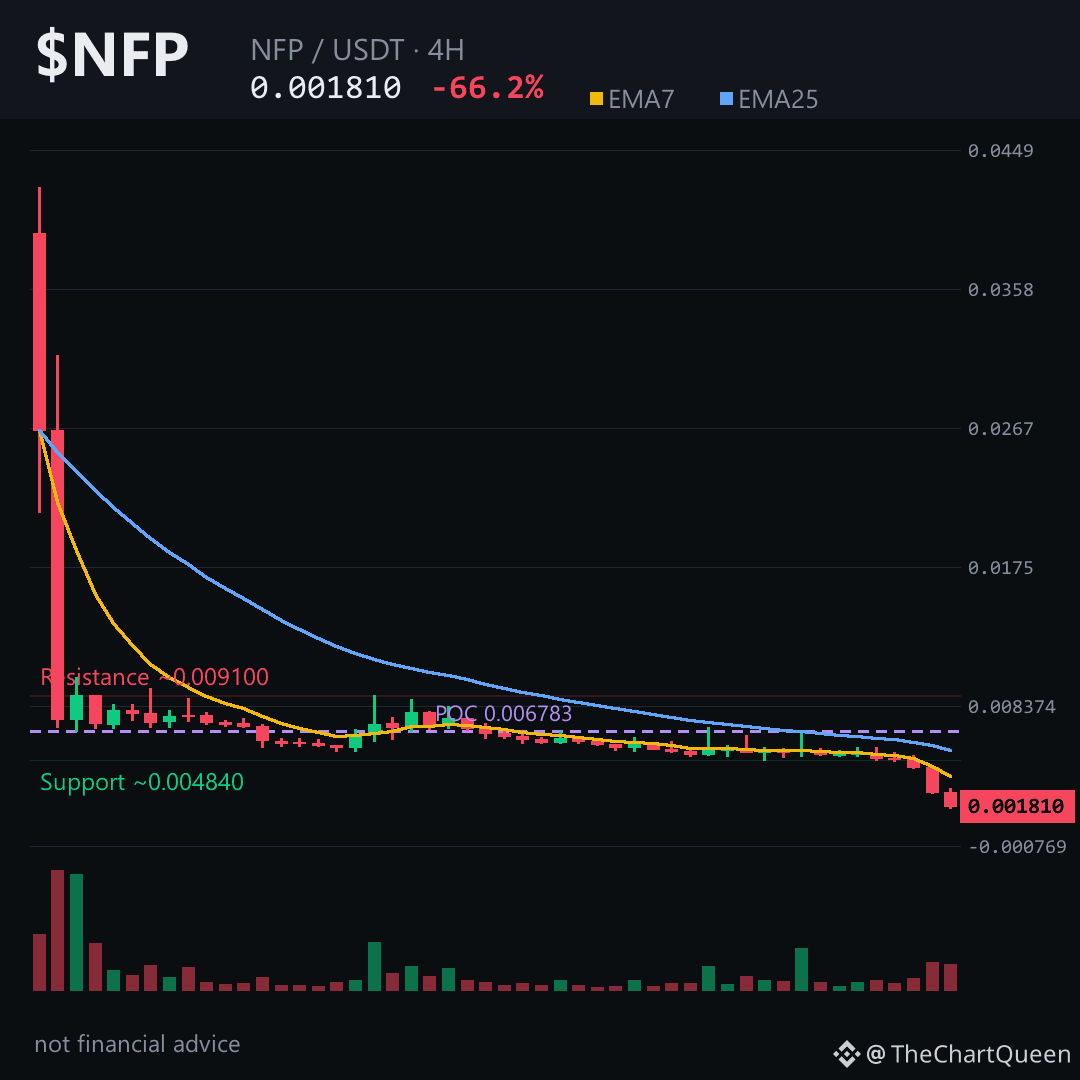
The market just dumped $NFP 66% in a day, and the 4‑hour chart is screaming another drop.
Read the key zones below 👇
The 4‑hour EMA7 sits well under EMA25 and RSI is stuck at 12.9, flagging an exhausted rally. Yet a bearish unfilled gap between 0.00479 – 0.00445 and a volume‑profile point‑of‑control near 0.00678—far above today’s price—suggest buying pressure has evaporated.
Current price hovers around the 0.00182 area. If $NFP slides below the ~0.00191 invalidation zone, the next leg could head toward the ~0.00166 objective. Holding above the ~0.00191 line would invalidate this bearish read.
My read: the chart is primed for a further dip toward the mid‑0.0016s unless a sharp bounce breaks the ~0.00191 ceiling.
Follow me for the next breakdown analysis when the price tests that ceiling – you’ll see the next move before it’s priced in. What level are you watching on $NFP? 👇
⚠️ Not financial advice. DYOR.
#NFP #Crypto #BinanceSquare #TopLoser
The market just dumped $NFP 66% in a day, and the 4‑hour chart is screaming another drop.
Read the key zones below 👇
The 4‑hour EMA7 sits well under EMA25 and RSI is stuck at 12.9, flagging an exhausted rally. Yet a bearish unfilled gap between 0.00479 – 0.00445 and a volume‑profile point‑of‑control near 0.00678—far above today’s price—suggest buying pressure has evaporated.
Current price hovers around the 0.00182 area. If $NFP slides below the ~0.00191 invalidation zone, the next leg could head toward the ~0.00166 objective. Holding above the ~0.00191 line would invalidate this bearish read.
My read: the chart is primed for a further dip toward the mid‑0.0016s unless a sharp bounce breaks the ~0.00191 ceiling.
Follow me for the next breakdown analysis when the price tests that ceiling – you’ll see the next move before it’s priced in. What level are you watching on $NFP? 👇
⚠️ Not financial advice. DYOR.
#NFP #Crypto #BinanceSquare #TopLoser
Read the key zones below 👇
The 4‑hour EMA7 sits well under EMA25 and RSI is stuck at 12.9, flagging an exhausted rally. Yet a bearish unfilled gap between 0.00479 – 0.00445 and a volume‑profile point‑of‑control near 0.00678—far above today’s price—suggest buying pressure has evaporated.
Current price hovers around the 0.00182 area. If $NFP slides below the ~0.00191 invalidation zone, the next leg could head toward the ~0.00166 objective. Holding above the ~0.00191 line would invalidate this bearish read.
My read: the chart is primed for a further dip toward the mid‑0.0016s unless a sharp bounce breaks the ~0.00191 ceiling.
Follow me for the next breakdown analysis when the price tests that ceiling – you’ll see the next move before it’s priced in. What level are you watching on $NFP? 👇
⚠️ Not financial advice. DYOR.
#NFP #Crypto #BinanceSquare #TopLoser
20

·
--
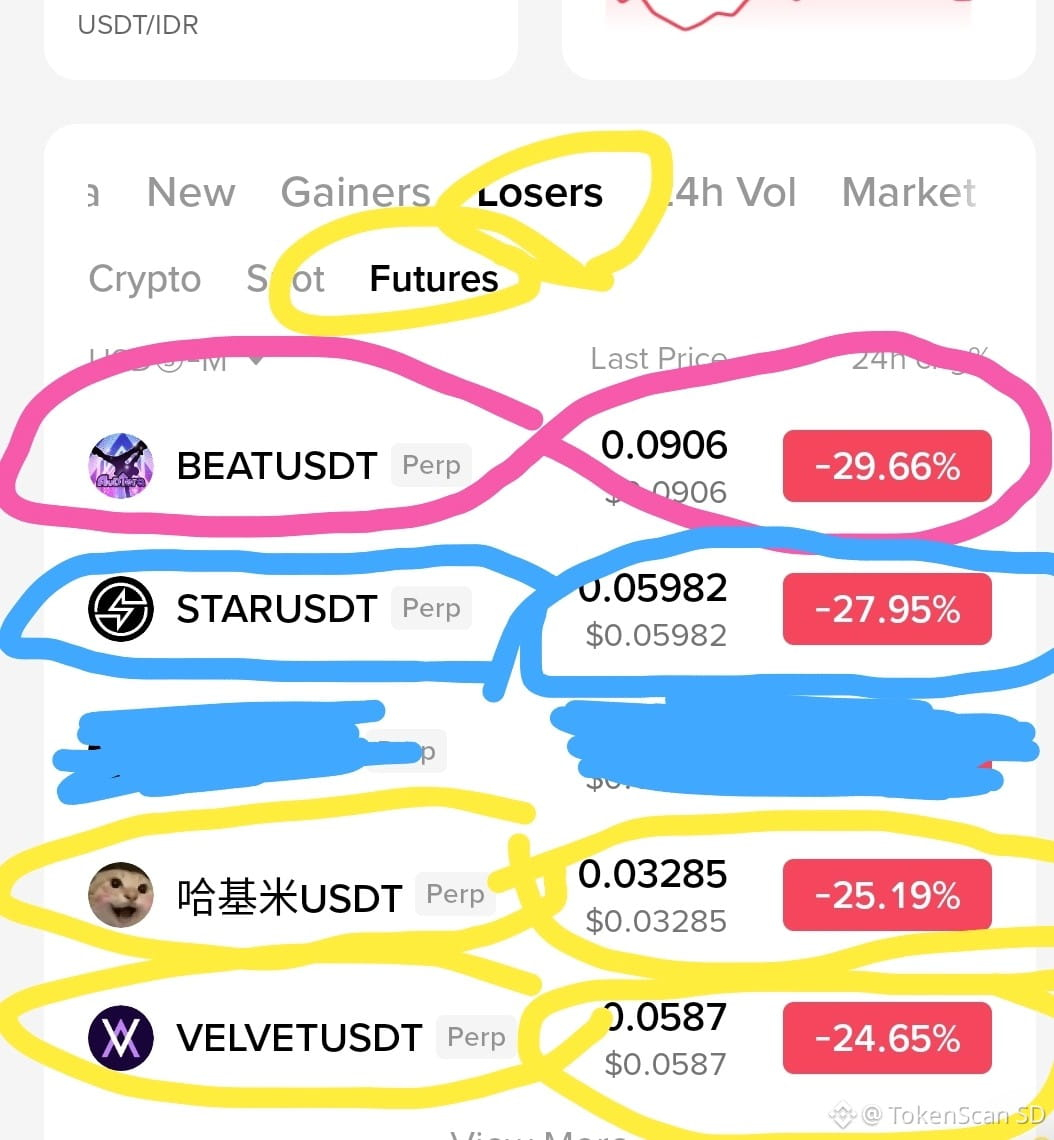
🚨Binance Futures top loser today all together fell off a cliff, like after a reunion then getting emotional together😅
📉 BEATUSDT -29.66% — after a quick rally, now it’s the turn of its leverage to get revenge
📉 STARUSDT -27.95% — too many long positions; the liquidation cascade kicked off first
📉 哈基米USDT -25.19% — meme token, thin liquidity; it really does love extreme toys
📉 VELVETUSDT -24.65% — buying momentum has been weak since yesterday; the price is just catching up
Brief analysis: a 20–30% correction in 24 hours isn’t the end of the world—it’s a typical sign of a market dominated by leverage. Usually after a drop this sharp, there are two possibilities: continued downside (if OI is still high & funding is extremely negative) or a technical bounce (if sellers are exhausted & funding starts to normalize).
If you’re going to trade: this isn’t a zone to FOMO short at this price—it's already too late. What makes more sense is to wait for the price to form a higher low first + have the funding rate return to neutral, then consider a small scalp bounce with a small size and a tight SL. Don’t go all-in just because you see red.
Note : BTW what is the #3 top loser?
you can guess and I’ll give you a prize ☕
⚠️ Not a call to buy/sell. High leverage = high risk. DYOR always, Crypto SD friends 🎒
#CryptoNewss #TopLoser #BinanceFutures #dyor
$BEAT
{future}(BEATUSDT)
$STAR
{future}(STARUSDT)
$VELVET
{future}(VELVETUSDT)
🚨Binance Futures top loser today all together fell off a cliff, like after a reunion then getting emotional together😅
📉 BEATUSDT -29.66% — after a quick rally, now it’s the turn of its leverage to get revenge
📉 STARUSDT -27.95% — too many long positions; the liquidation cascade kicked off first
📉 哈基米USDT -25.19% — meme token, thin liquidity; it really does love extreme toys
📉 VELVETUSDT -24.65% — buying momentum has been weak since yesterday; the price is just catching up
Brief analysis: a 20–30% correction in 24 hours isn’t the end of the world—it’s a typical sign of a market dominated by leverage. Usually after a drop this sharp, there are two possibilities: continued downside (if OI is still high & funding is extremely negative) or a technical bounce (if sellers are exhausted & funding starts to normalize).
If you’re going to trade: this isn’t a zone to FOMO short at this price—it's already too late. What makes more sense is to wait for the price to form a higher low first + have the funding rate return to neutral, then consider a small scalp bounce with a small size and a tight SL. Don’t go all-in just because you see red.
Note : BTW what is the #3 top loser?
you can guess and I’ll give you a prize ☕
⚠️ Not a call to buy/sell. High leverage = high risk. DYOR always, Crypto SD friends 🎒
#CryptoNewss #TopLoser #BinanceFutures #dyor
$BEAT
$STAR
$VELVET
📉 BEATUSDT -29.66% — after a quick rally, now it’s the turn of its leverage to get revenge
📉 STARUSDT -27.95% — too many long positions; the liquidation cascade kicked off first
📉 哈基米USDT -25.19% — meme token, thin liquidity; it really does love extreme toys
📉 VELVETUSDT -24.65% — buying momentum has been weak since yesterday; the price is just catching up
Brief analysis: a 20–30% correction in 24 hours isn’t the end of the world—it’s a typical sign of a market dominated by leverage. Usually after a drop this sharp, there are two possibilities: continued downside (if OI is still high & funding is extremely negative) or a technical bounce (if sellers are exhausted & funding starts to normalize).
If you’re going to trade: this isn’t a zone to FOMO short at this price—it's already too late. What makes more sense is to wait for the price to form a higher low first + have the funding rate return to neutral, then consider a small scalp bounce with a small size and a tight SL. Don’t go all-in just because you see red.
Note : BTW what is the #3 top loser?
you can guess and I’ll give you a prize ☕
⚠️ Not a call to buy/sell. High leverage = high risk. DYOR always, Crypto SD friends 🎒
#CryptoNewss #TopLoser #BinanceFutures #dyor
$BEAT
$STAR
$VELVET
1.2k
·
--
🚨Market Update🚨
Guys Stop And look here for the latest crypto news🫵🏼🔴🔴🔴🫵🏼
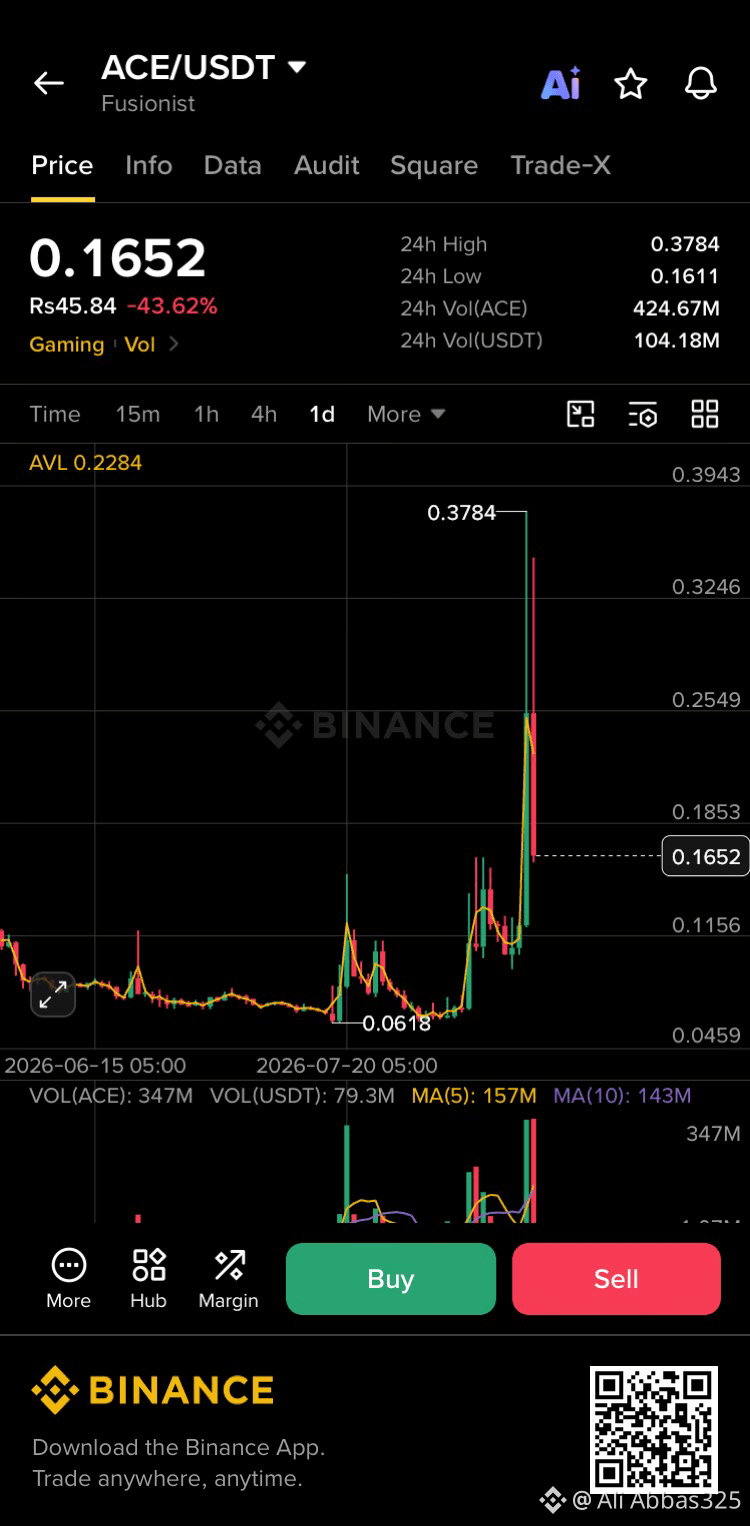
Guys $ACE going too much down Yesterday it was in the Top Gainer list and now it is in the top loser list .
Look at its chart it has Big Pump 📈 and Dump📉
$ACE keypoints:
• Market Cap : $17.78M
• Volume : $434.42M
What do you think will $ACE hit $1 in the next 24 hours ???
Tell me in comments and Follow for more
#ACE #TopLoser #Binance #LMECopperStocksFall42DaysLongestSince2014
{spot}(ACEUSDT)
🚨Market Update🚨
Guys Stop And look here for the latest crypto news🫵🏼🔴🔴🔴🫵🏼
Guys $ACE going too much down Yesterday it was in the Top Gainer list and now it is in the top loser list .
Look at its chart it has Big Pump 📈 and Dump📉
$ACE keypoints:
• Market Cap : $17.78M
• Volume : $434.42M
What do you think will $ACE hit $1 in the next 24 hours ???
Tell me in comments and Follow for more
#ACE #TopLoser #Binance #LMECopperStocksFall42DaysLongestSince2014
Guys Stop And look here for the latest crypto news🫵🏼🔴🔴🔴🫵🏼
Guys $ACE going too much down Yesterday it was in the Top Gainer list and now it is in the top loser list .
Look at its chart it has Big Pump 📈 and Dump📉
$ACE keypoints:
• Market Cap : $17.78M
• Volume : $434.42M
What do you think will $ACE hit $1 in the next 24 hours ???
Tell me in comments and Follow for more
#ACE #TopLoser #Binance #LMECopperStocksFall42DaysLongestSince2014
148

Partly True
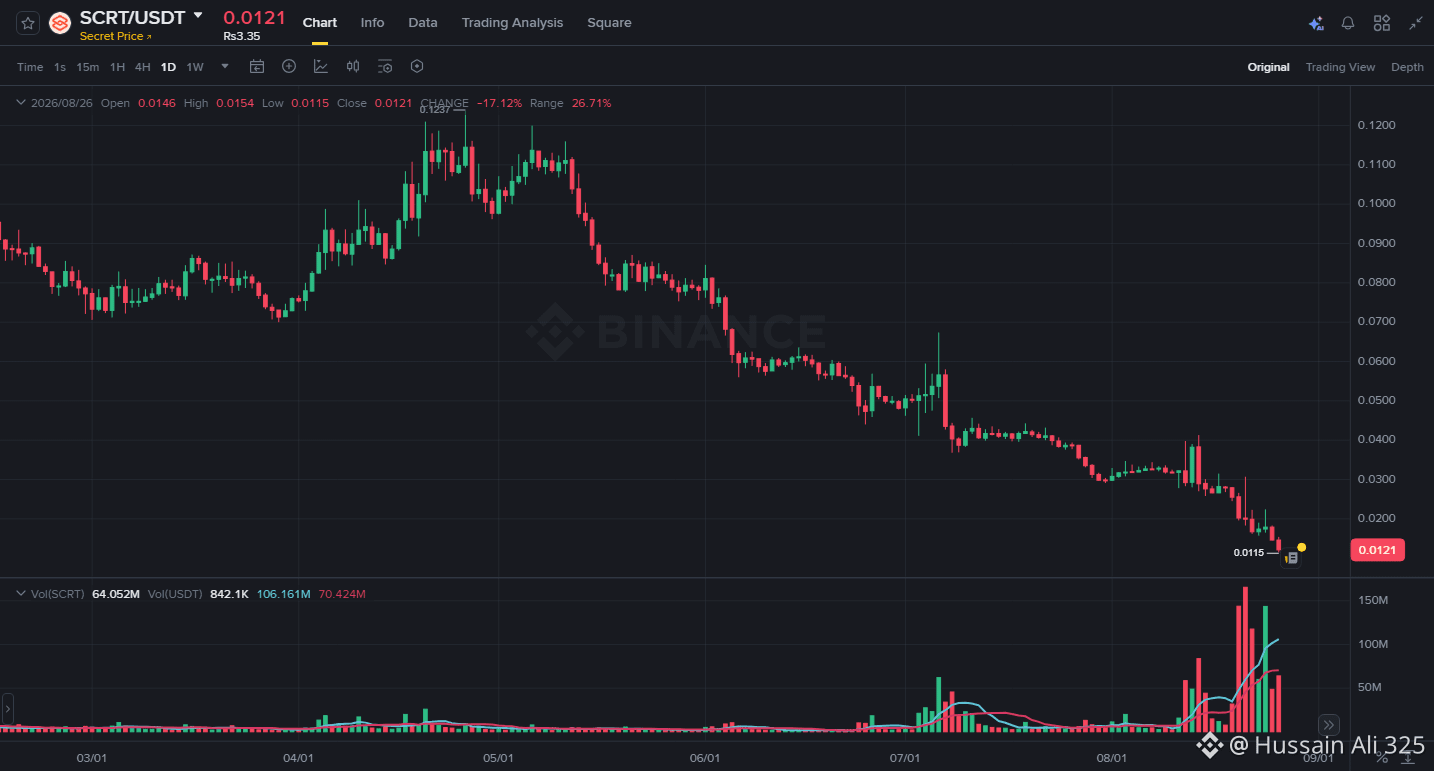
Just opened Binance and saw $SCRT 👀👀
{spot}(SCRTUSDT)
$SCRT is facing huge downfall 📉📉📉with a 24h change of -25.15%. and some points below:
📊Market Cap: $13.64M
🌟Rank : No. 816
📈24h Volume: $7.34M
I think that because of it's going to be delist that's why it's volume decreased so much. What do you think about #scrt ????
Important Note : SCRT/USDT will be delisted at 2026-09-03 08:00 UTC+5, please pay attention to the risks when trading.
Warning : " This token has monitoring tag so it has higher volatile and risks.
#secret #TopLoser #Binance
Just opened Binance and saw $SCRT 👀👀
$SCRT is facing huge downfall 📉📉📉with a 24h change of -25.15%. and some points below:
📊Market Cap: $13.64M
🌟Rank : No. 816
📈24h Volume: $7.34M
I think that because of it's going to be delist that's why it's volume decreased so much. What do you think about #scrt ????
Important Note : SCRT/USDT will be delisted at 2026-09-03 08:00 UTC+5, please pay attention to the risks when trading.
Warning : " This token has monitoring tag so it has higher volatile and risks.
#secret #TopLoser #Binance
$SCRT is facing huge downfall 📉📉📉with a 24h change of -25.15%. and some points below:
📊Market Cap: $13.64M
🌟Rank : No. 816
📈24h Volume: $7.34M
I think that because of it's going to be delist that's why it's volume decreased so much. What do you think about #scrt ????
Important Note : SCRT/USDT will be delisted at 2026-09-03 08:00 UTC+5, please pay attention to the risks when trading.
Warning : " This token has monitoring tag so it has higher volatile and risks.
#secret #TopLoser #Binance
156
·
--
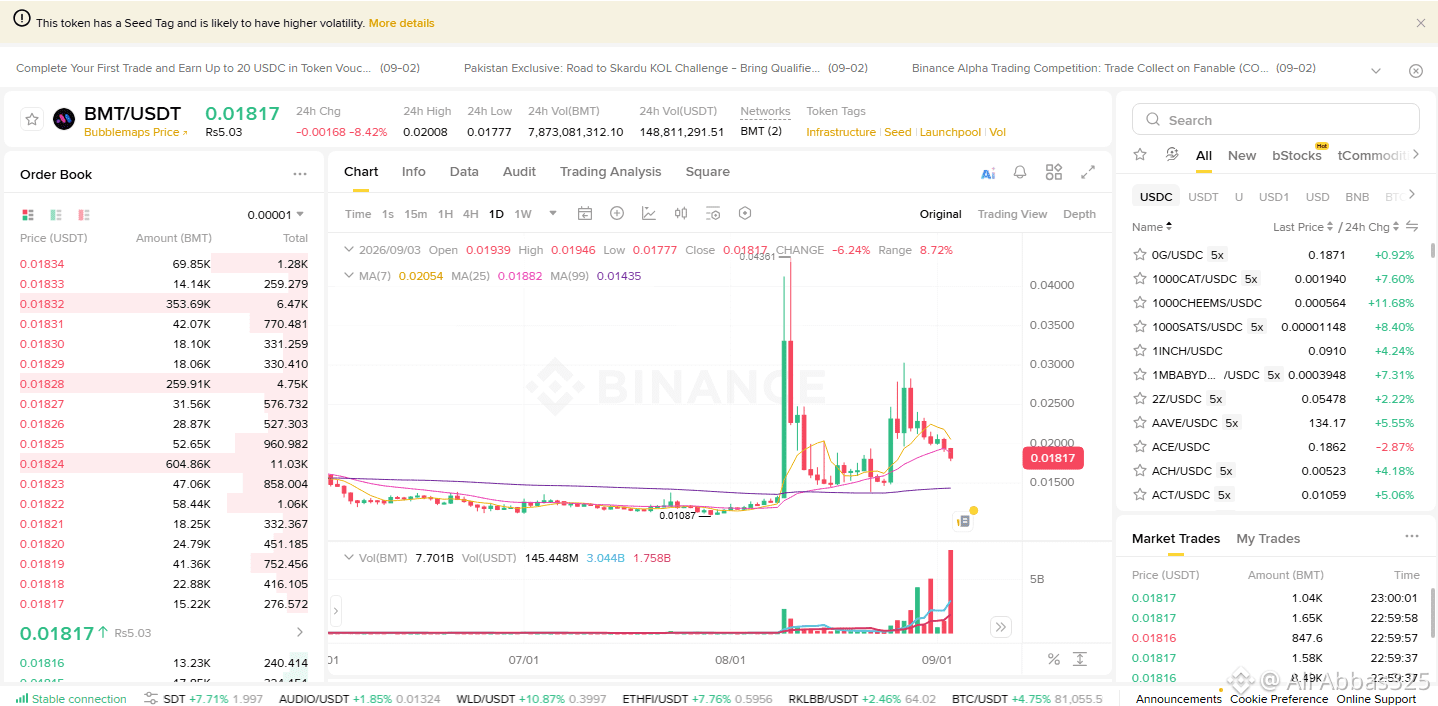
👀🚨Guys look at $BMT 👀🚨.
Where the whole market is bullish 📈📈.$BMT is in the top loser list with a 24h change of -8.42% and with.
Market Cap : $13.28M
Volume : $228.49M
24h High : 0.02008$
24h Low : 0.02008$
What's your opinion about its downfall .📉📉
tell me in commens and follow for more 😎🤩
Note : This token has a seed tag which means it is highly volatile.
#Bubblemaps #TopLoser
{spot}(BMTUSDT)
👀🚨Guys look at $BMT 👀🚨.
Where the whole market is bullish 📈📈.$BMT is in the top loser list with a 24h change of -8.42% and with.
Market Cap : $13.28M
Volume : $228.49M
24h High : 0.02008$
24h Low : 0.02008$
What's your opinion about its downfall .📉📉
tell me in commens and follow for more 😎🤩
Note : This token has a seed tag which means it is highly volatile.
#Bubblemaps #TopLoser
Where the whole market is bullish 📈📈.$BMT is in the top loser list with a 24h change of -8.42% and with.
Market Cap : $13.28M
Volume : $228.49M
24h High : 0.02008$
24h Low : 0.02008$
What's your opinion about its downfall .📉📉
tell me in commens and follow for more 😎🤩
Note : This token has a seed tag which means it is highly volatile.
#Bubblemaps #TopLoser
116
Market Watch and Volatility Check.
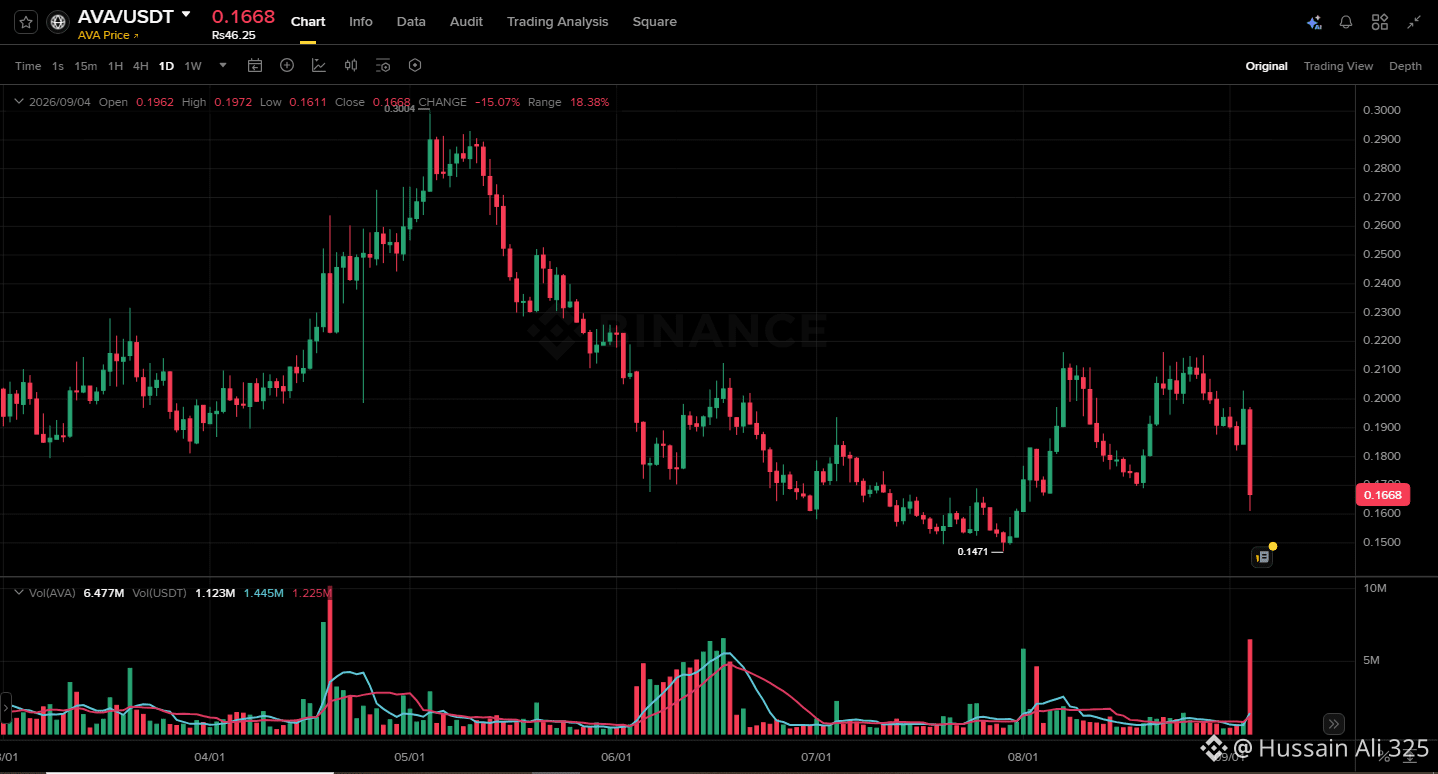
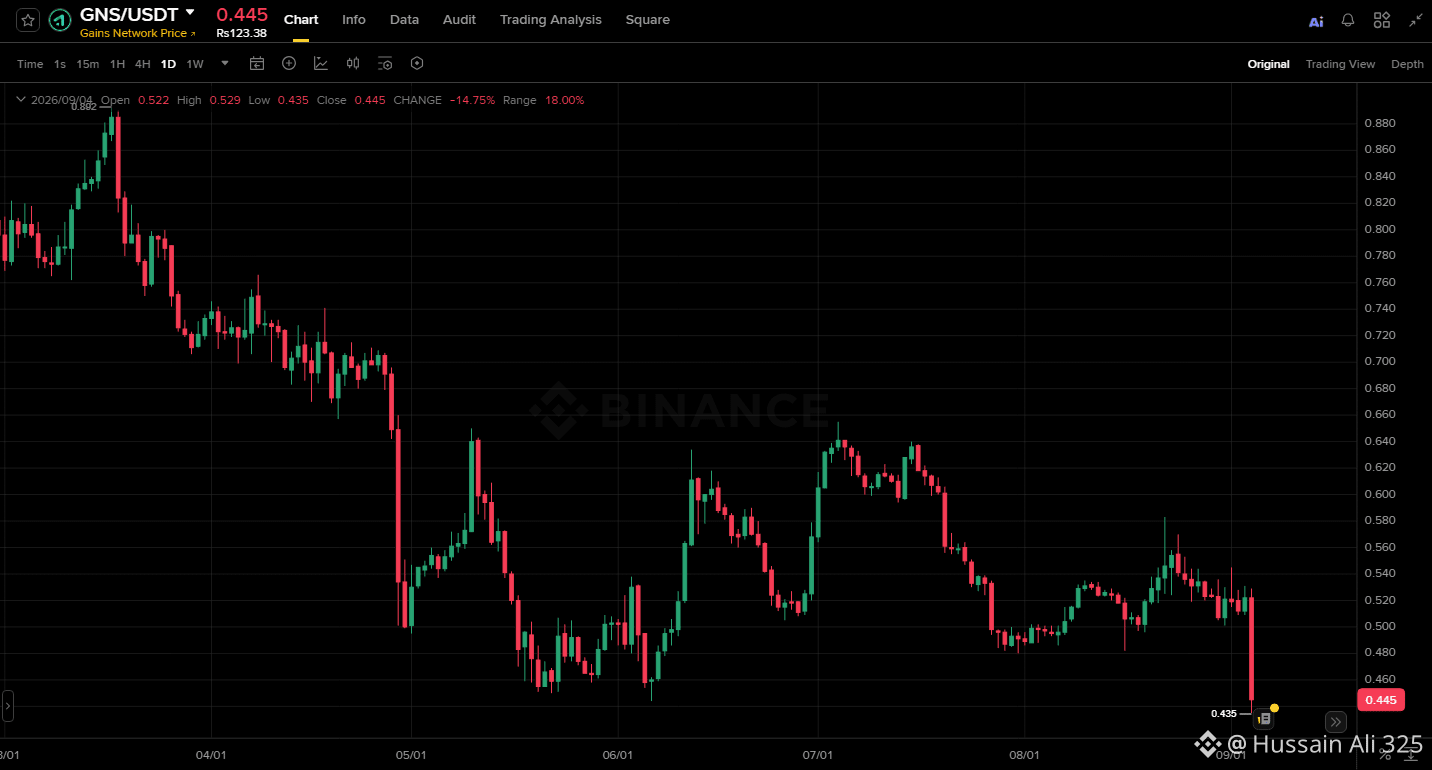
A quick breakdown of today's Fast deceasing tokens:
1️⃣ $GNS dipped -13.49% with $878.51K in 24h trading volume.
2️⃣ $AVA dipped -13.07% with $13.81M in 24h trading volume.
What are your strategies about these two ??
Tell me if you want .
WARNIGN : BOTH HAVE SEED TAGS
#AVA #GNS #TopLoser
{spot}(AVAUSDT)
Market Watch and Volatility Check.
A quick breakdown of today's Fast deceasing tokens:
1️⃣ $GNS dipped -13.49% with $878.51K in 24h trading volume.
2️⃣ $AVA dipped -13.07% with $13.81M in 24h trading volume.
What are your strategies about these two ??
Tell me if you want .
WARNIGN : BOTH HAVE SEED TAGS
#AVA #GNS #TopLoser
A quick breakdown of today's Fast deceasing tokens:
1️⃣ $GNS dipped -13.49% with $878.51K in 24h trading volume.
2️⃣ $AVA dipped -13.07% with $13.81M in 24h trading volume.
What are your strategies about these two ??
Tell me if you want .
WARNIGN : BOTH HAVE SEED TAGS
#AVA #GNS #TopLoser
169
Log in to explore more content
Join global crypto users on Binance Square
⚡️ Get latest and useful information about crypto.
💬 Trusted by the world’s largest crypto exchange.
👍 Discover real insights from verified creators.
Email / Phone number
Trending Topics
1
#NvidiaLoses$2.7TrillionInMonthAndAHalf
23,032 views
143 Discussing
2
#CanBTCReboundAfterFallingBelow60K?
795,453 views
3,046 Discussing
3
#GlobalStocksFaceLongestLosingStreakSince2023
293,694 views
2,038 Discussing
4
#BlackRockIBITPostsRecord$541MSingleDayOutflow
35,859 views
106 Discussing
5
#AnthropicPlungesTowardIPOPriceonDay2
151,254 views
1,236 Discussing
6
#TwentyOneCapitalAdds172.25BTC
69,617 views
682 Discussing
7
#HKBillWouldExcludeTokenizedDepositsFromVirtualAssets
9,375 views
50 Discussing
8
#BNBDropsBelow540USDTWith8.46%DailyDecline
81,204 views
662 Discussing
9
#HKBillProposesHK$100KFineForUnauthorizedCryptoTitles
2,745 views
22 Discussing
10
#BitMineFaces$10.1BUnrealizedETHLoss
5,747 views
28 Discussing