
#tradinganalysis
tradinganalysis
1.5M views
5,789 Discussing
Hot
Latest

·
--
🚨 HEAVY INSTITUTIONAL SELLER DETECTED: $LTCUSDT
AGGRESSIVE ASKS DUMPING INTO LIQUIDITY POOLS. BEARISH CVD DIVERGENCE CONFIRMED ON LOW TIMEFRAMES.
Price rejected violently at key resistance. Overhead supply is swallowing all passive bids while upside liquidity gets swept clean. A decisive downside flush is loading right now.
EXECUTION PLAN:
ENTRY: 42.29 $LTC
SL: 44.22
TP1: 40.35
TP2: 38.45
RR: 1:2
Bids are failing fast. Are we sweeping the local range lows next, or will dip buyers attempt a front-run?
#LTCUSDT #BinanceSquare #SlowSclap #TradingAnalysis
🚨 HEAVY INSTITUTIONAL SELLER DETECTED: $LTCUSDT
AGGRESSIVE ASKS DUMPING INTO LIQUIDITY POOLS. BEARISH CVD DIVERGENCE CONFIRMED ON LOW TIMEFRAMES.
Price rejected violently at key resistance. Overhead supply is swallowing all passive bids while upside liquidity gets swept clean. A decisive downside flush is loading right now.
EXECUTION PLAN:
ENTRY: 42.29 $LTC
SL: 44.22
TP1: 40.35
TP2: 38.45
RR: 1:2
Bids are failing fast. Are we sweeping the local range lows next, or will dip buyers attempt a front-run?
#LTCUSDT #BinanceSquare #SlowSclap #TradingAnalysis
AGGRESSIVE ASKS DUMPING INTO LIQUIDITY POOLS. BEARISH CVD DIVERGENCE CONFIRMED ON LOW TIMEFRAMES.
Price rejected violently at key resistance. Overhead supply is swallowing all passive bids while upside liquidity gets swept clean. A decisive downside flush is loading right now.
EXECUTION PLAN:
ENTRY: 42.29 $LTC
SL: 44.22
TP1: 40.35
TP2: 38.45
RR: 1:2
Bids are failing fast. Are we sweeping the local range lows next, or will dip buyers attempt a front-run?
#LTCUSDT #BinanceSquare #SlowSclap #TradingAnalysis
45

IRYS Market Snapshot: Strong 24-Hour Gain Following an Intraday Pullback
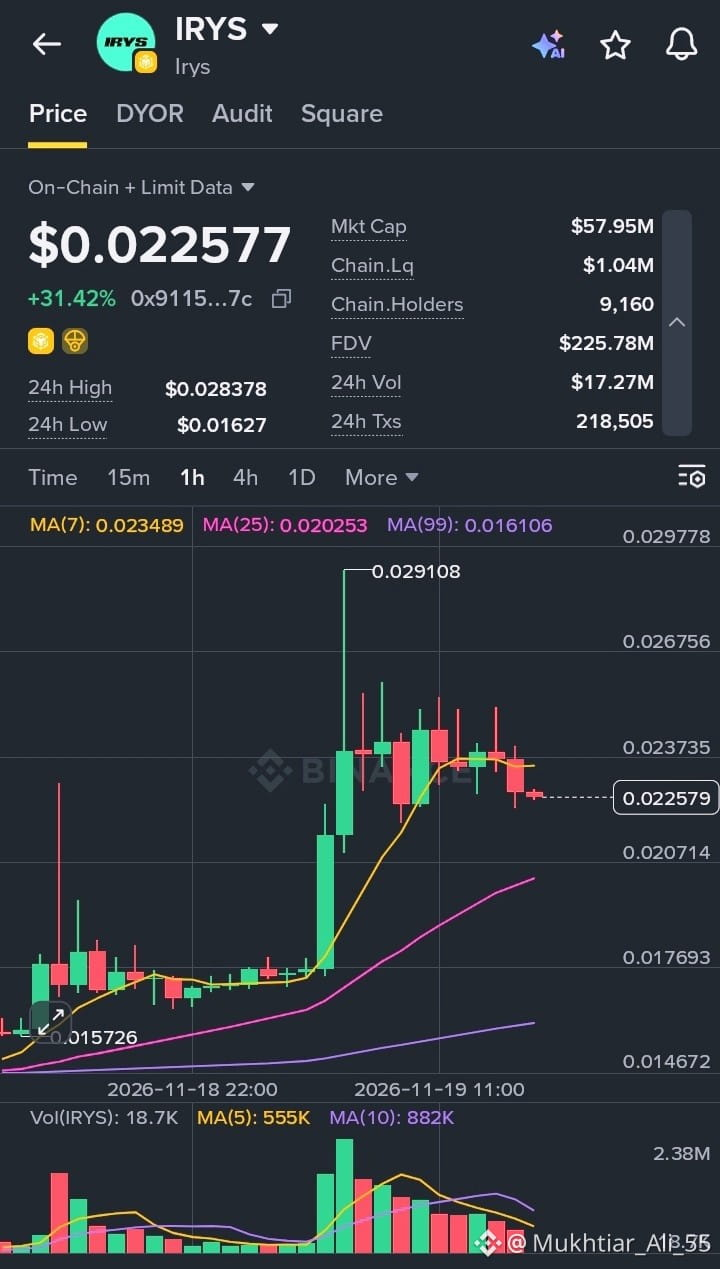
IRYS is trading around $0.022577, up +31.42% over the past 24 hours. On the 1-hour chart, price surged to a local high near 0.029108 before cooling off and consolidating around current levels—sitting just below MA(7) at 0.023489, while holding above MA(25) at 0.020253 and MA(99) at 0.016106.
Over the last 24 hours, price action has spanned from a low of $0.01627 to a high of $0.028378, reflecting strong momentum and active two-way trading.
Key on-chain and market metrics show:
Market Cap: $57.95M
Fully Diluted Valuation (FDV): $225.78M
24h Volume: $17.27M
24h Transactions: 218,505
On-Chain Liquidity: $1.04M
On-Chain Holders: 9,160
With heavy transaction flow and a wide 24-hour range, watching whether price can reclaim the 7-period moving average or hold support near the 25-period moving average will be important. Always do your own research (DYOR) and manage risk carefully in fast-moving markets.
#IRYS #CryptoMarket #OnChainData #Altcoins #TradingAnalysis
$IRYS
{future}(IRYSUSDT)
IRYS Market Snapshot: Strong 24-Hour Gain Following an Intraday Pullback
IRYS is trading around $0.022577, up +31.42% over the past 24 hours. On the 1-hour chart, price surged to a local high near 0.029108 before cooling off and consolidating around current levels—sitting just below MA(7) at 0.023489, while holding above MA(25) at 0.020253 and MA(99) at 0.016106.
Over the last 24 hours, price action has spanned from a low of $0.01627 to a high of $0.028378, reflecting strong momentum and active two-way trading.
Key on-chain and market metrics show:
Market Cap: $57.95M
Fully Diluted Valuation (FDV): $225.78M
24h Volume: $17.27M
24h Transactions: 218,505
On-Chain Liquidity: $1.04M
On-Chain Holders: 9,160
With heavy transaction flow and a wide 24-hour range, watching whether price can reclaim the 7-period moving average or hold support near the 25-period moving average will be important. Always do your own research (DYOR) and manage risk carefully in fast-moving markets.
#IRYS #CryptoMarket #OnChainData #Altcoins #TradingAnalysis
$IRYS
IRYS is trading around $0.022577, up +31.42% over the past 24 hours. On the 1-hour chart, price surged to a local high near 0.029108 before cooling off and consolidating around current levels—sitting just below MA(7) at 0.023489, while holding above MA(25) at 0.020253 and MA(99) at 0.016106.
Over the last 24 hours, price action has spanned from a low of $0.01627 to a high of $0.028378, reflecting strong momentum and active two-way trading.
Key on-chain and market metrics show:
Market Cap: $57.95M
Fully Diluted Valuation (FDV): $225.78M
24h Volume: $17.27M
24h Transactions: 218,505
On-Chain Liquidity: $1.04M
On-Chain Holders: 9,160
With heavy transaction flow and a wide 24-hour range, watching whether price can reclaim the 7-period moving average or hold support near the 25-period moving average will be important. Always do your own research (DYOR) and manage risk carefully in fast-moving markets.
#IRYS #CryptoMarket #OnChainData #Altcoins #TradingAnalysis
$IRYS
1
77
Impossible Cloud Network (ICNT) Market Snapshot: Strong Breakout Rally Testing Intraday Highs
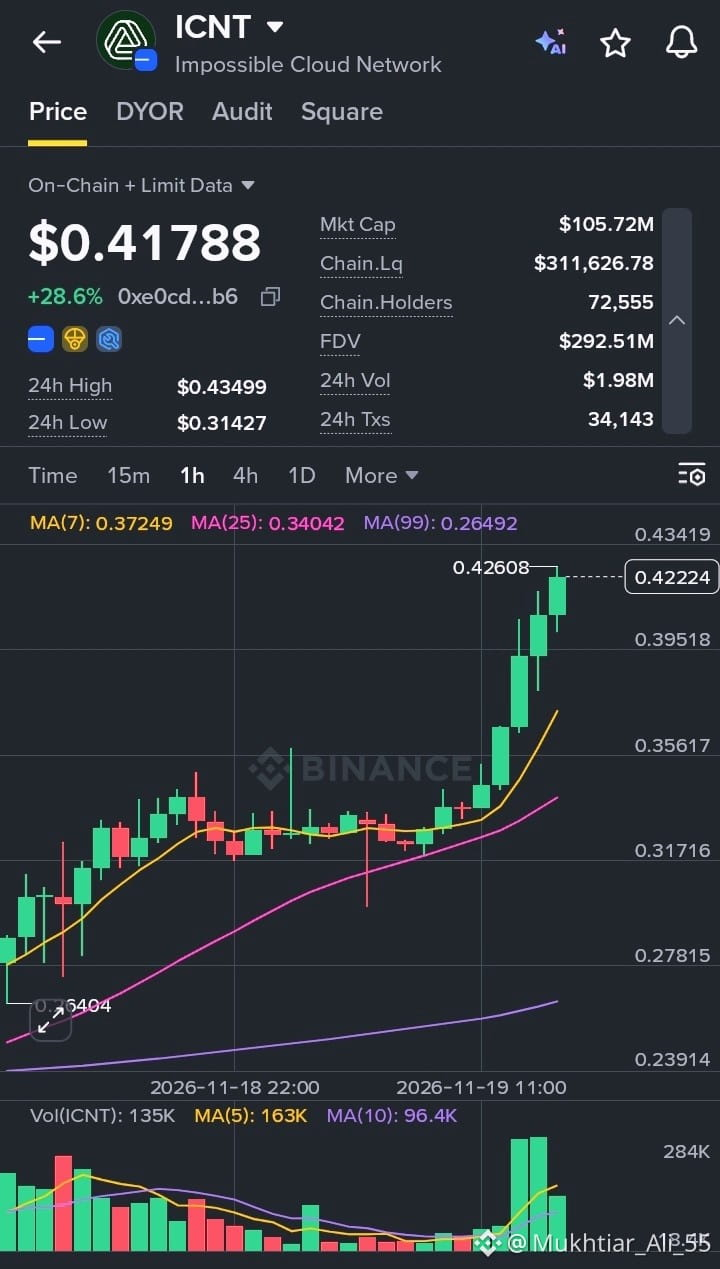
Impossible Cloud Network (ICNT) is trading around $0.41788, surging +28.6% over the past 24 hours. On the 1-hour chart, price action broke out sharply from a consolidation base near 0.26404 to reach a local peak of 0.42608—trading well above all three key moving averages: MA(7) at 0.37249, MA(25) at 0.34042, and MA(99) at 0.26492.
Over the last 24 hours, ICNT has moved within a wide range between a low of $0.31427 and a high of $0.43499, backed by a noticeable pickup in green hourly volume bars as buyers pushed price toward new local highs.
Key on-chain and market metrics show:
Market Cap: $105.72M
Fully Diluted Valuation (FDV): $292.51M
24h Volume: $1.98M
24h Transactions: 34,143
On-Chain Liquidity: $311,626.78
On-Chain Holders: 72,555
With strong upward momentum extending well above the 7-period moving average, traders will be watching how price reacts around the $0.426–$0.435 resistance zone and whether any pullback finds support closer to $0.372–$0.395. Always do your own research (DYOR) and manage risk carefully in fast-moving markets.
#ImpossibleCloudNetwork #ICNT #CryptoMarket #OnChainData #TradingAnalysis
$ICNT
{future}(ICNTUSDT)
Impossible Cloud Network (ICNT) Market Snapshot: Strong Breakout Rally Testing Intraday Highs
Impossible Cloud Network (ICNT) is trading around $0.41788, surging +28.6% over the past 24 hours. On the 1-hour chart, price action broke out sharply from a consolidation base near 0.26404 to reach a local peak of 0.42608—trading well above all three key moving averages: MA(7) at 0.37249, MA(25) at 0.34042, and MA(99) at 0.26492.
Over the last 24 hours, ICNT has moved within a wide range between a low of $0.31427 and a high of $0.43499, backed by a noticeable pickup in green hourly volume bars as buyers pushed price toward new local highs.
Key on-chain and market metrics show:
Market Cap: $105.72M
Fully Diluted Valuation (FDV): $292.51M
24h Volume: $1.98M
24h Transactions: 34,143
On-Chain Liquidity: $311,626.78
On-Chain Holders: 72,555
With strong upward momentum extending well above the 7-period moving average, traders will be watching how price reacts around the $0.426–$0.435 resistance zone and whether any pullback finds support closer to $0.372–$0.395. Always do your own research (DYOR) and manage risk carefully in fast-moving markets.
#ImpossibleCloudNetwork #ICNT #CryptoMarket #OnChainData #TradingAnalysis
$ICNT
Impossible Cloud Network (ICNT) is trading around $0.41788, surging +28.6% over the past 24 hours. On the 1-hour chart, price action broke out sharply from a consolidation base near 0.26404 to reach a local peak of 0.42608—trading well above all three key moving averages: MA(7) at 0.37249, MA(25) at 0.34042, and MA(99) at 0.26492.
Over the last 24 hours, ICNT has moved within a wide range between a low of $0.31427 and a high of $0.43499, backed by a noticeable pickup in green hourly volume bars as buyers pushed price toward new local highs.
Key on-chain and market metrics show:
Market Cap: $105.72M
Fully Diluted Valuation (FDV): $292.51M
24h Volume: $1.98M
24h Transactions: 34,143
On-Chain Liquidity: $311,626.78
On-Chain Holders: 72,555
With strong upward momentum extending well above the 7-period moving average, traders will be watching how price reacts around the $0.426–$0.435 resistance zone and whether any pullback finds support closer to $0.372–$0.395. Always do your own research (DYOR) and manage risk carefully in fast-moving markets.
#ImpossibleCloudNetwork #ICNT #CryptoMarket #OnChainData #TradingAnalysis
$ICNT
3
DAPPOS (DOS) Market Snapshot: Steady Uptrend Testing Intraday Resistance
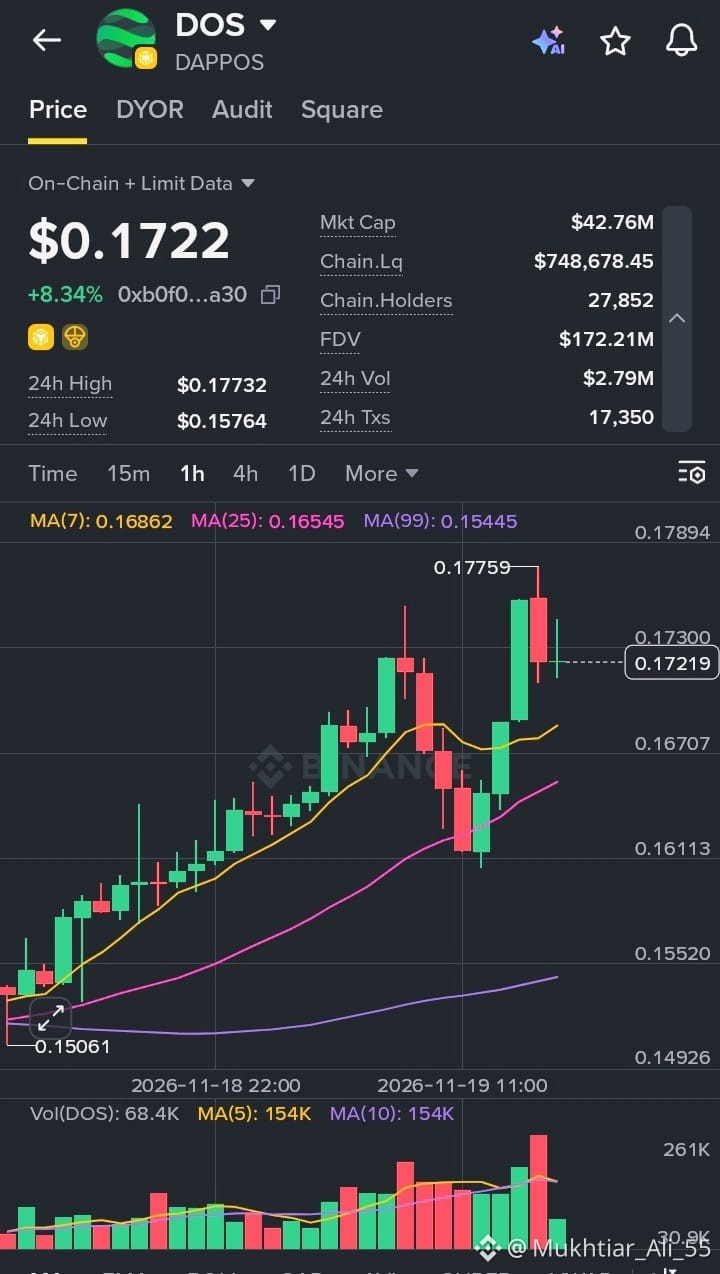
DAPPOS (DOS) is trading around $0.1722, recording an +8.34% gain over the past 24 hours. On the 1-hour chart, price action has climbed steadily from a swing low near 0.15061 to test a local peak of 0.17759—holding comfortably above all three key trend indicators: MA(7) at 0.16862, MA(25) at 0.16545, and MA(99) at 0.15445.
Over the last 24 hours, DOS has moved within a structured range between a low of $0.15764 and a high of $0.17732, showing consistent buyer demand on pullbacks as higher lows continue to form.
Key on-chain and market metrics show:
Market Cap: $42.76M
Fully Diluted Valuation (FDV): $172.21M
24h Volume: $2.79M
24h Transactions: 17,350
On-Chain Liquidity: $748,678.45
On-Chain Holders: 27,852
With moving averages aligned in a bullish stack and price consolidating just below its 24-hour high, traders will be watching whether support holds around the $0.168–$0.170 zone for another attempt at breaking past $0.1776. Always do your own research (DYOR) and manage risk carefully in active markets.
#DAPPOS #DOS #CryptoMarket #OnChainData #TradingAnalysis
$DOS
{future}(DOSUSDT)
DAPPOS (DOS) Market Snapshot: Steady Uptrend Testing Intraday Resistance
DAPPOS (DOS) is trading around $0.1722, recording an +8.34% gain over the past 24 hours. On the 1-hour chart, price action has climbed steadily from a swing low near 0.15061 to test a local peak of 0.17759—holding comfortably above all three key trend indicators: MA(7) at 0.16862, MA(25) at 0.16545, and MA(99) at 0.15445.
Over the last 24 hours, DOS has moved within a structured range between a low of $0.15764 and a high of $0.17732, showing consistent buyer demand on pullbacks as higher lows continue to form.
Key on-chain and market metrics show:
Market Cap: $42.76M
Fully Diluted Valuation (FDV): $172.21M
24h Volume: $2.79M
24h Transactions: 17,350
On-Chain Liquidity: $748,678.45
On-Chain Holders: 27,852
With moving averages aligned in a bullish stack and price consolidating just below its 24-hour high, traders will be watching whether support holds around the $0.168–$0.170 zone for another attempt at breaking past $0.1776. Always do your own research (DYOR) and manage risk carefully in active markets.
#DAPPOS #DOS #CryptoMarket #OnChainData #TradingAnalysis
$DOS
DAPPOS (DOS) is trading around $0.1722, recording an +8.34% gain over the past 24 hours. On the 1-hour chart, price action has climbed steadily from a swing low near 0.15061 to test a local peak of 0.17759—holding comfortably above all three key trend indicators: MA(7) at 0.16862, MA(25) at 0.16545, and MA(99) at 0.15445.
Over the last 24 hours, DOS has moved within a structured range between a low of $0.15764 and a high of $0.17732, showing consistent buyer demand on pullbacks as higher lows continue to form.
Key on-chain and market metrics show:
Market Cap: $42.76M
Fully Diluted Valuation (FDV): $172.21M
24h Volume: $2.79M
24h Transactions: 17,350
On-Chain Liquidity: $748,678.45
On-Chain Holders: 27,852
With moving averages aligned in a bullish stack and price consolidating just below its 24-hour high, traders will be watching whether support holds around the $0.168–$0.170 zone for another attempt at breaking past $0.1776. Always do your own research (DYOR) and manage risk carefully in active markets.
#DAPPOS #DOS #CryptoMarket #OnChainData #TradingAnalysis
$DOS
4
Venice Token (VVV) Market Snapshot: Steady Uptrend Consolidating Near 24-Hour Highs
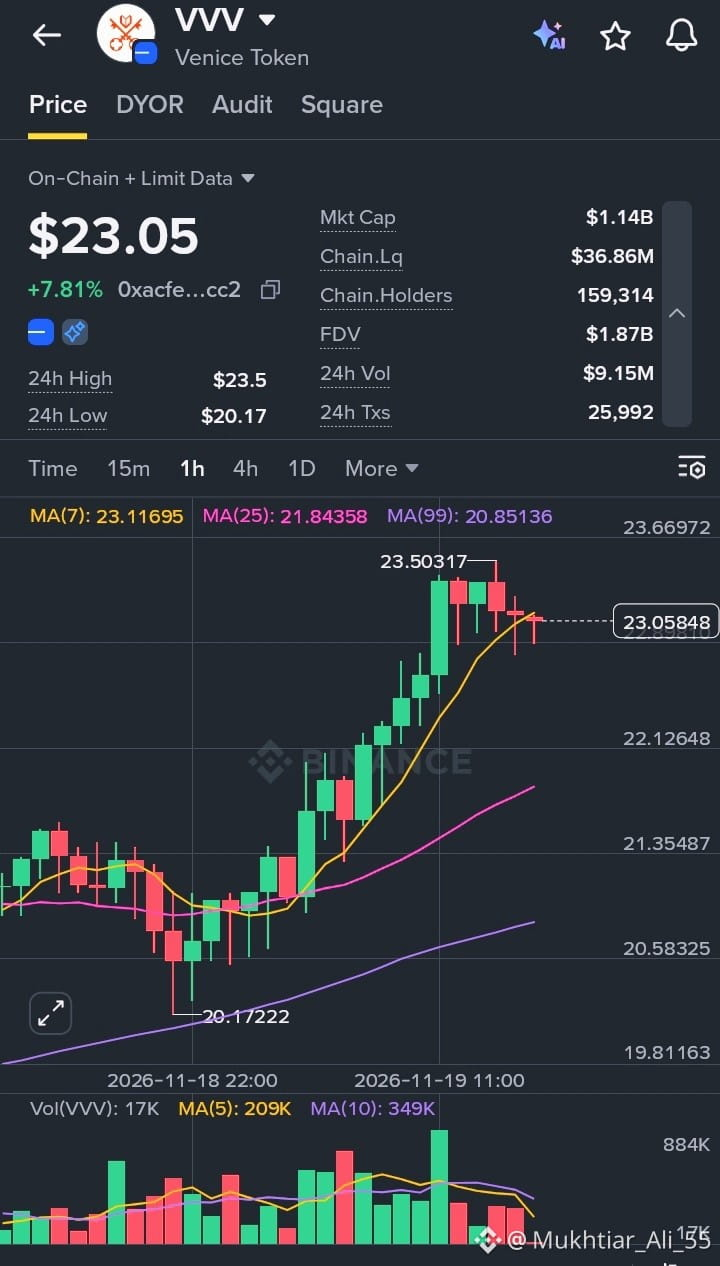
Venice Token (VVV) is trading around $23.05, recording a +7.81% gain over the past 24 hours. On the 1-hour chart, price rallied from a swing low near 20.17222 up to a local peak of 23.50317 before entering a tight consolidation phase—hovering right around MA(7) at 23.11695, while staying well above MA(25) at 21.84358 and MA(99) at 20.85136.
Over the last 24 hours, VVV has traded within a structured range between a low of $20.17 and a high of $23.5, showing sustained upward momentum with relatively controlled volatility compared to sharper altcoin swings.
Key on-chain and market metrics show:
Market Cap: $1.14B
Fully Diluted Valuation (FDV): $1.87B
24h Volume: $9.15M
24h Transactions: 25,992
On-Chain Liquidity: $36.86M
On-Chain Holders: 159,314
With deep on-chain liquidity and price consolidating just below its 24-hour high, traders will be watching whether VVV can hold the $23.00 zone and break cleanly past $23.50. Always do your own research (DYOR) and manage risk carefully in active markets.
#VeniceToken #VVV #CryptoMarket #OnChainData #TradingAnalysis
$VVV
{future}(VVVUSDT)
Venice Token (VVV) Market Snapshot: Steady Uptrend Consolidating Near 24-Hour Highs
Venice Token (VVV) is trading around $23.05, recording a +7.81% gain over the past 24 hours. On the 1-hour chart, price rallied from a swing low near 20.17222 up to a local peak of 23.50317 before entering a tight consolidation phase—hovering right around MA(7) at 23.11695, while staying well above MA(25) at 21.84358 and MA(99) at 20.85136.
Over the last 24 hours, VVV has traded within a structured range between a low of $20.17 and a high of $23.5, showing sustained upward momentum with relatively controlled volatility compared to sharper altcoin swings.
Key on-chain and market metrics show:
Market Cap: $1.14B
Fully Diluted Valuation (FDV): $1.87B
24h Volume: $9.15M
24h Transactions: 25,992
On-Chain Liquidity: $36.86M
On-Chain Holders: 159,314
With deep on-chain liquidity and price consolidating just below its 24-hour high, traders will be watching whether VVV can hold the $23.00 zone and break cleanly past $23.50. Always do your own research (DYOR) and manage risk carefully in active markets.
#VeniceToken #VVV #CryptoMarket #OnChainData #TradingAnalysis
$VVV
Venice Token (VVV) is trading around $23.05, recording a +7.81% gain over the past 24 hours. On the 1-hour chart, price rallied from a swing low near 20.17222 up to a local peak of 23.50317 before entering a tight consolidation phase—hovering right around MA(7) at 23.11695, while staying well above MA(25) at 21.84358 and MA(99) at 20.85136.
Over the last 24 hours, VVV has traded within a structured range between a low of $20.17 and a high of $23.5, showing sustained upward momentum with relatively controlled volatility compared to sharper altcoin swings.
Key on-chain and market metrics show:
Market Cap: $1.14B
Fully Diluted Valuation (FDV): $1.87B
24h Volume: $9.15M
24h Transactions: 25,992
On-Chain Liquidity: $36.86M
On-Chain Holders: 159,314
With deep on-chain liquidity and price consolidating just below its 24-hour high, traders will be watching whether VVV can hold the $23.00 zone and break cleanly past $23.50. Always do your own research (DYOR) and manage risk carefully in active markets.
#VeniceToken #VVV #CryptoMarket #OnChainData #TradingAnalysis
$VVV
1
32
Based (BASED) Market Snapshot: Steady Climb Holding Near Intraday Highs
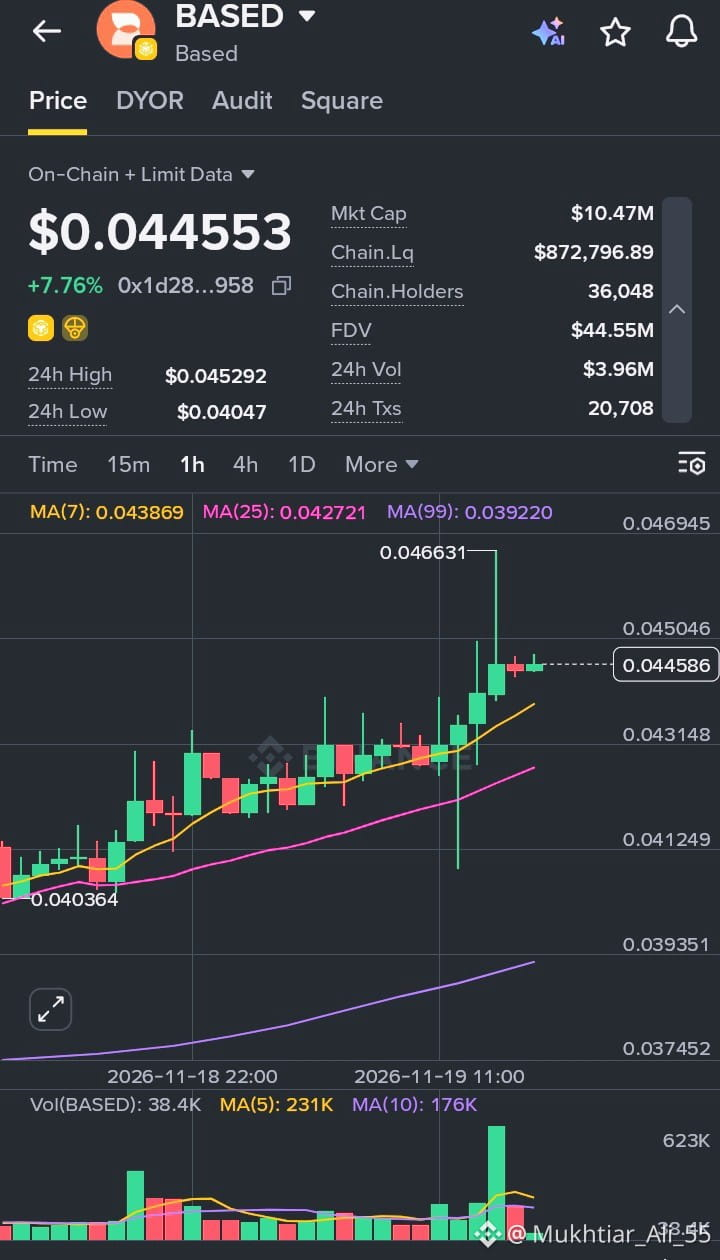
Based (BASED) is trading around $0.044553, posting a +7.76% gain over the past 24 hours. On the 1-hour chart, price action pushed up from a base near 0.040364 to test a local peak of 0.046631 before settling into a tight consolidation—holding comfortably above all three key moving averages: MA(7) at 0.043869, MA(25) at 0.042721, and MA(99) at 0.039220.
Over the last 24 hours, BASED has traded within a structured range between a low of $0.04047 and a high of $0.045292, showing steady buyer support on dips and gradual upward momentum.
Key on-chain and market metrics show:
Market Cap: $10.47M
Fully Diluted Valuation (FDV): $44.55M
24h Volume: $3.96M
24h Transactions: 20,708
On-Chain Liquidity: $872,796.89
On-Chain Holders: 36,048
With price holding above the 7-period moving average and trading close to its 24-hour high, traders will be watching whether support holds around the $0.0438–$0.0440 zone for another test of the $0.0453–$0.0466 resistance area. Always do your own research (DYOR) and manage risk carefully in active markets.
#Based #BASED #CryptoMarket #OnChainData #TradingAnalysis
$BASED
{future}(BASEDUSDT)
Based (BASED) Market Snapshot: Steady Climb Holding Near Intraday Highs
Based (BASED) is trading around $0.044553, posting a +7.76% gain over the past 24 hours. On the 1-hour chart, price action pushed up from a base near 0.040364 to test a local peak of 0.046631 before settling into a tight consolidation—holding comfortably above all three key moving averages: MA(7) at 0.043869, MA(25) at 0.042721, and MA(99) at 0.039220.
Over the last 24 hours, BASED has traded within a structured range between a low of $0.04047 and a high of $0.045292, showing steady buyer support on dips and gradual upward momentum.
Key on-chain and market metrics show:
Market Cap: $10.47M
Fully Diluted Valuation (FDV): $44.55M
24h Volume: $3.96M
24h Transactions: 20,708
On-Chain Liquidity: $872,796.89
On-Chain Holders: 36,048
With price holding above the 7-period moving average and trading close to its 24-hour high, traders will be watching whether support holds around the $0.0438–$0.0440 zone for another test of the $0.0453–$0.0466 resistance area. Always do your own research (DYOR) and manage risk carefully in active markets.
#Based #BASED #CryptoMarket #OnChainData #TradingAnalysis
$BASED
Based (BASED) is trading around $0.044553, posting a +7.76% gain over the past 24 hours. On the 1-hour chart, price action pushed up from a base near 0.040364 to test a local peak of 0.046631 before settling into a tight consolidation—holding comfortably above all three key moving averages: MA(7) at 0.043869, MA(25) at 0.042721, and MA(99) at 0.039220.
Over the last 24 hours, BASED has traded within a structured range between a low of $0.04047 and a high of $0.045292, showing steady buyer support on dips and gradual upward momentum.
Key on-chain and market metrics show:
Market Cap: $10.47M
Fully Diluted Valuation (FDV): $44.55M
24h Volume: $3.96M
24h Transactions: 20,708
On-Chain Liquidity: $872,796.89
On-Chain Holders: 36,048
With price holding above the 7-period moving average and trading close to its 24-hour high, traders will be watching whether support holds around the $0.0438–$0.0440 zone for another test of the $0.0453–$0.0466 resistance area. Always do your own research (DYOR) and manage risk carefully in active markets.
#Based #BASED #CryptoMarket #OnChainData #TradingAnalysis
$BASED
16
Bitway (BTW) Market Snapshot: Bullish Momentum Holds Above Key Moving Averages
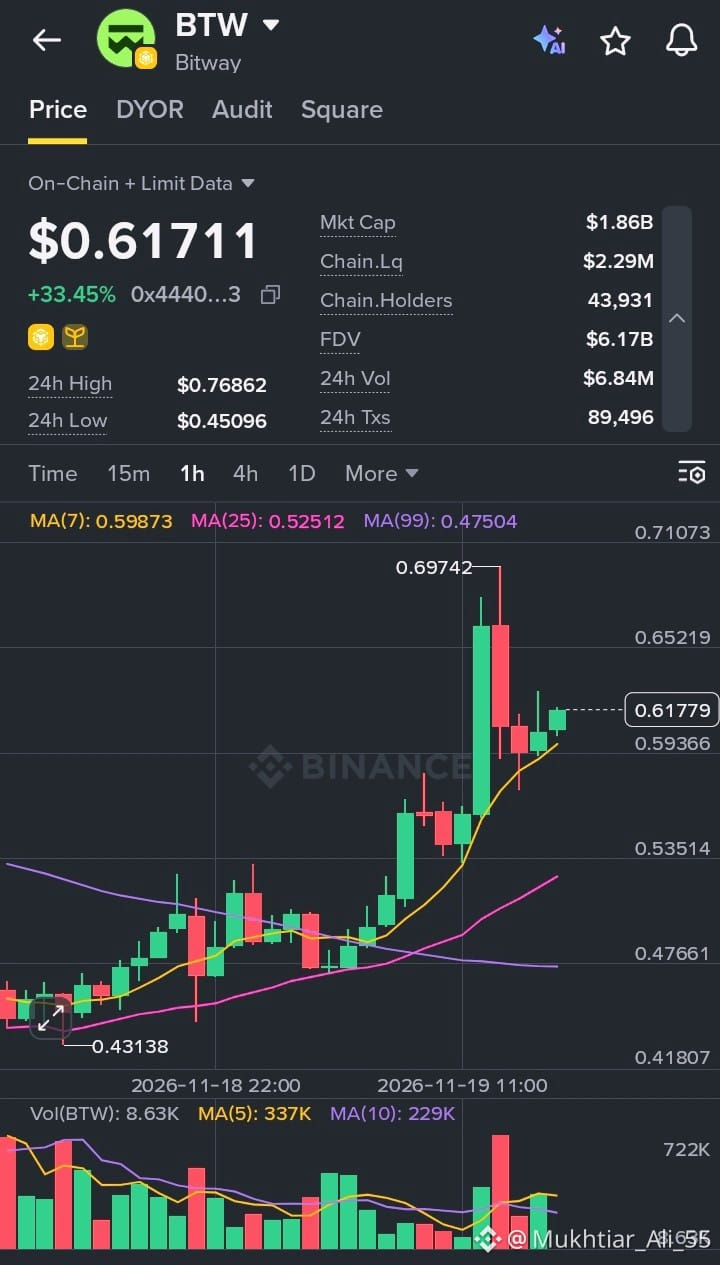
Bitway (BTW) is trading around $0.61711, marking a +33.45% gain over the past 24 hours. On the 1-hour chart, price action climbed from a base near 0.43138 to a local peak at 0.69742 before pulling back slightly to stabilize above its key trend indicators—MA(7) at 0.59873, MA(25) at 0.52512, and MA(99) at 0.47504.
Over the last 24 hours, BTW has moved within a range between a low of $0.45096 and a high of $0.76862, highlighting strong upward momentum alongside healthy intraday volatility.
Key on-chain and market metrics show:
Market Cap: $1.86B
Fully Diluted Valuation (FDV): $6.17B
24h Volume: $6.84M
24h Transactions: 89,496
On-Chain Liquidity: $2.29M
On-Chain Holders: 43,931
With price holding above the 7-period moving average after a sharp rally, traders will be watching to see if support holds near the $0.60 zone for another push higher. Always do your own research (DYOR) and manage risk carefully in volatile markets.
#Bitway #BTW #CryptoMarket #OnChainData #TradingAnalysis
$BTW
{future}(BTWUSDT)
Bitway (BTW) Market Snapshot: Bullish Momentum Holds Above Key Moving Averages
Bitway (BTW) is trading around $0.61711, marking a +33.45% gain over the past 24 hours. On the 1-hour chart, price action climbed from a base near 0.43138 to a local peak at 0.69742 before pulling back slightly to stabilize above its key trend indicators—MA(7) at 0.59873, MA(25) at 0.52512, and MA(99) at 0.47504.
Over the last 24 hours, BTW has moved within a range between a low of $0.45096 and a high of $0.76862, highlighting strong upward momentum alongside healthy intraday volatility.
Key on-chain and market metrics show:
Market Cap: $1.86B
Fully Diluted Valuation (FDV): $6.17B
24h Volume: $6.84M
24h Transactions: 89,496
On-Chain Liquidity: $2.29M
On-Chain Holders: 43,931
With price holding above the 7-period moving average after a sharp rally, traders will be watching to see if support holds near the $0.60 zone for another push higher. Always do your own research (DYOR) and manage risk carefully in volatile markets.
#Bitway #BTW #CryptoMarket #OnChainData #TradingAnalysis
$BTW
Bitway (BTW) is trading around $0.61711, marking a +33.45% gain over the past 24 hours. On the 1-hour chart, price action climbed from a base near 0.43138 to a local peak at 0.69742 before pulling back slightly to stabilize above its key trend indicators—MA(7) at 0.59873, MA(25) at 0.52512, and MA(99) at 0.47504.
Over the last 24 hours, BTW has moved within a range between a low of $0.45096 and a high of $0.76862, highlighting strong upward momentum alongside healthy intraday volatility.
Key on-chain and market metrics show:
Market Cap: $1.86B
Fully Diluted Valuation (FDV): $6.17B
24h Volume: $6.84M
24h Transactions: 89,496
On-Chain Liquidity: $2.29M
On-Chain Holders: 43,931
With price holding above the 7-period moving average after a sharp rally, traders will be watching to see if support holds near the $0.60 zone for another push higher. Always do your own research (DYOR) and manage risk carefully in volatile markets.
#Bitway #BTW #CryptoMarket #OnChainData #TradingAnalysis
$BTW
1
49
EVAA Market Snapshot: Strong Activity Amid Wide 24-Hour Volatility
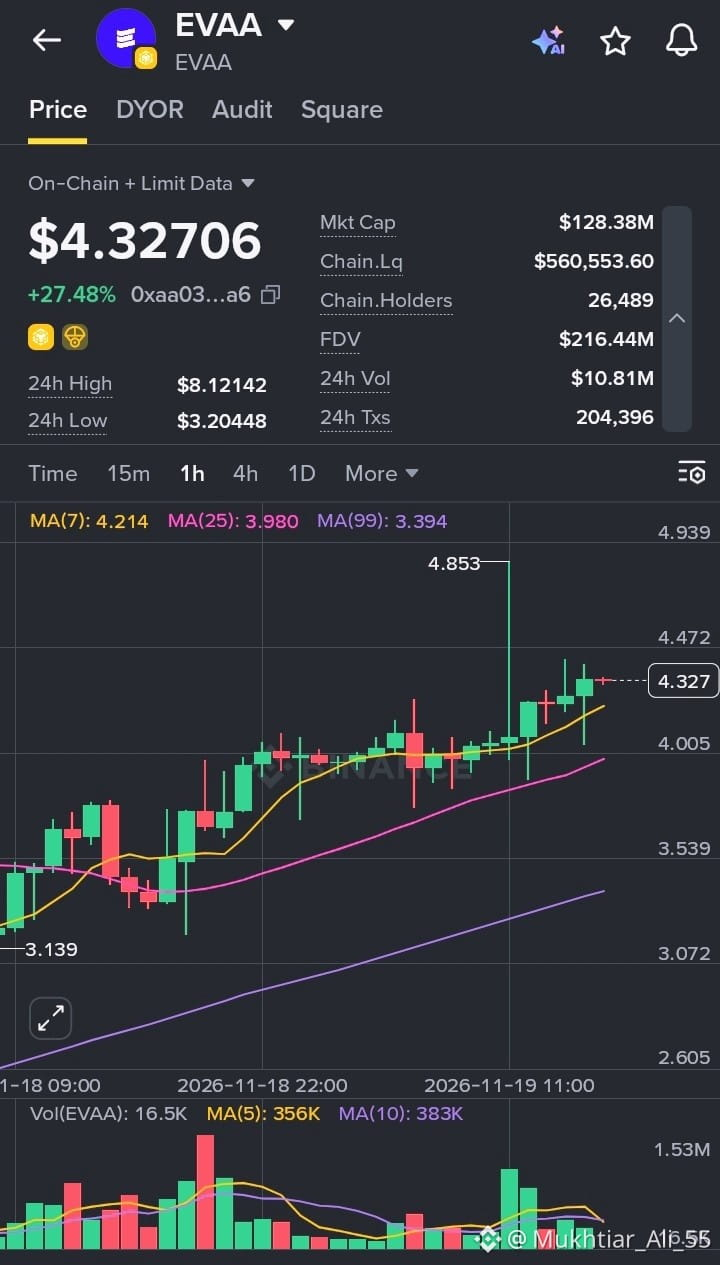
EVAA is trading around $4.32706, up +27.48% over the past 24 hours. On the 1-hour chart, price action has pushed above the short- and medium-term moving averages—MA(7) at 4.214, MA(25) at 3.980, and MA(99) at 3.394—after touching a local spike near 4.853 before settling near current levels.
The trading range over the last 24 hours has been wide, stretching from a low of $3.20448 to a high of $8.12142, which highlights sharp swings and active participation.
Key on-chain and market metrics show:
Market Cap: $128.38M
Fully Diluted Valuation (FDV): $216.44M
24h Volume: $10.81M
24h Transactions: 204,396
On-Chain Liquidity: $560,553.60
On-Chain Holders: 26,489
With high transaction counts and noticeable intraday swings, keeping an eye on how price holds above the moving averages and manages liquidity will be key. Always do your own research (DYOR) and manage risk carefully in volatile markets.
#EVAA #CryptoMarket #OnChainData #Altcoins #TradingAnalysis
$EVAA
{future}(EVAAUSDT)
EVAA Market Snapshot: Strong Activity Amid Wide 24-Hour Volatility
EVAA is trading around $4.32706, up +27.48% over the past 24 hours. On the 1-hour chart, price action has pushed above the short- and medium-term moving averages—MA(7) at 4.214, MA(25) at 3.980, and MA(99) at 3.394—after touching a local spike near 4.853 before settling near current levels.
The trading range over the last 24 hours has been wide, stretching from a low of $3.20448 to a high of $8.12142, which highlights sharp swings and active participation.
Key on-chain and market metrics show:
Market Cap: $128.38M
Fully Diluted Valuation (FDV): $216.44M
24h Volume: $10.81M
24h Transactions: 204,396
On-Chain Liquidity: $560,553.60
On-Chain Holders: 26,489
With high transaction counts and noticeable intraday swings, keeping an eye on how price holds above the moving averages and manages liquidity will be key. Always do your own research (DYOR) and manage risk carefully in volatile markets.
#EVAA #CryptoMarket #OnChainData #Altcoins #TradingAnalysis
$EVAA
EVAA is trading around $4.32706, up +27.48% over the past 24 hours. On the 1-hour chart, price action has pushed above the short- and medium-term moving averages—MA(7) at 4.214, MA(25) at 3.980, and MA(99) at 3.394—after touching a local spike near 4.853 before settling near current levels.
The trading range over the last 24 hours has been wide, stretching from a low of $3.20448 to a high of $8.12142, which highlights sharp swings and active participation.
Key on-chain and market metrics show:
Market Cap: $128.38M
Fully Diluted Valuation (FDV): $216.44M
24h Volume: $10.81M
24h Transactions: 204,396
On-Chain Liquidity: $560,553.60
On-Chain Holders: 26,489
With high transaction counts and noticeable intraday swings, keeping an eye on how price holds above the moving averages and manages liquidity will be key. Always do your own research (DYOR) and manage risk carefully in volatile markets.
#EVAA #CryptoMarket #OnChainData #Altcoins #TradingAnalysis
$EVAA
1
84
Janction (JCT) Market Snapshot: Steady Recovery Testing Higher Resistance
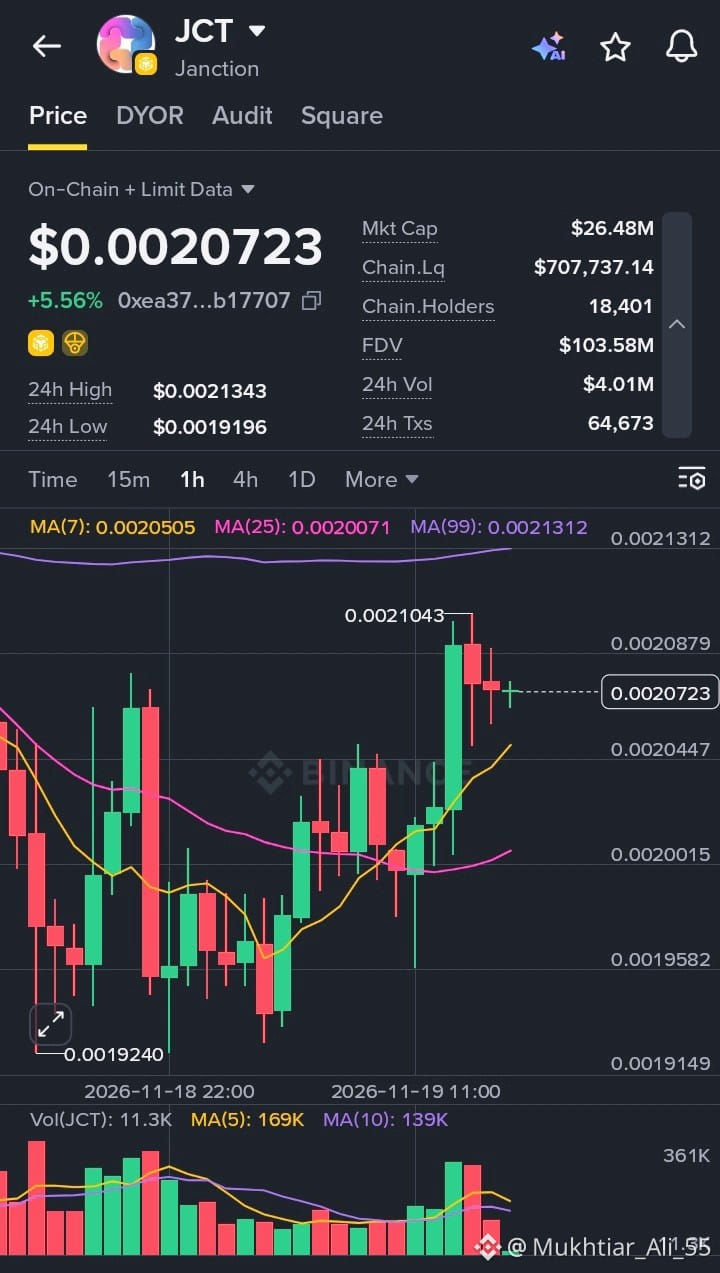
Janction (JCT) is trading around $0.0020723, posting a +5.56% gain over the past 24 hours. On the 1-hour chart, price rebounded from a swing low near 0.0019240 to reach a local high of 0.0021043—currently holding above both MA(7) at 0.0020505 and MA(25) at 0.0020071, while sitting just below MA(99) at 0.0021312.
Over the last 24 hours, JCT has traded within a range between a low of $0.0019196 and a high of $0.0021343, showing steady upward recovery as buyers step in near lower support levels.
Key on-chain and market metrics show:
Market Cap: $26.48M
Fully Diluted Valuation (FDV): $103.58M
24h Volume: $4.01M
24h Transactions: 64,673
On-Chain Liquidity: $707,737.14
On-Chain Holders: 18,401
With short-term moving averages turning supportive and price approaching the 99-period moving average, traders will be watching whether JCT can break cleanly above the $0.00213 resistance zone. Always do your own research (DYOR) and manage risk carefully in active markets.
#Janction #JCT #CryptoMarket #OnChainData #TradingAnalysis
$JCT
{future}(JCTUSDT)
Janction (JCT) Market Snapshot: Steady Recovery Testing Higher Resistance
Janction (JCT) is trading around $0.0020723, posting a +5.56% gain over the past 24 hours. On the 1-hour chart, price rebounded from a swing low near 0.0019240 to reach a local high of 0.0021043—currently holding above both MA(7) at 0.0020505 and MA(25) at 0.0020071, while sitting just below MA(99) at 0.0021312.
Over the last 24 hours, JCT has traded within a range between a low of $0.0019196 and a high of $0.0021343, showing steady upward recovery as buyers step in near lower support levels.
Key on-chain and market metrics show:
Market Cap: $26.48M
Fully Diluted Valuation (FDV): $103.58M
24h Volume: $4.01M
24h Transactions: 64,673
On-Chain Liquidity: $707,737.14
On-Chain Holders: 18,401
With short-term moving averages turning supportive and price approaching the 99-period moving average, traders will be watching whether JCT can break cleanly above the $0.00213 resistance zone. Always do your own research (DYOR) and manage risk carefully in active markets.
#Janction #JCT #CryptoMarket #OnChainData #TradingAnalysis
$JCT
Janction (JCT) is trading around $0.0020723, posting a +5.56% gain over the past 24 hours. On the 1-hour chart, price rebounded from a swing low near 0.0019240 to reach a local high of 0.0021043—currently holding above both MA(7) at 0.0020505 and MA(25) at 0.0020071, while sitting just below MA(99) at 0.0021312.
Over the last 24 hours, JCT has traded within a range between a low of $0.0019196 and a high of $0.0021343, showing steady upward recovery as buyers step in near lower support levels.
Key on-chain and market metrics show:
Market Cap: $26.48M
Fully Diluted Valuation (FDV): $103.58M
24h Volume: $4.01M
24h Transactions: 64,673
On-Chain Liquidity: $707,737.14
On-Chain Holders: 18,401
With short-term moving averages turning supportive and price approaching the 99-period moving average, traders will be watching whether JCT can break cleanly above the $0.00213 resistance zone. Always do your own research (DYOR) and manage risk carefully in active markets.
#Janction #JCT #CryptoMarket #OnChainData #TradingAnalysis
$JCT
1
22
·
--
🚨 INSTITUTIONAL ORDER FLOW DISLOCATION DETECTED: $FILUSDT
Aggressive delta exhaustion confirms strong bid replenishment directly inside the 4H Fair Value Gap (FVG). Cumulative Volume Delta (CVD) exhibits textbook bullish divergence as passive limit orders absorb sell-side market depth.
Price is interacting with a high-timeframe bullish Order Block (OB), sweeping resting sell-side liquidity before an expected mean-reversion expansion.
EXECUTION SETUP:
ENTRY: 0.5907 $FILUSDT
SL: 0.5855
TP1: 0.6025
TP2: 0.6145
RR: 4.61
Are quants front-running the displacement leg, or does the imbalance hold down into discount?
#FILUSDT #BinanceSquare #SlowSclap #TradingAnalysis
🚨 INSTITUTIONAL ORDER FLOW DISLOCATION DETECTED: $FILUSDT
Aggressive delta exhaustion confirms strong bid replenishment directly inside the 4H Fair Value Gap (FVG). Cumulative Volume Delta (CVD) exhibits textbook bullish divergence as passive limit orders absorb sell-side market depth.
Price is interacting with a high-timeframe bullish Order Block (OB), sweeping resting sell-side liquidity before an expected mean-reversion expansion.
EXECUTION SETUP:
ENTRY: 0.5907 $FILUSDT
SL: 0.5855
TP1: 0.6025
TP2: 0.6145
RR: 4.61
Are quants front-running the displacement leg, or does the imbalance hold down into discount?
#FILUSDT #BinanceSquare #SlowSclap #TradingAnalysis
Aggressive delta exhaustion confirms strong bid replenishment directly inside the 4H Fair Value Gap (FVG). Cumulative Volume Delta (CVD) exhibits textbook bullish divergence as passive limit orders absorb sell-side market depth.
Price is interacting with a high-timeframe bullish Order Block (OB), sweeping resting sell-side liquidity before an expected mean-reversion expansion.
EXECUTION SETUP:
ENTRY: 0.5907 $FILUSDT
SL: 0.5855
TP1: 0.6025
TP2: 0.6145
RR: 4.61
Are quants front-running the displacement leg, or does the imbalance hold down into discount?
#FILUSDT #BinanceSquare #SlowSclap #TradingAnalysis
18
·
--
🚨 AGGRESSIVE ORDER FLOW REJECTION: $ENA
CVD collapsing into local highs. HEAVY passive sell walls absorbing all retail breakout bids at 0.109.
LIQUIDITY SWEEP COMPLETE. Upside auction failed, trapped longs are sitting ducks. High-probability mean reversion underway.
EXECUTION:
ENTRY: 0.109 $ENA
SL: 0.1177
TP1: 0.1000
TP2: 0.0915
RR: 1:2.0
Are we looking at immediate capitulation toward single digits or a brief retest of local supply first?
#ENA #BinanceSquare #SlowSclap #TradingAnalysis
🚨 AGGRESSIVE ORDER FLOW REJECTION: $ENA
CVD collapsing into local highs. HEAVY passive sell walls absorbing all retail breakout bids at 0.109.
LIQUIDITY SWEEP COMPLETE. Upside auction failed, trapped longs are sitting ducks. High-probability mean reversion underway.
EXECUTION:
ENTRY: 0.109 $ENA
SL: 0.1177
TP1: 0.1000
TP2: 0.0915
RR: 1:2.0
Are we looking at immediate capitulation toward single digits or a brief retest of local supply first?
#ENA #BinanceSquare #SlowSclap #TradingAnalysis
CVD collapsing into local highs. HEAVY passive sell walls absorbing all retail breakout bids at 0.109.
LIQUIDITY SWEEP COMPLETE. Upside auction failed, trapped longs are sitting ducks. High-probability mean reversion underway.
EXECUTION:
ENTRY: 0.109 $ENA
SL: 0.1177
TP1: 0.1000
TP2: 0.0915
RR: 1:2.0
Are we looking at immediate capitulation toward single digits or a brief retest of local supply first?
#ENA #BinanceSquare #SlowSclap #TradingAnalysis
14
·
--
🚨 INSTITUTIONAL ORDER FLOW ANOMALY: $ENA
Quantitative analysis reveals significant aggregate CVD absorption at structural demand. We are observing aggressive buy-side imbalance filling an algorithmic Fair Value Gap (FVG) precisely at the H4 Bullish Order Block threshold. Sell-side liquidity sweeps are mathematically exhausted, creating a high-probability mean reversion setup.
EXECUTION:
ENTRY: 0.1128 $ENA
SL: 0.1115
TP1: 0.1162
TP2: 0.1196
RR: 5.26
INFLECTION: Price has mitigated local inefficiency while delta turns decisively positive on tick volume clusters.
Is this liquidity sweep on $ENA printing an algorithmic bottom, or will macro delta force a secondary FVG retest?
#ENA #BinanceSquare #SlowSclap #TradingAnalysis
🚨 INSTITUTIONAL ORDER FLOW ANOMALY: $ENA
Quantitative analysis reveals significant aggregate CVD absorption at structural demand. We are observing aggressive buy-side imbalance filling an algorithmic Fair Value Gap (FVG) precisely at the H4 Bullish Order Block threshold. Sell-side liquidity sweeps are mathematically exhausted, creating a high-probability mean reversion setup.
EXECUTION:
ENTRY: 0.1128 $ENA
SL: 0.1115
TP1: 0.1162
TP2: 0.1196
RR: 5.26
INFLECTION: Price has mitigated local inefficiency while delta turns decisively positive on tick volume clusters.
Is this liquidity sweep on $ENA printing an algorithmic bottom, or will macro delta force a secondary FVG retest?
#ENA #BinanceSquare #SlowSclap #TradingAnalysis
Quantitative analysis reveals significant aggregate CVD absorption at structural demand. We are observing aggressive buy-side imbalance filling an algorithmic Fair Value Gap (FVG) precisely at the H4 Bullish Order Block threshold. Sell-side liquidity sweeps are mathematically exhausted, creating a high-probability mean reversion setup.
EXECUTION:
ENTRY: 0.1128 $ENA
SL: 0.1115
TP1: 0.1162
TP2: 0.1196
RR: 5.26
INFLECTION: Price has mitigated local inefficiency while delta turns decisively positive on tick volume clusters.
Is this liquidity sweep on $ENA printing an algorithmic bottom, or will macro delta force a secondary FVG retest?
#ENA #BinanceSquare #SlowSclap #TradingAnalysis
4
·
--
🚨 INSTITUTIONAL LIQUIDITY SWEEP: $ARIAUSDT SHORT SETUP
AGGRESSIVE SELL DELTA SPIKE AT HIGHS. Spot CVD rolling over fast as passive bids get chewed through.
Price failed to accept above local resistance. LIQUIDITY GRAB complete. Smart money is distributing straight into weak breakout buyers.
EXECUTION:
ENTRY: 0.22797 $ARIA
SL: 0.24800
TP1: 0.21700
TP2: 0.20617
RR: 1:1.09 (Sniper Risk Model)
Momentum has broken down. Invalidation is tight and non-negotiable.
Are you shorting this distribution or waiting for the 0.206 demand test? Drop your reads below.
#ARIA #BinanceSquare #SlowSclap #TradingAnalysis
🚨 INSTITUTIONAL LIQUIDITY SWEEP: $ARIAUSDT SHORT SETUP
AGGRESSIVE SELL DELTA SPIKE AT HIGHS. Spot CVD rolling over fast as passive bids get chewed through.
Price failed to accept above local resistance. LIQUIDITY GRAB complete. Smart money is distributing straight into weak breakout buyers.
EXECUTION:
ENTRY: 0.22797 $ARIA
SL: 0.24800
TP1: 0.21700
TP2: 0.20617
RR: 1:1.09 (Sniper Risk Model)
Momentum has broken down. Invalidation is tight and non-negotiable.
Are you shorting this distribution or waiting for the 0.206 demand test? Drop your reads below.
#ARIA #BinanceSquare #SlowSclap #TradingAnalysis
AGGRESSIVE SELL DELTA SPIKE AT HIGHS. Spot CVD rolling over fast as passive bids get chewed through.
Price failed to accept above local resistance. LIQUIDITY GRAB complete. Smart money is distributing straight into weak breakout buyers.
EXECUTION:
ENTRY: 0.22797 $ARIA
SL: 0.24800
TP1: 0.21700
TP2: 0.20617
RR: 1:1.09 (Sniper Risk Model)
Momentum has broken down. Invalidation is tight and non-negotiable.
Are you shorting this distribution or waiting for the 0.206 demand test? Drop your reads below.
#ARIA #BinanceSquare #SlowSclap #TradingAnalysis
32
·
--
🚨 BREAK OF STRUCTURE CONFIRMED: $LIT IS FLIPPING RESISTANCE
Look at the tape. Despite neutral market sentiment, $LIT is showing clear signs of absorption at key levels. We just witnessed a micro-CHOCH on the lower timeframes, followed by aggressive limit bid defense right above structural demand.
WHY THIS SETUP WORKS: Smart money swept liquidity below prior lows without cascading into a panic dump. This liquidity grab now acts as a spring, invalidating bears as volume expands on the reclaim. Risk is tightly defined by invalidation.
ENTRY: 2.8166 $LIT
SL: 2.7683
TP1: 2.9500
TP2: 3.0842
RR: 5.5:1
Are we seeing an institutional accumulation range, or does overhead supply reject this breakout attempt?
#LIT #BinanceSquare #SlowSclap #TradingAnalysis
🚨 BREAK OF STRUCTURE CONFIRMED: $LIT IS FLIPPING RESISTANCE
Look at the tape. Despite neutral market sentiment, $LIT is showing clear signs of absorption at key levels. We just witnessed a micro-CHOCH on the lower timeframes, followed by aggressive limit bid defense right above structural demand.
WHY THIS SETUP WORKS: Smart money swept liquidity below prior lows without cascading into a panic dump. This liquidity grab now acts as a spring, invalidating bears as volume expands on the reclaim. Risk is tightly defined by invalidation.
ENTRY: 2.8166 $LIT
SL: 2.7683
TP1: 2.9500
TP2: 3.0842
RR: 5.5:1
Are we seeing an institutional accumulation range, or does overhead supply reject this breakout attempt?
#LIT #BinanceSquare #SlowSclap #TradingAnalysis
Look at the tape. Despite neutral market sentiment, $LIT is showing clear signs of absorption at key levels. We just witnessed a micro-CHOCH on the lower timeframes, followed by aggressive limit bid defense right above structural demand.
WHY THIS SETUP WORKS: Smart money swept liquidity below prior lows without cascading into a panic dump. This liquidity grab now acts as a spring, invalidating bears as volume expands on the reclaim. Risk is tightly defined by invalidation.
ENTRY: 2.8166 $LIT
SL: 2.7683
TP1: 2.9500
TP2: 3.0842
RR: 5.5:1
Are we seeing an institutional accumulation range, or does overhead supply reject this breakout attempt?
#LIT #BinanceSquare #SlowSclap #TradingAnalysis
6
·
--
🚨 STATISTICAL ARBITRAGE ALERT: $VVVUSDT BULLISH DISLOCATION DETECTED
Microstructure analysis reveals an acute Cumulative Volume Delta (CVD) divergence at current equilibrium. Aggressive limit bid absorption has systematically neutralized passive sell-side liquidity across the local order book.
Price is compressing within a high-confluence Fair Value Gap (FVG), intersecting a previously untested demand Order Block. As lower-bound liquidity gets swept, mean-reversion probability expands rapidly toward key premium liquidity clusters.
EXECUTION MATRIX:
ENTRY: 20.669 $VVVUSDT
SL: 20.051
TP1: 21.267
TP2: 21.865
RR: 1.94:1
Will the resting institutional liquidity above the local FVG trigger an impulsive expansion, or are we facing a structural delta rejection?
#VVVUSDT #BinanceSquare #SlowSclap #TradingAnalysis
🚨 STATISTICAL ARBITRAGE ALERT: $VVVUSDT BULLISH DISLOCATION DETECTED
Microstructure analysis reveals an acute Cumulative Volume Delta (CVD) divergence at current equilibrium. Aggressive limit bid absorption has systematically neutralized passive sell-side liquidity across the local order book.
Price is compressing within a high-confluence Fair Value Gap (FVG), intersecting a previously untested demand Order Block. As lower-bound liquidity gets swept, mean-reversion probability expands rapidly toward key premium liquidity clusters.
EXECUTION MATRIX:
ENTRY: 20.669 $VVVUSDT
SL: 20.051
TP1: 21.267
TP2: 21.865
RR: 1.94:1
Will the resting institutional liquidity above the local FVG trigger an impulsive expansion, or are we facing a structural delta rejection?
#VVVUSDT #BinanceSquare #SlowSclap #TradingAnalysis
Microstructure analysis reveals an acute Cumulative Volume Delta (CVD) divergence at current equilibrium. Aggressive limit bid absorption has systematically neutralized passive sell-side liquidity across the local order book.
Price is compressing within a high-confluence Fair Value Gap (FVG), intersecting a previously untested demand Order Block. As lower-bound liquidity gets swept, mean-reversion probability expands rapidly toward key premium liquidity clusters.
EXECUTION MATRIX:
ENTRY: 20.669 $VVVUSDT
SL: 20.051
TP1: 21.267
TP2: 21.865
RR: 1.94:1
Will the resting institutional liquidity above the local FVG trigger an impulsive expansion, or are we facing a structural delta rejection?
#VVVUSDT #BinanceSquare #SlowSclap #TradingAnalysis
·
--
🚨 MASSIVE INSTITUTIONAL LIQUIDATION TRAP DETECTED: $OP! 🚨
AGGRESSIVE SELLERS ARE CRUSHING THE BID. WE ARE WITNESSING A VIOLENT CVD DIVERGENCE AS RETAIL LONGS GET SYSTEMATICALLY HARVESTED AT RESISTANCE!
Smart money is unloading heavy inventory directly into late breakout buyers. Overhead liquidity is fully wiped and price is teetering on a critical breakdown edge!
ENTRY: 0.0749 $OP
SL: 0.0807
TP1: 0.0691
TP2: 0.0633
RR: 1:2
Are the whales preparing for a brutal flush below range lows, or will bulls force a sudden short squeeze? Drop your targets below!
#OP #BinanceSquare #SlowSclap #TradingAnalysis
🚨 MASSIVE INSTITUTIONAL LIQUIDATION TRAP DETECTED: $OP ! 🚨
AGGRESSIVE SELLERS ARE CRUSHING THE BID. WE ARE WITNESSING A VIOLENT CVD DIVERGENCE AS RETAIL LONGS GET SYSTEMATICALLY HARVESTED AT RESISTANCE!
Smart money is unloading heavy inventory directly into late breakout buyers. Overhead liquidity is fully wiped and price is teetering on a critical breakdown edge!
ENTRY: 0.0749 $OP
SL: 0.0807
TP1: 0.0691
TP2: 0.0633
RR: 1:2
Are the whales preparing for a brutal flush below range lows, or will bulls force a sudden short squeeze? Drop your targets below!
#OP #BinanceSquare #SlowSclap #TradingAnalysis
AGGRESSIVE SELLERS ARE CRUSHING THE BID. WE ARE WITNESSING A VIOLENT CVD DIVERGENCE AS RETAIL LONGS GET SYSTEMATICALLY HARVESTED AT RESISTANCE!
Smart money is unloading heavy inventory directly into late breakout buyers. Overhead liquidity is fully wiped and price is teetering on a critical breakdown edge!
ENTRY: 0.0749 $OP
SL: 0.0807
TP1: 0.0691
TP2: 0.0633
RR: 1:2
Are the whales preparing for a brutal flush below range lows, or will bulls force a sudden short squeeze? Drop your targets below!
#OP #BinanceSquare #SlowSclap #TradingAnalysis
2
·
--
🚨 THE BAIT HAS BEEN SET: $HYPEUSDT IS HUNTING YOU.
THEY want retail chasing this push into the highs, but the tape exposes the real trap. We are seeing massive CVD divergence paired with aggressive limit absorption—smart money is quietly offloading into late breakout buyers right at this critical inflection point. Liquidity above is cleared; the distribution phase is active.
SHADOW ORDER FLOW SETUP:
ENTRY: 69.36 $HYPE
SL: 70.24
TP1: 68.80
TP2: 68.51
RR: 1:1
Are the whales preparing a brutal flush toward local demand, or can breakout volume absorb the supply overhang?
#HYPEUSDT #BinanceSquare #SlowSclap #TradingAnalysis
🚨 THE BAIT HAS BEEN SET: $HYPEUSDT IS HUNTING YOU.
THEY want retail chasing this push into the highs, but the tape exposes the real trap. We are seeing massive CVD divergence paired with aggressive limit absorption—smart money is quietly offloading into late breakout buyers right at this critical inflection point. Liquidity above is cleared; the distribution phase is active.
SHADOW ORDER FLOW SETUP:
ENTRY: 69.36 $HYPE
SL: 70.24
TP1: 68.80
TP2: 68.51
RR: 1:1
Are the whales preparing a brutal flush toward local demand, or can breakout volume absorb the supply overhang?
#HYPEUSDT #BinanceSquare #SlowSclap #TradingAnalysis
THEY want retail chasing this push into the highs, but the tape exposes the real trap. We are seeing massive CVD divergence paired with aggressive limit absorption—smart money is quietly offloading into late breakout buyers right at this critical inflection point. Liquidity above is cleared; the distribution phase is active.
SHADOW ORDER FLOW SETUP:
ENTRY: 69.36 $HYPE
SL: 70.24
TP1: 68.80
TP2: 68.51
RR: 1:1
Are the whales preparing a brutal flush toward local demand, or can breakout volume absorb the supply overhang?
#HYPEUSDT #BinanceSquare #SlowSclap #TradingAnalysis
1


·
--
Bearish
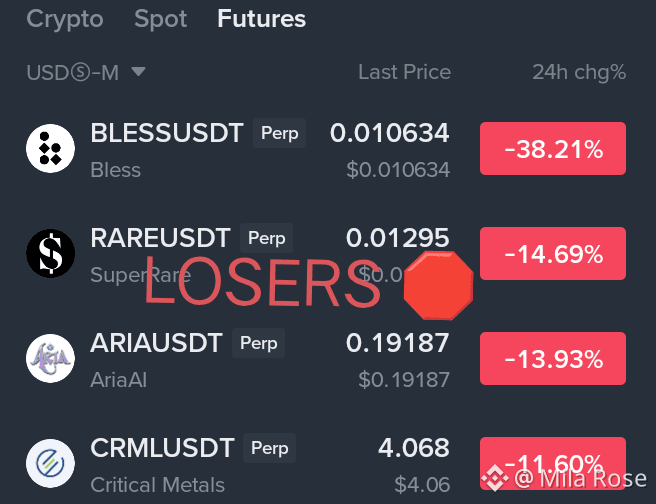
📉 BEARISH PERP LOSERS ANALYSIS🛑
$BLESS -38.38% 🔻
{future}(BLESSUSDT)
BLESS is leading the decline with a sharp drop, showing heavy selling pressure and significant downside momentum.
$RARE -15.02% ⚠️
RARE is facing continued weakness, reflecting bearish momentum and reduced buying interest.
$ARIA -14.11% 📉
{future}(ARIAUSDT)
ARIA is also under pressure, with sellers dominating the recent price action.
📊 Market Insight
Perpetual markets are showing broad downside pressure, led by BLESS.
🔥 Key Theme
Sharp declines can create rebound opportunities, but further downside and volatility remain possible.
🎯 Key Takeaway
BLESS leads the losses at -38.38%, followed by RARE at -15.02% and ARIA at -14.11%. Avoid emotional trades and manage risk carefully.
#Binance #Perpetual #Altcoins #TopLosers #TradingAnalysis
📉 BEARISH PERP LOSERS ANALYSIS🛑
$BLESS -38.38% 🔻
BLESS is leading the decline with a sharp drop, showing heavy selling pressure and significant downside momentum.
$RARE -15.02% ⚠️
RARE is facing continued weakness, reflecting bearish momentum and reduced buying interest.
$ARIA -14.11% 📉
ARIA is also under pressure, with sellers dominating the recent price action.
📊 Market Insight
Perpetual markets are showing broad downside pressure, led by BLESS.
🔥 Key Theme
Sharp declines can create rebound opportunities, but further downside and volatility remain possible.
🎯 Key Takeaway
BLESS leads the losses at -38.38%, followed by RARE at -15.02% and ARIA at -14.11%. Avoid emotional trades and manage risk carefully.
#Binance #Perpetual #Altcoins #TopLosers #TradingAnalysis
$BLESS -38.38% 🔻
BLESS is leading the decline with a sharp drop, showing heavy selling pressure and significant downside momentum.
$RARE -15.02% ⚠️
RARE is facing continued weakness, reflecting bearish momentum and reduced buying interest.
$ARIA -14.11% 📉
ARIA is also under pressure, with sellers dominating the recent price action.
📊 Market Insight
Perpetual markets are showing broad downside pressure, led by BLESS.
🔥 Key Theme
Sharp declines can create rebound opportunities, but further downside and volatility remain possible.
🎯 Key Takeaway
BLESS leads the losses at -38.38%, followed by RARE at -15.02% and ARIA at -14.11%. Avoid emotional trades and manage risk carefully.
#Binance #Perpetual #Altcoins #TopLosers #TradingAnalysis
196
·
--
🚨 INSTITUTIONAL ORDER FLOW ANOMALY: $PUMPUSDT
QUANTITATIVE LIQUIDITY AUDIT:
Cumulative Volume Delta (CVD) exhibits sharp bullish divergence at the lower boundary. Aggressive delta skew confirms passive sell limit absorption directly inside the discount Fair Value Gap (FVG).
DYNAMIC CONTEXT:
Price has swept external sell-side liquidity into the local H1 Order Block (OB). Mean reversion metrics indicate distribution exhaustion, setting up a high-probability liquidity run toward premium imbalances.
EXECUTION MATRIX:
ENTRY: 0.002781 $PUMPUSDT
SL: 0.002722
TP1: 0.002838
TP2: 0.002895
RR: 1:1.96
Are algorithms establishing an accumulation base here, or will the displacement fail to hold the OB?
#PUMPUSDT #BinanceSquare #SlowSclap #TradingAnalysis
🚨 INSTITUTIONAL ORDER FLOW ANOMALY: $PUMPUSDT
QUANTITATIVE LIQUIDITY AUDIT:
Cumulative Volume Delta (CVD) exhibits sharp bullish divergence at the lower boundary. Aggressive delta skew confirms passive sell limit absorption directly inside the discount Fair Value Gap (FVG).
DYNAMIC CONTEXT:
Price has swept external sell-side liquidity into the local H1 Order Block (OB). Mean reversion metrics indicate distribution exhaustion, setting up a high-probability liquidity run toward premium imbalances.
EXECUTION MATRIX:
ENTRY: 0.002781 $PUMPUSDT
SL: 0.002722
TP1: 0.002838
TP2: 0.002895
RR: 1:1.96
Are algorithms establishing an accumulation base here, or will the displacement fail to hold the OB?
#PUMPUSDT #BinanceSquare #SlowSclap #TradingAnalysis
QUANTITATIVE LIQUIDITY AUDIT:
Cumulative Volume Delta (CVD) exhibits sharp bullish divergence at the lower boundary. Aggressive delta skew confirms passive sell limit absorption directly inside the discount Fair Value Gap (FVG).
DYNAMIC CONTEXT:
Price has swept external sell-side liquidity into the local H1 Order Block (OB). Mean reversion metrics indicate distribution exhaustion, setting up a high-probability liquidity run toward premium imbalances.
EXECUTION MATRIX:
ENTRY: 0.002781 $PUMPUSDT
SL: 0.002722
TP1: 0.002838
TP2: 0.002895
RR: 1:1.96
Are algorithms establishing an accumulation base here, or will the displacement fail to hold the OB?
#PUMPUSDT #BinanceSquare #SlowSclap #TradingAnalysis
3
·
--
🚨 MASSIVE BUY ABSORPTION DETECTED: $HUMAUSDT
Aggressive bid-side CVD divergence on low timeframes. Sell orders completely absorbed at the base.
Price is sweeping liquidity into local demand. Inflection point active right now before an explosive squeeze through resting overhead shorts.
EXECUTION SETUP:
ENTRY: 0.009099 $HUMAUSDT
SL: 0.008534
TP1: 0.009920
TP2: 0.010759
RR: 2.94
Do you see this clearing resistance clean, or will order flow exhaust at local supply?
#HUMAUSDT #BinanceSquare #SlowSclap #TradingAnalysis
🚨 MASSIVE BUY ABSORPTION DETECTED: $HUMAUSDT
Aggressive bid-side CVD divergence on low timeframes. Sell orders completely absorbed at the base.
Price is sweeping liquidity into local demand. Inflection point active right now before an explosive squeeze through resting overhead shorts.
EXECUTION SETUP:
ENTRY: 0.009099 $HUMAUSDT
SL: 0.008534
TP1: 0.009920
TP2: 0.010759
RR: 2.94
Do you see this clearing resistance clean, or will order flow exhaust at local supply?
#HUMAUSDT #BinanceSquare #SlowSclap #TradingAnalysis
Aggressive bid-side CVD divergence on low timeframes. Sell orders completely absorbed at the base.
Price is sweeping liquidity into local demand. Inflection point active right now before an explosive squeeze through resting overhead shorts.
EXECUTION SETUP:
ENTRY: 0.009099 $HUMAUSDT
SL: 0.008534
TP1: 0.009920
TP2: 0.010759
RR: 2.94
Do you see this clearing resistance clean, or will order flow exhaust at local supply?
#HUMAUSDT #BinanceSquare #SlowSclap #TradingAnalysis
9
Log in to explore more content
Join global crypto users on Binance Square
⚡️ Get latest and useful information about crypto.
💬 Trusted by the world’s largest crypto exchange.
👍 Discover real insights from verified creators.
Email / Phone number
Trending Topics
1
#IsAnthropic’s$1.5TMarketCapJustified?
16,869 views
113 Discussing
2
#BTCRemainsUnderPressureAfterHawkishFOMCMinutes
278,419 views
2,173 Discussing
3
#NvidiaBoardReportedlySplitOverHuang’sReturn
136,970 views
1,178 Discussing
4
#StrategySTRCPreferredSlips3.65%Below$100Par
9,556 views
88 Discussing
5
#MASToUpgradeSGDTestnetToSGDigitalLedger
28,750 views
300 Discussing
6
#CanGTA6'sLaunchLiftTTWOShares?
101,610 views
846 Discussing
7
#Solana2027RoadmapTargetsDoubleComputeCapacity
12,253 views
159 Discussing
8
#InjectiveTokenizedRealEstateMortgagesTop$1.5B
1,336 views
29 Discussing
9
#TetherMakesStrategicInvestmentInSCRYPT
9,341 views
116 Discussing
10
#CapitalGroupAdds1264500StrategyShares
37,270 views
250 Discussing