
#usjobdata
usjobdata
19,629 views
136 Discussing
Hot
Latest

·
--
Bullish
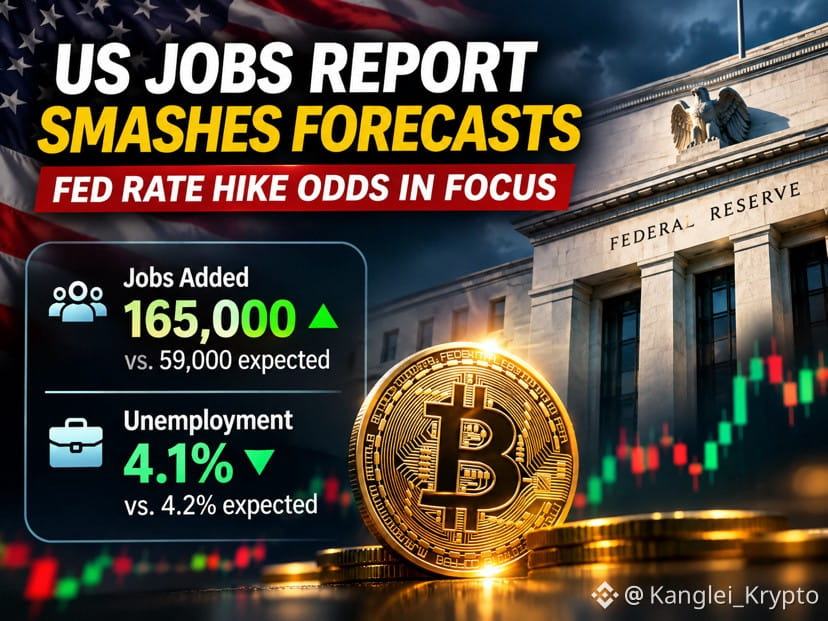
🚨 THE JOBS MARKET JUST DELIVERED A SHOCK — IS THE FED’S NEXT MOVE BACK ON THE TABLE?
165K JOBS vs. 59K EXPECTED — THE FED MAY HAVE A NEW INFLATION PROBLEM.
Wall Street expected a cooling US labour market. Instead, October delivered a serious upside surprise.
The US economy added 165,000 jobs, nearly 3x the forecast, while unemployment slipped to 4.1%, beating expectations.
📊 THE NUMBERS THAT MATTER:
🔸 Nonfarm payrolls: +165K vs. +59K expected
🔸 Unemployment: 4.1% vs. 4.2% expected
🔸 Private-sector jobs: +159K
🔸 Government jobs: +6K
🔸 Average hourly earnings: +0.4% MoM / +3.1% YoY
🔸 Combined August–September revisions: +84K
WHERE THE JOBS CAME FROM:
* Professional & business services: +70K
* Healthcare: +42K
* Transportation & warehousing: +25K
* Manufacturing: +19K
But there’s a catch.
Part-time employment for economic reasons jumped by 339K to 4.8 million. Beneath the headline strength, some cracks remain.
WHY CRYPTO TRADERS SHOULD CARE:
A stronger labour market could give the Federal Reserve less urgency to cut rates. Higher-for-longer rate expectations could strengthen the dollar, pressure liquidity and create fresh volatility across Bitcoin and altcoins.
But don’t jump to conclusions: one jobs report doesn’t guarantee a rate hike.
The real battle now is between economic resilience and the Fed’s inflation fight.
Strong jobs. Complicated signals. Uncertain liquidity.
Are we looking at a bullish US economy or a bearish setup for risk assets?
What’s your take? 👇
#USjobs #FederalReserve #usjobdata $BTC $ETH $BNB
{future}(BTCUSDT)
🚨 THE JOBS MARKET JUST DELIVERED A SHOCK — IS THE FED’S NEXT MOVE BACK ON THE TABLE?
165K JOBS vs. 59K EXPECTED — THE FED MAY HAVE A NEW INFLATION PROBLEM.
Wall Street expected a cooling US labour market. Instead, October delivered a serious upside surprise.
The US economy added 165,000 jobs, nearly 3x the forecast, while unemployment slipped to 4.1%, beating expectations.
📊 THE NUMBERS THAT MATTER:
🔸 Nonfarm payrolls: +165K vs. +59K expected
🔸 Unemployment: 4.1% vs. 4.2% expected
🔸 Private-sector jobs: +159K
🔸 Government jobs: +6K
🔸 Average hourly earnings: +0.4% MoM / +3.1% YoY
🔸 Combined August–September revisions: +84K
WHERE THE JOBS CAME FROM:
* Professional & business services: +70K
* Healthcare: +42K
* Transportation & warehousing: +25K
* Manufacturing: +19K
But there’s a catch.
Part-time employment for economic reasons jumped by 339K to 4.8 million. Beneath the headline strength, some cracks remain.
WHY CRYPTO TRADERS SHOULD CARE:
A stronger labour market could give the Federal Reserve less urgency to cut rates. Higher-for-longer rate expectations could strengthen the dollar, pressure liquidity and create fresh volatility across Bitcoin and altcoins.
But don’t jump to conclusions: one jobs report doesn’t guarantee a rate hike.
The real battle now is between economic resilience and the Fed’s inflation fight.
Strong jobs. Complicated signals. Uncertain liquidity.
Are we looking at a bullish US economy or a bearish setup for risk assets?
What’s your take? 👇
#USjobs #FederalReserve #usjobdata $BTC $ETH $BNB
165K JOBS vs. 59K EXPECTED — THE FED MAY HAVE A NEW INFLATION PROBLEM.
Wall Street expected a cooling US labour market. Instead, October delivered a serious upside surprise.
The US economy added 165,000 jobs, nearly 3x the forecast, while unemployment slipped to 4.1%, beating expectations.
📊 THE NUMBERS THAT MATTER:
🔸 Nonfarm payrolls: +165K vs. +59K expected
🔸 Unemployment: 4.1% vs. 4.2% expected
🔸 Private-sector jobs: +159K
🔸 Government jobs: +6K
🔸 Average hourly earnings: +0.4% MoM / +3.1% YoY
🔸 Combined August–September revisions: +84K
WHERE THE JOBS CAME FROM:
* Professional & business services: +70K
* Healthcare: +42K
* Transportation & warehousing: +25K
* Manufacturing: +19K
But there’s a catch.
Part-time employment for economic reasons jumped by 339K to 4.8 million. Beneath the headline strength, some cracks remain.
WHY CRYPTO TRADERS SHOULD CARE:
A stronger labour market could give the Federal Reserve less urgency to cut rates. Higher-for-longer rate expectations could strengthen the dollar, pressure liquidity and create fresh volatility across Bitcoin and altcoins.
But don’t jump to conclusions: one jobs report doesn’t guarantee a rate hike.
The real battle now is between economic resilience and the Fed’s inflation fight.
Strong jobs. Complicated signals. Uncertain liquidity.
Are we looking at a bullish US economy or a bearish setup for risk assets?
What’s your take? 👇
#USjobs #FederalReserve #usjobdata $BTC $ETH $BNB
1
196

U.S. JOBLESS CLAIMS RISE 189,000; EST. 197,000; PREV. 195,000
LOWEST SINCE JULY .
#USJobData
$BTC $ETH $XRP
{future}(XRPUSDT)
{future}(ETHUSDT)
{future}(BTCUSDT)
U.S. JOBLESS CLAIMS RISE 189,000; EST. 197,000; PREV. 195,000
LOWEST SINCE JULY .
#USJobData
$BTC $ETH $XRP
LOWEST SINCE JULY .
#USJobData
$BTC $ETH $XRP

141

·
--
🇺🇸 US JOBS DATA BEATS EXPECTATIONS
Weekly jobless claims came in at 196,000, below the 207,000 expected.
At face value, that’s positive for the US economy, suggesting the labour market remains resilient.
But for Bitcoin and other risk assets, it’s more complicated.
A stronger labour market can give the Federal Reserve less urgency to cut interest rates, particularly while inflation remains above its 2% target.
That means today’s data isn’t automatically bullish for crypto. Markets will be watching the combination of employment, inflation, Fed policy and liquidity to determine where risk assets go next.
Strong economy ≠ automatically bullish crypto.
#Bitcoin #USJobData
🇺🇸 US JOBS DATA BEATS EXPECTATIONS
Weekly jobless claims came in at 196,000, below the 207,000 expected.
At face value, that’s positive for the US economy, suggesting the labour market remains resilient.
But for Bitcoin and other risk assets, it’s more complicated.
A stronger labour market can give the Federal Reserve less urgency to cut interest rates, particularly while inflation remains above its 2% target.
That means today’s data isn’t automatically bullish for crypto. Markets will be watching the combination of employment, inflation, Fed policy and liquidity to determine where risk assets go next.
Strong economy ≠ automatically bullish crypto.
#Bitcoin #USJobData
Weekly jobless claims came in at 196,000, below the 207,000 expected.
At face value, that’s positive for the US economy, suggesting the labour market remains resilient.
But for Bitcoin and other risk assets, it’s more complicated.
A stronger labour market can give the Federal Reserve less urgency to cut interest rates, particularly while inflation remains above its 2% target.
That means today’s data isn’t automatically bullish for crypto. Markets will be watching the combination of employment, inflation, Fed policy and liquidity to determine where risk assets go next.
Strong economy ≠ automatically bullish crypto.
#Bitcoin #USJobData
106

·
--
Verified
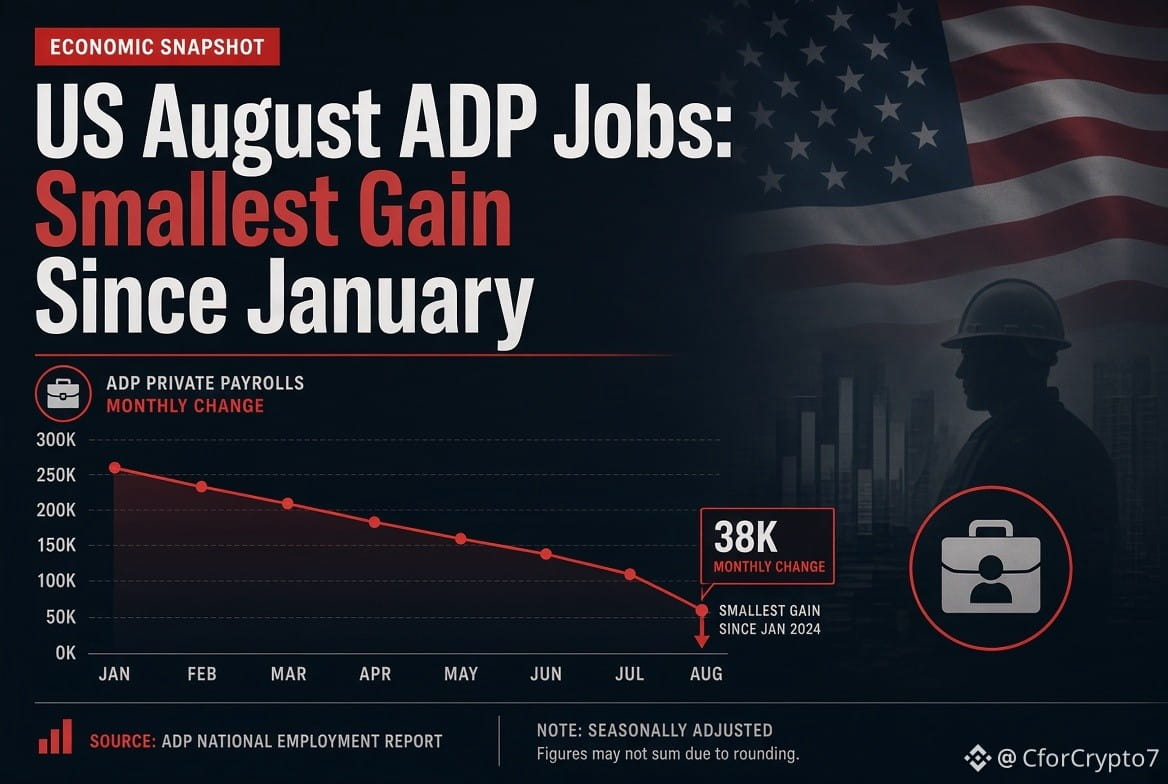
U.S. private employers add just 38,000 jobs in August.
ADP reports the smallest gain since January.
The figure falls short of the 47,000 expected by economists. July’s number is revised to 46,000.
Education and health services lead with 45,000 new positions. Leisure and hospitality add 16,000. Construction gains 12,000.
Manufacturing loses 17,000 jobs. Professional and business services drop 16,000. Large companies drive most of the hiring.
Wage growth holds steady.
Economists see the soft print as another sign of a cooling labor market.
Markets now turn attention to the official jobs report.
$ETH
{future}(ETHUSDT)
$SNDK
{future}(SNDKUSDT)
$BNB
{future}(BNBUSDT)
#USjobs #USJobData
#usaugadpjobssmallestgainsincejan
U.S. private employers add just 38,000 jobs in August.
ADP reports the smallest gain since January.
The figure falls short of the 47,000 expected by economists. July’s number is revised to 46,000.
Education and health services lead with 45,000 new positions. Leisure and hospitality add 16,000. Construction gains 12,000.
Manufacturing loses 17,000 jobs. Professional and business services drop 16,000. Large companies drive most of the hiring.
Wage growth holds steady.
Economists see the soft print as another sign of a cooling labor market.
Markets now turn attention to the official jobs report.
$ETH
$SNDK
$BNB
#USjobs #USJobData
#usaugadpjobssmallestgainsincejan
ADP reports the smallest gain since January.
The figure falls short of the 47,000 expected by economists. July’s number is revised to 46,000.
Education and health services lead with 45,000 new positions. Leisure and hospitality add 16,000. Construction gains 12,000.
Manufacturing loses 17,000 jobs. Professional and business services drop 16,000. Large companies drive most of the hiring.
Wage growth holds steady.
Economists see the soft print as another sign of a cooling labor market.
Markets now turn attention to the official jobs report.
$ETH
$SNDK
$BNB
#USjobs #USJobData
#usaugadpjobssmallestgainsincejan
2
2.6k

·
--
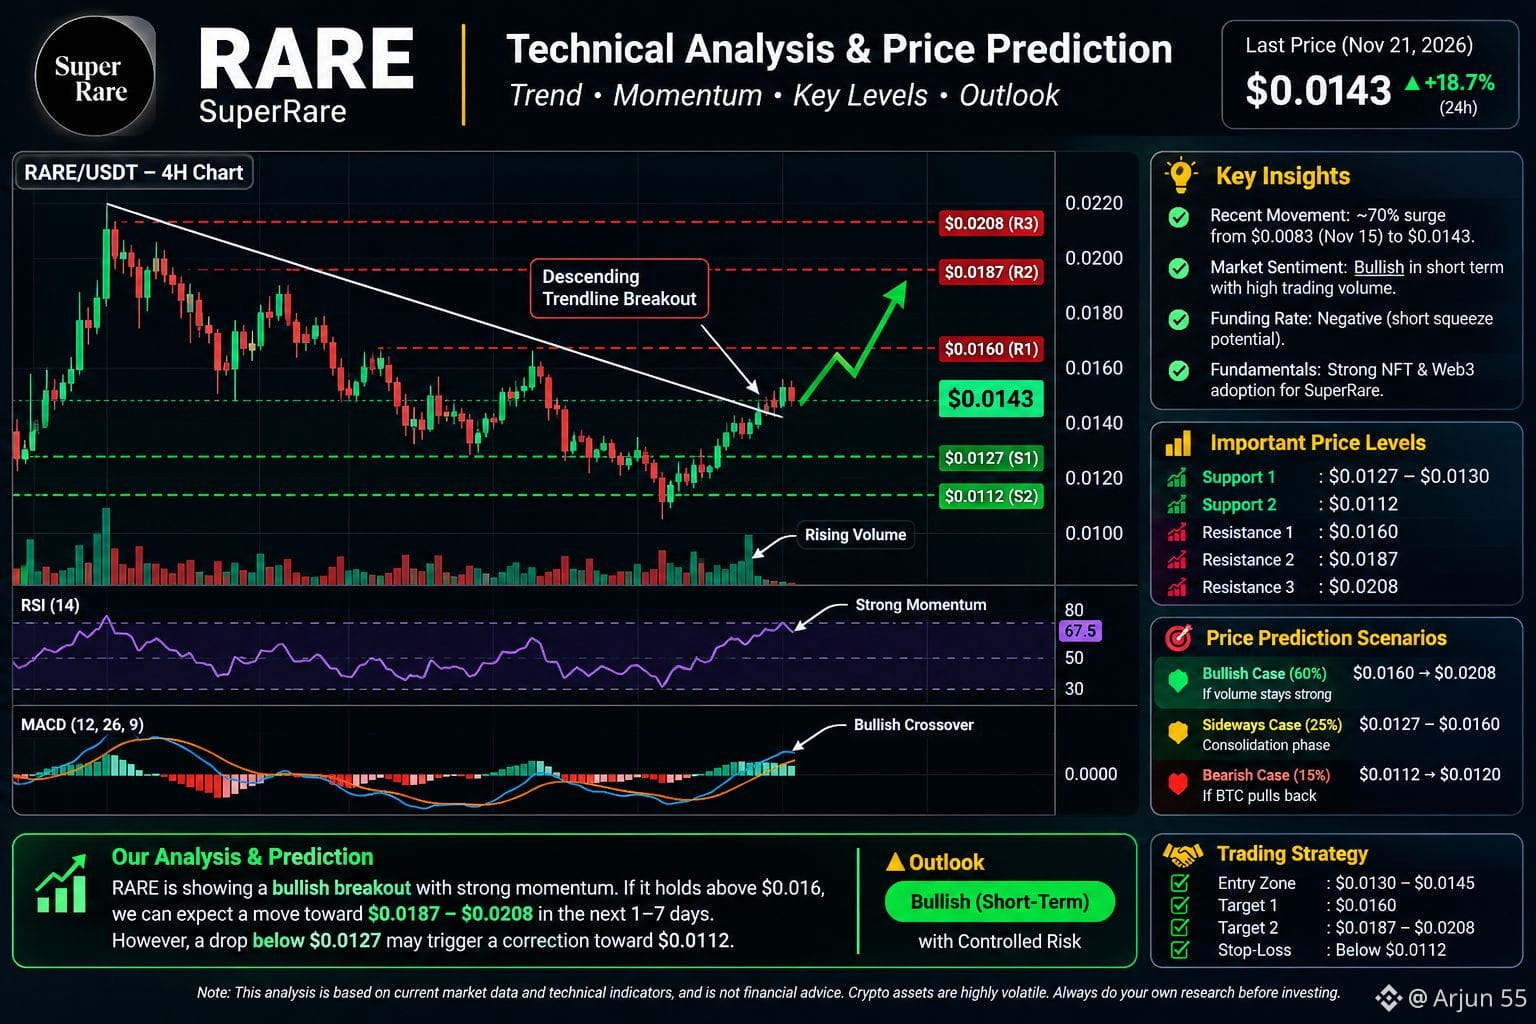
RARE Token (Super Rare) – Price Movement Analysis
RARE is the native token of the Super Rare NFT marketplace. Its price is influenced by overall crypto market sentiment, trading volume, investor demand, NFT market activity, and Bitcoin's movement.
For a proper prediction, we need to examine:
Recent price trend and support/resistance.
Trading volume and buying/selling pressure.
RSI and MACD momentum.
Bitcoin market direction.
Upcoming catalysts and token-related news.
Recent movement (21 November 2026)
RARE recently surged around 70% from its November 15 low near $0.0083.
Latest reported price varies around $0.0135–$0.0146 across data providers.
Futures activity is unusually high, with negative funding, indicating aggressive short positioning.
Important price levels
Level Price (USD)
Support 1 $0.0120–0.0127
Support 2 $0.0112
Resistance 1 $0.0160
Resistance 2 $0.0187
Resistance 3 $0.0208
My prediction
Next 1–7 days
Above $0.016 with strong volume: possible move toward $0.0187–$0.0208.
Below $0.012: downside risk increases.
Between $0.012 and $0.016: likely volatile consolidation.
Overall: Upside is possible, but a sharp correction after the recent rally is also a serious risk.
This is a conditional technical forecast, not a guaranteed prediction.
#RARE #dodo #SOXSB #CPIWatch #USJobData
{spot}(RAREUSDT)
{spot}(DODOUSDT)
{spot}(SOXSBUSDT)
RARE Token (Super Rare) – Price Movement Analysis
RARE is the native token of the Super Rare NFT marketplace. Its price is influenced by overall crypto market sentiment, trading volume, investor demand, NFT market activity, and Bitcoin's movement.
For a proper prediction, we need to examine:
Recent price trend and support/resistance.
Trading volume and buying/selling pressure.
RSI and MACD momentum.
Bitcoin market direction.
Upcoming catalysts and token-related news.
Recent movement (21 November 2026)
RARE recently surged around 70% from its November 15 low near $0.0083.
Latest reported price varies around $0.0135–$0.0146 across data providers.
Futures activity is unusually high, with negative funding, indicating aggressive short positioning.
Important price levels
Level Price (USD)
Support 1 $0.0120–0.0127
Support 2 $0.0112
Resistance 1 $0.0160
Resistance 2 $0.0187
Resistance 3 $0.0208
My prediction
Next 1–7 days
Above $0.016 with strong volume: possible move toward $0.0187–$0.0208.
Below $0.012: downside risk increases.
Between $0.012 and $0.016: likely volatile consolidation.
Overall: Upside is possible, but a sharp correction after the recent rally is also a serious risk.
This is a conditional technical forecast, not a guaranteed prediction.
#RARE #dodo #SOXSB #CPIWatch #USJobData
RARE is the native token of the Super Rare NFT marketplace. Its price is influenced by overall crypto market sentiment, trading volume, investor demand, NFT market activity, and Bitcoin's movement.
For a proper prediction, we need to examine:
Recent price trend and support/resistance.
Trading volume and buying/selling pressure.
RSI and MACD momentum.
Bitcoin market direction.
Upcoming catalysts and token-related news.
Recent movement (21 November 2026)
RARE recently surged around 70% from its November 15 low near $0.0083.
Latest reported price varies around $0.0135–$0.0146 across data providers.
Futures activity is unusually high, with negative funding, indicating aggressive short positioning.
Important price levels
Level Price (USD)
Support 1 $0.0120–0.0127
Support 2 $0.0112
Resistance 1 $0.0160
Resistance 2 $0.0187
Resistance 3 $0.0208
My prediction
Next 1–7 days
Above $0.016 with strong volume: possible move toward $0.0187–$0.0208.
Below $0.012: downside risk increases.
Between $0.012 and $0.016: likely volatile consolidation.
Overall: Upside is possible, but a sharp correction after the recent rally is also a serious risk.
This is a conditional technical forecast, not a guaranteed prediction.
#RARE #dodo #SOXSB #CPIWatch #USJobData
185
·
--
$SOXSB SOX SB Token – Recent Analysis & Future Price Prediction
$66 approx.
20 November 2026 · Indicative USD price; exchange prices may differ.
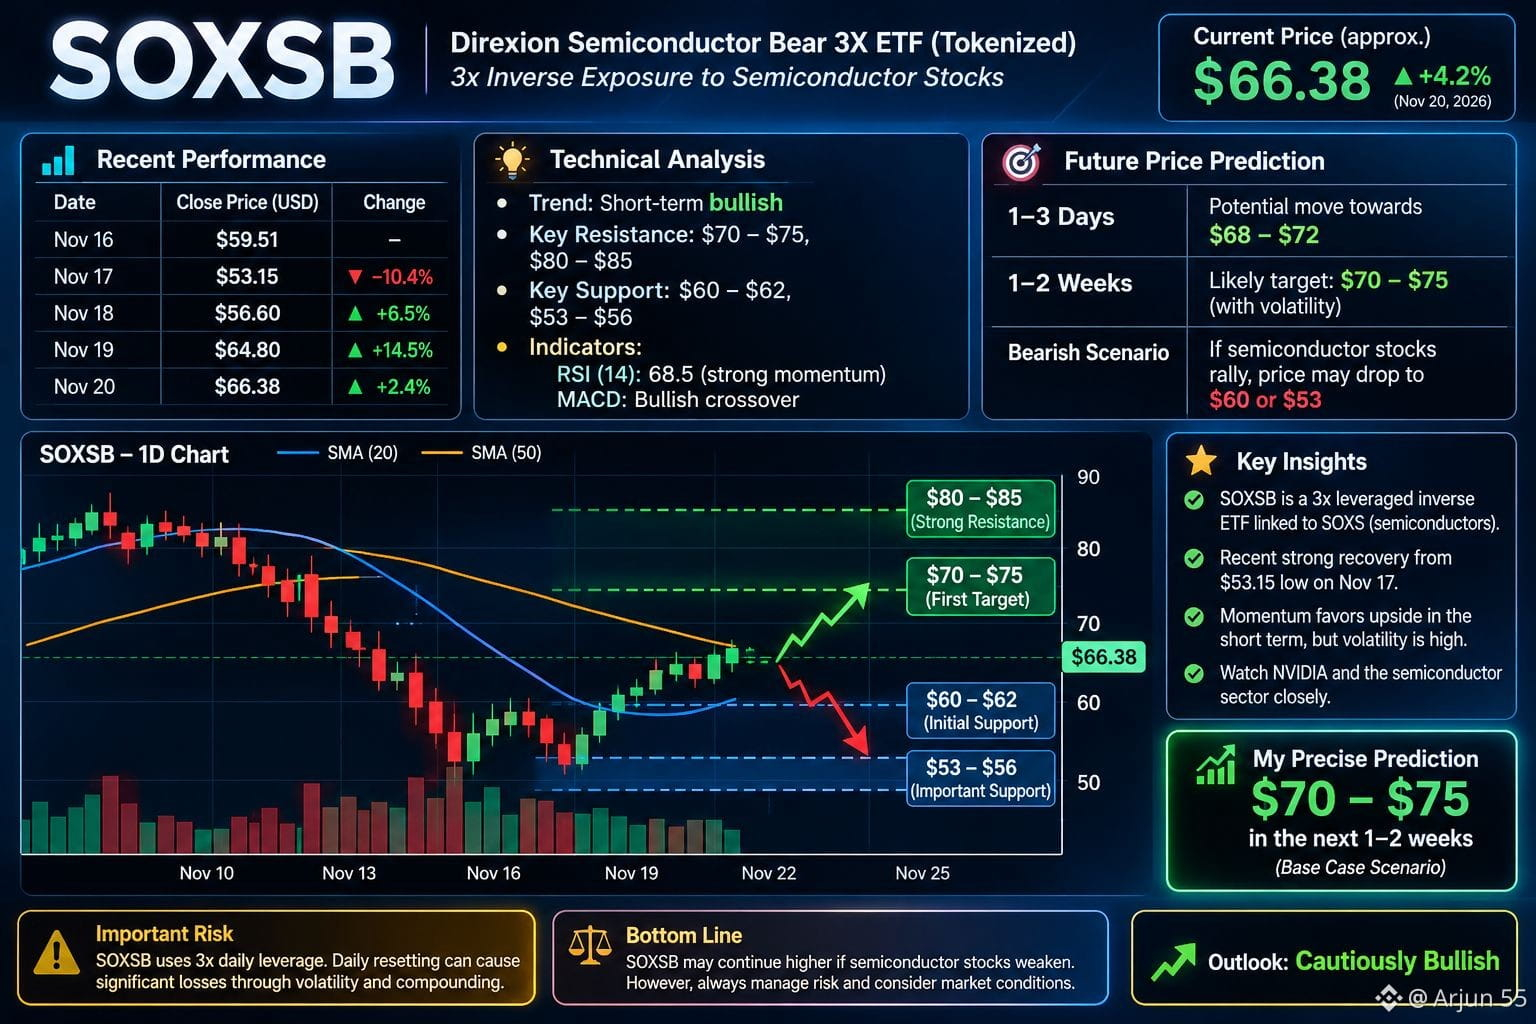
First, understand SOX SB: It represents the tokenized Direxion Semiconductor Bear 3X ETF (SOXS). It is designed to move approximately 3 times in the opposite direction of semiconductor stocks on a daily basis. It is NOT a normal crypto token.
Recent price movement
Date Closing price
Nov 16 $59.51
Nov 17 $53.15
Nov 18 $56.60
Nov 19 $64.80
Nov 20 $66.38
SOX SB has recovered strongly from its November 17 low.
Future movement prediction
Price level Significance
$70–75 First upside target zone
$80–85 Stronger resistance
$60–62 Initial support
$53–56 Important support
Below $53 Bearish warning
These are indicative technical zones, not guaranteed targets.
My prediction
Next 1–3 days: Potential upside continuation if semi conductor stocks weaken.
Next 1–2 weeks: $70–75 is a possible target, but volatility will be high.
Bearish scenario: If semiconductor stocks rally, SOX SB could fall rapidly towards $60 or $53.
Most important factor: Watch NVIDIA and the semiconductor sector. Semiconductor weakness generally benefits SOX SB; semiconductor strength generally hurts it
One important risk
SOX SB uses 3x daily leverage. Daily resetting can cause substantial losses through volatility and compounding, even when the underlying index eventually returns to its starting level.
#SOXSB #kernel #SKDDB #CPIWatch #USJobData
{spot}(SOXSBUSDT)
{spot}(KERNELUSDT)
{spot}(SKDDBUSDT)
$SOXSB SOX SB Token – Recent Analysis & Future Price Prediction
$66 approx.
20 November 2026 · Indicative USD price; exchange prices may differ.
First, understand SOX SB: It represents the tokenized Direxion Semiconductor Bear 3X ETF (SOXS). It is designed to move approximately 3 times in the opposite direction of semiconductor stocks on a daily basis. It is NOT a normal crypto token.
Recent price movement
Date Closing price
Nov 16 $59.51
Nov 17 $53.15
Nov 18 $56.60
Nov 19 $64.80
Nov 20 $66.38
SOX SB has recovered strongly from its November 17 low.
Future movement prediction
Price level Significance
$70–75 First upside target zone
$80–85 Stronger resistance
$60–62 Initial support
$53–56 Important support
Below $53 Bearish warning
These are indicative technical zones, not guaranteed targets.
My prediction
Next 1–3 days: Potential upside continuation if semi conductor stocks weaken.
Next 1–2 weeks: $70–75 is a possible target, but volatility will be high.
Bearish scenario: If semiconductor stocks rally, SOX SB could fall rapidly towards $60 or $53.
Most important factor: Watch NVIDIA and the semiconductor sector. Semiconductor weakness generally benefits SOX SB; semiconductor strength generally hurts it
One important risk
SOX SB uses 3x daily leverage. Daily resetting can cause substantial losses through volatility and compounding, even when the underlying index eventually returns to its starting level.
#SOXSB #kernel #SKDDB #CPIWatch #USJobData
$66 approx.
20 November 2026 · Indicative USD price; exchange prices may differ.
First, understand SOX SB: It represents the tokenized Direxion Semiconductor Bear 3X ETF (SOXS). It is designed to move approximately 3 times in the opposite direction of semiconductor stocks on a daily basis. It is NOT a normal crypto token.
Recent price movement
Date Closing price
Nov 16 $59.51
Nov 17 $53.15
Nov 18 $56.60
Nov 19 $64.80
Nov 20 $66.38
SOX SB has recovered strongly from its November 17 low.
Future movement prediction
Price level Significance
$70–75 First upside target zone
$80–85 Stronger resistance
$60–62 Initial support
$53–56 Important support
Below $53 Bearish warning
These are indicative technical zones, not guaranteed targets.
My prediction
Next 1–3 days: Potential upside continuation if semi conductor stocks weaken.
Next 1–2 weeks: $70–75 is a possible target, but volatility will be high.
Bearish scenario: If semiconductor stocks rally, SOX SB could fall rapidly towards $60 or $53.
Most important factor: Watch NVIDIA and the semiconductor sector. Semiconductor weakness generally benefits SOX SB; semiconductor strength generally hurts it
One important risk
SOX SB uses 3x daily leverage. Daily resetting can cause substantial losses through volatility and compounding, even when the underlying index eventually returns to its starting level.
#SOXSB #kernel #SKDDB #CPIWatch #USJobData
382
·
--
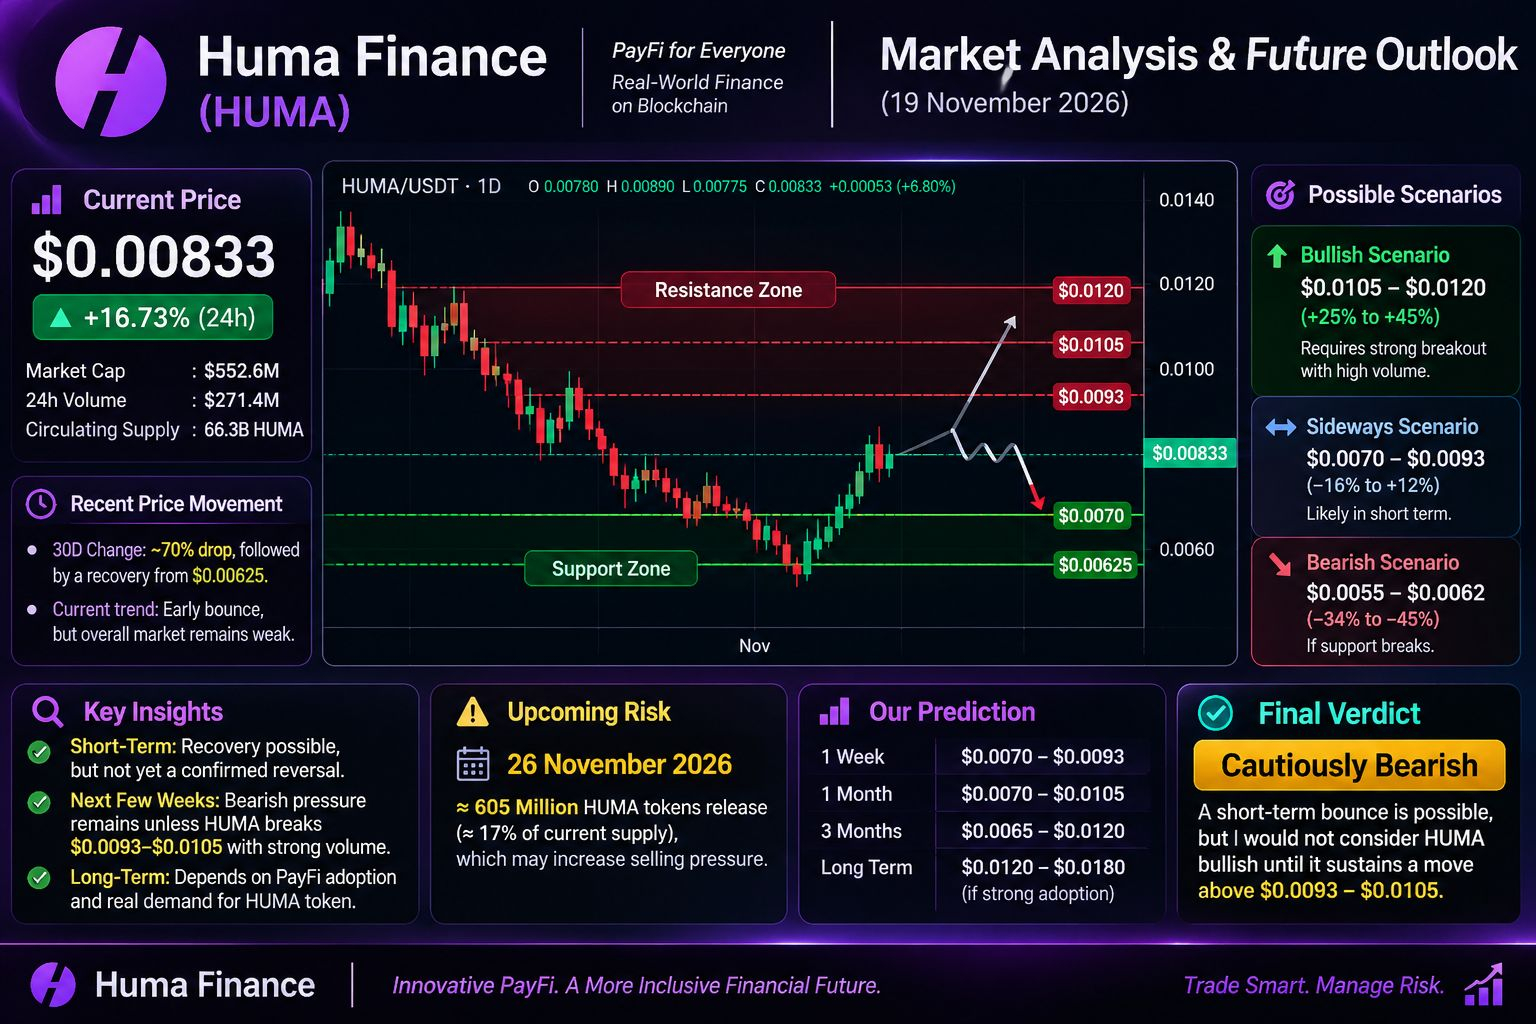
$HUMA HUMA Token – Recent Analysis & Future Prediction
$0.00833
Huma Finance (HUMA) · 19 November 2026 · USD
Recent price movement
HUMA has experienced a major correction, falling approximately 70% in the last 30 days.
It recently bounced from around $0.00625.
The latest recovery suggests short-term buying interest.
However, the overall trend remains weak.
Important price levels
Level Price
Immediate resistance $0.0093
Strong resistance $0.0105
Higher resistance $0.0120
Immediate support $0.0070
Strong support $0.00625
These are approximate technical levels, not guaranteed turning points.
Future prediction
Scenario Possible price
Bullish breakout $0.0105–0.0120
Sideways $0.0070–0.0093
Bearish breakdown $0.0055–0.0062
My assessment:
Short term: Recovery possible, but not yet a confirmed bullish reversal.
Next few weeks: Bearish pressure remains unless HUMA breaks resistance with strong volume.
Long term: Recovery depends on Pay Fi adoption and actual demand for the HUMA token.
Biggest upcoming risk
Around 26 November 2026, approximately 605 million HUMA tokens are reportedly scheduled for release, potentially increasing circulating supply by around 17%.
This could create significant selling pressure.
Final verdict
A short-term bounce is possible, but I would not consider HUMA bullish until it sustains a move above $0.0093–$0.0105.
#humausdt #LUNC #USTC #CPIWatch #USJobData
{spot}(HUMAUSDT)
{spot}(LUNCUSDT)
{spot}(USTCUSDT)
$HUMA HUMA Token – Recent Analysis & Future Prediction
$0.00833
Huma Finance (HUMA) · 19 November 2026 · USD
Recent price movement
HUMA has experienced a major correction, falling approximately 70% in the last 30 days.
It recently bounced from around $0.00625.
The latest recovery suggests short-term buying interest.
However, the overall trend remains weak.
Important price levels
Level Price
Immediate resistance $0.0093
Strong resistance $0.0105
Higher resistance $0.0120
Immediate support $0.0070
Strong support $0.00625
These are approximate technical levels, not guaranteed turning points.
Future prediction
Scenario Possible price
Bullish breakout $0.0105–0.0120
Sideways $0.0070–0.0093
Bearish breakdown $0.0055–0.0062
My assessment:
Short term: Recovery possible, but not yet a confirmed bullish reversal.
Next few weeks: Bearish pressure remains unless HUMA breaks resistance with strong volume.
Long term: Recovery depends on Pay Fi adoption and actual demand for the HUMA token.
Biggest upcoming risk
Around 26 November 2026, approximately 605 million HUMA tokens are reportedly scheduled for release, potentially increasing circulating supply by around 17%.
This could create significant selling pressure.
Final verdict
A short-term bounce is possible, but I would not consider HUMA bullish until it sustains a move above $0.0093–$0.0105.
#humausdt #LUNC #USTC #CPIWatch #USJobData
$0.00833
Huma Finance (HUMA) · 19 November 2026 · USD
Recent price movement
HUMA has experienced a major correction, falling approximately 70% in the last 30 days.
It recently bounced from around $0.00625.
The latest recovery suggests short-term buying interest.
However, the overall trend remains weak.
Important price levels
Level Price
Immediate resistance $0.0093
Strong resistance $0.0105
Higher resistance $0.0120
Immediate support $0.0070
Strong support $0.00625
These are approximate technical levels, not guaranteed turning points.
Future prediction
Scenario Possible price
Bullish breakout $0.0105–0.0120
Sideways $0.0070–0.0093
Bearish breakdown $0.0055–0.0062
My assessment:
Short term: Recovery possible, but not yet a confirmed bullish reversal.
Next few weeks: Bearish pressure remains unless HUMA breaks resistance with strong volume.
Long term: Recovery depends on Pay Fi adoption and actual demand for the HUMA token.
Biggest upcoming risk
Around 26 November 2026, approximately 605 million HUMA tokens are reportedly scheduled for release, potentially increasing circulating supply by around 17%.
This could create significant selling pressure.
Final verdict
A short-term bounce is possible, but I would not consider HUMA bullish until it sustains a move above $0.0093–$0.0105.
#humausdt #LUNC #USTC #CPIWatch #USJobData
383
·
--
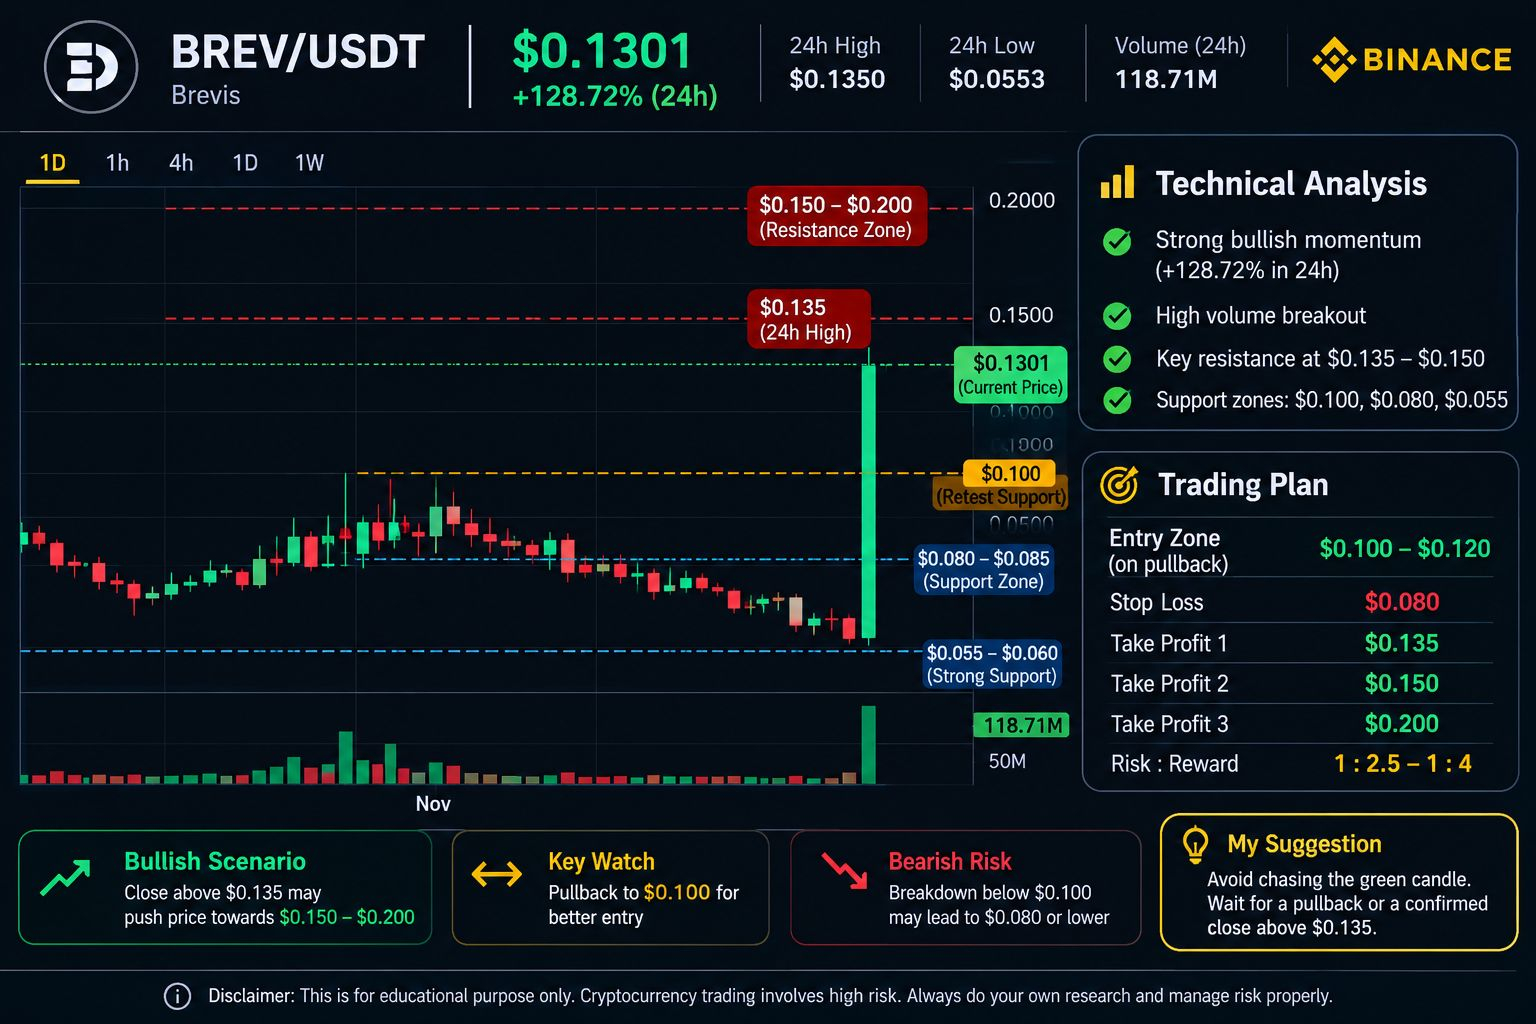
$BREV Brevis (BREV) — Analysis
Indicator Value
Current price $0.1301
24h change +128.72%
24h high $0.1350
24h low $0.0553
Trading volume 118.71M
Candle Large bullish candle
My interpretation: BREV has experienced a massive breakout with unusually high volume. This is bullish, but buying immediately after such a large candle carries substantial risk.
Important support and resistance
$0.1500–$0.2000
Potential upside resistance zones
$0.1350
Immediate resistance / 24h high
$0.1301
Current price
$0.1000
Potential breakout retest support
$0.0800–$0.0850
Previous consolidation zone These are estimated chart levels, not confirmed support or resistance.
3. Possible trading scenarios
Scenario What to watch
Bullish Daily close above $0.135
Retest Pullback toward $0.10
Bearish Breakdown below $0.10
Strong bearish Loss of $0.08
4. Should you buy now?
My opinion: Avoid chasing the huge green candle.
Wait for one of these:
A pullback followed by bullish confirmation.
A daily close above $0.135 followed by a successful retest.
A sudden reversal after a 128% pump is possible.
#brev #CYPHB #BLUR #CPIWatch #USJobData
{spot}(BREVUSDT)
{spot}(CYPHBUSDT)
{spot}(BLURUSDT)
$BREV Brevis (BREV) — Analysis
Indicator Value
Current price $0.1301
24h change +128.72%
24h high $0.1350
24h low $0.0553
Trading volume 118.71M
Candle Large bullish candle
My interpretation: BREV has experienced a massive breakout with unusually high volume. This is bullish, but buying immediately after such a large candle carries substantial risk.
Important support and resistance
$0.1500–$0.2000
Potential upside resistance zones
$0.1350
Immediate resistance / 24h high
$0.1301
Current price
$0.1000
Potential breakout retest support
$0.0800–$0.0850
Previous consolidation zone These are estimated chart levels, not confirmed support or resistance.
3. Possible trading scenarios
Scenario What to watch
Bullish Daily close above $0.135
Retest Pullback toward $0.10
Bearish Breakdown below $0.10
Strong bearish Loss of $0.08
4. Should you buy now?
My opinion: Avoid chasing the huge green candle.
Wait for one of these:
A pullback followed by bullish confirmation.
A daily close above $0.135 followed by a successful retest.
A sudden reversal after a 128% pump is possible.
#brev #CYPHB #BLUR #CPIWatch #USJobData
Indicator Value
Current price $0.1301
24h change +128.72%
24h high $0.1350
24h low $0.0553
Trading volume 118.71M
Candle Large bullish candle
My interpretation: BREV has experienced a massive breakout with unusually high volume. This is bullish, but buying immediately after such a large candle carries substantial risk.
Important support and resistance
$0.1500–$0.2000
Potential upside resistance zones
$0.1350
Immediate resistance / 24h high
$0.1301
Current price
$0.1000
Potential breakout retest support
$0.0800–$0.0850
Previous consolidation zone These are estimated chart levels, not confirmed support or resistance.
3. Possible trading scenarios
Scenario What to watch
Bullish Daily close above $0.135
Retest Pullback toward $0.10
Bearish Breakdown below $0.10
Strong bearish Loss of $0.08
4. Should you buy now?
My opinion: Avoid chasing the huge green candle.
Wait for one of these:
A pullback followed by bullish confirmation.
A daily close above $0.135 followed by a successful retest.
A sudden reversal after a 128% pump is possible.
#brev #CYPHB #BLUR #CPIWatch #USJobData
445
·
--
$RARE RARE Token (Super Rare – RARE) is a cryptocurrency associated with the Super Rare NFT marketplace. Its price is influenced by Bitcoin's movement, trading volume, market sentiment, token demand, and NFT- market activity.
For a proper prediction, we should examine recent price action, support and resistance, volume, and momentum rather than rely on price predictions alone.
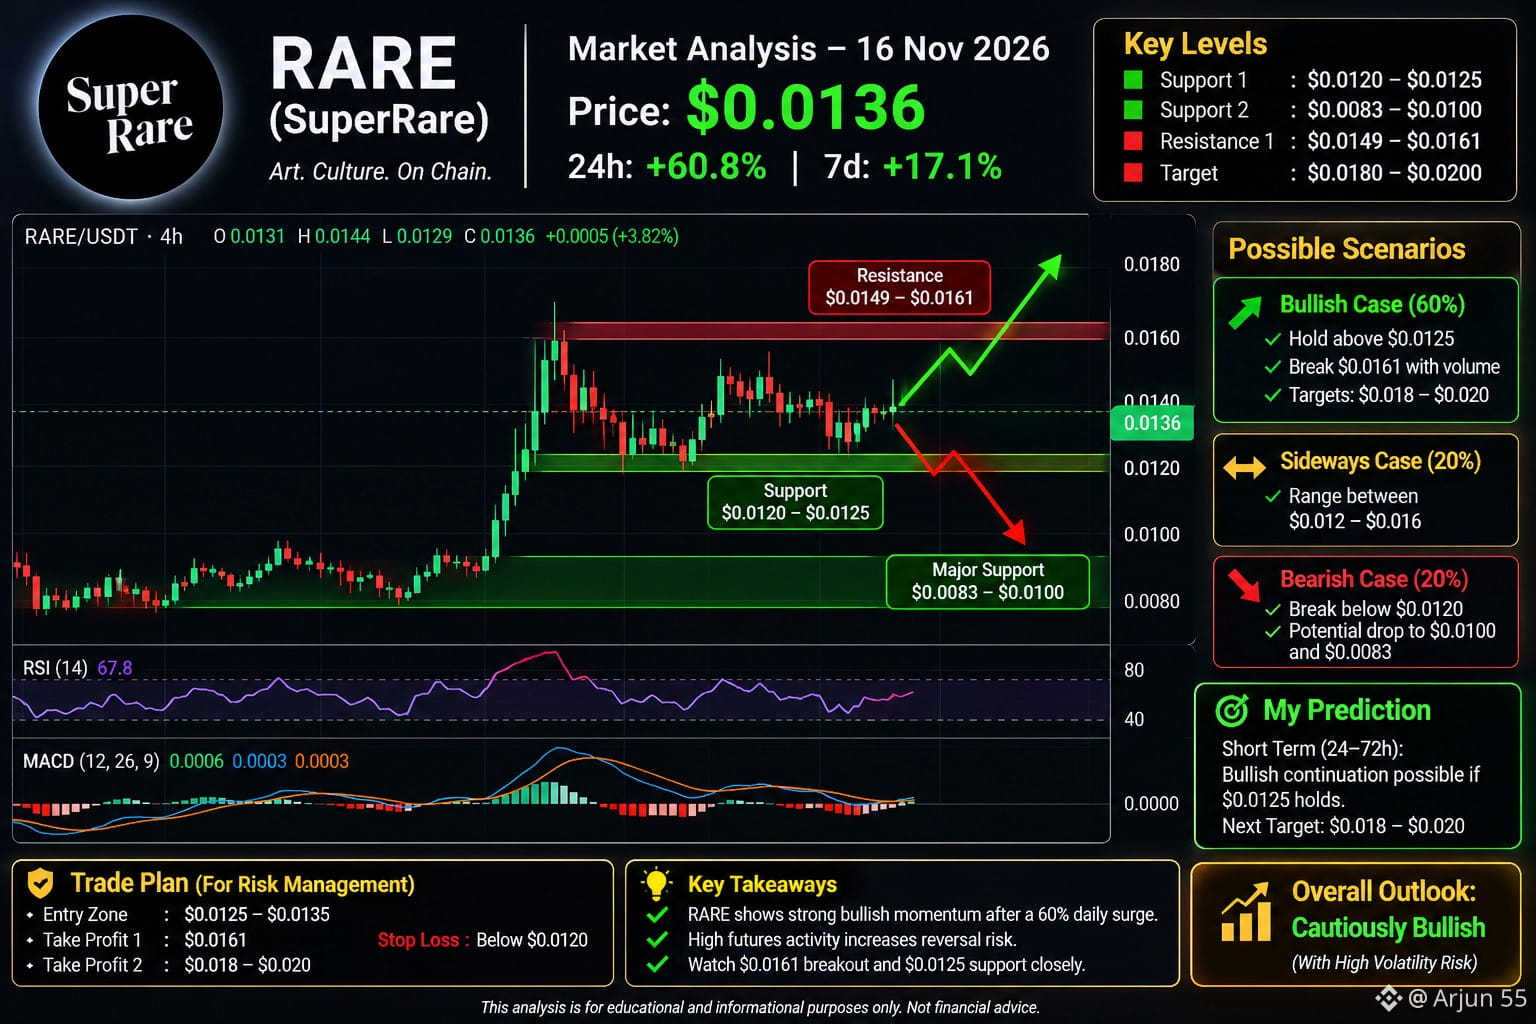
RARE recent market analysis — 16 November 2026
Indicator Latest reported data
Price $0.0128–$0.0144
24-hour movement +52% to +73%
7-day movement +17% approx.
Recent low $0.00826
Recent high $0.0161
Trading volume Extremely elevated
Sources:
Important price levels
Support: $0.0120–$0.0125
Major support: $0.0083–$0.0100
Resistance: $0.0149–$0.0161
Next bullish target: $0.0180–$0.0200
My prediction
Scenario Expected movement
Holds above $0.0125 Bullish continuation possible
Breaks $0.0161 with volume Potential move towards $0.018–$0.020
Falls below $0.0120 Bearish correction risk
Loses $0.0100 Potential retest of $0.0083
My view: RARE currently has bullish rebound momentum, but after a 50–70% daily surge, profit booking is a serious possibility. Futures activity is exceptionally high relative to spot trading, increasing liquidation and reversal risk.
This is a conditional technical forecast, not a guaranteed prediction.
#RARE #GLMR #win #CPIWatch #USJobData
{spot}(RAREUSDT)
{spot}(GLMRUSDT)
{spot}(WINUSDT)
$RARE RARE Token (Super Rare – RARE) is a cryptocurrency associated with the Super Rare NFT marketplace. Its price is influenced by Bitcoin's movement, trading volume, market sentiment, token demand, and NFT- market activity.
For a proper prediction, we should examine recent price action, support and resistance, volume, and momentum rather than rely on price predictions alone.
RARE recent market analysis — 16 November 2026
Indicator Latest reported data
Price $0.0128–$0.0144
24-hour movement +52% to +73%
7-day movement +17% approx.
Recent low $0.00826
Recent high $0.0161
Trading volume Extremely elevated
Sources:
Important price levels
Support: $0.0120–$0.0125
Major support: $0.0083–$0.0100
Resistance: $0.0149–$0.0161
Next bullish target: $0.0180–$0.0200
My prediction
Scenario Expected movement
Holds above $0.0125 Bullish continuation possible
Breaks $0.0161 with volume Potential move towards $0.018–$0.020
Falls below $0.0120 Bearish correction risk
Loses $0.0100 Potential retest of $0.0083
My view: RARE currently has bullish rebound momentum, but after a 50–70% daily surge, profit booking is a serious possibility. Futures activity is exceptionally high relative to spot trading, increasing liquidation and reversal risk.
This is a conditional technical forecast, not a guaranteed prediction.
#RARE #GLMR #win #CPIWatch #USJobData
For a proper prediction, we should examine recent price action, support and resistance, volume, and momentum rather than rely on price predictions alone.
RARE recent market analysis — 16 November 2026
Indicator Latest reported data
Price $0.0128–$0.0144
24-hour movement +52% to +73%
7-day movement +17% approx.
Recent low $0.00826
Recent high $0.0161
Trading volume Extremely elevated
Sources:
Important price levels
Support: $0.0120–$0.0125
Major support: $0.0083–$0.0100
Resistance: $0.0149–$0.0161
Next bullish target: $0.0180–$0.0200
My prediction
Scenario Expected movement
Holds above $0.0125 Bullish continuation possible
Breaks $0.0161 with volume Potential move towards $0.018–$0.020
Falls below $0.0120 Bearish correction risk
Loses $0.0100 Potential retest of $0.0083
My view: RARE currently has bullish rebound momentum, but after a 50–70% daily surge, profit booking is a serious possibility. Futures activity is exceptionally high relative to spot trading, increasing liquidation and reversal risk.
This is a conditional technical forecast, not a guaranteed prediction.
#RARE #GLMR #win #CPIWatch #USJobData
321
·
--
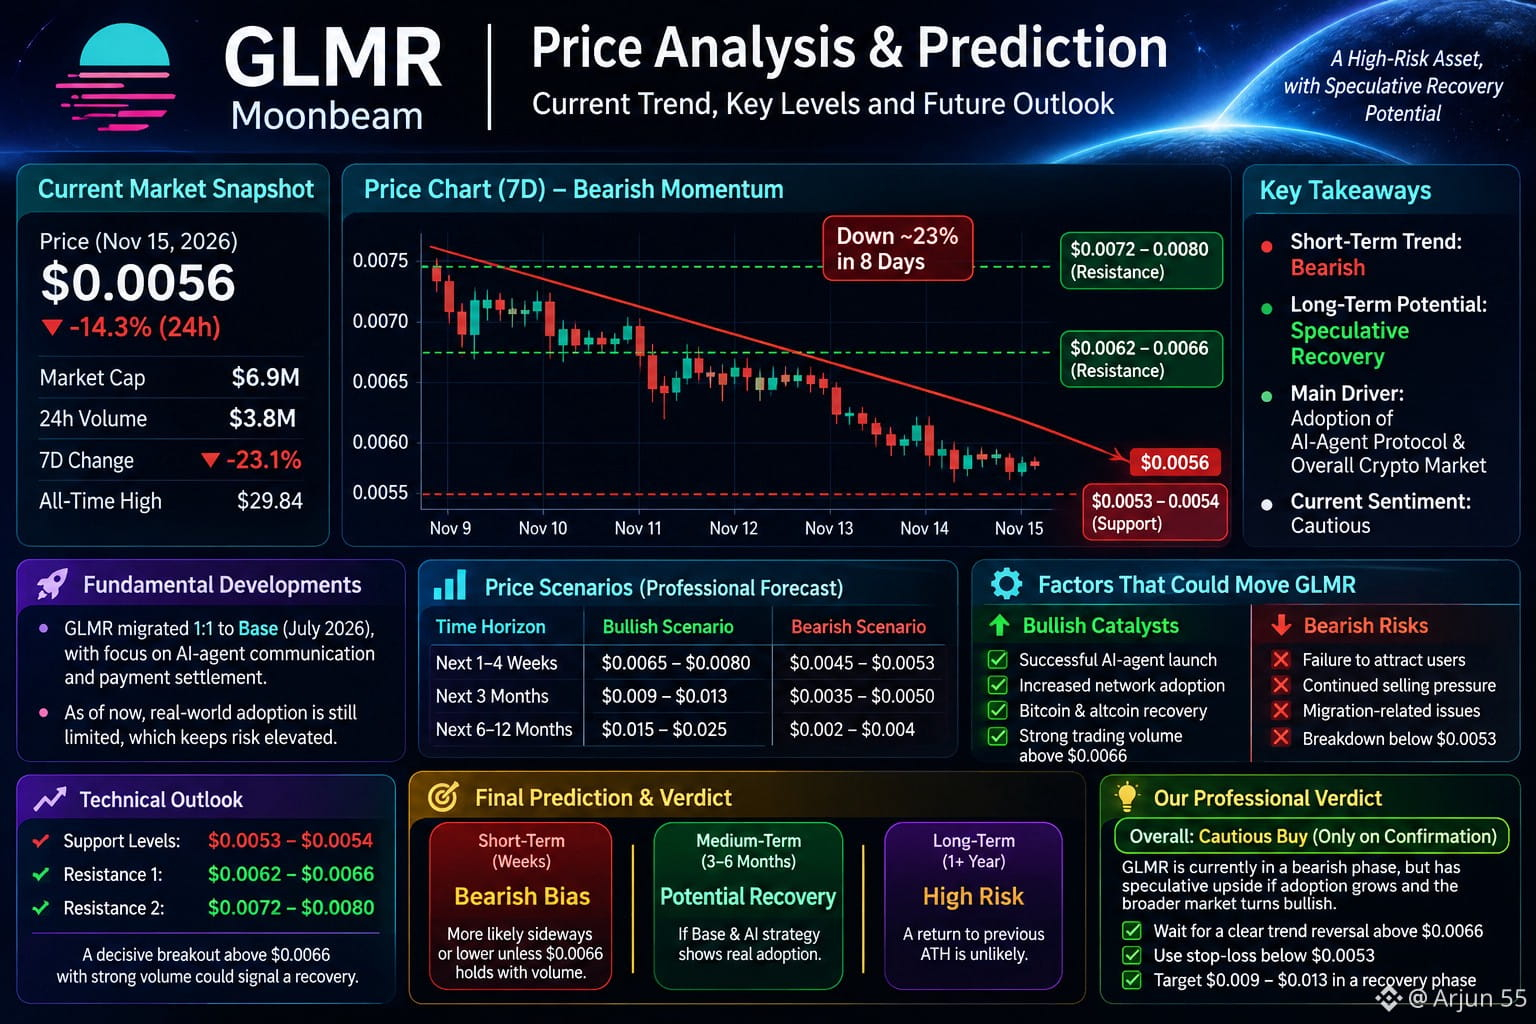
$GLMR GLMR (Moonbeam) token – price outlook
My initial view: GLMR is a high-risk, speculative altcoin. Its future price depends on Bitcoin's direction, overall altcoin liquidity, Moonbeam network adoption, and demand for the GLMR token.
For a proper prediction, we should distinguish a short-term recovery rally from a genuine long-term trend reversal. A price increase alone does not confirm a bull market
Recent price and market condition
GLMR current price
$0.0056–0.0057
Approximate market snapshot, November 15, 2026
Indicator Observation
Market cap ~$6.9 million
24-hour volume ~$3.8 million
7-day direction Down
All-time high $29.84 (CMC historical data)
Sources:
Recent price action is weak:
November 7: approximately $0.00736.
November 11: approximately $0.00693.
November 15: approximately $0.0057.
Important fundamental development
Moonbeam announced a major change in July 2026:
GLMR migrated 1:1 to Base.
The old Polkadot network was scheduled to shut down.
The new project direction focuses on AI-agent communication and payment settlement.
Important price levels to watch:
Support: $0.0053–0.0054
First resistance: $0.0062–0.0066
Stronger resistance: $0.0072–0.0080
Bullish catalysts
Successful launch of the AI-agent protocol.
Increased GLMR demand and real network usage.
Bearish risks
Failure to attract developers and users.
Continued selling pressure and weak liquidity.
Migration-related problems.
Another breakdown below $0.0053.
Final prediction: Up or down
My assessment:
Next few weeks: More likely sideways or downward unless GLMR recovers $0.0066 with strong volume.
Next 3–6 months: Potential recovery, but dependent on successful execution of the Base and AI strategy.
Long term: High-risk speculative investment. I would not assume a return to previous all-time highs.
My advice: Avoid buying simply because GLMR is trading near its historical low. Wait for evidence of a trend reversal.
#GLMR #INIT #dodo #CPIWatch #USJobData
{spot}(GLMRUSDT)
{spot}(INITUSDT)
{spot}(DODOUSDT)
$GLMR GLMR (Moonbeam) token – price outlook
My initial view: GLMR is a high-risk, speculative altcoin. Its future price depends on Bitcoin's direction, overall altcoin liquidity, Moonbeam network adoption, and demand for the GLMR token.
For a proper prediction, we should distinguish a short-term recovery rally from a genuine long-term trend reversal. A price increase alone does not confirm a bull market
Recent price and market condition
GLMR current price
$0.0056–0.0057
Approximate market snapshot, November 15, 2026
Indicator Observation
Market cap ~$6.9 million
24-hour volume ~$3.8 million
7-day direction Down
All-time high $29.84 (CMC historical data)
Sources:
Recent price action is weak:
November 7: approximately $0.00736.
November 11: approximately $0.00693.
November 15: approximately $0.0057.
Important fundamental development
Moonbeam announced a major change in July 2026:
GLMR migrated 1:1 to Base.
The old Polkadot network was scheduled to shut down.
The new project direction focuses on AI-agent communication and payment settlement.
Important price levels to watch:
Support: $0.0053–0.0054
First resistance: $0.0062–0.0066
Stronger resistance: $0.0072–0.0080
Bullish catalysts
Successful launch of the AI-agent protocol.
Increased GLMR demand and real network usage.
Bearish risks
Failure to attract developers and users.
Continued selling pressure and weak liquidity.
Migration-related problems.
Another breakdown below $0.0053.
Final prediction: Up or down
My assessment:
Next few weeks: More likely sideways or downward unless GLMR recovers $0.0066 with strong volume.
Next 3–6 months: Potential recovery, but dependent on successful execution of the Base and AI strategy.
Long term: High-risk speculative investment. I would not assume a return to previous all-time highs.
My advice: Avoid buying simply because GLMR is trading near its historical low. Wait for evidence of a trend reversal.
#GLMR #INIT #dodo #CPIWatch #USJobData
My initial view: GLMR is a high-risk, speculative altcoin. Its future price depends on Bitcoin's direction, overall altcoin liquidity, Moonbeam network adoption, and demand for the GLMR token.
For a proper prediction, we should distinguish a short-term recovery rally from a genuine long-term trend reversal. A price increase alone does not confirm a bull market
Recent price and market condition
GLMR current price
$0.0056–0.0057
Approximate market snapshot, November 15, 2026
Indicator Observation
Market cap ~$6.9 million
24-hour volume ~$3.8 million
7-day direction Down
All-time high $29.84 (CMC historical data)
Sources:
Recent price action is weak:
November 7: approximately $0.00736.
November 11: approximately $0.00693.
November 15: approximately $0.0057.
Important fundamental development
Moonbeam announced a major change in July 2026:
GLMR migrated 1:1 to Base.
The old Polkadot network was scheduled to shut down.
The new project direction focuses on AI-agent communication and payment settlement.
Important price levels to watch:
Support: $0.0053–0.0054
First resistance: $0.0062–0.0066
Stronger resistance: $0.0072–0.0080
Bullish catalysts
Successful launch of the AI-agent protocol.
Increased GLMR demand and real network usage.
Bearish risks
Failure to attract developers and users.
Continued selling pressure and weak liquidity.
Migration-related problems.
Another breakdown below $0.0053.
Final prediction: Up or down
My assessment:
Next few weeks: More likely sideways or downward unless GLMR recovers $0.0066 with strong volume.
Next 3–6 months: Potential recovery, but dependent on successful execution of the Base and AI strategy.
Long term: High-risk speculative investment. I would not assume a return to previous all-time highs.
My advice: Avoid buying simply because GLMR is trading near its historical low. Wait for evidence of a trend reversal.
#GLMR #INIT #dodo #CPIWatch #USJobData
341
·
--
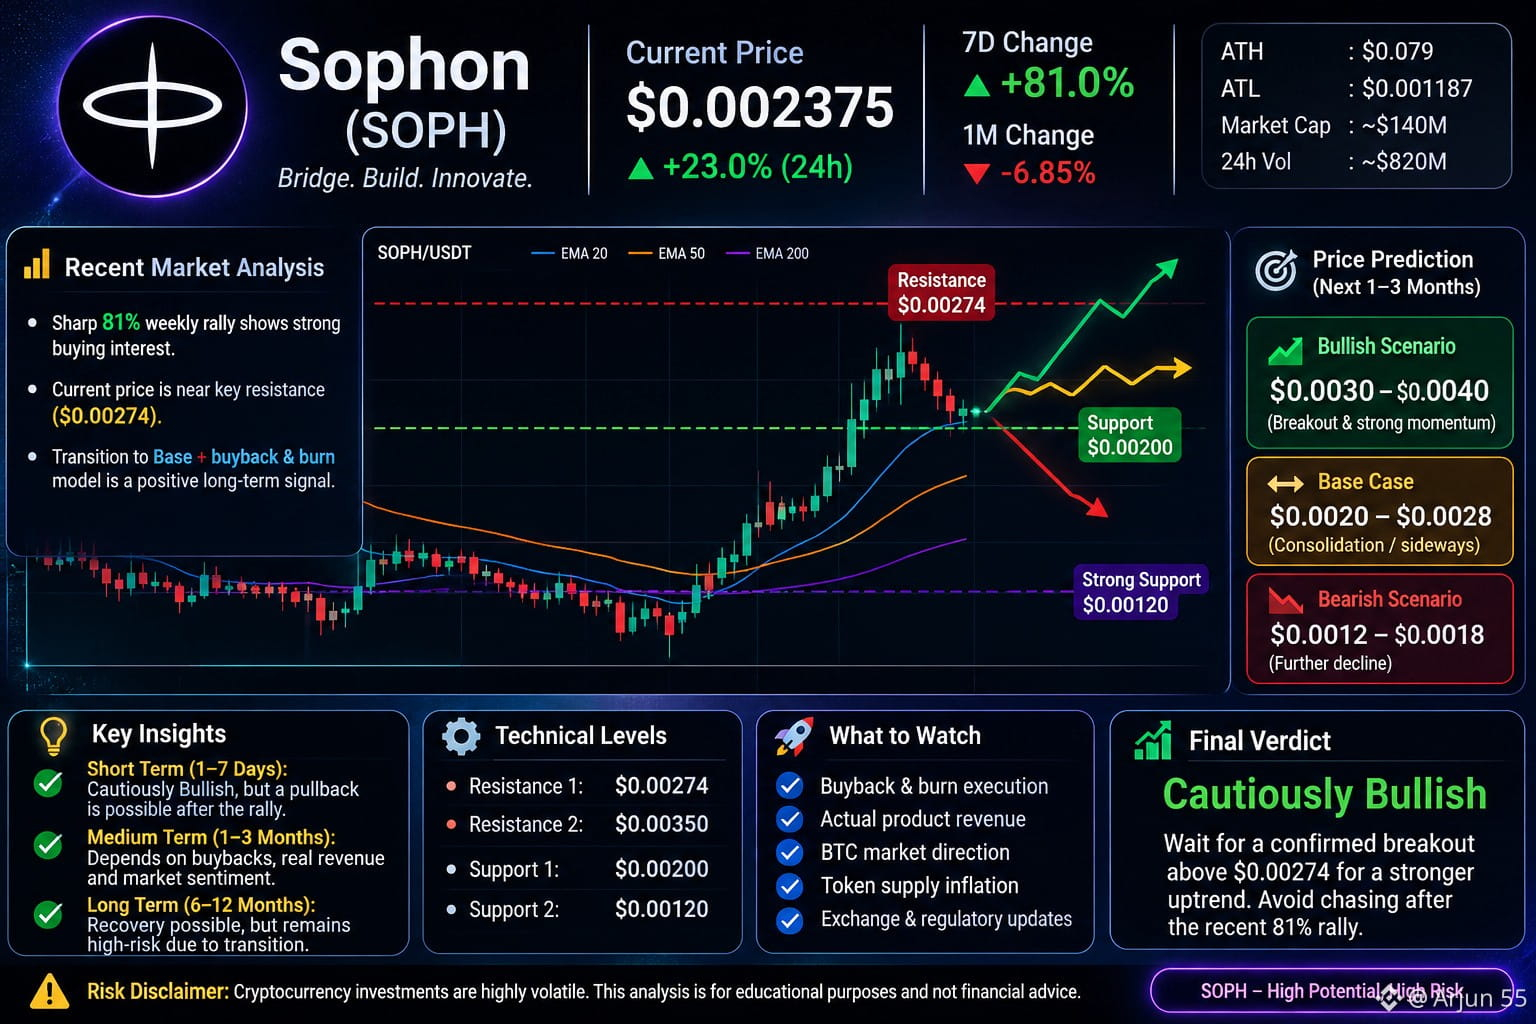
$SOPH SOPH recent market analysis
+$23% 24-hour movement
Reported by November 14, 2026
Reported price: approximately $0.002375.
7-day movement: approximately +81%.
1-month movement: approximately -6.85%.
All-time high: approximately $0.079.
Recent all-time low: approximately $0.001187.
Important fundamental development: Sophon is winding down its own blockchain and transitioning toward applications on Base. The project has announced a new SOPH buyback-and-burn model funded by product revenue.
This creates both risk and opportunity. Actual product revenue and buyback execution will matter more than announcements.
Future price prediction
Scenario Price target Outlook
Bullish $0.0030–0.0040 Breakout
Normal $0.0020–0.0028 Sideways
Bearish $0.0012–0.0018 Further decline
These are scenario levels, not guaranteed targets.
My assessment:
Short term (1–7 days): cautiously bullish, but a pullback after the sharp rally is possible.
Medium term (1–3 months): uncertain; sustainable growth depends on buybacks, actual revenue and investor confidence.
Long term (6–12 months): recovery is possible, but the transition away from its original blockchain makes SOPH a high-risk investment.
Important warning: High token-supply inflation and the recent exchange disclosure concerns add downside risk.
My conclusion
I would not chase SOPH after an 81% weekly rally. I would look for a price consolidation and a confirmed breakout above recent resistance around $0.00274 before considering the bullish trend stronger.
#SOPH #dodo #Aİ #CPIWatch #USJobData
{spot}(SOPHUSDT)
{spot}(DODOUSDT)
{spot}(AIUSDT)
$SOPH SOPH recent market analysis
+$23% 24-hour movement
Reported by November 14, 2026
Reported price: approximately $0.002375.
7-day movement: approximately +81%.
1-month movement: approximately -6.85%.
All-time high: approximately $0.079.
Recent all-time low: approximately $0.001187.
Important fundamental development: Sophon is winding down its own blockchain and transitioning toward applications on Base. The project has announced a new SOPH buyback-and-burn model funded by product revenue.
This creates both risk and opportunity. Actual product revenue and buyback execution will matter more than announcements.
Future price prediction
Scenario Price target Outlook
Bullish $0.0030–0.0040 Breakout
Normal $0.0020–0.0028 Sideways
Bearish $0.0012–0.0018 Further decline
These are scenario levels, not guaranteed targets.
My assessment:
Short term (1–7 days): cautiously bullish, but a pullback after the sharp rally is possible.
Medium term (1–3 months): uncertain; sustainable growth depends on buybacks, actual revenue and investor confidence.
Long term (6–12 months): recovery is possible, but the transition away from its original blockchain makes SOPH a high-risk investment.
Important warning: High token-supply inflation and the recent exchange disclosure concerns add downside risk.
My conclusion
I would not chase SOPH after an 81% weekly rally. I would look for a price consolidation and a confirmed breakout above recent resistance around $0.00274 before considering the bullish trend stronger.
#SOPH #dodo #Aİ #CPIWatch #USJobData
+$23% 24-hour movement
Reported by November 14, 2026
Reported price: approximately $0.002375.
7-day movement: approximately +81%.
1-month movement: approximately -6.85%.
All-time high: approximately $0.079.
Recent all-time low: approximately $0.001187.
Important fundamental development: Sophon is winding down its own blockchain and transitioning toward applications on Base. The project has announced a new SOPH buyback-and-burn model funded by product revenue.
This creates both risk and opportunity. Actual product revenue and buyback execution will matter more than announcements.
Future price prediction
Scenario Price target Outlook
Bullish $0.0030–0.0040 Breakout
Normal $0.0020–0.0028 Sideways
Bearish $0.0012–0.0018 Further decline
These are scenario levels, not guaranteed targets.
My assessment:
Short term (1–7 days): cautiously bullish, but a pullback after the sharp rally is possible.
Medium term (1–3 months): uncertain; sustainable growth depends on buybacks, actual revenue and investor confidence.
Long term (6–12 months): recovery is possible, but the transition away from its original blockchain makes SOPH a high-risk investment.
Important warning: High token-supply inflation and the recent exchange disclosure concerns add downside risk.
My conclusion
I would not chase SOPH after an 81% weekly rally. I would look for a price consolidation and a confirmed breakout above recent resistance around $0.00274 before considering the bullish trend stronger.
#SOPH #dodo #Aİ #CPIWatch #USJobData
246
·
--
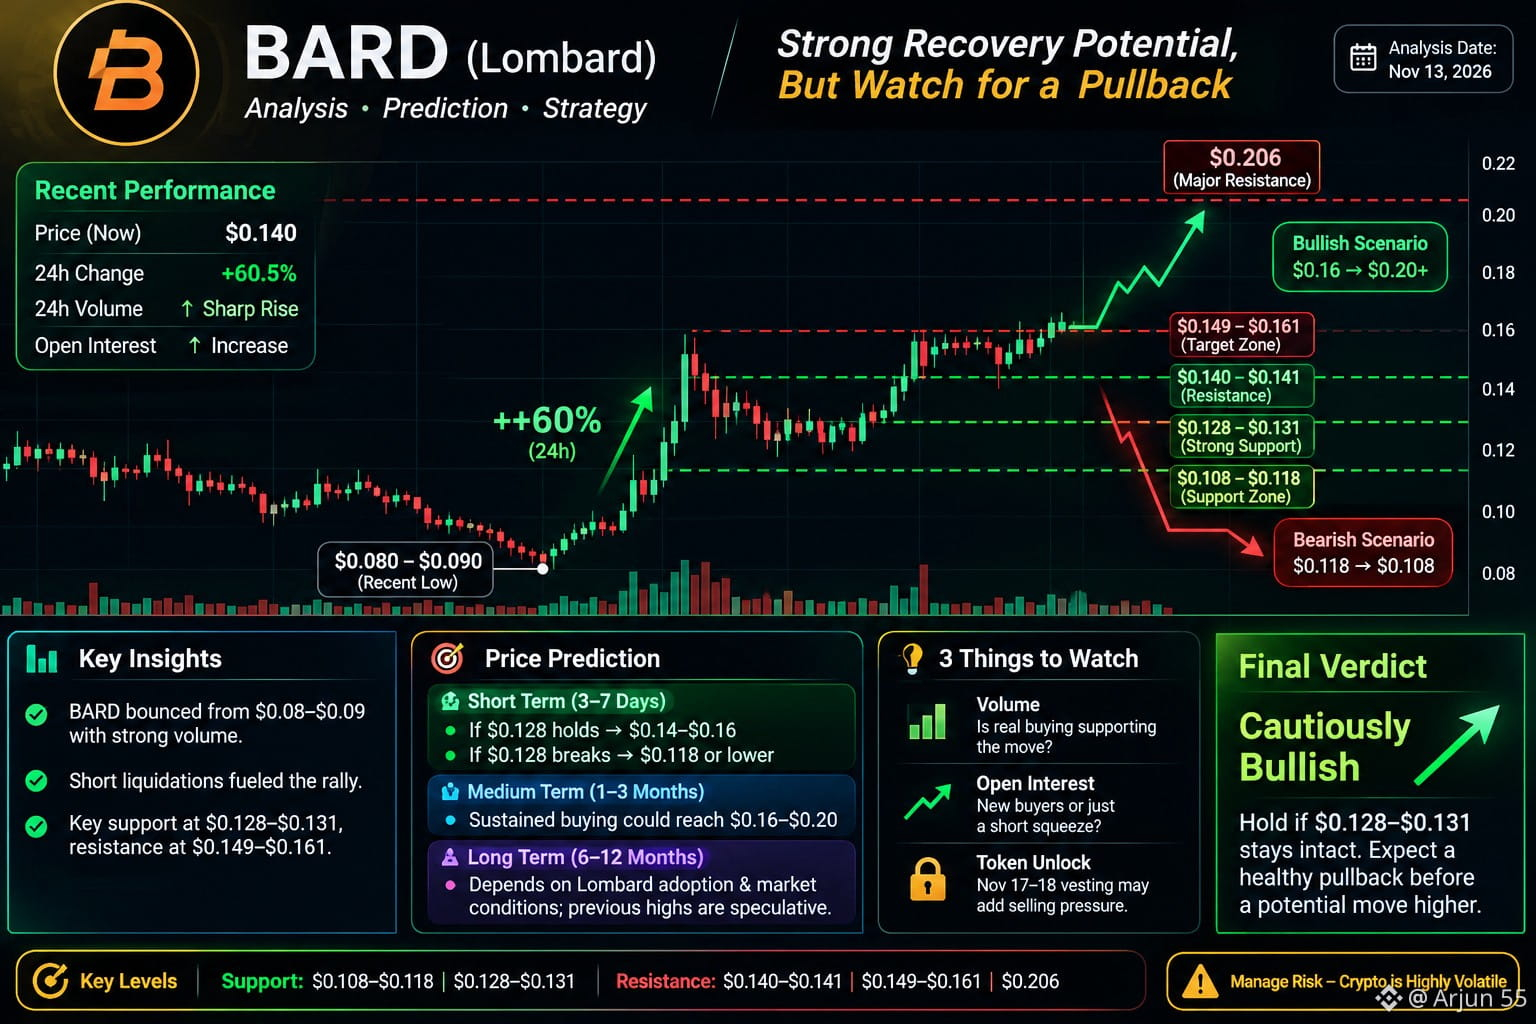
$BARD BARD (Lombard) Token – Short-Term & Future Price Analysis
My view: BARD has bullish short-term recovery potential, but the recent sharp pump makes a correction likely before a sustainable upward trend.
Recent price movement
As of November 13, 2026:
BARD recently bounced from approximately $0.08–$0.09.
It surged more than 60% in 24 hours.
Trading volume and futures open interest increased sharply.
Short liquidations helped accelerate the rally.
Important price levels
Price (USD) Significance
$0.108–0.118 Lower support zone
$0.128–0.131 Important support
$0.140–0.141 Immediate resistance
$0.149–0.161 Bullish targets
$0.206 Major resistance
My prediction
Short term (next 3–7 days)
If $0.128 holds, BARD could revisit $0.14–$0.16.
If $0.128 breaks, correction towards $0.118 or lower is possible.
Medium term (1–3 months)
Sustained buying could help BARD attempt $0.16–$0.20.
Failure to maintain support could result in another prolonged decline.
Long term (6–12 months)
Recovery depends on Lombard adoption, token demand, circulating supply and overall crypto market conditions.
A return to previous highs is highly speculative, not my base-case prediction.
Three things to watch
Volume: Is genuine spot buying supporting the price?
Open interest: Is new buying entering or is the rally mainly a short squeeze?
Token unlock: Upcoming November 17–18 vesting could create additional selling pressure.
Final verdict
I lean towards a possible continuation of the recovery, provided BARD holds $0.128–$0.131. However, chasing a 60% pump is risky. Wait for a confirmed breakout or a healthy pullback.
#Bard #SOPH #dodo #CPIWatch #USJobData
{spot}(BARDUSDT)
{spot}(SOPHUSDT)
{spot}(DODOUSDT)
$BARD BARD (Lombard) Token – Short-Term & Future Price Analysis
My view: BARD has bullish short-term recovery potential, but the recent sharp pump makes a correction likely before a sustainable upward trend.
Recent price movement
As of November 13, 2026:
BARD recently bounced from approximately $0.08–$0.09.
It surged more than 60% in 24 hours.
Trading volume and futures open interest increased sharply.
Short liquidations helped accelerate the rally.
Important price levels
Price (USD) Significance
$0.108–0.118 Lower support zone
$0.128–0.131 Important support
$0.140–0.141 Immediate resistance
$0.149–0.161 Bullish targets
$0.206 Major resistance
My prediction
Short term (next 3–7 days)
If $0.128 holds, BARD could revisit $0.14–$0.16.
If $0.128 breaks, correction towards $0.118 or lower is possible.
Medium term (1–3 months)
Sustained buying could help BARD attempt $0.16–$0.20.
Failure to maintain support could result in another prolonged decline.
Long term (6–12 months)
Recovery depends on Lombard adoption, token demand, circulating supply and overall crypto market conditions.
A return to previous highs is highly speculative, not my base-case prediction.
Three things to watch
Volume: Is genuine spot buying supporting the price?
Open interest: Is new buying entering or is the rally mainly a short squeeze?
Token unlock: Upcoming November 17–18 vesting could create additional selling pressure.
Final verdict
I lean towards a possible continuation of the recovery, provided BARD holds $0.128–$0.131. However, chasing a 60% pump is risky. Wait for a confirmed breakout or a healthy pullback.
#Bard #SOPH #dodo #CPIWatch #USJobData
My view: BARD has bullish short-term recovery potential, but the recent sharp pump makes a correction likely before a sustainable upward trend.
Recent price movement
As of November 13, 2026:
BARD recently bounced from approximately $0.08–$0.09.
It surged more than 60% in 24 hours.
Trading volume and futures open interest increased sharply.
Short liquidations helped accelerate the rally.
Important price levels
Price (USD) Significance
$0.108–0.118 Lower support zone
$0.128–0.131 Important support
$0.140–0.141 Immediate resistance
$0.149–0.161 Bullish targets
$0.206 Major resistance
My prediction
Short term (next 3–7 days)
If $0.128 holds, BARD could revisit $0.14–$0.16.
If $0.128 breaks, correction towards $0.118 or lower is possible.
Medium term (1–3 months)
Sustained buying could help BARD attempt $0.16–$0.20.
Failure to maintain support could result in another prolonged decline.
Long term (6–12 months)
Recovery depends on Lombard adoption, token demand, circulating supply and overall crypto market conditions.
A return to previous highs is highly speculative, not my base-case prediction.
Three things to watch
Volume: Is genuine spot buying supporting the price?
Open interest: Is new buying entering or is the rally mainly a short squeeze?
Token unlock: Upcoming November 17–18 vesting could create additional selling pressure.
Final verdict
I lean towards a possible continuation of the recovery, provided BARD holds $0.128–$0.131. However, chasing a 60% pump is risky. Wait for a confirmed breakout or a healthy pullback.
#Bard #SOPH #dodo #CPIWatch #USJobData
420
·
--
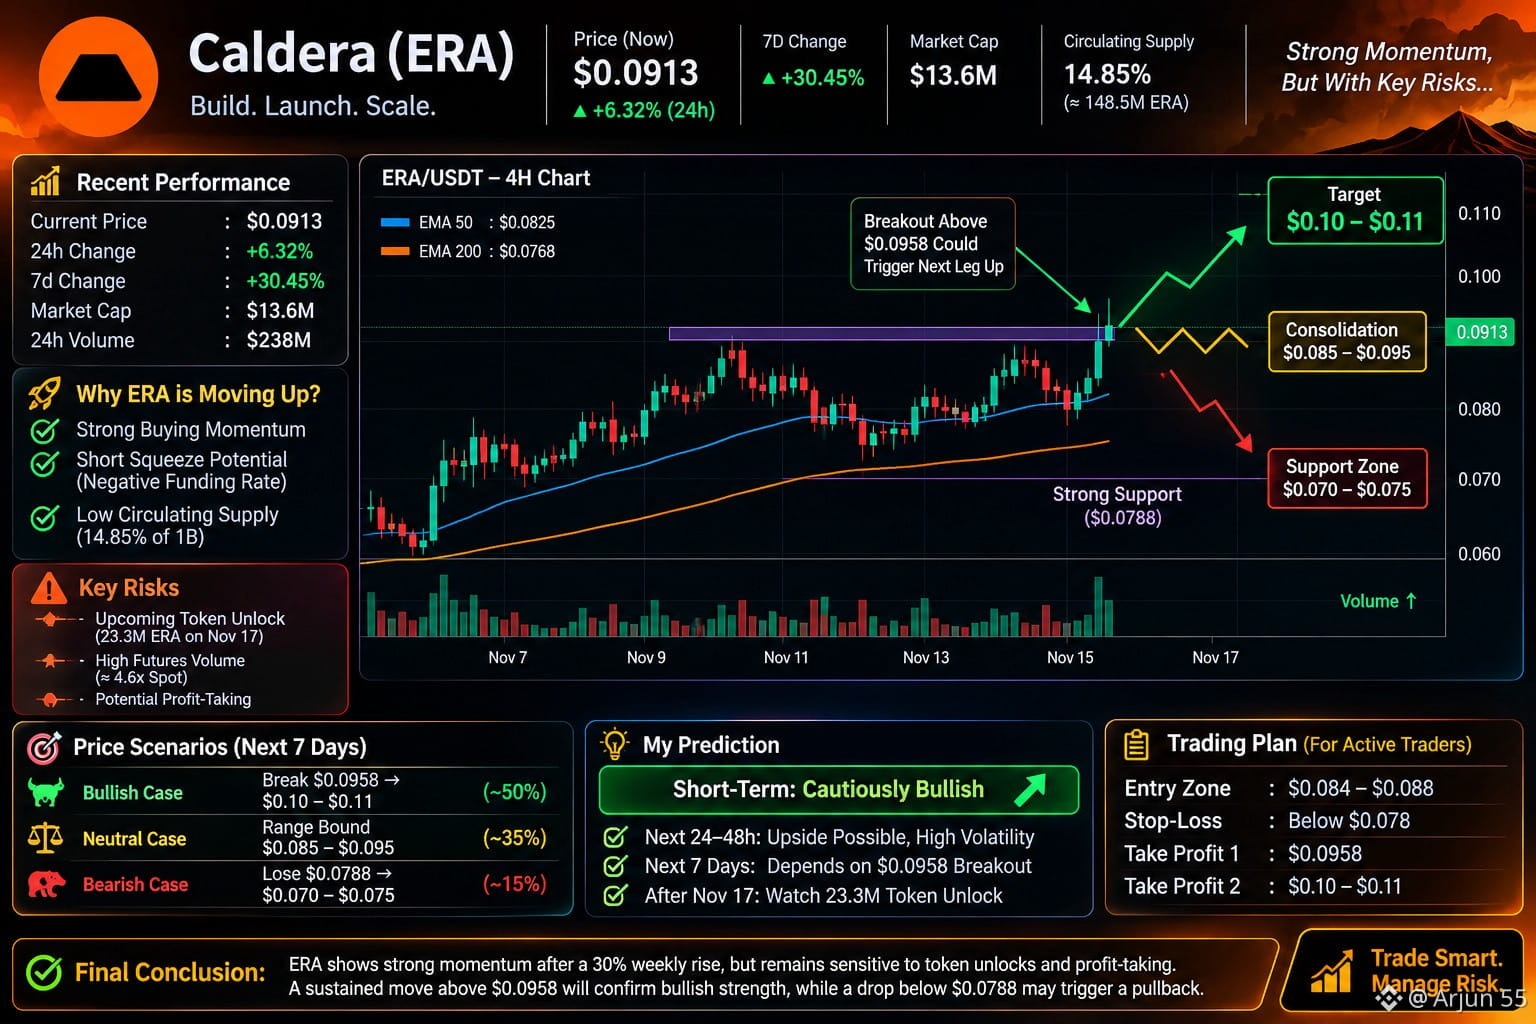
$ERA Caldera (ERA) Token – Recent Performance & Future Prediction
Assuming you mean Caldera (ERA) cryptocurrency.
Recent market performance
As of November 12, 2026:
Current price: approximately $0.0913
24-hour movement: +6.32%
7-day movement: +30.45%
Market cap: approximately $13.6 million.
Trading activity has increased significantly.
ERA has shown a strong recovery recently. However, a sharp rally can also attract profit-booking.
Why is ERA moving up?
Three important factors:
Buying momentum: Strong recent price appreciation.
Short squeeze possibility: Negative futures funding suggests bearish traders are paying longs.
Supply risk: Only around 14.85% of the maximum 1 billion tokens are circulating, so future token releases could create selling pressure.
Future price prediction
My assessment for the next few days:
Scenario Possible movement
Bullish Break above $0.0958, potentially test $0.10–$0.11
Neutral Consolidation around $0.085–$0.095
Bearish Lose $0.0788, potentially fall towards $0.070–$0.075
These are scenario levels, not guaranteed targets.
My prediction
Next 24–48 hours: Upside is possible, but volatility is high.
Next 7 days: Direction depends on whether ERA sustains its breakout.
After November 17: Watch the 23.3 million ERA token unlock, which could introduce selling pressure.
One important warning: futures volume is approximately 4.6 times spot volume. This makes the rally vulnerable to sudden reversals.
My conclusion: ERA currently has positive momentum, but I would not chase the price after a 30% weekly rise. A sustained move above $0.0958 would strengthen the bullish case.
#ERA #MBL #SKDDB #CPIWatch #USJobData
{spot}(ERAUSDT)
{spot}(MBLUSDT)
{spot}(SKDDBUSDT)
$ERA Caldera (ERA) Token – Recent Performance & Future Prediction
Assuming you mean Caldera (ERA) cryptocurrency.
Recent market performance
As of November 12, 2026:
Current price: approximately $0.0913
24-hour movement: +6.32%
7-day movement: +30.45%
Market cap: approximately $13.6 million.
Trading activity has increased significantly.
ERA has shown a strong recovery recently. However, a sharp rally can also attract profit-booking.
Why is ERA moving up?
Three important factors:
Buying momentum: Strong recent price appreciation.
Short squeeze possibility: Negative futures funding suggests bearish traders are paying longs.
Supply risk: Only around 14.85% of the maximum 1 billion tokens are circulating, so future token releases could create selling pressure.
Future price prediction
My assessment for the next few days:
Scenario Possible movement
Bullish Break above $0.0958, potentially test $0.10–$0.11
Neutral Consolidation around $0.085–$0.095
Bearish Lose $0.0788, potentially fall towards $0.070–$0.075
These are scenario levels, not guaranteed targets.
My prediction
Next 24–48 hours: Upside is possible, but volatility is high.
Next 7 days: Direction depends on whether ERA sustains its breakout.
After November 17: Watch the 23.3 million ERA token unlock, which could introduce selling pressure.
One important warning: futures volume is approximately 4.6 times spot volume. This makes the rally vulnerable to sudden reversals.
My conclusion: ERA currently has positive momentum, but I would not chase the price after a 30% weekly rise. A sustained move above $0.0958 would strengthen the bullish case.
#ERA #MBL #SKDDB #CPIWatch #USJobData
Assuming you mean Caldera (ERA) cryptocurrency.
Recent market performance
As of November 12, 2026:
Current price: approximately $0.0913
24-hour movement: +6.32%
7-day movement: +30.45%
Market cap: approximately $13.6 million.
Trading activity has increased significantly.
ERA has shown a strong recovery recently. However, a sharp rally can also attract profit-booking.
Why is ERA moving up?
Three important factors:
Buying momentum: Strong recent price appreciation.
Short squeeze possibility: Negative futures funding suggests bearish traders are paying longs.
Supply risk: Only around 14.85% of the maximum 1 billion tokens are circulating, so future token releases could create selling pressure.
Future price prediction
My assessment for the next few days:
Scenario Possible movement
Bullish Break above $0.0958, potentially test $0.10–$0.11
Neutral Consolidation around $0.085–$0.095
Bearish Lose $0.0788, potentially fall towards $0.070–$0.075
These are scenario levels, not guaranteed targets.
My prediction
Next 24–48 hours: Upside is possible, but volatility is high.
Next 7 days: Direction depends on whether ERA sustains its breakout.
After November 17: Watch the 23.3 million ERA token unlock, which could introduce selling pressure.
One important warning: futures volume is approximately 4.6 times spot volume. This makes the rally vulnerable to sudden reversals.
My conclusion: ERA currently has positive momentum, but I would not chase the price after a 30% weekly rise. A sustained move above $0.0958 would strengthen the bullish case.
#ERA #MBL #SKDDB #CPIWatch #USJobData
162
·
--
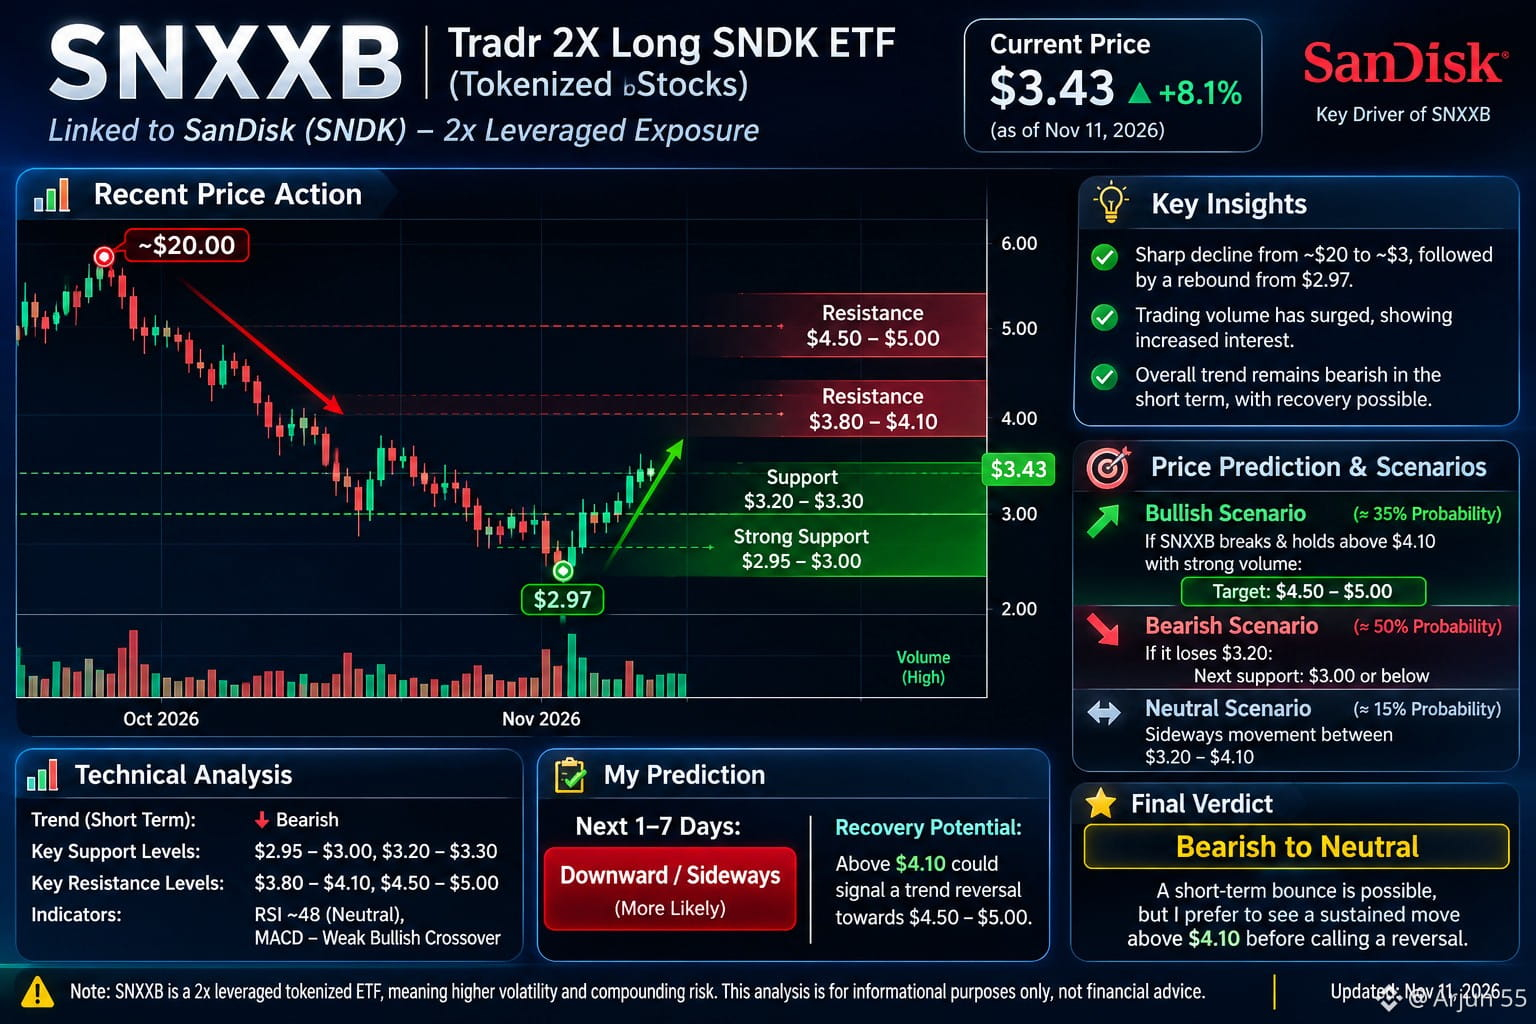
$SNXXB B – Recent Analysis & Future Price Prediction
Updated: 11 November 2026 | Short-term outlook
SN XXB (Tradr 2X Long SNDK ETF Tokenized b Stocks) is a leveraged tokenized investment linked to SanDisk (SNDK). Its price is heavily influenced by SanDisk's stock performance.
$3.43–$4.01
Recent reported price range across sources
Recent price movement
SN XXB suffered a sharp decline from around $20 to near $3.
It recently rebounded from approximately $2.97.
Trading volume has increased significantly.
Despite the rebound, the broader short-term trend remains bearish.
Future prediction
Price level Significance
$2.95–$3.00 Strong support zone
$3.20–$3.30 Near-term support
$3.80–$4.10 Resistance
$4.50–$5.00 Bullish recovery target
Below $2.95 Further downside risk
These are technical scenario levels, not guaranteed targets.
My prediction
Next 1–7 days
Downward / sideways
Bullish scenario: If SN XXB breaks $4.10 and holds above it with strong volume, recovery towards $4.50–$5 becomes possible.
Bearish scenario: If it loses $3.20, it could retest $3.00 or fall below it.
Most important factor
SN XXB is linked to a 2x leveraged SanDisk ETF structure. This means movements in SanDisk can have amplified effects. Daily leverage also creates compounding and volatility-decay risks.
Final verdict: I would currently classify SN XXB as bearish-to-neutral. A short-term bounce is possible, but I would want to see a sustained move above $4.10 before calling a trend reversal.
This is a probability-based market assessment, not financial advice.
#SNXXB #MUUB #CRWVB #CPIWatch #USJobData
{spot}(SNXXBUSDT)
{spot}(MUUBUSDT)
{spot}(CRWVBUSDT)
$SNXXB B – Recent Analysis & Future Price Prediction
Updated: 11 November 2026 | Short-term outlook
SN XXB (Tradr 2X Long SNDK ETF Tokenized b Stocks) is a leveraged tokenized investment linked to SanDisk (SNDK). Its price is heavily influenced by SanDisk's stock performance.
$3.43–$4.01
Recent reported price range across sources
Recent price movement
SN XXB suffered a sharp decline from around $20 to near $3.
It recently rebounded from approximately $2.97.
Trading volume has increased significantly.
Despite the rebound, the broader short-term trend remains bearish.
Future prediction
Price level Significance
$2.95–$3.00 Strong support zone
$3.20–$3.30 Near-term support
$3.80–$4.10 Resistance
$4.50–$5.00 Bullish recovery target
Below $2.95 Further downside risk
These are technical scenario levels, not guaranteed targets.
My prediction
Next 1–7 days
Downward / sideways
Bullish scenario: If SN XXB breaks $4.10 and holds above it with strong volume, recovery towards $4.50–$5 becomes possible.
Bearish scenario: If it loses $3.20, it could retest $3.00 or fall below it.
Most important factor
SN XXB is linked to a 2x leveraged SanDisk ETF structure. This means movements in SanDisk can have amplified effects. Daily leverage also creates compounding and volatility-decay risks.
Final verdict: I would currently classify SN XXB as bearish-to-neutral. A short-term bounce is possible, but I would want to see a sustained move above $4.10 before calling a trend reversal.
This is a probability-based market assessment, not financial advice.
#SNXXB #MUUB #CRWVB #CPIWatch #USJobData
Updated: 11 November 2026 | Short-term outlook
SN XXB (Tradr 2X Long SNDK ETF Tokenized b Stocks) is a leveraged tokenized investment linked to SanDisk (SNDK). Its price is heavily influenced by SanDisk's stock performance.
$3.43–$4.01
Recent reported price range across sources
Recent price movement
SN XXB suffered a sharp decline from around $20 to near $3.
It recently rebounded from approximately $2.97.
Trading volume has increased significantly.
Despite the rebound, the broader short-term trend remains bearish.
Future prediction
Price level Significance
$2.95–$3.00 Strong support zone
$3.20–$3.30 Near-term support
$3.80–$4.10 Resistance
$4.50–$5.00 Bullish recovery target
Below $2.95 Further downside risk
These are technical scenario levels, not guaranteed targets.
My prediction
Next 1–7 days
Downward / sideways
Bullish scenario: If SN XXB breaks $4.10 and holds above it with strong volume, recovery towards $4.50–$5 becomes possible.
Bearish scenario: If it loses $3.20, it could retest $3.00 or fall below it.
Most important factor
SN XXB is linked to a 2x leveraged SanDisk ETF structure. This means movements in SanDisk can have amplified effects. Daily leverage also creates compounding and volatility-decay risks.
Final verdict: I would currently classify SN XXB as bearish-to-neutral. A short-term bounce is possible, but I would want to see a sustained move above $4.10 before calling a trend reversal.
This is a probability-based market assessment, not financial advice.
#SNXXB #MUUB #CRWVB #CPIWatch #USJobData
578
·
--
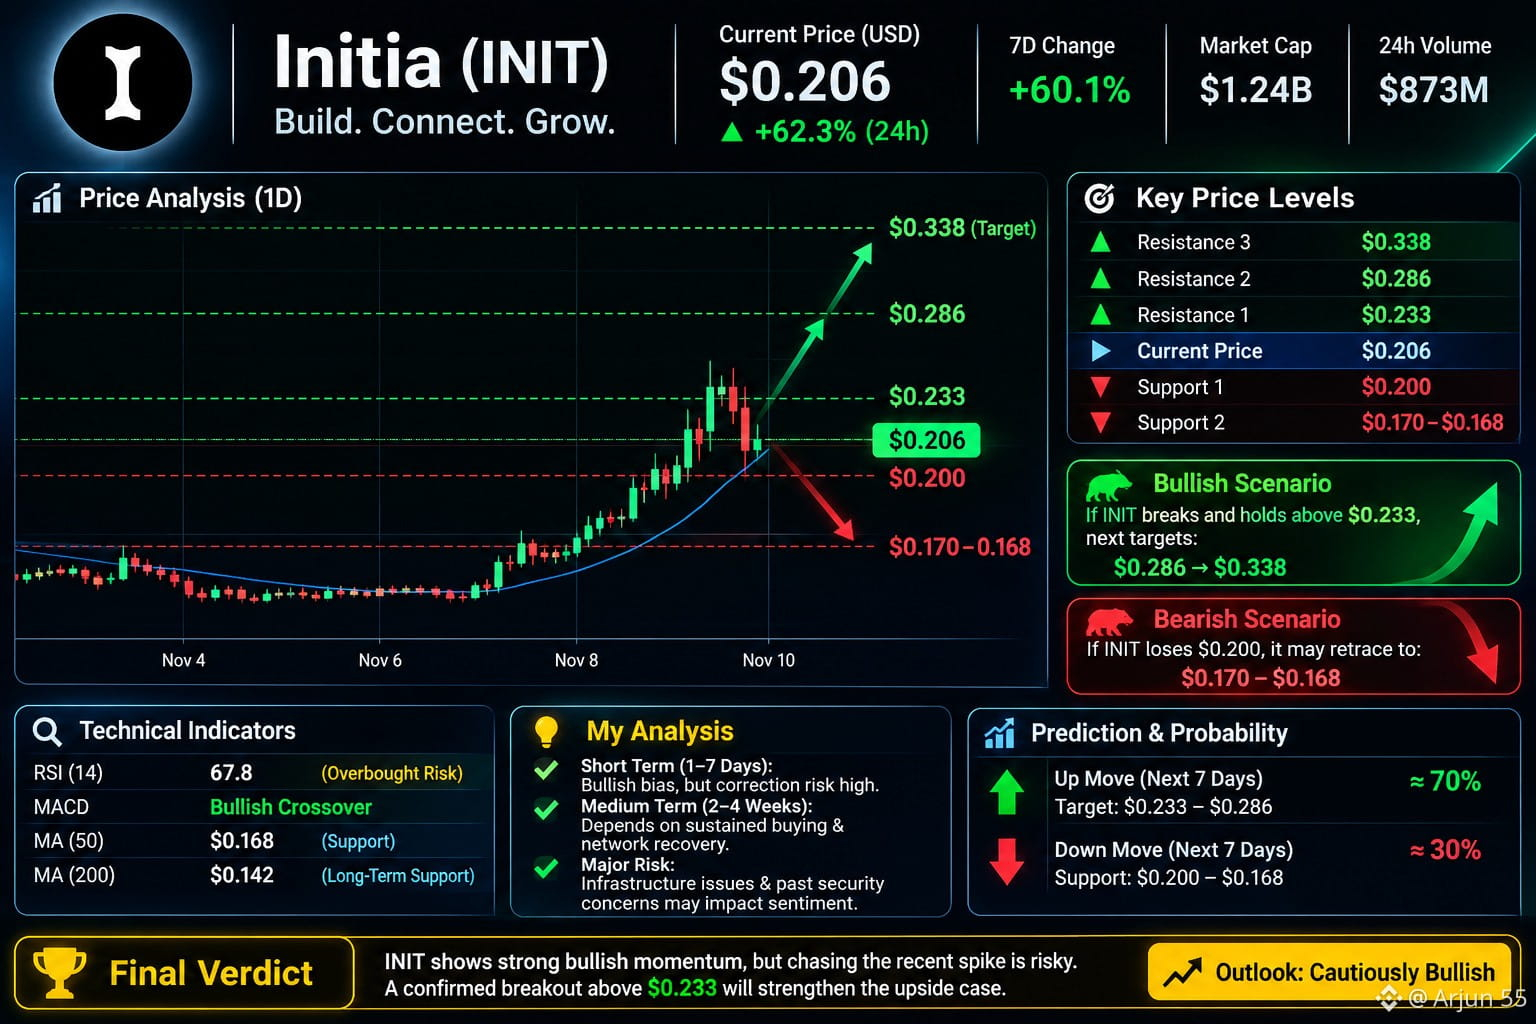
$INIT INIT (Ini tia) Token – Recent Analysis & Future Prediction
As of 10 November 2026, INIT is showing a strong recovery.
Market snapshot (USD)
Current price: approximately $0.20–$0.21
24-hour gain: approximately 58–71%
7-day gain: approximately 57–64%
RSI: approximately 67–69, indicating potentially overbought conditions.
Important price levels
Level Price (USD)
First resistance $0.215–0.216
Second resistance $0.233
Major resistance $0.286
Strong upside target $0.338
First support $0.200
Strong support $0.170–0.168
Future movement prediction
If INIT breaks and sustains above $0.233, the next possible targets are $0.286 and $0.338.
If INIT loses $0.200, it could retrace towards $0.170–$0.168.
My analysis
Short term (1–7 days): Bullish bias, but correction risk is high.
Medium term (2–4 weeks): Depends on sustained buying and network recovery.
Major risk: Recent rollup infrastructure disruption and earlier security concerns could affect investor confidence.
My verdict: INIT has bullish momentum, but chasing the recent sharp rise is risky. A confirmed breakout above $0.233 would strengthen the bullish case.
#INIT #QI #one #CPIWatch #USJobData
{spot}(INITUSDT)
{spot}(QIUSDT)
{spot}(ONEUSDT)
$INIT INIT (Ini tia) Token – Recent Analysis & Future Prediction
As of 10 November 2026, INIT is showing a strong recovery.
Market snapshot (USD)
Current price: approximately $0.20–$0.21
24-hour gain: approximately 58–71%
7-day gain: approximately 57–64%
RSI: approximately 67–69, indicating potentially overbought conditions.
Important price levels
Level Price (USD)
First resistance $0.215–0.216
Second resistance $0.233
Major resistance $0.286
Strong upside target $0.338
First support $0.200
Strong support $0.170–0.168
Future movement prediction
If INIT breaks and sustains above $0.233, the next possible targets are $0.286 and $0.338.
If INIT loses $0.200, it could retrace towards $0.170–$0.168.
My analysis
Short term (1–7 days): Bullish bias, but correction risk is high.
Medium term (2–4 weeks): Depends on sustained buying and network recovery.
Major risk: Recent rollup infrastructure disruption and earlier security concerns could affect investor confidence.
My verdict: INIT has bullish momentum, but chasing the recent sharp rise is risky. A confirmed breakout above $0.233 would strengthen the bullish case.
#INIT #QI #one #CPIWatch #USJobData
As of 10 November 2026, INIT is showing a strong recovery.
Market snapshot (USD)
Current price: approximately $0.20–$0.21
24-hour gain: approximately 58–71%
7-day gain: approximately 57–64%
RSI: approximately 67–69, indicating potentially overbought conditions.
Important price levels
Level Price (USD)
First resistance $0.215–0.216
Second resistance $0.233
Major resistance $0.286
Strong upside target $0.338
First support $0.200
Strong support $0.170–0.168
Future movement prediction
If INIT breaks and sustains above $0.233, the next possible targets are $0.286 and $0.338.
If INIT loses $0.200, it could retrace towards $0.170–$0.168.
My analysis
Short term (1–7 days): Bullish bias, but correction risk is high.
Medium term (2–4 weeks): Depends on sustained buying and network recovery.
Major risk: Recent rollup infrastructure disruption and earlier security concerns could affect investor confidence.
My verdict: INIT has bullish momentum, but chasing the recent sharp rise is risky. A confirmed breakout above $0.233 would strengthen the bullish case.
#INIT #QI #one #CPIWatch #USJobData
229
·
--
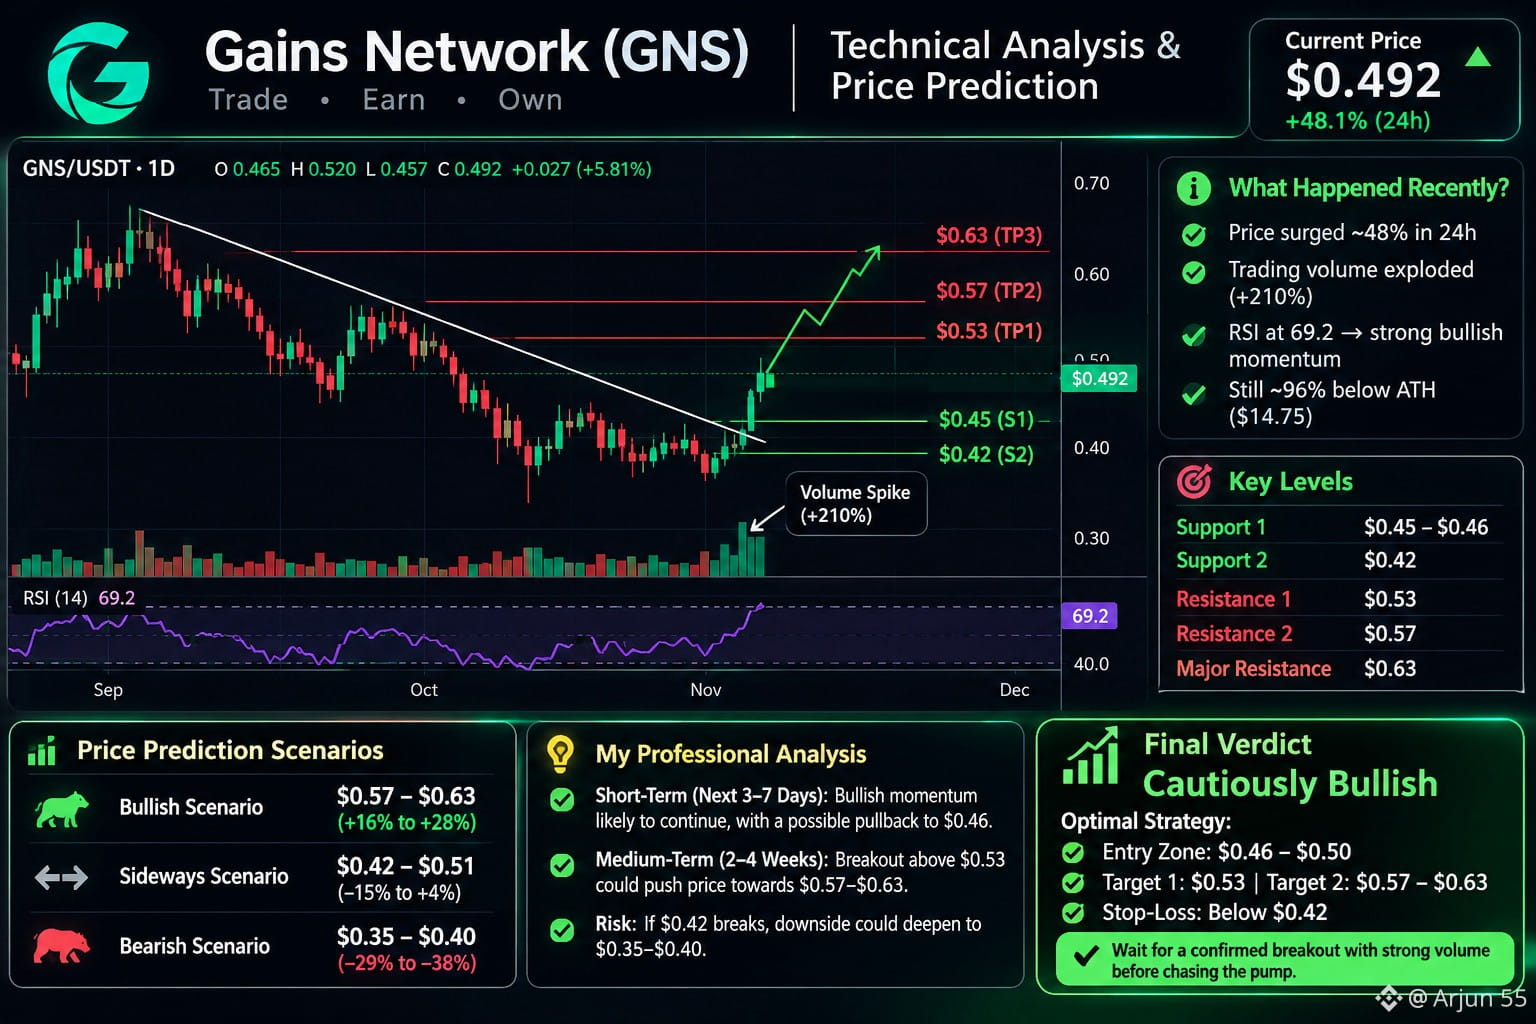
$GNS Gains Network (GNS) – Price Analysis & Prediction
Current price: Approximately $0.48–$0.51 (November 9, 2026).
What happened recently?
GNS surged approximately 48% in 24 hours.
Trading volume increased sharply, indicating strong buying activity.
However, the token remains around 96% below its all-time high.
RSI is around 60, showing positive but not yet extreme momentum.
Important price levels
Level Price (USD)
Support 1 $0.45–0.46
Support 2 $0.42
Resistance 1 $0.50–0.51
Resistance 2 $0.53
Major resistance $0.57
Future prediction
These are scenario estimates, not guaranteed targets.
Scenario Possible price
Bullish $0.57–$0.63
Sideways $0.42–$0.51
Bearish $0.35–$0.40
My assessment:
Next few days: Bullish momentum, but a pullback is possible.
Next 2–4 weeks: Potential upside if GNS breaks and holds above $0.51.
If it loses $0.42, downside risk increases considerably.
Final verdict
I would not chase the recent 48% pump. A sustained breakout above $0.51 with strong volume would strengthen the bullish case.
#GNS #TST #ARB #CPIWatch #USJobData
{spot}(GNSUSDT)
{spot}(TSTUSDT)
{spot}(ARBUSDT)
$GNS Gains Network (GNS) – Price Analysis & Prediction
Current price: Approximately $0.48–$0.51 (November 9, 2026).
What happened recently?
GNS surged approximately 48% in 24 hours.
Trading volume increased sharply, indicating strong buying activity.
However, the token remains around 96% below its all-time high.
RSI is around 60, showing positive but not yet extreme momentum.
Important price levels
Level Price (USD)
Support 1 $0.45–0.46
Support 2 $0.42
Resistance 1 $0.50–0.51
Resistance 2 $0.53
Major resistance $0.57
Future prediction
These are scenario estimates, not guaranteed targets.
Scenario Possible price
Bullish $0.57–$0.63
Sideways $0.42–$0.51
Bearish $0.35–$0.40
My assessment:
Next few days: Bullish momentum, but a pullback is possible.
Next 2–4 weeks: Potential upside if GNS breaks and holds above $0.51.
If it loses $0.42, downside risk increases considerably.
Final verdict
I would not chase the recent 48% pump. A sustained breakout above $0.51 with strong volume would strengthen the bullish case.
#GNS #TST #ARB #CPIWatch #USJobData
Current price: Approximately $0.48–$0.51 (November 9, 2026).
What happened recently?
GNS surged approximately 48% in 24 hours.
Trading volume increased sharply, indicating strong buying activity.
However, the token remains around 96% below its all-time high.
RSI is around 60, showing positive but not yet extreme momentum.
Important price levels
Level Price (USD)
Support 1 $0.45–0.46
Support 2 $0.42
Resistance 1 $0.50–0.51
Resistance 2 $0.53
Major resistance $0.57
Future prediction
These are scenario estimates, not guaranteed targets.
Scenario Possible price
Bullish $0.57–$0.63
Sideways $0.42–$0.51
Bearish $0.35–$0.40
My assessment:
Next few days: Bullish momentum, but a pullback is possible.
Next 2–4 weeks: Potential upside if GNS breaks and holds above $0.51.
If it loses $0.42, downside risk increases considerably.
Final verdict
I would not chase the recent 48% pump. A sustained breakout above $0.51 with strong volume would strengthen the bullish case.
#GNS #TST #ARB #CPIWatch #USJobData
327
·
--
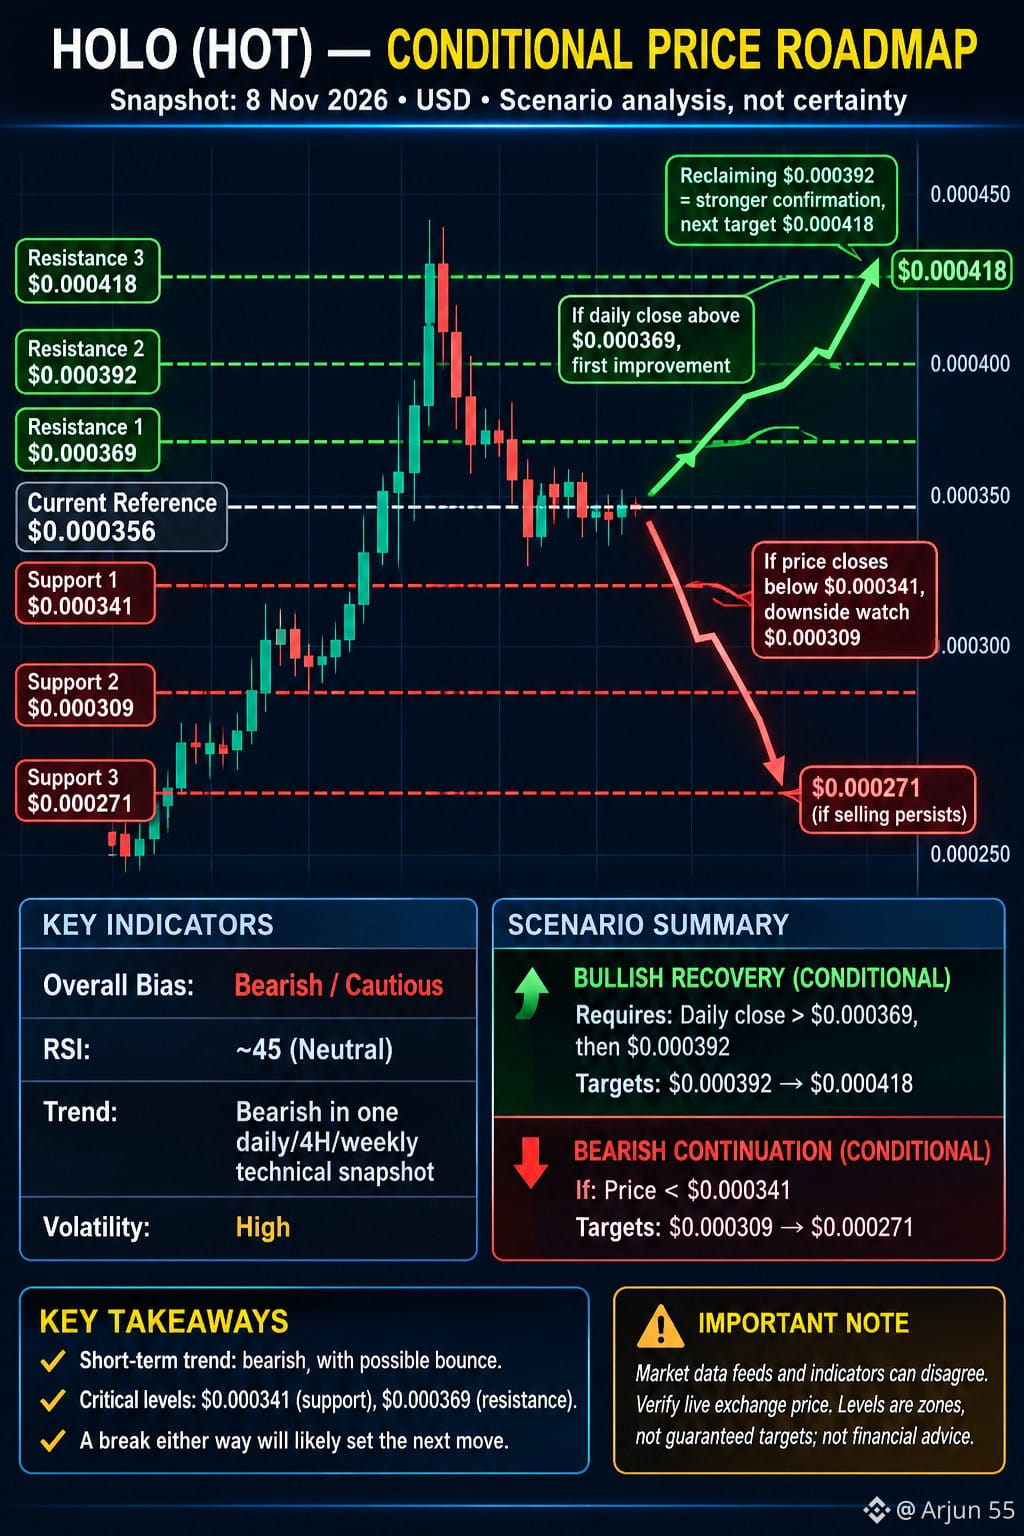
$HOT Holo (HOT) – Recent performance & future price prediction
HOLO (HOT)
My approach: Evaluate the recent price movement, buying and selling pressure, support and resistance, and the probability of an upward or downward move.
The key question is whether HOT is preparing for a recovery or continuing its downward trend. A price increase alone does not confirm a trend reversal.
Recent market performance
As of November 8, 2026, market feeds are showing conflicting prices:
Source HOT price 24h movement
$0.0003538 -3.88%
Investing.com $0.000462 +26.96%
$0.0004778 +33.72%
These discrepancies are significant. Verify the actual HOT/USDT exchange price before trading.
Important technical levels
Using the analysis as the reference:
Level Price
Support 1 $0.000361
Support 2 $0.000307
Resistance 1 $0.000383
A sustained move above $0.000383 would improve the bullish outlook. Losing $0.000307 would increase downside risk.
Future movement prediction
Bullish scenario: Buyers defend support and reclaim resistance, potentially starting another recovery.
Sideways scenario: HOT consolidates while buyers and sellers find balance.
Bearish scenario: Support breaks, leading to another decline.
One important warning: Investing.com reports RSI around 84.9 on its November 8 snapshot, indicating overbought conditions. A pullback is possible even during a strong rally.
My assessment
I would not call HOT a confirmed buy yet. I would wait for price confirmation, particularly a sustained breakout with strong trading volume.
#HOT #BMT #ACT #CPIWatch #USJobData
{spot}(HOTUSDT)
{spot}(BMTUSDT)
{spot}(ACTUSDT)
$HOT Holo (HOT) – Recent performance & future price prediction
HOLO (HOT)
My approach: Evaluate the recent price movement, buying and selling pressure, support and resistance, and the probability of an upward or downward move.
The key question is whether HOT is preparing for a recovery or continuing its downward trend. A price increase alone does not confirm a trend reversal.
Recent market performance
As of November 8, 2026, market feeds are showing conflicting prices:
Source HOT price 24h movement
$0.0003538 -3.88%
Investing.com $0.000462 +26.96%
$0.0004778 +33.72%
These discrepancies are significant. Verify the actual HOT/USDT exchange price before trading.
Important technical levels
Using the analysis as the reference:
Level Price
Support 1 $0.000361
Support 2 $0.000307
Resistance 1 $0.000383
A sustained move above $0.000383 would improve the bullish outlook. Losing $0.000307 would increase downside risk.
Future movement prediction
Bullish scenario: Buyers defend support and reclaim resistance, potentially starting another recovery.
Sideways scenario: HOT consolidates while buyers and sellers find balance.
Bearish scenario: Support breaks, leading to another decline.
One important warning: Investing.com reports RSI around 84.9 on its November 8 snapshot, indicating overbought conditions. A pullback is possible even during a strong rally.
My assessment
I would not call HOT a confirmed buy yet. I would wait for price confirmation, particularly a sustained breakout with strong trading volume.
#HOT #BMT #ACT #CPIWatch #USJobData
HOLO (HOT)
My approach: Evaluate the recent price movement, buying and selling pressure, support and resistance, and the probability of an upward or downward move.
The key question is whether HOT is preparing for a recovery or continuing its downward trend. A price increase alone does not confirm a trend reversal.
Recent market performance
As of November 8, 2026, market feeds are showing conflicting prices:
Source HOT price 24h movement
$0.0003538 -3.88%
Investing.com $0.000462 +26.96%
$0.0004778 +33.72%
These discrepancies are significant. Verify the actual HOT/USDT exchange price before trading.
Important technical levels
Using the analysis as the reference:
Level Price
Support 1 $0.000361
Support 2 $0.000307
Resistance 1 $0.000383
A sustained move above $0.000383 would improve the bullish outlook. Losing $0.000307 would increase downside risk.
Future movement prediction
Bullish scenario: Buyers defend support and reclaim resistance, potentially starting another recovery.
Sideways scenario: HOT consolidates while buyers and sellers find balance.
Bearish scenario: Support breaks, leading to another decline.
One important warning: Investing.com reports RSI around 84.9 on its November 8 snapshot, indicating overbought conditions. A pullback is possible even during a strong rally.
My assessment
I would not call HOT a confirmed buy yet. I would wait for price confirmation, particularly a sustained breakout with strong trading volume.
#HOT #BMT #ACT #CPIWatch #USJobData
134
·
--
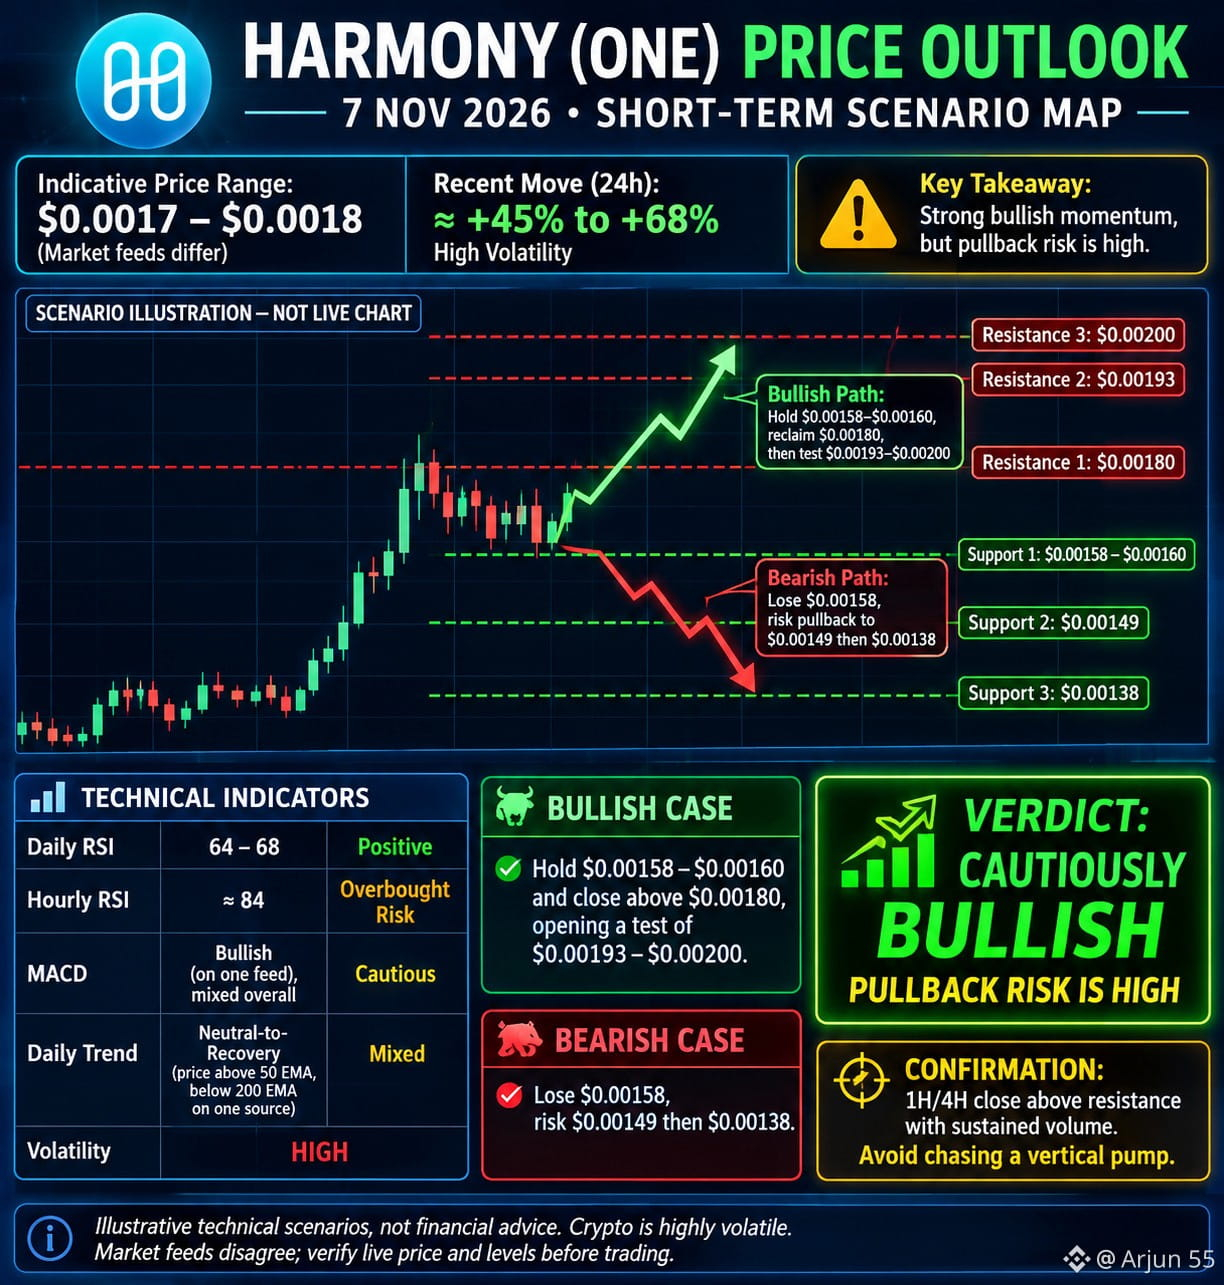
$ONE Harmony (ONE) — Technical Analysis
Harmony (ONE)
$0.001712
Approximately +56.59% in 24 hours
Recent movement
Strong price breakout.
Trading volume surged significantly.
Buyers currently have short-term control.
Price remains highly volatile.
Technical indicators
Indicator Reading Signal
RSI (daily) 63.84 Bullish
RSI (hourly) 83.99 Overbought
MACD Bullish Buy
ADX (hourly) 51.51 Strong trend
Important price levels
Level USD
Support $0.00175
Lower support $0.00169
Resistance $0.00188
Next resistance $0.00190–0.00201
My prediction
Next few hours: Possible upward continuation, but correction risk is high.
Next 24 hours: Bullish if price holds above $0.00175.
Break above $0.00190: Could open further upside.
Fall below $0.00169: Bearish warning.
Final verdict: UP bias, but avoid chasing the sudden pump. Wait for confirmation or a pullback.
#one #QNTB #ACT #CPIWatch #USJobData
{spot}(ONEUSDT)
{spot}(QNTBUSDT)
{spot}(ACTUSDT)
$ONE Harmony (ONE) — Technical Analysis
Harmony (ONE)
$0.001712
Approximately +56.59% in 24 hours
Recent movement
Strong price breakout.
Trading volume surged significantly.
Buyers currently have short-term control.
Price remains highly volatile.
Technical indicators
Indicator Reading Signal
RSI (daily) 63.84 Bullish
RSI (hourly) 83.99 Overbought
MACD Bullish Buy
ADX (hourly) 51.51 Strong trend
Important price levels
Level USD
Support $0.00175
Lower support $0.00169
Resistance $0.00188
Next resistance $0.00190–0.00201
My prediction
Next few hours: Possible upward continuation, but correction risk is high.
Next 24 hours: Bullish if price holds above $0.00175.
Break above $0.00190: Could open further upside.
Fall below $0.00169: Bearish warning.
Final verdict: UP bias, but avoid chasing the sudden pump. Wait for confirmation or a pullback.
#one #QNTB #ACT #CPIWatch #USJobData
Harmony (ONE)
$0.001712
Approximately +56.59% in 24 hours
Recent movement
Strong price breakout.
Trading volume surged significantly.
Buyers currently have short-term control.
Price remains highly volatile.
Technical indicators
Indicator Reading Signal
RSI (daily) 63.84 Bullish
RSI (hourly) 83.99 Overbought
MACD Bullish Buy
ADX (hourly) 51.51 Strong trend
Important price levels
Level USD
Support $0.00175
Lower support $0.00169
Resistance $0.00188
Next resistance $0.00190–0.00201
My prediction
Next few hours: Possible upward continuation, but correction risk is high.
Next 24 hours: Bullish if price holds above $0.00175.
Break above $0.00190: Could open further upside.
Fall below $0.00169: Bearish warning.
Final verdict: UP bias, but avoid chasing the sudden pump. Wait for confirmation or a pullback.
#one #QNTB #ACT #CPIWatch #USJobData
200
·
--
$CYBER CYBER Token – Recent Analysis & Future Prediction
$0.373
Cyber (CYBER) · Approximate market price, 6 November 2026
Recent movement
CYBER has experienced a very strong rally, rising approximately 49.6% in 24 hours.
Price recovered from around $0.23 to $0.37.
Trading volume increased sharply, indicating strong market activity.
The project is developing its AI and blockchain infrastructure narrative.
Technical analysis
Indicator Price
Immediate resistance $0.40
Next resistance $0.42–0.45
First support $0.35
Strong support $0.31
Major support $0.28
Technical indicators show bullish short-term momentum, but weekly trend remains bearish.
Future prediction
Scenario Possible movement
Bullish $0.40–$0.45
Strong bullish breakout $0.48–$0.50
Normal correction $0.31–$0.35
Bearish breakdown Below $0.28
My assessment:
Next 1–3 days: Upside possible, but profit booking is likely after such a sharp rally.
Next 1–2 weeks: Direction depends on whether CYBER can sustain above $0.35 and break $0.40.
Token unlocks and leveraged trading increase volatility.
Final prediction
I favour a bullish continuation only if price holds above $0.35 and breaks $0.40 convincingly. Otherwise, a correction toward $0.31–$0.35 is possible.
#CYBER #one #movr #CPIWatch #USJobData
{spot}(CYBERUSDT)
{spot}(ONEUSDT)
{spot}(MOVRUSDT)
$CYBER CYBER Token – Recent Analysis & Future Prediction
$0.373
Cyber (CYBER) · Approximate market price, 6 November 2026
Recent movement
CYBER has experienced a very strong rally, rising approximately 49.6% in 24 hours.
Price recovered from around $0.23 to $0.37.
Trading volume increased sharply, indicating strong market activity.
The project is developing its AI and blockchain infrastructure narrative.
Technical analysis
Indicator Price
Immediate resistance $0.40
Next resistance $0.42–0.45
First support $0.35
Strong support $0.31
Major support $0.28
Technical indicators show bullish short-term momentum, but weekly trend remains bearish.
Future prediction
Scenario Possible movement
Bullish $0.40–$0.45
Strong bullish breakout $0.48–$0.50
Normal correction $0.31–$0.35
Bearish breakdown Below $0.28
My assessment:
Next 1–3 days: Upside possible, but profit booking is likely after such a sharp rally.
Next 1–2 weeks: Direction depends on whether CYBER can sustain above $0.35 and break $0.40.
Token unlocks and leveraged trading increase volatility.
Final prediction
I favour a bullish continuation only if price holds above $0.35 and breaks $0.40 convincingly. Otherwise, a correction toward $0.31–$0.35 is possible.
#CYBER #one #movr #CPIWatch #USJobData
$0.373
Cyber (CYBER) · Approximate market price, 6 November 2026
Recent movement
CYBER has experienced a very strong rally, rising approximately 49.6% in 24 hours.
Price recovered from around $0.23 to $0.37.
Trading volume increased sharply, indicating strong market activity.
The project is developing its AI and blockchain infrastructure narrative.
Technical analysis
Indicator Price
Immediate resistance $0.40
Next resistance $0.42–0.45
First support $0.35
Strong support $0.31
Major support $0.28
Technical indicators show bullish short-term momentum, but weekly trend remains bearish.
Future prediction
Scenario Possible movement
Bullish $0.40–$0.45
Strong bullish breakout $0.48–$0.50
Normal correction $0.31–$0.35
Bearish breakdown Below $0.28
My assessment:
Next 1–3 days: Upside possible, but profit booking is likely after such a sharp rally.
Next 1–2 weeks: Direction depends on whether CYBER can sustain above $0.35 and break $0.40.
Token unlocks and leveraged trading increase volatility.
Final prediction
I favour a bullish continuation only if price holds above $0.35 and breaks $0.40 convincingly. Otherwise, a correction toward $0.31–$0.35 is possible.
#CYBER #one #movr #CPIWatch #USJobData
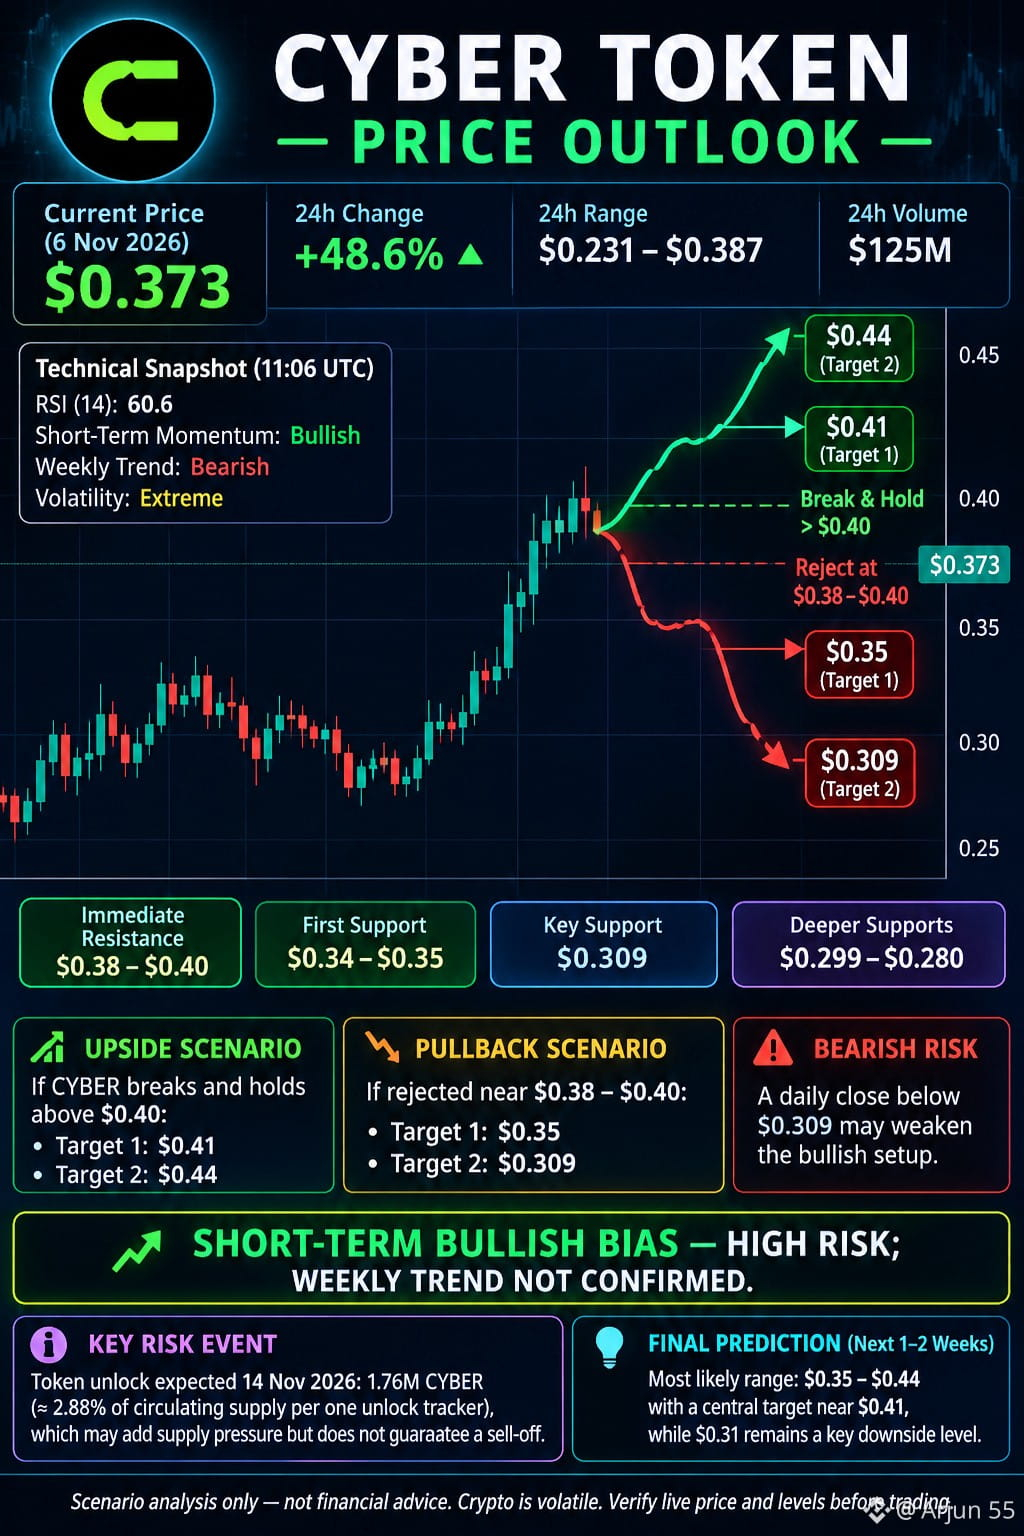
84
·
--
$APPB APP B (AppLovin Tokenized b Stocks) – Analysis
As of 5 November 2026, APP B is showing a major price movement.
Recent market movement reported price
$327.97
24h high: $336.80
24h low: $236.28 · Market cap: approximately $2.04 million
Source:
Important: Other price trackers are reporting approximately $226–$327. This is a substantial discrepancy. Confirm the APP B/USDT exchange price before trading.
Why did APP B rise
AppLovin announced strong Q3 2026 results on November 4:
Revenue: $2.185 billion.
Revenue growth: 55% year over year.
Net income growth: 72% year over year.
These are positive fundamental signals for the underlying company.
Technical levels to watch
Based on the reported trading range:
Level APP B price (USD) Importance
Resistance 2 $347 Breakout zone
Resistance 1 $337 Recent high
Support 1 $300–310 Potential pullback zone
Support 2 $270–280 Deeper correction zone
Support 3 $236–250 Recent lower range
These are provisional price zones, not confirmed technical support levels.
Future prediction
Next 24–48 hours
Bullish scenario
Holds above $310 and breaks $337 with strong volume.
Correction scenario
Rejection near $337 could lead to profit-taking toward $300 or lower.
Next 7–30 days
Direction depends on App Lovin's underlying stock performance, earnings momentum and APP B market liquidity.
My assessment: Bullish underlying fundamentals, but chasing a 37% rally is risky. I would wait for price consolidation and confirmation rather than buy immediately.
#APPB #fogo #SOXSB #CPIWatch #USJobData
{spot}(APPBUSDT)
{spot}(FOGOUSDT)
{spot}(SOXSBUSDT)
$APPB APP B (AppLovin Tokenized b Stocks) – Analysis
As of 5 November 2026, APP B is showing a major price movement.
Recent market movement reported price
$327.97
24h high: $336.80
24h low: $236.28 · Market cap: approximately $2.04 million
Source:
Important: Other price trackers are reporting approximately $226–$327. This is a substantial discrepancy. Confirm the APP B/USDT exchange price before trading.
Why did APP B rise
AppLovin announced strong Q3 2026 results on November 4:
Revenue: $2.185 billion.
Revenue growth: 55% year over year.
Net income growth: 72% year over year.
These are positive fundamental signals for the underlying company.
Technical levels to watch
Based on the reported trading range:
Level APP B price (USD) Importance
Resistance 2 $347 Breakout zone
Resistance 1 $337 Recent high
Support 1 $300–310 Potential pullback zone
Support 2 $270–280 Deeper correction zone
Support 3 $236–250 Recent lower range
These are provisional price zones, not confirmed technical support levels.
Future prediction
Next 24–48 hours
Bullish scenario
Holds above $310 and breaks $337 with strong volume.
Correction scenario
Rejection near $337 could lead to profit-taking toward $300 or lower.
Next 7–30 days
Direction depends on App Lovin's underlying stock performance, earnings momentum and APP B market liquidity.
My assessment: Bullish underlying fundamentals, but chasing a 37% rally is risky. I would wait for price consolidation and confirmation rather than buy immediately.
#APPB #fogo #SOXSB #CPIWatch #USJobData
As of 5 November 2026, APP B is showing a major price movement.
Recent market movement reported price
$327.97
24h high: $336.80
24h low: $236.28 · Market cap: approximately $2.04 million
Source:
Important: Other price trackers are reporting approximately $226–$327. This is a substantial discrepancy. Confirm the APP B/USDT exchange price before trading.
Why did APP B rise
AppLovin announced strong Q3 2026 results on November 4:
Revenue: $2.185 billion.
Revenue growth: 55% year over year.
Net income growth: 72% year over year.
These are positive fundamental signals for the underlying company.
Technical levels to watch
Based on the reported trading range:
Level APP B price (USD) Importance
Resistance 2 $347 Breakout zone
Resistance 1 $337 Recent high
Support 1 $300–310 Potential pullback zone
Support 2 $270–280 Deeper correction zone
Support 3 $236–250 Recent lower range
These are provisional price zones, not confirmed technical support levels.
Future prediction
Next 24–48 hours
Bullish scenario
Holds above $310 and breaks $337 with strong volume.
Correction scenario
Rejection near $337 could lead to profit-taking toward $300 or lower.
Next 7–30 days
Direction depends on App Lovin's underlying stock performance, earnings momentum and APP B market liquidity.
My assessment: Bullish underlying fundamentals, but chasing a 37% rally is risky. I would wait for price consolidation and confirmation rather than buy immediately.
#APPB #fogo #SOXSB #CPIWatch #USJobData
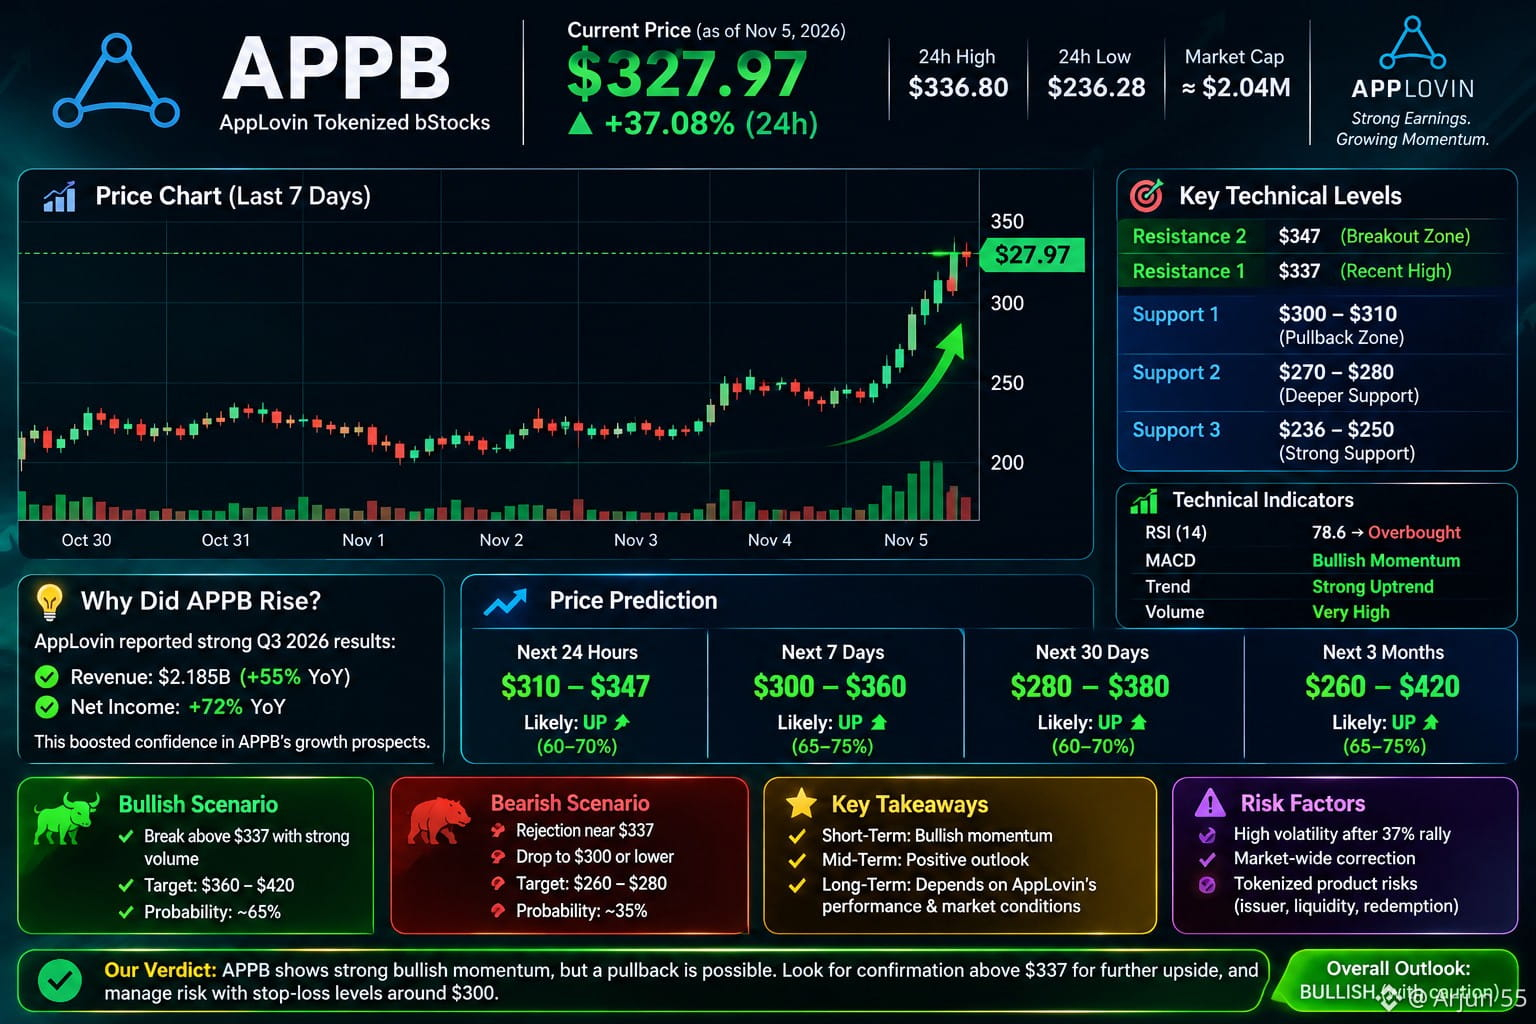
322
Log in to explore more content
Join global crypto users on Binance Square
⚡️ Get latest and useful information about crypto.
💬 Trusted by the world’s largest crypto exchange.
👍 Discover real insights from verified creators.
Email / Phone number
Trending Topics
1
#NvidiaLoses$2.7TrillionInMonthAndAHalf
21,076 views
135 Discussing
2
#CanBTCReboundAfterFallingBelow60K?
779,053 views
3,011 Discussing
3
#GlobalStocksFaceLongestLosingStreakSince2023
286,132 views
2,012 Discussing
4
#BlackRockIBITPostsRecord$541MSingleDayOutflow
34,435 views
101 Discussing
5
#AnthropicPlungesTowardIPOPriceonDay2
145,845 views
1,228 Discussing
6
#TwentyOneCapitalAdds172.25BTC
67,425 views
673 Discussing
7
#HKBillWouldExcludeTokenizedDepositsFromVirtualAssets
8,886 views
50 Discussing
8
#BNBDropsBelow540USDTWith8.46%DailyDecline
79,316 views
656 Discussing
9
#HKBillProposesHK$100KFineForUnauthorizedCryptoTitles
2,674 views
22 Discussing
10
#BitMineFaces$10.1BUnrealizedETHLoss
5,586 views
28 Discussing