
#baba
baba
66,614 views
916 Discussing
Hot
Latest

·
--
Bullish
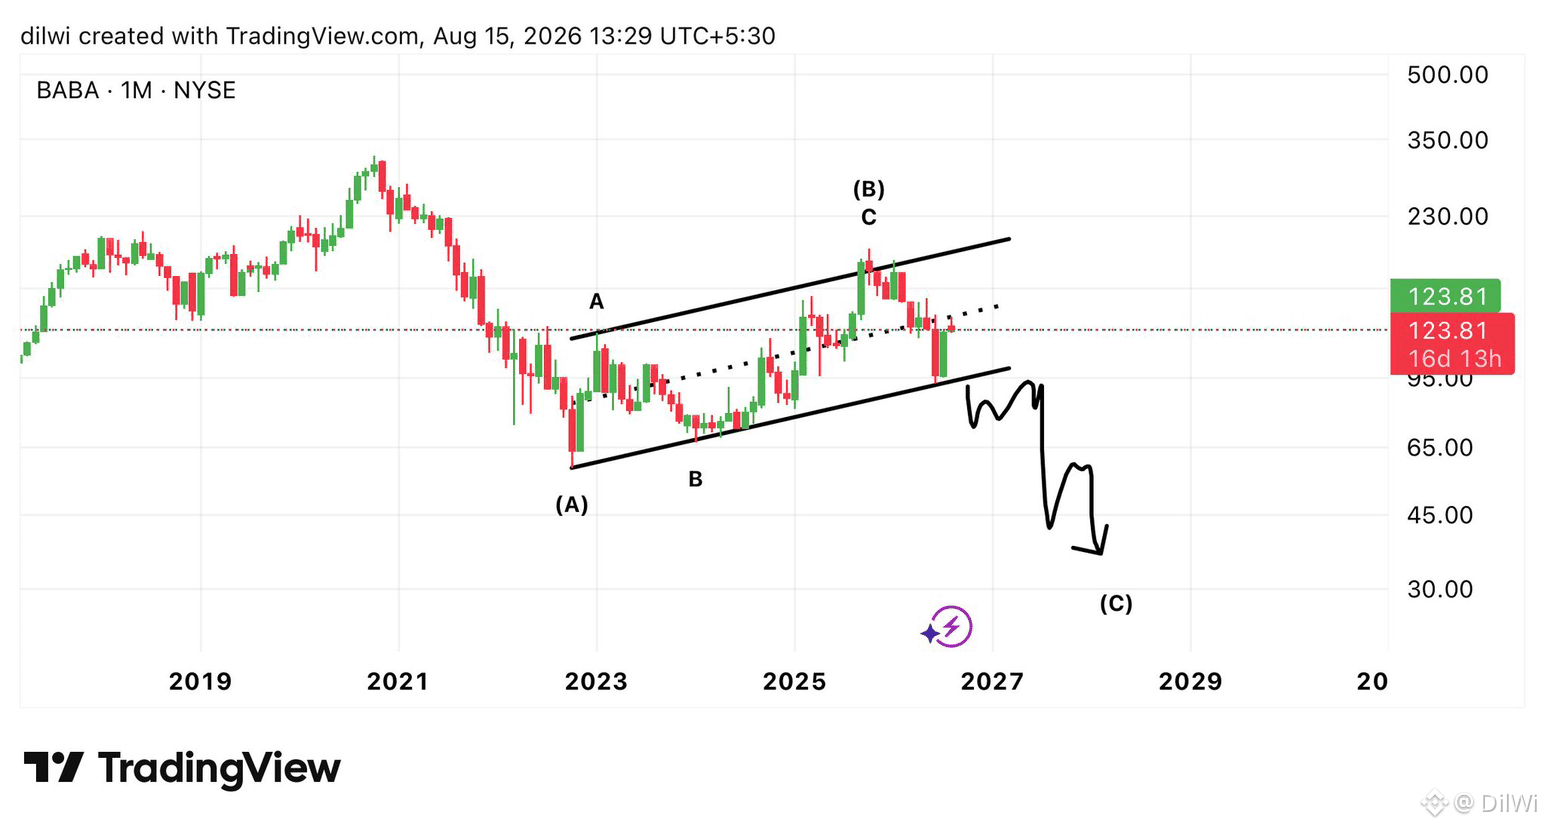
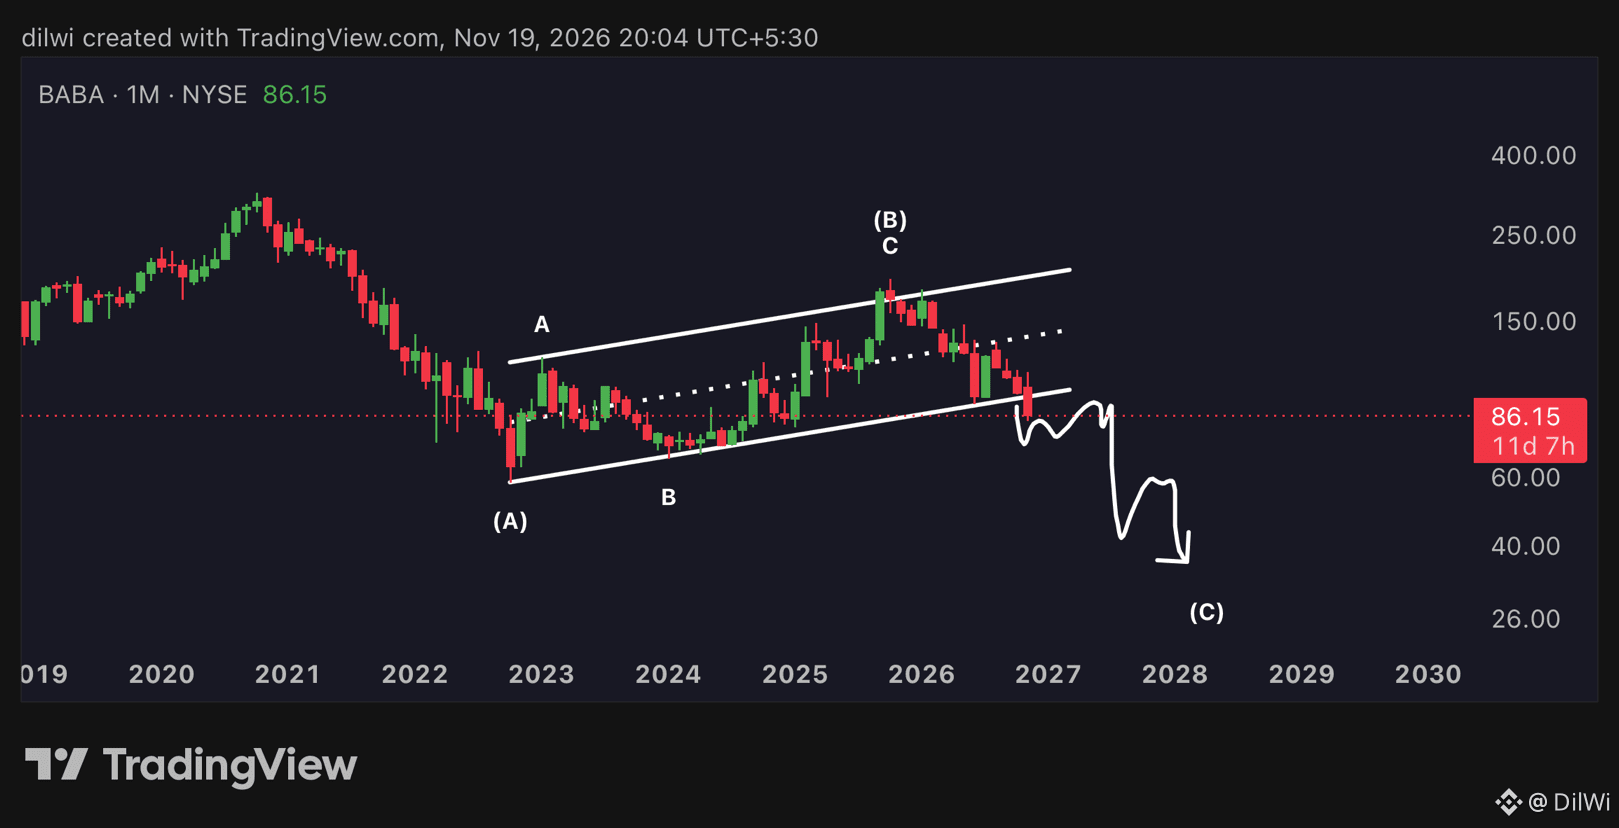
$STABLE $IDOL $BABA
🚨 THE NEXT TRADING OPPORTUNITY COULD BE HIDING IN THESE 3 NAMES — TAKE A CLOSER LOOK!
STABLE: Watch for a clear shift in momentum and stronger trading volume.
IDOL: Monitor liquidity and whether price can break its recent resistance.
BABA: Track broader market sentiment, company-related catalysts, and key technical levels.
Key Takeaway: Don't enter just because a chart looks active. Wait for confirmation and plan your exit.
#STABLE #BABA
{future}(STABLEUSDT)
{future}(IDOLUSDT)
{future}(BABAUSDT)
$STABLE $IDOL $BABA
🚨 THE NEXT TRADING OPPORTUNITY COULD BE HIDING IN THESE 3 NAMES — TAKE A CLOSER LOOK!
STABLE: Watch for a clear shift in momentum and stronger trading volume.
IDOL: Monitor liquidity and whether price can break its recent resistance.
BABA: Track broader market sentiment, company-related catalysts, and key technical levels.
Key Takeaway: Don't enter just because a chart looks active. Wait for confirmation and plan your exit.
#STABLE #BABA
🚨 THE NEXT TRADING OPPORTUNITY COULD BE HIDING IN THESE 3 NAMES — TAKE A CLOSER LOOK!
STABLE: Watch for a clear shift in momentum and stronger trading volume.
IDOL: Monitor liquidity and whether price can break its recent resistance.
BABA: Track broader market sentiment, company-related catalysts, and key technical levels.
Key Takeaway: Don't enter just because a chart looks active. Wait for confirmation and plan your exit.
#STABLE #BABA
340


·
--
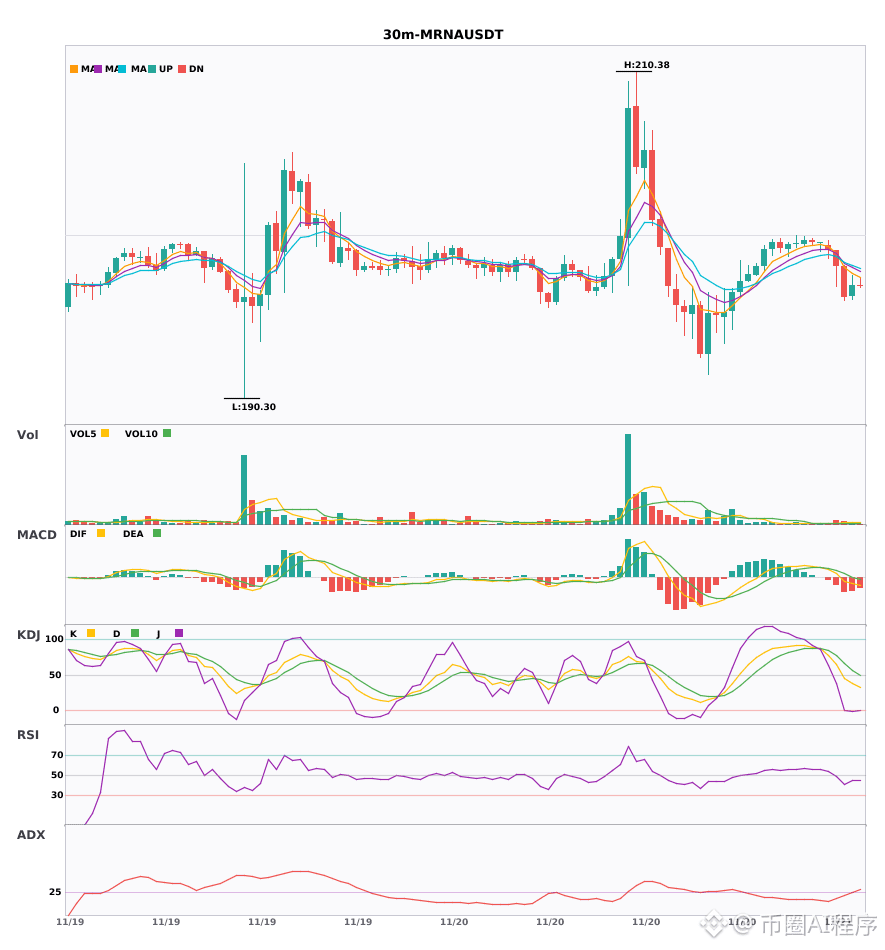
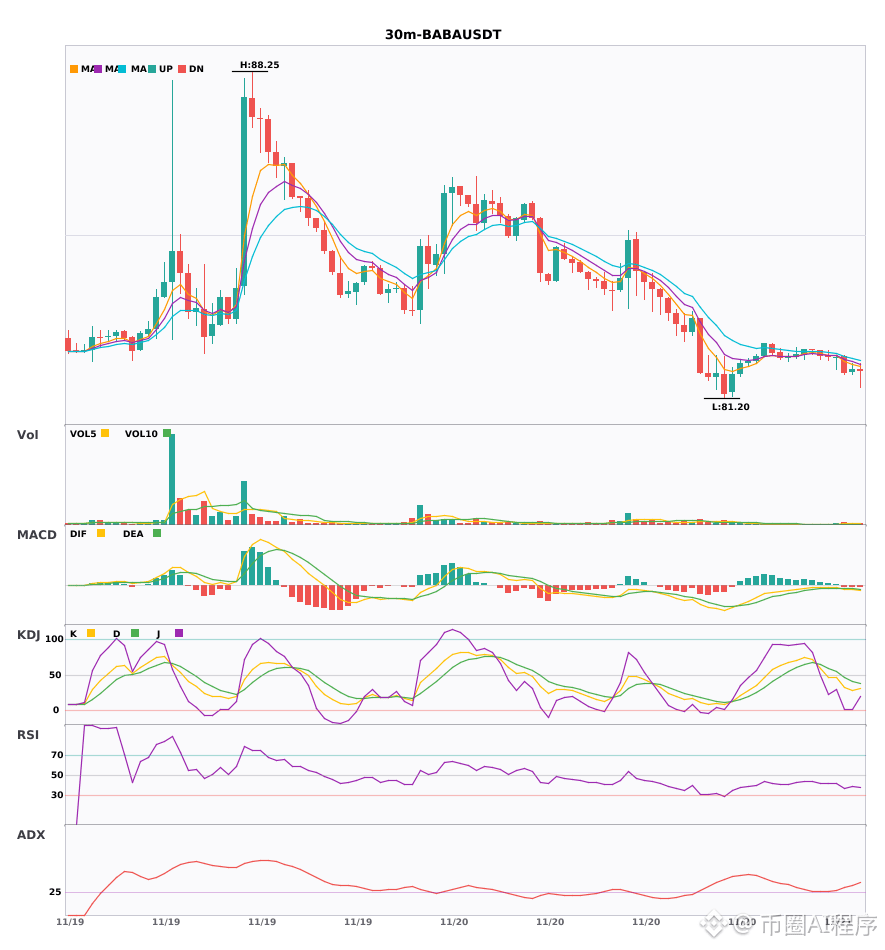
$H/$MRNA/$BABA 30-minute short, 4-hour downtrend confirmed🔥
════════════════════
🟢 $H 30-minute short signal
⚠️Technical analysis: 4-hour bearish momentum confirmed by 30-minute confluence; MACD bearish crossover with expanding green bars, moving averages in a bearish alignment spreading downward, KDJ favoring weak bears, and volume surging.
════════════════════
🟢 $MRNA 30-minute short signal
⚠️Technical analysis: 4-hour downtrend + 30-minute entry; multi-timeframe confluence for a short! MACD breaks below the zero line, turning bearish; EMA5 crosses below EMA8; volume surges to 2.8x
════════════════════
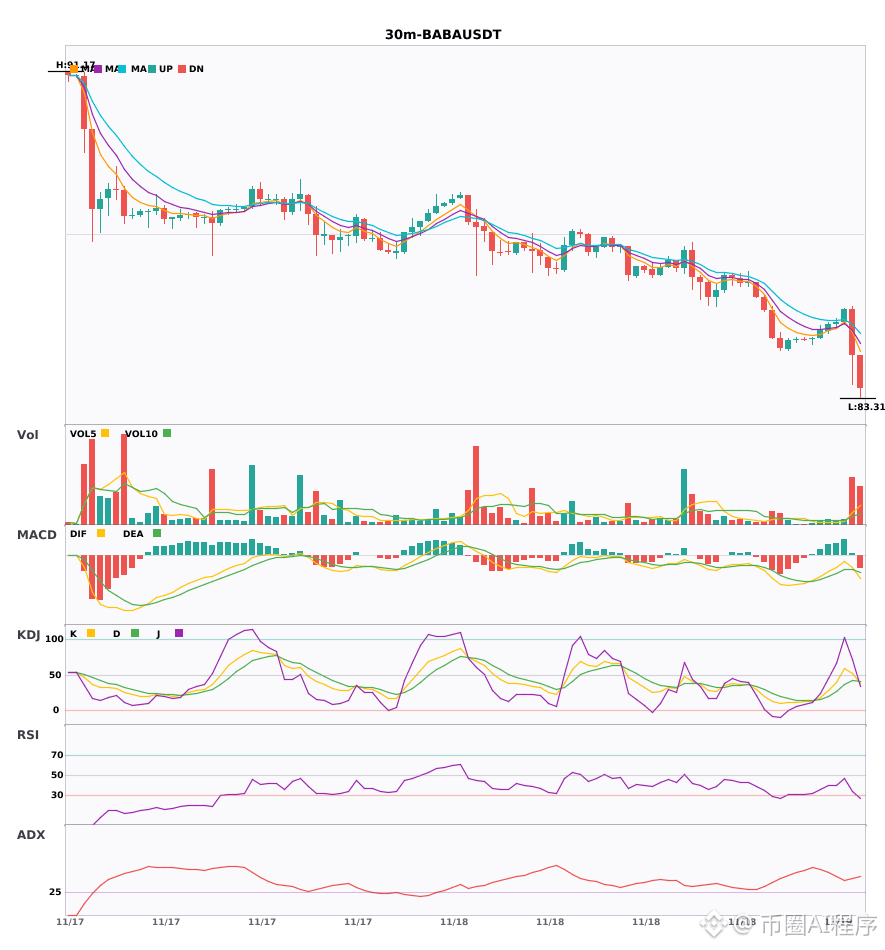
🟢 $BABA 30-minute short signal
⚠️Technical analysis: 4-hour and 30-minute bearish confluence confirmed; green bars expand after the MACD bearish crossover, moving averages in a bearish alignment spreading downward, KDJ K crosses below D without being oversold, and volume expands 3.2x
════════════════════
🔔 Follow to get the latest market moves 🔔
#多周期共振 #H #MRNA #BABA
📌 When trading, check whether the candlestick pattern meets the criteria
$H /$MRNA /$BABA 30-minute short, 4-hour downtrend confirmed🔥
════════════════════
🟢 $H 30-minute short signal
⚠️Technical analysis: 4-hour bearish momentum confirmed by 30-minute confluence; MACD bearish crossover with expanding green bars, moving averages in a bearish alignment spreading downward, KDJ favoring weak bears, and volume surging.
════════════════════
🟢 $MRNA 30-minute short signal
⚠️Technical analysis: 4-hour downtrend + 30-minute entry; multi-timeframe confluence for a short! MACD breaks below the zero line, turning bearish; EMA5 crosses below EMA8; volume surges to 2.8x
════════════════════
🟢 $BABA 30-minute short signal
⚠️Technical analysis: 4-hour and 30-minute bearish confluence confirmed; green bars expand after the MACD bearish crossover, moving averages in a bearish alignment spreading downward, KDJ K crosses below D without being oversold, and volume expands 3.2x
════════════════════
🔔 Follow to get the latest market moves 🔔
#多周期共振 #H #MRNA #BABA
📌 When trading, check whether the candlestick pattern meets the criteria
════════════════════
🟢 $H 30-minute short signal
⚠️Technical analysis: 4-hour bearish momentum confirmed by 30-minute confluence; MACD bearish crossover with expanding green bars, moving averages in a bearish alignment spreading downward, KDJ favoring weak bears, and volume surging.
════════════════════
🟢 $MRNA 30-minute short signal
⚠️Technical analysis: 4-hour downtrend + 30-minute entry; multi-timeframe confluence for a short! MACD breaks below the zero line, turning bearish; EMA5 crosses below EMA8; volume surges to 2.8x
════════════════════
🟢 $BABA 30-minute short signal
⚠️Technical analysis: 4-hour and 30-minute bearish confluence confirmed; green bars expand after the MACD bearish crossover, moving averages in a bearish alignment spreading downward, KDJ K crosses below D without being oversold, and volume expands 3.2x
════════════════════
🔔 Follow to get the latest market moves 🔔
#多周期共振 #H #MRNA #BABA
📌 When trading, check whether the candlestick pattern meets the criteria
17

·
--
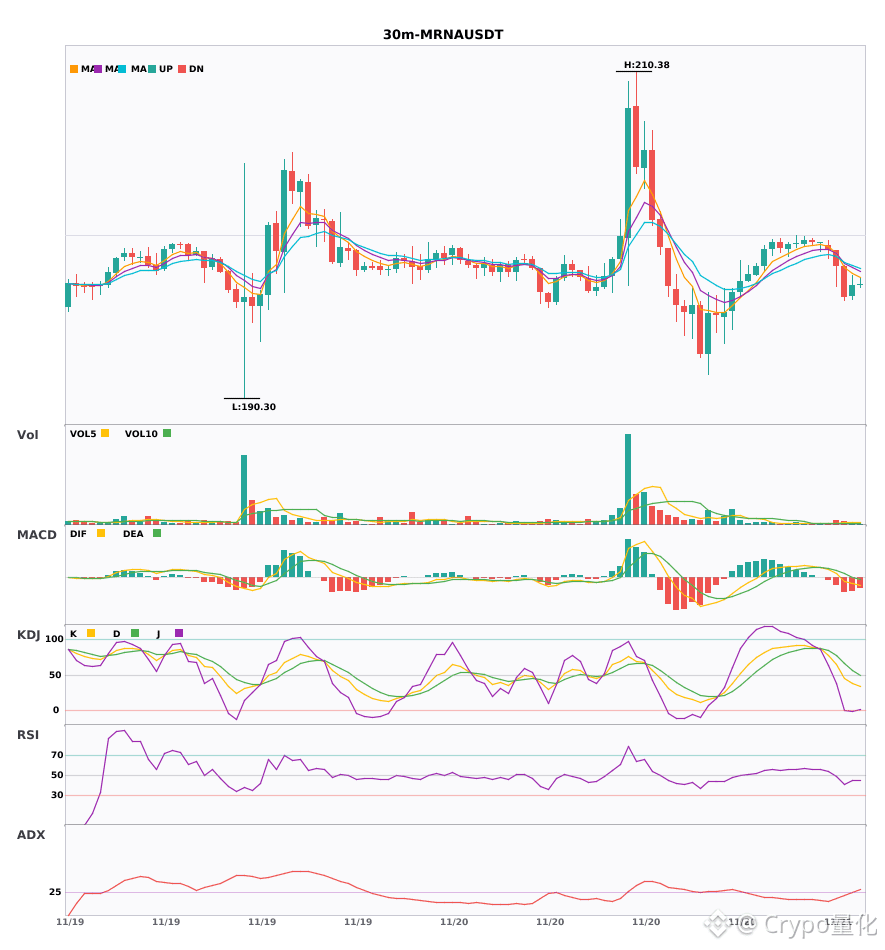
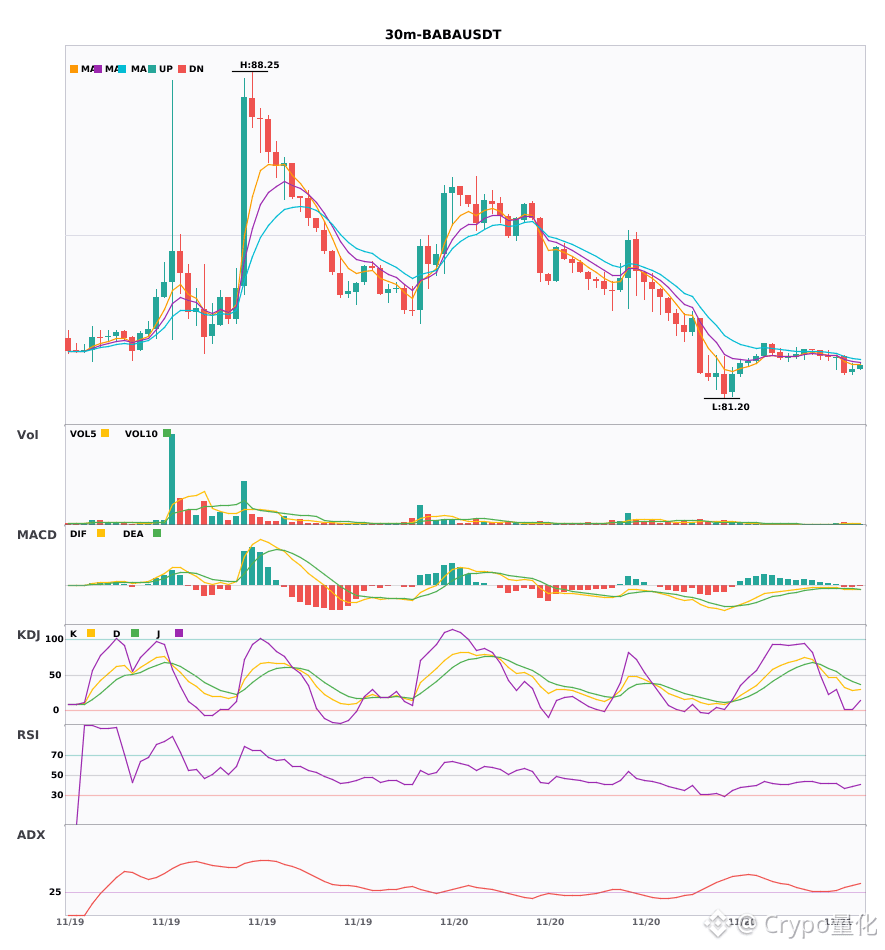
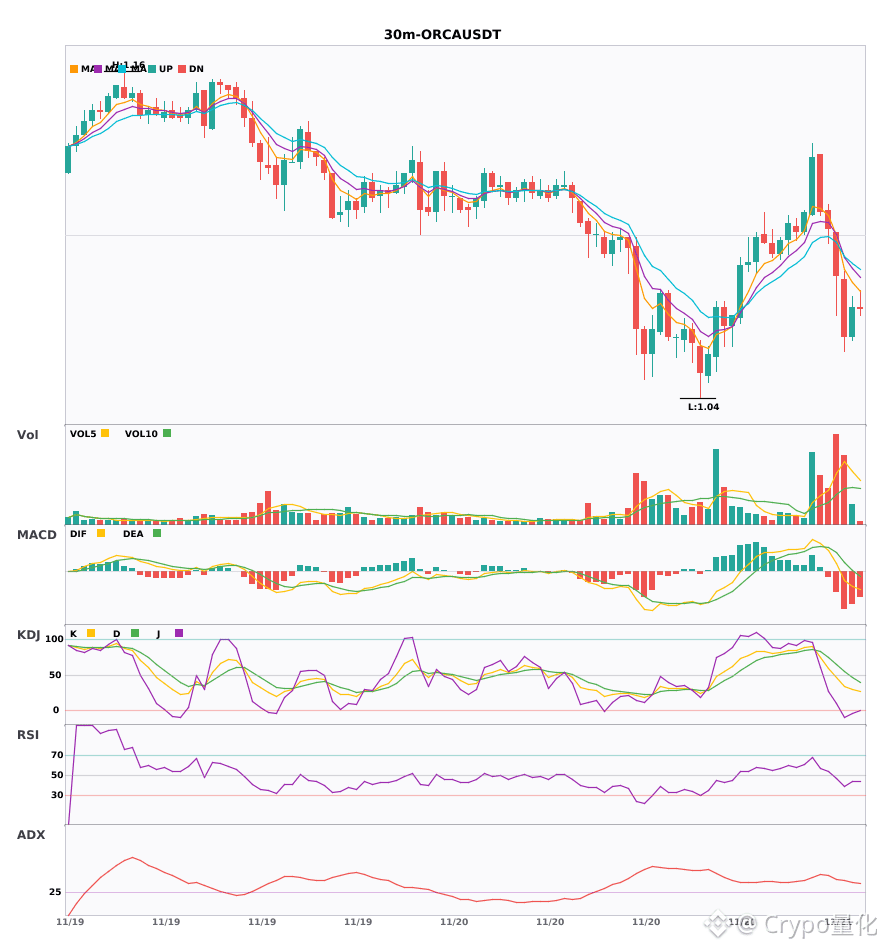
$MRNA $BABA $ORCA 30-minute short warning—don't chase longs 🔥
════════════════════
🟢 $MRNA 30-minute short signal
⚠️ Technicals: ADX trend is just getting underway; worth watching | MACD DIF broke below the zero line, bearish | EMA5 crossed below EMA8, short-term bearish | Volume up 2.8x
════════════════════
🟢 $BABA 30-minute short signal
⚠️ Technicals: ADX at 29, trend just starting; consider following | Volume increased after MACD death cross, bearish momentum accelerating | Moving averages in bearish alignment | KDJ weak; K crossed below D, bears have the upper hand | Volume surged 3.2x
════════════════════
🟢 $ORCA 30-minute short signal
⚠️ Technicals: ADX is at 41; the trend is very clear. MACD DIF fell below the zero line, signaling a bearish turn. Moving averages are spreading downward, and a bearish alignment has just formed. Volume surged 3x!
════════════════════
🔔 Follow for first-hand market updates 🔔
#技术分析 #MRNA #BABA #ORCA
📌 When trading, pay attention to whether the candlestick pattern confirms the signal
$MRNA $BABA $ORCA 30-minute short warning—don't chase longs 🔥
════════════════════
🟢 $MRNA 30-minute short signal
⚠️ Technicals: ADX trend is just getting underway; worth watching | MACD DIF broke below the zero line, bearish | EMA5 crossed below EMA8, short-term bearish | Volume up 2.8x
════════════════════
🟢 $BABA 30-minute short signal
⚠️ Technicals: ADX at 29, trend just starting; consider following | Volume increased after MACD death cross, bearish momentum accelerating | Moving averages in bearish alignment | KDJ weak; K crossed below D, bears have the upper hand | Volume surged 3.2x
════════════════════
🟢 $ORCA 30-minute short signal
⚠️ Technicals: ADX is at 41; the trend is very clear. MACD DIF fell below the zero line, signaling a bearish turn. Moving averages are spreading downward, and a bearish alignment has just formed. Volume surged 3x!
════════════════════
🔔 Follow for first-hand market updates 🔔
#技术分析 #MRNA #BABA #ORCA
📌 When trading, pay attention to whether the candlestick pattern confirms the signal
════════════════════
🟢 $MRNA 30-minute short signal
⚠️ Technicals: ADX trend is just getting underway; worth watching | MACD DIF broke below the zero line, bearish | EMA5 crossed below EMA8, short-term bearish | Volume up 2.8x
════════════════════
🟢 $BABA 30-minute short signal
⚠️ Technicals: ADX at 29, trend just starting; consider following | Volume increased after MACD death cross, bearish momentum accelerating | Moving averages in bearish alignment | KDJ weak; K crossed below D, bears have the upper hand | Volume surged 3.2x
════════════════════
🟢 $ORCA 30-minute short signal
⚠️ Technicals: ADX is at 41; the trend is very clear. MACD DIF fell below the zero line, signaling a bearish turn. Moving averages are spreading downward, and a bearish alignment has just formed. Volume surged 3x!
════════════════════
🔔 Follow for first-hand market updates 🔔
#技术分析 #MRNA #BABA #ORCA
📌 When trading, pay attention to whether the candlestick pattern confirms the signal
8

·
--
🔻 $BABA SHORT 🔻
Entry: 86.5097 – 87.0303
SL: 87.7340
TP1: 85.9437
TP2: 85.3929
TP3: 84.7043
📈 Technical Outlook:
$BABA is showing bearish pressure after losing strength near a key technical zone. The setup is supported by EMA trend is bearish, RSI supports bearish momentum, volume confirms stronger pressure. As long as price stays below the entry area, sellers may continue pushing toward the listed downside targets.
#BABA #Crypto #BinanceSquare #Trading
🔻 $BABA SHORT 🔻
Entry: 86.5097 – 87.0303
SL: 87.7340
TP1: 85.9437
TP2: 85.3929
TP3: 84.7043
📈 Technical Outlook:
$BABA is showing bearish pressure after losing strength near a key technical zone. The setup is supported by EMA trend is bearish, RSI supports bearish momentum, volume confirms stronger pressure. As long as price stays below the entry area, sellers may continue pushing toward the listed downside targets.
#BABA #Crypto #BinanceSquare #Trading
Entry: 86.5097 – 87.0303
SL: 87.7340
TP1: 85.9437
TP2: 85.3929
TP3: 84.7043
📈 Technical Outlook:
$BABA is showing bearish pressure after losing strength near a key technical zone. The setup is supported by EMA trend is bearish, RSI supports bearish momentum, volume confirms stronger pressure. As long as price stays below the entry area, sellers may continue pushing toward the listed downside targets.
#BABA #Crypto #BinanceSquare #Trading

1

·
--
📉 BABAB range-bound near the lows; 85.88 is the rebound threshold
On Nov 20, Binance’s BABAB/USDT spot snapshot showed 83.64 USDT. Trading volume over the past 24 hours was about $760,000, with buy orders slightly heavier within 2% of the current price. Daily highs have continued to move lower, and a short-term rebound still awaits confirmation from increased volume. Spot market (https://www.coingecko.com/en/coins/alibaba-bstocks-tokenized-stock) · Historical candlesticks (https://chartexchange.com/symbol/crypto-bababusdt/historical/?exchange=binance)
The underlying, Alibaba’s US-listed BABA stock, closed yesterday at $83.31, down 1.26%, and briefly recovered to $83.92 in premarket trading today. Revenue from Alibaba’s AI cloud and computing services grew 53% year over year, but the Hang Seng Tech Index fell 3.78% today, with weakness in the sector weighing on a rebound. US stock market data (https://www.coinglass.com/stocks/BABA) · Alibaba earnings report (https://markets.ft.markitdigital.com/data/announce/detail?dockey=600-202611190502BIZWIRE_USPRX____20261118_BW898798-1) · Hong Kong market close (https://www.newtimespace.com/en/finance/1463463.html)
⚡ Over the next 4–24 hours, expect choppy trading, with the price likely to fluctuate repeatedly between 82.95 and 85.88 USDT. US markets are open; watch whether BABA can extend its premarket recovery. A break below 82.95 would put 81.96 in focus, while a high-volume hold above 85.88 would point to 88.12. Either scenario would invalidate the range-bound outlook. Token historical prices (https://ca.investing.com/crypto/alibaba-tokenized-bstocks/historical-data)
#BABAB #BABA #中概股 #RWA
📉 BABAB range-bound near the lows; 85.88 is the rebound threshold
On Nov 20, Binance’s BABAB/USDT spot snapshot showed 83.64 USDT. Trading volume over the past 24 hours was about $760,000, with buy orders slightly heavier within 2% of the current price. Daily highs have continued to move lower, and a short-term rebound still awaits confirmation from increased volume. Spot market (https://www.coingecko.com/en/coins/alibaba-bstocks-tokenized-stock) · Historical candlesticks (https://chartexchange.com/symbol/crypto-bababusdt/historical/?exchange=binance)
The underlying, Alibaba’s US-listed BABA stock, closed yesterday at $83.31, down 1.26%, and briefly recovered to $83.92 in premarket trading today. Revenue from Alibaba’s AI cloud and computing services grew 53% year over year, but the Hang Seng Tech Index fell 3.78% today, with weakness in the sector weighing on a rebound. US stock market data (https://www.coinglass.com/stocks/BABA) · Alibaba earnings report (https://markets.ft.markitdigital.com/data/announce/detail?dockey=600-202611190502BIZWIRE_USPRX____20261118_BW898798-1) · Hong Kong market close (https://www.newtimespace.com/en/finance/1463463.html)
⚡ Over the next 4–24 hours, expect choppy trading, with the price likely to fluctuate repeatedly between 82.95 and 85.88 USDT. US markets are open; watch whether BABA can extend its premarket recovery. A break below 82.95 would put 81.96 in focus, while a high-volume hold above 85.88 would point to 88.12. Either scenario would invalidate the range-bound outlook. Token historical prices (https://ca.investing.com/crypto/alibaba-tokenized-bstocks/historical-data)
#BABAB #BABA #中概股 #RWA
On Nov 20, Binance’s BABAB/USDT spot snapshot showed 83.64 USDT. Trading volume over the past 24 hours was about $760,000, with buy orders slightly heavier within 2% of the current price. Daily highs have continued to move lower, and a short-term rebound still awaits confirmation from increased volume. Spot market (https://www.coingecko.com/en/coins/alibaba-bstocks-tokenized-stock) · Historical candlesticks (https://chartexchange.com/symbol/crypto-bababusdt/historical/?exchange=binance)
The underlying, Alibaba’s US-listed BABA stock, closed yesterday at $83.31, down 1.26%, and briefly recovered to $83.92 in premarket trading today. Revenue from Alibaba’s AI cloud and computing services grew 53% year over year, but the Hang Seng Tech Index fell 3.78% today, with weakness in the sector weighing on a rebound. US stock market data (https://www.coinglass.com/stocks/BABA) · Alibaba earnings report (https://markets.ft.markitdigital.com/data/announce/detail?dockey=600-202611190502BIZWIRE_USPRX____20261118_BW898798-1) · Hong Kong market close (https://www.newtimespace.com/en/finance/1463463.html)
⚡ Over the next 4–24 hours, expect choppy trading, with the price likely to fluctuate repeatedly between 82.95 and 85.88 USDT. US markets are open; watch whether BABA can extend its premarket recovery. A break below 82.95 would put 81.96 in focus, while a high-volume hold above 85.88 would point to 88.12. Either scenario would invalidate the range-bound outlook. Token historical prices (https://ca.investing.com/crypto/alibaba-tokenized-bstocks/historical-data)
#BABAB #BABA #中概股 #RWA
4


·
--
⚡ BABAB: Range-bound after the rebound; 88.12 is the key level
On November 20, Binance spot BABABUSDT was quoted at 85.45 USDT, up 3.59% over the past 24 hours, with approximately 18,400 tokens traded. Reliable data on order-book depth and synchronized premiums is not yet available. Spot market data (https://coinalyze.net/markets/?exchange=A.&page=33)
Alibaba’s US-listed shares (BABA) closed down 1.26% in regular trading, then recovered to $85.43 in after-hours trading. Hong Kong shares also rebounded against the broader trend. Earnings showed that revenue from AI cloud and computing power grew 53% year over year, but the net outflow of free cash flow widened. Weak Nasdaq futures also added resistance to the rebound. US stock data (https://finance.yahoo.com/quote/BABA/) · Hong Kong stock data (https://ng.investing.com/news/stock-market-news/alibaba-hk-shares-rise-as-q2-topline-beat-invites-some-bargain-buying-2820016) · Alibaba earnings report (https://www1.hkexnews.hk/listedco/listconews/sehk/2026/1119/2026111900874_c.pdf) · Stock index futures (https://marketveo.com/futures/)
Over the next 4–24 hours, expect range-bound trading as the market first digests the after-hours gains. For the token, the 24-hour low of 81.96 USDT is support, and the high of 88.12 USDT is resistance. Watch the US market open tonight: a high-volume hold above resistance would signal strengthening, while a decisive break below support would signal weakness.
#BABAB #BABA #中概股 #TokenizedStocks
⚡ BABAB: Range-bound after the rebound; 88.12 is the key level
On November 20, Binance spot BABABUSDT was quoted at 85.45 USDT, up 3.59% over the past 24 hours, with approximately 18,400 tokens traded. Reliable data on order-book depth and synchronized premiums is not yet available. Spot market data (https://coinalyze.net/markets/?exchange=A.&page=33)
Alibaba’s US-listed shares (BABA) closed down 1.26% in regular trading, then recovered to $85.43 in after-hours trading. Hong Kong shares also rebounded against the broader trend. Earnings showed that revenue from AI cloud and computing power grew 53% year over year, but the net outflow of free cash flow widened. Weak Nasdaq futures also added resistance to the rebound. US stock data (https://finance.yahoo.com/quote/BABA/) · Hong Kong stock data (https://ng.investing.com/news/stock-market-news/alibaba-hk-shares-rise-as-q2-topline-beat-invites-some-bargain-buying-2820016) · Alibaba earnings report (https://www1.hkexnews.hk/listedco/listconews/sehk/2026/1119/2026111900874_c.pdf) · Stock index futures (https://marketveo.com/futures/)
Over the next 4–24 hours, expect range-bound trading as the market first digests the after-hours gains. For the token, the 24-hour low of 81.96 USDT is support, and the high of 88.12 USDT is resistance. Watch the US market open tonight: a high-volume hold above resistance would signal strengthening, while a decisive break below support would signal weakness.
#BABAB #BABA #中概股 #TokenizedStocks
On November 20, Binance spot BABABUSDT was quoted at 85.45 USDT, up 3.59% over the past 24 hours, with approximately 18,400 tokens traded. Reliable data on order-book depth and synchronized premiums is not yet available. Spot market data (https://coinalyze.net/markets/?exchange=A.&page=33)
Alibaba’s US-listed shares (BABA) closed down 1.26% in regular trading, then recovered to $85.43 in after-hours trading. Hong Kong shares also rebounded against the broader trend. Earnings showed that revenue from AI cloud and computing power grew 53% year over year, but the net outflow of free cash flow widened. Weak Nasdaq futures also added resistance to the rebound. US stock data (https://finance.yahoo.com/quote/BABA/) · Hong Kong stock data (https://ng.investing.com/news/stock-market-news/alibaba-hk-shares-rise-as-q2-topline-beat-invites-some-bargain-buying-2820016) · Alibaba earnings report (https://www1.hkexnews.hk/listedco/listconews/sehk/2026/1119/2026111900874_c.pdf) · Stock index futures (https://marketveo.com/futures/)
Over the next 4–24 hours, expect range-bound trading as the market first digests the after-hours gains. For the token, the 24-hour low of 81.96 USDT is support, and the high of 88.12 USDT is resistance. Watch the US market open tonight: a high-volume hold above resistance would signal strengthening, while a decisive break below support would signal weakness.
#BABAB #BABA #中概股 #TokenizedStocks
2
·
--
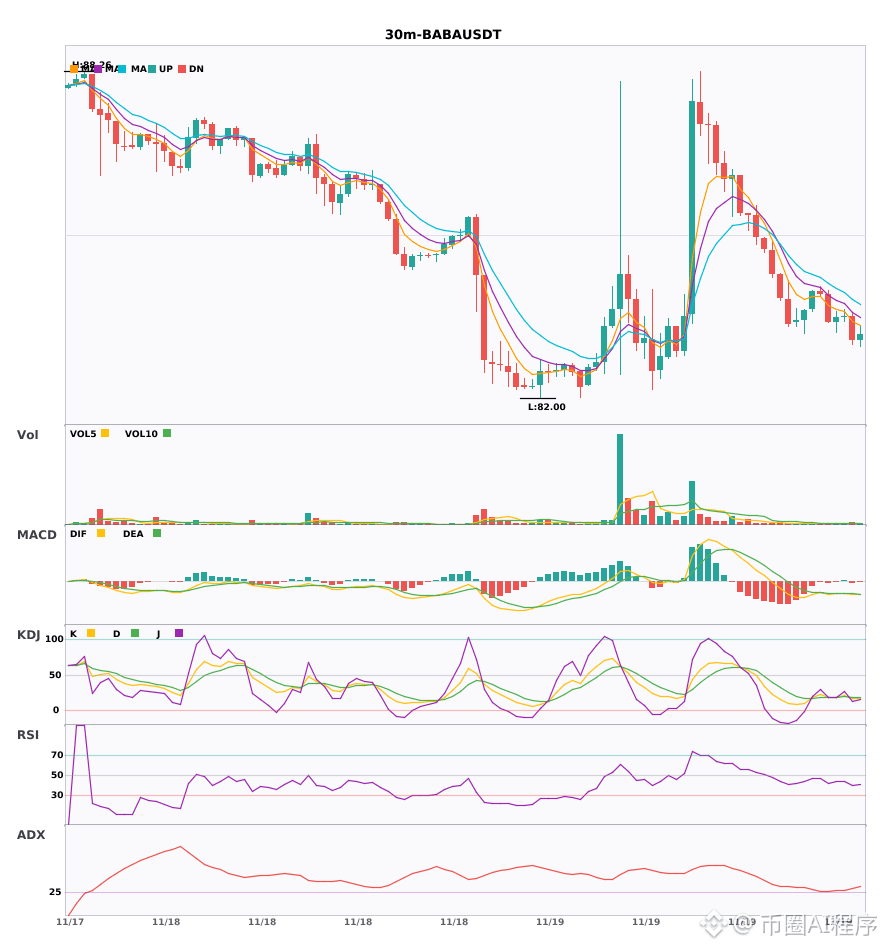
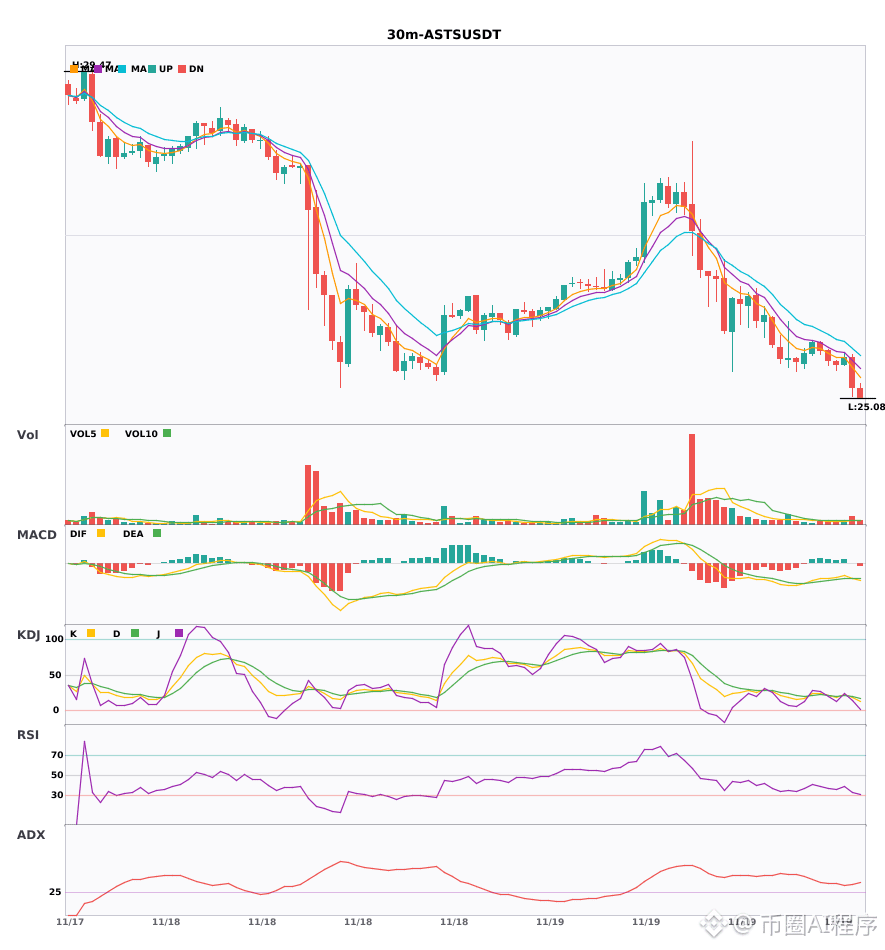
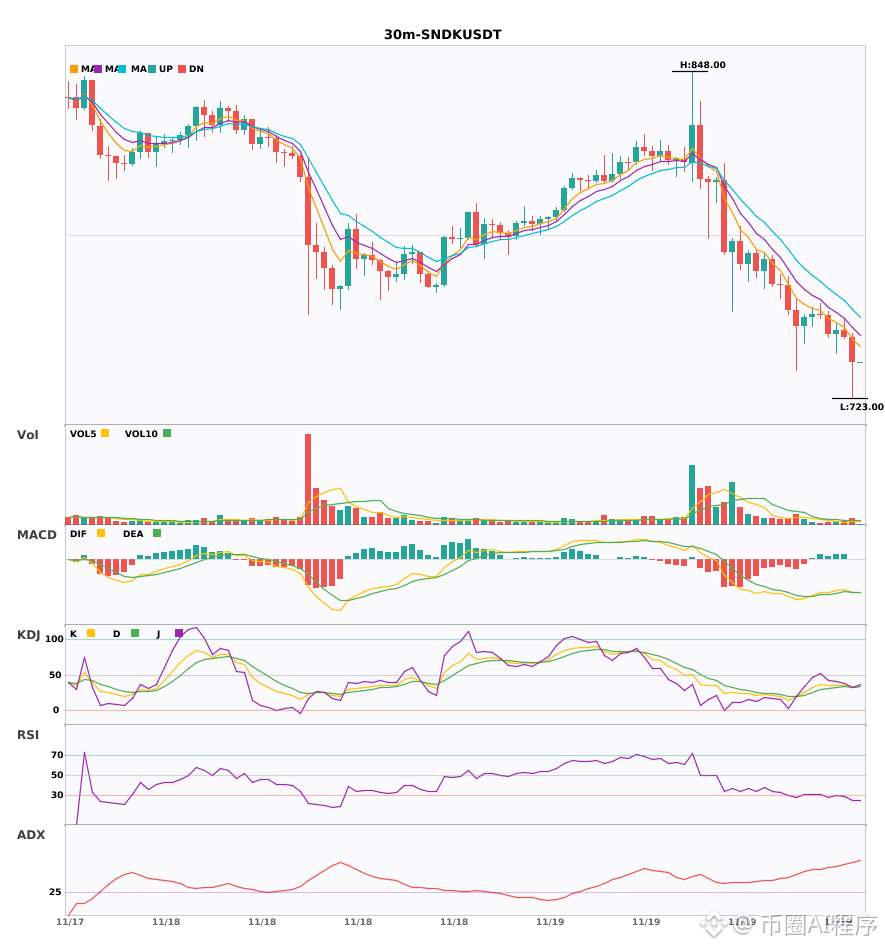
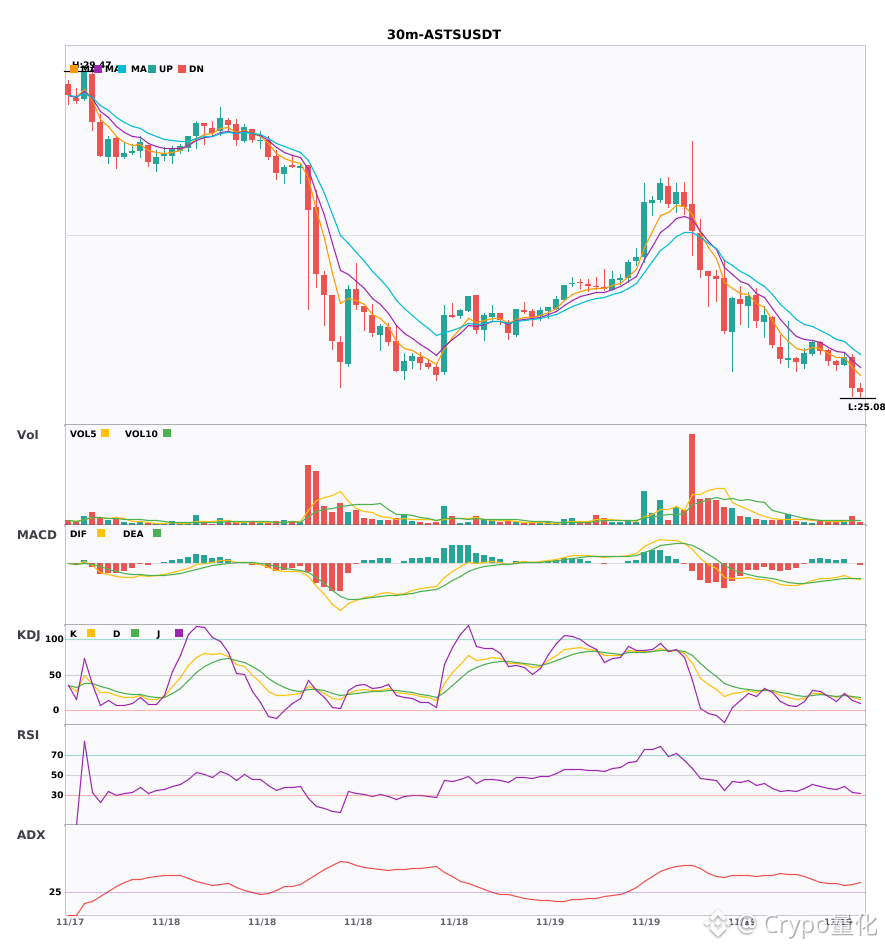
$BABA $ASTS $SNDK 4-hour bearish confirmation, 30-minute weakness 🔥
════════════════════
🟢 $BABA 30-minute bearish signal
⚠️ Technical analysis: Enter on the 30-minute chart, with 4-hour bearish confluence confirmed! MACD death cross below zero with volume 1.5x, moving averages in a bearish alignment sloping downward, KDJ death cross; short-term outlook bearish.
════════════════════
🟢 $ASTS 30-minute bearish signal
⚠️ Technical analysis: 4-hour bearish trend + 30-minute confluence confirms a short opportunity! MACD death cross below zero with increased volume, moving averages in a bearish alignment diverging downward, KDJ death cross (K18.4 D20.2), volume up 1.9x.
════════════════════
🟢 $SNDK 30-minute bearish signal
⚠️ Technical analysis: 4-hour bearish trend + 30-minute short signal, with multi-timeframe confluence! After the MACD death cross, the green bars are growing; moving averages are in a bearish alignment, and KDJ has crossed down without entering oversold territory. A clear shorting opportunity.
════════════════════
🔔 Follow for first-hand market updates 🔔
#多周期共振 #BABA #ASTS #SNDK
📌 When trading, pay attention to whether the candlestick patterns align.
$BABA $ASTS $SNDK 4-hour bearish confirmation, 30-minute weakness 🔥
════════════════════
🟢 $BABA 30-minute bearish signal
⚠️ Technical analysis: Enter on the 30-minute chart, with 4-hour bearish confluence confirmed! MACD death cross below zero with volume 1.5x, moving averages in a bearish alignment sloping downward, KDJ death cross; short-term outlook bearish.
════════════════════
🟢 $ASTS 30-minute bearish signal
⚠️ Technical analysis: 4-hour bearish trend + 30-minute confluence confirms a short opportunity! MACD death cross below zero with increased volume, moving averages in a bearish alignment diverging downward, KDJ death cross (K18.4 D20.2), volume up 1.9x.
════════════════════
🟢 $SNDK 30-minute bearish signal
⚠️ Technical analysis: 4-hour bearish trend + 30-minute short signal, with multi-timeframe confluence! After the MACD death cross, the green bars are growing; moving averages are in a bearish alignment, and KDJ has crossed down without entering oversold territory. A clear shorting opportunity.
════════════════════
🔔 Follow for first-hand market updates 🔔
#多周期共振 #BABA #ASTS #SNDK
📌 When trading, pay attention to whether the candlestick patterns align.
════════════════════
🟢 $BABA 30-minute bearish signal
⚠️ Technical analysis: Enter on the 30-minute chart, with 4-hour bearish confluence confirmed! MACD death cross below zero with volume 1.5x, moving averages in a bearish alignment sloping downward, KDJ death cross; short-term outlook bearish.
════════════════════
🟢 $ASTS 30-minute bearish signal
⚠️ Technical analysis: 4-hour bearish trend + 30-minute confluence confirms a short opportunity! MACD death cross below zero with increased volume, moving averages in a bearish alignment diverging downward, KDJ death cross (K18.4 D20.2), volume up 1.9x.
════════════════════
🟢 $SNDK 30-minute bearish signal
⚠️ Technical analysis: 4-hour bearish trend + 30-minute short signal, with multi-timeframe confluence! After the MACD death cross, the green bars are growing; moving averages are in a bearish alignment, and KDJ has crossed down without entering oversold territory. A clear shorting opportunity.
════════════════════
🔔 Follow for first-hand market updates 🔔
#多周期共振 #BABA #ASTS #SNDK
📌 When trading, pay attention to whether the candlestick patterns align.
158
·
--
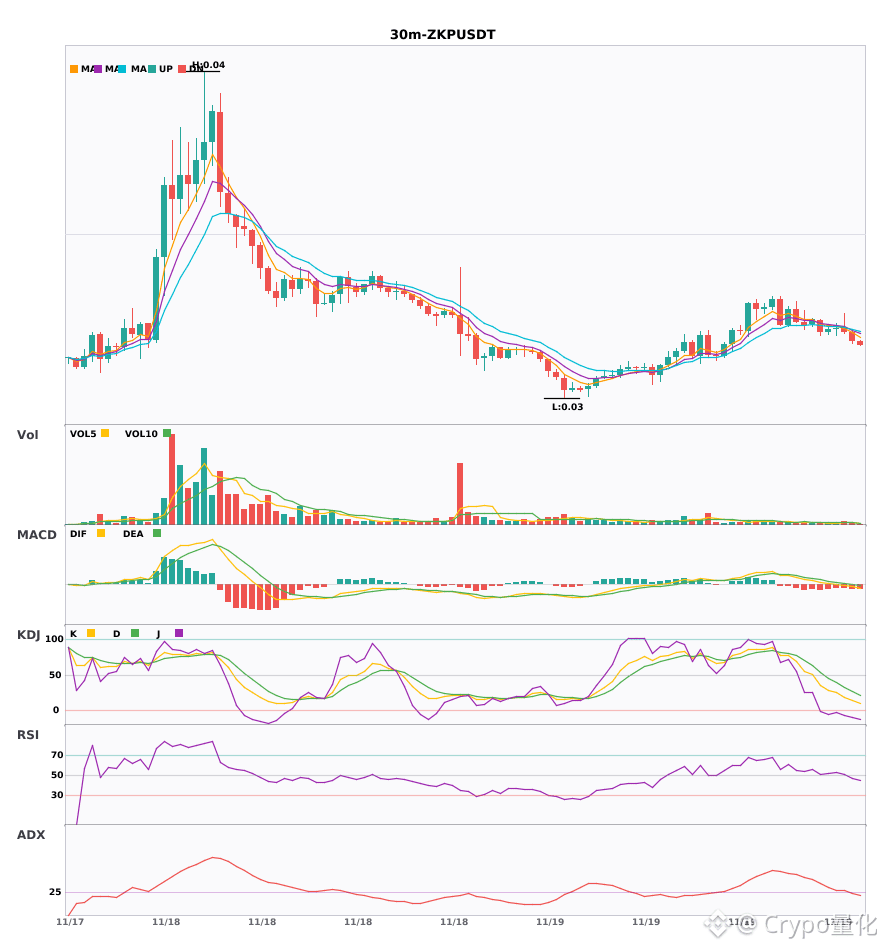
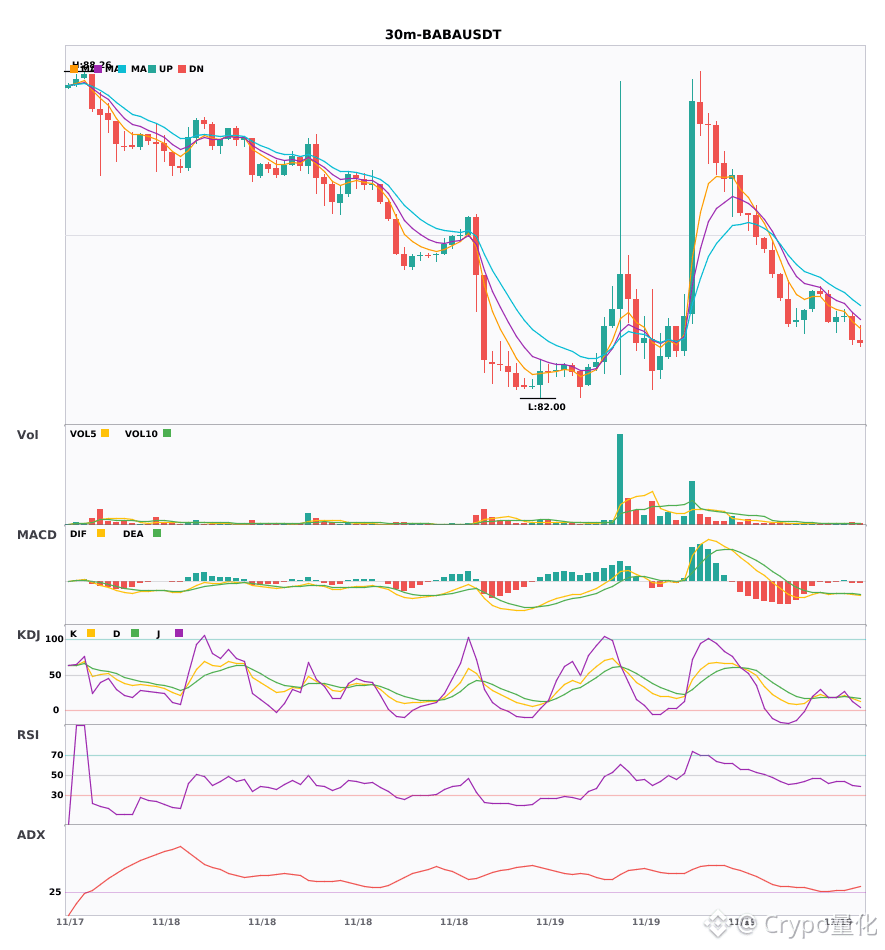
$ZKP $BABA $ASTS 30-minute bearish signals all at once—the bears are coming together 🔥
════════════════════
🟢 $ZKP 30-minute bearish signal
⚠️Technical: ADX trend is forming and can be followed | MACD breaks below the zero line, turning bearish | Moving averages are converging; a direction needs to be chosen | KDJ is weak, with K below D (K19 D32) | Volume is up 1.6x
════════════════════
🟢 $BABA 30-minute bearish signal
⚠️Technical: ADX shows a clear trend; MACD has a bearish cross below zero; moving averages are bearishly aligned; KDJ bearish cross (K16.5 D18.7); volume is up 1.5x
════════════════════
🟢 $ASTS 30-minute bearish signal
⚠️Technical: ADX indicates a clear trend; MACD has a bearish cross below zero on increased volume, and bearish momentum is accelerating. Moving averages are bearishly aligned and spreading downward. KDJ has a bearish cross, with K crossing below D in the low range, indicating short-term weakness. Trading volume is nearly twice as high.
════════════════════
🔔 Follow for first-hand market alerts 🔔
#技术分析 #ZKP #BABA #ASTS
📌 When trading, pay attention to whether the candlestick pattern confirms the setup.
$ZKP $BABA $ASTS 30-minute bearish signals all at once—the bears are coming together 🔥
════════════════════
🟢 $ZKP 30-minute bearish signal
⚠️Technical: ADX trend is forming and can be followed | MACD breaks below the zero line, turning bearish | Moving averages are converging; a direction needs to be chosen | KDJ is weak, with K below D (K19 D32) | Volume is up 1.6x
════════════════════
🟢 $BABA 30-minute bearish signal
⚠️Technical: ADX shows a clear trend; MACD has a bearish cross below zero; moving averages are bearishly aligned; KDJ bearish cross (K16.5 D18.7); volume is up 1.5x
════════════════════
🟢 $ASTS 30-minute bearish signal
⚠️Technical: ADX indicates a clear trend; MACD has a bearish cross below zero on increased volume, and bearish momentum is accelerating. Moving averages are bearishly aligned and spreading downward. KDJ has a bearish cross, with K crossing below D in the low range, indicating short-term weakness. Trading volume is nearly twice as high.
════════════════════
🔔 Follow for first-hand market alerts 🔔
#技术分析 #ZKP #BABA #ASTS
📌 When trading, pay attention to whether the candlestick pattern confirms the setup.
════════════════════
🟢 $ZKP 30-minute bearish signal
⚠️Technical: ADX trend is forming and can be followed | MACD breaks below the zero line, turning bearish | Moving averages are converging; a direction needs to be chosen | KDJ is weak, with K below D (K19 D32) | Volume is up 1.6x
════════════════════
🟢 $BABA 30-minute bearish signal
⚠️Technical: ADX shows a clear trend; MACD has a bearish cross below zero; moving averages are bearishly aligned; KDJ bearish cross (K16.5 D18.7); volume is up 1.5x
════════════════════
🟢 $ASTS 30-minute bearish signal
⚠️Technical: ADX indicates a clear trend; MACD has a bearish cross below zero on increased volume, and bearish momentum is accelerating. Moving averages are bearishly aligned and spreading downward. KDJ has a bearish cross, with K crossing below D in the low range, indicating short-term weakness. Trading volume is nearly twice as high.
════════════════════
🔔 Follow for first-hand market alerts 🔔
#技术分析 #ZKP #BABA #ASTS
📌 When trading, pay attention to whether the candlestick pattern confirms the setup.
32
·
--
Three currencies are bearish on both the 30-minute and 4-hour timeframes—short-side convergence confirmed 🔥
════════════════════
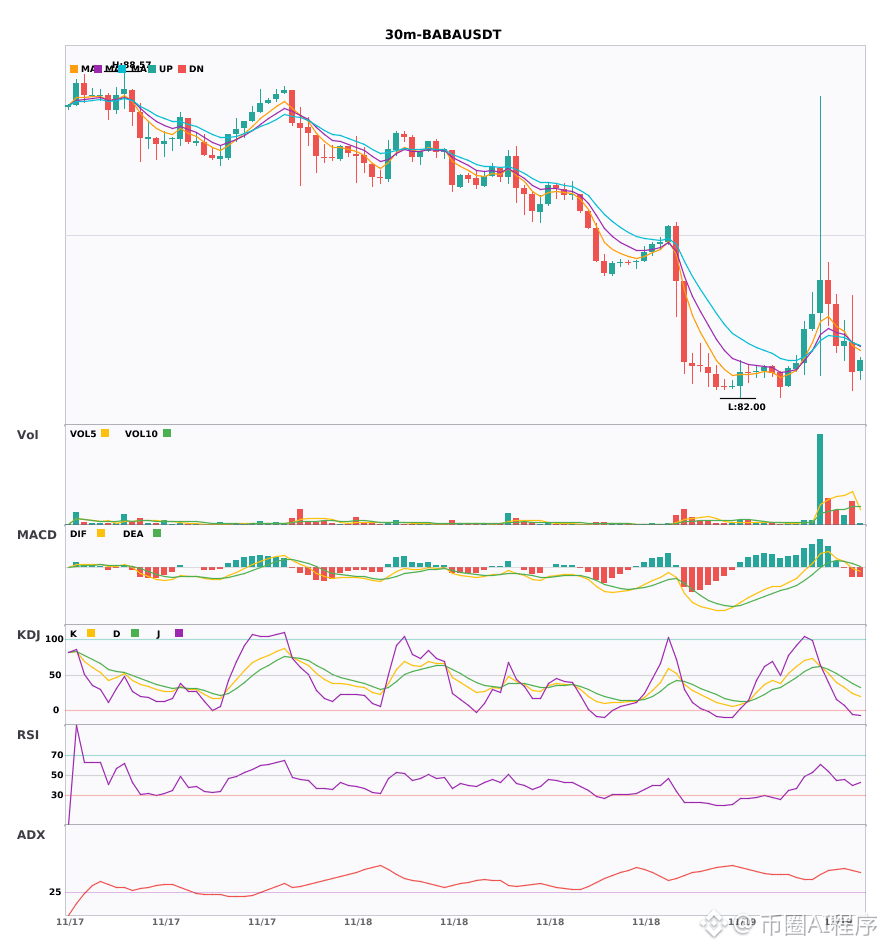
🟢 $BABA 30-minute bearish signal
⚠️Technical analysis: 30-minute entry signal, confirmed by 4-hour bearish convergence. The MACD bearish crossover is followed by expanding green bars, DIF has fallen below the zero line, EMA5 has just crossed below EMA8, forming a bearish alignment, and KDJ is trending down after a bearish crossover. Volume is expanding at a normal rate; multiple signals converge for a short.
════════════════════
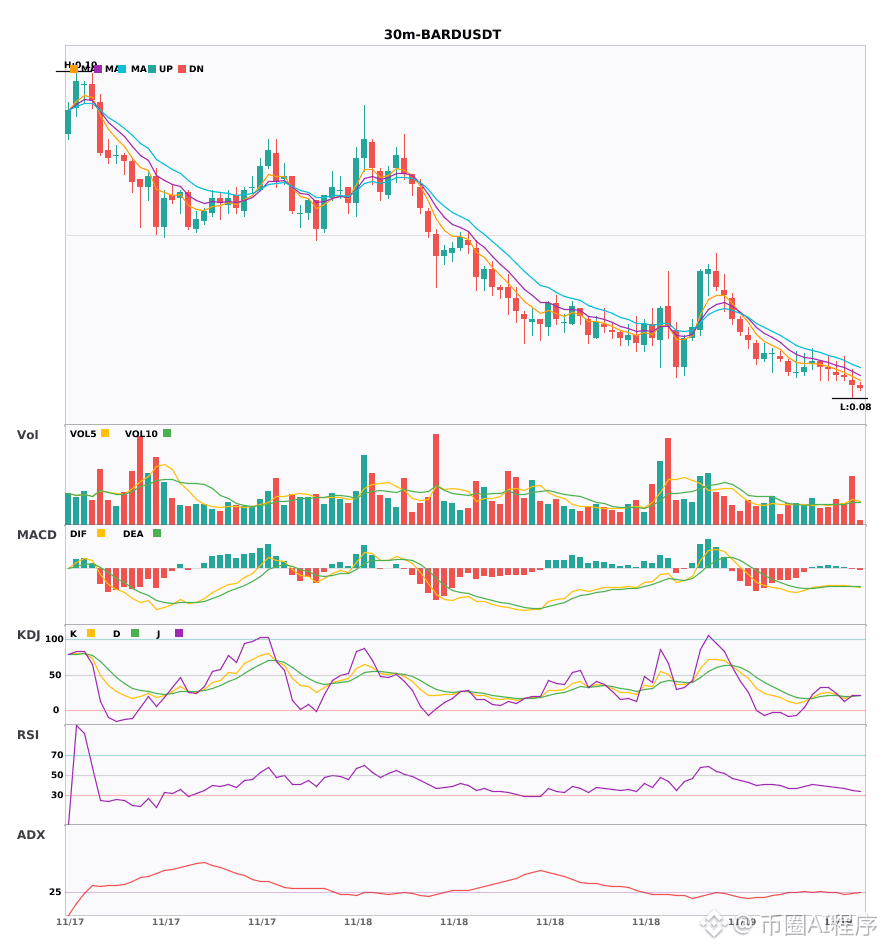
🟢 $BARD 30-minute bearish signal
⚠️Technical analysis: 4-hour bearish trend and 30-minute entry signal converge, confirming the setup. The MACD has crossed bearishly below zero, with expanding green bars; moving averages are diverging downward in a bearish alignment. KDJ has formed a golden cross at a low level without becoming overbought, and trading volume has increased 2.1 times.
════════════════════
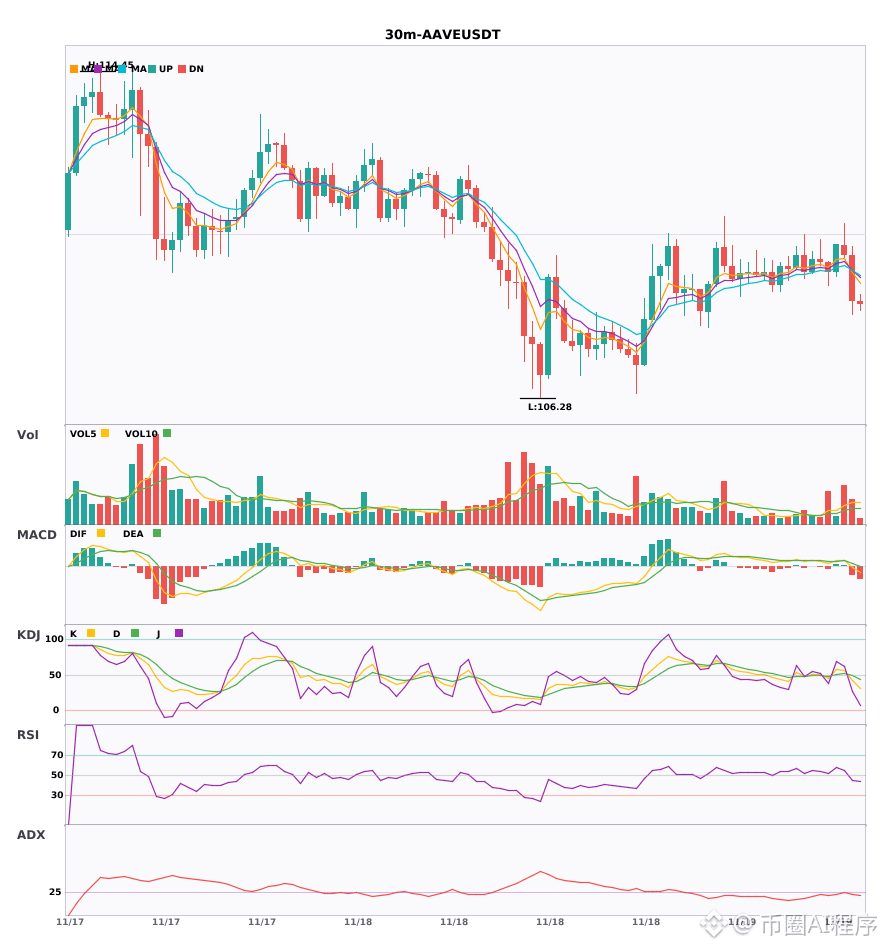
🟢 $AAVE 30-minute bearish signal
⚠️Technical analysis: 4-hour bearish trend + 30-minute entry signal converge, confirming the setup: MACD bearish crossover with rising volume and expanding green bars; moving averages diverge bearishly; KDJ has formed a bearish crossover without becoming oversold; volume has increased 2.7 times. Multiple timeframes converge for a short.
📢Market update: The Aave app has integrated $91 billion in liquidity from Tron and opened early access on Android. It has also launched stablecoin redemptions on Arbitrum; USD-denominated claims must be redeemed before funds are credited.
════════════════════
🔔 Follow for first-hand market updates 🔔
#多周期共振 #BABA #BARD #AAVE
📌 When trading, pay attention to whether the candlestick pattern matches the setup
Three currencies are bearish on both the 30-minute and 4-hour timeframes—short-side convergence confirmed 🔥
════════════════════
🟢 $BABA 30-minute bearish signal
⚠️Technical analysis: 30-minute entry signal, confirmed by 4-hour bearish convergence. The MACD bearish crossover is followed by expanding green bars, DIF has fallen below the zero line, EMA5 has just crossed below EMA8, forming a bearish alignment, and KDJ is trending down after a bearish crossover. Volume is expanding at a normal rate; multiple signals converge for a short.
════════════════════
🟢 $BARD 30-minute bearish signal
⚠️Technical analysis: 4-hour bearish trend and 30-minute entry signal converge, confirming the setup. The MACD has crossed bearishly below zero, with expanding green bars; moving averages are diverging downward in a bearish alignment. KDJ has formed a golden cross at a low level without becoming overbought, and trading volume has increased 2.1 times.
════════════════════
🟢 $AAVE 30-minute bearish signal
⚠️Technical analysis: 4-hour bearish trend + 30-minute entry signal converge, confirming the setup: MACD bearish crossover with rising volume and expanding green bars; moving averages diverge bearishly; KDJ has formed a bearish crossover without becoming oversold; volume has increased 2.7 times. Multiple timeframes converge for a short.
📢Market update: The Aave app has integrated $91 billion in liquidity from Tron and opened early access on Android. It has also launched stablecoin redemptions on Arbitrum; USD-denominated claims must be redeemed before funds are credited.
════════════════════
🔔 Follow for first-hand market updates 🔔
#多周期共振 #BABA #BARD #AAVE
📌 When trading, pay attention to whether the candlestick pattern matches the setup
════════════════════
🟢 $BABA 30-minute bearish signal
⚠️Technical analysis: 30-minute entry signal, confirmed by 4-hour bearish convergence. The MACD bearish crossover is followed by expanding green bars, DIF has fallen below the zero line, EMA5 has just crossed below EMA8, forming a bearish alignment, and KDJ is trending down after a bearish crossover. Volume is expanding at a normal rate; multiple signals converge for a short.
════════════════════
🟢 $BARD 30-minute bearish signal
⚠️Technical analysis: 4-hour bearish trend and 30-minute entry signal converge, confirming the setup. The MACD has crossed bearishly below zero, with expanding green bars; moving averages are diverging downward in a bearish alignment. KDJ has formed a golden cross at a low level without becoming overbought, and trading volume has increased 2.1 times.
════════════════════
🟢 $AAVE 30-minute bearish signal
⚠️Technical analysis: 4-hour bearish trend + 30-minute entry signal converge, confirming the setup: MACD bearish crossover with rising volume and expanding green bars; moving averages diverge bearishly; KDJ has formed a bearish crossover without becoming oversold; volume has increased 2.7 times. Multiple timeframes converge for a short.
📢Market update: The Aave app has integrated $91 billion in liquidity from Tron and opened early access on Android. It has also launched stablecoin redemptions on Arbitrum; USD-denominated claims must be redeemed before funds are credited.
════════════════════
🔔 Follow for first-hand market updates 🔔
#多周期共振 #BABA #BARD #AAVE
📌 When trading, pay attention to whether the candlestick pattern matches the setup
·
--
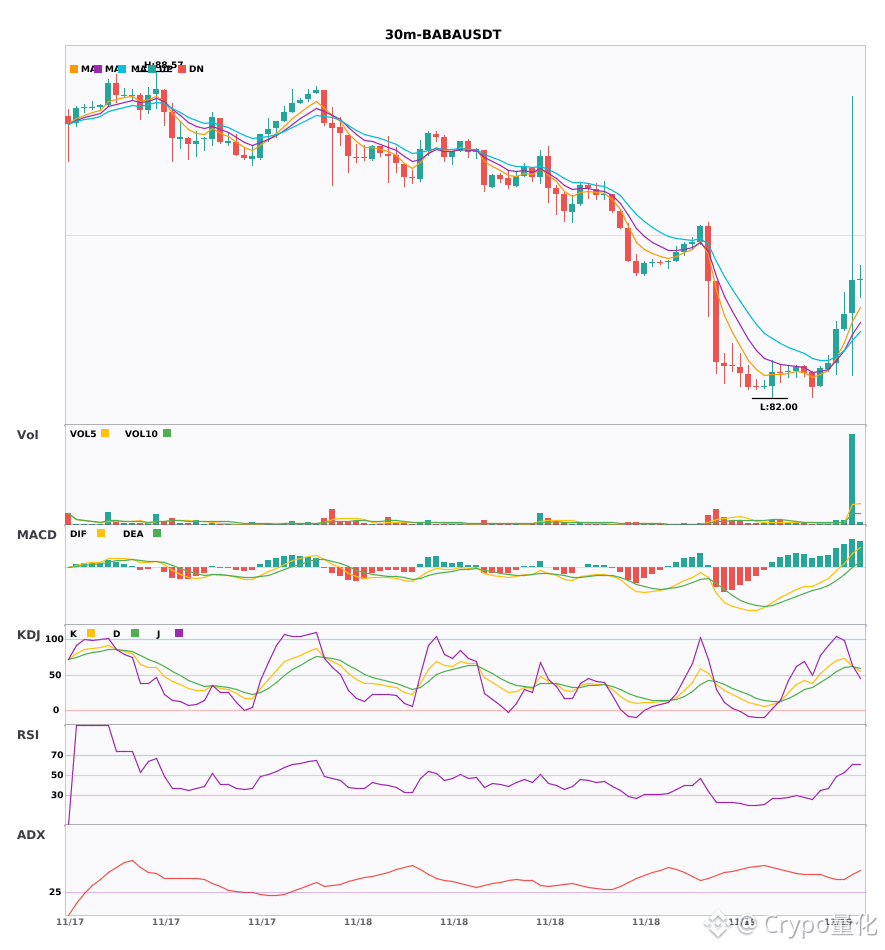
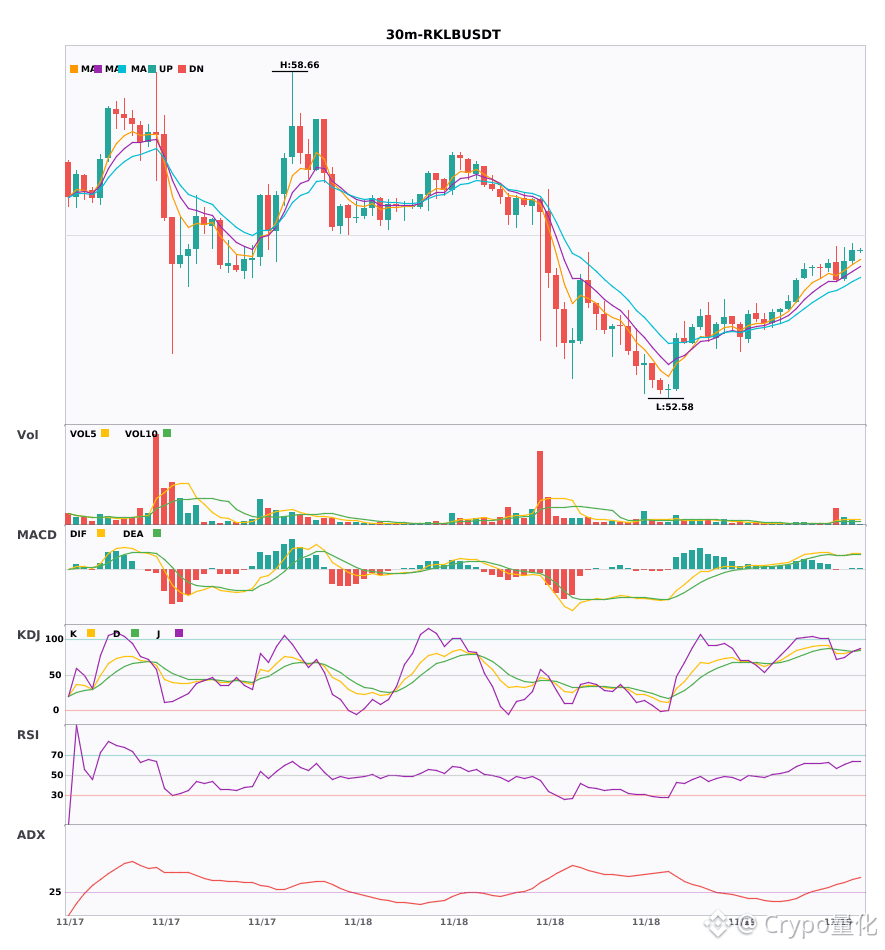
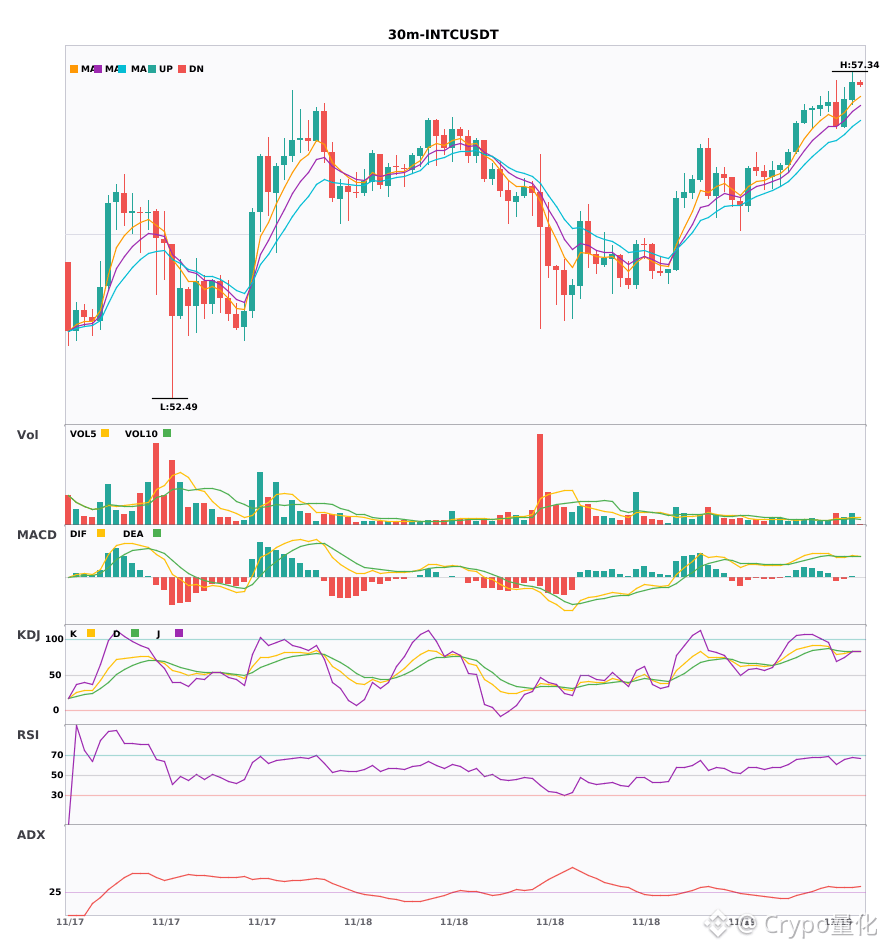
$BABA $RKLB $INTC 30-minute golden cross resonance, bullish signals are all in place 🔥
════════════════════
🔴 $BABA 30-minute bullish signal
⚠️Technical analysis: ADX 39, clear trend. MACD golden cross with increased volume, breaking above the zero line. Moving averages are converging and building momentum. KDJ favors strong bulls. Volume is up 1.8x.
════════════════════
🔴 $RKLB 30-minute bullish signal
⚠️Technical analysis: ADX above 46, an exceptionally strong trend—beware of a pullback from overbought conditions. MACD golden cross above zero with increased volume; the red bars are growing. Moving averages are in a bullish alignment, diverging upward. KDJ is in overbought territory, so watch for risk. Volume is up 2x.
════════════════════
🔴 $INTC 30-minute bullish signal
⚠️Technical analysis: ADX 33, a very strong trend. Volume increased after the MACD golden cross. Moving averages are in a bullish alignment, diverging upward. KDJ is overbought (K and D both at 83.3), so beware of a pullback. Volume is up 1.8x.
════════════════════
🔔 Follow for first-hand market alerts 🔔
#技术分析 #BABA #RKLB #INTC
📌 When trading, check whether the candlestick pattern confirms the signal
$BABA $RKLB $INTC 30-minute golden cross resonance, bullish signals are all in place 🔥
════════════════════
🔴 $BABA 30-minute bullish signal
⚠️Technical analysis: ADX 39, clear trend. MACD golden cross with increased volume, breaking above the zero line. Moving averages are converging and building momentum. KDJ favors strong bulls. Volume is up 1.8x.
════════════════════
🔴 $RKLB 30-minute bullish signal
⚠️Technical analysis: ADX above 46, an exceptionally strong trend—beware of a pullback from overbought conditions. MACD golden cross above zero with increased volume; the red bars are growing. Moving averages are in a bullish alignment, diverging upward. KDJ is in overbought territory, so watch for risk. Volume is up 2x.
════════════════════
🔴 $INTC 30-minute bullish signal
⚠️Technical analysis: ADX 33, a very strong trend. Volume increased after the MACD golden cross. Moving averages are in a bullish alignment, diverging upward. KDJ is overbought (K and D both at 83.3), so beware of a pullback. Volume is up 1.8x.
════════════════════
🔔 Follow for first-hand market alerts 🔔
#技术分析 #BABA #RKLB #INTC
📌 When trading, check whether the candlestick pattern confirms the signal
════════════════════
🔴 $BABA 30-minute bullish signal
⚠️Technical analysis: ADX 39, clear trend. MACD golden cross with increased volume, breaking above the zero line. Moving averages are converging and building momentum. KDJ favors strong bulls. Volume is up 1.8x.
════════════════════
🔴 $RKLB 30-minute bullish signal
⚠️Technical analysis: ADX above 46, an exceptionally strong trend—beware of a pullback from overbought conditions. MACD golden cross above zero with increased volume; the red bars are growing. Moving averages are in a bullish alignment, diverging upward. KDJ is in overbought territory, so watch for risk. Volume is up 2x.
════════════════════
🔴 $INTC 30-minute bullish signal
⚠️Technical analysis: ADX 33, a very strong trend. Volume increased after the MACD golden cross. Moving averages are in a bullish alignment, diverging upward. KDJ is overbought (K and D both at 83.3), so beware of a pullback. Volume is up 1.8x.
════════════════════
🔔 Follow for first-hand market alerts 🔔
#技术分析 #BABA #RKLB #INTC
📌 When trading, check whether the candlestick pattern confirms the signal
3
·
--
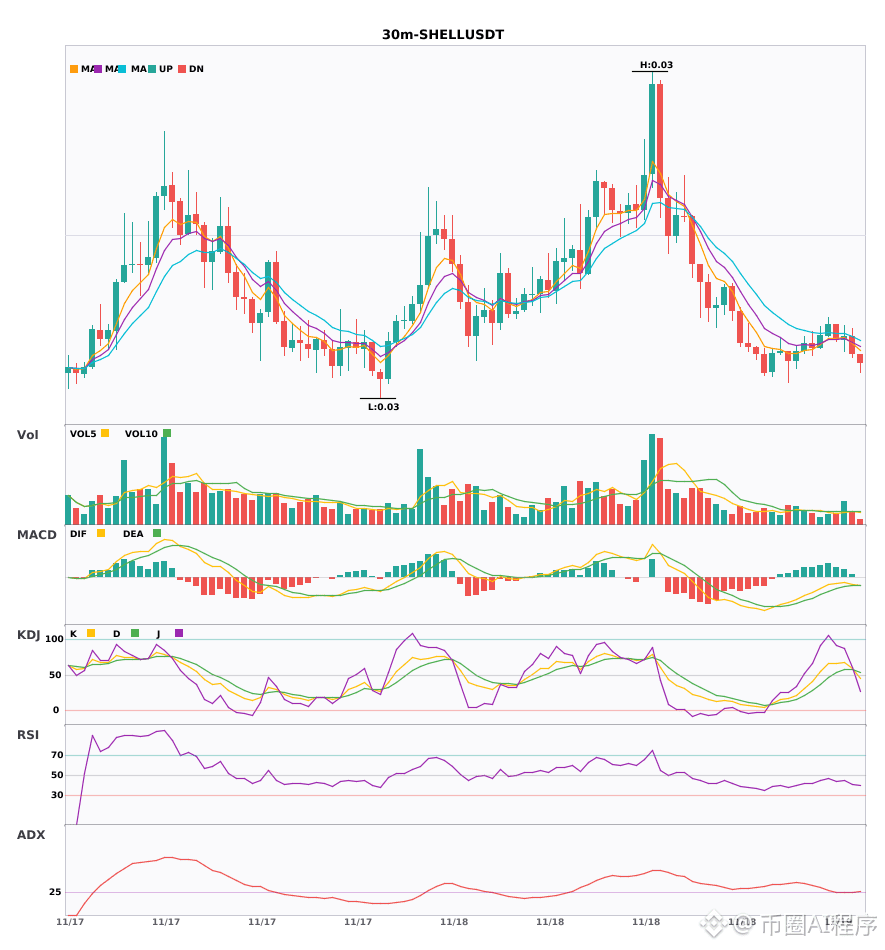
The 30-minute and 4-hour moving averages are both diverging bearishly; 2 coins show a synchronized bearish signal 🔥
════════════════════
🟢 $SHELL 30-minute bearish signal
⚠️ Technicals: The 4-hour bearish trend is confirmed. On the 30-minute chart, EMA5 has just crossed below EMA8, forming a death cross and turning bearish. Multiple timeframes align to signal a bearish outlook; in the strong zone, KDJ's K line has crossed above D, giving bulls the upper hand. Trading volume has increased 1.7x.
📢 Market update: MyShell (SHELL) airdrops continue: Binance has launched the second HODLer Airdrop. Users with a history of holding BNB in Simple Earn may receive SHELL airdrops. SHELL locked products offer annualized yields of up to 29.9%.
════════════════════
🟢 $BABA 30-minute bearish signal
⚠️ Technicals: The 4-hour and 30-minute charts confirm a synchronized bearish trend! On the 30-minute chart, EMA5 has just crossed below EMA8, with the moving averages in a bearish alignment and diverging downward. Trading volume has surged 5.7x.
════════════════════
🔔 Follow for real-time market updates 🔔
#多周期共振 #SHELL #BABA
📌 When trading, pay attention to whether the candlestick patterns confirm the setup.
The 30-minute and 4-hour moving averages are both diverging bearishly; 2 coins show a synchronized bearish signal 🔥
════════════════════
🟢 $SHELL 30-minute bearish signal
⚠️ Technicals: The 4-hour bearish trend is confirmed. On the 30-minute chart, EMA5 has just crossed below EMA8, forming a death cross and turning bearish. Multiple timeframes align to signal a bearish outlook; in the strong zone, KDJ's K line has crossed above D, giving bulls the upper hand. Trading volume has increased 1.7x.
📢 Market update: MyShell (SHELL) airdrops continue: Binance has launched the second HODLer Airdrop. Users with a history of holding BNB in Simple Earn may receive SHELL airdrops. SHELL locked products offer annualized yields of up to 29.9%.
════════════════════
🟢 $BABA 30-minute bearish signal
⚠️ Technicals: The 4-hour and 30-minute charts confirm a synchronized bearish trend! On the 30-minute chart, EMA5 has just crossed below EMA8, with the moving averages in a bearish alignment and diverging downward. Trading volume has surged 5.7x.
════════════════════
🔔 Follow for real-time market updates 🔔
#多周期共振 #SHELL #BABA
📌 When trading, pay attention to whether the candlestick patterns confirm the setup.
════════════════════
🟢 $SHELL 30-minute bearish signal
⚠️ Technicals: The 4-hour bearish trend is confirmed. On the 30-minute chart, EMA5 has just crossed below EMA8, forming a death cross and turning bearish. Multiple timeframes align to signal a bearish outlook; in the strong zone, KDJ's K line has crossed above D, giving bulls the upper hand. Trading volume has increased 1.7x.
📢 Market update: MyShell (SHELL) airdrops continue: Binance has launched the second HODLer Airdrop. Users with a history of holding BNB in Simple Earn may receive SHELL airdrops. SHELL locked products offer annualized yields of up to 29.9%.
════════════════════
🟢 $BABA 30-minute bearish signal
⚠️ Technicals: The 4-hour and 30-minute charts confirm a synchronized bearish trend! On the 30-minute chart, EMA5 has just crossed below EMA8, with the moving averages in a bearish alignment and diverging downward. Trading volume has surged 5.7x.
════════════════════
🔔 Follow for real-time market updates 🔔
#多周期共振 #SHELL #BABA
📌 When trading, pay attention to whether the candlestick patterns confirm the setup.
30

*According to people familiar with the matter, NVIDIA’s sales team introduced Alibaba to Alice Huang, who was accused of being a Chinese spy, in 2022.
*NVIDIA’s referral helped Alice Huang successfully sign Alibaba as a customer before the U.S. export ban took effect.
#NVDA • #BABA
Source: Tradfin
⏰ 11-18 11:10
$NVDA $BABA
*According to people familiar with the matter, NVIDIA’s sales team introduced Alibaba to Alice Huang, who was accused of being a Chinese spy, in 2022.
*NVIDIA’s referral helped Alice Huang successfully sign Alibaba as a customer before the U.S. export ban took effect.
#NVDA • #BABA
Source: Tradfin
⏰ 11-18 11:10
$NVDA $BABA
*NVIDIA’s referral helped Alice Huang successfully sign Alibaba as a customer before the U.S. export ban took effect.
#NVDA • #BABA
Source: Tradfin
⏰ 11-18 11:10
$NVDA $BABA
146
·
--
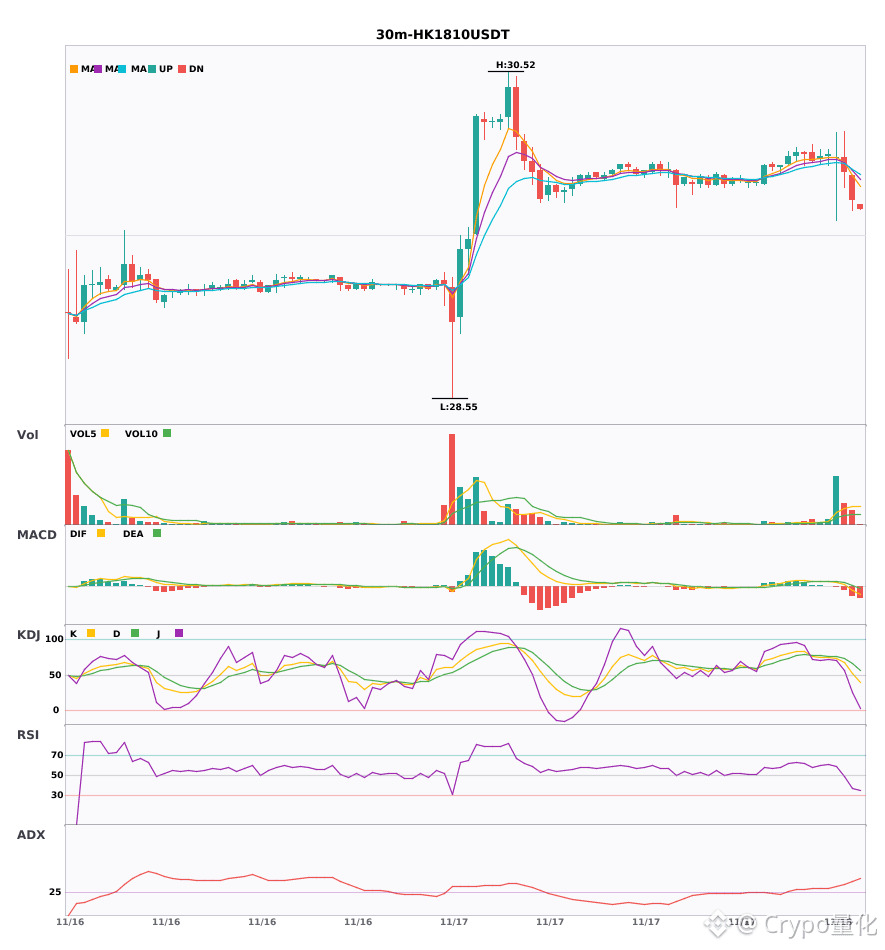
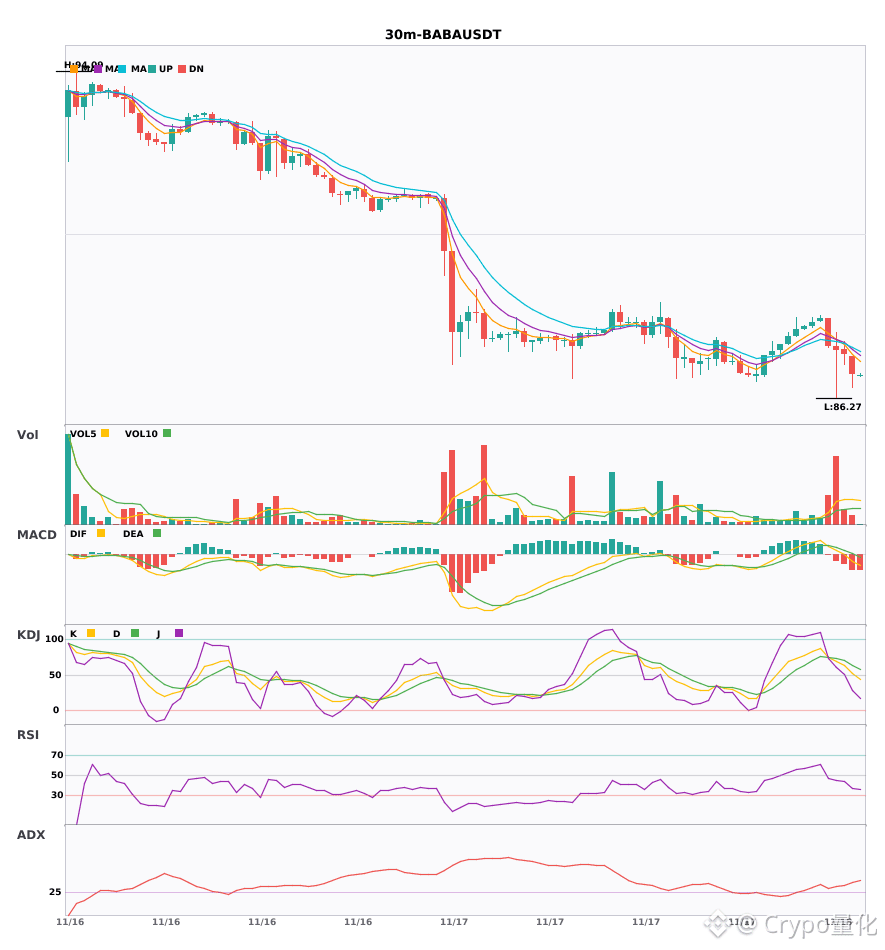
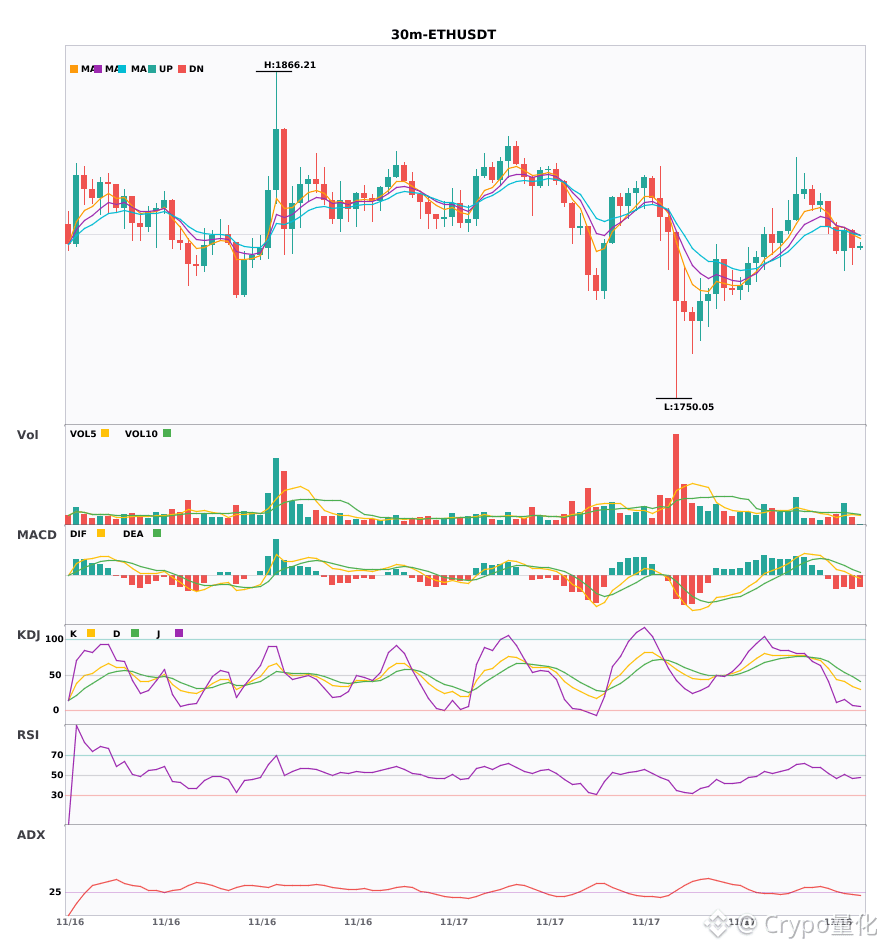
Caution! 30-minute bearish alert $HK1810/$BABA/$ETH🔥
════════════════════
🟢 $HK1810 30-minute bearish signal
⚠️Technical analysis: The trend is very clear. MACD has fallen below the zero line, signaling bearishness, and the moving averages have just formed a bearish alignment. In KDJ, K has crossed above D but is not yet overbought, giving the bulls the edge; volume has increased 2.3 times.
════════════════════
🟢 $BABA 30-minute bearish signal
⚠️Technical analysis: ADX at 37 indicates a clear but bearish trend. MACD has formed a death cross and fallen below the zero line, turning bearish. The moving averages are weakening. KDJ is not yet overbought, but momentum is insufficient; the surge in volume may indicate selling pressure. Overall, the outlook is bearish.
════════════════════
🟢 $ETH 30-minute bearish signal
⚠️Technical analysis: The ADX trend is just starting to pick up and may be worth following. MACD has formed a death cross and fallen below the zero line, signaling bearishness. The moving averages are converging as the market awaits direction. In KDJ, K has crossed below D, giving the bears the edge; volume has increased 1.7 times.
📢Market update: Ethereum network (ETH) wallet maintenance — 2026-10-28
════════════════════
🔔 Follow for first-hand market alerts 🔔
#技术分析 #HK1810 #BABA #ETH
📌 When trading, pay attention to whether the candlestick pattern confirms the signal.
Caution! 30-minute bearish alert $HK1810 /$BABA /$ETH 🔥
════════════════════
🟢 $HK1810 30-minute bearish signal
⚠️Technical analysis: The trend is very clear. MACD has fallen below the zero line, signaling bearishness, and the moving averages have just formed a bearish alignment. In KDJ, K has crossed above D but is not yet overbought, giving the bulls the edge; volume has increased 2.3 times.
════════════════════
🟢 $BABA 30-minute bearish signal
⚠️Technical analysis: ADX at 37 indicates a clear but bearish trend. MACD has formed a death cross and fallen below the zero line, turning bearish. The moving averages are weakening. KDJ is not yet overbought, but momentum is insufficient; the surge in volume may indicate selling pressure. Overall, the outlook is bearish.
════════════════════
🟢 $ETH 30-minute bearish signal
⚠️Technical analysis: The ADX trend is just starting to pick up and may be worth following. MACD has formed a death cross and fallen below the zero line, signaling bearishness. The moving averages are converging as the market awaits direction. In KDJ, K has crossed below D, giving the bears the edge; volume has increased 1.7 times.
📢Market update: Ethereum network (ETH) wallet maintenance — 2026-10-28
════════════════════
🔔 Follow for first-hand market alerts 🔔
#技术分析 #HK1810 #BABA #ETH
📌 When trading, pay attention to whether the candlestick pattern confirms the signal.
════════════════════
🟢 $HK1810 30-minute bearish signal
⚠️Technical analysis: The trend is very clear. MACD has fallen below the zero line, signaling bearishness, and the moving averages have just formed a bearish alignment. In KDJ, K has crossed above D but is not yet overbought, giving the bulls the edge; volume has increased 2.3 times.
════════════════════
🟢 $BABA 30-minute bearish signal
⚠️Technical analysis: ADX at 37 indicates a clear but bearish trend. MACD has formed a death cross and fallen below the zero line, turning bearish. The moving averages are weakening. KDJ is not yet overbought, but momentum is insufficient; the surge in volume may indicate selling pressure. Overall, the outlook is bearish.
════════════════════
🟢 $ETH 30-minute bearish signal
⚠️Technical analysis: The ADX trend is just starting to pick up and may be worth following. MACD has formed a death cross and fallen below the zero line, signaling bearishness. The moving averages are converging as the market awaits direction. In KDJ, K has crossed below D, giving the bears the edge; volume has increased 1.7 times.
📢Market update: Ethereum network (ETH) wallet maintenance — 2026-10-28
════════════════════
🔔 Follow for first-hand market alerts 🔔
#技术分析 #HK1810 #BABA #ETH
📌 When trading, pay attention to whether the candlestick pattern confirms the signal.
5
·
--
4-hour and daily charts are both decisively bearish—bearish signals are aligned across 3 coins 🔥
════════════════════
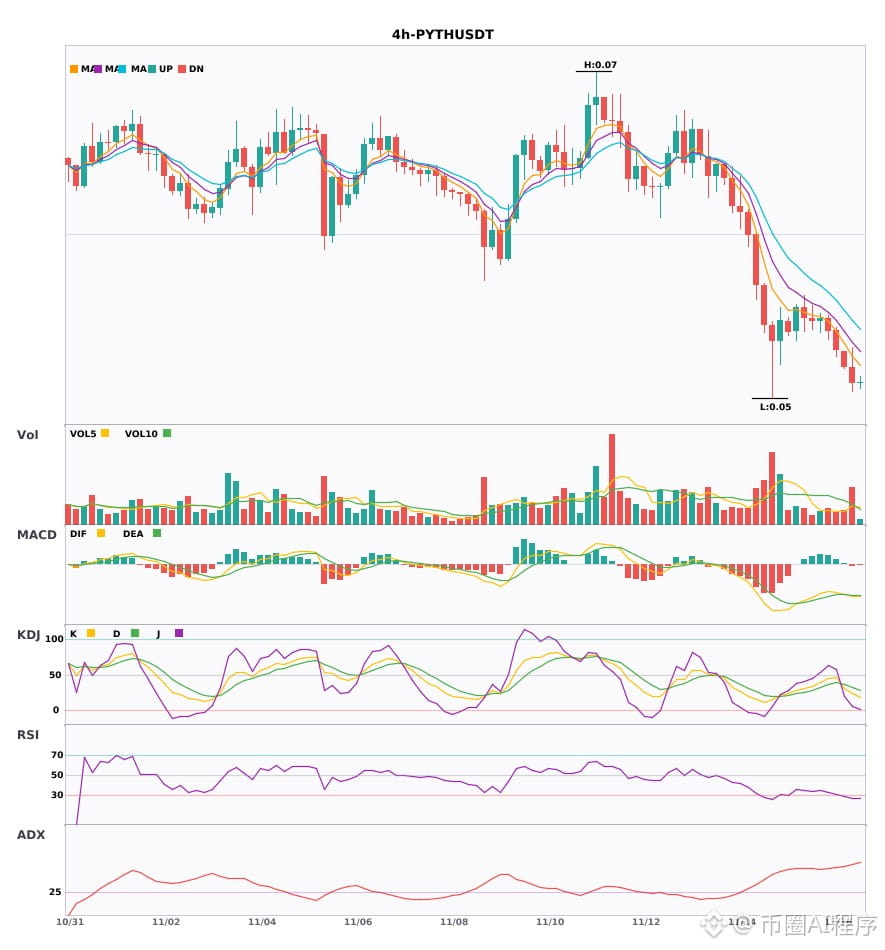
🟢 $PYTH 4-hour bearish signal
⚠️ Technical analysis: Multi-timeframe alignment: daily bearish + 4-hour bearish confirmation! MACD has formed a death cross, with expanding green bars. Moving averages are bearishly aligned and diverging downward. KDJ is weak (K23.7 D32.5), with volume up 1.8x.
════════════════════
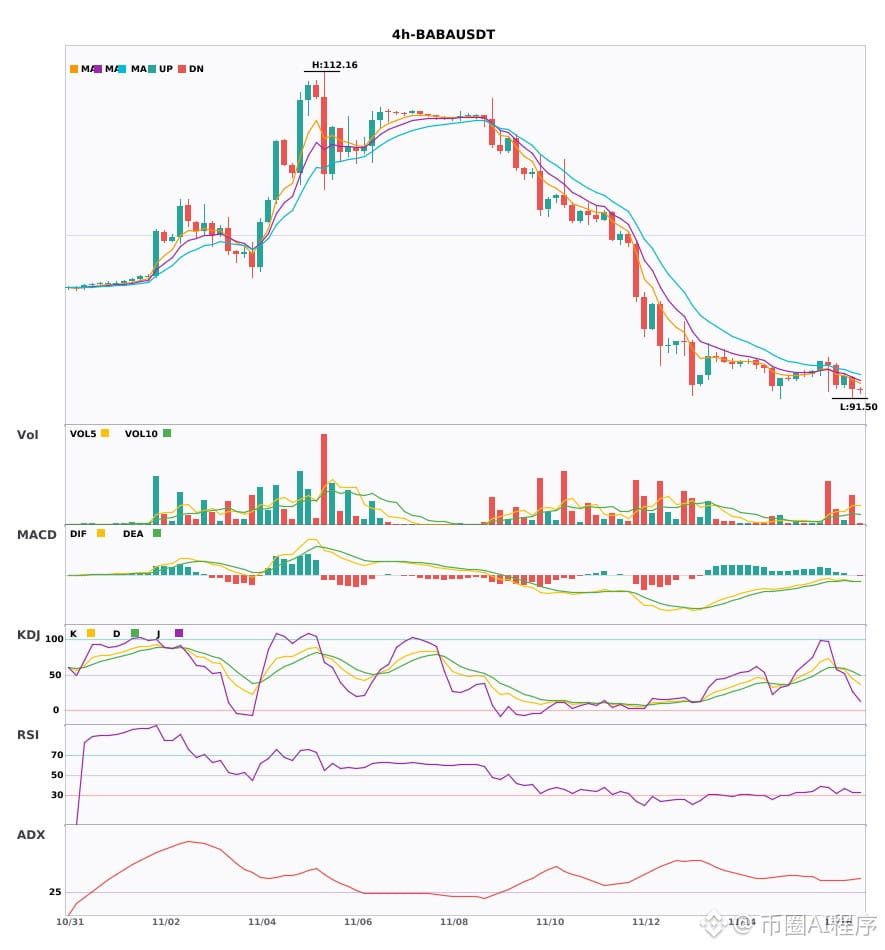
🟢 $BABA 4-hour bearish signal
⚠️ Technical analysis: Daily bearish + 4-hour alignment confirmed! MACD has formed a death cross below zero on rising volume. Moving averages are bearishly aligned and diverging downward. Volume has surged 2.6x, and bearish momentum is accelerating.
════════════════════
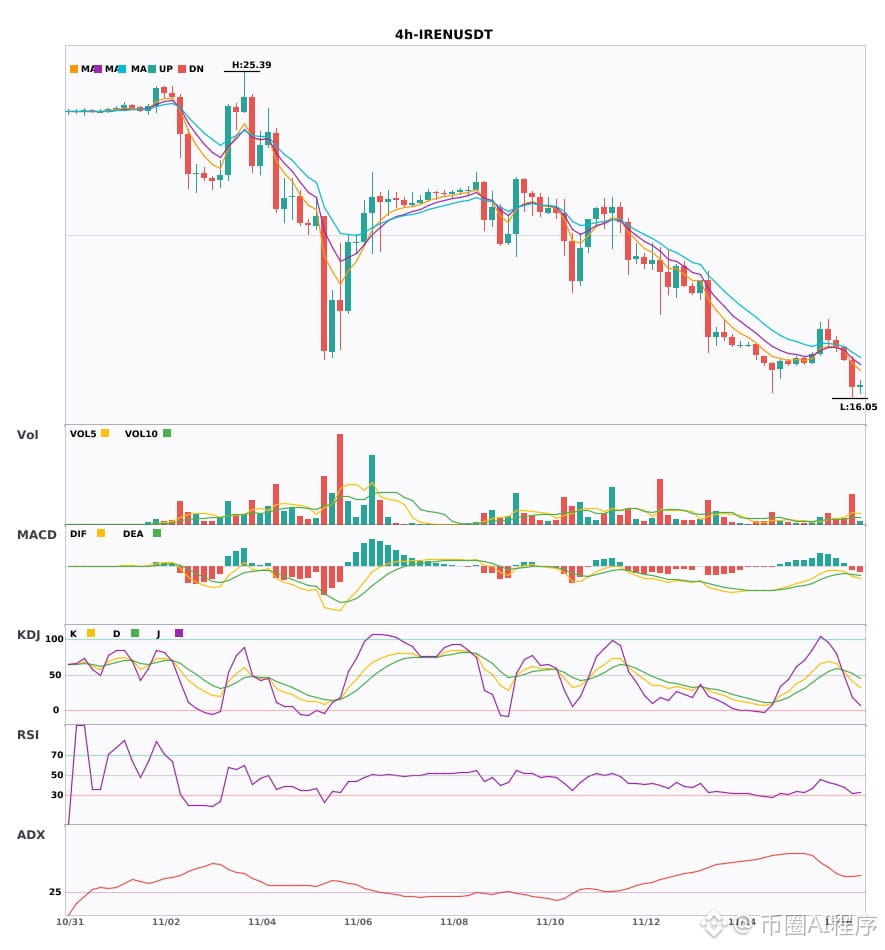
🟢 $IREN 4-hour bearish signal
⚠️ Technical analysis: 4-hour bearish entry + daily bearish alignment confirmed. Multi-timeframe signals align to the downside. MACD has formed a death cross below zero on rising volume. Moving averages are bearishly aligned and diverging downward, with volume surging 4.1x.
════════════════════
🔔 Follow for first-hand market alerts 🔔
#多周期共振 #PYTH #BABA #IREN
📌 When trading, check whether the candlestick pattern confirms the setup
4-hour and daily charts are both decisively bearish—bearish signals are aligned across 3 coins 🔥
════════════════════
🟢 $PYTH 4-hour bearish signal
⚠️ Technical analysis: Multi-timeframe alignment: daily bearish + 4-hour bearish confirmation! MACD has formed a death cross, with expanding green bars. Moving averages are bearishly aligned and diverging downward. KDJ is weak (K23.7 D32.5), with volume up 1.8x.
════════════════════
🟢 $BABA 4-hour bearish signal
⚠️ Technical analysis: Daily bearish + 4-hour alignment confirmed! MACD has formed a death cross below zero on rising volume. Moving averages are bearishly aligned and diverging downward. Volume has surged 2.6x, and bearish momentum is accelerating.
════════════════════
🟢 $IREN 4-hour bearish signal
⚠️ Technical analysis: 4-hour bearish entry + daily bearish alignment confirmed. Multi-timeframe signals align to the downside. MACD has formed a death cross below zero on rising volume. Moving averages are bearishly aligned and diverging downward, with volume surging 4.1x.
════════════════════
🔔 Follow for first-hand market alerts 🔔
#多周期共振 #PYTH #BABA #IREN
📌 When trading, check whether the candlestick pattern confirms the setup
════════════════════
🟢 $PYTH 4-hour bearish signal
⚠️ Technical analysis: Multi-timeframe alignment: daily bearish + 4-hour bearish confirmation! MACD has formed a death cross, with expanding green bars. Moving averages are bearishly aligned and diverging downward. KDJ is weak (K23.7 D32.5), with volume up 1.8x.
════════════════════
🟢 $BABA 4-hour bearish signal
⚠️ Technical analysis: Daily bearish + 4-hour alignment confirmed! MACD has formed a death cross below zero on rising volume. Moving averages are bearishly aligned and diverging downward. Volume has surged 2.6x, and bearish momentum is accelerating.
════════════════════
🟢 $IREN 4-hour bearish signal
⚠️ Technical analysis: 4-hour bearish entry + daily bearish alignment confirmed. Multi-timeframe signals align to the downside. MACD has formed a death cross below zero on rising volume. Moving averages are bearishly aligned and diverging downward, with volume surging 4.1x.
════════════════════
🔔 Follow for first-hand market alerts 🔔
#多周期共振 #PYTH #BABA #IREN
📌 When trading, check whether the candlestick pattern confirms the setup
1

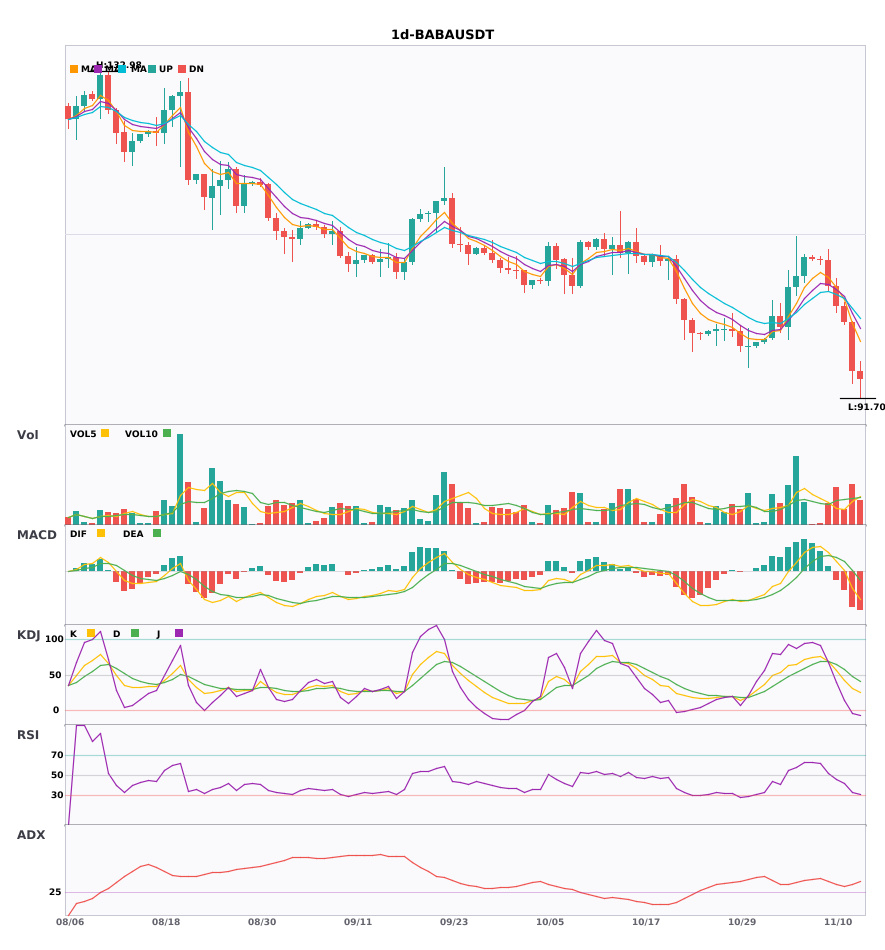
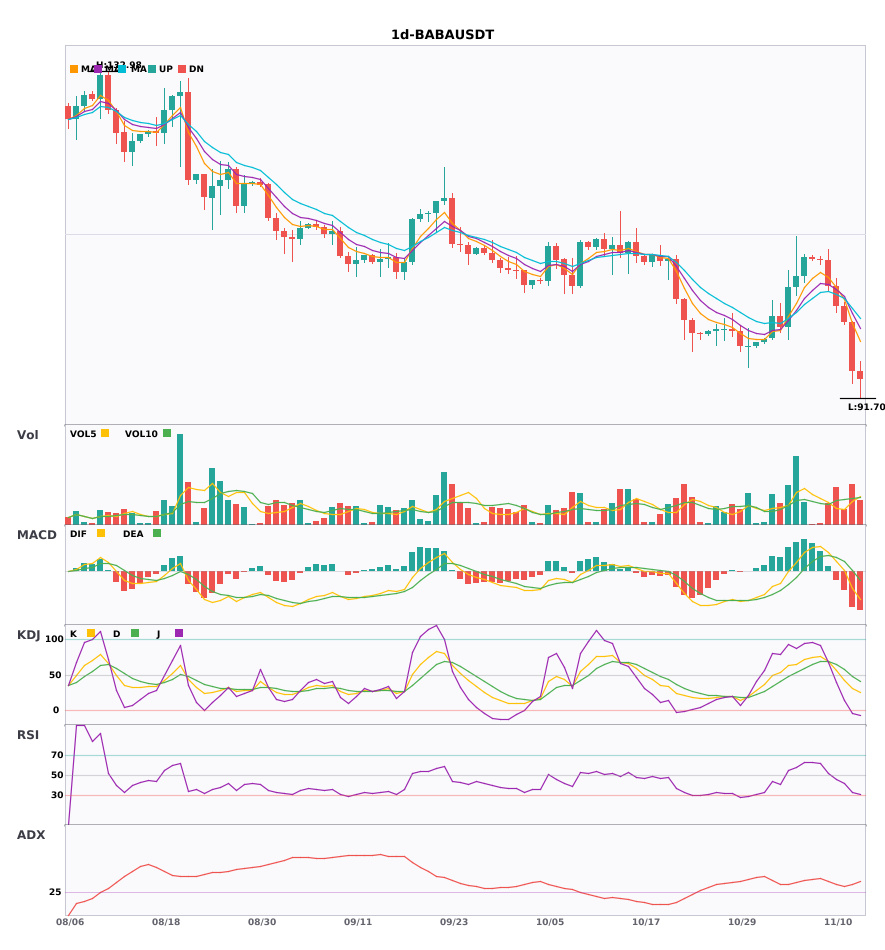
$BABA The daily trend is bearish, with short-term downward pressure ahead
📉 $BABA | Daily bearish signal
━━━━━━━━━━━━━━━━━━
Technical analysis: ADX (38) indicates a pronounced trend; MACD DIF has crossed below the zero line, turning bearish; EMA5/8/13 are in a bearish alignment; KDJ is weak (K31.3, D48.6); trading volume has increased 1.5-fold.
Price change: -6.0900%
━━━━━━━━━━━━━━━━━━
#技术分析 #BABA
📌 The above content is for reference only and does not constitute investment advice
$BABA The daily trend is bearish, with short-term downward pressure ahead
📉 $BABA | Daily bearish signal
━━━━━━━━━━━━━━━━━━
Technical analysis: ADX (38) indicates a pronounced trend; MACD DIF has crossed below the zero line, turning bearish; EMA5/8/13 are in a bearish alignment; KDJ is weak (K31.3, D48.6); trading volume has increased 1.5-fold.
Price change: -6.0900%
━━━━━━━━━━━━━━━━━━
#技术分析 #BABA
📌 The above content is for reference only and does not constitute investment advice
📉 $BABA | Daily bearish signal
━━━━━━━━━━━━━━━━━━
Technical analysis: ADX (38) indicates a pronounced trend; MACD DIF has crossed below the zero line, turning bearish; EMA5/8/13 are in a bearish alignment; KDJ is weak (K31.3, D48.6); trading volume has increased 1.5-fold.
Price change: -6.0900%
━━━━━━━━━━━━━━━━━━
#技术分析 #BABA
📌 The above content is for reference only and does not constitute investment advice
9
·
--
$BABA daily chart bearish warning: pullback risk is rising 🔥
════════════════════
🟢 $BABA daily chart bearish signal
⚠️ Technical analysis: ADX is at 38, indicating a strong trend. The MACD bearish crossover has fallen below the zero line, turning bearish. The moving averages are bearishly aligned and diverging. K has crossed below D on the KDJ without entering oversold territory. Volume has increased 1.5-fold, with bears in control.
════════════════════
🔔 Follow for first-hand market movement updates 🔔
#技术分析 #BABA
📌 When trading, pay attention to whether the candlestick pattern confirms the setup
$BABA daily chart bearish warning: pullback risk is rising 🔥
════════════════════
🟢 $BABA daily chart bearish signal
⚠️ Technical analysis: ADX is at 38, indicating a strong trend. The MACD bearish crossover has fallen below the zero line, turning bearish. The moving averages are bearishly aligned and diverging. K has crossed below D on the KDJ without entering oversold territory. Volume has increased 1.5-fold, with bears in control.
════════════════════
🔔 Follow for first-hand market movement updates 🔔
#技术分析 #BABA
📌 When trading, pay attention to whether the candlestick pattern confirms the setup
════════════════════
🟢 $BABA daily chart bearish signal
⚠️ Technical analysis: ADX is at 38, indicating a strong trend. The MACD bearish crossover has fallen below the zero line, turning bearish. The moving averages are bearishly aligned and diverging. K has crossed below D on the KDJ without entering oversold territory. Volume has increased 1.5-fold, with bears in control.
════════════════════
🔔 Follow for first-hand market movement updates 🔔
#技术分析 #BABA
📌 When trading, pay attention to whether the candlestick pattern confirms the setup
8
·
--
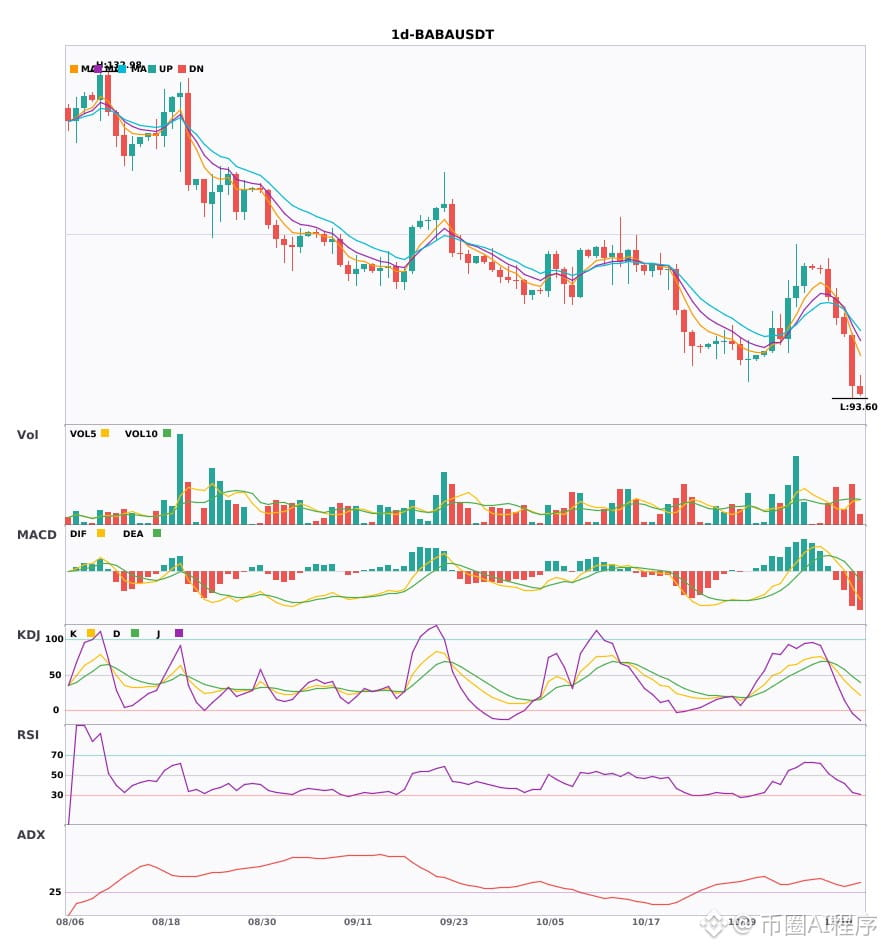
$BABA Daily chart multi-timeframe resonance is diverging, and the weekly bearish trend has just been confirmed—an opportunity to go short has arrived 🔥
════════════════════
🟢 $BABA Daily chart bearish signal
⚠️ Technical analysis: Weekly and daily bearish resonance confirmed; a short signal. After the daily MACD death cross, price fell below the zero line on increased volume. The EMAs are bearishly aligned and diverging downward. KDJ K crossed below D and is moving weakly (K31.3 D48.6). Trading volume increased 1.5 times, and the trend has turned bearish.
════════════════════
🔔 Follow to get first-hand market updates 🔔
#多周期共振 #BABA
📌 When trading, pay attention to whether the candlestick pattern is consistent
$BABA Daily chart multi-timeframe resonance is diverging, and the weekly bearish trend has just been confirmed—an opportunity to go short has arrived 🔥
════════════════════
🟢 $BABA Daily chart bearish signal
⚠️ Technical analysis: Weekly and daily bearish resonance confirmed; a short signal. After the daily MACD death cross, price fell below the zero line on increased volume. The EMAs are bearishly aligned and diverging downward. KDJ K crossed below D and is moving weakly (K31.3 D48.6). Trading volume increased 1.5 times, and the trend has turned bearish.
════════════════════
🔔 Follow to get first-hand market updates 🔔
#多周期共振 #BABA
📌 When trading, pay attention to whether the candlestick pattern is consistent
════════════════════
🟢 $BABA Daily chart bearish signal
⚠️ Technical analysis: Weekly and daily bearish resonance confirmed; a short signal. After the daily MACD death cross, price fell below the zero line on increased volume. The EMAs are bearishly aligned and diverging downward. KDJ K crossed below D and is moving weakly (K31.3 D48.6). Trading volume increased 1.5 times, and the trend has turned bearish.
════════════════════
🔔 Follow to get first-hand market updates 🔔
#多周期共振 #BABA
📌 When trading, pay attention to whether the candlestick pattern is consistent
5
·
--
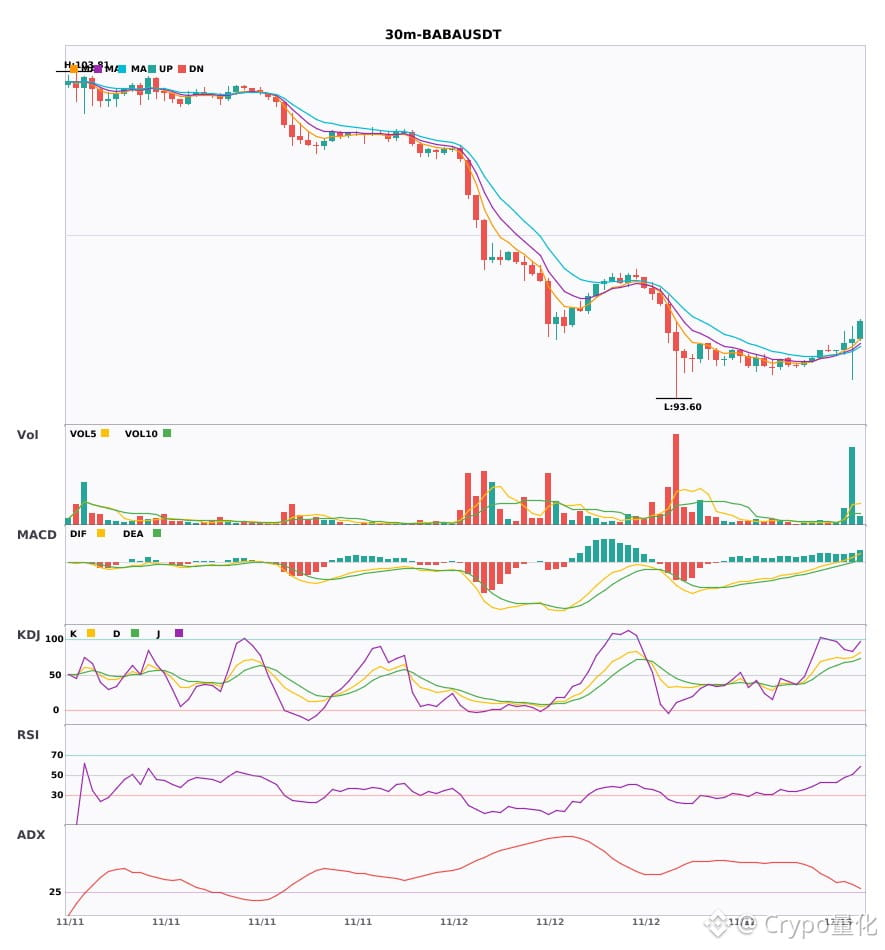
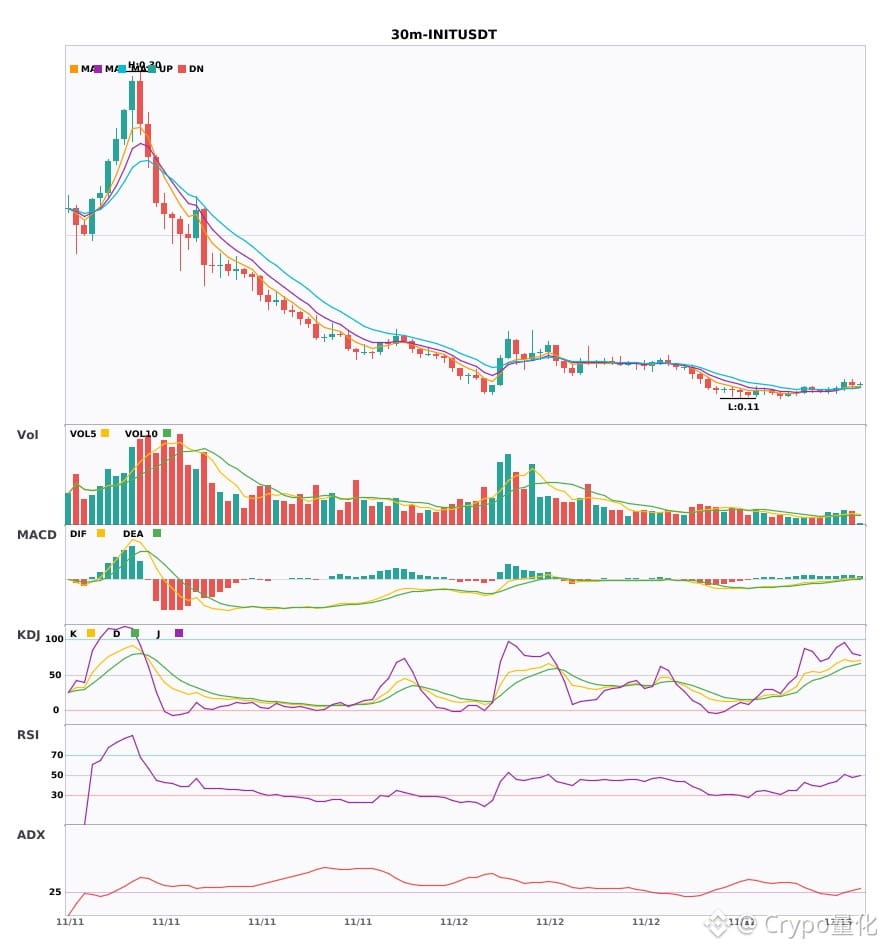
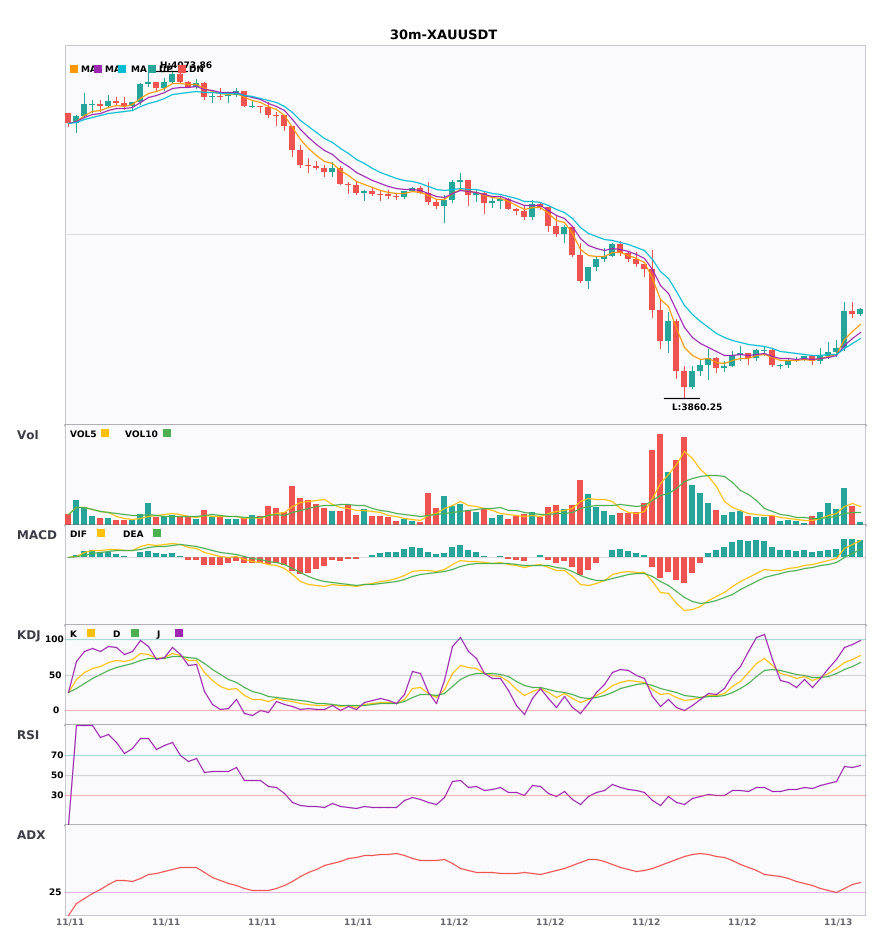
$BABA/$INIT/$XAU 30-minute bullish bias, short-term confluence 🔥
════════════════════
🔴 $BABA 30-minute bullish signal
⚠️ Technicals: ADX 37, trend strengthening; MACD bullish crossover with rising volume, moving above the zero line; moving averages aligned bullishly and diverging upward; K crosses above D without entering overbought territory; volume up 4x.
════════════════════
🔴 $INIT 30-minute bullish signal
⚠️ Technicals: ADX 31, clear trend; after the MACD bullish crossover, the red histogram bars are growing but momentum is weakening; EMAs aligned bullishly and trending upward; K in KDJ crosses above D without entering overbought territory; volume up 1.5x.
════════════════════
🔴 $XAU 30-minute bullish signal
⚠️ Technicals: ADX 29, trend just starting; MACD bullish crossover with rising volume, turning bullish; moving averages aligned bullishly and diverging; K in KDJ crosses above D without entering overbought territory; volume surges 3.1x.
════════════════════
🔔 Follow to get real-time market alerts 🔔
#技术分析 #BABA #INIT #XAU
📌 When trading, pay attention to whether the candlestick pattern confirms the setup
$BABA /$INIT /$XAU 30-minute bullish bias, short-term confluence 🔥
════════════════════
🔴 $BABA 30-minute bullish signal
⚠️ Technicals: ADX 37, trend strengthening; MACD bullish crossover with rising volume, moving above the zero line; moving averages aligned bullishly and diverging upward; K crosses above D without entering overbought territory; volume up 4x.
════════════════════
🔴 $INIT 30-minute bullish signal
⚠️ Technicals: ADX 31, clear trend; after the MACD bullish crossover, the red histogram bars are growing but momentum is weakening; EMAs aligned bullishly and trending upward; K in KDJ crosses above D without entering overbought territory; volume up 1.5x.
════════════════════
🔴 $XAU 30-minute bullish signal
⚠️ Technicals: ADX 29, trend just starting; MACD bullish crossover with rising volume, turning bullish; moving averages aligned bullishly and diverging; K in KDJ crosses above D without entering overbought territory; volume surges 3.1x.
════════════════════
🔔 Follow to get real-time market alerts 🔔
#技术分析 #BABA #INIT #XAU
📌 When trading, pay attention to whether the candlestick pattern confirms the setup
════════════════════
🔴 $BABA 30-minute bullish signal
⚠️ Technicals: ADX 37, trend strengthening; MACD bullish crossover with rising volume, moving above the zero line; moving averages aligned bullishly and diverging upward; K crosses above D without entering overbought territory; volume up 4x.
════════════════════
🔴 $INIT 30-minute bullish signal
⚠️ Technicals: ADX 31, clear trend; after the MACD bullish crossover, the red histogram bars are growing but momentum is weakening; EMAs aligned bullishly and trending upward; K in KDJ crosses above D without entering overbought territory; volume up 1.5x.
════════════════════
🔴 $XAU 30-minute bullish signal
⚠️ Technicals: ADX 29, trend just starting; MACD bullish crossover with rising volume, turning bullish; moving averages aligned bullishly and diverging; K in KDJ crosses above D without entering overbought territory; volume surges 3.1x.
════════════════════
🔔 Follow to get real-time market alerts 🔔
#技术分析 #BABA #INIT #XAU
📌 When trading, pay attention to whether the candlestick pattern confirms the setup
6
Log in to explore more content
Join global crypto users on Binance Square
⚡️ Get latest and useful information about crypto.
💬 Trusted by the world’s largest crypto exchange.
👍 Discover real insights from verified creators.
Email / Phone number
Trending Topics
1
#CanBTCReboundAfterFallingBelow60K?
388,957 views
1,683 Discussing
2
#GlobalStocksFaceLongestLosingStreakSince2023
129,378 views
1,171 Discussing
3
#BlackRockIBITPostsRecord$541MSingleDayOutflow
1,028 views
32 Discussing
4
#AnthropicPlungesTowardIPOPriceonDay2
61,498 views
650 Discussing
5
#TwentyOneCapitalAdds172.25BTC
14,326 views
197 Discussing
6
#HKBillWouldExcludeTokenizedDepositsFromVirtualAssets
1,432 views
19 Discussing
7
#BNBDropsBelow540USDTWith8.46%DailyDecline
34,954 views
304 Discussing
8
#HKBillProposesHK$100KFineForUnauthorizedCryptoTitles
1,141 views
17 Discussing
9
#BitMineFaces$10.1BUnrealizedETHLoss
2,166 views
20 Discussing
10
#StrategyReports$35BNetReserves
2,128 views
18 Discussing