
#ratehikes
ratehikes
4,324 views
45 Discussing
Hot
Latest

·
--
Bearish
🔑 week in short
$BTC 📊 $79,400 → $74,910 → $82,000 — most dramatic week since August 🎢
⚖️ CLARITY Act: 49-50 failed — shelved until 2027
🏛️ Fed: +25bps hike — rates at 3.75-4.00%, barely moved $BTC
🏦 ETF: +$6.2M net — wild ride, Friday saved the week
😀 Fear & Greed: 73 — greed, resilient despite chaos
📅 Next: December FOMC — 70%+ hike probability
$BTC closed at $82,000 — above where it started the week despite the CLARITY Act death and a rate hike. That price action tells you something important about the market's underlying strength. Two bearish catalysts landed simultaneously — and $BTC finished the week at a new recent high. $80K is now support. The next target is $85K. But December FOMC with 70%+ hike probability is the wall ahead. 🎯
#ClarityActFailed #RateHikes #dyor
🔑 week in short
$BTC 📊 $79,400 → $74,910 → $82,000 — most dramatic week since August 🎢
⚖️ CLARITY Act: 49-50 failed — shelved until 2027
🏛️ Fed: +25bps hike — rates at 3.75-4.00%, barely moved $BTC
🏦 ETF: +$6.2M net — wild ride, Friday saved the week
😀 Fear & Greed: 73 — greed, resilient despite chaos
📅 Next: December FOMC — 70%+ hike probability
$BTC closed at $82,000 — above where it started the week despite the CLARITY Act death and a rate hike. That price action tells you something important about the market's underlying strength. Two bearish catalysts landed simultaneously — and $BTC finished the week at a new recent high. $80K is now support. The next target is $85K. But December FOMC with 70%+ hike probability is the wall ahead. 🎯
#ClarityActFailed #RateHikes #dyor
$BTC 📊 $79,400 → $74,910 → $82,000 — most dramatic week since August 🎢
⚖️ CLARITY Act: 49-50 failed — shelved until 2027
🏛️ Fed: +25bps hike — rates at 3.75-4.00%, barely moved $BTC
🏦 ETF: +$6.2M net — wild ride, Friday saved the week
😀 Fear & Greed: 73 — greed, resilient despite chaos
📅 Next: December FOMC — 70%+ hike probability
$BTC closed at $82,000 — above where it started the week despite the CLARITY Act death and a rate hike. That price action tells you something important about the market's underlying strength. Two bearish catalysts landed simultaneously — and $BTC finished the week at a new recent high. $80K is now support. The next target is $85K. But December FOMC with 70%+ hike probability is the wall ahead. 🎯
#ClarityActFailed #RateHikes #dyor
145

FED'S HAWKER IS BACK WITH A RATE HIKE MANTRA — $BTC BRACES FOR THE INFLATION SHOWDOWN 🔥📉
The dollar's gatekeeper just doubled down: immediate hikes aren't optional, they're necessary. Harker's words carry weight because he's pointing at sticky inflation that refuses to fade quietly. When the Fed talks this way, liquidity gets nervous — and crypto trades on the pulse of liquidity.
Here's the real battle: the old guard still believes 2% inflation is a sacred altar worth sacrificing growth for. But dig deeper — the market's asking whether this inflation is transitory scar tissue or a structural shift. Every hawkish echo tightens the noose on risk assets, yet the bid underneath tells a different story.
Smart money watches the lag between Fed rhetoric and actual policy. The question isn't whether they hike — it's whether markets have already priced the pain. Crypto doesn't crash on news; it crashes on surprise. So the real play? Watch the reaction, not the headline.
Do you think the Fed's hawkish stance is fully priced into digital assets, or is another leg down waiting? 🎯
⚠️ Not financial advice. Always manage your risk. 🛡️
🏷️ $BTC #FederalReserve #Inflation #CryptoMarkets #RateHikes
⚡️💎
FED'S HAWKER IS BACK WITH A RATE HIKE MANTRA — $BTC BRACES FOR THE INFLATION SHOWDOWN 🔥📉
The dollar's gatekeeper just doubled down: immediate hikes aren't optional, they're necessary. Harker's words carry weight because he's pointing at sticky inflation that refuses to fade quietly. When the Fed talks this way, liquidity gets nervous — and crypto trades on the pulse of liquidity.
Here's the real battle: the old guard still believes 2% inflation is a sacred altar worth sacrificing growth for. But dig deeper — the market's asking whether this inflation is transitory scar tissue or a structural shift. Every hawkish echo tightens the noose on risk assets, yet the bid underneath tells a different story.
Smart money watches the lag between Fed rhetoric and actual policy. The question isn't whether they hike — it's whether markets have already priced the pain. Crypto doesn't crash on news; it crashes on surprise. So the real play? Watch the reaction, not the headline.
Do you think the Fed's hawkish stance is fully priced into digital assets, or is another leg down waiting? 🎯
⚠️ Not financial advice. Always manage your risk. 🛡️
🏷️ $BTC #FederalReserve #Inflation #CryptoMarkets #RateHikes
⚡️💎
The dollar's gatekeeper just doubled down: immediate hikes aren't optional, they're necessary. Harker's words carry weight because he's pointing at sticky inflation that refuses to fade quietly. When the Fed talks this way, liquidity gets nervous — and crypto trades on the pulse of liquidity.
Here's the real battle: the old guard still believes 2% inflation is a sacred altar worth sacrificing growth for. But dig deeper — the market's asking whether this inflation is transitory scar tissue or a structural shift. Every hawkish echo tightens the noose on risk assets, yet the bid underneath tells a different story.
Smart money watches the lag between Fed rhetoric and actual policy. The question isn't whether they hike — it's whether markets have already priced the pain. Crypto doesn't crash on news; it crashes on surprise. So the real play? Watch the reaction, not the headline.
Do you think the Fed's hawkish stance is fully priced into digital assets, or is another leg down waiting? 🎯
⚠️ Not financial advice. Always manage your risk. 🛡️
🏷️ $BTC #FederalReserve #Inflation #CryptoMarkets #RateHikes
⚡️💎
34

·
--
FED'S HARKER REAFFIRMS RATE HIKE URGENCY — WHAT IT MEANS FOR $BTC 🔥📉
The hawkish tone is getting louder. Philadelphia Fed's Harker is reinforcing the case for immediate rate hikes, arguing that recent supply shocks could keep inflation pressure elevated. That's a direct signal that the path back to 2% won't be a straight line — and markets should price more tightening, not less. 📊
For digital assets, this is the macro backdrop that matters most. Higher rates compress liquidity, and liquidity is the oxygen of risk assets. The transitory inflation camp is losing ground, and that shifts the structural bias for $BTC toward caution until the data pivots. 🏦
The real question is whether this is the final leg of the tightening cycle or the beginning of a longer squeeze. Institutional positioning will tell the story — watch the next CPI print like your portfolio depends on it. Because it might. 🤔
What's your read — hawkish hold or terminal rate approaching? 👇
⚠️ Not financial advice. Always manage your risk. 🛡️
🏷️ $BTC #FedPolicy #RateHikes #CryptoMarket #MacroOutlook
📉🧠
FED'S HARKER REAFFIRMS RATE HIKE URGENCY — WHAT IT MEANS FOR $BTC 🔥📉
The hawkish tone is getting louder. Philadelphia Fed's Harker is reinforcing the case for immediate rate hikes, arguing that recent supply shocks could keep inflation pressure elevated. That's a direct signal that the path back to 2% won't be a straight line — and markets should price more tightening, not less. 📊
For digital assets, this is the macro backdrop that matters most. Higher rates compress liquidity, and liquidity is the oxygen of risk assets. The transitory inflation camp is losing ground, and that shifts the structural bias for $BTC toward caution until the data pivots. 🏦
The real question is whether this is the final leg of the tightening cycle or the beginning of a longer squeeze. Institutional positioning will tell the story — watch the next CPI print like your portfolio depends on it. Because it might. 🤔
What's your read — hawkish hold or terminal rate approaching? 👇
⚠️ Not financial advice. Always manage your risk. 🛡️
🏷️ $BTC #FedPolicy #RateHikes #CryptoMarket #MacroOutlook
📉🧠
The hawkish tone is getting louder. Philadelphia Fed's Harker is reinforcing the case for immediate rate hikes, arguing that recent supply shocks could keep inflation pressure elevated. That's a direct signal that the path back to 2% won't be a straight line — and markets should price more tightening, not less. 📊
For digital assets, this is the macro backdrop that matters most. Higher rates compress liquidity, and liquidity is the oxygen of risk assets. The transitory inflation camp is losing ground, and that shifts the structural bias for $BTC toward caution until the data pivots. 🏦
The real question is whether this is the final leg of the tightening cycle or the beginning of a longer squeeze. Institutional positioning will tell the story — watch the next CPI print like your portfolio depends on it. Because it might. 🤔
What's your read — hawkish hold or terminal rate approaching? 👇
⚠️ Not financial advice. Always manage your risk. 🛡️
🏷️ $BTC #FedPolicy #RateHikes #CryptoMarket #MacroOutlook
📉🧠
28

·
--
Bearish
Verified
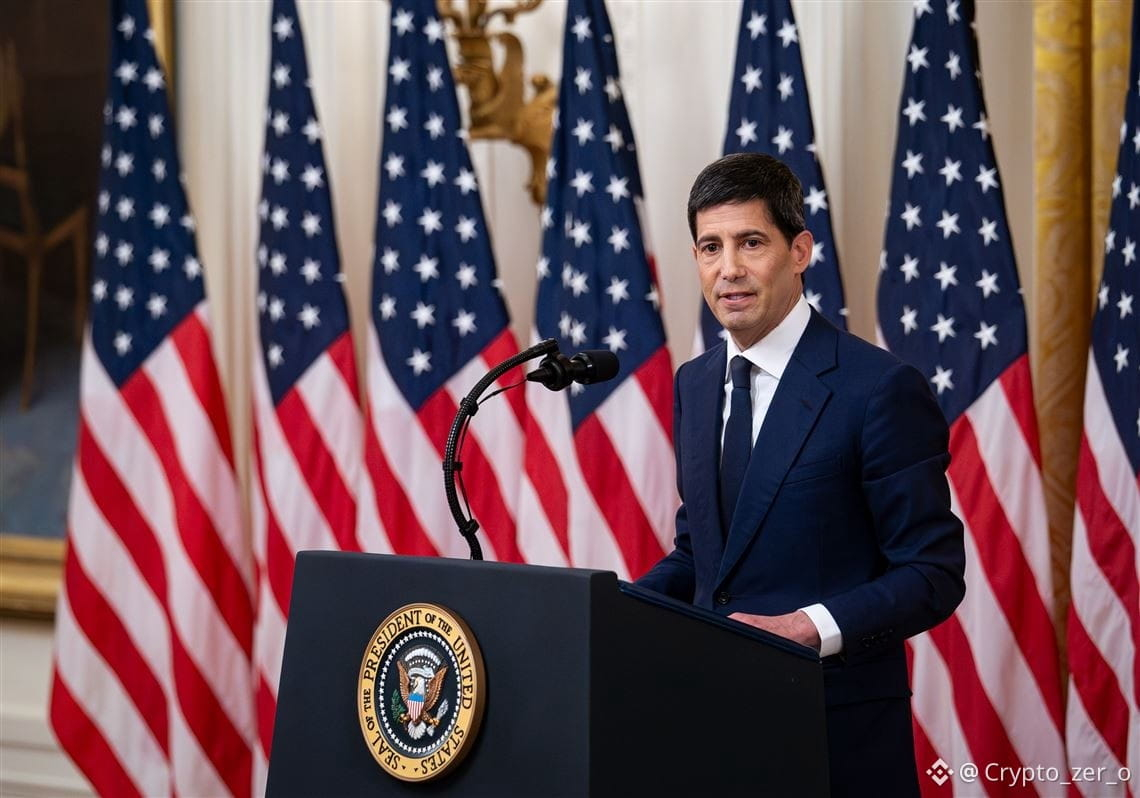
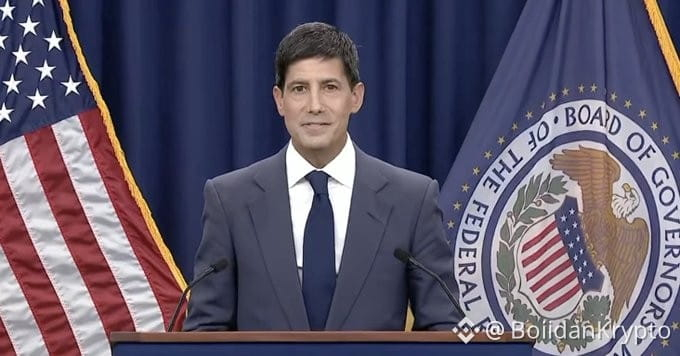
I was worried about Kevin Warsh’s tone before the speech, and honestly, the speech confirmed that for me 🦅
Warsh was very clear on the topic of inflation, and he pointed out that PCE at 3.7% is still far from the Federal target of 2%.
He said the Fed has work to do if it isn’t confident that inflation will return to the desired level, and he also noted that financial conditions are not restrictive enough.
For me, this is clearly a hawkish tone.
I told you before the speech that I was leaning toward this scenario, and now the message has arrived.
So I’m still very cautious about crypto in the short term, especially after the strong rally we saw.
$BTC
{spot}(BTCUSDT)
#RateHikes
#Fed
I was worried about Kevin Warsh’s tone before the speech, and honestly, the speech confirmed that for me 🦅
Warsh was very clear on the topic of inflation, and he pointed out that PCE at 3.7% is still far from the Federal target of 2%.
He said the Fed has work to do if it isn’t confident that inflation will return to the desired level, and he also noted that financial conditions are not restrictive enough.
For me, this is clearly a hawkish tone.
I told you before the speech that I was leaning toward this scenario, and now the message has arrived.
So I’m still very cautious about crypto in the short term, especially after the strong rally we saw.
$BTC
#RateHikes
#Fed
Warsh was very clear on the topic of inflation, and he pointed out that PCE at 3.7% is still far from the Federal target of 2%.
He said the Fed has work to do if it isn’t confident that inflation will return to the desired level, and he also noted that financial conditions are not restrictive enough.
For me, this is clearly a hawkish tone.
I told you before the speech that I was leaning toward this scenario, and now the message has arrived.
So I’m still very cautious about crypto in the short term, especially after the strong rally we saw.
$BTC
#RateHikes
#Fed
5
3.4k
·
--
Bearish
🚨 BOFA DROPS A NUKE ON RATE CUT HOPES! 🚨
The biggest bank on Wall Street just flipped the script—and it’s TERRIFYING for risk assets.
Bank of America is now officially calling for the 🇺🇸 Fed to RAISE rates THREE TIMES in 2026 (Sept, Oct, Dec). We're talking 25bps hikes that take the terminal rate to a stifling 4.25%-4.5% by year-end.
Oh, and if you thought relief was coming? Forget it. BofA says the first rate CUT won’t happen until 2028. That’s basically a lifetime in crypto and market years.
Here’s my hot take: This isn't a "soft landing" prediction—this is the Fed deliberately keeping the economy on life support with a chokehold. If inflation is still this sticky heading into 2026, it means the "transitory" narrative is officially dead and buried. They are choosing to starve liquidity to kill inflation, and they don't care if equities bleed.
But let’s be real—does anyone actually trust Bank of America’s forecasting track record? They were calling for a recession in 2023 that never happened. Now they’re going full hawkish while the US debt clock is ticking past $34 trillion? Raising rates into that fiscal disaster is like throwing gasoline on a fire to put it out.
I think they’re bluffing. Powell pivots way sooner when the labor market cracks. What do you think? 👇
Are you scaling back into cash/bonds, or are you doubling down on hard assets before this "2028 cut" fantasy becomes reality?
Drop a 🔥 if you think BofA is dead wrong, or drop a 💀 if you’re actually preparing for 4.5% rates to wreck the economy!
#HawkishFed #RateHikes #BearMarketAlert
$NVDA
{future}(NVDAUSDT)
$SPCX
{future}(SPCXUSDT)
$BTC
{future}(BTCUSDT)
🚨 BOFA DROPS A NUKE ON RATE CUT HOPES! 🚨
The biggest bank on Wall Street just flipped the script—and it’s TERRIFYING for risk assets.
Bank of America is now officially calling for the 🇺🇸 Fed to RAISE rates THREE TIMES in 2026 (Sept, Oct, Dec). We're talking 25bps hikes that take the terminal rate to a stifling 4.25%-4.5% by year-end.
Oh, and if you thought relief was coming? Forget it. BofA says the first rate CUT won’t happen until 2028. That’s basically a lifetime in crypto and market years.
Here’s my hot take: This isn't a "soft landing" prediction—this is the Fed deliberately keeping the economy on life support with a chokehold. If inflation is still this sticky heading into 2026, it means the "transitory" narrative is officially dead and buried. They are choosing to starve liquidity to kill inflation, and they don't care if equities bleed.
But let’s be real—does anyone actually trust Bank of America’s forecasting track record? They were calling for a recession in 2023 that never happened. Now they’re going full hawkish while the US debt clock is ticking past $34 trillion? Raising rates into that fiscal disaster is like throwing gasoline on a fire to put it out.
I think they’re bluffing. Powell pivots way sooner when the labor market cracks. What do you think? 👇
Are you scaling back into cash/bonds, or are you doubling down on hard assets before this "2028 cut" fantasy becomes reality?
Drop a 🔥 if you think BofA is dead wrong, or drop a 💀 if you’re actually preparing for 4.5% rates to wreck the economy!
#HawkishFed #RateHikes #BearMarketAlert
$NVDA
$SPCX
$BTC
The biggest bank on Wall Street just flipped the script—and it’s TERRIFYING for risk assets.
Bank of America is now officially calling for the 🇺🇸 Fed to RAISE rates THREE TIMES in 2026 (Sept, Oct, Dec). We're talking 25bps hikes that take the terminal rate to a stifling 4.25%-4.5% by year-end.
Oh, and if you thought relief was coming? Forget it. BofA says the first rate CUT won’t happen until 2028. That’s basically a lifetime in crypto and market years.
Here’s my hot take: This isn't a "soft landing" prediction—this is the Fed deliberately keeping the economy on life support with a chokehold. If inflation is still this sticky heading into 2026, it means the "transitory" narrative is officially dead and buried. They are choosing to starve liquidity to kill inflation, and they don't care if equities bleed.
But let’s be real—does anyone actually trust Bank of America’s forecasting track record? They were calling for a recession in 2023 that never happened. Now they’re going full hawkish while the US debt clock is ticking past $34 trillion? Raising rates into that fiscal disaster is like throwing gasoline on a fire to put it out.
I think they’re bluffing. Powell pivots way sooner when the labor market cracks. What do you think? 👇
Are you scaling back into cash/bonds, or are you doubling down on hard assets before this "2028 cut" fantasy becomes reality?
Drop a 🔥 if you think BofA is dead wrong, or drop a 💀 if you’re actually preparing for 4.5% rates to wreck the economy!
#HawkishFed #RateHikes #BearMarketAlert
$NVDA
$SPCX
$BTC
169

·
--
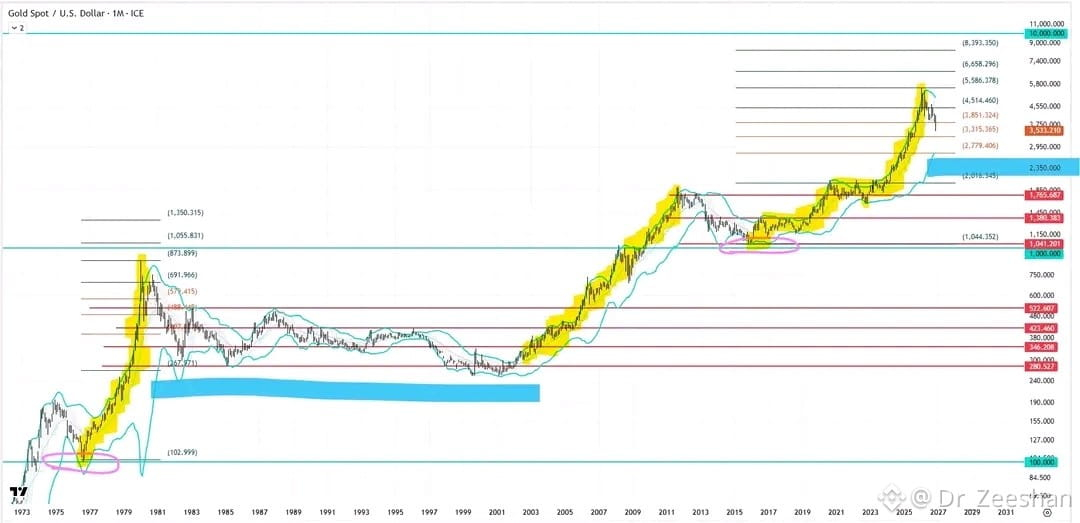
XAU/USD Analysis: Gold Under Heavy Pressure Near the $3,500–$3,540 Zone
Gold has been going through a brutal stretch in November 2026. After hitting record highs near $5,595–$5,608/oz back in January and failing to hold a bounce near $4,148 earlier this month, XAU/USD has slid down into the $3,500–$3,540/oz area—down roughly 30%+ from its peak and posting one of its steepest weekly drops in months.
1. Chart Structure & Trend
Broken Multi-Year Structure: The chart has shifted into a clear sequence of lower highs and lower lows after breaking multi-year uptrend support.
Moving Averages Overhead: Price is trading below major daily and weekly moving averages, leaving plenty of dynamic overhead supply on any bounce.
Oversold Momentum, No Confirmed Bottom Yet: Short-term and weekly momentum indicators (like RSI) have dropped into deeply oversold territory, which raises the odds of sharp dead-cat bounces or relief rallies. Still, oversold isn’t a reversal until price actually holds support and puts in a higher low.
2. Key Levels to Watch
Immediate Support: $3,500–$3,540 is the line in the sand right now. If that breaks decisively, traders are looking at lower demand zones around $3,390–$3,432, followed by deeper levels near $3,136 and $2,956.
Overhead Resistance: First hurdle on a bounce sits around $3,625–$3,650, then $3,700–$3,765, with bigger structural resistance higher up near $3,873–$3,883 and $4,147.
3. What’s Driving the Tape
Rate Repricing & Sticky Inflation: After the Fed’s September hike and hotter-than-expected CPI prints keeping rate pressure alive, non-yielding assets like gold have faced stiff headwinds.
Cross-Asset Liquidity & Deleveraging: Weakness across equities and the AI trade has forced some market participants to raise cash where they have liquidity, adding extra weight to precious metals.
Upcoming Macro Catalysts: With U.S. GDP and Core PCE inflation data coming up, volatility could stay elevated—especially around thinner holiday liquidity.
$XAU $XAUT $PAXG
#BinanceSquareTalks #RateHikes
XAU/USD Analysis: Gold Under Heavy Pressure Near the $3,500–$3,540 Zone
Gold has been going through a brutal stretch in November 2026. After hitting record highs near $5,595–$5,608/oz back in January and failing to hold a bounce near $4,148 earlier this month, XAU/USD has slid down into the $3,500–$3,540/oz area—down roughly 30%+ from its peak and posting one of its steepest weekly drops in months.
1. Chart Structure & Trend
Broken Multi-Year Structure: The chart has shifted into a clear sequence of lower highs and lower lows after breaking multi-year uptrend support.
Moving Averages Overhead: Price is trading below major daily and weekly moving averages, leaving plenty of dynamic overhead supply on any bounce.
Oversold Momentum, No Confirmed Bottom Yet: Short-term and weekly momentum indicators (like RSI) have dropped into deeply oversold territory, which raises the odds of sharp dead-cat bounces or relief rallies. Still, oversold isn’t a reversal until price actually holds support and puts in a higher low.
2. Key Levels to Watch
Immediate Support: $3,500–$3,540 is the line in the sand right now. If that breaks decisively, traders are looking at lower demand zones around $3,390–$3,432, followed by deeper levels near $3,136 and $2,956.
Overhead Resistance: First hurdle on a bounce sits around $3,625–$3,650, then $3,700–$3,765, with bigger structural resistance higher up near $3,873–$3,883 and $4,147.
3. What’s Driving the Tape
Rate Repricing & Sticky Inflation: After the Fed’s September hike and hotter-than-expected CPI prints keeping rate pressure alive, non-yielding assets like gold have faced stiff headwinds.
Cross-Asset Liquidity & Deleveraging: Weakness across equities and the AI trade has forced some market participants to raise cash where they have liquidity, adding extra weight to precious metals.
Upcoming Macro Catalysts: With U.S. GDP and Core PCE inflation data coming up, volatility could stay elevated—especially around thinner holiday liquidity.
$XAU $XAUT $PAXG
#BinanceSquareTalks #RateHikes
Gold has been going through a brutal stretch in November 2026. After hitting record highs near $5,595–$5,608/oz back in January and failing to hold a bounce near $4,148 earlier this month, XAU/USD has slid down into the $3,500–$3,540/oz area—down roughly 30%+ from its peak and posting one of its steepest weekly drops in months.
1. Chart Structure & Trend
Broken Multi-Year Structure: The chart has shifted into a clear sequence of lower highs and lower lows after breaking multi-year uptrend support.
Moving Averages Overhead: Price is trading below major daily and weekly moving averages, leaving plenty of dynamic overhead supply on any bounce.
Oversold Momentum, No Confirmed Bottom Yet: Short-term and weekly momentum indicators (like RSI) have dropped into deeply oversold territory, which raises the odds of sharp dead-cat bounces or relief rallies. Still, oversold isn’t a reversal until price actually holds support and puts in a higher low.
2. Key Levels to Watch
Immediate Support: $3,500–$3,540 is the line in the sand right now. If that breaks decisively, traders are looking at lower demand zones around $3,390–$3,432, followed by deeper levels near $3,136 and $2,956.
Overhead Resistance: First hurdle on a bounce sits around $3,625–$3,650, then $3,700–$3,765, with bigger structural resistance higher up near $3,873–$3,883 and $4,147.
3. What’s Driving the Tape
Rate Repricing & Sticky Inflation: After the Fed’s September hike and hotter-than-expected CPI prints keeping rate pressure alive, non-yielding assets like gold have faced stiff headwinds.
Cross-Asset Liquidity & Deleveraging: Weakness across equities and the AI trade has forced some market participants to raise cash where they have liquidity, adding extra weight to precious metals.
Upcoming Macro Catalysts: With U.S. GDP and Core PCE inflation data coming up, volatility could stay elevated—especially around thinner holiday liquidity.
$XAU $XAUT $PAXG
#BinanceSquareTalks #RateHikes
551

The #CLARITYAct stalled at the senate and the US #Fed imposed a rate hike, with a great possibility for more #RateHikes in 2026, but still $BTC and the broad market keeps climbing.
I did not expect this... and you?
The #CLARITYAct stalled at the senate and the US #Fed imposed a rate hike, with a great possibility for more #RateHikes in 2026, but still $BTC and the broad market keeps climbing.
I did not expect this... and you?
I did not expect this... and you?
108

Article
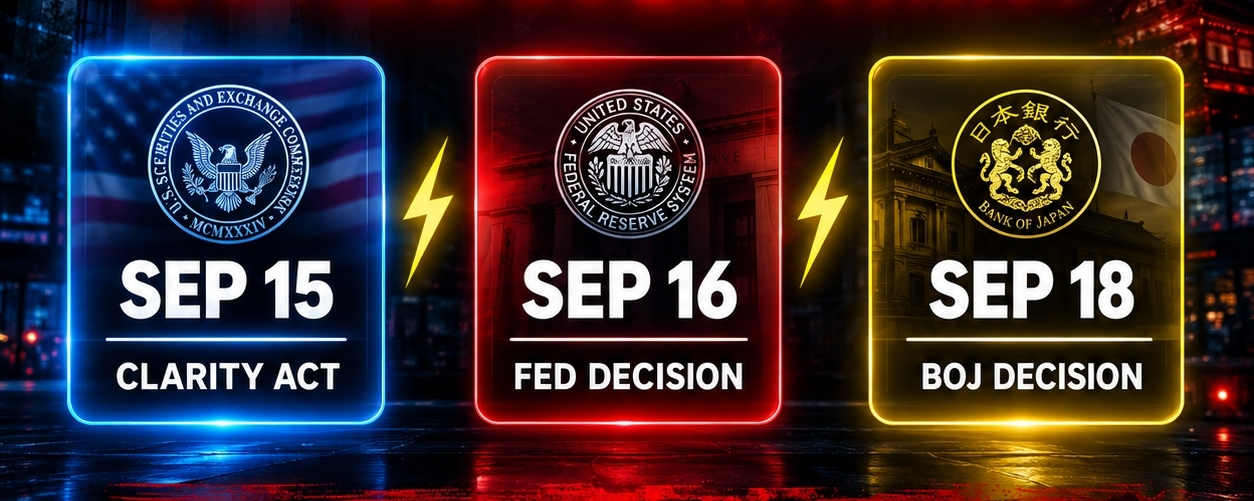
Next Week — 3 Events That Will Shake Markets:🚨 Biggest week of the year for crypto
and global markets. Buckle up.
━━━━━━━━━━━━━━━
📅 Sep 15 — CLARITY Act Vote
Likely to fail — already priced in.
BUT if it passes?
Crypto pumps hard on the surprise. 🚀
━━━━━━━━━━━━━━━
📅 Sep 16 — Fed Decision
87% chance of rate hike = bad for crypto.
If they pause instead?
Massive relief rally across all markets. 📈
━━━━━━━━━━━━━━━
📅 Sep 18 — BOJ Decision
25bps hike expected.
More hikes ahead = yen carry trade unwinds
= global market pain. 🔴
Done hiking = markets push higher. 🟢
━━━━━━━━━━━━━━━
⚠️ Bottom Line:
3 events. 3 outcomes.
Volatility guaranteed either way.
Manage your risk. Tighten your SL.
This is not the week to gamble. ⚙️
#ClarityActFacesProceduralVoteSept15 #BankOfJapan #RateHikes #FOMC
{spot}(BTCUSDT)
{future}(XAUUSDT)
{future}(NVDAUSDT)
Next Week — 3 Events That Will Shake Markets:
🚨 Biggest week of the year for crypto
and global markets. Buckle up.
━━━━━━━━━━━━━━━
📅 Sep 15 — CLARITY Act Vote
Likely to fail — already priced in.
BUT if it passes?
Crypto pumps hard on the surprise. 🚀
━━━━━━━━━━━━━━━
📅 Sep 16 — Fed Decision
87% chance of rate hike = bad for crypto.
If they pause instead?
Massive relief rally across all markets. 📈
━━━━━━━━━━━━━━━
📅 Sep 18 — BOJ Decision
25bps hike expected.
More hikes ahead = yen carry trade unwinds
= global market pain. 🔴
Done hiking = markets push higher. 🟢
━━━━━━━━━━━━━━━
⚠️ Bottom Line:
3 events. 3 outcomes.
Volatility guaranteed either way.
Manage your risk. Tighten your SL.
This is not the week to gamble. ⚙️
#ClarityActFacesProceduralVoteSept15 #BankOfJapan #RateHikes #FOMC
and global markets. Buckle up.
━━━━━━━━━━━━━━━
📅 Sep 15 — CLARITY Act Vote
Likely to fail — already priced in.
BUT if it passes?
Crypto pumps hard on the surprise. 🚀
━━━━━━━━━━━━━━━
📅 Sep 16 — Fed Decision
87% chance of rate hike = bad for crypto.
If they pause instead?
Massive relief rally across all markets. 📈
━━━━━━━━━━━━━━━
📅 Sep 18 — BOJ Decision
25bps hike expected.
More hikes ahead = yen carry trade unwinds
= global market pain. 🔴
Done hiking = markets push higher. 🟢
━━━━━━━━━━━━━━━
⚠️ Bottom Line:
3 events. 3 outcomes.
Volatility guaranteed either way.
Manage your risk. Tighten your SL.
This is not the week to gamble. ⚙️
#ClarityActFacesProceduralVoteSept15 #BankOfJapan #RateHikes #FOMC
89

ECB HAWKISH TALK IS THE REAL HEADWIND FOR $BTC RIGHT NOW 🚨
Even with the US-Iran peace deal, the ECB's most hawkish member just doubled down on rate hikes. Inflation risks remain elevated and energy price shocks could spill over. That means tighter liquidity for risk assets like crypto.
The market is pricing in optimism from the ceasefire, but the central bank isn't backing off. Schnabel made it clear: further rate hikes expected to bring inflation back to 2%. That's a direct headwind for any risk-on rally.
Are you trimming your longs or holding through this macro noise?
Not financial advice. Always manage your risk.
#BTC #Macro #Inflation #RateHikes
🚨
ECB HAWKISH TALK IS THE REAL HEADWIND FOR $BTC RIGHT NOW 🚨
Even with the US-Iran peace deal, the ECB's most hawkish member just doubled down on rate hikes. Inflation risks remain elevated and energy price shocks could spill over. That means tighter liquidity for risk assets like crypto.
The market is pricing in optimism from the ceasefire, but the central bank isn't backing off. Schnabel made it clear: further rate hikes expected to bring inflation back to 2%. That's a direct headwind for any risk-on rally.
Are you trimming your longs or holding through this macro noise?
Not financial advice. Always manage your risk.
#BTC #Macro #Inflation #RateHikes
🚨
Even with the US-Iran peace deal, the ECB's most hawkish member just doubled down on rate hikes. Inflation risks remain elevated and energy price shocks could spill over. That means tighter liquidity for risk assets like crypto.
The market is pricing in optimism from the ceasefire, but the central bank isn't backing off. Schnabel made it clear: further rate hikes expected to bring inflation back to 2%. That's a direct headwind for any risk-on rally.
Are you trimming your longs or holding through this macro noise?
Not financial advice. Always manage your risk.
#BTC #Macro #Inflation #RateHikes
🚨
45

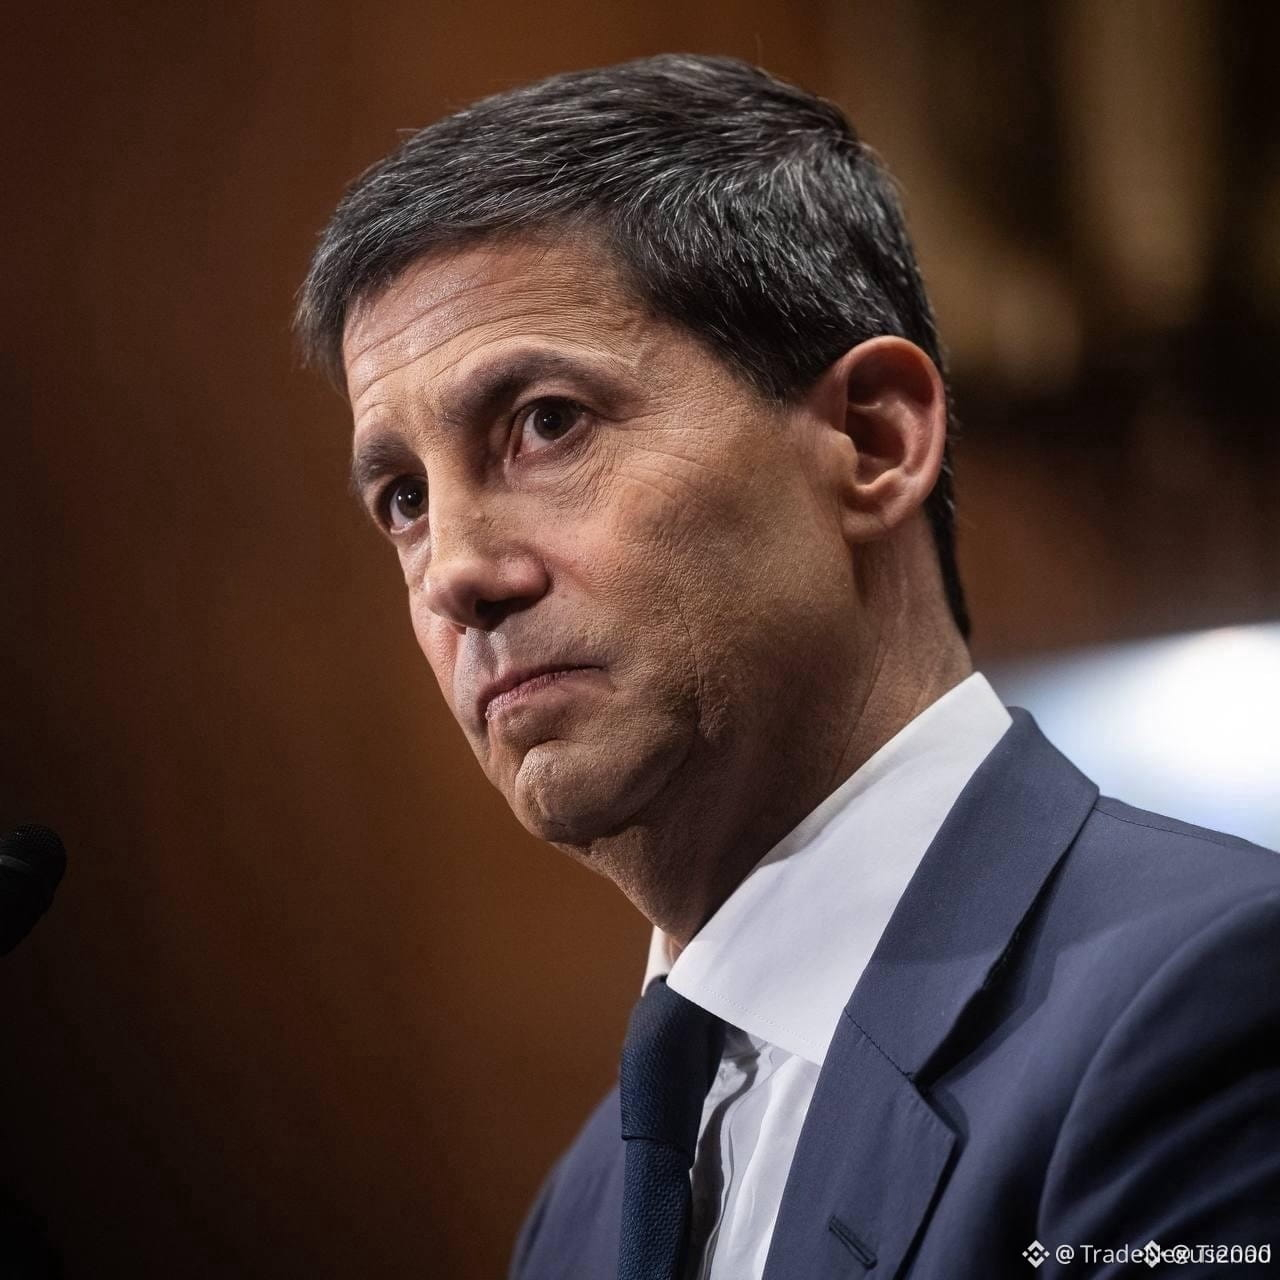
FED MINUTES SPARK VOLATILITY – $OGN NEXT MOVE? ⚡
The Fed’s June minutes confirm a hawkish lean: rate hikes remain on the table if inflation stays stubborn. This macro headwind often pressures risk assets, but recent sessions show crypto decoupling — $OGN and $UTK volume is climbing as traders anticipate a flight to alternative stores of value.
The real test will be how order book depth holds on top-tier exchanges when the next CPI print drops. Are you expecting a risk-off rout or a crypto bid this time?
Not financial advice. Always manage your risk.
#OGN #FedMinutes #RateHikes #Altcoins
🔥
FED MINUTES SPARK VOLATILITY – $OGN NEXT MOVE? ⚡
The Fed’s June minutes confirm a hawkish lean: rate hikes remain on the table if inflation stays stubborn. This macro headwind often pressures risk assets, but recent sessions show crypto decoupling — $OGN and $UTK volume is climbing as traders anticipate a flight to alternative stores of value.
The real test will be how order book depth holds on top-tier exchanges when the next CPI print drops. Are you expecting a risk-off rout or a crypto bid this time?
Not financial advice. Always manage your risk.
#OGN #FedMinutes #RateHikes #Altcoins
🔥
The Fed’s June minutes confirm a hawkish lean: rate hikes remain on the table if inflation stays stubborn. This macro headwind often pressures risk assets, but recent sessions show crypto decoupling — $OGN and $UTK volume is climbing as traders anticipate a flight to alternative stores of value.
The real test will be how order book depth holds on top-tier exchanges when the next CPI print drops. Are you expecting a risk-off rout or a crypto bid this time?
Not financial advice. Always manage your risk.
#OGN #FedMinutes #RateHikes #Altcoins
🔥
68

·
--
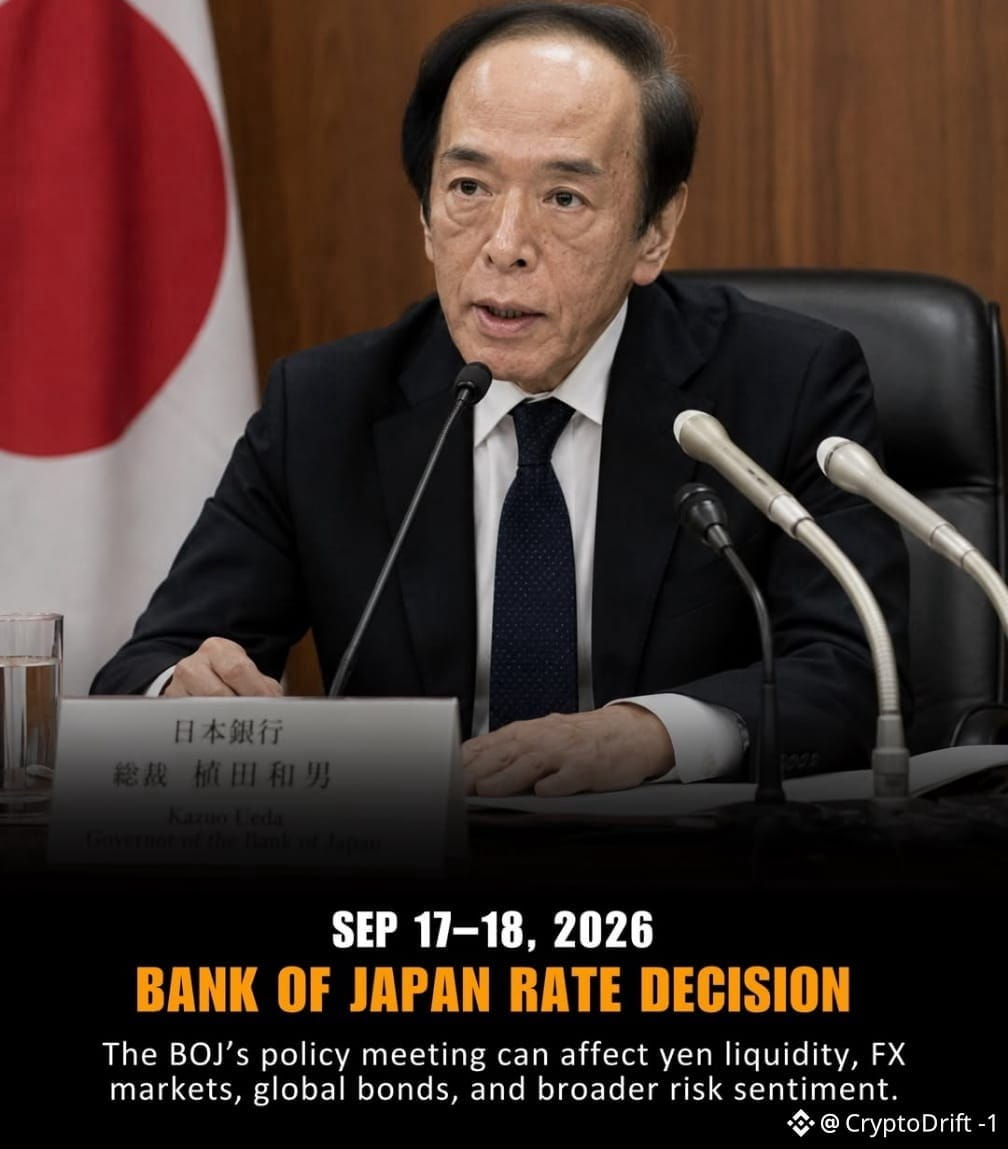
🚨🚨🚨...🇯🇵 BREAKING
. Bank of Japan raises rates by 25 BPS to 1.25%, the HIGHEST level in 31 years.#RateHikes #cryptouniverseofficial
🚨🚨🚨...🇯🇵 BREAKING
. Bank of Japan raises rates by 25 BPS to 1.25%, the HIGHEST level in 31 years.#RateHikes #cryptouniverseofficial
. Bank of Japan raises rates by 25 BPS to 1.25%, the HIGHEST level in 31 years.#RateHikes #cryptouniverseofficial
91

·
--
Verified
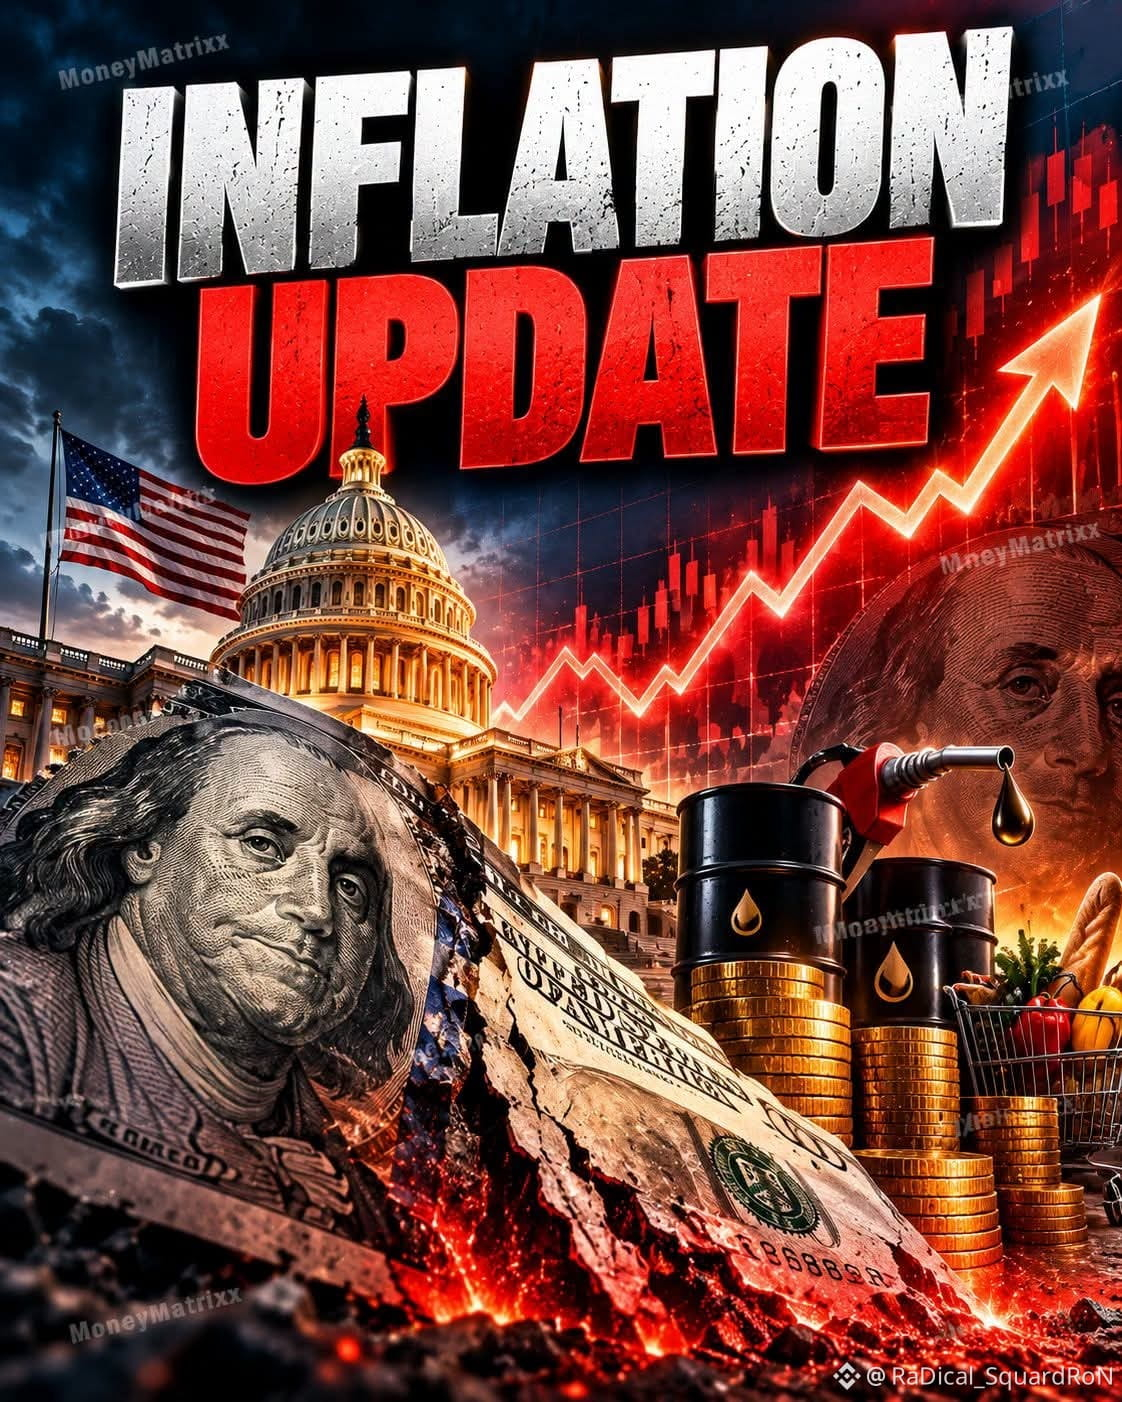
US CPI inflation hit 3.7 percent which is nearly double the Fed's 2 percent target
US PPI inflation climbed to 6.3 percent that's over three times the target
Core PPI landed at 5.0 percent
PCE inflation last read 3.4 percent
Brent crude oil jumped to 106 dollars a barrel up 73 percent year to date
Fuel oil inflation is up 74 percent year over year
September marked the 67th straight month with CPI above the Fed's 2 percent goal
The US Dollar has lost nearly one fourth of its value in five years
The time to take action is now
$ZEC $AGT $PUFFER #inflation #ratehikes #usa #CPIWatch
{alpha}(560x87d00066cf131ff54b72b134a217d5401e5392b6)
{future}(AGTUSDT)
{future}(ZECUSDT)
US CPI inflation hit 3.7 percent which is nearly double the Fed's 2 percent target
US PPI inflation climbed to 6.3 percent that's over three times the target
Core PPI landed at 5.0 percent
PCE inflation last read 3.4 percent
Brent crude oil jumped to 106 dollars a barrel up 73 percent year to date
Fuel oil inflation is up 74 percent year over year
September marked the 67th straight month with CPI above the Fed's 2 percent goal
The US Dollar has lost nearly one fourth of its value in five years
The time to take action is now
$ZEC $AGT $PUFFER #inflation #ratehikes #usa #CPIWatch
US PPI inflation climbed to 6.3 percent that's over three times the target
Core PPI landed at 5.0 percent
PCE inflation last read 3.4 percent
Brent crude oil jumped to 106 dollars a barrel up 73 percent year to date
Fuel oil inflation is up 74 percent year over year
September marked the 67th straight month with CPI above the Fed's 2 percent goal
The US Dollar has lost nearly one fourth of its value in five years
The time to take action is now
$ZEC $AGT $PUFFER #inflation #ratehikes #usa #CPIWatch
841

·
--
#JobsReportRaisesHikeOdds
Market Flips Hawkish as US Jobs Data Blows Past Expectations – Hike Odds Surge
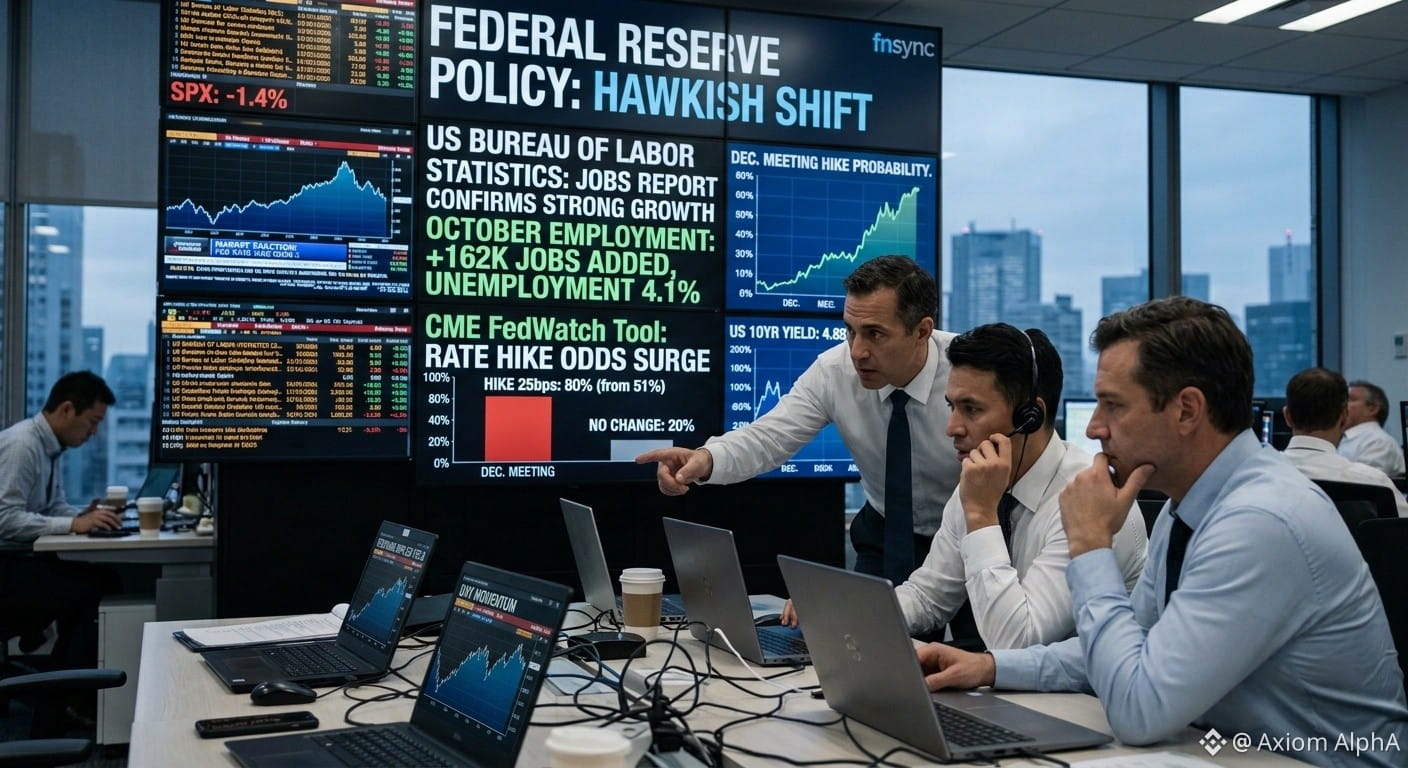
The macro landscape has just taken a decisive turn. Forget the "soft landing" or "pause" narratives for a moment; the latest US Nonfarm Payrolls and unemployment data just dropped, and it is overwhelmingly hot.
The BLS report shows a massive beat with +162K jobs added and unemployment holding steady at 4.1%.
The market reaction was instant and violent. Look at the data shifts from the command center:
📊 CME FedWatch Tool: Rate Hike Odds for the upcoming meeting have surged to 80%, a massive jump from just 51% yesterday.
📉 SPX Futures: Down -1.4%.
💵 USD/JPY: Spiked to 153.20 (+0.8%) as cash flies to the safety and yield of the dollar.
📈 US 10YR Yield: Rocketed +12 bps to 4.88%.
This is pure pressure on risk assets, including crypto. High yields and a strong dollar are a painful combination for BTC and ALTS in the short term. As the market prices in "Higher for Longer," expect volatility.
Here is how I am playing the tradeable coins on this macro shift.
📉 The Trade Plan: Tradeable Coins
Bitcoin $BTC
Target 1 (T1): $76,500 (Primary Support).
Target 2 (T2): $78,000 (Macro range low).
Stop Loss (SL): $72,500 (Invalidation of the short thesis if BTC pushes above recent highs despite the yields).
Ethereum $ETH
Trade Setup (Short):
Entry Zone: $2,550 – $2,620.
Target 1 (T1): $2,380.
Target 2 (T2): $2,210.
Stop Loss (SL): $2,700.
Binance Coin $BNB
Trade Setup (Neutral / Long Hedges): I am avoiding a directional position on BNB for now, but I will monitor it to potentially flip long if the sell-off in BTC and ETH hits an exhaustion point at T2 levels.
Risk Management Framework:
The market is reacting emotionally to the 80% hike odds. The primary risk is a "sell the news, buy the fact" event before the next Fed meeting, or a sudden reversal in bond yields. Maintain strictly < 2% total portfolio risk per trade and respect all Stop Loss boundaries.
{spot}(BTCUSDT)
{spot}(ETHUSDT)
{spot}(BNBUSDT)
#JobsReport #RateHikes #marketcrash #FedWatch
#JobsReportRaisesHikeOdds
Market Flips Hawkish as US Jobs Data Blows Past Expectations – Hike Odds Surge
The macro landscape has just taken a decisive turn. Forget the "soft landing" or "pause" narratives for a moment; the latest US Nonfarm Payrolls and unemployment data just dropped, and it is overwhelmingly hot.
The BLS report shows a massive beat with +162K jobs added and unemployment holding steady at 4.1%.
The market reaction was instant and violent. Look at the data shifts from the command center:
📊 CME FedWatch Tool: Rate Hike Odds for the upcoming meeting have surged to 80%, a massive jump from just 51% yesterday.
📉 SPX Futures: Down -1.4%.
💵 USD/JPY: Spiked to 153.20 (+0.8%) as cash flies to the safety and yield of the dollar.
📈 US 10YR Yield: Rocketed +12 bps to 4.88%.
This is pure pressure on risk assets, including crypto. High yields and a strong dollar are a painful combination for BTC and ALTS in the short term. As the market prices in "Higher for Longer," expect volatility.
Here is how I am playing the tradeable coins on this macro shift.
📉 The Trade Plan: Tradeable Coins
Bitcoin $BTC
Target 1 (T1): $76,500 (Primary Support).
Target 2 (T2): $78,000 (Macro range low).
Stop Loss (SL): $72,500 (Invalidation of the short thesis if BTC pushes above recent highs despite the yields).
Ethereum $ETH
Trade Setup (Short):
Entry Zone: $2,550 – $2,620.
Target 1 (T1): $2,380.
Target 2 (T2): $2,210.
Stop Loss (SL): $2,700.
Binance Coin $BNB
Trade Setup (Neutral / Long Hedges): I am avoiding a directional position on BNB for now, but I will monitor it to potentially flip long if the sell-off in BTC and ETH hits an exhaustion point at T2 levels.
Risk Management Framework:
The market is reacting emotionally to the 80% hike odds. The primary risk is a "sell the news, buy the fact" event before the next Fed meeting, or a sudden reversal in bond yields. Maintain strictly < 2% total portfolio risk per trade and respect all Stop Loss boundaries.
#JobsReport #RateHikes #marketcrash #FedWatch
Market Flips Hawkish as US Jobs Data Blows Past Expectations – Hike Odds Surge
The macro landscape has just taken a decisive turn. Forget the "soft landing" or "pause" narratives for a moment; the latest US Nonfarm Payrolls and unemployment data just dropped, and it is overwhelmingly hot.
The BLS report shows a massive beat with +162K jobs added and unemployment holding steady at 4.1%.
The market reaction was instant and violent. Look at the data shifts from the command center:
📊 CME FedWatch Tool: Rate Hike Odds for the upcoming meeting have surged to 80%, a massive jump from just 51% yesterday.
📉 SPX Futures: Down -1.4%.
💵 USD/JPY: Spiked to 153.20 (+0.8%) as cash flies to the safety and yield of the dollar.
📈 US 10YR Yield: Rocketed +12 bps to 4.88%.
This is pure pressure on risk assets, including crypto. High yields and a strong dollar are a painful combination for BTC and ALTS in the short term. As the market prices in "Higher for Longer," expect volatility.
Here is how I am playing the tradeable coins on this macro shift.
📉 The Trade Plan: Tradeable Coins
Bitcoin $BTC
Target 1 (T1): $76,500 (Primary Support).
Target 2 (T2): $78,000 (Macro range low).
Stop Loss (SL): $72,500 (Invalidation of the short thesis if BTC pushes above recent highs despite the yields).
Ethereum $ETH
Trade Setup (Short):
Entry Zone: $2,550 – $2,620.
Target 1 (T1): $2,380.
Target 2 (T2): $2,210.
Stop Loss (SL): $2,700.
Binance Coin $BNB
Trade Setup (Neutral / Long Hedges): I am avoiding a directional position on BNB for now, but I will monitor it to potentially flip long if the sell-off in BTC and ETH hits an exhaustion point at T2 levels.
Risk Management Framework:
The market is reacting emotionally to the 80% hike odds. The primary risk is a "sell the news, buy the fact" event before the next Fed meeting, or a sudden reversal in bond yields. Maintain strictly < 2% total portfolio risk per trade and respect all Stop Loss boundaries.
#JobsReport #RateHikes #marketcrash #FedWatch
121

$BTC EYES LIQUIDITY SHIFT AS BANK OF KOREA SIGNS HAWKISH PACE 🔥
This exact macro setup has triggered big moves in BTC during past rate cycles. The Bank of Korea is signaling 25bp hikes each quarter through late 2026, starting with a move from 2.50% to 2.75% next week. That tightens global liquidity faster than many expected.
First-quarter growth was revised up and Q2 activity stayed resilient — so this hawkish bias has real momentum behind it. Risk assets tend to front-run these announcements, and BTC is already compressing near a key support zone. Are you positioning for a breakout or waiting for the decision to clear?
Not financial advice. Always manage your risk.
#BTC #MacroSetup #Bitcoin #RateHikes #Crypto
🔥
$BTC EYES LIQUIDITY SHIFT AS BANK OF KOREA SIGNS HAWKISH PACE 🔥
This exact macro setup has triggered big moves in BTC during past rate cycles. The Bank of Korea is signaling 25bp hikes each quarter through late 2026, starting with a move from 2.50% to 2.75% next week. That tightens global liquidity faster than many expected.
First-quarter growth was revised up and Q2 activity stayed resilient — so this hawkish bias has real momentum behind it. Risk assets tend to front-run these announcements, and BTC is already compressing near a key support zone. Are you positioning for a breakout or waiting for the decision to clear?
Not financial advice. Always manage your risk.
#BTC #MacroSetup #Bitcoin #RateHikes #Crypto
🔥
This exact macro setup has triggered big moves in BTC during past rate cycles. The Bank of Korea is signaling 25bp hikes each quarter through late 2026, starting with a move from 2.50% to 2.75% next week. That tightens global liquidity faster than many expected.
First-quarter growth was revised up and Q2 activity stayed resilient — so this hawkish bias has real momentum behind it. Risk assets tend to front-run these announcements, and BTC is already compressing near a key support zone. Are you positioning for a breakout or waiting for the decision to clear?
Not financial advice. Always manage your risk.
#BTC #MacroSetup #Bitcoin #RateHikes #Crypto
🔥
17

🚨 FED SPLIT WIDENS: 5 PRESIDENTS LEAN HAWKISH — $BTC HEADS FOR TURBULENCE ⚡
📊 The Federal Reserve's internal battle just went public — 5 of 12 regional presidents now lean toward rate hikes, openly challenging the prevailing hold stance. Cleveland's Harker calls policy "not restrictive enough," while St. Louis' Bullard warns that the Treasury sell-off mirrors fading market faith in the Fed's credibility. 🔍
💡 Kashkari's "small continuous actions" philosophy and George's focus on stubborn demand pressures suggest inflation is far from tamed. This isn't a single dissenting voice — it's an institutional shift that reshapes liquidity expectations for every risk asset, including Bitcoin. 🌊
💬 Are you pricing in a hawkish shock to your $BTC positions, or treating this as noise before the next leg up? 👇
⚠️ Not financial advice. Always manage your risk. 🛡️
🏷️ #BTC #FederalReserve #RateHikes #Macro #Crypto
🔥 💎
🚨 FED SPLIT WIDENS: 5 PRESIDENTS LEAN HAWKISH — $BTC HEADS FOR TURBULENCE ⚡
📊 The Federal Reserve's internal battle just went public — 5 of 12 regional presidents now lean toward rate hikes, openly challenging the prevailing hold stance. Cleveland's Harker calls policy "not restrictive enough," while St. Louis' Bullard warns that the Treasury sell-off mirrors fading market faith in the Fed's credibility. 🔍
💡 Kashkari's "small continuous actions" philosophy and George's focus on stubborn demand pressures suggest inflation is far from tamed. This isn't a single dissenting voice — it's an institutional shift that reshapes liquidity expectations for every risk asset, including Bitcoin. 🌊
💬 Are you pricing in a hawkish shock to your $BTC positions, or treating this as noise before the next leg up? 👇
⚠️ Not financial advice. Always manage your risk. 🛡️
🏷️ #BTC #FederalReserve #RateHikes #Macro #Crypto
🔥 💎
📊 The Federal Reserve's internal battle just went public — 5 of 12 regional presidents now lean toward rate hikes, openly challenging the prevailing hold stance. Cleveland's Harker calls policy "not restrictive enough," while St. Louis' Bullard warns that the Treasury sell-off mirrors fading market faith in the Fed's credibility. 🔍
💡 Kashkari's "small continuous actions" philosophy and George's focus on stubborn demand pressures suggest inflation is far from tamed. This isn't a single dissenting voice — it's an institutional shift that reshapes liquidity expectations for every risk asset, including Bitcoin. 🌊
💬 Are you pricing in a hawkish shock to your $BTC positions, or treating this as noise before the next leg up? 👇
⚠️ Not financial advice. Always manage your risk. 🛡️
🏷️ #BTC #FederalReserve #RateHikes #Macro #Crypto
🔥 💎
9
ADDITIONAL RATE HIKES ARE THE DRAG CHUTE ON $BTC RISK APPETITE 🚨
The Bank of Korea just stepped up the hawkish choir — demand-side inflation pressure means more hikes are coming, and that's a liquidity headwind every risk asset has to respect. 📉 When central banks tighten, the cheap-money tide that lifted crypto boats starts pulling back.
💡 This isn't a single-event panic — it's a regime signal. Watch how $BTC digests this macro punch. If bids hold above key support, the market is pricing the tightening in already. If we sweep liquidity instead, the path of least resistance tilts lower. 🔍
💬 Is your portfolio positioned for a hawkish macro season, or are you betting the Fed blinks before Korea does? 👇
⚠️ Not financial advice. Always manage your risk. 🛡️
🏷️ #BTC #MacroWatch #RateHikes #RiskOff #CryptoMarket
🐻 📉
ADDITIONAL RATE HIKES ARE THE DRAG CHUTE ON $BTC RISK APPETITE 🚨
The Bank of Korea just stepped up the hawkish choir — demand-side inflation pressure means more hikes are coming, and that's a liquidity headwind every risk asset has to respect. 📉 When central banks tighten, the cheap-money tide that lifted crypto boats starts pulling back.
💡 This isn't a single-event panic — it's a regime signal. Watch how $BTC digests this macro punch. If bids hold above key support, the market is pricing the tightening in already. If we sweep liquidity instead, the path of least resistance tilts lower. 🔍
💬 Is your portfolio positioned for a hawkish macro season, or are you betting the Fed blinks before Korea does? 👇
⚠️ Not financial advice. Always manage your risk. 🛡️
🏷️ #BTC #MacroWatch #RateHikes #RiskOff #CryptoMarket
🐻 📉
The Bank of Korea just stepped up the hawkish choir — demand-side inflation pressure means more hikes are coming, and that's a liquidity headwind every risk asset has to respect. 📉 When central banks tighten, the cheap-money tide that lifted crypto boats starts pulling back.
💡 This isn't a single-event panic — it's a regime signal. Watch how $BTC digests this macro punch. If bids hold above key support, the market is pricing the tightening in already. If we sweep liquidity instead, the path of least resistance tilts lower. 🔍
💬 Is your portfolio positioned for a hawkish macro season, or are you betting the Fed blinks before Korea does? 👇
⚠️ Not financial advice. Always manage your risk. 🛡️
🏷️ #BTC #MacroWatch #RateHikes #RiskOff #CryptoMarket
🐻 📉
36

·
--
🚨 $BTC FACES A NEW HEADWIND AS SOUTH KOREA SIGNALS MORE RATE HIKES! ⚠️
📉 The Bank of Korea just poured cold water on risk appetite. Senior Deputy Governor Yoon Seong-dae made it clear: more tightening is coming unless a major shock flips the script. That's not a one-and-done — that's a policy path.
💡 Here's the kicker: South Korea's economy is running HOT, powered by AI-driven semiconductor exports. Stronger growth = more inflation pressure = higher rates for longer. 📊 For crypto, this means tighter liquidity in one of the world's most active retail markets. When Korean won liquidity dries up, the bid beneath altcoins thins out fast. 🔍
🔴 Smart money is watching rate differentials like a hawk right now. Every hike makes speculative assets that much harder to justify on a risk-adjusted basis. This isn't a flash crash signal — it's a structural headwind that demands respect for position sizing.
💬 Are you trimming exposure ahead of the next BOK decision, or do you see this as noise within a longer macro cycle? 👇
⚠️ Not financial advice. Always manage your risk. 🛡️
🏷️ #BTC #Macro #RateHikes #Crypto #RiskOff
🛡️ ⚖️
🚨 $BTC FACES A NEW HEADWIND AS SOUTH KOREA SIGNALS MORE RATE HIKES! ⚠️
📉 The Bank of Korea just poured cold water on risk appetite. Senior Deputy Governor Yoon Seong-dae made it clear: more tightening is coming unless a major shock flips the script. That's not a one-and-done — that's a policy path.
💡 Here's the kicker: South Korea's economy is running HOT, powered by AI-driven semiconductor exports. Stronger growth = more inflation pressure = higher rates for longer. 📊 For crypto, this means tighter liquidity in one of the world's most active retail markets. When Korean won liquidity dries up, the bid beneath altcoins thins out fast. 🔍
🔴 Smart money is watching rate differentials like a hawk right now. Every hike makes speculative assets that much harder to justify on a risk-adjusted basis. This isn't a flash crash signal — it's a structural headwind that demands respect for position sizing.
💬 Are you trimming exposure ahead of the next BOK decision, or do you see this as noise within a longer macro cycle? 👇
⚠️ Not financial advice. Always manage your risk. 🛡️
🏷️ #BTC #Macro #RateHikes #Crypto #RiskOff
🛡️ ⚖️
📉 The Bank of Korea just poured cold water on risk appetite. Senior Deputy Governor Yoon Seong-dae made it clear: more tightening is coming unless a major shock flips the script. That's not a one-and-done — that's a policy path.
💡 Here's the kicker: South Korea's economy is running HOT, powered by AI-driven semiconductor exports. Stronger growth = more inflation pressure = higher rates for longer. 📊 For crypto, this means tighter liquidity in one of the world's most active retail markets. When Korean won liquidity dries up, the bid beneath altcoins thins out fast. 🔍
🔴 Smart money is watching rate differentials like a hawk right now. Every hike makes speculative assets that much harder to justify on a risk-adjusted basis. This isn't a flash crash signal — it's a structural headwind that demands respect for position sizing.
💬 Are you trimming exposure ahead of the next BOK decision, or do you see this as noise within a longer macro cycle? 👇
⚠️ Not financial advice. Always manage your risk. 🛡️
🏷️ #BTC #Macro #RateHikes #Crypto #RiskOff
🛡️ ⚖️
10
$BTC IS BRACING AS MARKETS FULLY PRICE IN TWO FED RATE HIKES BY MARCH 🎯
Not financial advice. Always manage your risk.
The market has now priced in at least one rate hike by September and two by end of March next year — a massive shift in liquidity expectations. Meanwhile, Trump announced new sanctions on Iran plus a 20% fee on Strait of Hormuz goods, which could rattle commodity and risk assets further.
That kind of macro headwind tends to compress crypto volatility before a directional move. The question is whether $BTC holds support or gets swept lower first. Are you positioning for a drop or waiting for the sweep?
Not financial advice. Always manage your risk.
#BTC #Macro #RateHikes #RiskOff #Crypto
🎯
$BTC IS BRACING AS MARKETS FULLY PRICE IN TWO FED RATE HIKES BY MARCH 🎯
Not financial advice. Always manage your risk.
The market has now priced in at least one rate hike by September and two by end of March next year — a massive shift in liquidity expectations. Meanwhile, Trump announced new sanctions on Iran plus a 20% fee on Strait of Hormuz goods, which could rattle commodity and risk assets further.
That kind of macro headwind tends to compress crypto volatility before a directional move. The question is whether $BTC holds support or gets swept lower first. Are you positioning for a drop or waiting for the sweep?
Not financial advice. Always manage your risk.
#BTC #Macro #RateHikes #RiskOff #Crypto
🎯
Not financial advice. Always manage your risk.
The market has now priced in at least one rate hike by September and two by end of March next year — a massive shift in liquidity expectations. Meanwhile, Trump announced new sanctions on Iran plus a 20% fee on Strait of Hormuz goods, which could rattle commodity and risk assets further.
That kind of macro headwind tends to compress crypto volatility before a directional move. The question is whether $BTC holds support or gets swept lower first. Are you positioning for a drop or waiting for the sweep?
Not financial advice. Always manage your risk.
#BTC #Macro #RateHikes #RiskOff #Crypto
🎯
37

💥 JAPAN'S RATE HIKE CYCLE JUST FLIPPED THE RISK AVERSION SWITCH – $BANK $RIF IN PLAY ⚡
📌 The BOJ is moving faster than markets priced – three+ rate hikes a year on a yen that's tanking to 1986 lows. This isn't a slow bleed; it's a structural unwind that shifts liquidity flows across global markets, including crypto. 📉
🔍 Smart money is already front-running the volatility. Weak yen historically sends capital seeking higher-yielding assets – and pockets of the crypto market like $BANK and $RIF become liquidity magnets when traditional currency hedging fails. 📊
💡 This isn't a bullish blanket statement – it's a macro regime change that reweights risk-on positioning. The question is whether these tokens survive the initial shock or become the next safe harbor. 💬 Which side of this rate-hike cascade are you positioning for – yen carry unwind or crypto flight? 👇
⚠️ Not financial advice. Always manage your risk. 🛡️
🏷️ #BANK #RIF #Macro #Crypto #RateHikes
🦈 ⚡
💥 JAPAN'S RATE HIKE CYCLE JUST FLIPPED THE RISK AVERSION SWITCH – $BANK $RIF IN PLAY ⚡
📌 The BOJ is moving faster than markets priced – three+ rate hikes a year on a yen that's tanking to 1986 lows. This isn't a slow bleed; it's a structural unwind that shifts liquidity flows across global markets, including crypto. 📉
🔍 Smart money is already front-running the volatility. Weak yen historically sends capital seeking higher-yielding assets – and pockets of the crypto market like $BANK and $RIF become liquidity magnets when traditional currency hedging fails. 📊
💡 This isn't a bullish blanket statement – it's a macro regime change that reweights risk-on positioning. The question is whether these tokens survive the initial shock or become the next safe harbor. 💬 Which side of this rate-hike cascade are you positioning for – yen carry unwind or crypto flight? 👇
⚠️ Not financial advice. Always manage your risk. 🛡️
🏷️ #BANK #RIF #Macro #Crypto #RateHikes
🦈 ⚡
📌 The BOJ is moving faster than markets priced – three+ rate hikes a year on a yen that's tanking to 1986 lows. This isn't a slow bleed; it's a structural unwind that shifts liquidity flows across global markets, including crypto. 📉
🔍 Smart money is already front-running the volatility. Weak yen historically sends capital seeking higher-yielding assets – and pockets of the crypto market like $BANK and $RIF become liquidity magnets when traditional currency hedging fails. 📊
💡 This isn't a bullish blanket statement – it's a macro regime change that reweights risk-on positioning. The question is whether these tokens survive the initial shock or become the next safe harbor. 💬 Which side of this rate-hike cascade are you positioning for – yen carry unwind or crypto flight? 👇
⚠️ Not financial advice. Always manage your risk. 🛡️
🏷️ #BANK #RIF #Macro #Crypto #RateHikes
🦈 ⚡

133
·
--
🔴 $BTC SQUEEZES AS BANK OF KOREA SIGNALS MORE RATE HIKES 🚨
The Bank of Korea just put the market on notice — the tightening cycle is far from over. With AI-driven semiconductor exports fueling stronger-than-expected growth and inflation pressures building, the deputy governor leaves little room for dovish interpretation. 📊
This is the macro backdrop risk assets can't ignore. Every hawkish pivot pulls liquidity from the system, and crypto feels that suction first. Global central banks are singing the same restrictive tune, meaning capital flows into digital assets face structural headwinds. 🏦 ⚡
The real question isn't whether the squeeze lands — it's how deep the liquidity retraction goes before finding structural support. 💬 Are your positions built for a hawkish macro regime, or are you waiting on the next dovish pivot? 👇
⚠️ Not financial advice. Always manage your risk. 🛡️
🏷️ #BTC #MacroAnalysis #RateHikes #Crypto #RiskOff
🐻 📉
🔴 $BTC SQUEEZES AS BANK OF KOREA SIGNALS MORE RATE HIKES 🚨
The Bank of Korea just put the market on notice — the tightening cycle is far from over. With AI-driven semiconductor exports fueling stronger-than-expected growth and inflation pressures building, the deputy governor leaves little room for dovish interpretation. 📊
This is the macro backdrop risk assets can't ignore. Every hawkish pivot pulls liquidity from the system, and crypto feels that suction first. Global central banks are singing the same restrictive tune, meaning capital flows into digital assets face structural headwinds. 🏦 ⚡
The real question isn't whether the squeeze lands — it's how deep the liquidity retraction goes before finding structural support. 💬 Are your positions built for a hawkish macro regime, or are you waiting on the next dovish pivot? 👇
⚠️ Not financial advice. Always manage your risk. 🛡️
🏷️ #BTC #MacroAnalysis #RateHikes #Crypto #RiskOff
🐻 📉
The Bank of Korea just put the market on notice — the tightening cycle is far from over. With AI-driven semiconductor exports fueling stronger-than-expected growth and inflation pressures building, the deputy governor leaves little room for dovish interpretation. 📊
This is the macro backdrop risk assets can't ignore. Every hawkish pivot pulls liquidity from the system, and crypto feels that suction first. Global central banks are singing the same restrictive tune, meaning capital flows into digital assets face structural headwinds. 🏦 ⚡
The real question isn't whether the squeeze lands — it's how deep the liquidity retraction goes before finding structural support. 💬 Are your positions built for a hawkish macro regime, or are you waiting on the next dovish pivot? 👇
⚠️ Not financial advice. Always manage your risk. 🛡️
🏷️ #BTC #MacroAnalysis #RateHikes #Crypto #RiskOff
🐻 📉
17
Log in to explore more content
Join global crypto users on Binance Square
⚡️ Get latest and useful information about crypto.
💬 Trusted by the world’s largest crypto exchange.
👍 Discover real insights from verified creators.
Email / Phone number
Trending Topics
1
#BTCReboundsAbove$60KAmidWhaleDipBuying
87,462 views
374 Discussing
2
#SolanaSets2027RoadmapToDoubleComputeCapacity
72,115 views
1,096 Discussing
3
#CaliforniaNvidiaProbeExaminesPotentialCriminalViolations
19,625 views
152 Discussing
4
#BlackRockLaunchesHKDollarDigitalLiquidityFund
60,494 views
824 Discussing
5
#NvidiaLoses$2.7TrillionInMonthAndAHalf
82,199 views
322 Discussing
6
#GlobalStocksFaceLongestLosingStreakSince2023
590,969 views
3,548 Discussing
7
#BlackRockIBITPostsRecord$541MSingleDayOutflow
100,178 views
186 Discussing
8
#AnthropicPlungesTowardIPOPriceonDay2
329,451 views
2,387 Discussing
9
#TwentyOneCapitalAdds172.25BTC
178,604 views
1,696 Discussing
10
#HKBillWouldExcludeTokenizedDepositsFromVirtualAssets
19,138 views
109 Discussing