
#strc
strc
73,202 views
850 Discussing
Hot
Latest

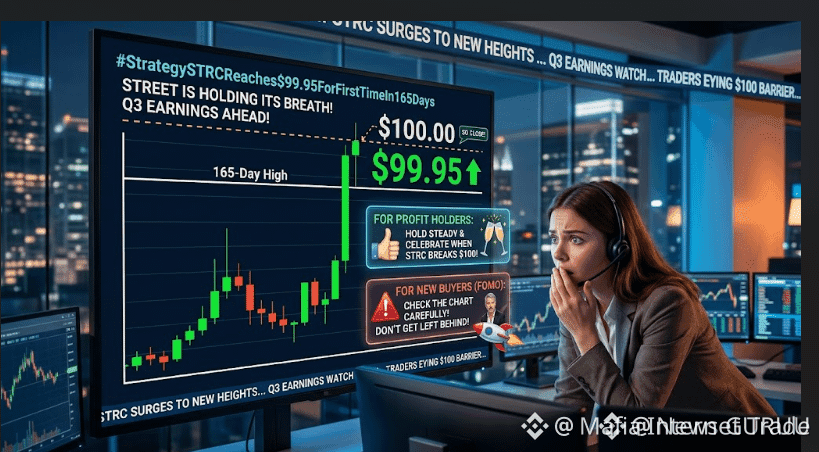
🚨 $STRC SITS JUST FIVE CENTS AWAY FROM THE LEGENDARY $100 BREAKOUT! 💥
Entry: 99.95 ⚡
Target: 100.00 🚀
After a relentless 165-day consolidation grind, buyers are stepping up heavy pressure right at the doorstep of triple digits. 📊 Q3 earnings catalysts are breathing fresh life into the order books as momentum builds rapidly toward this psychological ceiling. ⚡
Chasing green candles without a plan is a quick way to get caught in a local top sweep, so watch how order flow behaves around the final resistance. 🔍 Are you positioning for the clean break above par, or waiting for a retest? 👇
⚠️ Not financial advice. Always manage your risk. 🛡️
🏷️ #STRC #Breakout #Momentum #Crypto
🔥 💎
🚨 $STRC SITS JUST FIVE CENTS AWAY FROM THE LEGENDARY $100 BREAKOUT! 💥
Entry: 99.95 ⚡
Target: 100.00 🚀
After a relentless 165-day consolidation grind, buyers are stepping up heavy pressure right at the doorstep of triple digits. 📊 Q3 earnings catalysts are breathing fresh life into the order books as momentum builds rapidly toward this psychological ceiling. ⚡
Chasing green candles without a plan is a quick way to get caught in a local top sweep, so watch how order flow behaves around the final resistance. 🔍 Are you positioning for the clean break above par, or waiting for a retest? 👇
⚠️ Not financial advice. Always manage your risk. 🛡️
🏷️ #STRC #Breakout #Momentum #Crypto
🔥 💎
Entry: 99.95 ⚡
Target: 100.00 🚀
After a relentless 165-day consolidation grind, buyers are stepping up heavy pressure right at the doorstep of triple digits. 📊 Q3 earnings catalysts are breathing fresh life into the order books as momentum builds rapidly toward this psychological ceiling. ⚡
Chasing green candles without a plan is a quick way to get caught in a local top sweep, so watch how order flow behaves around the final resistance. 🔍 Are you positioning for the clean break above par, or waiting for a retest? 👇
⚠️ Not financial advice. Always manage your risk. 🛡️
🏷️ #STRC #Breakout #Momentum #Crypto
🔥 💎

·
--
🦈 $STRC INSTITUTIONAL ACCUMULATION ZONE ACTIVE AS SMART MONEY DEFENDS THE $100 PAR VALUE ⚡
Entry: 94.66 ⚡
Institutional footprint is unmistakable as corporate treasury allocation absorbs over six hundred million in daily volume. 📊 Smart money is systematically defending the sub-one hundred tier to suppress dividend drag and reinforce balance sheet efficiency. 🌊
Meanwhile, concurrent accumulation of $BTC scales treasury reserves higher as cash flow fuels structural expansion. 💡 When corporate balance sheets actively optimize liquidity below par, how does this institutional bid alter your view of market depth? 👇
⚠️ Not financial advice. Always manage your risk. 🛡️
🏷️ #STRC #SmartMoney #Liquidity #Bitcoin #Treasury
🦈 💰
🦈 $STRC INSTITUTIONAL ACCUMULATION ZONE ACTIVE AS SMART MONEY DEFENDS THE $100 PAR VALUE ⚡
Entry: 94.66 ⚡
Institutional footprint is unmistakable as corporate treasury allocation absorbs over six hundred million in daily volume. 📊 Smart money is systematically defending the sub-one hundred tier to suppress dividend drag and reinforce balance sheet efficiency. 🌊
Meanwhile, concurrent accumulation of $BTC scales treasury reserves higher as cash flow fuels structural expansion. 💡 When corporate balance sheets actively optimize liquidity below par, how does this institutional bid alter your view of market depth? 👇
⚠️ Not financial advice. Always manage your risk. 🛡️
🏷️ #STRC #SmartMoney #Liquidity #Bitcoin #Treasury
🦈 💰
Entry: 94.66 ⚡
Institutional footprint is unmistakable as corporate treasury allocation absorbs over six hundred million in daily volume. 📊 Smart money is systematically defending the sub-one hundred tier to suppress dividend drag and reinforce balance sheet efficiency. 🌊
Meanwhile, concurrent accumulation of $BTC scales treasury reserves higher as cash flow fuels structural expansion. 💡 When corporate balance sheets actively optimize liquidity below par, how does this institutional bid alter your view of market depth? 👇
⚠️ Not financial advice. Always manage your risk. 🛡️
🏷️ #STRC #SmartMoney #Liquidity #Bitcoin #Treasury
🦈 💰

8

$STRC DISCOUNT ACCUMULATION IGNITES AS TREASURY CONTINUES AGGRESSIVE BUYBACKS 🦈💥
Entry: 94.66 ⚡
Treasury capital allocation in action. Strategy is mopping up preferred stock below the 100 dollar par value to slash dividend obligations while stacking another batch of $BTC into the vault. When a heavy hitter systematically absorbs supply below par while locking in multi-million dollar capital efficiency, institutional accumulation leaves a clear footprint. 📊
This structured sweep trims future cash burn and strengthens the underlying balance sheet while expanding their multi-coin fortress. ⚡ Are you tracking how corporate treasury mechanics dictate broader market liquidity flows? 🤔
⚠️ Not financial advice. Always manage your risk. 🛡️
🏷️ #STRC #Bitcoin #Strategy #Crypto
🔥 💎
$STRC DISCOUNT ACCUMULATION IGNITES AS TREASURY CONTINUES AGGRESSIVE BUYBACKS 🦈💥
Entry: 94.66 ⚡
Treasury capital allocation in action. Strategy is mopping up preferred stock below the 100 dollar par value to slash dividend obligations while stacking another batch of $BTC into the vault. When a heavy hitter systematically absorbs supply below par while locking in multi-million dollar capital efficiency, institutional accumulation leaves a clear footprint. 📊
This structured sweep trims future cash burn and strengthens the underlying balance sheet while expanding their multi-coin fortress. ⚡ Are you tracking how corporate treasury mechanics dictate broader market liquidity flows? 🤔
⚠️ Not financial advice. Always manage your risk. 🛡️
🏷️ #STRC #Bitcoin #Strategy #Crypto
🔥 💎
Entry: 94.66 ⚡
Treasury capital allocation in action. Strategy is mopping up preferred stock below the 100 dollar par value to slash dividend obligations while stacking another batch of $BTC into the vault. When a heavy hitter systematically absorbs supply below par while locking in multi-million dollar capital efficiency, institutional accumulation leaves a clear footprint. 📊
This structured sweep trims future cash burn and strengthens the underlying balance sheet while expanding their multi-coin fortress. ⚡ Are you tracking how corporate treasury mechanics dictate broader market liquidity flows? 🤔
⚠️ Not financial advice. Always manage your risk. 🛡️
🏷️ #STRC #Bitcoin #Strategy #Crypto
🔥 💎


🚨 $STRC TESTING PAR VALUE DEFENSE AS CAPITAL SHIFTS FROM SPOT BTC 📊
Entry: 96.35 ⚡
Institutional capital management is front and center as $STRC tests its structural discount near 96.35 against the 100 par value. Heavy equity repurchases totaling over two hundred million are actively defending the credit engine while temporarily absorbing liquidity that would otherwise flow into spot $BTC accumulation. 🌊
The underlying balance sheet remains heavily backed by robust USD assets and massive bitcoin reserves supporting the twelve percent variable dividend yield. Monitoring how management balances these credit defense mechanisms provides critical insight into broader institutional allocation flows. 💡
💬 Is this discount on $STRC a compelling yield opportunity or an early structural cooling signal for $BTC ? 👇
⚠️ Not financial advice. Always manage your risk. 🛡️
🏷️ #STRC #BTC #MSTR #InstitutionalFlow #MarketStructure
🦈 ⚖️
🚨 $STRC TESTING PAR VALUE DEFENSE AS CAPITAL SHIFTS FROM SPOT BTC 📊
Entry: 96.35 ⚡
Institutional capital management is front and center as $STRC tests its structural discount near 96.35 against the 100 par value. Heavy equity repurchases totaling over two hundred million are actively defending the credit engine while temporarily absorbing liquidity that would otherwise flow into spot $BTC accumulation. 🌊
The underlying balance sheet remains heavily backed by robust USD assets and massive bitcoin reserves supporting the twelve percent variable dividend yield. Monitoring how management balances these credit defense mechanisms provides critical insight into broader institutional allocation flows. 💡
💬 Is this discount on $STRC a compelling yield opportunity or an early structural cooling signal for $BTC ? 👇
⚠️ Not financial advice. Always manage your risk. 🛡️
🏷️ #STRC #BTC #MSTR #InstitutionalFlow #MarketStructure
🦈 ⚖️
Entry: 96.35 ⚡
Institutional capital management is front and center as $STRC tests its structural discount near 96.35 against the 100 par value. Heavy equity repurchases totaling over two hundred million are actively defending the credit engine while temporarily absorbing liquidity that would otherwise flow into spot $BTC accumulation. 🌊
The underlying balance sheet remains heavily backed by robust USD assets and massive bitcoin reserves supporting the twelve percent variable dividend yield. Monitoring how management balances these credit defense mechanisms provides critical insight into broader institutional allocation flows. 💡
💬 Is this discount on $STRC a compelling yield opportunity or an early structural cooling signal for $BTC ? 👇
⚠️ Not financial advice. Always manage your risk. 🛡️
🏷️ #STRC #BTC #MSTR #InstitutionalFlow #MarketStructure
🦈 ⚖️
8

·
--
🦈 $STRC CRACKS BELOW PAR AS CORPORATE TREASURY DEFENDS THE PEG! 💥
Entry: 96.35 ⚡
Target: 100 🚀
Corporate heavyweights are rewriting the playbook as capital pivots hard toward treasury defense over spot accumulation. 📊 With massive buybacks soaking up supply below par value, the balance sheet is locked in a high-stakes tug-of-war against broader market momentum. ⚡
Smart money is tracking this discount closely to see whether yield preservation acts as a structural floor or a temporary drag on upside velocity. 💡
💬 Are you bidding this discount for the yield or waiting for spot momentum to reclaim dominance? 👇
⚠️ Not financial advice. Always manage your risk. 🛡️
🏷️ #STRC #BTC #Yield #Crypto
🔥 💎
🦈 $STRC CRACKS BELOW PAR AS CORPORATE TREASURY DEFENDS THE PEG! 💥
Entry: 96.35 ⚡
Target: 100 🚀
Corporate heavyweights are rewriting the playbook as capital pivots hard toward treasury defense over spot accumulation. 📊 With massive buybacks soaking up supply below par value, the balance sheet is locked in a high-stakes tug-of-war against broader market momentum. ⚡
Smart money is tracking this discount closely to see whether yield preservation acts as a structural floor or a temporary drag on upside velocity. 💡
💬 Are you bidding this discount for the yield or waiting for spot momentum to reclaim dominance? 👇
⚠️ Not financial advice. Always manage your risk. 🛡️
🏷️ #STRC #BTC #Yield #Crypto
🔥 💎
Entry: 96.35 ⚡
Target: 100 🚀
Corporate heavyweights are rewriting the playbook as capital pivots hard toward treasury defense over spot accumulation. 📊 With massive buybacks soaking up supply below par value, the balance sheet is locked in a high-stakes tug-of-war against broader market momentum. ⚡
Smart money is tracking this discount closely to see whether yield preservation acts as a structural floor or a temporary drag on upside velocity. 💡
💬 Are you bidding this discount for the yield or waiting for spot momentum to reclaim dominance? 👇
⚠️ Not financial advice. Always manage your risk. 🛡️
🏷️ #STRC #BTC #Yield #Crypto
🔥 💎
8

·
--
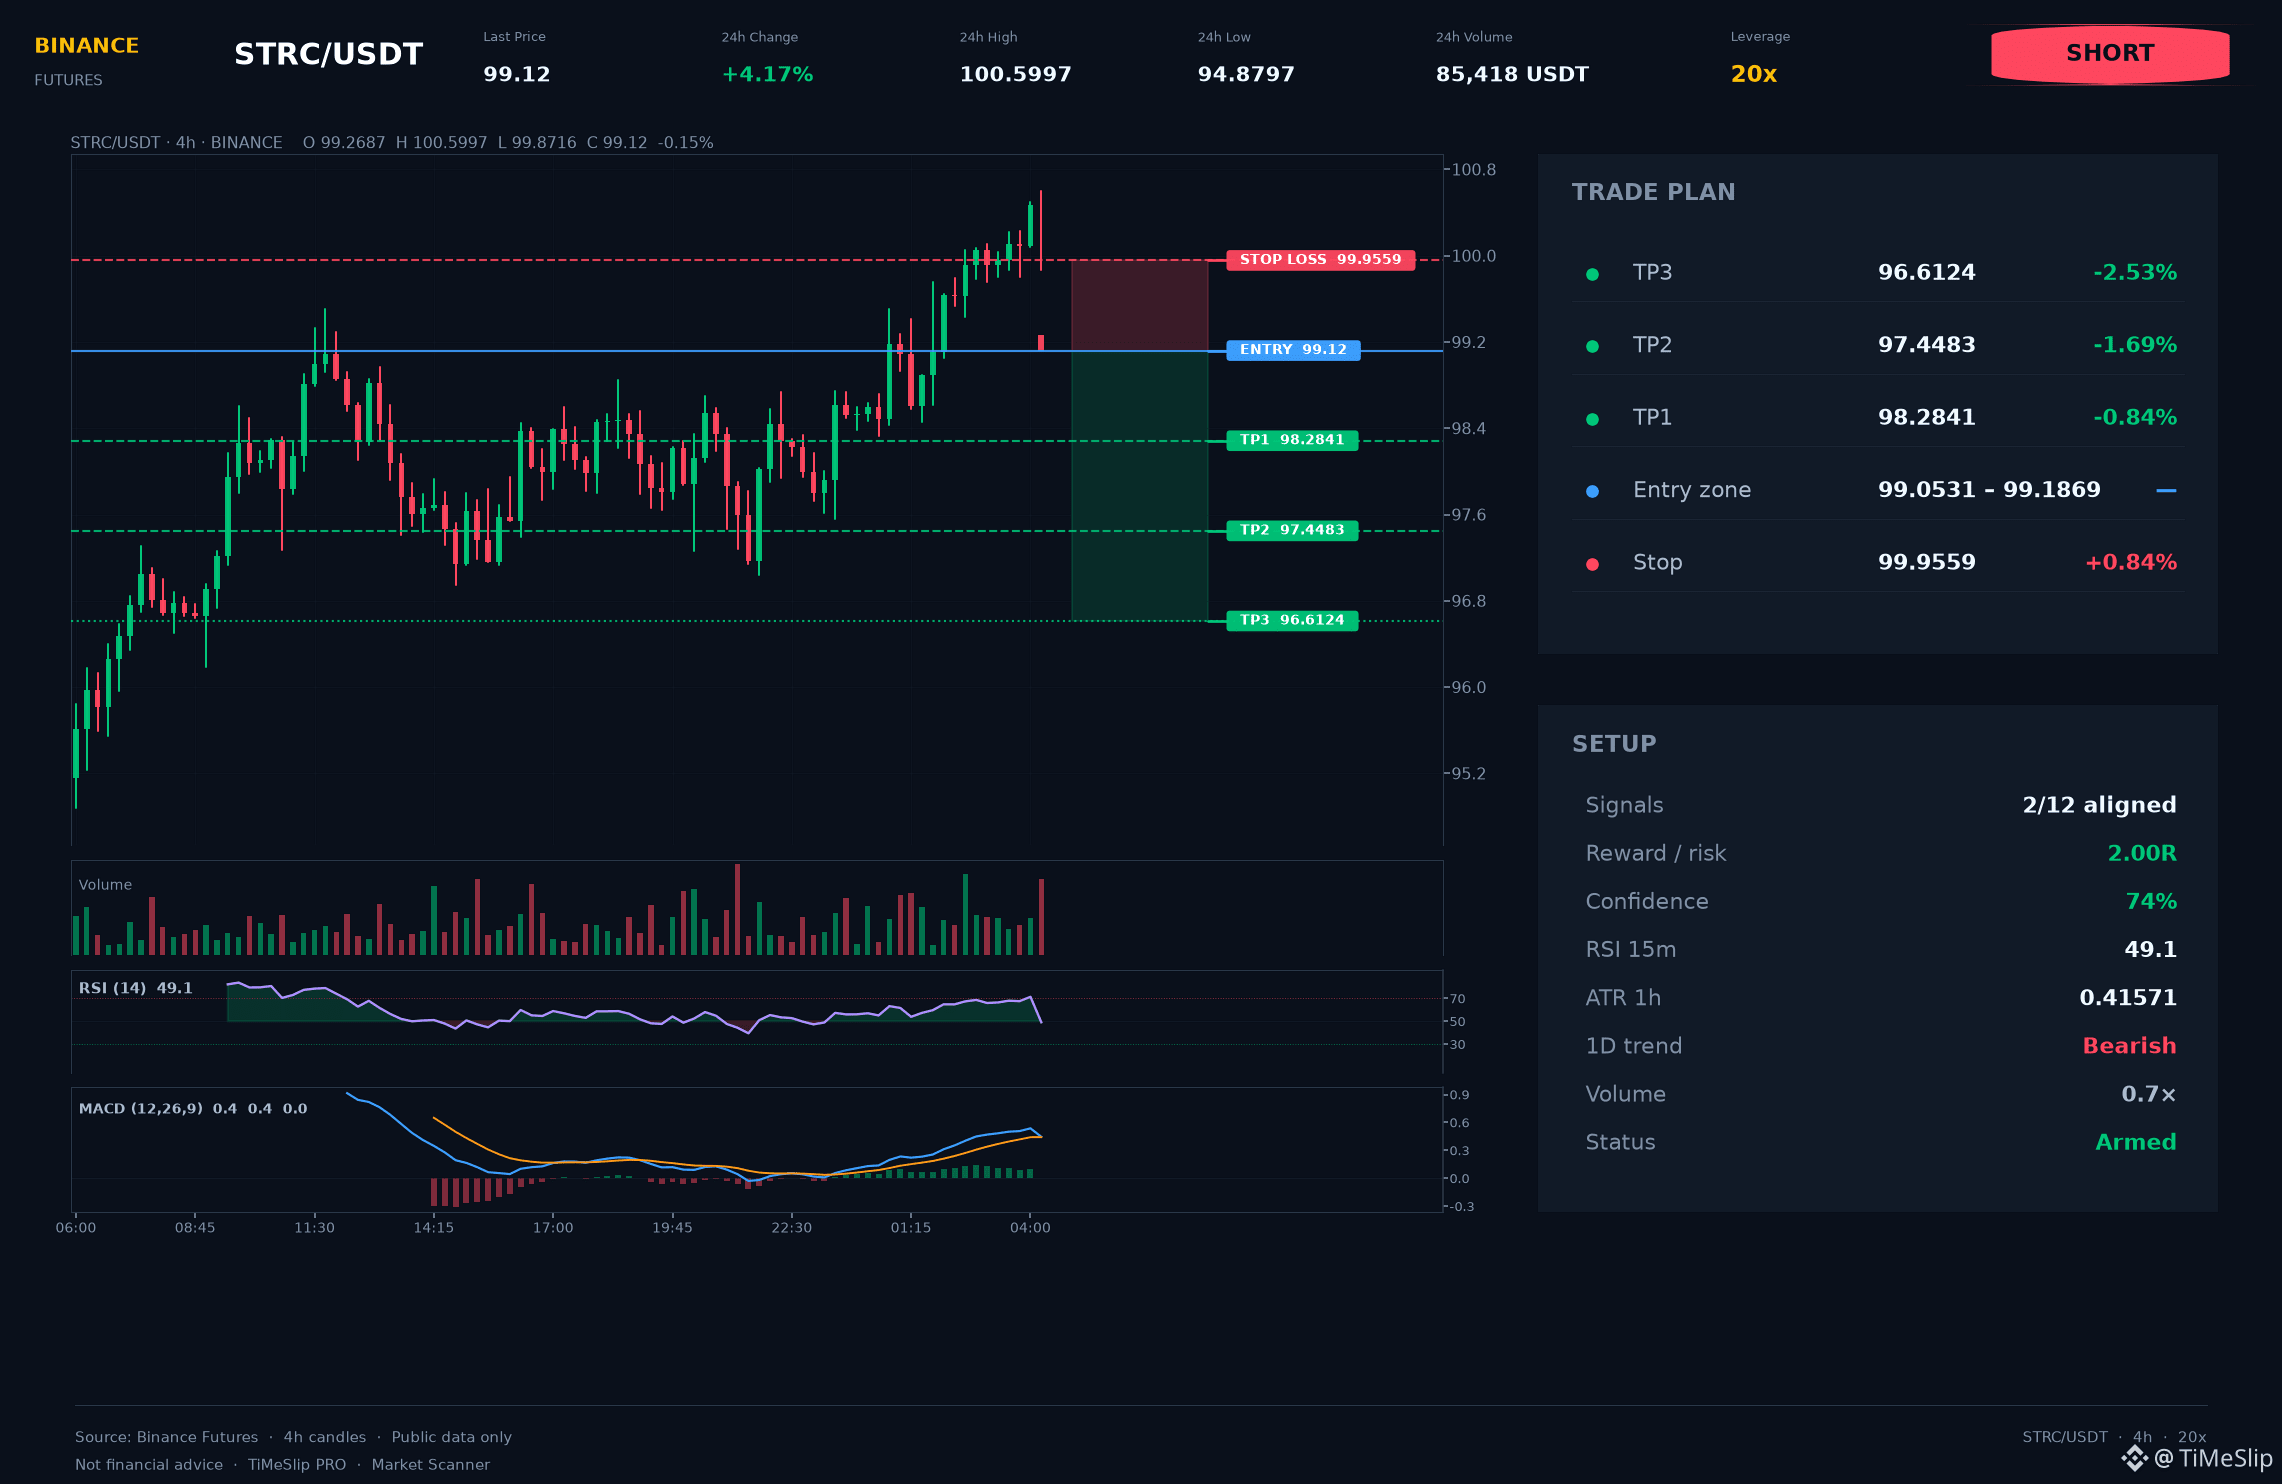
$STRC 🔴 (SELL)
ENTRY: 99.120
STOP: 99.956
• TP1: 98.284
• TP2: 97.448
• TP3: 96.612
💡 Tip: after TP1 is hit, move stop-loss to break-even.
The short on STRC has a technical case, not just a red candle. Sellers must hold the zone.
Structure broken: break of 99.238 confirmed by retest. Risk to stop held at 0.84%. Context: 8h, 12h. ATR(14): 0.41571.
Volume within normal range (0.7×).
📚 Order Flow: order book imbalance -15.7%; aggressive buys 38.7%. Overall flow supports the signal direction.
Technical setup rating — 74/100. This is a structure/risk calculation, not a profit guarantee. Risk is controlled (0.84%).
🔔 Subscribe to stay on top of major crypto market moves!
All information is analytical only. You make financial decisions independently and at your own risk.
#STRC #STRCNews $STRC 👈 Tap to trade
$STRC 🔴 (SELL)
ENTRY: 99.120
STOP: 99.956
• TP1: 98.284
• TP2: 97.448
• TP3: 96.612
💡 Tip: after TP1 is hit, move stop-loss to break-even.
The short on STRC has a technical case, not just a red candle. Sellers must hold the zone.
Structure broken: break of 99.238 confirmed by retest. Risk to stop held at 0.84%. Context: 8h, 12h. ATR(14): 0.41571.
Volume within normal range (0.7×).
📚 Order Flow: order book imbalance -15.7%; aggressive buys 38.7%. Overall flow supports the signal direction.
Technical setup rating — 74/100. This is a structure/risk calculation, not a profit guarantee. Risk is controlled (0.84%).
🔔 Subscribe to stay on top of major crypto market moves!
All information is analytical only. You make financial decisions independently and at your own risk.
#STRC #STRCNews $STRC 👈 Tap to trade
ENTRY: 99.120
STOP: 99.956
• TP1: 98.284
• TP2: 97.448
• TP3: 96.612
💡 Tip: after TP1 is hit, move stop-loss to break-even.
The short on STRC has a technical case, not just a red candle. Sellers must hold the zone.
Structure broken: break of 99.238 confirmed by retest. Risk to stop held at 0.84%. Context: 8h, 12h. ATR(14): 0.41571.
Volume within normal range (0.7×).
📚 Order Flow: order book imbalance -15.7%; aggressive buys 38.7%. Overall flow supports the signal direction.
Technical setup rating — 74/100. This is a structure/risk calculation, not a profit guarantee. Risk is controlled (0.84%).
🔔 Subscribe to stay on top of major crypto market moves!
All information is analytical only. You make financial decisions independently and at your own risk.
#STRC #STRCNews $STRC 👈 Tap to trade
23


·
--
Verified
#strategy旗下strc优先股跌破100美元面值
STRC, the preferred stock issued by Strategy, has recently seen a noteworthy change: its share price has fallen below its $100 par value again.
On November 18, STRC fell as low as $95.50 intraday and closed at $96.11, a discount of about 3.9% to its $100 par value and its lowest level since August.
What is STRC? Simply put, it is a perpetual preferred stock issued by Strategy with a floating dividend. Its current annualized dividend rate is 12%. The company adjusts the rate monthly based on market conditions, aiming to keep the share price trading around its $100 par value.
So why is a drop below $100 worth paying attention to?
Strategy previously said that when STRC trades below $100, the company tends to buy back shares. Its current policy is not to issue new STRC below $100. If the price stays below par, the company’s ability to raise funds through this type of preferred stock may be constrained.
More notably, Strategy bought back about $228 million worth of STRC over the past week, while it spent only about $33.4 million on Bitcoin purchases. The company is balancing how to allocate funds between supporting its preferred stock price and adding to its Bitcoin holdings.
Of course, STRC falling below $100 does not mean Strategy is facing an immediate solvency crisis. But it is a reminder to the market that high-dividend products can also fluctuate in price: a 12% annualized dividend rate does not guarantee your principal, nor does it guarantee returns.
Do you think STRC falling below par is just a short-term market fluctuation, or is Strategy’s financing model facing a much bigger test?
#Strategy #STRC #MSTR
#strategy旗下strc优先股跌破100美元面值
STRC, the preferred stock issued by Strategy, has recently seen a noteworthy change: its share price has fallen below its $100 par value again.
On November 18, STRC fell as low as $95.50 intraday and closed at $96.11, a discount of about 3.9% to its $100 par value and its lowest level since August.
What is STRC? Simply put, it is a perpetual preferred stock issued by Strategy with a floating dividend. Its current annualized dividend rate is 12%. The company adjusts the rate monthly based on market conditions, aiming to keep the share price trading around its $100 par value.
So why is a drop below $100 worth paying attention to?
Strategy previously said that when STRC trades below $100, the company tends to buy back shares. Its current policy is not to issue new STRC below $100. If the price stays below par, the company’s ability to raise funds through this type of preferred stock may be constrained.
More notably, Strategy bought back about $228 million worth of STRC over the past week, while it spent only about $33.4 million on Bitcoin purchases. The company is balancing how to allocate funds between supporting its preferred stock price and adding to its Bitcoin holdings.
Of course, STRC falling below $100 does not mean Strategy is facing an immediate solvency crisis. But it is a reminder to the market that high-dividend products can also fluctuate in price: a 12% annualized dividend rate does not guarantee your principal, nor does it guarantee returns.
Do you think STRC falling below par is just a short-term market fluctuation, or is Strategy’s financing model facing a much bigger test?
#Strategy #STRC #MSTR
STRC, the preferred stock issued by Strategy, has recently seen a noteworthy change: its share price has fallen below its $100 par value again.
On November 18, STRC fell as low as $95.50 intraday and closed at $96.11, a discount of about 3.9% to its $100 par value and its lowest level since August.
What is STRC? Simply put, it is a perpetual preferred stock issued by Strategy with a floating dividend. Its current annualized dividend rate is 12%. The company adjusts the rate monthly based on market conditions, aiming to keep the share price trading around its $100 par value.
So why is a drop below $100 worth paying attention to?
Strategy previously said that when STRC trades below $100, the company tends to buy back shares. Its current policy is not to issue new STRC below $100. If the price stays below par, the company’s ability to raise funds through this type of preferred stock may be constrained.
More notably, Strategy bought back about $228 million worth of STRC over the past week, while it spent only about $33.4 million on Bitcoin purchases. The company is balancing how to allocate funds between supporting its preferred stock price and adding to its Bitcoin holdings.
Of course, STRC falling below $100 does not mean Strategy is facing an immediate solvency crisis. But it is a reminder to the market that high-dividend products can also fluctuate in price: a 12% annualized dividend rate does not guarantee your principal, nor does it guarantee returns.
Do you think STRC falling below par is just a short-term market fluctuation, or is Strategy’s financing model facing a much bigger test?
#Strategy #STRC #MSTR
905

·
--
$STRC / $GRVT — Two bullish signals have arrived simultaneously on the 30-minute chart 🔥
════════════════════
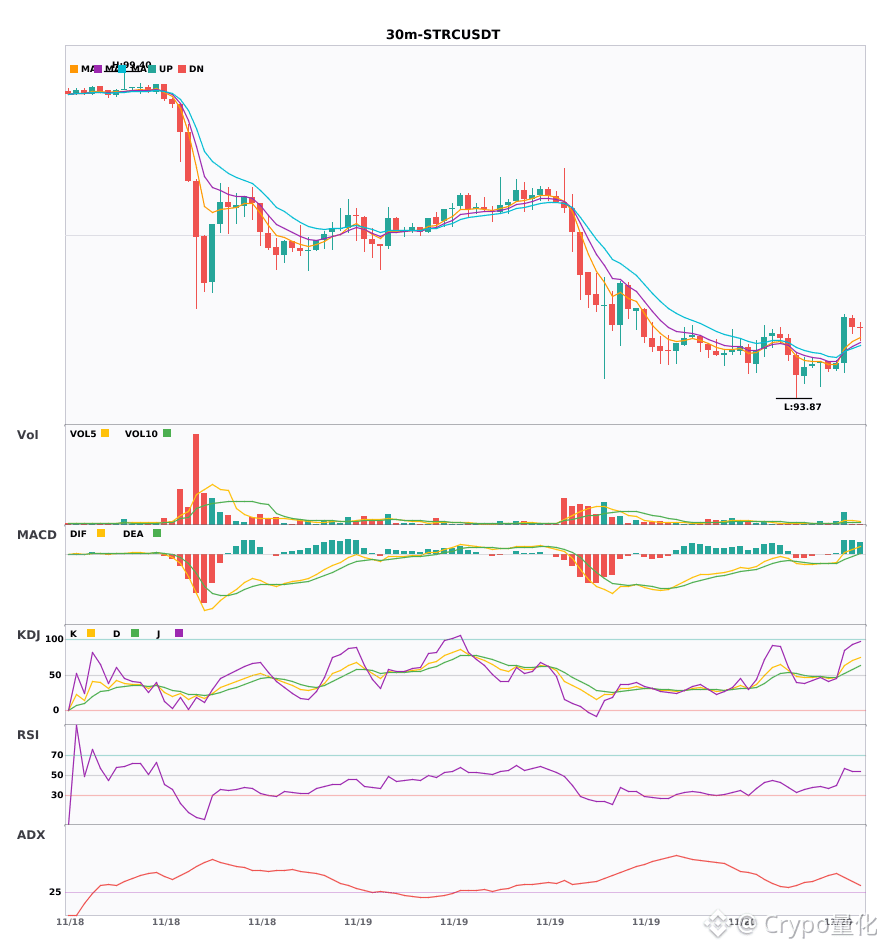
🔴 $STRC — 30-minute bullish signal
⚠️Technical analysis: ADX at 39 indicates a clear trend. MACD has formed a bullish crossover with increasing volume, and the red histogram bars are growing. The moving averages have just formed a bullish alignment. K has crossed above D without entering overbought territory. Volume surged 4.8x, showing strong bullish momentum.
📢Market update: Michael Saylor says Strategy's STRC preferred stock has up to $7.5 billion in "natural demand", and that the company is responding to tightening credit markets by reducing the STRC float.
════════════════════
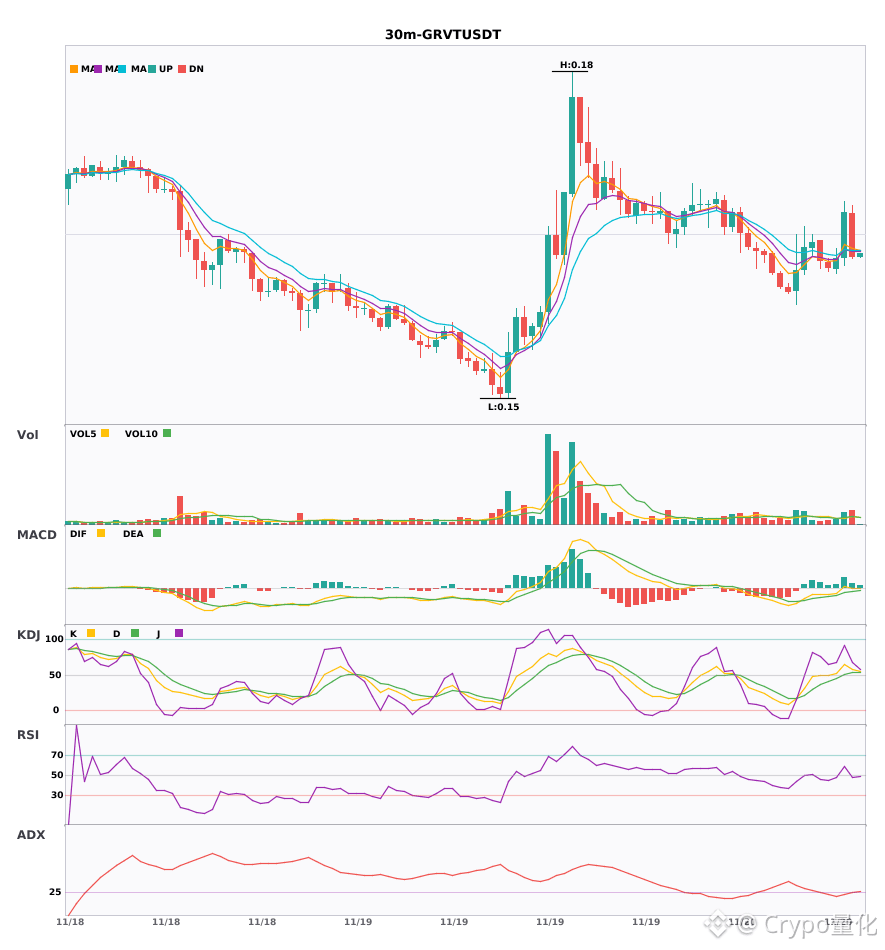
🔴 $GRVT — 30-minute bullish signal
⚠️Technical analysis: The trend is just getting started and is worth watching. MACD has formed a bullish crossover with increasing volume, and the red histogram bars are expanding. The moving averages have just formed a bullish alignment and are pointing upward. K has crossed above D without entering overbought territory. Volume is up about 1.7x, with bulls in control.
════════════════════
🔔 Follow for first-hand market movement alerts 🔔
#技术分析 #STRC #GRVT
📌 When trading, pay attention to whether the candlestick pattern confirms the setup.
$STRC / $GRVT — Two bullish signals have arrived simultaneously on the 30-minute chart 🔥
════════════════════
🔴 $STRC — 30-minute bullish signal
⚠️Technical analysis: ADX at 39 indicates a clear trend. MACD has formed a bullish crossover with increasing volume, and the red histogram bars are growing. The moving averages have just formed a bullish alignment. K has crossed above D without entering overbought territory. Volume surged 4.8x, showing strong bullish momentum.
📢Market update: Michael Saylor says Strategy's STRC preferred stock has up to $7.5 billion in "natural demand", and that the company is responding to tightening credit markets by reducing the STRC float.
════════════════════
🔴 $GRVT — 30-minute bullish signal
⚠️Technical analysis: The trend is just getting started and is worth watching. MACD has formed a bullish crossover with increasing volume, and the red histogram bars are expanding. The moving averages have just formed a bullish alignment and are pointing upward. K has crossed above D without entering overbought territory. Volume is up about 1.7x, with bulls in control.
════════════════════
🔔 Follow for first-hand market movement alerts 🔔
#技术分析 #STRC #GRVT
📌 When trading, pay attention to whether the candlestick pattern confirms the setup.
════════════════════
🔴 $STRC — 30-minute bullish signal
⚠️Technical analysis: ADX at 39 indicates a clear trend. MACD has formed a bullish crossover with increasing volume, and the red histogram bars are growing. The moving averages have just formed a bullish alignment. K has crossed above D without entering overbought territory. Volume surged 4.8x, showing strong bullish momentum.
📢Market update: Michael Saylor says Strategy's STRC preferred stock has up to $7.5 billion in "natural demand", and that the company is responding to tightening credit markets by reducing the STRC float.
════════════════════
🔴 $GRVT — 30-minute bullish signal
⚠️Technical analysis: The trend is just getting started and is worth watching. MACD has formed a bullish crossover with increasing volume, and the red histogram bars are expanding. The moving averages have just formed a bullish alignment and are pointing upward. K has crossed above D without entering overbought territory. Volume is up about 1.7x, with bulls in control.
════════════════════
🔔 Follow for first-hand market movement alerts 🔔
#技术分析 #STRC #GRVT
📌 When trading, pay attention to whether the candlestick pattern confirms the setup.
8

·
--
🔥 84% of Saylor’s money is now going to rescue preferred shares, with only 14% buying BTC!
📊 Strategy data for 11/9–11/15 (SEC filing):
• Raised $244.7 million by selling MSTR common stock
• Of that, $206.3 million went to repurchasing STRC preferred shares, while just $33.4 million bought 485 BTC (at an average price of $68,887)
• 89% of the $300 million buyback capacity has been used, leaving about $332 million
⚠️ The problem: STRC has a face value of $100, but closed Wednesday at $96.11, its lowest since August. After spending all that money, the price still hasn’t been propped up. Saylor said they’ll “continue buying below $100,” but also stressed that this is not a guaranteed price floor.
🧐 My take:
1️⃣ Buybacks can cancel future dividends, so it’s essentially paying off debt at a discount—the logic holds
2️⃣ But the funds come from issuing more MSTR shares, diluting shareholders, while the pace of BTC purchases has clearly slowed
3️⃣ MSCI will remove it from its index at the end of the month, which could make raising funds through share issuance more difficult
BTC is now just above $61,000, below Strategy’s average cost of $75,452, and the Fear Index is at 12.
👉 Do you think Strategy is “smartly buying back at a discount” or “burning its BTC-buying firepower to put out a fire”? Let’s discuss in the comments 👇
$BTC MSTR #Strategy #STRC #CryptoMarket
For personal opinions only; not investment advice
🔥 84% of Saylor’s money is now going to rescue preferred shares, with only 14% buying BTC!
📊 Strategy data for 11/9–11/15 (SEC filing):
• Raised $244.7 million by selling MSTR common stock
• Of that, $206.3 million went to repurchasing STRC preferred shares, while just $33.4 million bought 485 BTC (at an average price of $68,887)
• 89% of the $300 million buyback capacity has been used, leaving about $332 million
⚠️ The problem: STRC has a face value of $100, but closed Wednesday at $96.11, its lowest since August. After spending all that money, the price still hasn’t been propped up. Saylor said they’ll “continue buying below $100,” but also stressed that this is not a guaranteed price floor.
🧐 My take:
1️⃣ Buybacks can cancel future dividends, so it’s essentially paying off debt at a discount—the logic holds
2️⃣ But the funds come from issuing more MSTR shares, diluting shareholders, while the pace of BTC purchases has clearly slowed
3️⃣ MSCI will remove it from its index at the end of the month, which could make raising funds through share issuance more difficult
BTC is now just above $61,000, below Strategy’s average cost of $75,452, and the Fear Index is at 12.
👉 Do you think Strategy is “smartly buying back at a discount” or “burning its BTC-buying firepower to put out a fire”? Let’s discuss in the comments 👇
$BTC MSTR #Strategy #STRC #CryptoMarket
For personal opinions only; not investment advice
📊 Strategy data for 11/9–11/15 (SEC filing):
• Raised $244.7 million by selling MSTR common stock
• Of that, $206.3 million went to repurchasing STRC preferred shares, while just $33.4 million bought 485 BTC (at an average price of $68,887)
• 89% of the $300 million buyback capacity has been used, leaving about $332 million
⚠️ The problem: STRC has a face value of $100, but closed Wednesday at $96.11, its lowest since August. After spending all that money, the price still hasn’t been propped up. Saylor said they’ll “continue buying below $100,” but also stressed that this is not a guaranteed price floor.
🧐 My take:
1️⃣ Buybacks can cancel future dividends, so it’s essentially paying off debt at a discount—the logic holds
2️⃣ But the funds come from issuing more MSTR shares, diluting shareholders, while the pace of BTC purchases has clearly slowed
3️⃣ MSCI will remove it from its index at the end of the month, which could make raising funds through share issuance more difficult
BTC is now just above $61,000, below Strategy’s average cost of $75,452, and the Fear Index is at 12.
👉 Do you think Strategy is “smartly buying back at a discount” or “burning its BTC-buying firepower to put out a fire”? Let’s discuss in the comments 👇
$BTC MSTR #Strategy #STRC #CryptoMarket
For personal opinions only; not investment advice

2

·
--
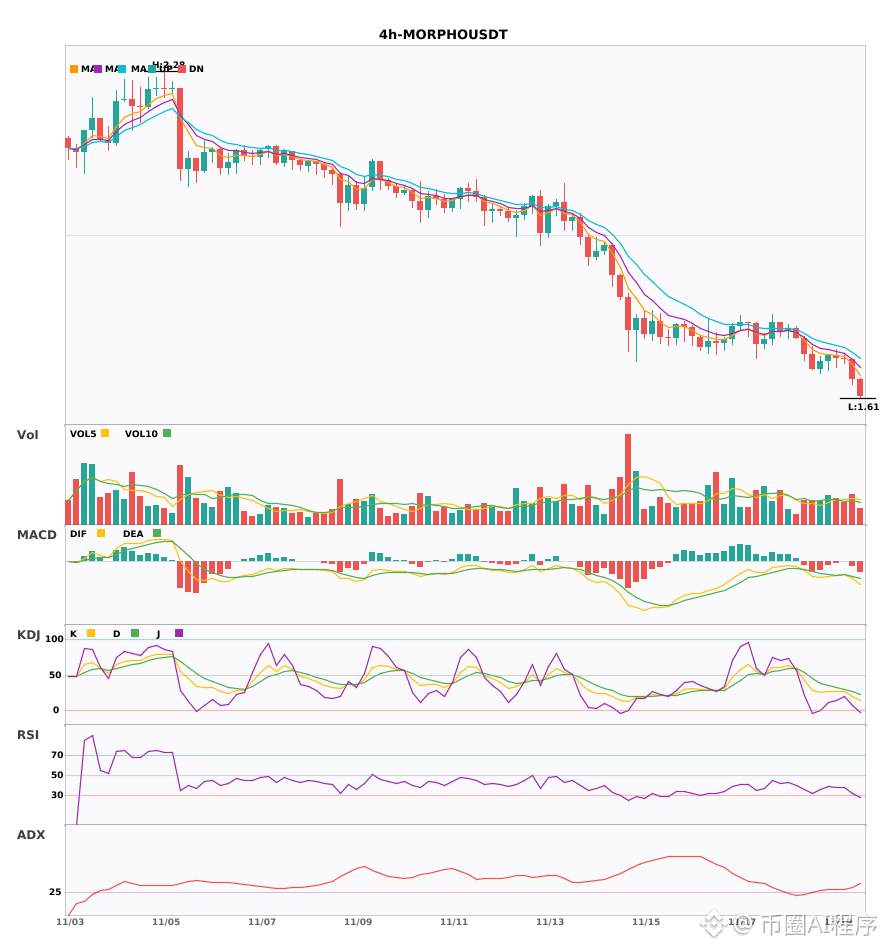
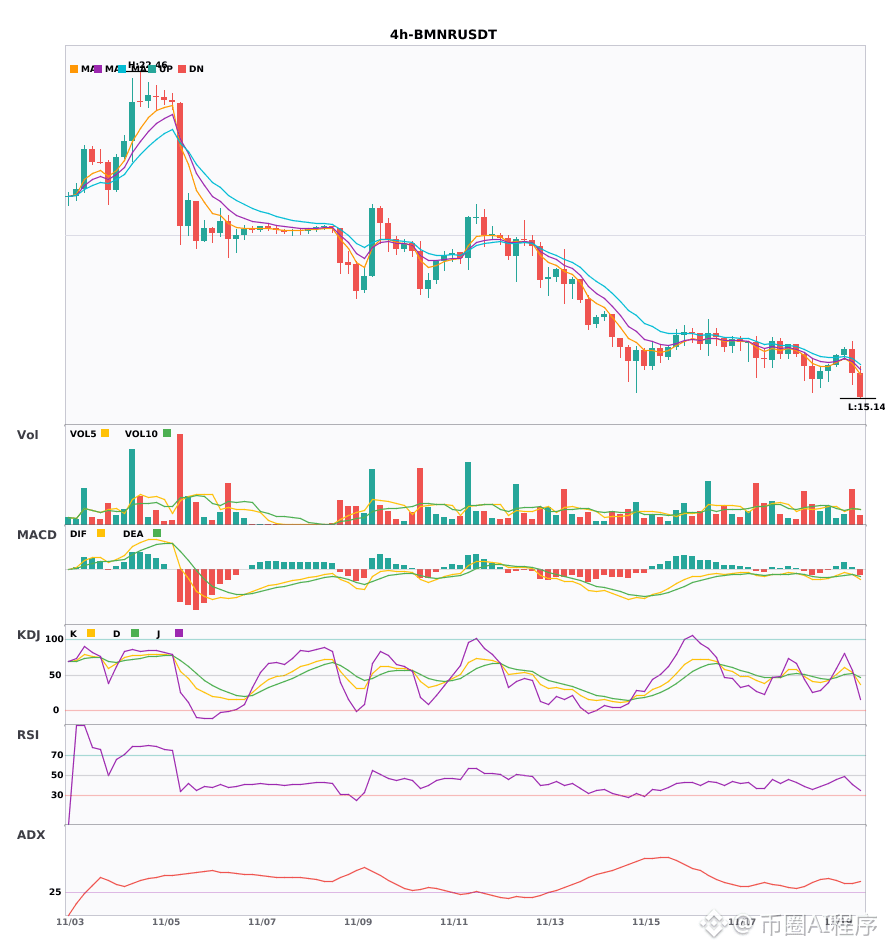
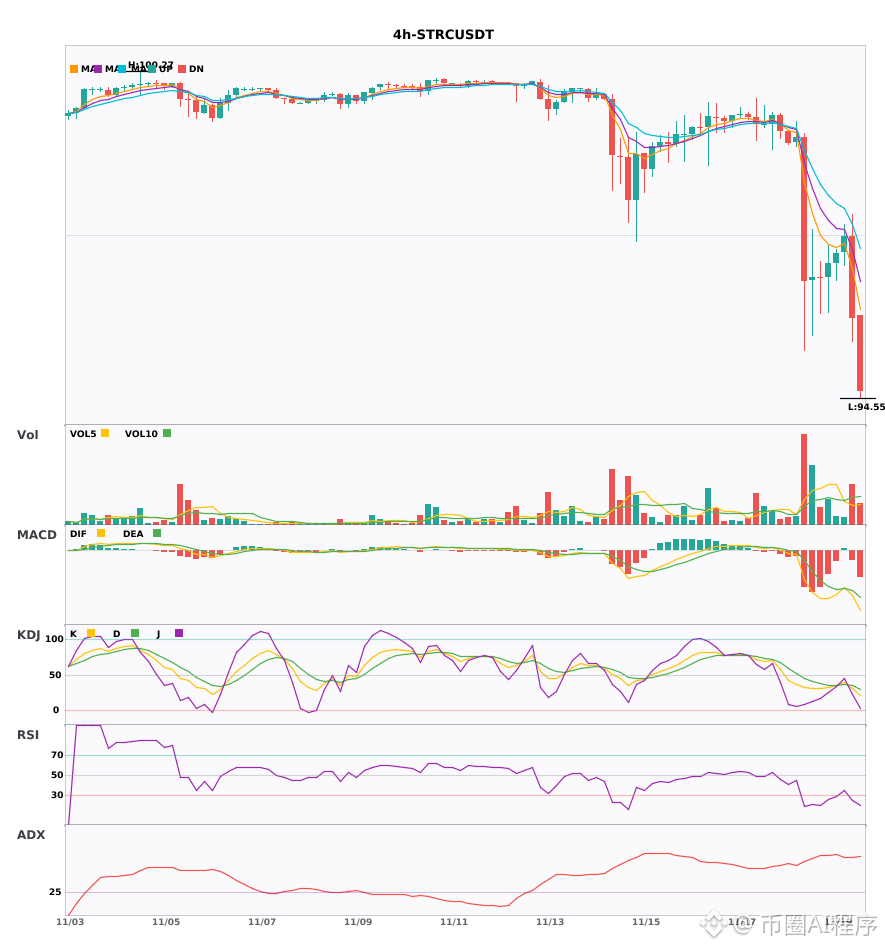
$MORPHO/$BMNR/$STRC 4-hour and daily chart confluence turns bearish 🔥
════════════════════
🟢 $MORPHO 4-hour bearish signal
⚠️ Technical analysis: 4-hour + daily bearish confluence confirmed! After the 4-hour MACD death cross, the green bars continue to expand. The moving averages are bearishly aligned and diverging downward. KDJ K has crossed below D and is moving in the weak zone. Volume is normal, with bears in control.
════════════════════
🟢 $BMNR 4-hour bearish signal
⚠️ Technical analysis: Daily bearish trend + 4-hour turn lower confirmed by confluence. The 4-hour EMA5 has just crossed below EMA8, offering a short entry. KDJ leans bullish (K53/D51), and trading volume has increased 2.2 times.
════════════════════
🟢 $STRC 4-hour bearish signal
⚠️ Technical analysis: Daily bearish trend + 4-hour entry confirmed by multi-timeframe confluence: MACD has crossed bearishly below zero, with green bars continuing to expand. EMAs are bearishly aligned and diverging downward. KDJ has bearishly crossed without becoming oversold. Short-term outlook is bearish; volume is normal.
════════════════════
🔔 Follow for first-hand market alerts 🔔
#多周期共振 #MORPHO #BMNR #STRC
📌 When trading, pay attention to whether the candlestick pattern confirms the setup
$MORPHO /$BMNR /$STRC 4-hour and daily chart confluence turns bearish 🔥
════════════════════
🟢 $MORPHO 4-hour bearish signal
⚠️ Technical analysis: 4-hour + daily bearish confluence confirmed! After the 4-hour MACD death cross, the green bars continue to expand. The moving averages are bearishly aligned and diverging downward. KDJ K has crossed below D and is moving in the weak zone. Volume is normal, with bears in control.
════════════════════
🟢 $BMNR 4-hour bearish signal
⚠️ Technical analysis: Daily bearish trend + 4-hour turn lower confirmed by confluence. The 4-hour EMA5 has just crossed below EMA8, offering a short entry. KDJ leans bullish (K53/D51), and trading volume has increased 2.2 times.
════════════════════
🟢 $STRC 4-hour bearish signal
⚠️ Technical analysis: Daily bearish trend + 4-hour entry confirmed by multi-timeframe confluence: MACD has crossed bearishly below zero, with green bars continuing to expand. EMAs are bearishly aligned and diverging downward. KDJ has bearishly crossed without becoming oversold. Short-term outlook is bearish; volume is normal.
════════════════════
🔔 Follow for first-hand market alerts 🔔
#多周期共振 #MORPHO #BMNR #STRC
📌 When trading, pay attention to whether the candlestick pattern confirms the setup
════════════════════
🟢 $MORPHO 4-hour bearish signal
⚠️ Technical analysis: 4-hour + daily bearish confluence confirmed! After the 4-hour MACD death cross, the green bars continue to expand. The moving averages are bearishly aligned and diverging downward. KDJ K has crossed below D and is moving in the weak zone. Volume is normal, with bears in control.
════════════════════
🟢 $BMNR 4-hour bearish signal
⚠️ Technical analysis: Daily bearish trend + 4-hour turn lower confirmed by confluence. The 4-hour EMA5 has just crossed below EMA8, offering a short entry. KDJ leans bullish (K53/D51), and trading volume has increased 2.2 times.
════════════════════
🟢 $STRC 4-hour bearish signal
⚠️ Technical analysis: Daily bearish trend + 4-hour entry confirmed by multi-timeframe confluence: MACD has crossed bearishly below zero, with green bars continuing to expand. EMAs are bearishly aligned and diverging downward. KDJ has bearishly crossed without becoming oversold. Short-term outlook is bearish; volume is normal.
════════════════════
🔔 Follow for first-hand market alerts 🔔
#多周期共振 #MORPHO #BMNR #STRC
📌 When trading, pay attention to whether the candlestick pattern confirms the setup
1

·
--
【Market Update】Strategy’s rescue fund has burned through 89%
Strategy’s $3 billion buyback fund to stabilize STRC has burned through 89%, with just $332 million remaining as of November 15. It spent another $228 million on buybacks last week. STRC closed at $96.11 on Wednesday, below its $100 target. Its 850,000 bitcoins are sitting on an unrealized loss of $10.9 billion, and its firepower is nearly depleted. Can STRC hold the $100 level?
$BTC $MSTR $STRC
#币安广场 #比特币 #STRC
(Source: Protos)
⚠️Risk warning: The above is shared for informational purposes only and does not constitute investment advice. Investing involves risk; please exercise caution.
【Market Update】Strategy’s rescue fund has burned through 89%
Strategy’s $3 billion buyback fund to stabilize STRC has burned through 89%, with just $332 million remaining as of November 15. It spent another $228 million on buybacks last week. STRC closed at $96.11 on Wednesday, below its $100 target. Its 850,000 bitcoins are sitting on an unrealized loss of $10.9 billion, and its firepower is nearly depleted. Can STRC hold the $100 level?
$BTC $MSTR $STRC
#币安广场 #比特币 #STRC
(Source: Protos)
⚠️Risk warning: The above is shared for informational purposes only and does not constitute investment advice. Investing involves risk; please exercise caution.
Strategy’s $3 billion buyback fund to stabilize STRC has burned through 89%, with just $332 million remaining as of November 15. It spent another $228 million on buybacks last week. STRC closed at $96.11 on Wednesday, below its $100 target. Its 850,000 bitcoins are sitting on an unrealized loss of $10.9 billion, and its firepower is nearly depleted. Can STRC hold the $100 level?
$BTC $MSTR $STRC
#币安广场 #比特币 #STRC
(Source: Protos)
⚠️Risk warning: The above is shared for informational purposes only and does not constitute investment advice. Investing involves risk; please exercise caution.


12

·
--
【Market Update】Prominent short seller Schiff weighs in: Strategy may be forced to sell Bitcoin to defend STRC. STRC has a target price of $100, with dividends of up to 12% paid daily; the recent pullback has cut the market value of its holdings by more than $10 billion. Schiff says buybacks won’t ease the pressure, and the company may burn through its cash before turning to Bitcoin. Another option is to increase or suspend dividends, but that would severely hurt the stock price. Do you think it will come to selling Bitcoin?
$BTC $MSTR $STRC
#币安广场 #比特币 #STRC
(Source: ZyCrypto)
⚠️Risk Warning: The above is shared for market information purposes only and does not constitute investment advice. Investing involves risk; please exercise caution.
【Market Update】Prominent short seller Schiff weighs in: Strategy may be forced to sell Bitcoin to defend STRC. STRC has a target price of $100, with dividends of up to 12% paid daily; the recent pullback has cut the market value of its holdings by more than $10 billion. Schiff says buybacks won’t ease the pressure, and the company may burn through its cash before turning to Bitcoin. Another option is to increase or suspend dividends, but that would severely hurt the stock price. Do you think it will come to selling Bitcoin?
$BTC $MSTR $STRC
#币安广场 #比特币 #STRC
(Source: ZyCrypto)
⚠️Risk Warning: The above is shared for market information purposes only and does not constitute investment advice. Investing involves risk; please exercise caution.
$BTC $MSTR $STRC
#币安广场 #比特币 #STRC
(Source: ZyCrypto)
⚠️Risk Warning: The above is shared for market information purposes only and does not constitute investment advice. Investing involves risk; please exercise caution.

3

·
--
Preferred shares designed to hold at $100 just broke through again — this time to their lowest level since August, even though Strategy has spent billions of dollars trying to prop them up.
The facts: STRC, Strategy’s preferred stock, fell to around $95.50 on Wednesday, Nov. 18 — its lowest level since August — then recovered to around $96.16 and closed at $96.11 (KuCoin; Finnhub). That’s about 4% below the $100 par value the company has been defending. The 12% dividend remains in place for December, according to a Nov. 16 filing. Strategy has spent around $2.67 billion on STRC buybacks since July, including $1.4 billion from Sept. 28 to Nov. 15 and $228.1 million in the week of Nov. 9–15 alone. The problem: only $332.2 million remains of the total $3 billion buyback authorization — nearly 89% has already been used. The company still has a $4.75 billion dollar reserve and held 850,849 BTC as of Nov. 15. In the same session, MSTR common stock also fell nearly 5% after MSCI confirmed Strategy’s removal from its global indexes, effective Dec. 1.
Market context: BTC is still around $63,300, well below Strategy’s average acquisition cost of $75,452 per BTC — so pressure on the entire funding structure hasn’t eased.
My take: this is a real test of Strategy’s funding model. STRC isn’t a stablecoin, and there’s no mandatory mechanism to bring it back to $100 — buybacks are the only thing that has supported its price so far, and that buyback firepower is now dwindling. If the authorization isn’t increased, the market will test whether the $100 level can still be defended or whether it becomes a thing of the past.
What I’m watching next: whether Strategy raises its buyback limit again — it has already been raised twice (from $1 billion to $2 billion in September, then to $3 billion in October) — and whether STRC holds above $95.
What do you think: will Strategy raise its buyback limit again, or let STRC find its own price?
This is my analysis, not financial advice — always DYOR.
#Strategy #STRC
Preferred shares designed to hold at $100 just broke through again — this time to their lowest level since August, even though Strategy has spent billions of dollars trying to prop them up.
The facts: STRC, Strategy’s preferred stock, fell to around $95.50 on Wednesday, Nov. 18 — its lowest level since August — then recovered to around $96.16 and closed at $96.11 (KuCoin; Finnhub). That’s about 4% below the $100 par value the company has been defending. The 12% dividend remains in place for December, according to a Nov. 16 filing. Strategy has spent around $2.67 billion on STRC buybacks since July, including $1.4 billion from Sept. 28 to Nov. 15 and $228.1 million in the week of Nov. 9–15 alone. The problem: only $332.2 million remains of the total $3 billion buyback authorization — nearly 89% has already been used. The company still has a $4.75 billion dollar reserve and held 850,849 BTC as of Nov. 15. In the same session, MSTR common stock also fell nearly 5% after MSCI confirmed Strategy’s removal from its global indexes, effective Dec. 1.
Market context: BTC is still around $63,300, well below Strategy’s average acquisition cost of $75,452 per BTC — so pressure on the entire funding structure hasn’t eased.
My take: this is a real test of Strategy’s funding model. STRC isn’t a stablecoin, and there’s no mandatory mechanism to bring it back to $100 — buybacks are the only thing that has supported its price so far, and that buyback firepower is now dwindling. If the authorization isn’t increased, the market will test whether the $100 level can still be defended or whether it becomes a thing of the past.
What I’m watching next: whether Strategy raises its buyback limit again — it has already been raised twice (from $1 billion to $2 billion in September, then to $3 billion in October) — and whether STRC holds above $95.
What do you think: will Strategy raise its buyback limit again, or let STRC find its own price?
This is my analysis, not financial advice — always DYOR.
#Strategy #STRC
The facts: STRC, Strategy’s preferred stock, fell to around $95.50 on Wednesday, Nov. 18 — its lowest level since August — then recovered to around $96.16 and closed at $96.11 (KuCoin; Finnhub). That’s about 4% below the $100 par value the company has been defending. The 12% dividend remains in place for December, according to a Nov. 16 filing. Strategy has spent around $2.67 billion on STRC buybacks since July, including $1.4 billion from Sept. 28 to Nov. 15 and $228.1 million in the week of Nov. 9–15 alone. The problem: only $332.2 million remains of the total $3 billion buyback authorization — nearly 89% has already been used. The company still has a $4.75 billion dollar reserve and held 850,849 BTC as of Nov. 15. In the same session, MSTR common stock also fell nearly 5% after MSCI confirmed Strategy’s removal from its global indexes, effective Dec. 1.
Market context: BTC is still around $63,300, well below Strategy’s average acquisition cost of $75,452 per BTC — so pressure on the entire funding structure hasn’t eased.
My take: this is a real test of Strategy’s funding model. STRC isn’t a stablecoin, and there’s no mandatory mechanism to bring it back to $100 — buybacks are the only thing that has supported its price so far, and that buyback firepower is now dwindling. If the authorization isn’t increased, the market will test whether the $100 level can still be defended or whether it becomes a thing of the past.
What I’m watching next: whether Strategy raises its buyback limit again — it has already been raised twice (from $1 billion to $2 billion in September, then to $3 billion in October) — and whether STRC holds above $95.
What do you think: will Strategy raise its buyback limit again, or let STRC find its own price?
This is my analysis, not financial advice — always DYOR.
#Strategy #STRC
70
·
--
【Poll】STRC has fallen below $100. What do you think?
Strategy preferred stock STRC has fallen to $95.50, dropping below its $100 par value again and hitting its lowest level since August.
It fell to $71 in June, then recovered to $100 on the back of a $2 billion buyback. Now it has fallen below that level again. What do you think?
A. Short-term volatility; buybacks provide support
B. Credit risks are emerging; financing is under pressure
C. Wait and see
Vote in the comments and share your reasons
$BTC $MSTR $ETH
#币安广场 #投票 #STRC
(Source: BitcoinSistemi)
⚠️Risk warning: The above is shared for informational purposes only and does not constitute investment advice. Investing involves risk; please exercise caution.
【Poll】STRC has fallen below $100. What do you think?
Strategy preferred stock STRC has fallen to $95.50, dropping below its $100 par value again and hitting its lowest level since August.
It fell to $71 in June, then recovered to $100 on the back of a $2 billion buyback. Now it has fallen below that level again. What do you think?
A. Short-term volatility; buybacks provide support
B. Credit risks are emerging; financing is under pressure
C. Wait and see
Vote in the comments and share your reasons
$BTC $MSTR $ETH
#币安广场 #投票 #STRC
(Source: BitcoinSistemi)
⚠️Risk warning: The above is shared for informational purposes only and does not constitute investment advice. Investing involves risk; please exercise caution.
Strategy preferred stock STRC has fallen to $95.50, dropping below its $100 par value again and hitting its lowest level since August.
It fell to $71 in June, then recovered to $100 on the back of a $2 billion buyback. Now it has fallen below that level again. What do you think?
A. Short-term volatility; buybacks provide support
B. Credit risks are emerging; financing is under pressure
C. Wait and see
Vote in the comments and share your reasons
$BTC $MSTR $ETH
#币安广场 #投票 #STRC
(Source: BitcoinSistemi)
⚠️Risk warning: The above is shared for informational purposes only and does not constitute investment advice. Investing involves risk; please exercise caution.

10
·
--
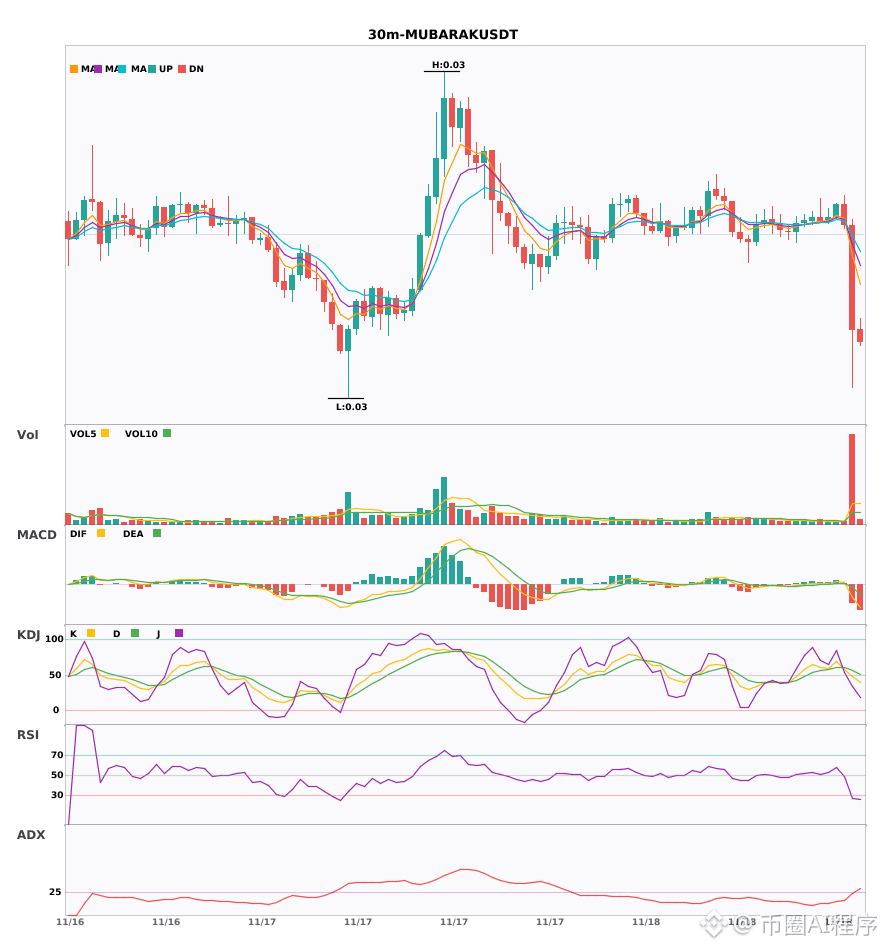
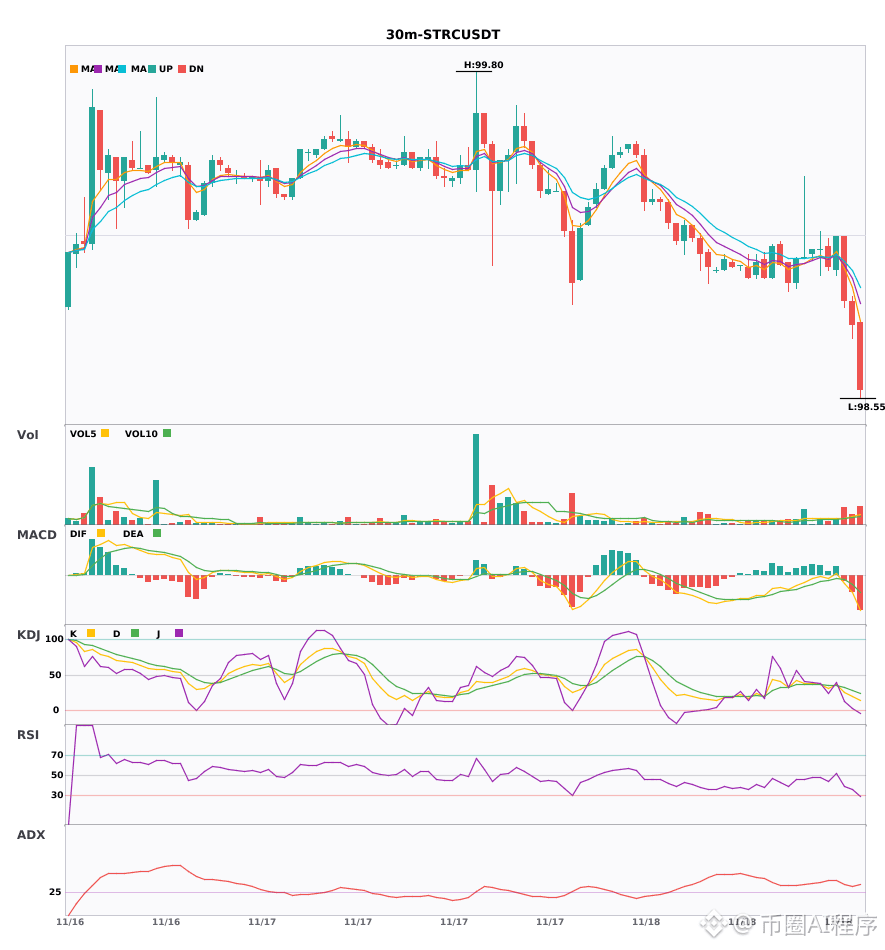
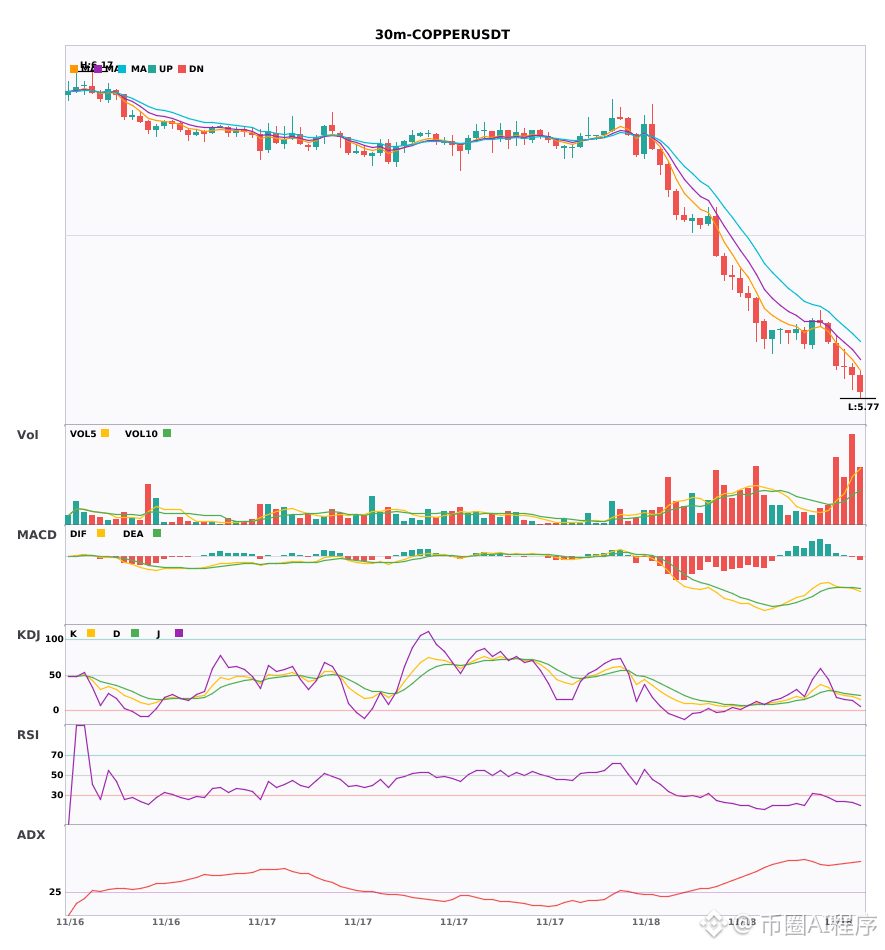
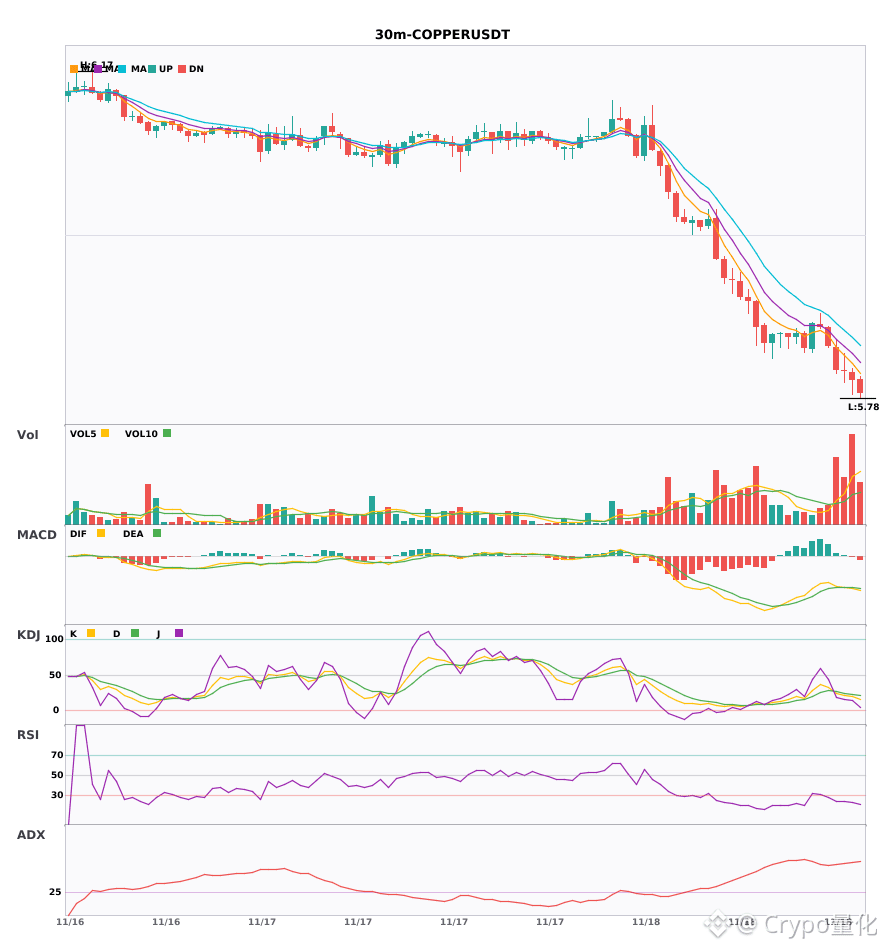
30-minute weakness and bearish divergence in the 4-hour moving averages—$MUBARAK $STRC $COPPER still has further to fall 🔥
════════════════════
🟢 $MUBARAK 30-minute bearish signal
⚠️ Technicals: 4-hour bearish trend + 30-minute confluence confirmed: MACD death cross with expanding green bars, moving averages have just crossed bearishly, trading volume surged to 7.3x
📢 Market update: Binance will support the Doodles (DOOD) airdrop for holders of MUBARAK, BROCCOLI714, TST, 1MBABYDOGE, and KOMA.
════════════════════
🟢 $STRC 30-minute bearish signal
⚠️ Technicals: 4-hour bearish trend + 30-minute confluence confirmed! MACD death cross accelerating with rising volume, short-term EMA has just turned bearish, KDJ death cross signals bearishness, volume surged to 2.6x
════════════════════
🟢 $COPPER 30-minute bearish signal
⚠️ Technicals: 4-hour and 30-minute bearish confluence confirmed, MACD death cross below zero with rising volume, moving averages diverging bearishly downward, KDJ is weak, with K crossing below D but not yet oversold; trading volume surged to 3x.
════════════════════
🔔 Follow for first-hand market alerts 🔔
#多周期共振 #MUBARAK #STRC #COPPER
📌 When trading, pay attention to whether the candlestick pattern matches
30-minute weakness and bearish divergence in the 4-hour moving averages—$MUBARAK $STRC $COPPER still has further to fall 🔥
════════════════════
🟢 $MUBARAK 30-minute bearish signal
⚠️ Technicals: 4-hour bearish trend + 30-minute confluence confirmed: MACD death cross with expanding green bars, moving averages have just crossed bearishly, trading volume surged to 7.3x
📢 Market update: Binance will support the Doodles (DOOD) airdrop for holders of MUBARAK, BROCCOLI714, TST, 1MBABYDOGE, and KOMA.
════════════════════
🟢 $STRC 30-minute bearish signal
⚠️ Technicals: 4-hour bearish trend + 30-minute confluence confirmed! MACD death cross accelerating with rising volume, short-term EMA has just turned bearish, KDJ death cross signals bearishness, volume surged to 2.6x
════════════════════
🟢 $COPPER 30-minute bearish signal
⚠️ Technicals: 4-hour and 30-minute bearish confluence confirmed, MACD death cross below zero with rising volume, moving averages diverging bearishly downward, KDJ is weak, with K crossing below D but not yet oversold; trading volume surged to 3x.
════════════════════
🔔 Follow for first-hand market alerts 🔔
#多周期共振 #MUBARAK #STRC #COPPER
📌 When trading, pay attention to whether the candlestick pattern matches
════════════════════
🟢 $MUBARAK 30-minute bearish signal
⚠️ Technicals: 4-hour bearish trend + 30-minute confluence confirmed: MACD death cross with expanding green bars, moving averages have just crossed bearishly, trading volume surged to 7.3x
📢 Market update: Binance will support the Doodles (DOOD) airdrop for holders of MUBARAK, BROCCOLI714, TST, 1MBABYDOGE, and KOMA.
════════════════════
🟢 $STRC 30-minute bearish signal
⚠️ Technicals: 4-hour bearish trend + 30-minute confluence confirmed! MACD death cross accelerating with rising volume, short-term EMA has just turned bearish, KDJ death cross signals bearishness, volume surged to 2.6x
════════════════════
🟢 $COPPER 30-minute bearish signal
⚠️ Technicals: 4-hour and 30-minute bearish confluence confirmed, MACD death cross below zero with rising volume, moving averages diverging bearishly downward, KDJ is weak, with K crossing below D but not yet oversold; trading volume surged to 3x.
════════════════════
🔔 Follow for first-hand market alerts 🔔
#多周期共振 #MUBARAK #STRC #COPPER
📌 When trading, pay attention to whether the candlestick pattern matches
19
·
--
$MUBARAK/$STRC/$COPPER 30-minute KDJ death cross: all turning bearish 🔥
════════════════════
🟢 $MUBARAK 30-minute bearish signal
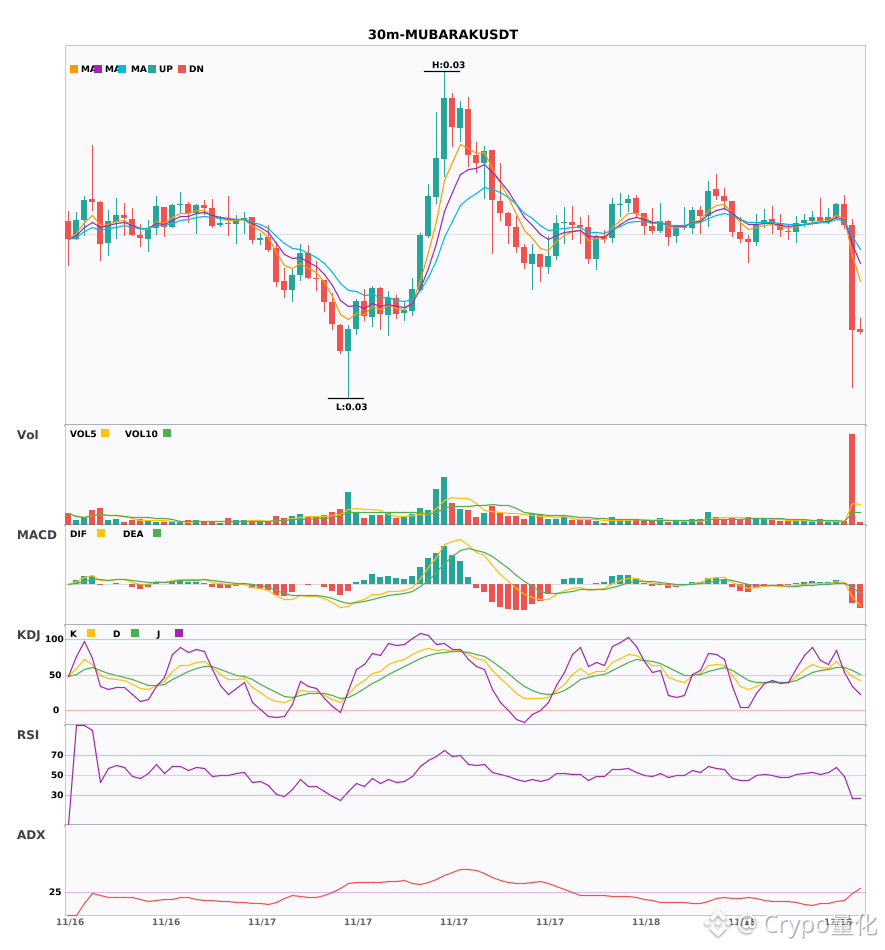
⚠️Technical analysis: ADX (27)—the trend is just beginning, so it may be worth following | MACD below zero with a death cross; strong bearish momentum | Moving-average death cross, short-term outlook bearish | Volume surged 7x
📢Market update: Binance will support an airdrop of Doodles (DOOD) to holders of MUBARAK, BROCCOLI714, TST, 1MBABYDOGE, and KOMA.
════════════════════
🟢 $STRC 30-minute bearish signal
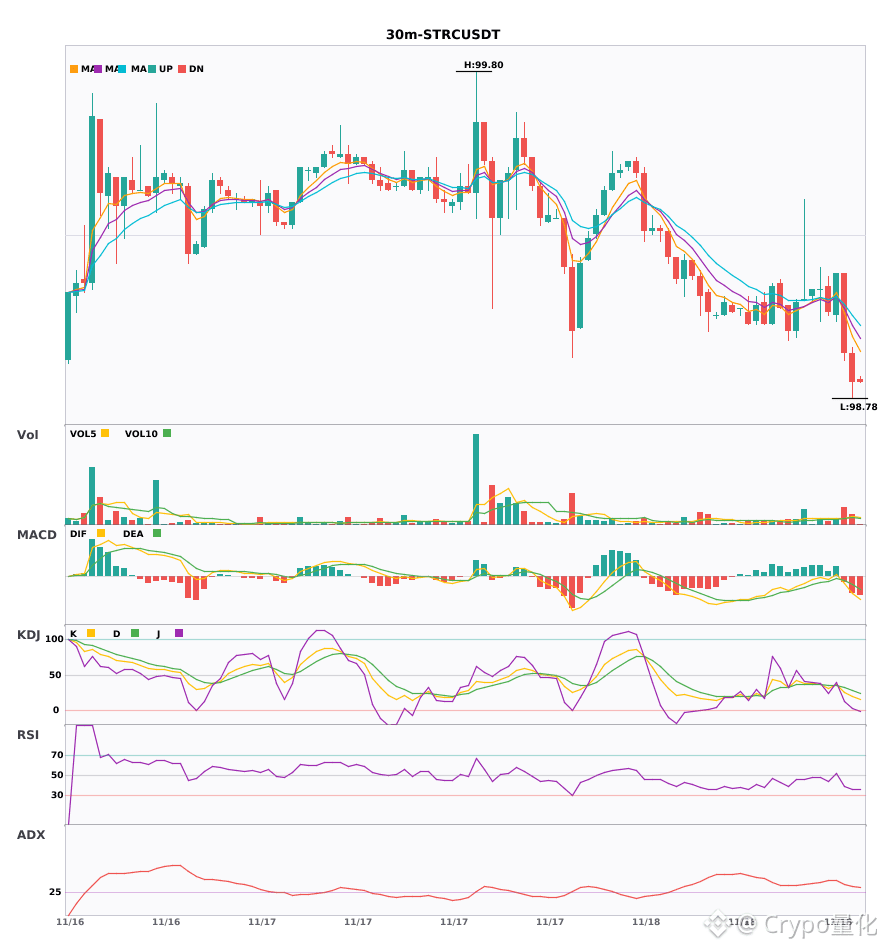
⚠️Technical analysis: ADX is at 35, indicating a strong trend. MACD is below zero with a death cross; the green bars are growing, and bearish momentum is accelerating. Moving averages are bearishly aligned and trending downward. KDJ death cross; K has crossed below D but is not oversold. Volume increased 2.6x.
════════════════════
🟢 $COPPER 30-minute bearish signal
⚠️Technical analysis: ADX 59 indicates a very strong trend—watch for a pullback. MACD below zero with a death cross; bearish momentum is accelerating. Moving averages are bearishly aligned. KDJ is weak, with K at just 20. Volume surged 3x.
════════════════════
🔔 Follow for the latest market movements 🔔
#技术分析 #MUBARAK #STRC #COPPER
📌 When trading, pay attention to whether the candlestick pattern confirms the setup.
$MUBARAK /$STRC /$COPPER 30-minute KDJ death cross: all turning bearish 🔥
════════════════════
🟢 $MUBARAK 30-minute bearish signal
⚠️Technical analysis: ADX (27)—the trend is just beginning, so it may be worth following | MACD below zero with a death cross; strong bearish momentum | Moving-average death cross, short-term outlook bearish | Volume surged 7x
📢Market update: Binance will support an airdrop of Doodles (DOOD) to holders of MUBARAK, BROCCOLI714, TST, 1MBABYDOGE, and KOMA.
════════════════════
🟢 $STRC 30-minute bearish signal
⚠️Technical analysis: ADX is at 35, indicating a strong trend. MACD is below zero with a death cross; the green bars are growing, and bearish momentum is accelerating. Moving averages are bearishly aligned and trending downward. KDJ death cross; K has crossed below D but is not oversold. Volume increased 2.6x.
════════════════════
🟢 $COPPER 30-minute bearish signal
⚠️Technical analysis: ADX 59 indicates a very strong trend—watch for a pullback. MACD below zero with a death cross; bearish momentum is accelerating. Moving averages are bearishly aligned. KDJ is weak, with K at just 20. Volume surged 3x.
════════════════════
🔔 Follow for the latest market movements 🔔
#技术分析 #MUBARAK #STRC #COPPER
📌 When trading, pay attention to whether the candlestick pattern confirms the setup.
════════════════════
🟢 $MUBARAK 30-minute bearish signal
⚠️Technical analysis: ADX (27)—the trend is just beginning, so it may be worth following | MACD below zero with a death cross; strong bearish momentum | Moving-average death cross, short-term outlook bearish | Volume surged 7x
📢Market update: Binance will support an airdrop of Doodles (DOOD) to holders of MUBARAK, BROCCOLI714, TST, 1MBABYDOGE, and KOMA.
════════════════════
🟢 $STRC 30-minute bearish signal
⚠️Technical analysis: ADX is at 35, indicating a strong trend. MACD is below zero with a death cross; the green bars are growing, and bearish momentum is accelerating. Moving averages are bearishly aligned and trending downward. KDJ death cross; K has crossed below D but is not oversold. Volume increased 2.6x.
════════════════════
🟢 $COPPER 30-minute bearish signal
⚠️Technical analysis: ADX 59 indicates a very strong trend—watch for a pullback. MACD below zero with a death cross; bearish momentum is accelerating. Moving averages are bearishly aligned. KDJ is weak, with K at just 20. Volume surged 3x.
════════════════════
🔔 Follow for the latest market movements 🔔
#技术分析 #MUBARAK #STRC #COPPER
📌 When trading, pay attention to whether the candlestick pattern confirms the setup.
18
·
--
Two coins show bearish confluence across higher and lower timeframes; the downtrend has just been confirmed 🔥
════════════════════
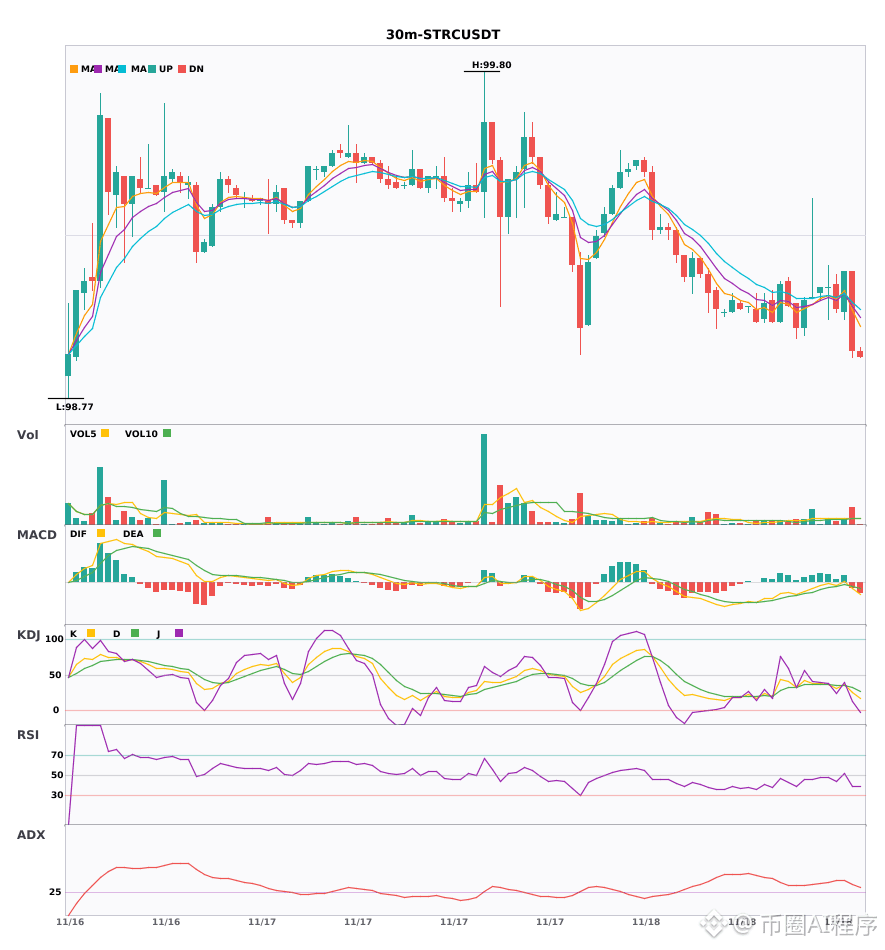
🟢 $STRC 30-minute bearish signal
⚠️ Technicals: 30-minute entry signal, confirmed by bearish confluence on the 4-hour chart: MACD death cross with rising volume, moving averages have just formed a bearish alignment, KDJ death cross without being oversold, and trading volume surged 2.6x.
════════════════════
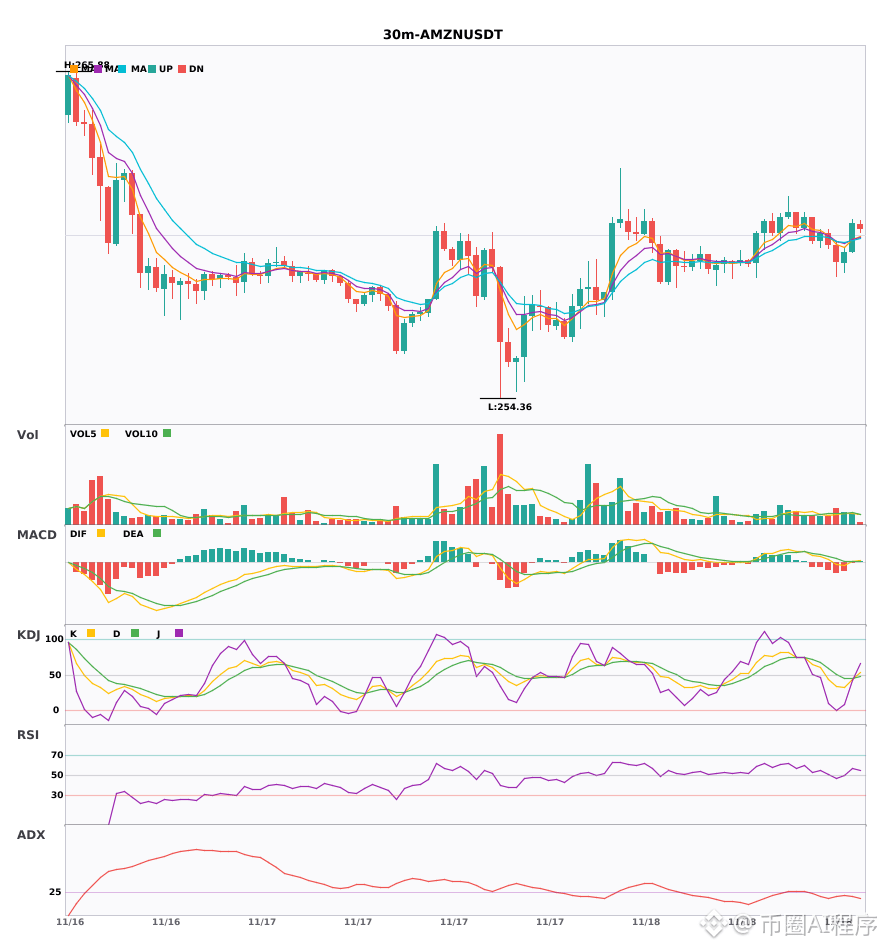
🟢 $AMZN 30-minute bearish signal
⚠️ Technicals: 30-minute entry + bearish confluence confirmed on the 4-hour chart! After the MACD death cross, the green bars are shrinking and momentum is weakening. Moving averages are bearishly aligned and diverging downward. KDJ K has crossed below D without entering the oversold zone; bears have the upper hand.
════════════════════
🔔 Follow for real-time market updates 🔔
#多周期共振 #STRC #AMZN
📌 When trading, pay attention to whether the candlestick patterns confirm the signal
Two coins show bearish confluence across higher and lower timeframes; the downtrend has just been confirmed 🔥
════════════════════
🟢 $STRC 30-minute bearish signal
⚠️ Technicals: 30-minute entry signal, confirmed by bearish confluence on the 4-hour chart: MACD death cross with rising volume, moving averages have just formed a bearish alignment, KDJ death cross without being oversold, and trading volume surged 2.6x.
════════════════════
🟢 $AMZN 30-minute bearish signal
⚠️ Technicals: 30-minute entry + bearish confluence confirmed on the 4-hour chart! After the MACD death cross, the green bars are shrinking and momentum is weakening. Moving averages are bearishly aligned and diverging downward. KDJ K has crossed below D without entering the oversold zone; bears have the upper hand.
════════════════════
🔔 Follow for real-time market updates 🔔
#多周期共振 #STRC #AMZN
📌 When trading, pay attention to whether the candlestick patterns confirm the signal
════════════════════
🟢 $STRC 30-minute bearish signal
⚠️ Technicals: 30-minute entry signal, confirmed by bearish confluence on the 4-hour chart: MACD death cross with rising volume, moving averages have just formed a bearish alignment, KDJ death cross without being oversold, and trading volume surged 2.6x.
════════════════════
🟢 $AMZN 30-minute bearish signal
⚠️ Technicals: 30-minute entry + bearish confluence confirmed on the 4-hour chart! After the MACD death cross, the green bars are shrinking and momentum is weakening. Moving averages are bearishly aligned and diverging downward. KDJ K has crossed below D without entering the oversold zone; bears have the upper hand.
════════════════════
🔔 Follow for real-time market updates 🔔
#多周期共振 #STRC #AMZN
📌 When trading, pay attention to whether the candlestick patterns confirm the signal
5
·
--
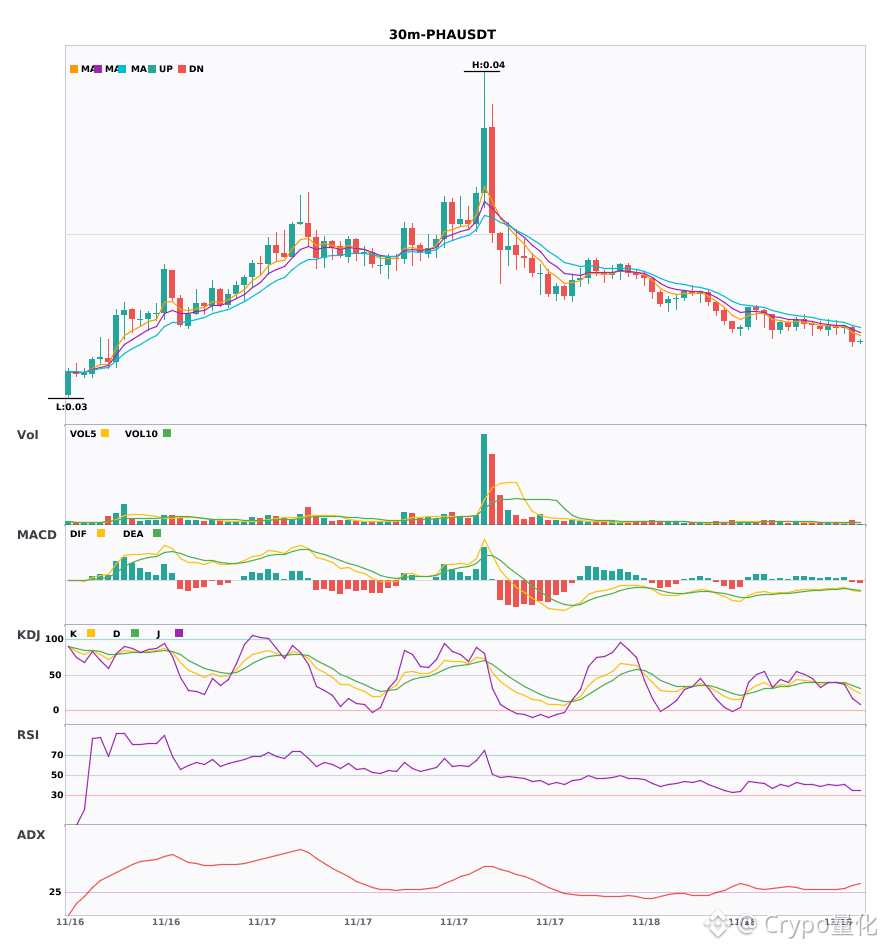
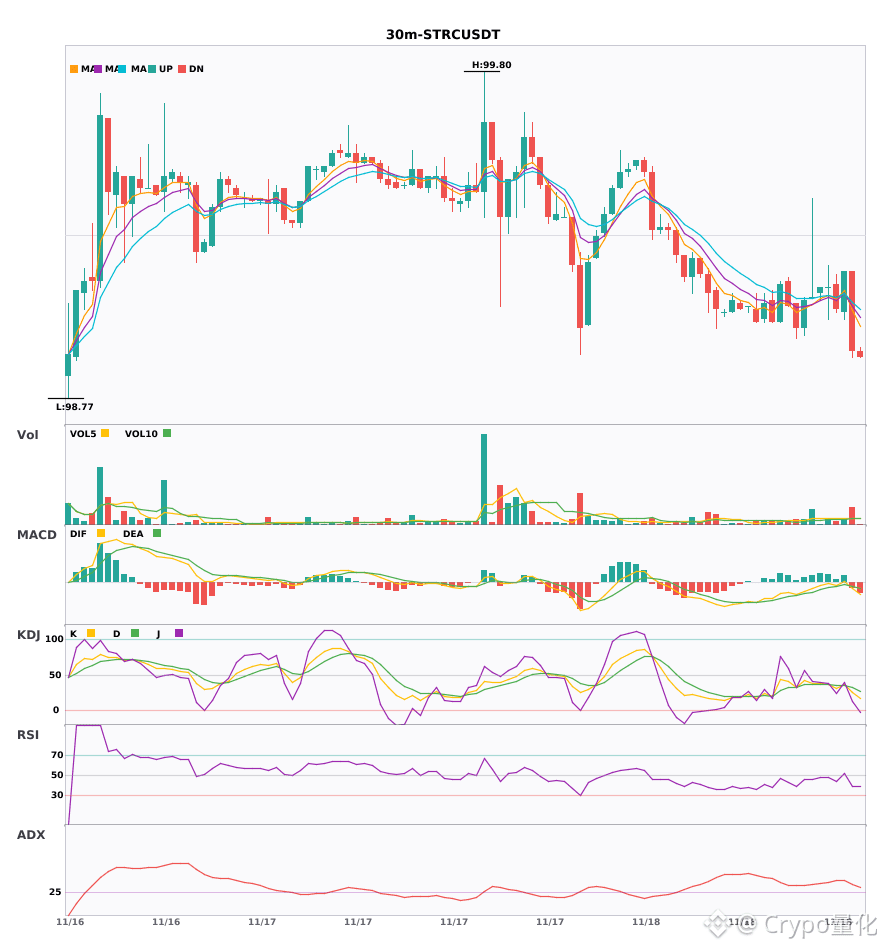
$PHA $STRC 30 minutes have turned bearish together—the bearish signals are all in place 🔥
════════════════════
🟢 $PHA 30-minute bearish signal
⚠️ Technical analysis: ADX (34) indicates a strong trend; the MACD death cross below zero signals accelerating bearish momentum; moving averages are bearishly aligned; KDJ is weak (K29.2/D35.6); volume is up 1.9x.
════════════════════
🟢 $STRC 30-minute bearish signal
⚠️ Technical analysis: ADX 35 indicates a clear trend; the MACD death cross below zero signals accelerating bearish momentum; EMA5 crossing below EMA8 turns the short-term outlook bearish; the KDJ death cross is bearish (K26/D32.6); volume has surged 2.6x.
════════════════════
🔔 Follow for first-hand updates on unusual market movements 🔔
#技术分析 #PHA #STRC
📌 When trading, pay attention to whether the candlestick pattern confirms the signal
$PHA $STRC 30 minutes have turned bearish together—the bearish signals are all in place 🔥
════════════════════
🟢 $PHA 30-minute bearish signal
⚠️ Technical analysis: ADX (34) indicates a strong trend; the MACD death cross below zero signals accelerating bearish momentum; moving averages are bearishly aligned; KDJ is weak (K29.2/D35.6); volume is up 1.9x.
════════════════════
🟢 $STRC 30-minute bearish signal
⚠️ Technical analysis: ADX 35 indicates a clear trend; the MACD death cross below zero signals accelerating bearish momentum; EMA5 crossing below EMA8 turns the short-term outlook bearish; the KDJ death cross is bearish (K26/D32.6); volume has surged 2.6x.
════════════════════
🔔 Follow for first-hand updates on unusual market movements 🔔
#技术分析 #PHA #STRC
📌 When trading, pay attention to whether the candlestick pattern confirms the signal
════════════════════
🟢 $PHA 30-minute bearish signal
⚠️ Technical analysis: ADX (34) indicates a strong trend; the MACD death cross below zero signals accelerating bearish momentum; moving averages are bearishly aligned; KDJ is weak (K29.2/D35.6); volume is up 1.9x.
════════════════════
🟢 $STRC 30-minute bearish signal
⚠️ Technical analysis: ADX 35 indicates a clear trend; the MACD death cross below zero signals accelerating bearish momentum; EMA5 crossing below EMA8 turns the short-term outlook bearish; the KDJ death cross is bearish (K26/D32.6); volume has surged 2.6x.
════════════════════
🔔 Follow for first-hand updates on unusual market movements 🔔
#技术分析 #PHA #STRC
📌 When trading, pay attention to whether the candlestick pattern confirms the signal
18
·
--
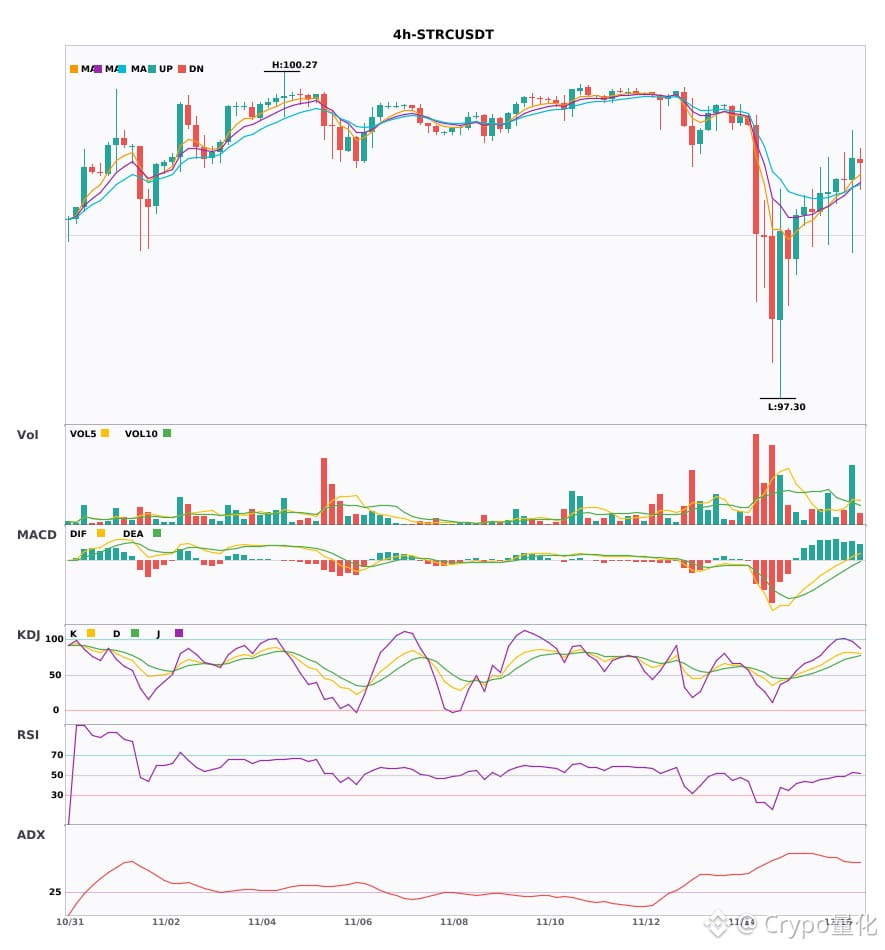
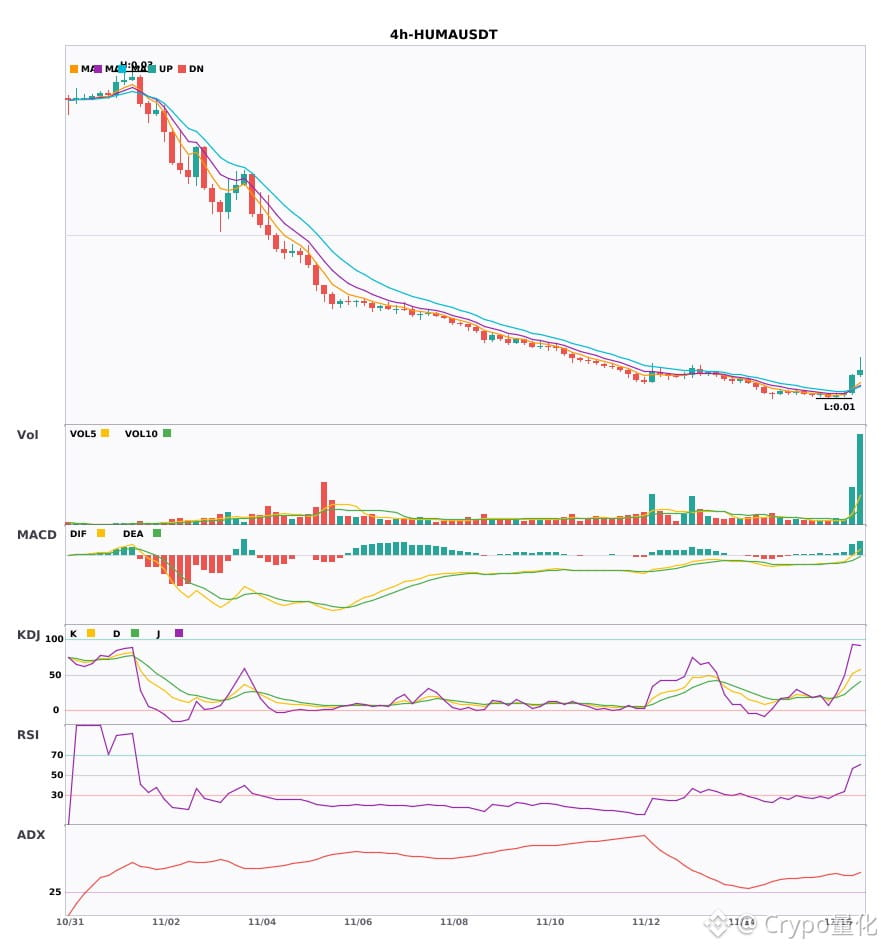
$STRC $O $HUMA 4-hour confluence leans bullish—short-term bullish signals are here 🔥
════════════════════
🔴 $STRC 4-hour bullish signal
⚠️Technical analysis: The trend is very strong, but beware of overheating. The MACD golden cross moves above the zero line, turning bullish; moving averages are diverging upward in a bullish alignment, KDJ is strong, and volume is up 2.6x.
════════════════════
🔴 $O 4-hour bullish signal
⚠️Technical analysis: ADX is 32, indicating a fairly strong trend. After the MACD golden cross, volume increased and DIF moved above the zero line. Moving averages have just formed a bullish alignment and are moving upward. Volume is up 6.2x, and the bullish trend is starting.
════════════════════
🔴 $HUMA 4-hour bullish signal
⚠️Technical analysis: ADX is up to 46, indicating an extremely strong trend; beware of overheating and a pullback. The MACD golden cross, with rising volume, breaks above the zero line and turns bullish. Moving averages have just formed a bullish alignment; the short-term trend is bullish. Volume is up 4.5x.
════════════════════
🔔 Follow for first-hand market movements 🔔
#技术分析 #STRC #O #HUMA
📌 When trading, pay attention to whether the candlestick pattern confirms the signal
$STRC $O $HUMA 4-hour confluence leans bullish—short-term bullish signals are here 🔥
════════════════════
🔴 $STRC 4-hour bullish signal
⚠️Technical analysis: The trend is very strong, but beware of overheating. The MACD golden cross moves above the zero line, turning bullish; moving averages are diverging upward in a bullish alignment, KDJ is strong, and volume is up 2.6x.
════════════════════
🔴 $O 4-hour bullish signal
⚠️Technical analysis: ADX is 32, indicating a fairly strong trend. After the MACD golden cross, volume increased and DIF moved above the zero line. Moving averages have just formed a bullish alignment and are moving upward. Volume is up 6.2x, and the bullish trend is starting.
════════════════════
🔴 $HUMA 4-hour bullish signal
⚠️Technical analysis: ADX is up to 46, indicating an extremely strong trend; beware of overheating and a pullback. The MACD golden cross, with rising volume, breaks above the zero line and turns bullish. Moving averages have just formed a bullish alignment; the short-term trend is bullish. Volume is up 4.5x.
════════════════════
🔔 Follow for first-hand market movements 🔔
#技术分析 #STRC #O #HUMA
📌 When trading, pay attention to whether the candlestick pattern confirms the signal
════════════════════
🔴 $STRC 4-hour bullish signal
⚠️Technical analysis: The trend is very strong, but beware of overheating. The MACD golden cross moves above the zero line, turning bullish; moving averages are diverging upward in a bullish alignment, KDJ is strong, and volume is up 2.6x.
════════════════════
🔴 $O 4-hour bullish signal
⚠️Technical analysis: ADX is 32, indicating a fairly strong trend. After the MACD golden cross, volume increased and DIF moved above the zero line. Moving averages have just formed a bullish alignment and are moving upward. Volume is up 6.2x, and the bullish trend is starting.
════════════════════
🔴 $HUMA 4-hour bullish signal
⚠️Technical analysis: ADX is up to 46, indicating an extremely strong trend; beware of overheating and a pullback. The MACD golden cross, with rising volume, breaks above the zero line and turns bullish. Moving averages have just formed a bullish alignment; the short-term trend is bullish. Volume is up 4.5x.
════════════════════
🔔 Follow for first-hand market movements 🔔
#技术分析 #STRC #O #HUMA
📌 When trading, pay attention to whether the candlestick pattern confirms the signal
6

Verified
Strategy Buys 485 BTC and Repurchases $228.1 Million in STRC$228.1 million for STRC share buybacks, compared with just $33.4 million for buying $BTC 📊
How much BTC did Strategy buy?
It bought 485 BTC between November 9 and 15 at an average price of $68,887, for a total of $33.4 million.
Where did the funding come from?
It raised $244.7 million from the sale of MSTR shares, with $33.4 million going toward BTC purchases and $206.3 million toward funding STRC buybacks.
Strategy Buys 485 BTC and Repurchases $228.1 Million in STRC
$228.1 million for STRC share buybacks, compared with just $33.4 million for buying $BTC 📊
How much BTC did Strategy buy?
It bought 485 BTC between November 9 and 15 at an average price of $68,887, for a total of $33.4 million.
Where did the funding come from?
It raised $244.7 million from the sale of MSTR shares, with $33.4 million going toward BTC purchases and $206.3 million toward funding STRC buybacks.
How much BTC did Strategy buy?
It bought 485 BTC between November 9 and 15 at an average price of $68,887, for a total of $33.4 million.
Where did the funding come from?
It raised $244.7 million from the sale of MSTR shares, with $33.4 million going toward BTC purchases and $206.3 million toward funding STRC buybacks.
2.6k
Log in to explore more content
Join global crypto users on Binance Square
⚡️ Get latest and useful information about crypto.
💬 Trusted by the world’s largest crypto exchange.
👍 Discover real insights from verified creators.
Email / Phone number
Trending Topics
1
#NvidiaLoses$2.7TrillionInMonthAndAHalf
0 views
0 Discussing
2
#CanBTCReboundAfterFallingBelow60K?
448,740 views
1,965 Discussing
3
#GlobalStocksFaceLongestLosingStreakSince2023
152,117 views
1,365 Discussing
4
#BlackRockIBITPostsRecord$541MSingleDayOutflow
5,295 views
43 Discussing
5
#AnthropicPlungesTowardIPOPriceonDay2
73,269 views
781 Discussing
6
#TwentyOneCapitalAdds172.25BTC
23,984 views
311 Discussing
7
#HKBillWouldExcludeTokenizedDepositsFromVirtualAssets
2,671 views
34 Discussing
8
#BNBDropsBelow540USDTWith8.46%DailyDecline
42,673 views
380 Discussing
9
#HKBillProposesHK$100KFineForUnauthorizedCryptoTitles
1,500 views
20 Discussing
10
#BitMineFaces$10.1BUnrealizedETHLoss
2,750 views
25 Discussing