
#amzn
amzn
92,840 views
1,341 Discussing
Hot
Latest

·
--
🔻 $AMZN SHORT 🔻
Entry: 248.86 – 250.36
SL: 253.56
TP1: 246.22
TP2: 243.97
TP3: 241.15
📈 Technical Outlook:
$AMZN is showing bearish pressure after losing strength near a key technical zone. The setup is supported by EMA trend is bearish, price is breaking below recent support, RSI supports bearish momentum. As long as price stays below the entry area, sellers may continue pushing toward the listed downside targets.
#AMZN #Crypto #BinanceSquare #Trading
🔻 $AMZN SHORT 🔻
Entry: 248.86 – 250.36
SL: 253.56
TP1: 246.22
TP2: 243.97
TP3: 241.15
📈 Technical Outlook:
$AMZN is showing bearish pressure after losing strength near a key technical zone. The setup is supported by EMA trend is bearish, price is breaking below recent support, RSI supports bearish momentum. As long as price stays below the entry area, sellers may continue pushing toward the listed downside targets.
#AMZN #Crypto #BinanceSquare #Trading
Entry: 248.86 – 250.36
SL: 253.56
TP1: 246.22
TP2: 243.97
TP3: 241.15
📈 Technical Outlook:
$AMZN is showing bearish pressure after losing strength near a key technical zone. The setup is supported by EMA trend is bearish, price is breaking below recent support, RSI supports bearish momentum. As long as price stays below the entry area, sellers may continue pushing toward the listed downside targets.
#AMZN #Crypto #BinanceSquare #Trading

3

·
--
📉 AMZNB Bearish, 253 USDT Is the Key Level Right Now
At 7:03 a.m. Eastern Time on Nov. 20, Binance AMZNB/USDT spot was trading at 253.74, down 7.45% over 24 hours, with trading volume of about $1.85 million, a 0.27% premium to Amazon’s premarket reference price of $253.06. Market snapshot (https://stocknas.com/id/stock/AMZN)
Amazon closed down 3.87% on Thursday. Anthropic’s IPO failed to ease selling pressure on AI stocks, and Nasdaq 100 futures were weaker before the market open. Amazon quote (https://stockmarketwatch.com/stock/AMZN/premarket) · Reuters (https://www.investing.com/news/economy-news/wall-st-futures-slip-as-anthropic-debut-fails-to-reassure-ai-investors-5041171)
Bearish over the next 4–24 hours, with 253 USDT likely to be tested first. If it breaks below that level, the next target is the 250 round-number level. Resistance on a rebound is at 254.3–255.7 USDT. The bearish outlook is invalidated if price breaks above 255.7 on strong volume and the underlying stock stabilizes after the open. Watch for the University of Michigan’s final consumer sentiment reading, due at 10 a.m. Eastern Time. Spot range (https://coinalyze.net/markets/?exchange=A\u0026page=37) · Data calendar (https://data.sca.isr.umich.edu/fetchdoc.php?docid=79628)
#AMZNB #AMZN #美股 #RWA
📉 AMZNB Bearish, 253 USDT Is the Key Level Right Now
At 7:03 a.m. Eastern Time on Nov. 20, Binance AMZNB/USDT spot was trading at 253.74, down 7.45% over 24 hours, with trading volume of about $1.85 million, a 0.27% premium to Amazon’s premarket reference price of $253.06. Market snapshot (https://stocknas.com/id/stock/AMZN)
Amazon closed down 3.87% on Thursday. Anthropic’s IPO failed to ease selling pressure on AI stocks, and Nasdaq 100 futures were weaker before the market open. Amazon quote (https://stockmarketwatch.com/stock/AMZN/premarket) · Reuters (https://www.investing.com/news/economy-news/wall-st-futures-slip-as-anthropic-debut-fails-to-reassure-ai-investors-5041171)
Bearish over the next 4–24 hours, with 253 USDT likely to be tested first. If it breaks below that level, the next target is the 250 round-number level. Resistance on a rebound is at 254.3–255.7 USDT. The bearish outlook is invalidated if price breaks above 255.7 on strong volume and the underlying stock stabilizes after the open. Watch for the University of Michigan’s final consumer sentiment reading, due at 10 a.m. Eastern Time. Spot range (https://coinalyze.net/markets/?exchange=A\u0026page=37) · Data calendar (https://data.sca.isr.umich.edu/fetchdoc.php?docid=79628)
#AMZNB #AMZN #美股 #RWA
At 7:03 a.m. Eastern Time on Nov. 20, Binance AMZNB/USDT spot was trading at 253.74, down 7.45% over 24 hours, with trading volume of about $1.85 million, a 0.27% premium to Amazon’s premarket reference price of $253.06. Market snapshot (https://stocknas.com/id/stock/AMZN)
Amazon closed down 3.87% on Thursday. Anthropic’s IPO failed to ease selling pressure on AI stocks, and Nasdaq 100 futures were weaker before the market open. Amazon quote (https://stockmarketwatch.com/stock/AMZN/premarket) · Reuters (https://www.investing.com/news/economy-news/wall-st-futures-slip-as-anthropic-debut-fails-to-reassure-ai-investors-5041171)
Bearish over the next 4–24 hours, with 253 USDT likely to be tested first. If it breaks below that level, the next target is the 250 round-number level. Resistance on a rebound is at 254.3–255.7 USDT. The bearish outlook is invalidated if price breaks above 255.7 on strong volume and the underlying stock stabilizes after the open. Watch for the University of Michigan’s final consumer sentiment reading, due at 10 a.m. Eastern Time. Spot range (https://coinalyze.net/markets/?exchange=A\u0026page=37) · Data calendar (https://data.sca.isr.umich.edu/fetchdoc.php?docid=79628)
#AMZNB #AMZN #美股 #RWA

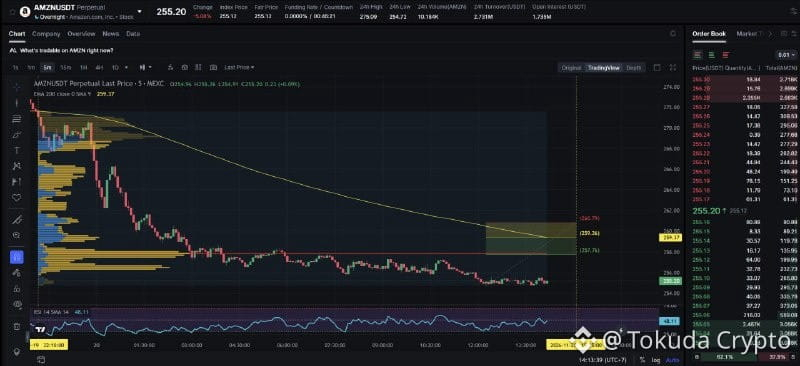
Don't rush to catch the bottom $AMZN right now! The SC02 M5 structure is revealing an ideal Short entry at HVN, with a wide 0.55% resistance zone. The downtrend has lasted 16h5m, with a maximum range of 6.22%; no strong rebound opportunity has emerged yet.
What do you think, everyone—has this crash hit the bottom at $2.7T yet, or is there more downside?
#AMZN #BinanceSquare #CryptoTrading #Short
Don't rush to catch the bottom $AMZN right now! The SC02 M5 structure is revealing an ideal Short entry at HVN, with a wide 0.55% resistance zone. The downtrend has lasted 16h5m, with a maximum range of 6.22%; no strong rebound opportunity has emerged yet.
What do you think, everyone—has this crash hit the bottom at $2.7T yet, or is there more downside?
#AMZN #BinanceSquare #CryptoTrading #Short
What do you think, everyone—has this crash hit the bottom at $2.7T yet, or is there more downside?
#AMZN #BinanceSquare #CryptoTrading #Short
3
·
--
📉 AMZNB short-term bearish; 256.5 is the first key level
The Binance spot snapshot shows 257.39 USDT. The token is down about 3.8% across the market over 24 hours, with trading volume of around $7.9 million, and its price is near the bottom of its range. Amazon shares fell 3.87% on heavy volume on November 19, closing at $257.37; in after-hours trading, they briefly dipped to $256. Binance (https://www.binance.com/en/trade/AMZNB_USDT) · CoinMarketCap (https://coinmarketcap.com/currencies/amazon-tokenized-bstocks/) · U.S. stock quotes (https://finance.yahoo.com/quote/AMZN/?p=AMZN)
Anthropic shares rose on their first day of trading, while tech stocks remained under pressure. Nasdaq futures briefly fell about 0.7% during the Asian session. The outlook for the next 4–24 hours is bearish, with a likely retest of the lows after any rebound stalls. Reuters (https://www.investing.com/news/economy-news/asian-shares-head-for-worst-week-since-2020-as-ai-trade-gloom-fails-to-abate-5040496)
On Binance, a break below 256.5 USDT points to 254.5; the first rebound target is 258.5. A sustained move above 261.4 on rising volume would invalidate the bearish outlook. The final University of Michigan consumer sentiment reading, due at 23:00 Beijing time tonight, could amplify volatility. Spot range (https://www.cexscan.com/coin-summary?symbol=AMZNB) · Seven-day market data (https://coinalyze.net/markets/?exchange=A.&page=37) · Data calendar (https://www.sca.isr.umich.edu/)
#AMZNB #AMZN #美股 #RWA
📉 AMZNB short-term bearish; 256.5 is the first key level
The Binance spot snapshot shows 257.39 USDT. The token is down about 3.8% across the market over 24 hours, with trading volume of around $7.9 million, and its price is near the bottom of its range. Amazon shares fell 3.87% on heavy volume on November 19, closing at $257.37; in after-hours trading, they briefly dipped to $256. Binance (https://www.binance.com/en/trade/AMZNB_USDT) · CoinMarketCap (https://coinmarketcap.com/currencies/amazon-tokenized-bstocks/) · U.S. stock quotes (https://finance.yahoo.com/quote/AMZN/?p=AMZN)
Anthropic shares rose on their first day of trading, while tech stocks remained under pressure. Nasdaq futures briefly fell about 0.7% during the Asian session. The outlook for the next 4–24 hours is bearish, with a likely retest of the lows after any rebound stalls. Reuters (https://www.investing.com/news/economy-news/asian-shares-head-for-worst-week-since-2020-as-ai-trade-gloom-fails-to-abate-5040496)
On Binance, a break below 256.5 USDT points to 254.5; the first rebound target is 258.5. A sustained move above 261.4 on rising volume would invalidate the bearish outlook. The final University of Michigan consumer sentiment reading, due at 23:00 Beijing time tonight, could amplify volatility. Spot range (https://www.cexscan.com/coin-summary?symbol=AMZNB) · Seven-day market data (https://coinalyze.net/markets/?exchange=A.&page=37) · Data calendar (https://www.sca.isr.umich.edu/)
#AMZNB #AMZN #美股 #RWA
The Binance spot snapshot shows 257.39 USDT. The token is down about 3.8% across the market over 24 hours, with trading volume of around $7.9 million, and its price is near the bottom of its range. Amazon shares fell 3.87% on heavy volume on November 19, closing at $257.37; in after-hours trading, they briefly dipped to $256. Binance (https://www.binance.com/en/trade/AMZNB_USDT) · CoinMarketCap (https://coinmarketcap.com/currencies/amazon-tokenized-bstocks/) · U.S. stock quotes (https://finance.yahoo.com/quote/AMZN/?p=AMZN)
Anthropic shares rose on their first day of trading, while tech stocks remained under pressure. Nasdaq futures briefly fell about 0.7% during the Asian session. The outlook for the next 4–24 hours is bearish, with a likely retest of the lows after any rebound stalls. Reuters (https://www.investing.com/news/economy-news/asian-shares-head-for-worst-week-since-2020-as-ai-trade-gloom-fails-to-abate-5040496)
On Binance, a break below 256.5 USDT points to 254.5; the first rebound target is 258.5. A sustained move above 261.4 on rising volume would invalidate the bearish outlook. The final University of Michigan consumer sentiment reading, due at 23:00 Beijing time tonight, could amplify volatility. Spot range (https://www.cexscan.com/coin-summary?symbol=AMZNB) · Seven-day market data (https://coinalyze.net/markets/?exchange=A.&page=37) · Data calendar (https://www.sca.isr.umich.edu/)
#AMZNB #AMZN #美股 #RWA

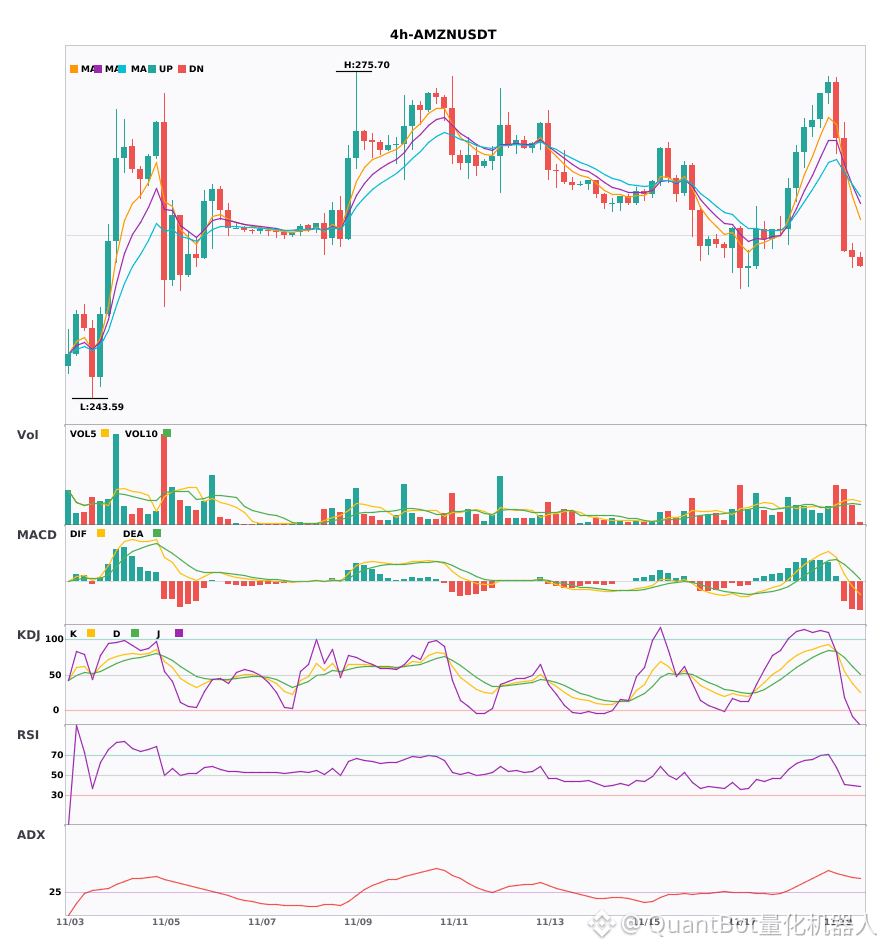
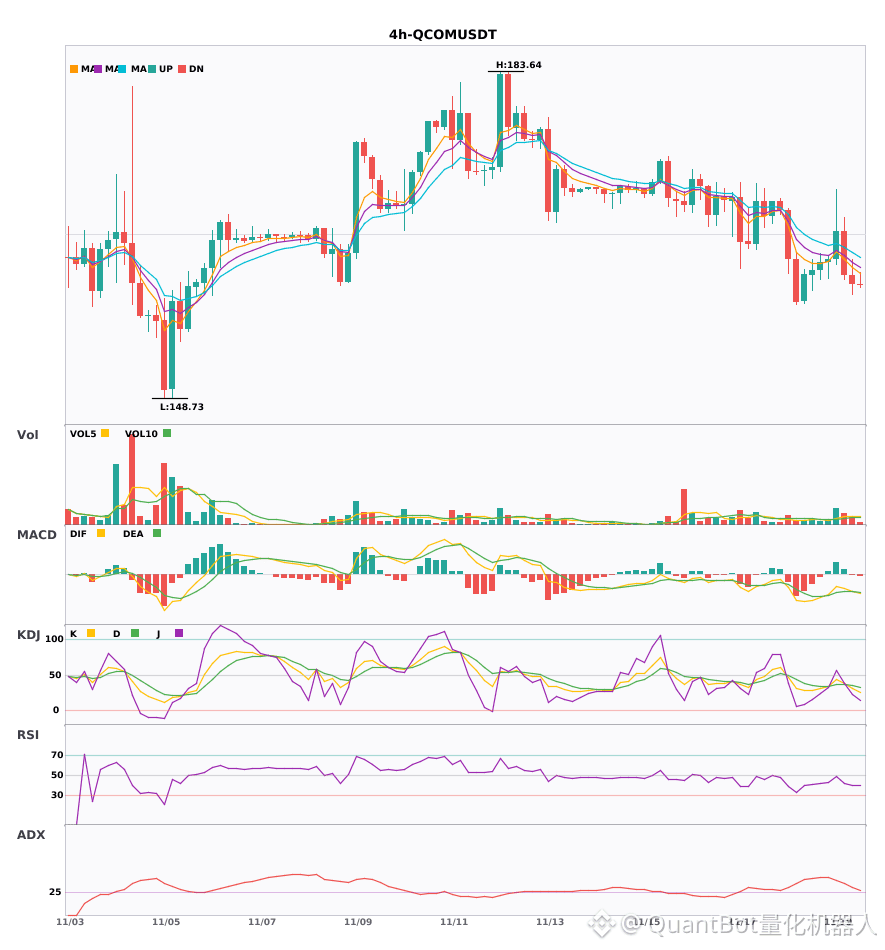
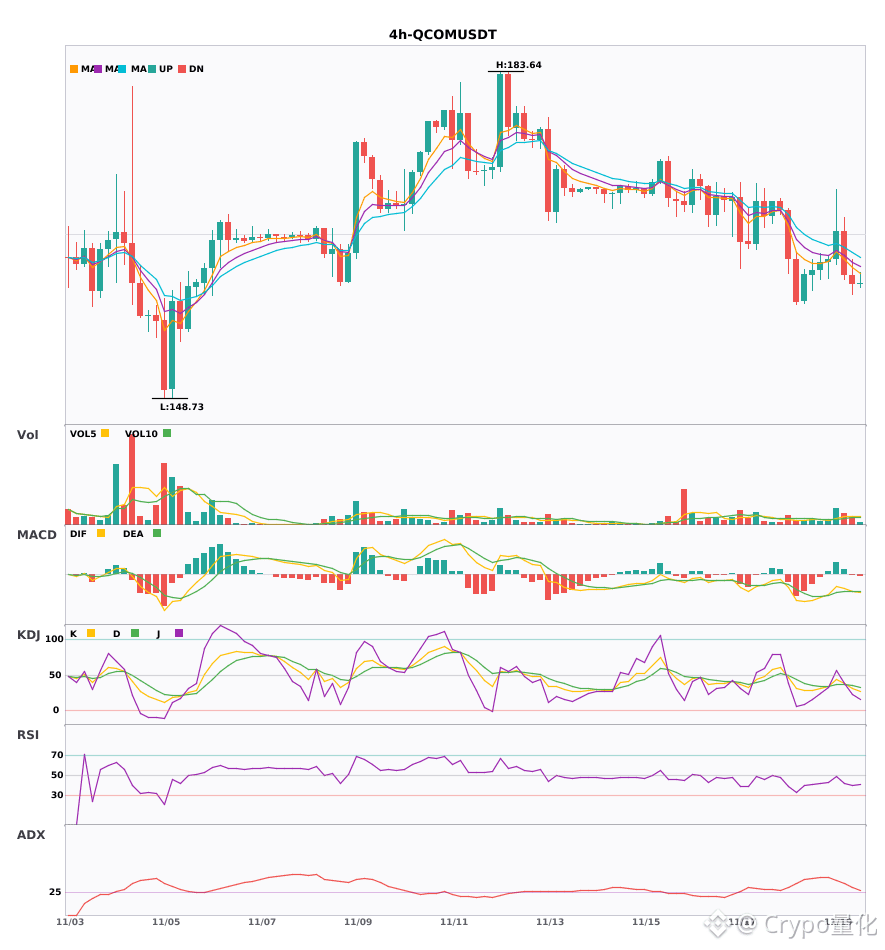
$AMZN / $QCOM 4 Technical outlook is bearish, with significant short-term downside pressure
📉 $AMZN | 4-hour bearish signal
━━━━━━━━━━━━━━━━━━
Technical analysis: ADX(46) indicates a strong trend; beware of a pullback | MACD DIF breaks below the zero line, signaling a bearish trend | EMA5<EMA8<EMA13 bearish alignment | Volume up 1.7x
Price change: -0.2300%
📉 $QCOM | 4-hour bearish signal
━━━━━━━━━━━━━━━━━━
Technical analysis: ADX(32) indicates a strong trend, MACD bearish crossover below zero, EMA5/8/13 bearish alignment, KDJ bearish crossover, volume up 1.8x; short-term outlook is bearish.
Price change: -0.6200%
━━━━━━━━━━━━━━━━━━
#技术分析 #AMZN #QCOM
📌 The above is for reference only and does not constitute investment advice
$AMZN / $QCOM 4 Technical outlook is bearish, with significant short-term downside pressure
📉 $AMZN | 4-hour bearish signal
━━━━━━━━━━━━━━━━━━
Technical analysis: ADX(46) indicates a strong trend; beware of a pullback | MACD DIF breaks below the zero line, signaling a bearish trend | EMA5<EMA8<EMA13 bearish alignment | Volume up 1.7x
Price change: -0.2300%
📉 $QCOM | 4-hour bearish signal
━━━━━━━━━━━━━━━━━━
Technical analysis: ADX(32) indicates a strong trend, MACD bearish crossover below zero, EMA5/8/13 bearish alignment, KDJ bearish crossover, volume up 1.8x; short-term outlook is bearish.
Price change: -0.6200%
━━━━━━━━━━━━━━━━━━
#技术分析 #AMZN #QCOM
📌 The above is for reference only and does not constitute investment advice
📉 $AMZN | 4-hour bearish signal
━━━━━━━━━━━━━━━━━━
Technical analysis: ADX(46) indicates a strong trend; beware of a pullback | MACD DIF breaks below the zero line, signaling a bearish trend | EMA5<EMA8<EMA13 bearish alignment | Volume up 1.7x
Price change: -0.2300%
📉 $QCOM | 4-hour bearish signal
━━━━━━━━━━━━━━━━━━
Technical analysis: ADX(32) indicates a strong trend, MACD bearish crossover below zero, EMA5/8/13 bearish alignment, KDJ bearish crossover, volume up 1.8x; short-term outlook is bearish.
Price change: -0.6200%
━━━━━━━━━━━━━━━━━━
#技术分析 #AMZN #QCOM
📌 The above is for reference only and does not constitute investment advice
68

·
--
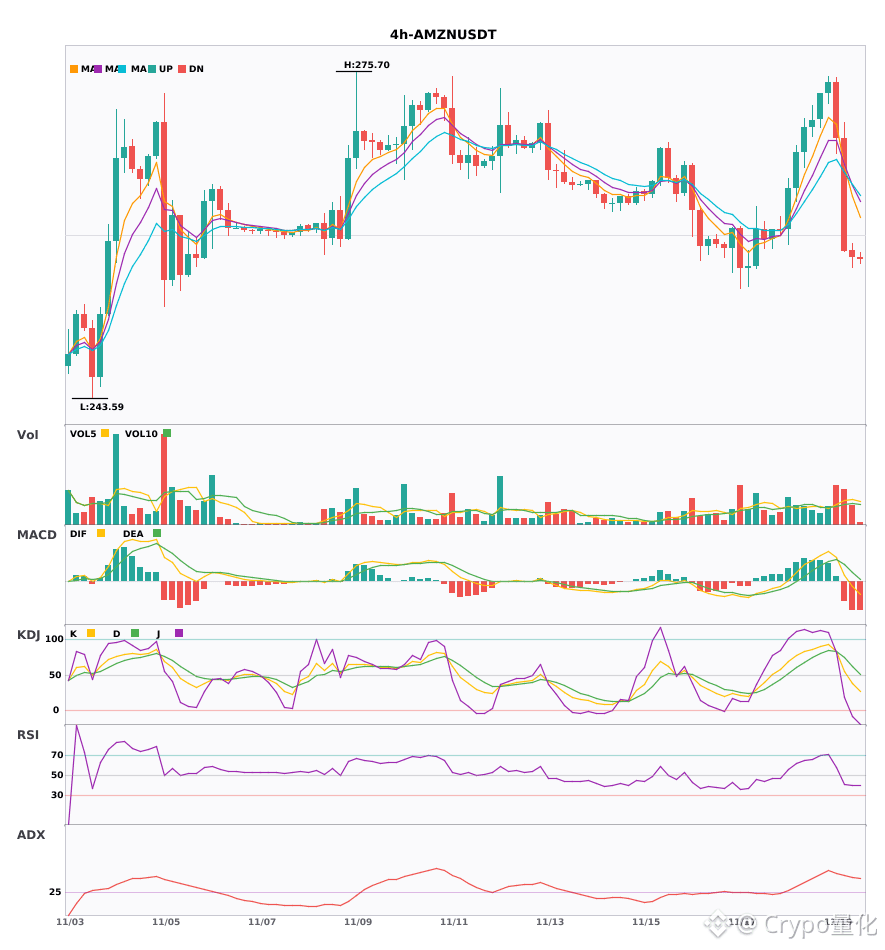
4-hour timeframe: $AMZN $QCOM bearish alerts have lit up at the same time 🔥
════════════════════
🟢 $AMZN 4-hour bearish signal
⚠️ Technical analysis: ADX is as high as 46, indicating a strong trend, but watch out for a pullback. The MACD DIF has fallen below the zero line, signaling a bearish turn. The three moving averages are aligned bearishly and trending downward. Trading volume has increased to 1.7x; watch for bearish pressure.
════════════════════
🟢 $QCOM 4-hour bearish signal
⚠️ Technical analysis: ADX indicates a clear trend. The MACD death cross is accelerating the bearish momentum, and the moving averages are aligned bearishly. The KDJ death cross is not yet oversold. Volume has increased 1.8x; the short-term outlook is bearish.
════════════════════
🔔 Follow to get the latest market movements 🔔
#技术分析 #AMZN #QCOM
📌 When trading, pay attention to whether the candlestick pattern confirms the signal.
4-hour timeframe: $AMZN $QCOM bearish alerts have lit up at the same time 🔥
════════════════════
🟢 $AMZN 4-hour bearish signal
⚠️ Technical analysis: ADX is as high as 46, indicating a strong trend, but watch out for a pullback. The MACD DIF has fallen below the zero line, signaling a bearish turn. The three moving averages are aligned bearishly and trending downward. Trading volume has increased to 1.7x; watch for bearish pressure.
════════════════════
🟢 $QCOM 4-hour bearish signal
⚠️ Technical analysis: ADX indicates a clear trend. The MACD death cross is accelerating the bearish momentum, and the moving averages are aligned bearishly. The KDJ death cross is not yet oversold. Volume has increased 1.8x; the short-term outlook is bearish.
════════════════════
🔔 Follow to get the latest market movements 🔔
#技术分析 #AMZN #QCOM
📌 When trading, pay attention to whether the candlestick pattern confirms the signal.
════════════════════
🟢 $AMZN 4-hour bearish signal
⚠️ Technical analysis: ADX is as high as 46, indicating a strong trend, but watch out for a pullback. The MACD DIF has fallen below the zero line, signaling a bearish turn. The three moving averages are aligned bearishly and trending downward. Trading volume has increased to 1.7x; watch for bearish pressure.
════════════════════
🟢 $QCOM 4-hour bearish signal
⚠️ Technical analysis: ADX indicates a clear trend. The MACD death cross is accelerating the bearish momentum, and the moving averages are aligned bearishly. The KDJ death cross is not yet oversold. Volume has increased 1.8x; the short-term outlook is bearish.
════════════════════
🔔 Follow to get the latest market movements 🔔
#技术分析 #AMZN #QCOM
📌 When trading, pay attention to whether the candlestick pattern confirms the signal.
41
·
--
📉 AMZNB short-term bearish, facing resistance near 259
Binance spot AMZNB/USDT touched 274.76 early in the session, then fell back to a verifiable intraday quote of 260.40 USDT, down 2.57% over the rolling 24 hours at the time. Binance’s live order book has not been verified. Spot quote (https://www.piyasadoviz.com/kripto/binance?birim=USDT) · Intraday data (https://www.cryptometer.io/data/binance/amznb/usdt)
Underlying stock Amazon (AMZN) opened higher on Thursday but declined through the session, closing regular trading at $259.11, down 3.22%, and is now trading after hours. Anthropic rose on its first day as a publicly listed company, while the Nasdaq Composite was still down 2.3%, reflecting weak risk appetite for tech stocks. AMZN data (https://finance.yahoo.com/quote/AMZN/history/) · U.S. market close (https://apnews.com/article/206c84045137824feabe052a29ff6140)
Over the next 4–24 hours, the bias is for a failed rebound followed by another test of 258–259 USDT, with 254–255 in view if that level breaks. Resistance is at 265–268 USDT. The bearish outlook is invalidated if the hourly candle holds above 268 and the underlying stock stabilizes as well. The final University of Michigan Consumer Sentiment reading at 23:00 Beijing time tonight could amplify volatility. Data calendar (https://www.sca.isr.umich.edu/?lctg=6796bccb7b375dec1909a709)
#AMZNB #AMZN #美股 #Tokenized stocks
📉 AMZNB short-term bearish, facing resistance near 259
Binance spot AMZNB/USDT touched 274.76 early in the session, then fell back to a verifiable intraday quote of 260.40 USDT, down 2.57% over the rolling 24 hours at the time. Binance’s live order book has not been verified. Spot quote (https://www.piyasadoviz.com/kripto/binance?birim=USDT) · Intraday data (https://www.cryptometer.io/data/binance/amznb/usdt)
Underlying stock Amazon (AMZN) opened higher on Thursday but declined through the session, closing regular trading at $259.11, down 3.22%, and is now trading after hours. Anthropic rose on its first day as a publicly listed company, while the Nasdaq Composite was still down 2.3%, reflecting weak risk appetite for tech stocks. AMZN data (https://finance.yahoo.com/quote/AMZN/history/) · U.S. market close (https://apnews.com/article/206c84045137824feabe052a29ff6140)
Over the next 4–24 hours, the bias is for a failed rebound followed by another test of 258–259 USDT, with 254–255 in view if that level breaks. Resistance is at 265–268 USDT. The bearish outlook is invalidated if the hourly candle holds above 268 and the underlying stock stabilizes as well. The final University of Michigan Consumer Sentiment reading at 23:00 Beijing time tonight could amplify volatility. Data calendar (https://www.sca.isr.umich.edu/?lctg=6796bccb7b375dec1909a709)
#AMZNB #AMZN #美股 #Tokenized stocks
Binance spot AMZNB/USDT touched 274.76 early in the session, then fell back to a verifiable intraday quote of 260.40 USDT, down 2.57% over the rolling 24 hours at the time. Binance’s live order book has not been verified. Spot quote (https://www.piyasadoviz.com/kripto/binance?birim=USDT) · Intraday data (https://www.cryptometer.io/data/binance/amznb/usdt)
Underlying stock Amazon (AMZN) opened higher on Thursday but declined through the session, closing regular trading at $259.11, down 3.22%, and is now trading after hours. Anthropic rose on its first day as a publicly listed company, while the Nasdaq Composite was still down 2.3%, reflecting weak risk appetite for tech stocks. AMZN data (https://finance.yahoo.com/quote/AMZN/history/) · U.S. market close (https://apnews.com/article/206c84045137824feabe052a29ff6140)
Over the next 4–24 hours, the bias is for a failed rebound followed by another test of 258–259 USDT, with 254–255 in view if that level breaks. Resistance is at 265–268 USDT. The bearish outlook is invalidated if the hourly candle holds above 268 and the underlying stock stabilizes as well. The final University of Michigan Consumer Sentiment reading at 23:00 Beijing time tonight could amplify volatility. Data calendar (https://www.sca.isr.umich.edu/?lctg=6796bccb7b375dec1909a709)
#AMZNB #AMZN #美股 #Tokenized stocks
6

·
--
2026-11-19 23:00
$BTC 63,526.20 (-0.61%)
4H bearish · 15m RSI 38 · Wait 4H bearish · wait for a rebound Reference 64,025.09 Wait for a rebound · Go short
$ETH 1,796.38 (-0.56%)
4H bearish · 15m RSI 38 · Wait 4H bearish · wait for a rebound Reference 1,813.03 Wait for a rebound · Go short
$AMZN 272.22 (-0.88%)
4H bullish · 15m RSI 28 · Strong buy 4H bullish + 15m oversold pullback Reference 271.98 Enter long
TSLA 386.20 (-1.28%)
4H bullish · 15m RSI 30 · Strong buy 4H bullish + 15m oversold pullback Reference 387.45 Enter long
#BTC #ETH #AMZN
⚠ For reference only; this is not investment advice
2026-11-19 23:00
$BTC 63,526.20 (-0.61%)
4H bearish · 15m RSI 38 · Wait 4H bearish · wait for a rebound Reference 64,025.09 Wait for a rebound · Go short
$ETH 1,796.38 (-0.56%)
4H bearish · 15m RSI 38 · Wait 4H bearish · wait for a rebound Reference 1,813.03 Wait for a rebound · Go short
$AMZN 272.22 (-0.88%)
4H bullish · 15m RSI 28 · Strong buy 4H bullish + 15m oversold pullback Reference 271.98 Enter long
TSLA 386.20 (-1.28%)
4H bullish · 15m RSI 30 · Strong buy 4H bullish + 15m oversold pullback Reference 387.45 Enter long
#BTC #ETH #AMZN
⚠ For reference only; this is not investment advice
$BTC 63,526.20 (-0.61%)
4H bearish · 15m RSI 38 · Wait 4H bearish · wait for a rebound Reference 64,025.09 Wait for a rebound · Go short
$ETH 1,796.38 (-0.56%)
4H bearish · 15m RSI 38 · Wait 4H bearish · wait for a rebound Reference 1,813.03 Wait for a rebound · Go short
$AMZN 272.22 (-0.88%)
4H bullish · 15m RSI 28 · Strong buy 4H bullish + 15m oversold pullback Reference 271.98 Enter long
TSLA 386.20 (-1.28%)
4H bullish · 15m RSI 30 · Strong buy 4H bullish + 15m oversold pullback Reference 387.45 Enter long
#BTC #ETH #AMZN
⚠ For reference only; this is not investment advice
56

·
--
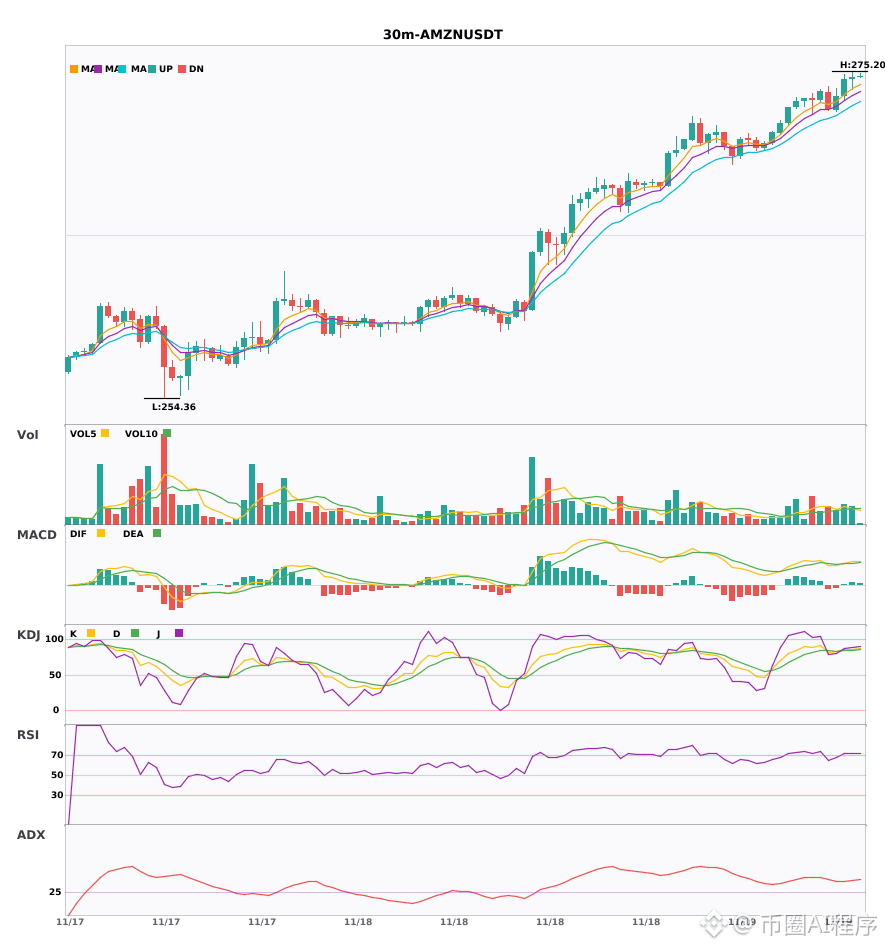
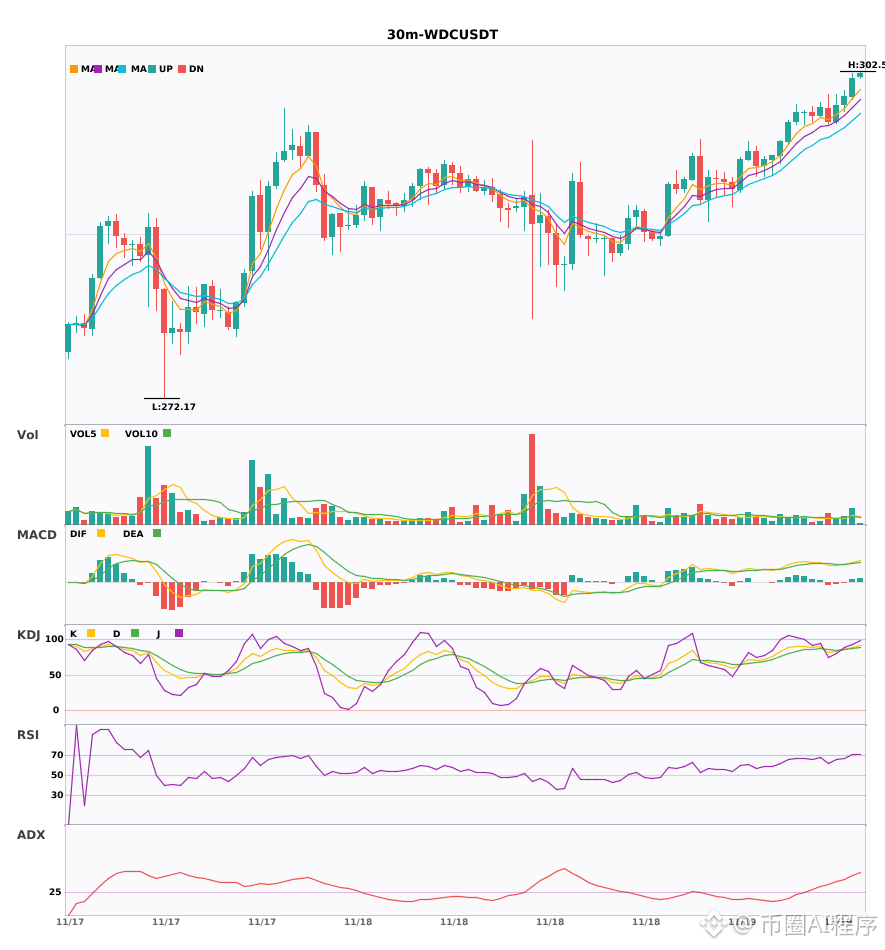
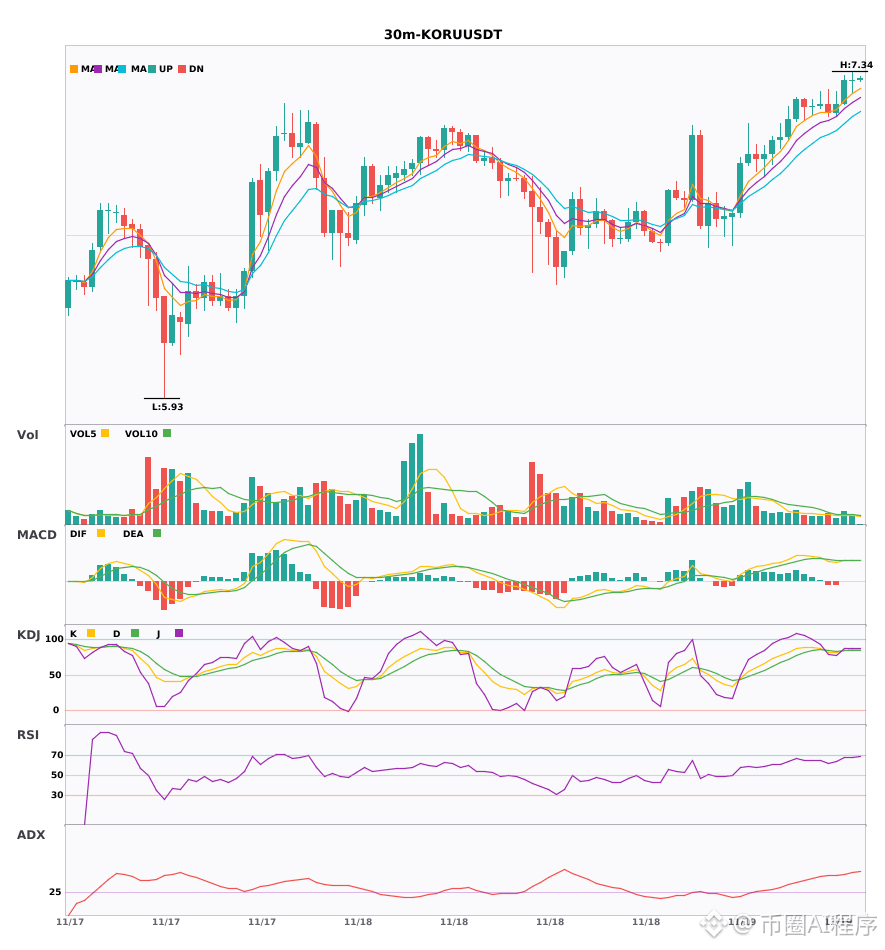
$AMZN $WDC $KORU 30-minute MACD golden cross with increased volume; 4-hour bullish alignment confirmed🔥
════════════════════
🔴 $AMZN 30-minute bullish signal
⚠️Technical analysis: 30-minute entry, confirmed by 4-hour bullish confluence! MACD golden cross with increased volume; moving averages are bullishly aligned and diverging upward. KDJ golden cross without being overbought; volume is moderate. Short-term outlook is bullish.
════════════════════
🔴 $WDC 30-minute bullish signal
⚠️Technical analysis: 4-hour bullish confluence confirmed; 30-minute MACD golden cross with increased volume; moving averages are bullishly aligned and diverging. KDJ is on the high side, so watch for a pullback.
════════════════════
🔴 $KORU 30-minute bullish signal
⚠️Technical analysis: 4-hour bullish trend + 30-minute entry, confirmed by multi-timeframe confluence! The 30-minute MACD golden cross has increased volume, with the red bars growing; moving averages are bullishly aligned and diverging upward. KDJ has entered the overbought zone (K85.4 D84.3), so beware of a pullback. Volume is normal at 1.2x.
════════════════════
🔔 Follow to get the latest market movements 🔔
#多周期共振 #AMZN #WDC #KORU
📌 When trading, pay attention to whether the candlestick pattern matches
$AMZN $WDC $KORU 30-minute MACD golden cross with increased volume; 4-hour bullish alignment confirmed🔥
════════════════════
🔴 $AMZN 30-minute bullish signal
⚠️Technical analysis: 30-minute entry, confirmed by 4-hour bullish confluence! MACD golden cross with increased volume; moving averages are bullishly aligned and diverging upward. KDJ golden cross without being overbought; volume is moderate. Short-term outlook is bullish.
════════════════════
🔴 $WDC 30-minute bullish signal
⚠️Technical analysis: 4-hour bullish confluence confirmed; 30-minute MACD golden cross with increased volume; moving averages are bullishly aligned and diverging. KDJ is on the high side, so watch for a pullback.
════════════════════
🔴 $KORU 30-minute bullish signal
⚠️Technical analysis: 4-hour bullish trend + 30-minute entry, confirmed by multi-timeframe confluence! The 30-minute MACD golden cross has increased volume, with the red bars growing; moving averages are bullishly aligned and diverging upward. KDJ has entered the overbought zone (K85.4 D84.3), so beware of a pullback. Volume is normal at 1.2x.
════════════════════
🔔 Follow to get the latest market movements 🔔
#多周期共振 #AMZN #WDC #KORU
📌 When trading, pay attention to whether the candlestick pattern matches
════════════════════
🔴 $AMZN 30-minute bullish signal
⚠️Technical analysis: 30-minute entry, confirmed by 4-hour bullish confluence! MACD golden cross with increased volume; moving averages are bullishly aligned and diverging upward. KDJ golden cross without being overbought; volume is moderate. Short-term outlook is bullish.
════════════════════
🔴 $WDC 30-minute bullish signal
⚠️Technical analysis: 4-hour bullish confluence confirmed; 30-minute MACD golden cross with increased volume; moving averages are bullishly aligned and diverging. KDJ is on the high side, so watch for a pullback.
════════════════════
🔴 $KORU 30-minute bullish signal
⚠️Technical analysis: 4-hour bullish trend + 30-minute entry, confirmed by multi-timeframe confluence! The 30-minute MACD golden cross has increased volume, with the red bars growing; moving averages are bullishly aligned and diverging upward. KDJ has entered the overbought zone (K85.4 D84.3), so beware of a pullback. Volume is normal at 1.2x.
════════════════════
🔔 Follow to get the latest market movements 🔔
#多周期共振 #AMZN #WDC #KORU
📌 When trading, pay attention to whether the candlestick pattern matches
24
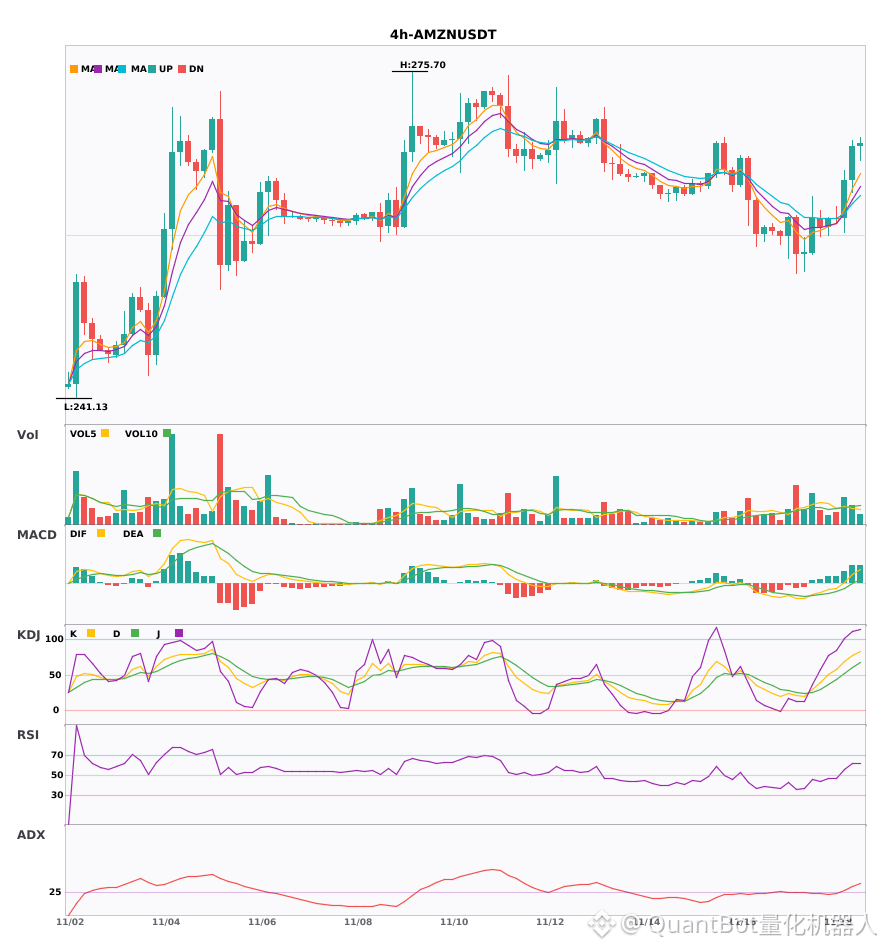
$AMZN 4-hour timeframe triggered a bullish signal; trend momentum is strengthening
📈 $AMZN | 4-hour bullish signal
━━━━━━━━━━━━━━━━━━
Technical analysis: ADX(36) indicates a clear trend; MACD bullish momentum is strengthening; EMA5>8>13 bullish alignment; KDJ is strong (K77.4/D60.5); trading volume increased 1.5x.
Price change: 1.3400%
━━━━━━━━━━━━━━━━━━
#技术分析 #AMZN
📌 The above content is for reference only and does not constitute investment advice
$AMZN 4-hour timeframe triggered a bullish signal; trend momentum is strengthening
📈 $AMZN | 4-hour bullish signal
━━━━━━━━━━━━━━━━━━
Technical analysis: ADX(36) indicates a clear trend; MACD bullish momentum is strengthening; EMA5>8>13 bullish alignment; KDJ is strong (K77.4/D60.5); trading volume increased 1.5x.
Price change: 1.3400%
━━━━━━━━━━━━━━━━━━
#技术分析 #AMZN
📌 The above content is for reference only and does not constitute investment advice
📈 $AMZN | 4-hour bullish signal
━━━━━━━━━━━━━━━━━━
Technical analysis: ADX(36) indicates a clear trend; MACD bullish momentum is strengthening; EMA5>8>13 bullish alignment; KDJ is strong (K77.4/D60.5); trading volume increased 1.5x.
Price change: 1.3400%
━━━━━━━━━━━━━━━━━━
#技术分析 #AMZN
📌 The above content is for reference only and does not constitute investment advice
8
·
--
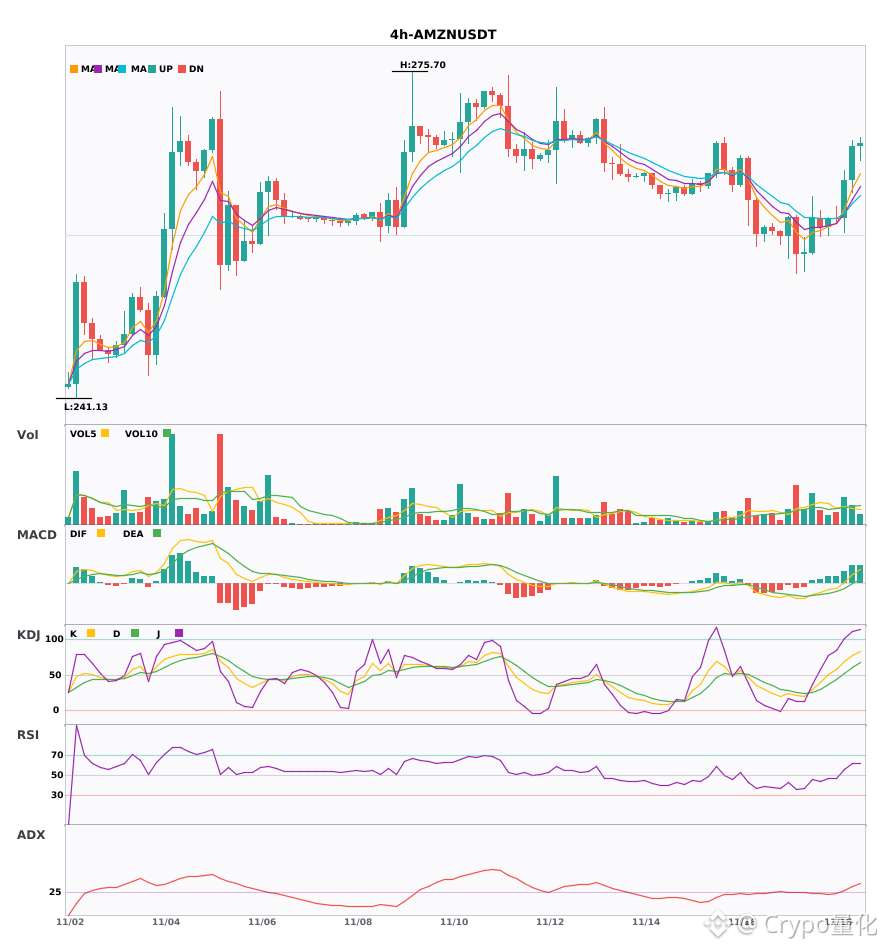
$AMZN 4-hour bullish outlook, MACD golden cross with red bars continuing to expand 🔥
════════════════════
🔴 $AMZN 4-hour bullish signal
⚠️ Technical analysis: ADX indicates a trending market. After the MACD golden cross, the red bars are expanding; the moving averages have just formed a bullish alignment; K crossed above D without entering overbought territory; volume increased 1.5 times.
════════════════════
🔔 Follow us for first-hand market updates 🔔
#技术分析 #AMZN
📌 When trading, pay attention to whether the candlestick pattern meets the criteria
$AMZN 4-hour bullish outlook, MACD golden cross with red bars continuing to expand 🔥
════════════════════
🔴 $AMZN 4-hour bullish signal
⚠️ Technical analysis: ADX indicates a trending market. After the MACD golden cross, the red bars are expanding; the moving averages have just formed a bullish alignment; K crossed above D without entering overbought territory; volume increased 1.5 times.
════════════════════
🔔 Follow us for first-hand market updates 🔔
#技术分析 #AMZN
📌 When trading, pay attention to whether the candlestick pattern meets the criteria
════════════════════
🔴 $AMZN 4-hour bullish signal
⚠️ Technical analysis: ADX indicates a trending market. After the MACD golden cross, the red bars are expanding; the moving averages have just formed a bullish alignment; K crossed above D without entering overbought territory; volume increased 1.5 times.
════════════════════
🔔 Follow us for first-hand market updates 🔔
#技术分析 #AMZN
📌 When trading, pay attention to whether the candlestick pattern meets the criteria
5
·
--
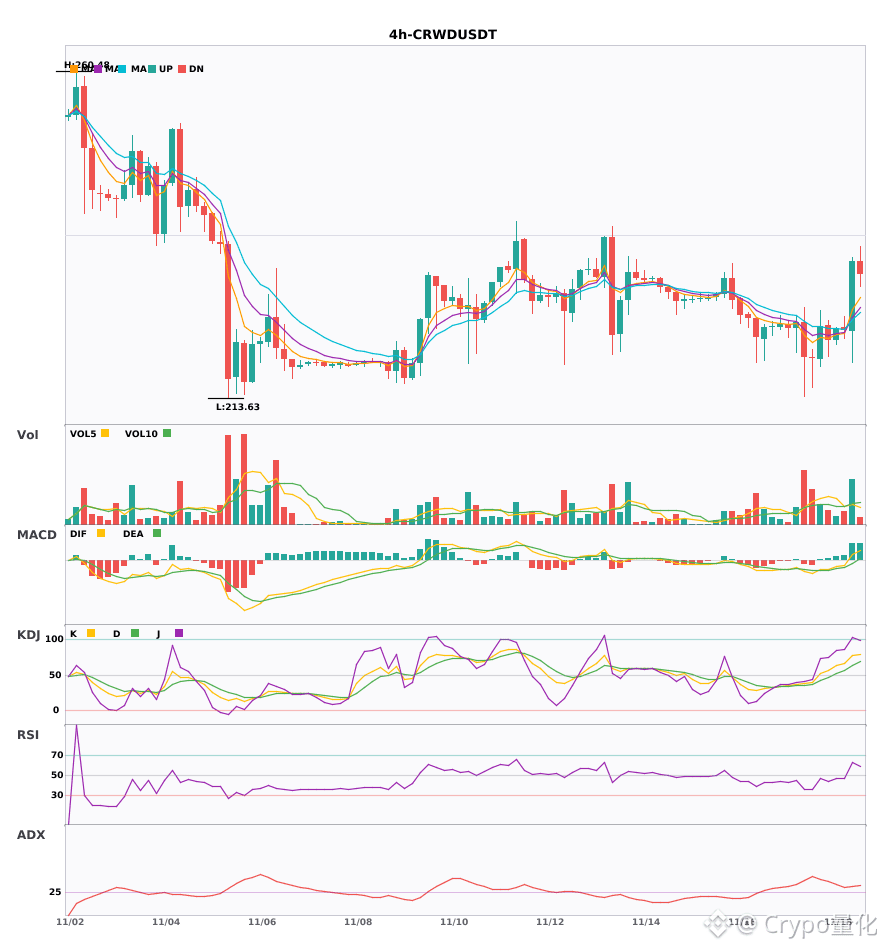
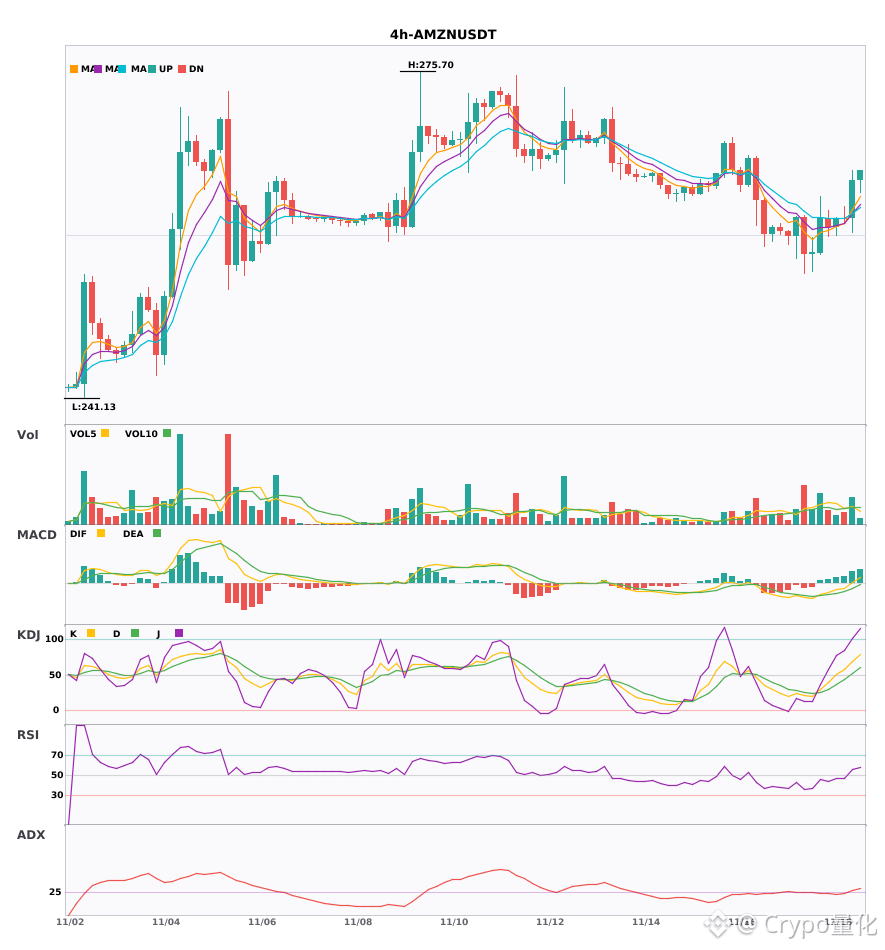
$CRWD $AMZN $MOCA 4-hour bullish convergence, a short-term opportunity is here🔥
════════════════════
🔴 $CRWD 4-hour bullish signal
⚠️Technical: ADX has reached 32, and the trend is very clear. MACD has formed a bullish crossover with rising volume; the red bars keep expanding, and it has moved above the zero line. The moving averages have just formed a bullish alignment and are diverging upward. K has crossed above D but is not yet in overbought territory; bulls have the upper hand. Volume is up 2.1x.
════════════════════
🔴 $AMZN 4-hour bullish signal
⚠️Technical: The ADX trend is forming and becoming actionable | After the MACD bullish crossover, DIF crossed above the zero line | Moving averages have just formed a bullish alignment | K crossed above D without entering overbought territory | Volume is up 1.5x
════════════════════
🔴 $MOCA 4-hour bullish signal
⚠️Technical: ADX is at 51, indicating an exceptionally strong trend; beware of overheating and a pullback. MACD has formed a bullish crossover with rising volume and moved above the zero line; the moving averages are in a bullish alignment. The KDJ bearish crossover signals short-term weakness, and volume has surged 9.3x.
════════════════════
🔔 Follow for first-hand market movement alerts 🔔
#技术分析 #CRWD #AMZN #MOCA
📌 When trading, pay attention to whether the candlestick pattern matches
$CRWD $AMZN $MOCA 4-hour bullish convergence, a short-term opportunity is here🔥
════════════════════
🔴 $CRWD 4-hour bullish signal
⚠️Technical: ADX has reached 32, and the trend is very clear. MACD has formed a bullish crossover with rising volume; the red bars keep expanding, and it has moved above the zero line. The moving averages have just formed a bullish alignment and are diverging upward. K has crossed above D but is not yet in overbought territory; bulls have the upper hand. Volume is up 2.1x.
════════════════════
🔴 $AMZN 4-hour bullish signal
⚠️Technical: The ADX trend is forming and becoming actionable | After the MACD bullish crossover, DIF crossed above the zero line | Moving averages have just formed a bullish alignment | K crossed above D without entering overbought territory | Volume is up 1.5x
════════════════════
🔴 $MOCA 4-hour bullish signal
⚠️Technical: ADX is at 51, indicating an exceptionally strong trend; beware of overheating and a pullback. MACD has formed a bullish crossover with rising volume and moved above the zero line; the moving averages are in a bullish alignment. The KDJ bearish crossover signals short-term weakness, and volume has surged 9.3x.
════════════════════
🔔 Follow for first-hand market movement alerts 🔔
#技术分析 #CRWD #AMZN #MOCA
📌 When trading, pay attention to whether the candlestick pattern matches
════════════════════
🔴 $CRWD 4-hour bullish signal
⚠️Technical: ADX has reached 32, and the trend is very clear. MACD has formed a bullish crossover with rising volume; the red bars keep expanding, and it has moved above the zero line. The moving averages have just formed a bullish alignment and are diverging upward. K has crossed above D but is not yet in overbought territory; bulls have the upper hand. Volume is up 2.1x.
════════════════════
🔴 $AMZN 4-hour bullish signal
⚠️Technical: The ADX trend is forming and becoming actionable | After the MACD bullish crossover, DIF crossed above the zero line | Moving averages have just formed a bullish alignment | K crossed above D without entering overbought territory | Volume is up 1.5x
════════════════════
🔴 $MOCA 4-hour bullish signal
⚠️Technical: ADX is at 51, indicating an exceptionally strong trend; beware of overheating and a pullback. MACD has formed a bullish crossover with rising volume and moved above the zero line; the moving averages are in a bullish alignment. The KDJ bearish crossover signals short-term weakness, and volume has surged 9.3x.
════════════════════
🔔 Follow for first-hand market movement alerts 🔔
#技术分析 #CRWD #AMZN #MOCA
📌 When trading, pay attention to whether the candlestick pattern matches
4
·
--
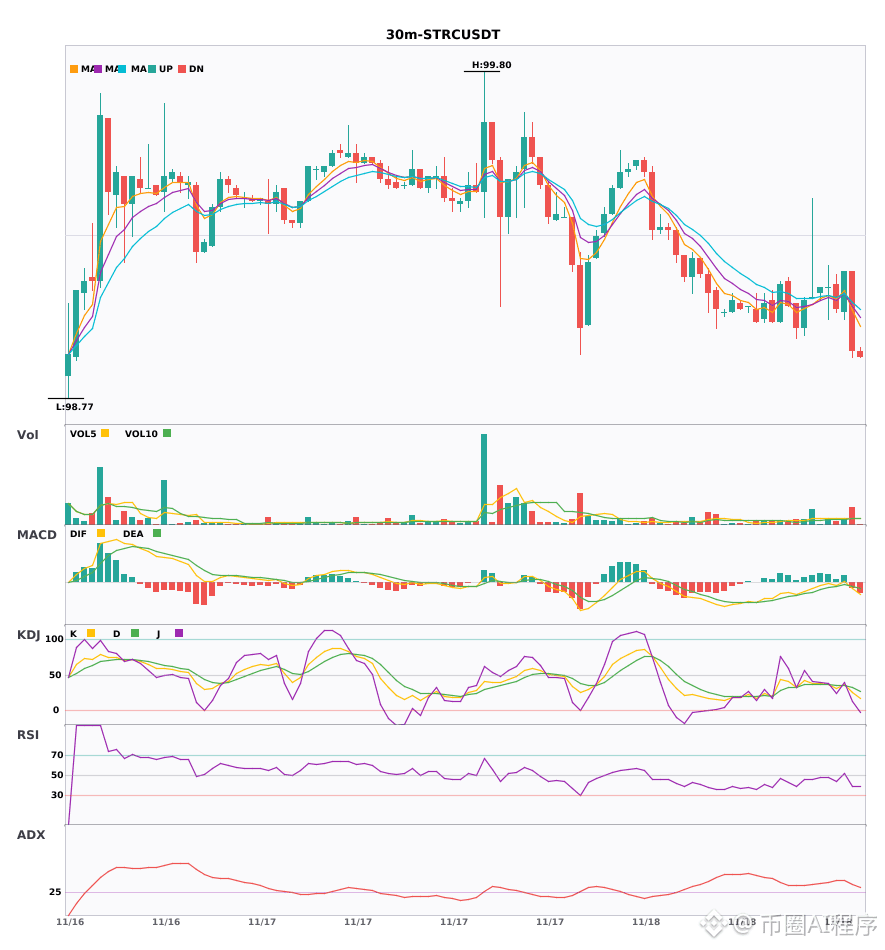
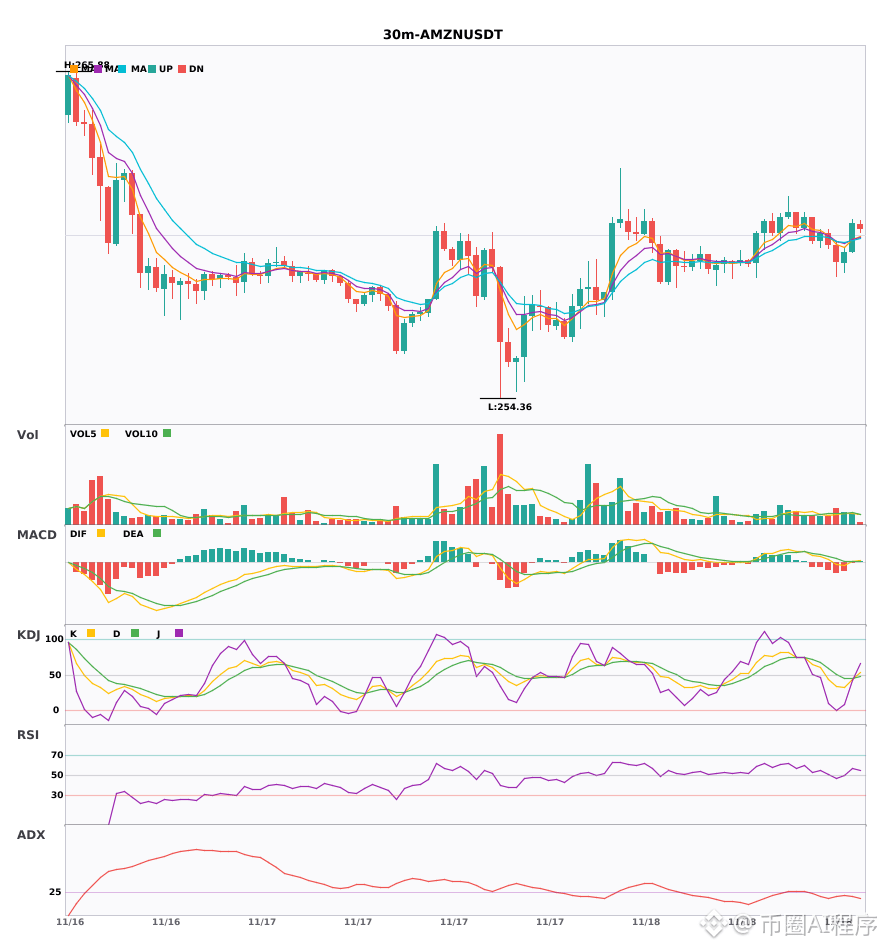
Two coins show bearish confluence across higher and lower timeframes; the downtrend has just been confirmed 🔥
════════════════════
🟢 $STRC 30-minute bearish signal
⚠️ Technicals: 30-minute entry signal, confirmed by bearish confluence on the 4-hour chart: MACD death cross with rising volume, moving averages have just formed a bearish alignment, KDJ death cross without being oversold, and trading volume surged 2.6x.
════════════════════
🟢 $AMZN 30-minute bearish signal
⚠️ Technicals: 30-minute entry + bearish confluence confirmed on the 4-hour chart! After the MACD death cross, the green bars are shrinking and momentum is weakening. Moving averages are bearishly aligned and diverging downward. KDJ K has crossed below D without entering the oversold zone; bears have the upper hand.
════════════════════
🔔 Follow for real-time market updates 🔔
#多周期共振 #STRC #AMZN
📌 When trading, pay attention to whether the candlestick patterns confirm the signal
Two coins show bearish confluence across higher and lower timeframes; the downtrend has just been confirmed 🔥
════════════════════
🟢 $STRC 30-minute bearish signal
⚠️ Technicals: 30-minute entry signal, confirmed by bearish confluence on the 4-hour chart: MACD death cross with rising volume, moving averages have just formed a bearish alignment, KDJ death cross without being oversold, and trading volume surged 2.6x.
════════════════════
🟢 $AMZN 30-minute bearish signal
⚠️ Technicals: 30-minute entry + bearish confluence confirmed on the 4-hour chart! After the MACD death cross, the green bars are shrinking and momentum is weakening. Moving averages are bearishly aligned and diverging downward. KDJ K has crossed below D without entering the oversold zone; bears have the upper hand.
════════════════════
🔔 Follow for real-time market updates 🔔
#多周期共振 #STRC #AMZN
📌 When trading, pay attention to whether the candlestick patterns confirm the signal
════════════════════
🟢 $STRC 30-minute bearish signal
⚠️ Technicals: 30-minute entry signal, confirmed by bearish confluence on the 4-hour chart: MACD death cross with rising volume, moving averages have just formed a bearish alignment, KDJ death cross without being oversold, and trading volume surged 2.6x.
════════════════════
🟢 $AMZN 30-minute bearish signal
⚠️ Technicals: 30-minute entry + bearish confluence confirmed on the 4-hour chart! After the MACD death cross, the green bars are shrinking and momentum is weakening. Moving averages are bearishly aligned and diverging downward. KDJ K has crossed below D without entering the oversold zone; bears have the upper hand.
════════════════════
🔔 Follow for real-time market updates 🔔
#多周期共振 #STRC #AMZN
📌 When trading, pay attention to whether the candlestick patterns confirm the signal
5
·
--
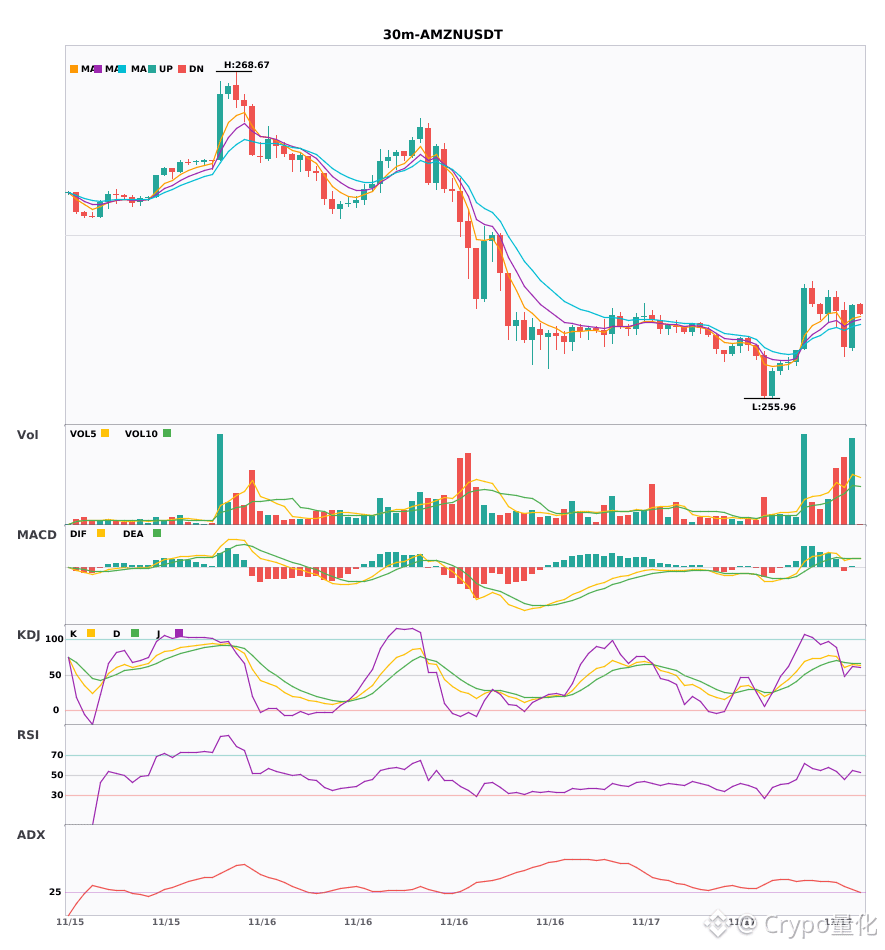
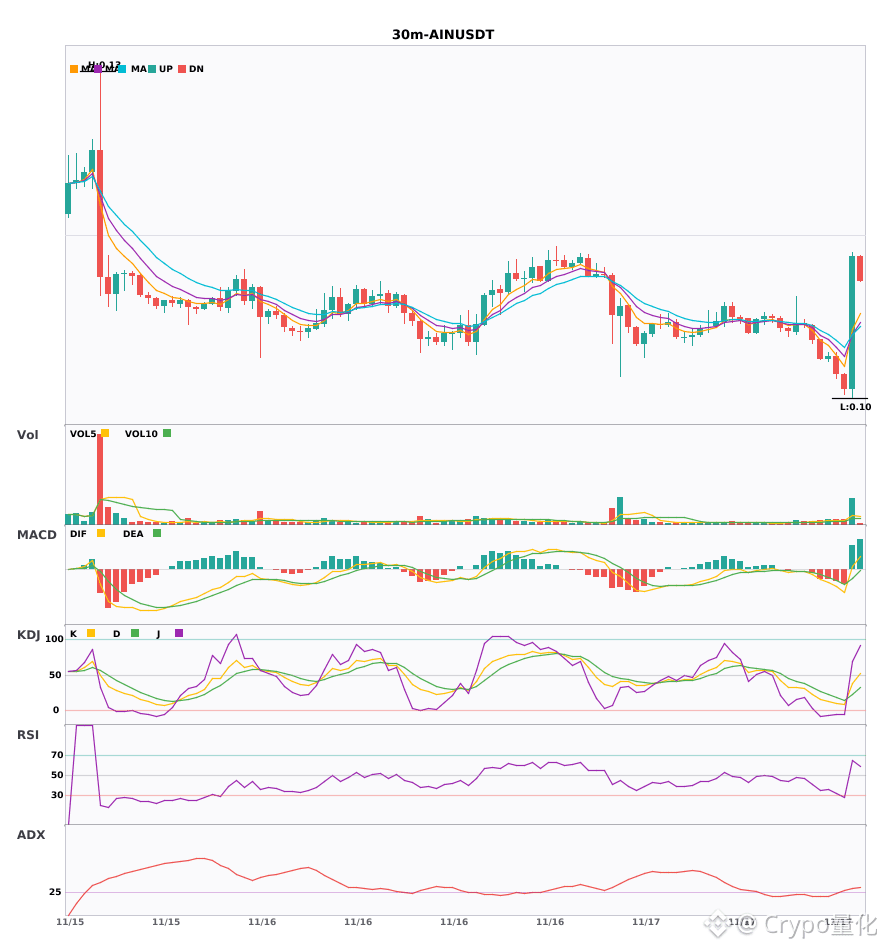
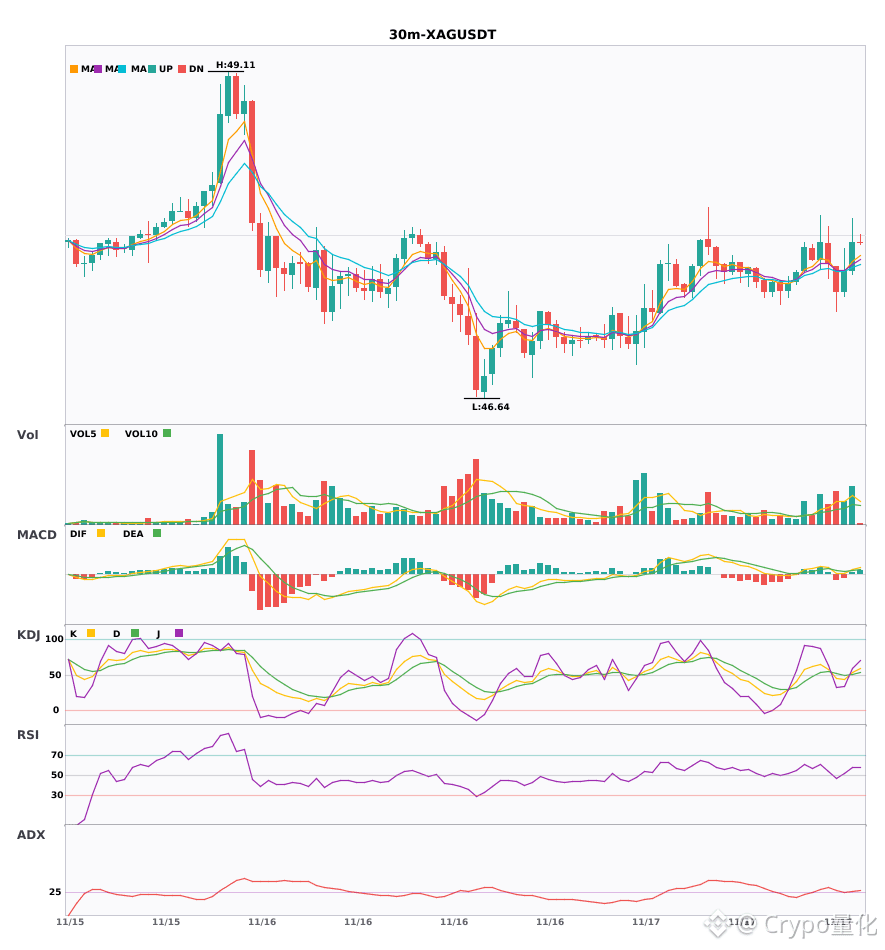
$AMZN $AIN $XAG 30-minute bullish confluence, short-term outlook bullish 🔥
════════════════════
🔴 $AMZN 30-minute bullish signal
⚠️Technical analysis: ADX is at 29; the trend is just getting started, so you can enter. MACD has formed a golden cross above zero, with expanding red bars on increased volume. The moving averages are in a bullish alignment and diverging upward. In KDJ, K has crossed above D and is not yet overbought. Trading volume is up 2.2x.
════════════════════
🔴 $AIN 30-minute bullish signal
⚠️Technical analysis: ADX is at 31, indicating a clear trend. MACD has formed a golden cross, with expanding red bars. The moving averages have just formed a bullish alignment. K has crossed above D and is not yet overbought. Trading volume is up 4.1x.
════════════════════
🔴 $XAG 30-minute bullish signal
⚠️Technical analysis: ADX shows that a trend is forming, so you can get in. Volume picked up after the MACD golden cross, and the red bars are expanding. The moving averages have just formed a golden cross and turned bullish. KDJ has formed a golden cross and is not overbought. Trading volume is up 1.9x.
════════════════════
🔔 Follow for real-time market updates 🔔
#技术分析 #AMZN #AIN #XAG
📌 When trading, pay attention to whether the candlestick pattern confirms the setup
$AMZN $AIN $XAG 30-minute bullish confluence, short-term outlook bullish 🔥
════════════════════
🔴 $AMZN 30-minute bullish signal
⚠️Technical analysis: ADX is at 29; the trend is just getting started, so you can enter. MACD has formed a golden cross above zero, with expanding red bars on increased volume. The moving averages are in a bullish alignment and diverging upward. In KDJ, K has crossed above D and is not yet overbought. Trading volume is up 2.2x.
════════════════════
🔴 $AIN 30-minute bullish signal
⚠️Technical analysis: ADX is at 31, indicating a clear trend. MACD has formed a golden cross, with expanding red bars. The moving averages have just formed a bullish alignment. K has crossed above D and is not yet overbought. Trading volume is up 4.1x.
════════════════════
🔴 $XAG 30-minute bullish signal
⚠️Technical analysis: ADX shows that a trend is forming, so you can get in. Volume picked up after the MACD golden cross, and the red bars are expanding. The moving averages have just formed a golden cross and turned bullish. KDJ has formed a golden cross and is not overbought. Trading volume is up 1.9x.
════════════════════
🔔 Follow for real-time market updates 🔔
#技术分析 #AMZN #AIN #XAG
📌 When trading, pay attention to whether the candlestick pattern confirms the setup
════════════════════
🔴 $AMZN 30-minute bullish signal
⚠️Technical analysis: ADX is at 29; the trend is just getting started, so you can enter. MACD has formed a golden cross above zero, with expanding red bars on increased volume. The moving averages are in a bullish alignment and diverging upward. In KDJ, K has crossed above D and is not yet overbought. Trading volume is up 2.2x.
════════════════════
🔴 $AIN 30-minute bullish signal
⚠️Technical analysis: ADX is at 31, indicating a clear trend. MACD has formed a golden cross, with expanding red bars. The moving averages have just formed a bullish alignment. K has crossed above D and is not yet overbought. Trading volume is up 4.1x.
════════════════════
🔴 $XAG 30-minute bullish signal
⚠️Technical analysis: ADX shows that a trend is forming, so you can get in. Volume picked up after the MACD golden cross, and the red bars are expanding. The moving averages have just formed a golden cross and turned bullish. KDJ has formed a golden cross and is not overbought. Trading volume is up 1.9x.
════════════════════
🔔 Follow for real-time market updates 🔔
#技术分析 #AMZN #AIN #XAG
📌 When trading, pay attention to whether the candlestick pattern confirms the setup
4
·
--
🔻 $AMZN SHORT 🔻
Entry: 262.07 – 263.65
SL: 264.93
TP1: 261.09
TP2: 259.91
TP3: 258.43
📈 Technical Outlook:
$AMZN is showing bearish pressure after losing strength near a key technical zone. The setup is supported by EMA trend is bearish, price is breaking below recent support, RSI supports bearish momentum. As long as price stays below the entry area, sellers may continue pushing toward the listed downside targets.
#AMZN #Crypto #BinanceSquare #Trading
🔻 $AMZN SHORT 🔻
Entry: 262.07 – 263.65
SL: 264.93
TP1: 261.09
TP2: 259.91
TP3: 258.43
📈 Technical Outlook:
$AMZN is showing bearish pressure after losing strength near a key technical zone. The setup is supported by EMA trend is bearish, price is breaking below recent support, RSI supports bearish momentum. As long as price stays below the entry area, sellers may continue pushing toward the listed downside targets.
#AMZN #Crypto #BinanceSquare #Trading
Entry: 262.07 – 263.65
SL: 264.93
TP1: 261.09
TP2: 259.91
TP3: 258.43
📈 Technical Outlook:
$AMZN is showing bearish pressure after losing strength near a key technical zone. The setup is supported by EMA trend is bearish, price is breaking below recent support, RSI supports bearish momentum. As long as price stays below the entry area, sellers may continue pushing toward the listed downside targets.
#AMZN #Crypto #BinanceSquare #Trading

1
·
--
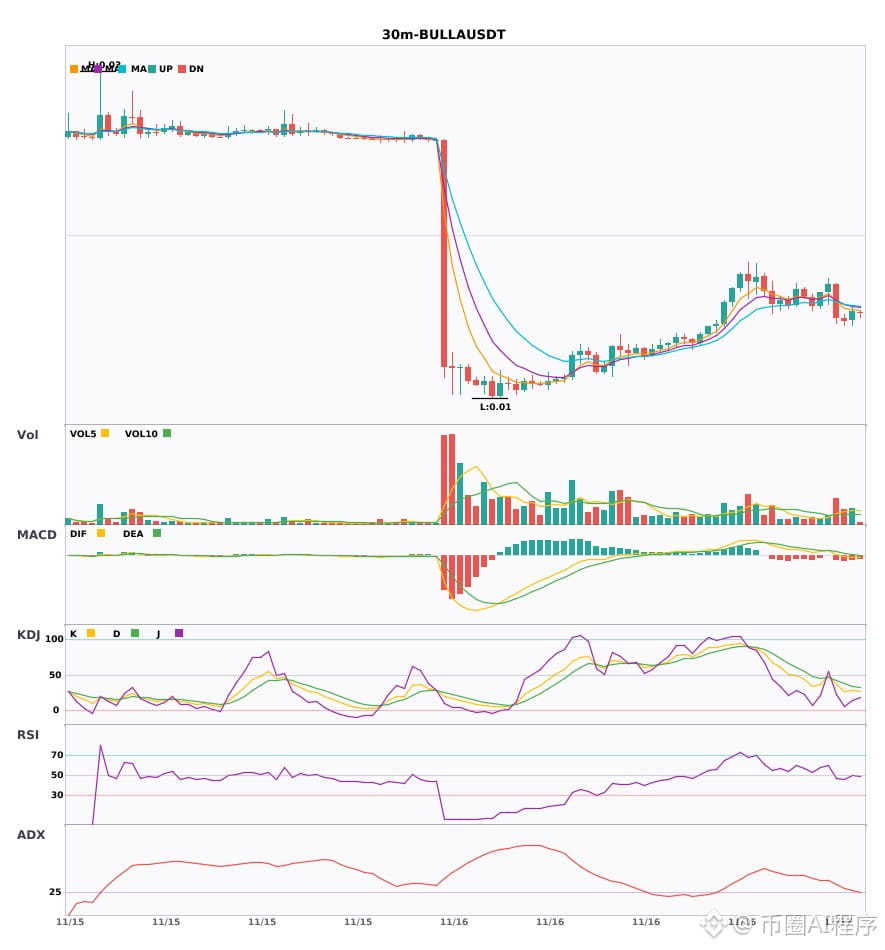
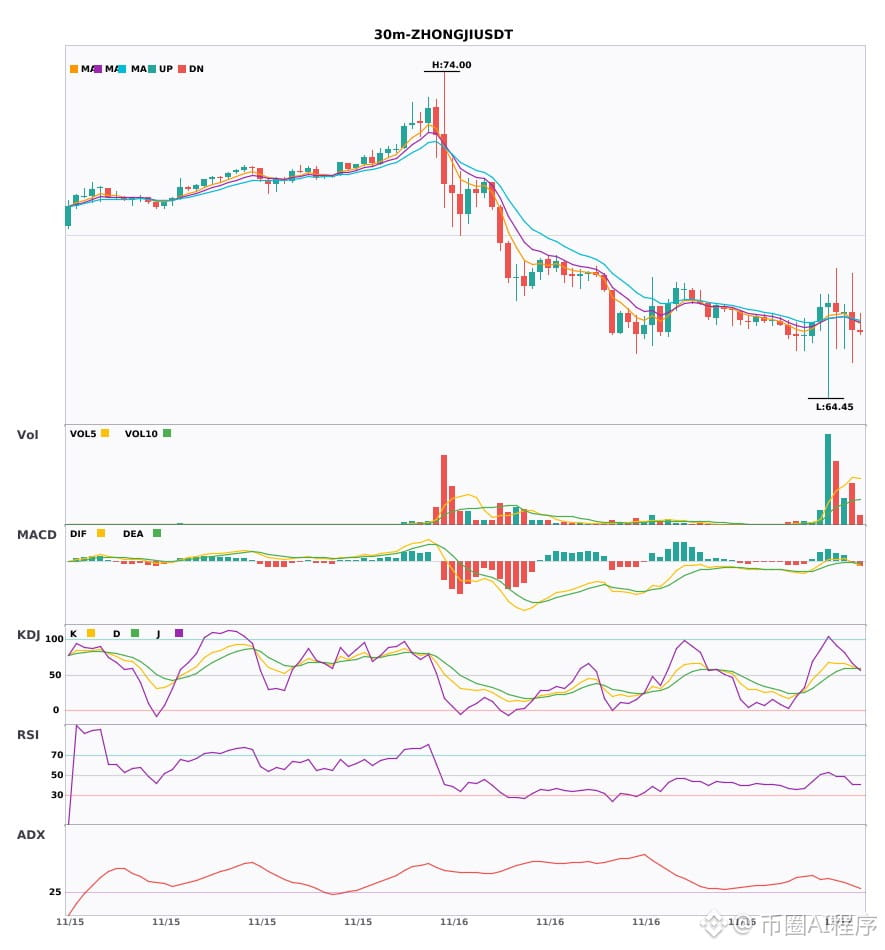
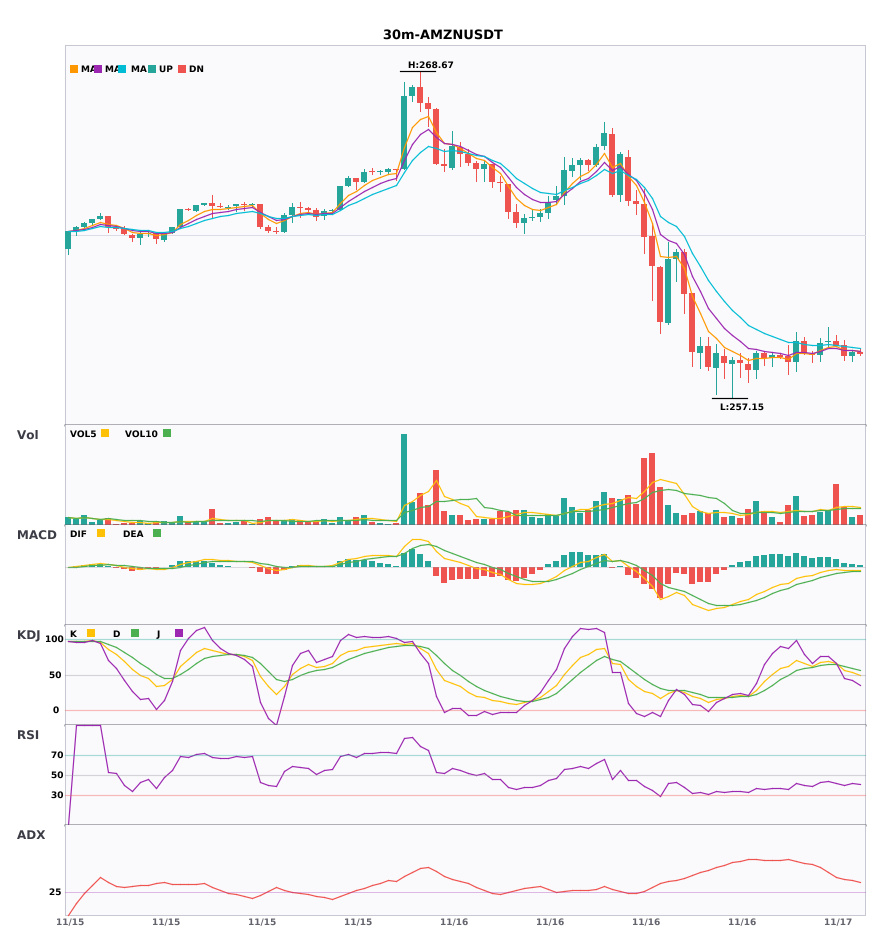
Three coins are bearish on both the 30-minute and 4-hour timeframes; bearish confluence confirmed 🔥
════════════════════
🟢 $BULLA 30-minute bearish signal
⚠️ Technicals: 30-minute entry + 4-hour bearish confluence confirmed: MACD bearish crossover with rising volume, DIF falls below the zero line and the trend turns bearish, moving averages are bearishly aligned and sloping downward, KDJ K crosses below D without entering oversold territory. Bears have the upper hand; volume is up 2.6x.
════════════════════
🟢 $ZHONGJI 30-minute bearish signal
⚠️ Technicals: 4-hour bearish trend + 30-minute entry confirmed by multi-timeframe confluence. MACD bearish crossover below zero is accelerating, moving averages have crossed bearishly, KDJ remains tilted bullish, and trading volume is up 1.7x.
════════════════════
🟢 $AMZN 30-minute bearish signal
⚠️ Technicals: Multi-timeframe confluence for a short: 4-hour bearish trend + on the 30-minute chart, EMA5 has just crossed below EMA8, forming a bearish alignment. KDJ has crossed bearishly without entering the oversold zone; confluence confirmed with volume up 2.6x.
════════════════════
🔔 Follow for real-time market updates 🔔
#多周期共振 #BULLA #ZHONGJI #AMZN
📌 When trading, pay attention to whether the candlestick patterns align.
Three coins are bearish on both the 30-minute and 4-hour timeframes; bearish confluence confirmed 🔥
════════════════════
🟢 $BULLA 30-minute bearish signal
⚠️ Technicals: 30-minute entry + 4-hour bearish confluence confirmed: MACD bearish crossover with rising volume, DIF falls below the zero line and the trend turns bearish, moving averages are bearishly aligned and sloping downward, KDJ K crosses below D without entering oversold territory. Bears have the upper hand; volume is up 2.6x.
════════════════════
🟢 $ZHONGJI 30-minute bearish signal
⚠️ Technicals: 4-hour bearish trend + 30-minute entry confirmed by multi-timeframe confluence. MACD bearish crossover below zero is accelerating, moving averages have crossed bearishly, KDJ remains tilted bullish, and trading volume is up 1.7x.
════════════════════
🟢 $AMZN 30-minute bearish signal
⚠️ Technicals: Multi-timeframe confluence for a short: 4-hour bearish trend + on the 30-minute chart, EMA5 has just crossed below EMA8, forming a bearish alignment. KDJ has crossed bearishly without entering the oversold zone; confluence confirmed with volume up 2.6x.
════════════════════
🔔 Follow for real-time market updates 🔔
#多周期共振 #BULLA #ZHONGJI #AMZN
📌 When trading, pay attention to whether the candlestick patterns align.
════════════════════
🟢 $BULLA 30-minute bearish signal
⚠️ Technicals: 30-minute entry + 4-hour bearish confluence confirmed: MACD bearish crossover with rising volume, DIF falls below the zero line and the trend turns bearish, moving averages are bearishly aligned and sloping downward, KDJ K crosses below D without entering oversold territory. Bears have the upper hand; volume is up 2.6x.
════════════════════
🟢 $ZHONGJI 30-minute bearish signal
⚠️ Technicals: 4-hour bearish trend + 30-minute entry confirmed by multi-timeframe confluence. MACD bearish crossover below zero is accelerating, moving averages have crossed bearishly, KDJ remains tilted bullish, and trading volume is up 1.7x.
════════════════════
🟢 $AMZN 30-minute bearish signal
⚠️ Technicals: Multi-timeframe confluence for a short: 4-hour bearish trend + on the 30-minute chart, EMA5 has just crossed below EMA8, forming a bearish alignment. KDJ has crossed bearishly without entering the oversold zone; confluence confirmed with volume up 2.6x.
════════════════════
🔔 Follow for real-time market updates 🔔
#多周期共振 #BULLA #ZHONGJI #AMZN
📌 When trading, pay attention to whether the candlestick patterns align.
2
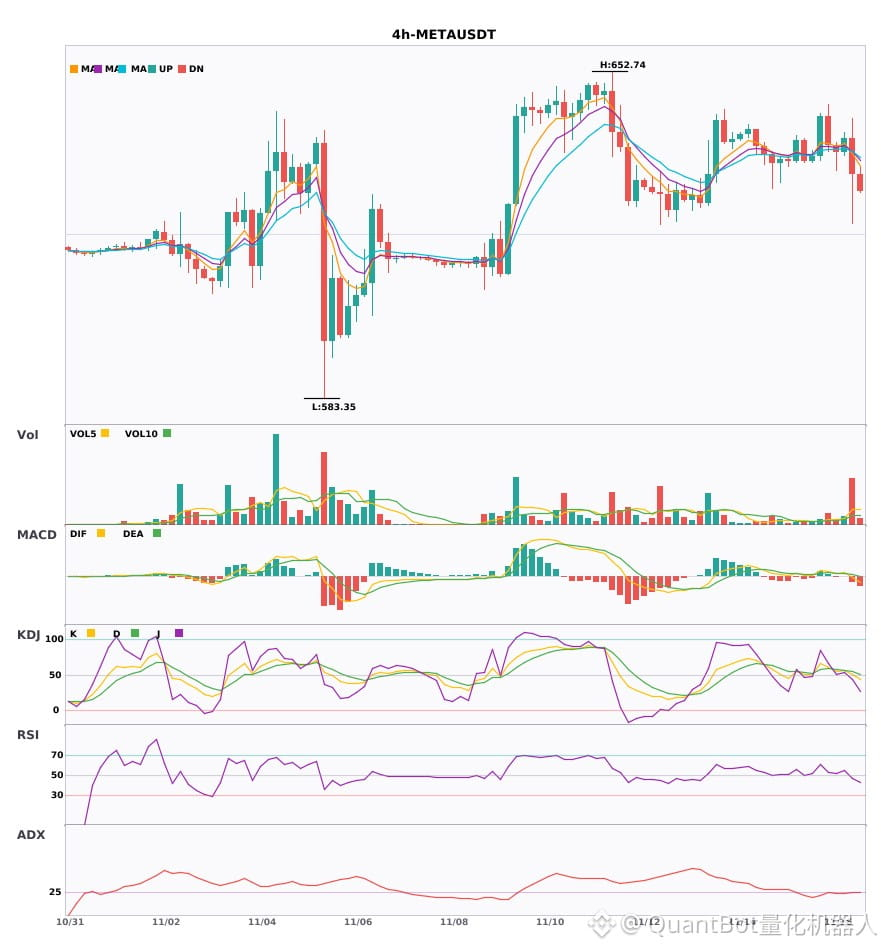
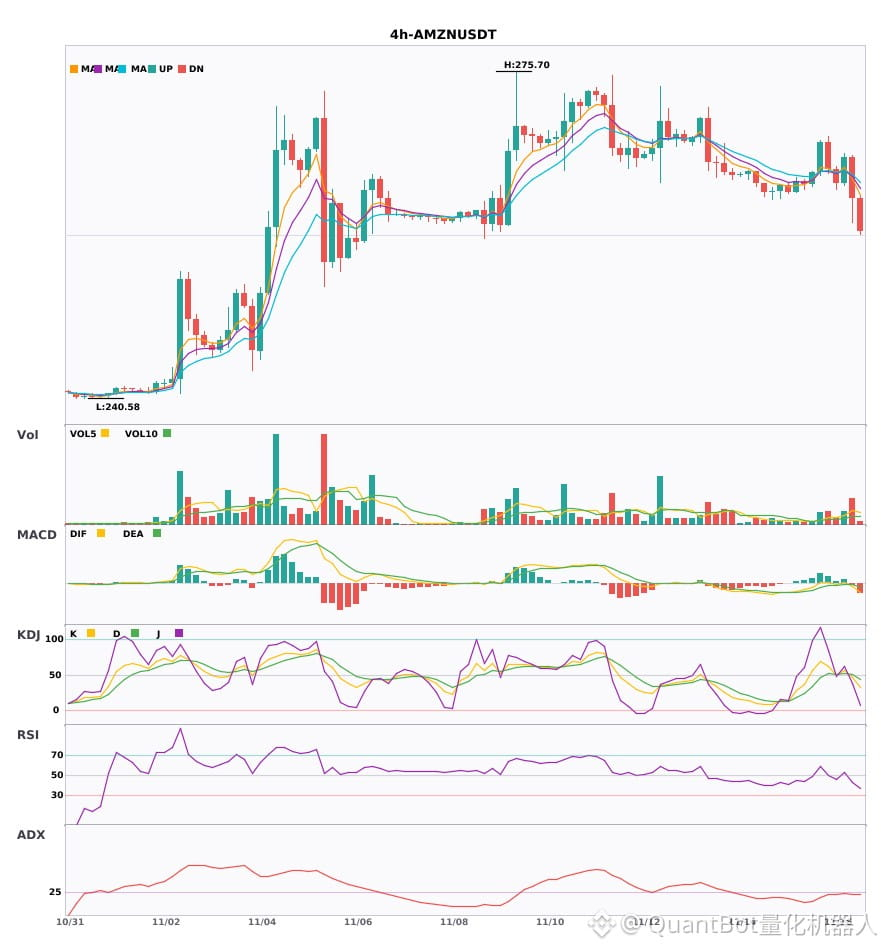
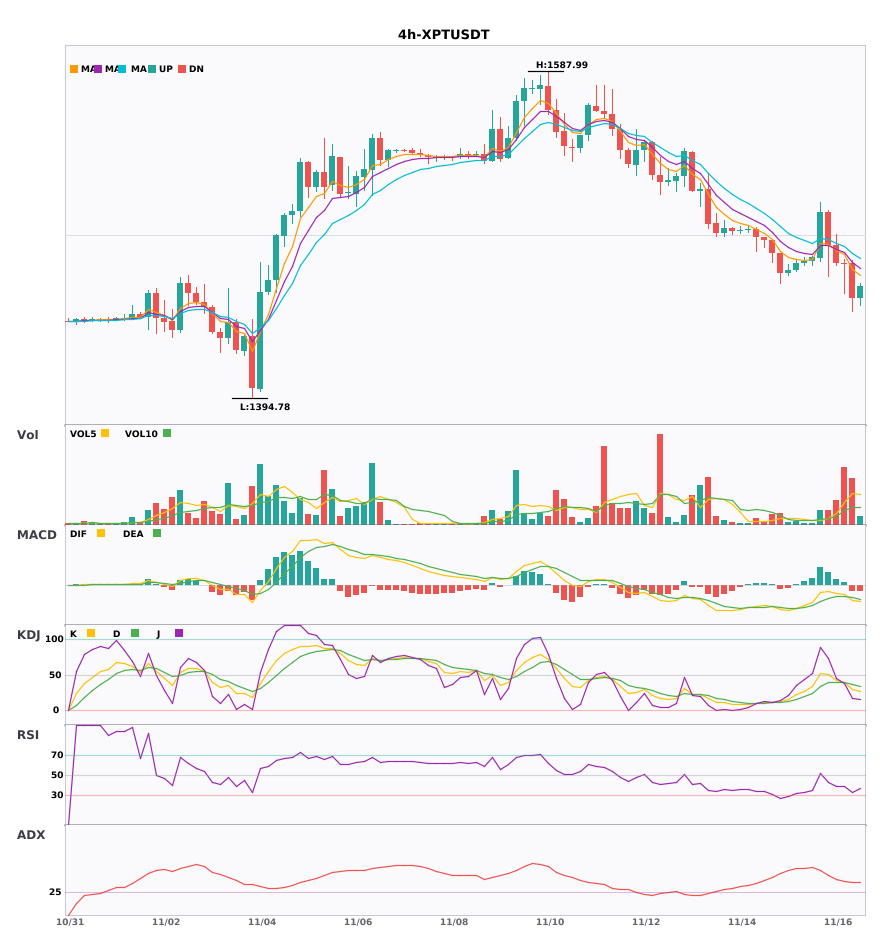
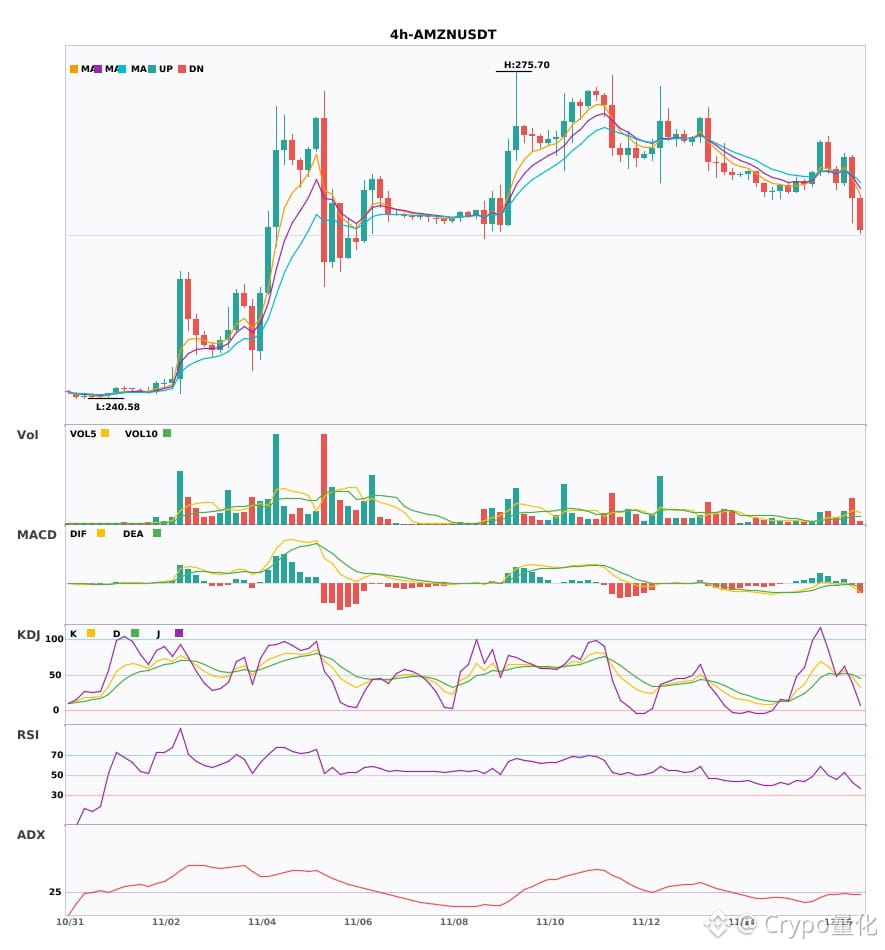
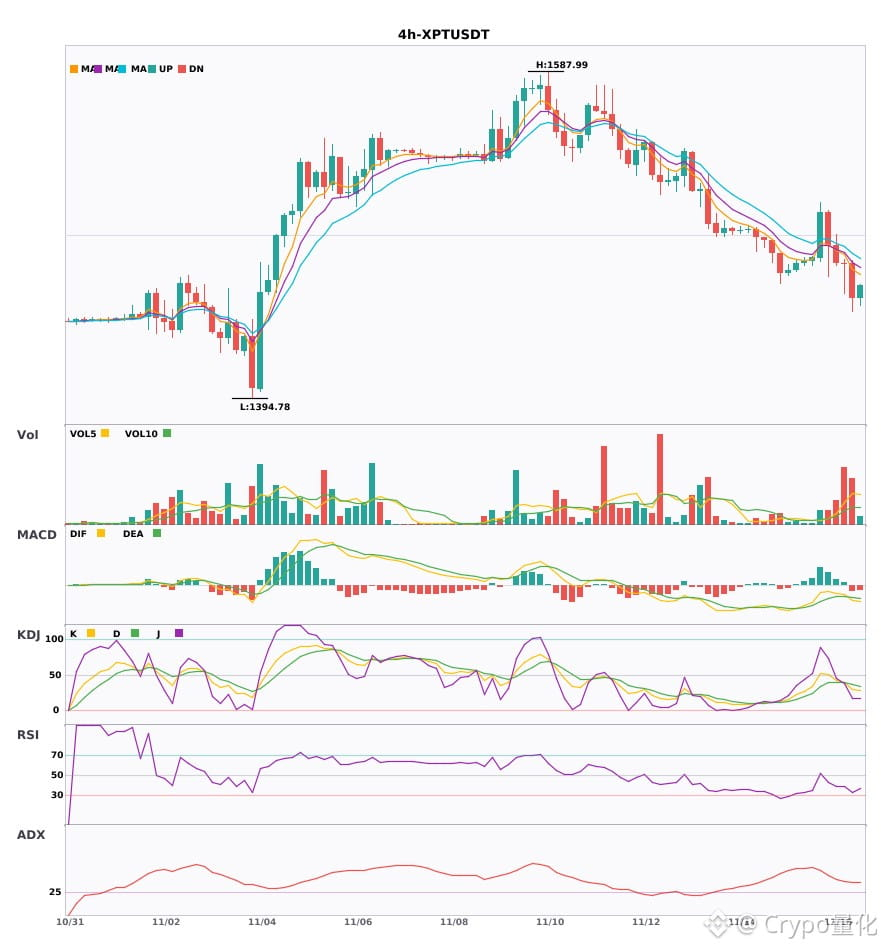
$META/$AMZN/$XPT 4H-level bearish confluence signal confirmed
📉 $META | 4-hour bearish signal
━━━━━━━━━━━━━━━━━━
Technical analysis: ADX(27) trend established; MACD bearish cross below zero; EMA5 breaks below 8, turning bearish; strong KDJ at 50.9/54.8; volume 5.1x
Price change: -1.2000%
📉 $AMZN | 4-hour bearish signal
━━━━━━━━━━━━━━━━━━
Technical analysis: ADX(25) trend formed, suitable for entry|MACD bearish cross below zero|EMA5/8 bearish cross|KDJ bearish cross (46.5/50.6)|Volume up 3x
Price change: -1.6700%
📉 $XPT | 4-hour bearish signal
━━━━━━━━━━━━━━━━━━
Technical analysis: ADX(38) strong trend | MACD bearish cross below zero accelerating | EMA5/8/13 bearish alignment | Weak KDJ (K:29.9, D:36.5) | Volume up 4.1x
Price change: -1.4100%
━━━━━━━━━━━━━━━━━━
#技术分析 #META #AMZN #XPT
📌 The above is for reference only and does not constitute investment advice
$META /$AMZN /$XPT 4H-level bearish confluence signal confirmed
📉 $META | 4-hour bearish signal
━━━━━━━━━━━━━━━━━━
Technical analysis: ADX(27) trend established; MACD bearish cross below zero; EMA5 breaks below 8, turning bearish; strong KDJ at 50.9/54.8; volume 5.1x
Price change: -1.2000%
📉 $AMZN | 4-hour bearish signal
━━━━━━━━━━━━━━━━━━
Technical analysis: ADX(25) trend formed, suitable for entry|MACD bearish cross below zero|EMA5/8 bearish cross|KDJ bearish cross (46.5/50.6)|Volume up 3x
Price change: -1.6700%
📉 $XPT | 4-hour bearish signal
━━━━━━━━━━━━━━━━━━
Technical analysis: ADX(38) strong trend | MACD bearish cross below zero accelerating | EMA5/8/13 bearish alignment | Weak KDJ (K:29.9, D:36.5) | Volume up 4.1x
Price change: -1.4100%
━━━━━━━━━━━━━━━━━━
#技术分析 #META #AMZN #XPT
📌 The above is for reference only and does not constitute investment advice
📉 $META | 4-hour bearish signal
━━━━━━━━━━━━━━━━━━
Technical analysis: ADX(27) trend established; MACD bearish cross below zero; EMA5 breaks below 8, turning bearish; strong KDJ at 50.9/54.8; volume 5.1x
Price change: -1.2000%
📉 $AMZN | 4-hour bearish signal
━━━━━━━━━━━━━━━━━━
Technical analysis: ADX(25) trend formed, suitable for entry|MACD bearish cross below zero|EMA5/8 bearish cross|KDJ bearish cross (46.5/50.6)|Volume up 3x
Price change: -1.6700%
📉 $XPT | 4-hour bearish signal
━━━━━━━━━━━━━━━━━━
Technical analysis: ADX(38) strong trend | MACD bearish cross below zero accelerating | EMA5/8/13 bearish alignment | Weak KDJ (K:29.9, D:36.5) | Volume up 4.1x
Price change: -1.4100%
━━━━━━━━━━━━━━━━━━
#技术分析 #META #AMZN #XPT
📌 The above is for reference only and does not constitute investment advice
2
·
--
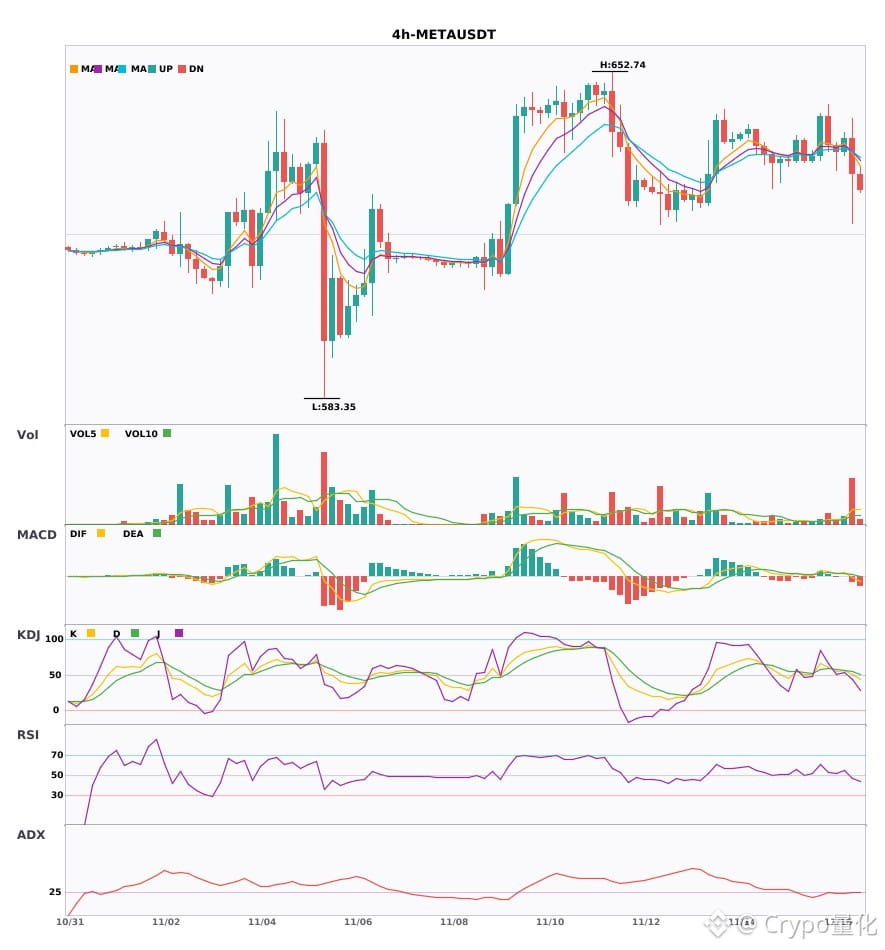
$META/$AMZN/$XPT 4-hour charts are all weakening; don't rush to buy the dip 🔥
════════════════════
🟢 $META 4-hour bearish signal
⚠️ Technicals: The ADX trend is just starting, so there may be an opportunity to enter|MACD death cross, bears are gaining momentum|EMA has turned bearish in the short term|KDJ favors the bulls|Trading volume surged 5.1x
════════════════════
🟢 $AMZN 4-hour bearish signal
⚠️ Technicals: The trend is just taking shape, so there may be an opportunity to enter. MACD death cross below zero, bears are gaining momentum. Moving averages have turned bearish in the short term. KDJ death cross, but not oversold. Volume surged 3x.
════════════════════
🟢 $XPT 4-hour bearish signal
⚠️ Technicals: The trend is clear. MACD death cross below zero, with bears gaining momentum. Moving averages are bearishly aligned and heading down. KDJ is weak, favoring the bears. Trading volume increased 4.1x.
════════════════════
🔔 Follow for first-hand market alerts 🔔
#技术分析 #META #AMZN #XPT
📌 When trading, watch for whether the candlestick pattern meets your criteria
$META /$AMZN /$XPT 4-hour charts are all weakening; don't rush to buy the dip 🔥
════════════════════
🟢 $META 4-hour bearish signal
⚠️ Technicals: The ADX trend is just starting, so there may be an opportunity to enter|MACD death cross, bears are gaining momentum|EMA has turned bearish in the short term|KDJ favors the bulls|Trading volume surged 5.1x
════════════════════
🟢 $AMZN 4-hour bearish signal
⚠️ Technicals: The trend is just taking shape, so there may be an opportunity to enter. MACD death cross below zero, bears are gaining momentum. Moving averages have turned bearish in the short term. KDJ death cross, but not oversold. Volume surged 3x.
════════════════════
🟢 $XPT 4-hour bearish signal
⚠️ Technicals: The trend is clear. MACD death cross below zero, with bears gaining momentum. Moving averages are bearishly aligned and heading down. KDJ is weak, favoring the bears. Trading volume increased 4.1x.
════════════════════
🔔 Follow for first-hand market alerts 🔔
#技术分析 #META #AMZN #XPT
📌 When trading, watch for whether the candlestick pattern meets your criteria
════════════════════
🟢 $META 4-hour bearish signal
⚠️ Technicals: The ADX trend is just starting, so there may be an opportunity to enter|MACD death cross, bears are gaining momentum|EMA has turned bearish in the short term|KDJ favors the bulls|Trading volume surged 5.1x
════════════════════
🟢 $AMZN 4-hour bearish signal
⚠️ Technicals: The trend is just taking shape, so there may be an opportunity to enter. MACD death cross below zero, bears are gaining momentum. Moving averages have turned bearish in the short term. KDJ death cross, but not oversold. Volume surged 3x.
════════════════════
🟢 $XPT 4-hour bearish signal
⚠️ Technicals: The trend is clear. MACD death cross below zero, with bears gaining momentum. Moving averages are bearishly aligned and heading down. KDJ is weak, favoring the bears. Trading volume increased 4.1x.
════════════════════
🔔 Follow for first-hand market alerts 🔔
#技术分析 #META #AMZN #XPT
📌 When trading, watch for whether the candlestick pattern meets your criteria
2
·
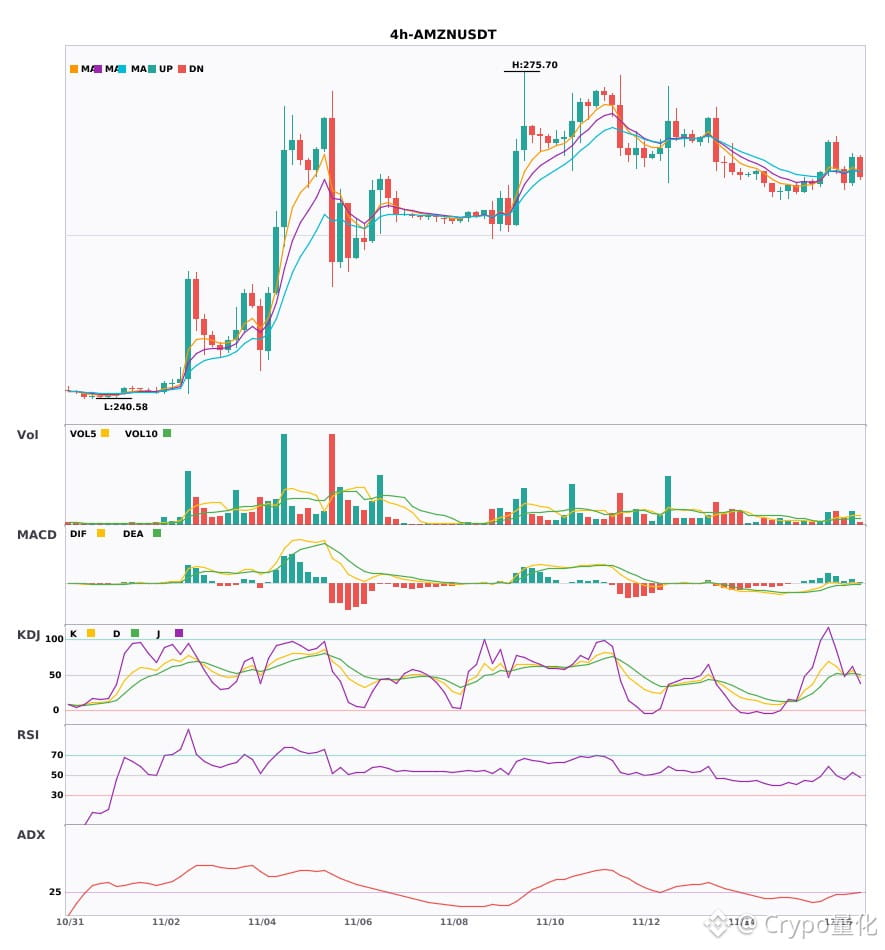
--
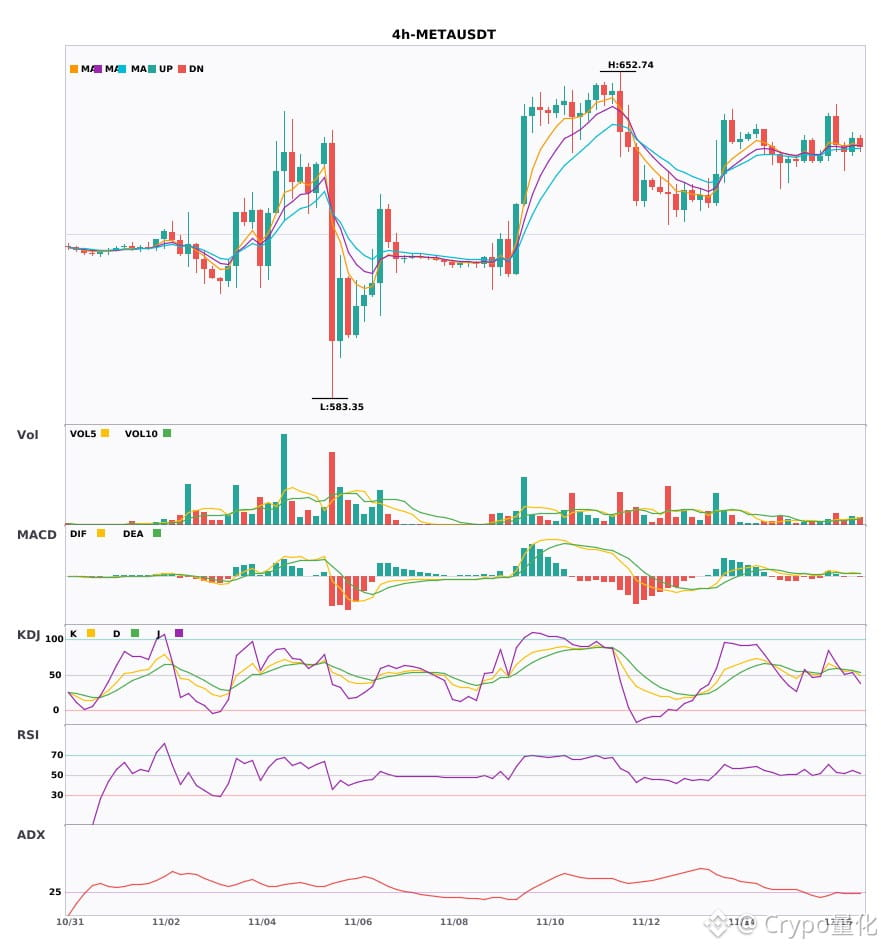
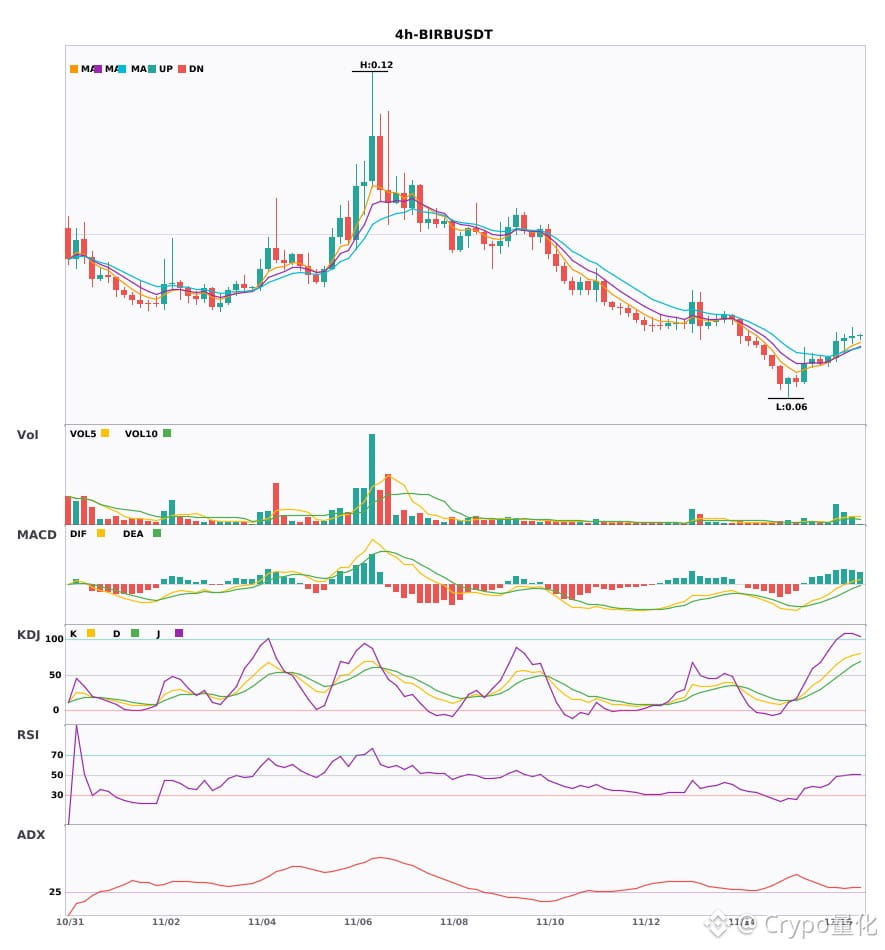
$META $BIRB $AMZN 4 hours strengthening together—who will break out first? 🔥
════════════════════
🔴 $META 4-hour bullish signal
⚠️Technical analysis: ADX trend taking shape; worth following | MACD bullish crossover, red bars growing | EMA5>8>13 bullish alignment and divergence | KDJ strong, K slightly below D | Volume up 1.6x
════════════════════
🔴 $BIRB 4-hour bullish signal
⚠️Technical analysis: ADX shows a fairly clear trend. Bullish after the MACD crossover, though momentum has weakened a little. Moving averages have just formed a bullish alignment and are diverging. In KDJ, K crossed above D and is strong, but not overbought. Volume up 2.3x.
════════════════════
🔴 $AMZN 4-hour bullish signal
⚠️Technical analysis: A trend is taking shape; worth watching. MACD bullish crossover with rising volume and growing red bars—bullish bias. Moving averages have just formed a bullish alignment and are diverging upward. In KDJ, K crossed above D and has not reached the overbought zone; short-term bias is bullish. Volume up about 1.9x.
════════════════════
🔔 Follow for first-hand market alerts 🔔
#技术分析 #META #BIRB #AMZN
📌 When trading, pay attention to whether the candlestick pattern confirms the signal
$META $BIRB $AMZN 4 hours strengthening together—who will break out first? 🔥
════════════════════
🔴 $META 4-hour bullish signal
⚠️Technical analysis: ADX trend taking shape; worth following | MACD bullish crossover, red bars growing | EMA5>8>13 bullish alignment and divergence | KDJ strong, K slightly below D | Volume up 1.6x
════════════════════
🔴 $BIRB 4-hour bullish signal
⚠️Technical analysis: ADX shows a fairly clear trend. Bullish after the MACD crossover, though momentum has weakened a little. Moving averages have just formed a bullish alignment and are diverging. In KDJ, K crossed above D and is strong, but not overbought. Volume up 2.3x.
════════════════════
🔴 $AMZN 4-hour bullish signal
⚠️Technical analysis: A trend is taking shape; worth watching. MACD bullish crossover with rising volume and growing red bars—bullish bias. Moving averages have just formed a bullish alignment and are diverging upward. In KDJ, K crossed above D and has not reached the overbought zone; short-term bias is bullish. Volume up about 1.9x.
════════════════════
🔔 Follow for first-hand market alerts 🔔
#技术分析 #META #BIRB #AMZN
📌 When trading, pay attention to whether the candlestick pattern confirms the signal
════════════════════
🔴 $META 4-hour bullish signal
⚠️Technical analysis: ADX trend taking shape; worth following | MACD bullish crossover, red bars growing | EMA5>8>13 bullish alignment and divergence | KDJ strong, K slightly below D | Volume up 1.6x
════════════════════
🔴 $BIRB 4-hour bullish signal
⚠️Technical analysis: ADX shows a fairly clear trend. Bullish after the MACD crossover, though momentum has weakened a little. Moving averages have just formed a bullish alignment and are diverging. In KDJ, K crossed above D and is strong, but not overbought. Volume up 2.3x.
════════════════════
🔴 $AMZN 4-hour bullish signal
⚠️Technical analysis: A trend is taking shape; worth watching. MACD bullish crossover with rising volume and growing red bars—bullish bias. Moving averages have just formed a bullish alignment and are diverging upward. In KDJ, K crossed above D and has not reached the overbought zone; short-term bias is bullish. Volume up about 1.9x.
════════════════════
🔔 Follow for first-hand market alerts 🔔
#技术分析 #META #BIRB #AMZN
📌 When trading, pay attention to whether the candlestick pattern confirms the signal
3
·
--
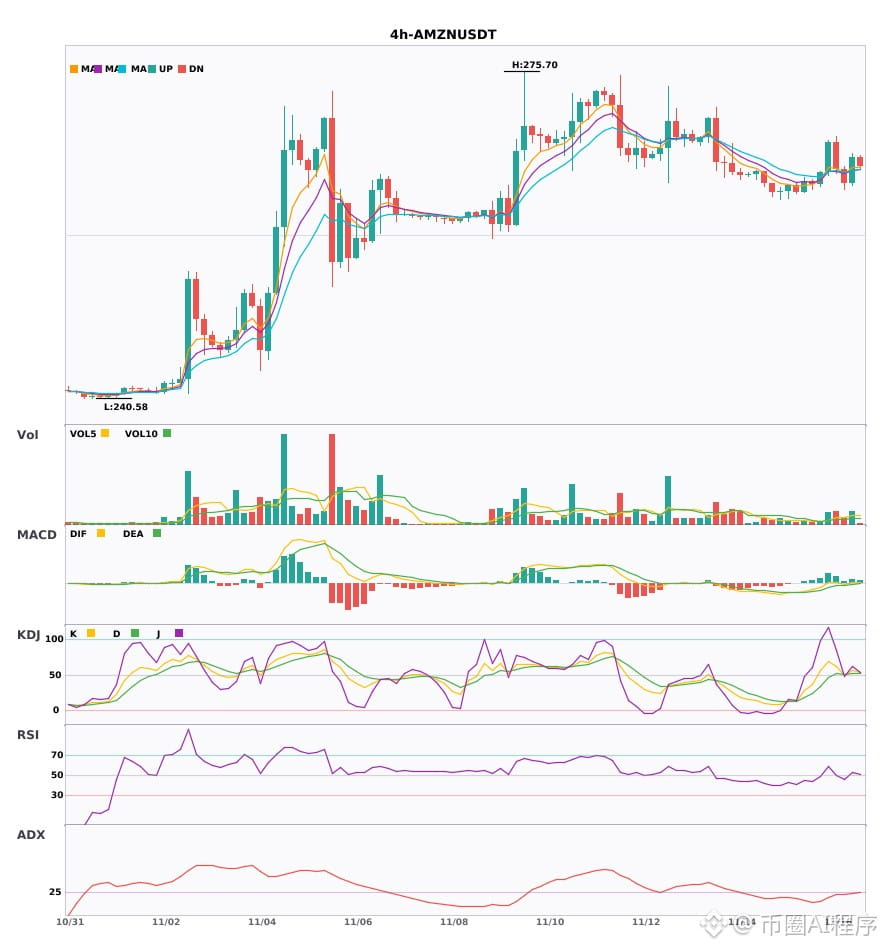
$AMZN 4-hour and daily bullish confluence; volume surges after the golden cross—short-term opportunity is here 🔥
════════════════════
🔴 $AMZN 4-hour bullish signal
⚠️ Technical analysis: Daily bullish trend + 4-hour entry confluence confirmed! Volume surged after the MACD golden cross, breaking above the zero line. Moving averages are in bullish alignment and diverging upward. K crossed above D without entering overbought territory; volume increased 1.9x.
════════════════════
🔔 Follow to get first-hand updates on market movements 🔔
#多周期共振 #AMZN
📌 When trading, check whether the candlestick pattern meets the criteria.
$AMZN 4-hour and daily bullish confluence; volume surges after the golden cross—short-term opportunity is here 🔥
════════════════════
🔴 $AMZN 4-hour bullish signal
⚠️ Technical analysis: Daily bullish trend + 4-hour entry confluence confirmed! Volume surged after the MACD golden cross, breaking above the zero line. Moving averages are in bullish alignment and diverging upward. K crossed above D without entering overbought territory; volume increased 1.9x.
════════════════════
🔔 Follow to get first-hand updates on market movements 🔔
#多周期共振 #AMZN
📌 When trading, check whether the candlestick pattern meets the criteria.
════════════════════
🔴 $AMZN 4-hour bullish signal
⚠️ Technical analysis: Daily bullish trend + 4-hour entry confluence confirmed! Volume surged after the MACD golden cross, breaking above the zero line. Moving averages are in bullish alignment and diverging upward. K crossed above D without entering overbought territory; volume increased 1.9x.
════════════════════
🔔 Follow to get first-hand updates on market movements 🔔
#多周期共振 #AMZN
📌 When trading, check whether the candlestick pattern meets the criteria.
4
Log in to explore more content
Join global crypto users on Binance Square
⚡️ Get latest and useful information about crypto.
💬 Trusted by the world’s largest crypto exchange.
👍 Discover real insights from verified creators.
Email / Phone number
Trending Topics
1
#NvidiaLoses$2.7TrillionInMonthAndAHalf
31,852 views
167 Discussing
2
#CanBTCReboundAfterFallingBelow60K?
885,652 views
3,275 Discussing
3
#GlobalStocksFaceLongestLosingStreakSince2023
334,416 views
2,188 Discussing
4
#BlackRockIBITPostsRecord$541MSingleDayOutflow
44,222 views
121 Discussing
5
#AnthropicPlungesTowardIPOPriceonDay2
172,904 views
1,343 Discussing
6
#TwentyOneCapitalAdds172.25BTC
81,154 views
776 Discussing
7
#HKBillWouldExcludeTokenizedDepositsFromVirtualAssets
11,937 views
57 Discussing
8
#BNBDropsBelow540USDTWith8.46%DailyDecline
91,486 views
732 Discussing
9
#HKBillProposesHK$100KFineForUnauthorizedCryptoTitles
3,150 views
29 Discussing
10
#BitMineFaces$10.1BUnrealizedETHLoss
6,324 views
32 Discussing