
#xpt
xpt
94,091 views
796 Discussing
Hot
Latest

·
--
🚨 $XPT USDT.P Daily Analysis: Breakdown Below 1.618 Fib & Key Levels! 📉📊
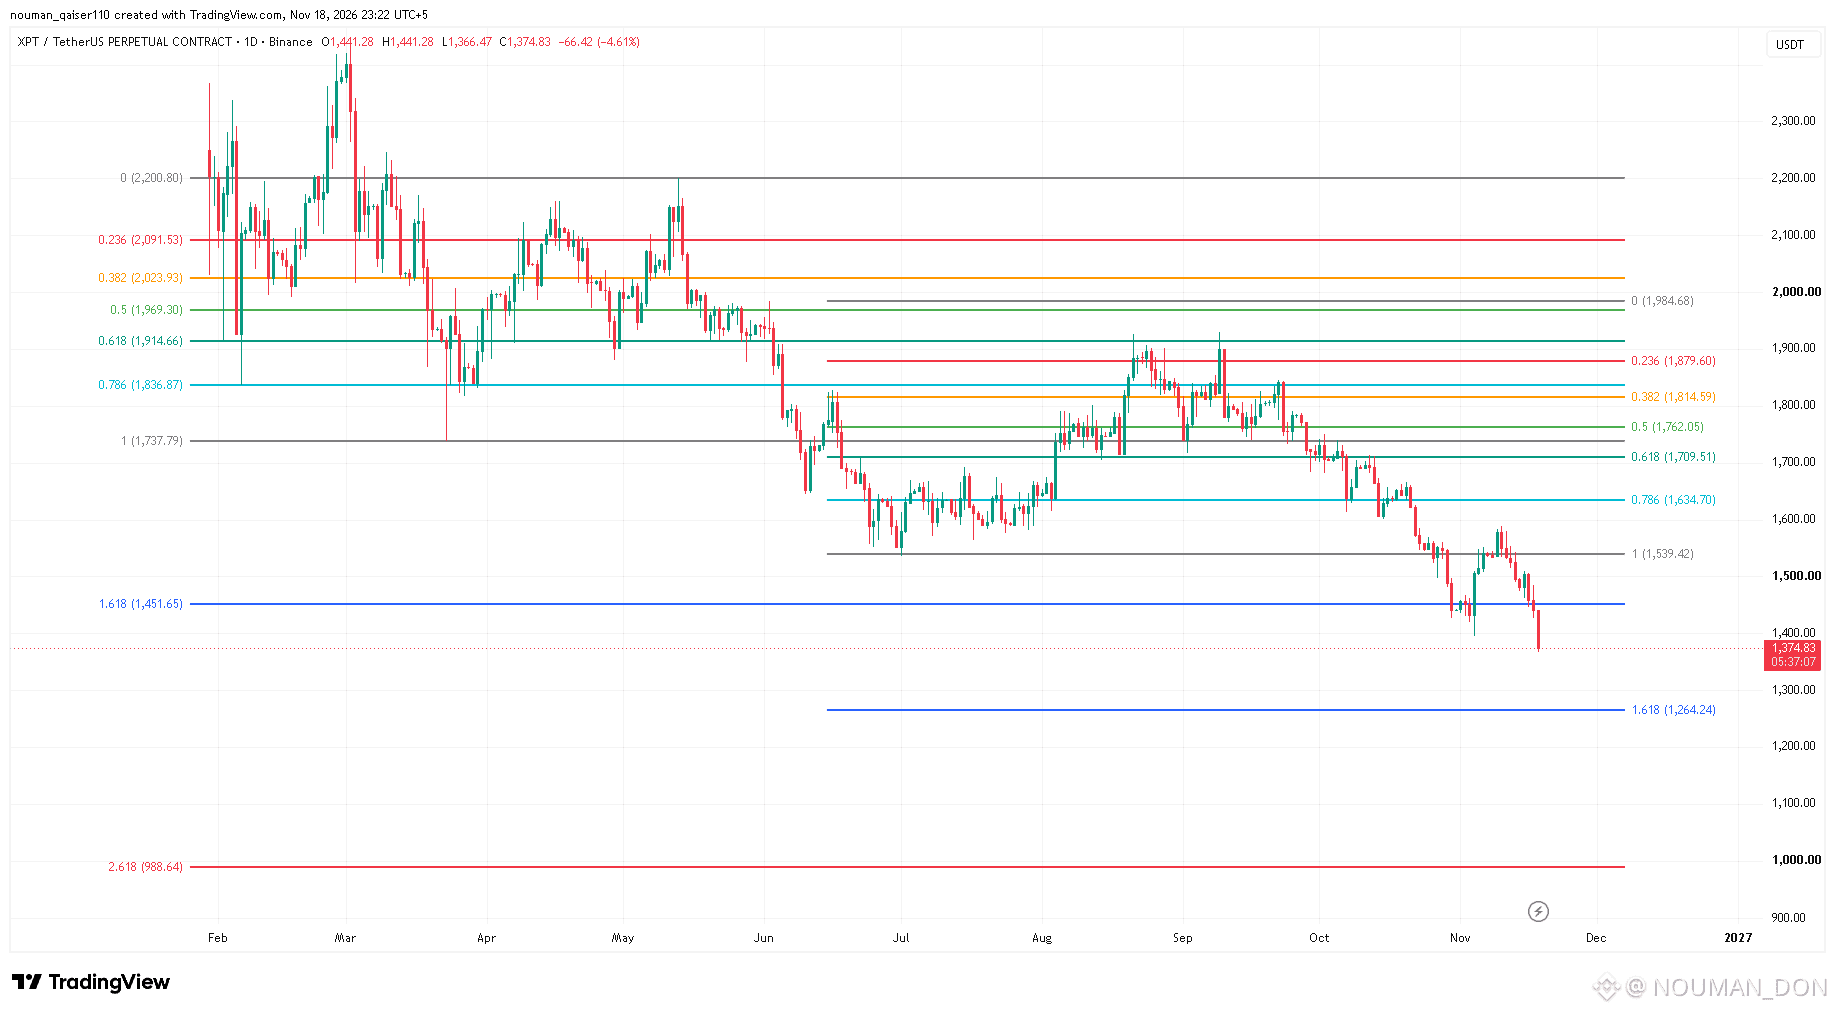
Platinum ($XPT) is trading around $1,374.80 (-4.61%) on the 1D chart, accelerating downward after losing a critical macro support floor.
🔹 Key Breakdown & Resistance: Price just sliced below the $1,451.65 (1.618 macro Fib) support level, turning it into immediate overhead resistance alongside the $1,539.42 (1.0 local Fib) swing pivot.
🔹 Next Downside Support Zones: With bearish momentum dominant, the next high-probability demand target sits at the $1,264.24 (1.618 local Fib) extension, followed by deeper macro support near $985.60 (2.618 Fib).
🔹 Bullish Recovery Trigger: Bulls must decisively reclaim $1,452 on a daily close to invalidate the breakdown and target $1,634.70.
Wait for price stabilization around $1,264 before catching falling knives! 👀📉
#XPT #xptusdt #platinum #TechnicalAnalysis #BinanceFutures
{future}(XPTUSDT)
🚨 $XPT USDT.P Daily Analysis: Breakdown Below 1.618 Fib & Key Levels! 📉📊
Platinum ($XPT ) is trading around $1,374.80 (-4.61%) on the 1D chart, accelerating downward after losing a critical macro support floor.
🔹 Key Breakdown & Resistance: Price just sliced below the $1,451.65 (1.618 macro Fib) support level, turning it into immediate overhead resistance alongside the $1,539.42 (1.0 local Fib) swing pivot.
🔹 Next Downside Support Zones: With bearish momentum dominant, the next high-probability demand target sits at the $1,264.24 (1.618 local Fib) extension, followed by deeper macro support near $985.60 (2.618 Fib).
🔹 Bullish Recovery Trigger: Bulls must decisively reclaim $1,452 on a daily close to invalidate the breakdown and target $1,634.70.
Wait for price stabilization around $1,264 before catching falling knives! 👀📉
#XPT #xptusdt #platinum #TechnicalAnalysis #BinanceFutures
Platinum ($XPT ) is trading around $1,374.80 (-4.61%) on the 1D chart, accelerating downward after losing a critical macro support floor.
🔹 Key Breakdown & Resistance: Price just sliced below the $1,451.65 (1.618 macro Fib) support level, turning it into immediate overhead resistance alongside the $1,539.42 (1.0 local Fib) swing pivot.
🔹 Next Downside Support Zones: With bearish momentum dominant, the next high-probability demand target sits at the $1,264.24 (1.618 local Fib) extension, followed by deeper macro support near $985.60 (2.618 Fib).
🔹 Bullish Recovery Trigger: Bulls must decisively reclaim $1,452 on a daily close to invalidate the breakdown and target $1,634.70.
Wait for price stabilization around $1,264 before catching falling knives! 👀📉
#XPT #xptusdt #platinum #TechnicalAnalysis #BinanceFutures
1
70

·
--
3 coins: 30-minute + 4-hour bearish convergence; trend confirmed, further decline expected 🔥
════════════════════
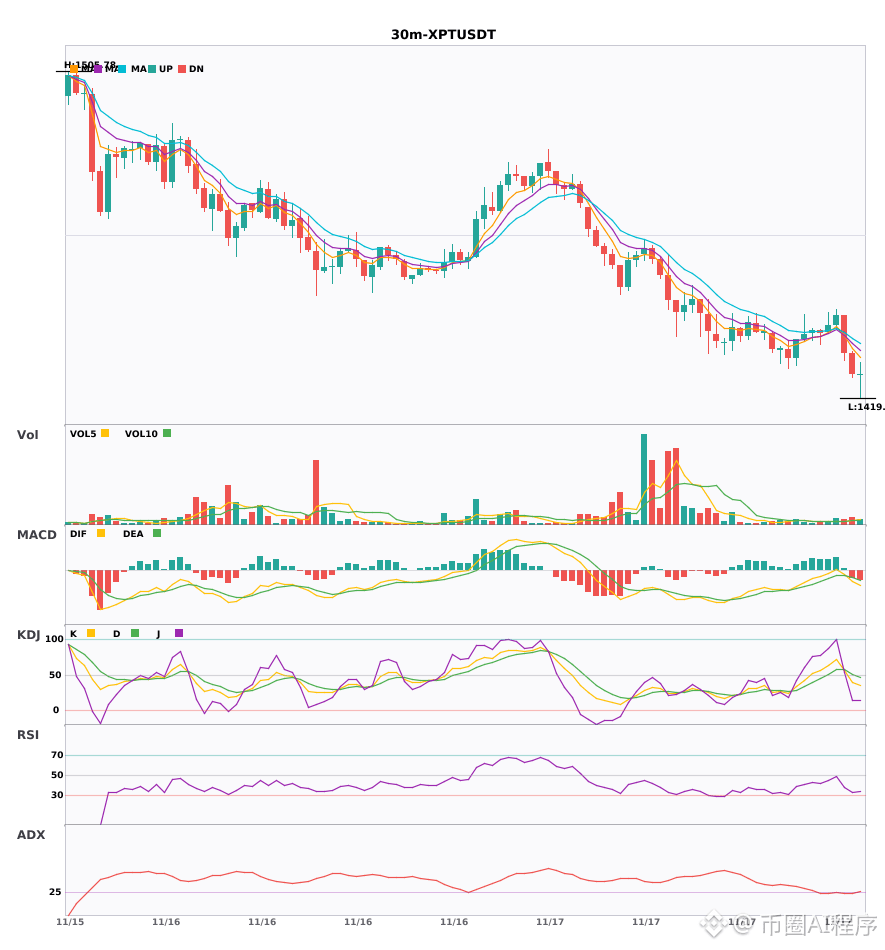
🟢 $XPT 30-minute bearish signal
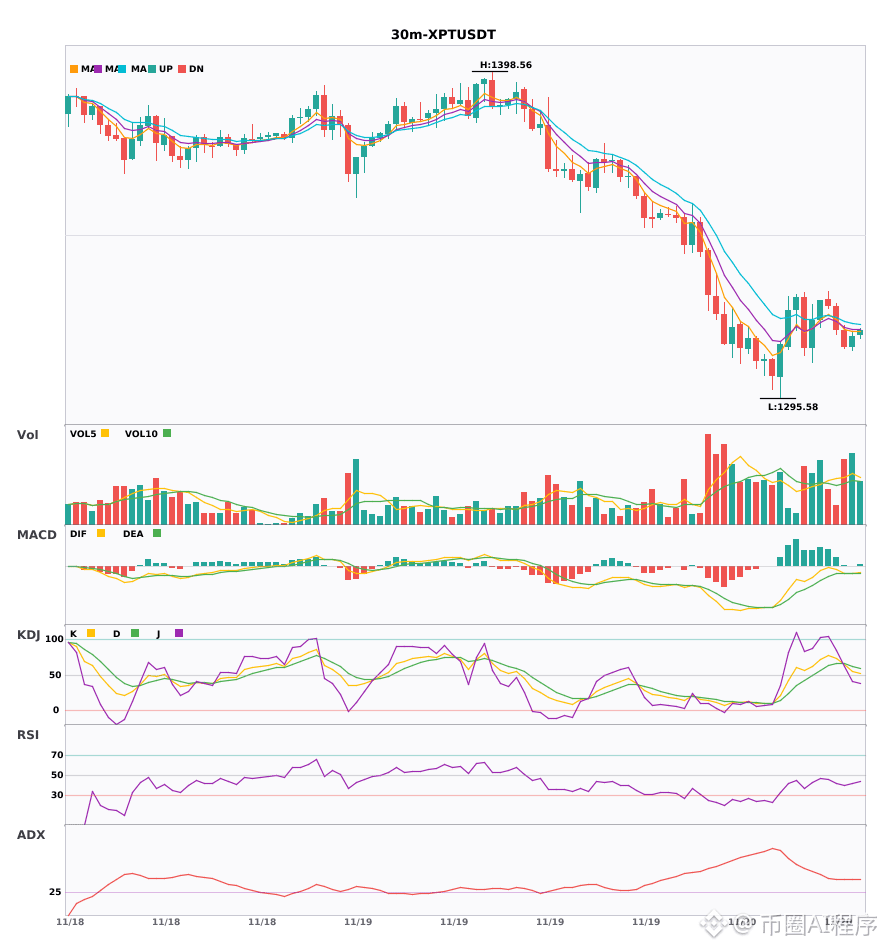
⚠️Technical analysis: The 4-hour bearish direction is confirmed. On the 30-minute chart, EMA5 has just crossed below EMA8, forming a bearish alignment. KDJ has formed a death cross, with K crossing below D, but has not yet entered oversold territory. Trading volume has increased 1.6 times. Multiple timeframes converge to indicate a bearish outlook.
════════════════════
🟢 $META 30-minute bearish signal
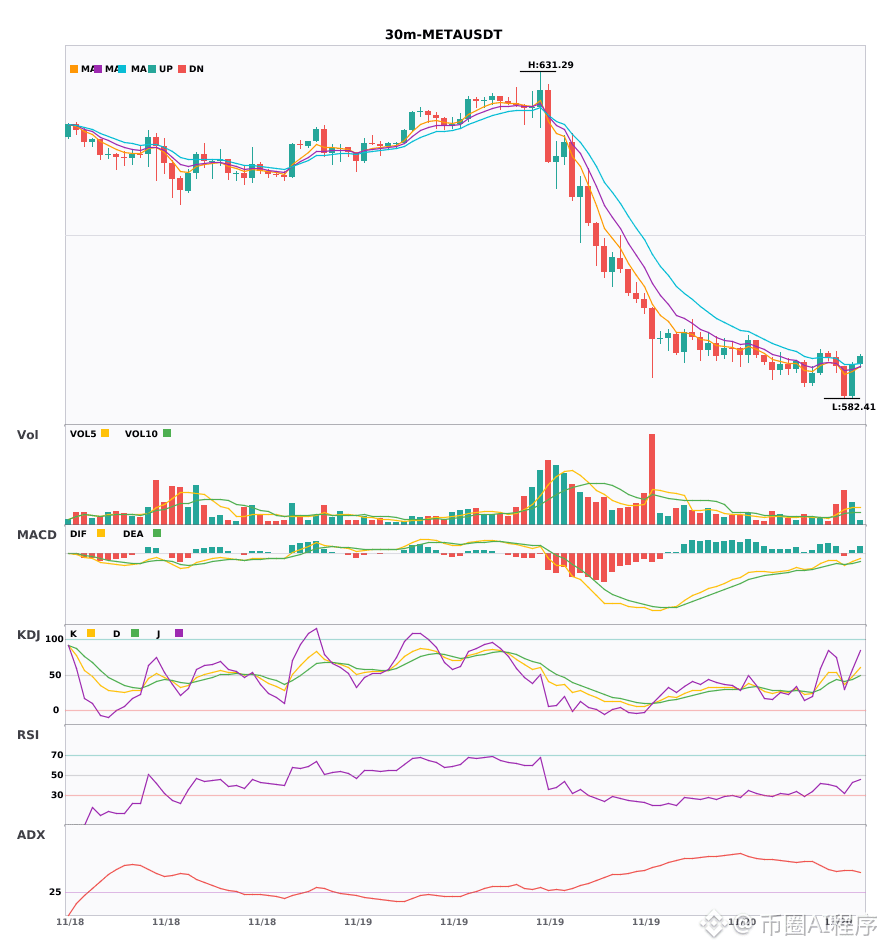
⚠️Technical analysis: The 4-hour and 30-minute bearish signals are confirmed in alignment. MACD has formed a death cross below zero, with volume accelerating the move. The moving averages have just formed a bearish alignment. KDJ has formed a death cross but is not oversold. Volume has surged 2.9 times. The converging short signal is clear.
════════════════════
🟢 $WIF 30-minute bearish signal
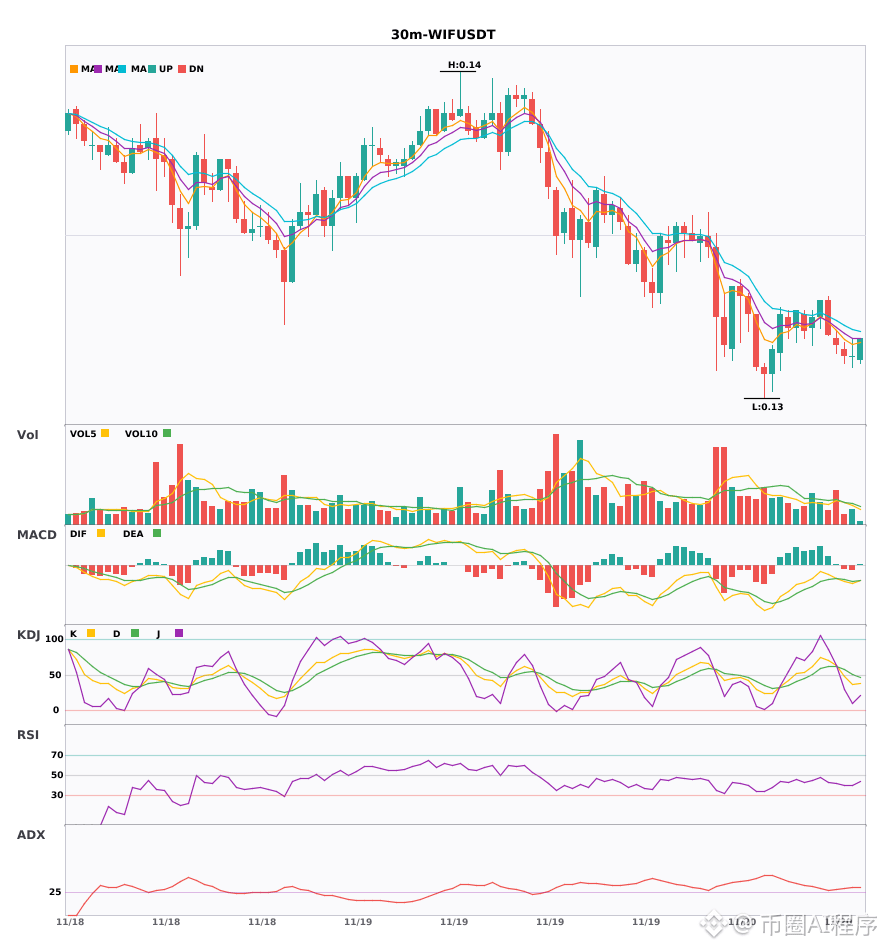
⚠️Technical analysis: The 4-hour bearish trend is confirmed, and a 30-minute entry signal has appeared. After the MACD death cross, the green bars continue to expand. The moving averages are bearishly aligned and spreading downward. KDJ has formed a death cross and has not entered oversold territory. The 4-hour and 30-minute timeframes converge to indicate a bearish outlook.
════════════════════
🔔 Follow for first-hand market updates 🔔
#多周期共振 #XPT #META #WIF
📌 When trading, pay attention to whether the candlestick pattern aligns
3 coins: 30-minute + 4-hour bearish convergence; trend confirmed, further decline expected 🔥
════════════════════
🟢 $XPT 30-minute bearish signal
⚠️Technical analysis: The 4-hour bearish direction is confirmed. On the 30-minute chart, EMA5 has just crossed below EMA8, forming a bearish alignment. KDJ has formed a death cross, with K crossing below D, but has not yet entered oversold territory. Trading volume has increased 1.6 times. Multiple timeframes converge to indicate a bearish outlook.
════════════════════
🟢 $META 30-minute bearish signal
⚠️Technical analysis: The 4-hour and 30-minute bearish signals are confirmed in alignment. MACD has formed a death cross below zero, with volume accelerating the move. The moving averages have just formed a bearish alignment. KDJ has formed a death cross but is not oversold. Volume has surged 2.9 times. The converging short signal is clear.
════════════════════
🟢 $WIF 30-minute bearish signal
⚠️Technical analysis: The 4-hour bearish trend is confirmed, and a 30-minute entry signal has appeared. After the MACD death cross, the green bars continue to expand. The moving averages are bearishly aligned and spreading downward. KDJ has formed a death cross and has not entered oversold territory. The 4-hour and 30-minute timeframes converge to indicate a bearish outlook.
════════════════════
🔔 Follow for first-hand market updates 🔔
#多周期共振 #XPT #META #WIF
📌 When trading, pay attention to whether the candlestick pattern aligns
════════════════════
🟢 $XPT 30-minute bearish signal
⚠️Technical analysis: The 4-hour bearish direction is confirmed. On the 30-minute chart, EMA5 has just crossed below EMA8, forming a bearish alignment. KDJ has formed a death cross, with K crossing below D, but has not yet entered oversold territory. Trading volume has increased 1.6 times. Multiple timeframes converge to indicate a bearish outlook.
════════════════════
🟢 $META 30-minute bearish signal
⚠️Technical analysis: The 4-hour and 30-minute bearish signals are confirmed in alignment. MACD has formed a death cross below zero, with volume accelerating the move. The moving averages have just formed a bearish alignment. KDJ has formed a death cross but is not oversold. Volume has surged 2.9 times. The converging short signal is clear.
════════════════════
🟢 $WIF 30-minute bearish signal
⚠️Technical analysis: The 4-hour bearish trend is confirmed, and a 30-minute entry signal has appeared. After the MACD death cross, the green bars continue to expand. The moving averages are bearishly aligned and spreading downward. KDJ has formed a death cross and has not entered oversold territory. The 4-hour and 30-minute timeframes converge to indicate a bearish outlook.
════════════════════
🔔 Follow for first-hand market updates 🔔
#多周期共振 #XPT #META #WIF
📌 When trading, pay attention to whether the candlestick pattern aligns
7
·
--
Three coins bearish on both the 30-minute and 4-hour timeframes; bearish confluence confirmed 🔥
════════════════════
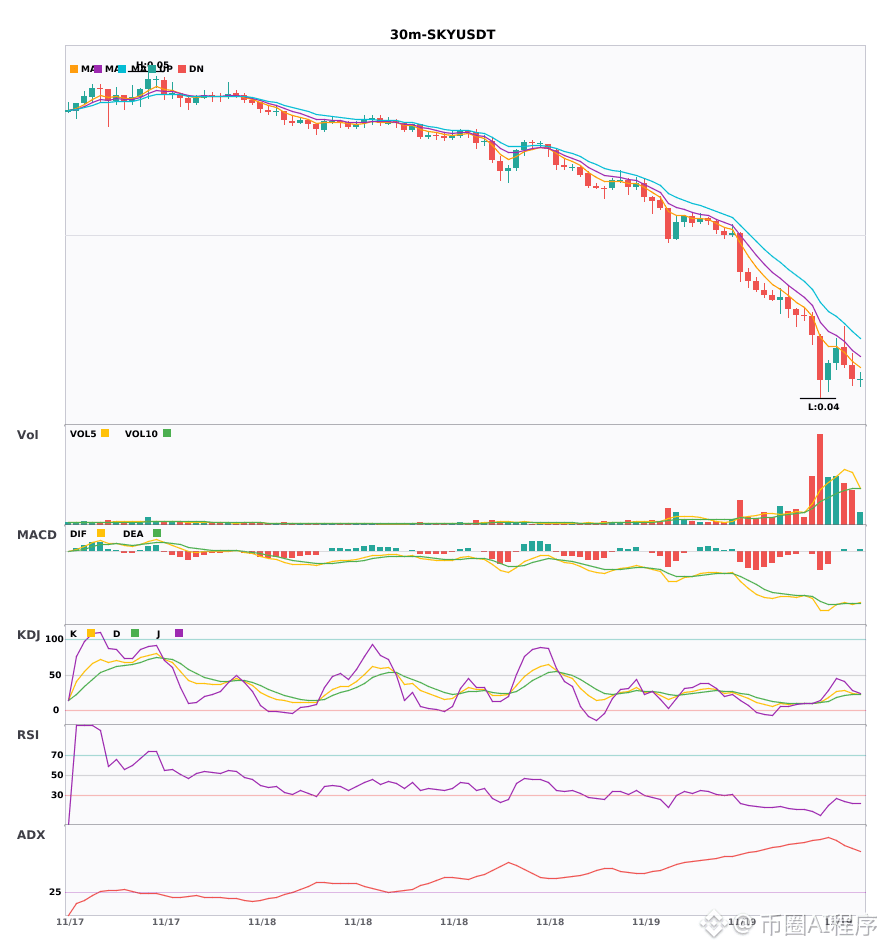
🟢 $SKY 30-minute bearish signal
⚠️ Technical analysis: 30-minute entry + 4-hour bearish confluence confirmed! MACD death cross with expanding green bars; moving averages aligned bearishly and trending down; KDJ favors bearish momentum; volume up 1.2x.
📢 Market update: SKY plunged 12%, with losses widening against BTC and ETH. It has fallen about 38% over the past four weeks, far more than Bitcoin's 22% drop. Its TVL and USDS circulation continue to decline.
════════════════════
🟢 $Bull Comes 30-minute bearish signal
⚠️ Technical analysis: 4-hour bearish confluence confirmed, with a 30-minute entry: MACD death cross below the zero line, with green bars continuing to expand; EMA5 crossed below EMA8, forming a bearish alignment; KDJ K crossed below D and remains weak, with volume up 4.2x. Multiple timeframes align bearishly.
════════════════════
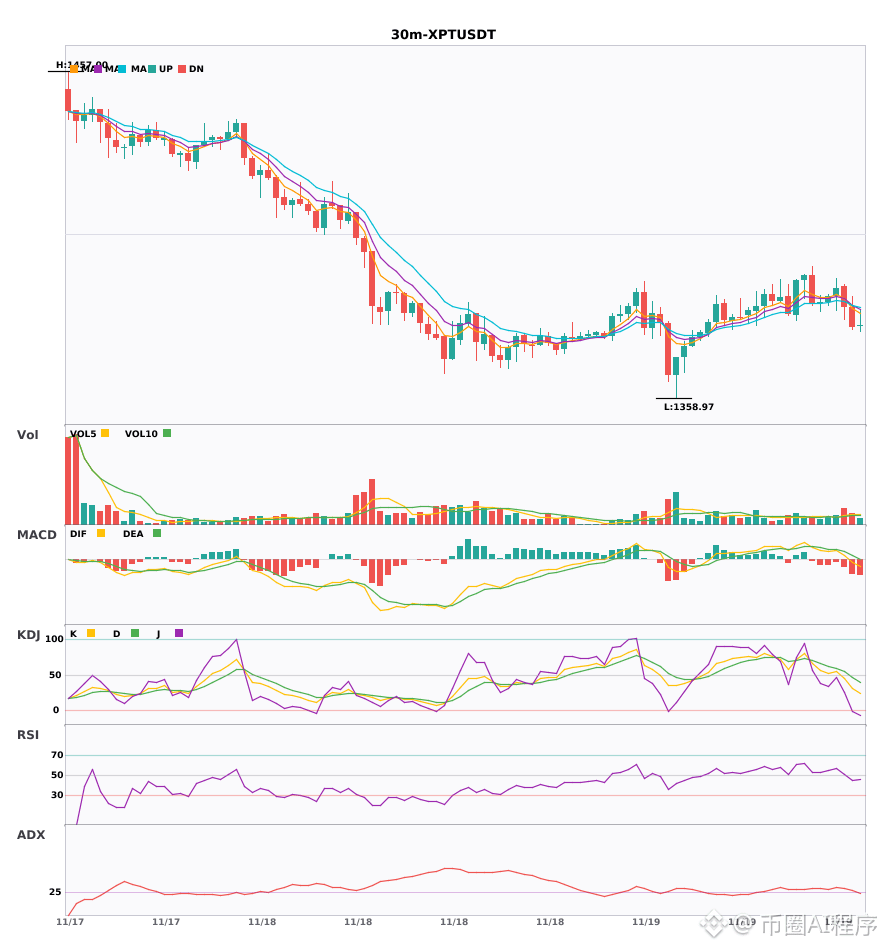
🟢 $XPT 30-minute bearish signal
⚠️ Technical analysis: 4-hour + 30-minute bearish confluence: MACD death cross below the zero line, EMA5 crossed below EMA8 in a bearish alignment, KDJ K crossed below D without entering oversold territory, and volume up 1.9x—confluence for a short.
════════════════════
🔔 Follow for first-hand market updates 🔔
#多周期共振 #SKY #牛来 #XPT
📌 When trading, check whether the candlestick pattern aligns.
Three coins bearish on both the 30-minute and 4-hour timeframes; bearish confluence confirmed 🔥
════════════════════
🟢 $SKY 30-minute bearish signal
⚠️ Technical analysis: 30-minute entry + 4-hour bearish confluence confirmed! MACD death cross with expanding green bars; moving averages aligned bearishly and trending down; KDJ favors bearish momentum; volume up 1.2x.
📢 Market update: SKY plunged 12%, with losses widening against BTC and ETH. It has fallen about 38% over the past four weeks, far more than Bitcoin's 22% drop. Its TVL and USDS circulation continue to decline.
════════════════════
🟢 $Bull Comes 30-minute bearish signal
⚠️ Technical analysis: 4-hour bearish confluence confirmed, with a 30-minute entry: MACD death cross below the zero line, with green bars continuing to expand; EMA5 crossed below EMA8, forming a bearish alignment; KDJ K crossed below D and remains weak, with volume up 4.2x. Multiple timeframes align bearishly.
════════════════════
🟢 $XPT 30-minute bearish signal
⚠️ Technical analysis: 4-hour + 30-minute bearish confluence: MACD death cross below the zero line, EMA5 crossed below EMA8 in a bearish alignment, KDJ K crossed below D without entering oversold territory, and volume up 1.9x—confluence for a short.
════════════════════
🔔 Follow for first-hand market updates 🔔
#多周期共振 #SKY #牛来 #XPT
📌 When trading, check whether the candlestick pattern aligns.
════════════════════
🟢 $SKY 30-minute bearish signal
⚠️ Technical analysis: 30-minute entry + 4-hour bearish confluence confirmed! MACD death cross with expanding green bars; moving averages aligned bearishly and trending down; KDJ favors bearish momentum; volume up 1.2x.
📢 Market update: SKY plunged 12%, with losses widening against BTC and ETH. It has fallen about 38% over the past four weeks, far more than Bitcoin's 22% drop. Its TVL and USDS circulation continue to decline.
════════════════════
🟢 $Bull Comes 30-minute bearish signal
⚠️ Technical analysis: 4-hour bearish confluence confirmed, with a 30-minute entry: MACD death cross below the zero line, with green bars continuing to expand; EMA5 crossed below EMA8, forming a bearish alignment; KDJ K crossed below D and remains weak, with volume up 4.2x. Multiple timeframes align bearishly.
════════════════════
🟢 $XPT 30-minute bearish signal
⚠️ Technical analysis: 4-hour + 30-minute bearish confluence: MACD death cross below the zero line, EMA5 crossed below EMA8 in a bearish alignment, KDJ K crossed below D without entering oversold territory, and volume up 1.9x—confluence for a short.
════════════════════
🔔 Follow for first-hand market updates 🔔
#多周期共振 #SKY #牛来 #XPT
📌 When trading, check whether the candlestick pattern aligns.
46

·
--
$PANW $Bull Is Coming $XPT : both weakening across 30 minutes. Watch the risk—don't hold losing positions! 🔥
════════════════════
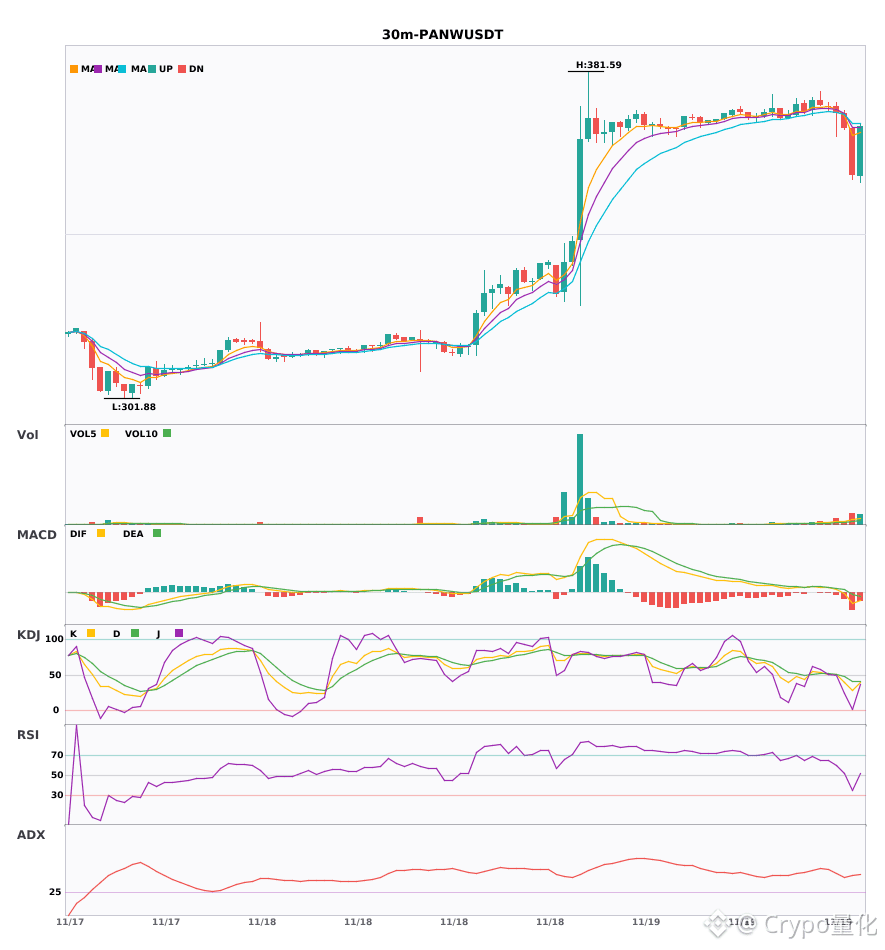
🟢 $PANW 30-minute bearish signal
⚠️Technical analysis: ADX at 43 indicates a clear trend; MACD has fallen below the zero line, turning bearish; EMA5 crossed below EMA8, indicating short-term weakness; KDJ's K is below D, with no bullish crossover yet; volume is up 2.7x.
════════════════════
🟢 $Bull Is Coming 30-minute bearish signal
⚠️Technical analysis: ADX at 25—the trend is just forming, so it may be worth taking a position; MACD has fallen below the zero line, turning bearish; EMA5 crossed below EMA8, turning bearish in the short term; KDJ K crossed below D, with bears in control (K39, D48); volume is up 4.2x.
════════════════════
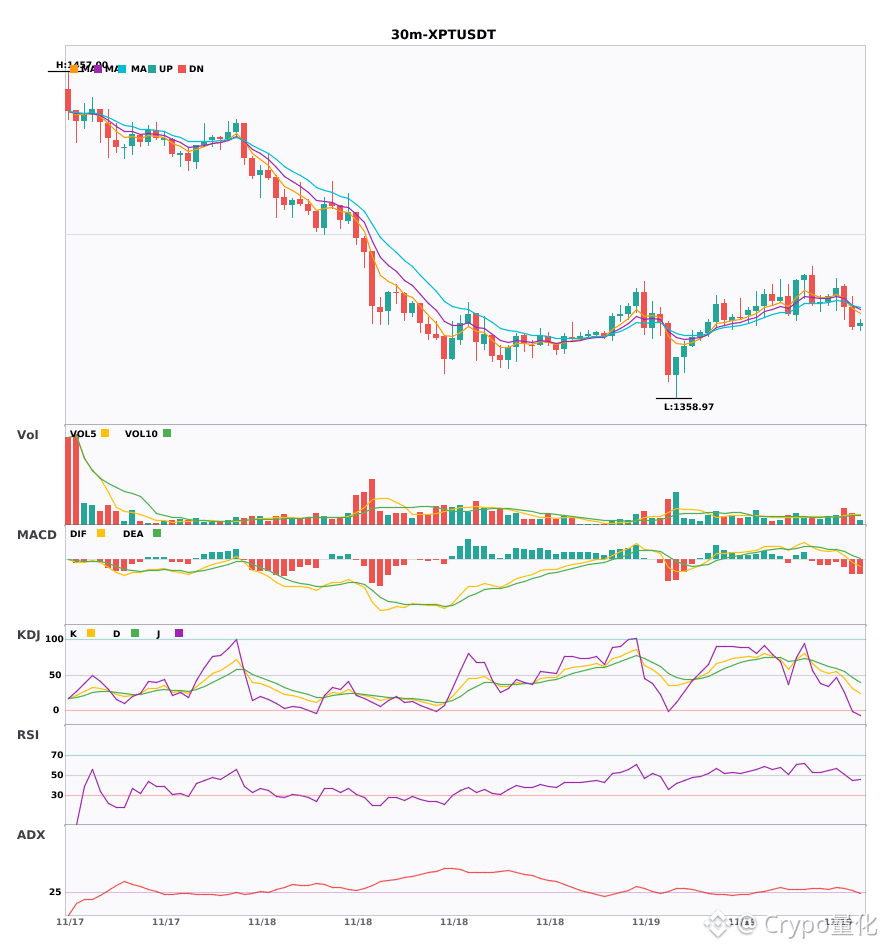
🟢 $XPT 30-minute bearish signal
⚠️Technical analysis: The ADX trend is just forming and can be followed | MACD bearish crossover | Moving averages have just turned bearish | KDJ is weak, with K below D but not oversold | Volume is up 1.9x
════════════════════
🔔 Follow for the latest market alerts 🔔
#技术分析 #PANW #牛来 #XPT
📌 When trading, check whether the candlestick pattern aligns
$PANW $Bull Is Coming $XPT : both weakening across 30 minutes. Watch the risk—don't hold losing positions! 🔥
════════════════════
🟢 $PANW 30-minute bearish signal
⚠️Technical analysis: ADX at 43 indicates a clear trend; MACD has fallen below the zero line, turning bearish; EMA5 crossed below EMA8, indicating short-term weakness; KDJ's K is below D, with no bullish crossover yet; volume is up 2.7x.
════════════════════
🟢 $Bull Is Coming 30-minute bearish signal
⚠️Technical analysis: ADX at 25—the trend is just forming, so it may be worth taking a position; MACD has fallen below the zero line, turning bearish; EMA5 crossed below EMA8, turning bearish in the short term; KDJ K crossed below D, with bears in control (K39, D48); volume is up 4.2x.
════════════════════
🟢 $XPT 30-minute bearish signal
⚠️Technical analysis: The ADX trend is just forming and can be followed | MACD bearish crossover | Moving averages have just turned bearish | KDJ is weak, with K below D but not oversold | Volume is up 1.9x
════════════════════
🔔 Follow for the latest market alerts 🔔
#技术分析 #PANW #牛来 #XPT
📌 When trading, check whether the candlestick pattern aligns
════════════════════
🟢 $PANW 30-minute bearish signal
⚠️Technical analysis: ADX at 43 indicates a clear trend; MACD has fallen below the zero line, turning bearish; EMA5 crossed below EMA8, indicating short-term weakness; KDJ's K is below D, with no bullish crossover yet; volume is up 2.7x.
════════════════════
🟢 $Bull Is Coming 30-minute bearish signal
⚠️Technical analysis: ADX at 25—the trend is just forming, so it may be worth taking a position; MACD has fallen below the zero line, turning bearish; EMA5 crossed below EMA8, turning bearish in the short term; KDJ K crossed below D, with bears in control (K39, D48); volume is up 4.2x.
════════════════════
🟢 $XPT 30-minute bearish signal
⚠️Technical analysis: The ADX trend is just forming and can be followed | MACD bearish crossover | Moving averages have just turned bearish | KDJ is weak, with K below D but not oversold | Volume is up 1.9x
════════════════════
🔔 Follow for the latest market alerts 🔔
#技术分析 #PANW #牛来 #XPT
📌 When trading, check whether the candlestick pattern aligns
45
·
--
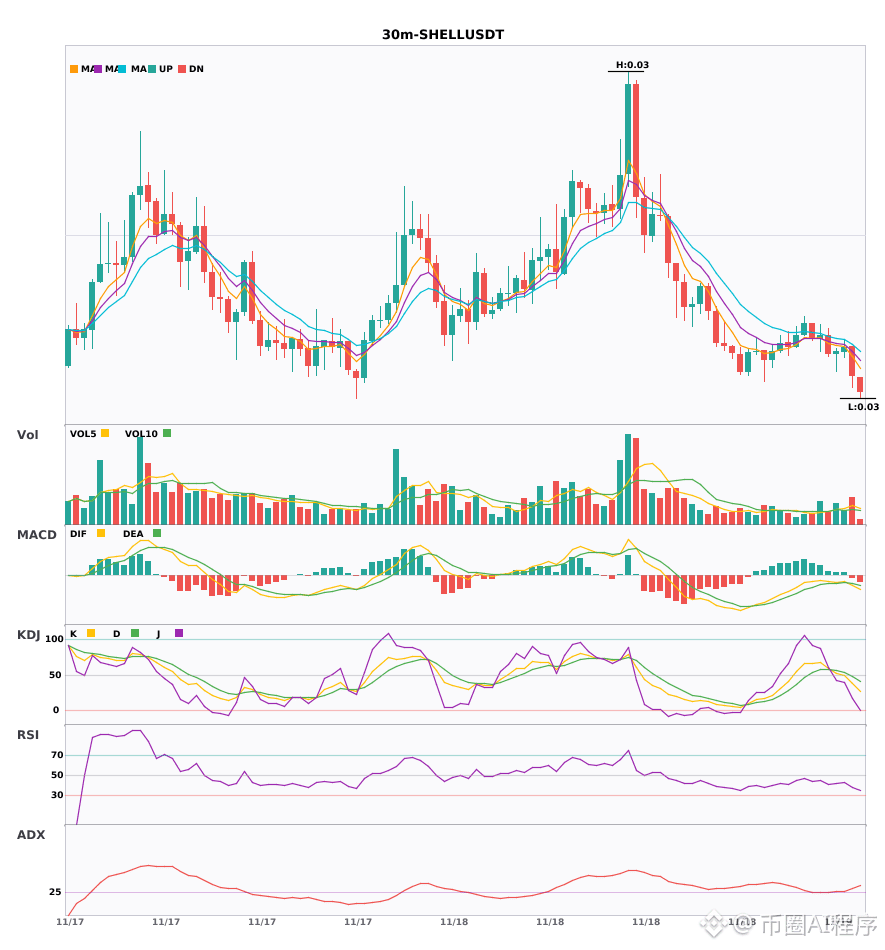
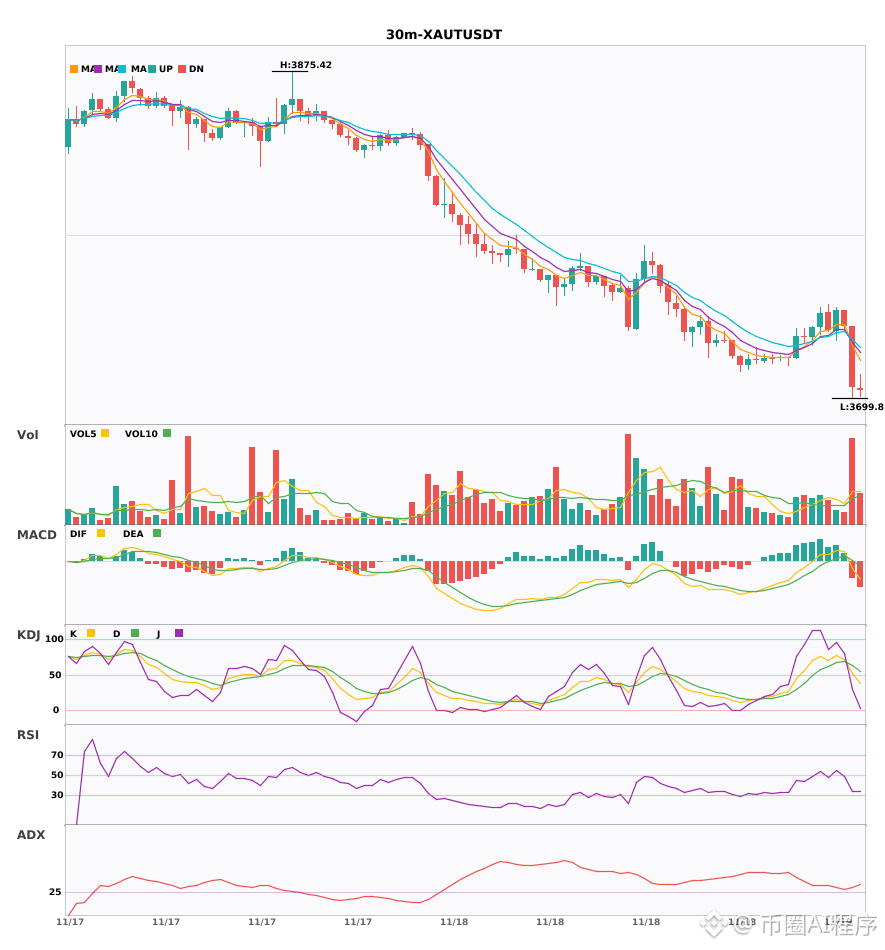
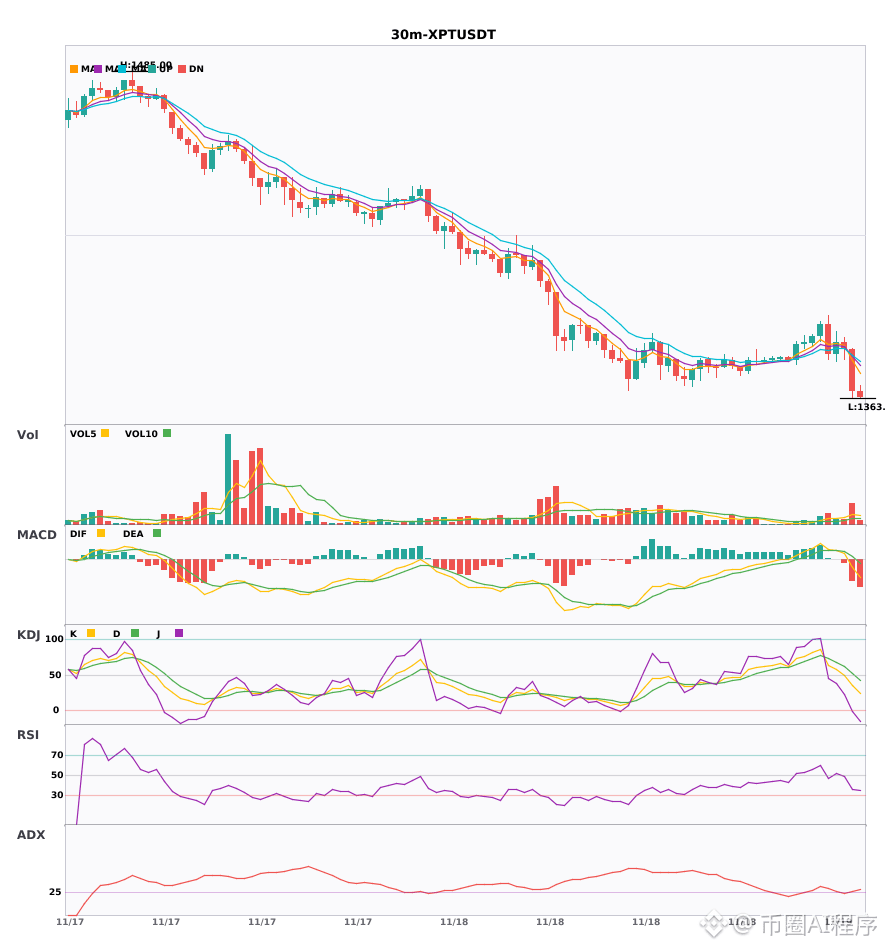
$SHELL $XAUT $XPT Multi-timeframe confluence weakening; 4-hour bearish trend just confirmed 🔥
════════════════════
🟢 $SHELL 30-minute short signal
⚠️Technical analysis: The 4-hour and 30-minute bearish signals are confirmed in confluence. The 30-minute MACD has formed a bearish cross below zero, moving averages are bearishly aligned and trending downward, KDJ is weak, and volume has increased 1.8 times—clear bearish confluence.
📢Market update: MyShell (SHELL) airdrop ongoing: Binance's second HODLer airdrop has been announced. Holding BNB Simple Earn qualifies you for retroactive SHELL rewards. SHELL locked products offer up to 29.9% annualized returns (2025-08-27).
════════════════════
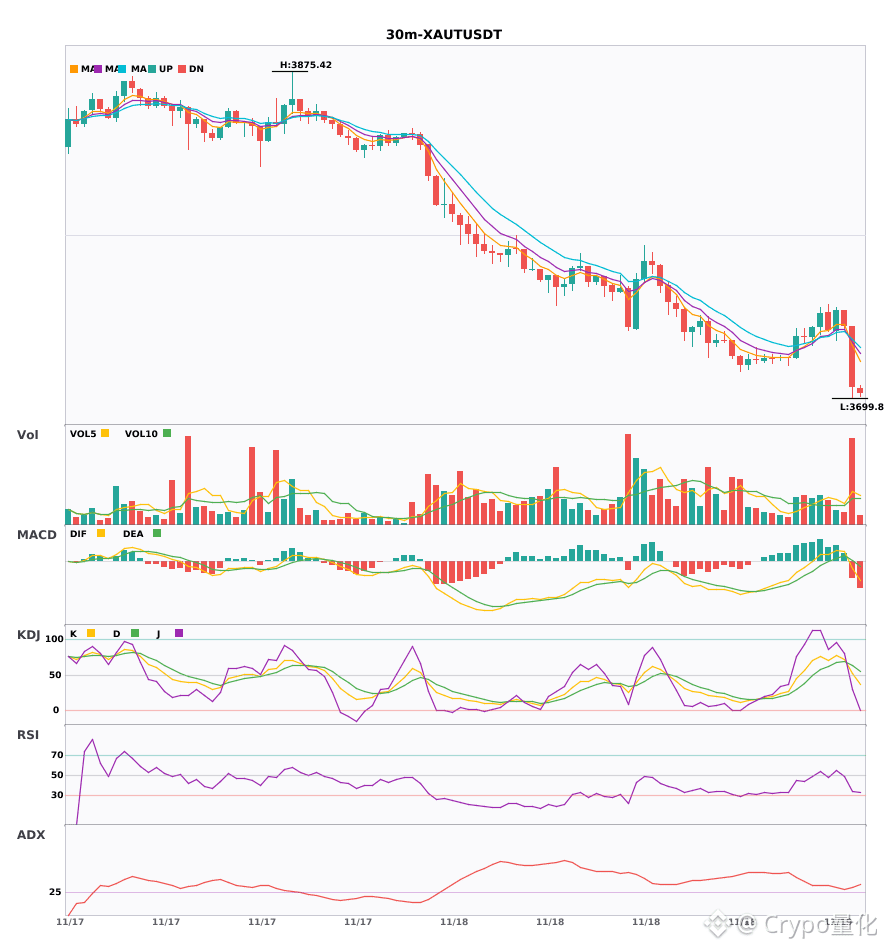
🟢 $XAUT 30-minute short signal
⚠️Technical analysis: Bearish confluence across the 4-hour and 30-minute timeframes—short in the same direction across multiple timeframes! The 30-minute MACD has formed a bearish cross below zero, with the green histogram bars growing. Moving averages have just formed a bearish alignment, KDJ has formed a bearish cross and is not yet in the oversold zone, and volume has surged 3.2 times. Short with the trend.
════════════════════
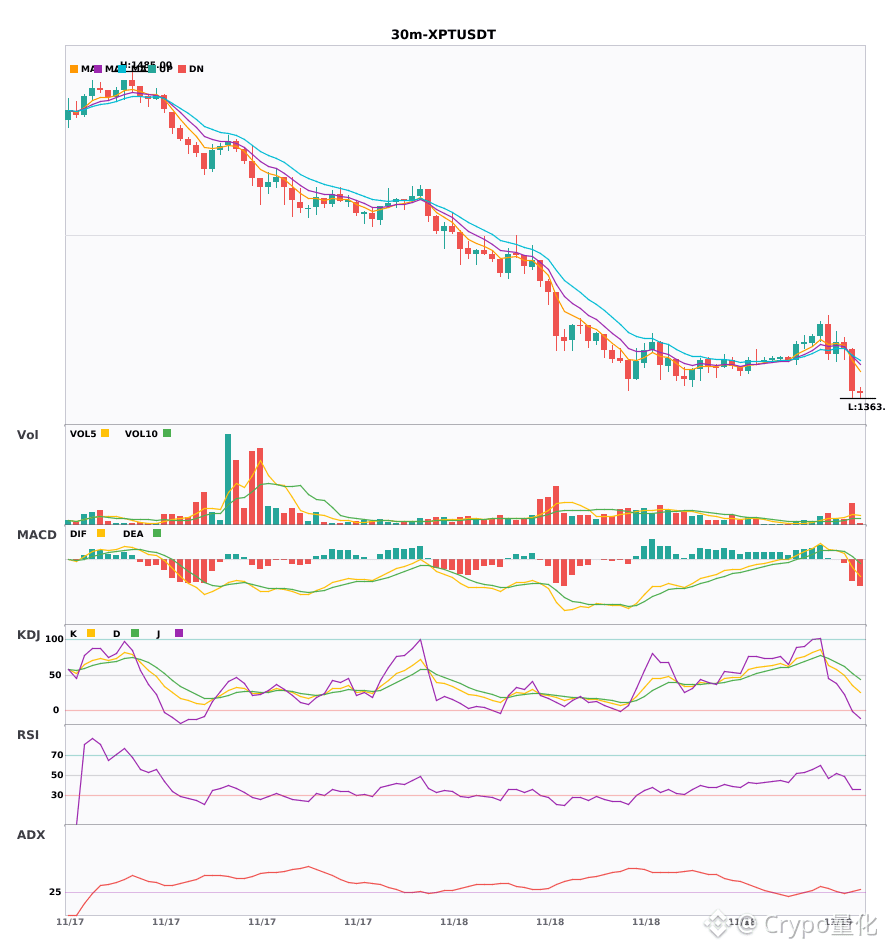
🟢 $XPT 30-minute short signal
⚠️Technical analysis: 4-hour bearish trend and 30-minute confluence confirmed. MACD has formed a bearish cross, broken below the zero line, and volume has expanded. EMA has just formed a bearish alignment, and volume has surged 3.3 times. The short signal is clear.
════════════════════
🔔 Follow for first-hand market updates 🔔
#多周期共振 #SHELL #XAUT #XPT
📌 When trading, check whether the candlestick pattern matches.
$SHELL $XAUT $XPT Multi-timeframe confluence weakening; 4-hour bearish trend just confirmed 🔥
════════════════════
🟢 $SHELL 30-minute short signal
⚠️Technical analysis: The 4-hour and 30-minute bearish signals are confirmed in confluence. The 30-minute MACD has formed a bearish cross below zero, moving averages are bearishly aligned and trending downward, KDJ is weak, and volume has increased 1.8 times—clear bearish confluence.
📢Market update: MyShell (SHELL) airdrop ongoing: Binance's second HODLer airdrop has been announced. Holding BNB Simple Earn qualifies you for retroactive SHELL rewards. SHELL locked products offer up to 29.9% annualized returns (2025-08-27).
════════════════════
🟢 $XAUT 30-minute short signal
⚠️Technical analysis: Bearish confluence across the 4-hour and 30-minute timeframes—short in the same direction across multiple timeframes! The 30-minute MACD has formed a bearish cross below zero, with the green histogram bars growing. Moving averages have just formed a bearish alignment, KDJ has formed a bearish cross and is not yet in the oversold zone, and volume has surged 3.2 times. Short with the trend.
════════════════════
🟢 $XPT 30-minute short signal
⚠️Technical analysis: 4-hour bearish trend and 30-minute confluence confirmed. MACD has formed a bearish cross, broken below the zero line, and volume has expanded. EMA has just formed a bearish alignment, and volume has surged 3.3 times. The short signal is clear.
════════════════════
🔔 Follow for first-hand market updates 🔔
#多周期共振 #SHELL #XAUT #XPT
📌 When trading, check whether the candlestick pattern matches.
════════════════════
🟢 $SHELL 30-minute short signal
⚠️Technical analysis: The 4-hour and 30-minute bearish signals are confirmed in confluence. The 30-minute MACD has formed a bearish cross below zero, moving averages are bearishly aligned and trending downward, KDJ is weak, and volume has increased 1.8 times—clear bearish confluence.
📢Market update: MyShell (SHELL) airdrop ongoing: Binance's second HODLer airdrop has been announced. Holding BNB Simple Earn qualifies you for retroactive SHELL rewards. SHELL locked products offer up to 29.9% annualized returns (2025-08-27).
════════════════════
🟢 $XAUT 30-minute short signal
⚠️Technical analysis: Bearish confluence across the 4-hour and 30-minute timeframes—short in the same direction across multiple timeframes! The 30-minute MACD has formed a bearish cross below zero, with the green histogram bars growing. Moving averages have just formed a bearish alignment, KDJ has formed a bearish cross and is not yet in the oversold zone, and volume has surged 3.2 times. Short with the trend.
════════════════════
🟢 $XPT 30-minute short signal
⚠️Technical analysis: 4-hour bearish trend and 30-minute confluence confirmed. MACD has formed a bearish cross, broken below the zero line, and volume has expanded. EMA has just formed a bearish alignment, and volume has surged 3.3 times. The short signal is clear.
════════════════════
🔔 Follow for first-hand market updates 🔔
#多周期共振 #SHELL #XAUT #XPT
📌 When trading, check whether the candlestick pattern matches.
6
·
--
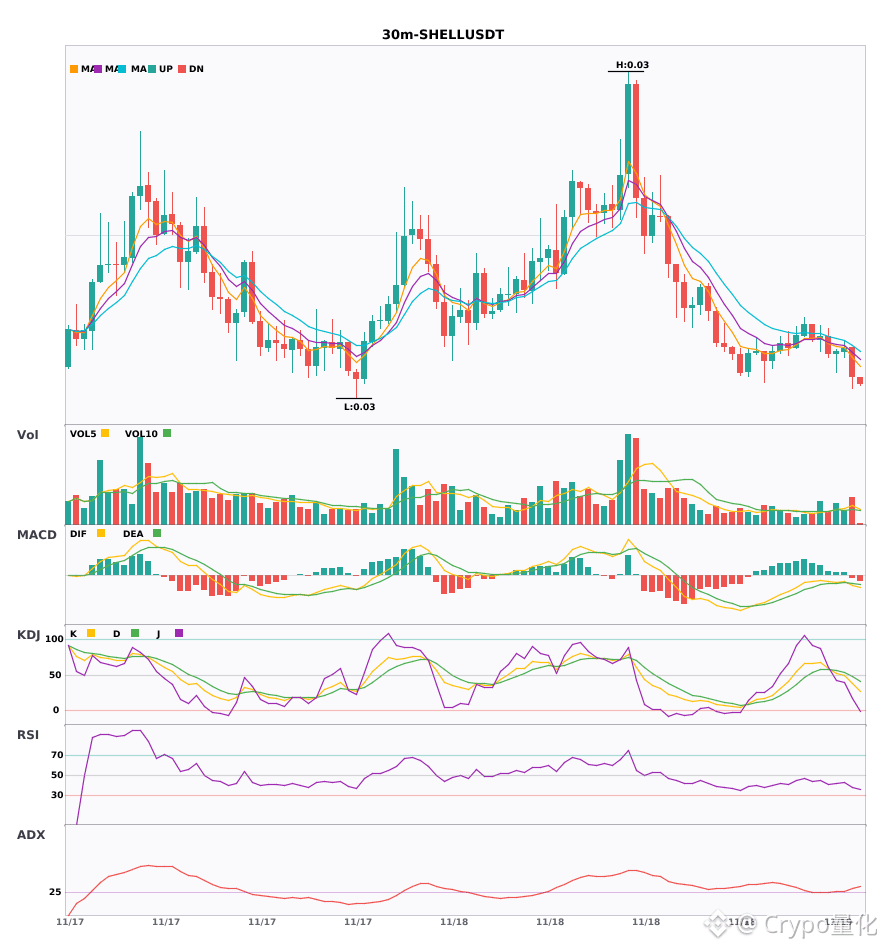
30-minute bearish alert is here! $SHELL $XAUT $XPT needs attention 🔥
════════════════════
🟢 $SHELL 30-minute bearish signal
⚠️ Technicals: ADX shows the trend has just started, so you can enter. MACD has a bearish crossover below the zero line, and the bears are accelerating. The moving averages are aligned bearishly and trending downward. KDJ is weakening, with the K-line 37.7 crossing below the D-line 48.2, giving bears the upper hand. Volume has expanded to 1.8x.
📢 Market dynamics: MyShell (SHELL) airdrop continues: Binance announced the second HODLer airdrop, BNB Simple Earn users can retroactively claim SHELL, and the SHELL locked product offers up to 29.9% annualized yield.
════════════════════
🟢 $XAUT 30-minute bearish signal
⚠️ Technicals: The trend is clear, MACD bearish crossover is accelerating, EMA5 has crossed below EMA8 turning bearish, KDJ bearish crossover signals weakness, and volume has surged 3.2x.
════════════════════
🟢 $XPT 30-minute bearish signal
⚠️ Technicals: ADX 29 indicates the trend is taking shape and can be traded, but MACD has fallen below the zero line and turned bearish, EMA5 has just crossed below EMA8 for short-term weakness, and volume suddenly expanded 3.3x
════════════════════
🔔 Follow to get the first-hand market moves 🔔
#技术分析 #SHELL #XAUT #XPT
📌 When trading, pay attention to whether the candlestick pattern is valid
30-minute bearish alert is here! $SHELL $XAUT $XPT needs attention 🔥
════════════════════
🟢 $SHELL 30-minute bearish signal
⚠️ Technicals: ADX shows the trend has just started, so you can enter. MACD has a bearish crossover below the zero line, and the bears are accelerating. The moving averages are aligned bearishly and trending downward. KDJ is weakening, with the K-line 37.7 crossing below the D-line 48.2, giving bears the upper hand. Volume has expanded to 1.8x.
📢 Market dynamics: MyShell (SHELL) airdrop continues: Binance announced the second HODLer airdrop, BNB Simple Earn users can retroactively claim SHELL, and the SHELL locked product offers up to 29.9% annualized yield.
════════════════════
🟢 $XAUT 30-minute bearish signal
⚠️ Technicals: The trend is clear, MACD bearish crossover is accelerating, EMA5 has crossed below EMA8 turning bearish, KDJ bearish crossover signals weakness, and volume has surged 3.2x.
════════════════════
🟢 $XPT 30-minute bearish signal
⚠️ Technicals: ADX 29 indicates the trend is taking shape and can be traded, but MACD has fallen below the zero line and turned bearish, EMA5 has just crossed below EMA8 for short-term weakness, and volume suddenly expanded 3.3x
════════════════════
🔔 Follow to get the first-hand market moves 🔔
#技术分析 #SHELL #XAUT #XPT
📌 When trading, pay attention to whether the candlestick pattern is valid
════════════════════
🟢 $SHELL 30-minute bearish signal
⚠️ Technicals: ADX shows the trend has just started, so you can enter. MACD has a bearish crossover below the zero line, and the bears are accelerating. The moving averages are aligned bearishly and trending downward. KDJ is weakening, with the K-line 37.7 crossing below the D-line 48.2, giving bears the upper hand. Volume has expanded to 1.8x.
📢 Market dynamics: MyShell (SHELL) airdrop continues: Binance announced the second HODLer airdrop, BNB Simple Earn users can retroactively claim SHELL, and the SHELL locked product offers up to 29.9% annualized yield.
════════════════════
🟢 $XAUT 30-minute bearish signal
⚠️ Technicals: The trend is clear, MACD bearish crossover is accelerating, EMA5 has crossed below EMA8 turning bearish, KDJ bearish crossover signals weakness, and volume has surged 3.2x.
════════════════════
🟢 $XPT 30-minute bearish signal
⚠️ Technicals: ADX 29 indicates the trend is taking shape and can be traded, but MACD has fallen below the zero line and turned bearish, EMA5 has just crossed below EMA8 for short-term weakness, and volume suddenly expanded 3.3x
════════════════════
🔔 Follow to get the first-hand market moves 🔔
#技术分析 #SHELL #XAUT #XPT
📌 When trading, pay attention to whether the candlestick pattern is valid
6
·
--
$XPT 30-minute: 4-hour bearish alignment—pay attention to the risks! 🔥
════════════════════
🟢 $XPT 30-minute short signal
⚠️ Technical analysis: The 4-hour bearish trend aligns with the 30-minute entry signal, pointing downward! MACD has formed a death cross, with the green bars growing; moving averages are bearishly aligned and trending downward; KDJ has formed a death cross but is not oversold; volume has increased 2.9-fold.
════════════════════
🔔 Follow for the latest market movements 🔔
#多周期共振 #XPT
📌 When trading, pay attention to whether the candlestick pattern confirms the signal.
$XPT 30-minute: 4-hour bearish alignment—pay attention to the risks! 🔥
════════════════════
🟢 $XPT 30-minute short signal
⚠️ Technical analysis: The 4-hour bearish trend aligns with the 30-minute entry signal, pointing downward! MACD has formed a death cross, with the green bars growing; moving averages are bearishly aligned and trending downward; KDJ has formed a death cross but is not oversold; volume has increased 2.9-fold.
════════════════════
🔔 Follow for the latest market movements 🔔
#多周期共振 #XPT
📌 When trading, pay attention to whether the candlestick pattern confirms the signal.
════════════════════
🟢 $XPT 30-minute short signal
⚠️ Technical analysis: The 4-hour bearish trend aligns with the 30-minute entry signal, pointing downward! MACD has formed a death cross, with the green bars growing; moving averages are bearishly aligned and trending downward; KDJ has formed a death cross but is not oversold; volume has increased 2.9-fold.
════════════════════
🔔 Follow for the latest market movements 🔔
#多周期共振 #XPT
📌 When trading, pay attention to whether the candlestick pattern confirms the signal.

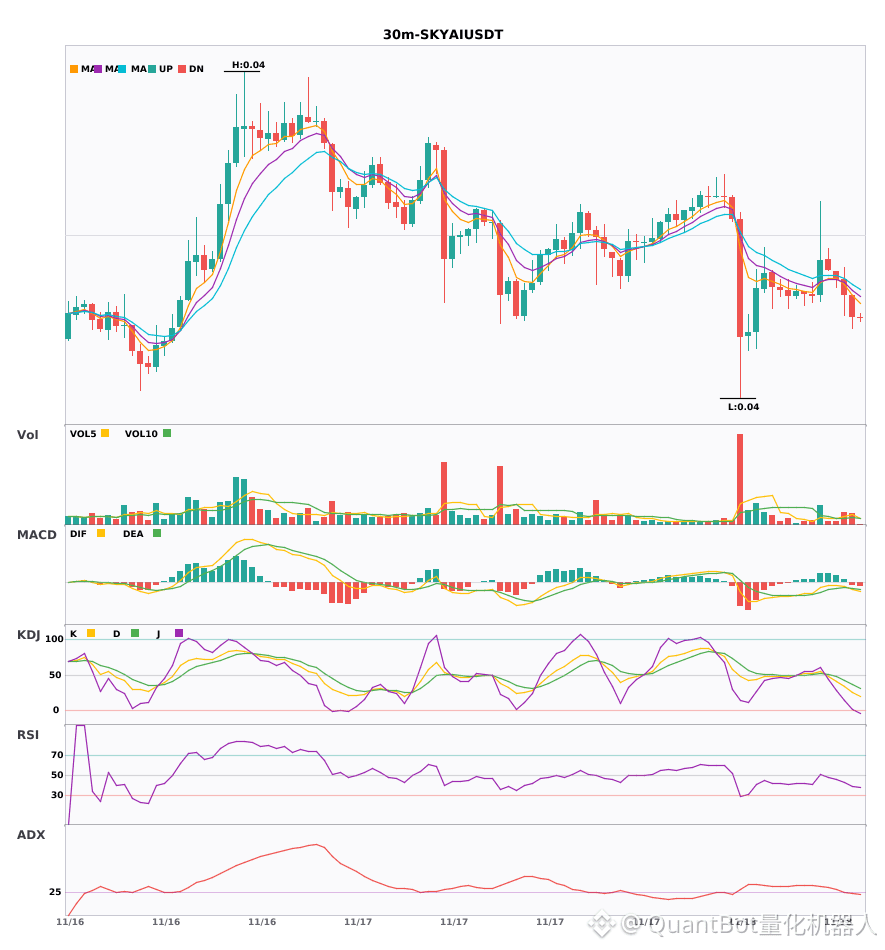
$XPT and $SKYAI : 30-minute technical indicators weakening in sync; assessment of short-term downside risk
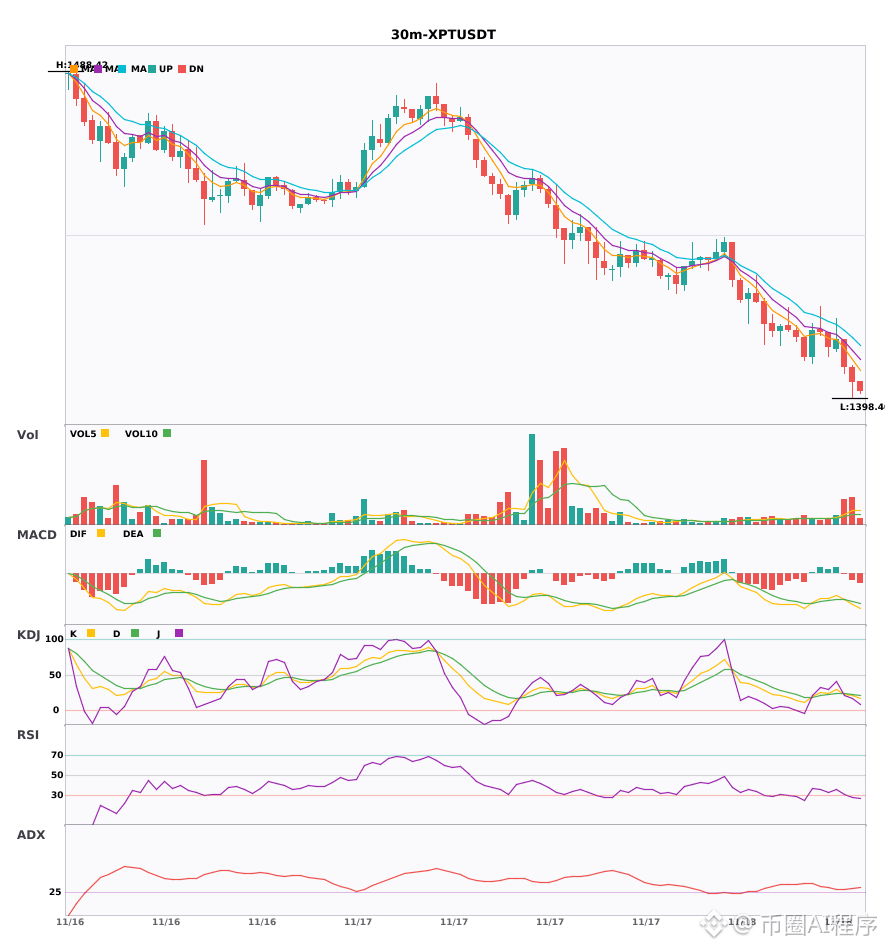
📉 $XPT | 30-minute bearish signal
━━━━━━━━━━━━━━━━━━
Technical analysis: ADX27 indicates the trend is taking shape, making it worth considering; MACD has formed a death cross below the zero line, with bearish momentum strengthening; EMA5<8<13 are in bearish alignment; KDJ death cross (K23.1/D24.2), indicating a short-term bearish bias; volume has expanded to 2.9x.
Price change: -0.5400%
📉 $SKYAI | 30-minute bearish signal
━━━━━━━━━━━━━━━━━━
Technical analysis: ADX(25) indicates the trend is starting; participation is recommended | MACD has formed a death cross below zero, with bearish momentum strengthening | EMA5<8<13 are in bearish alignment | KDJ is moving weakly, with bears in control (K25.1,D36.9) | Volume has increased 1.9x
Price change: -1.1600%
━━━━━━━━━━━━━━━━━━
#技术分析 #XPT #SKYAI
📌 The above content is for reference only and does not constitute investment advice
$XPT and $SKYAI : 30-minute technical indicators weakening in sync; assessment of short-term downside risk
📉 $XPT | 30-minute bearish signal
━━━━━━━━━━━━━━━━━━
Technical analysis: ADX27 indicates the trend is taking shape, making it worth considering; MACD has formed a death cross below the zero line, with bearish momentum strengthening; EMA5<8<13 are in bearish alignment; KDJ death cross (K23.1/D24.2), indicating a short-term bearish bias; volume has expanded to 2.9x.
Price change: -0.5400%
📉 $SKYAI | 30-minute bearish signal
━━━━━━━━━━━━━━━━━━
Technical analysis: ADX(25) indicates the trend is starting; participation is recommended | MACD has formed a death cross below zero, with bearish momentum strengthening | EMA5<8<13 are in bearish alignment | KDJ is moving weakly, with bears in control (K25.1,D36.9) | Volume has increased 1.9x
Price change: -1.1600%
━━━━━━━━━━━━━━━━━━
#技术分析 #XPT #SKYAI
📌 The above content is for reference only and does not constitute investment advice
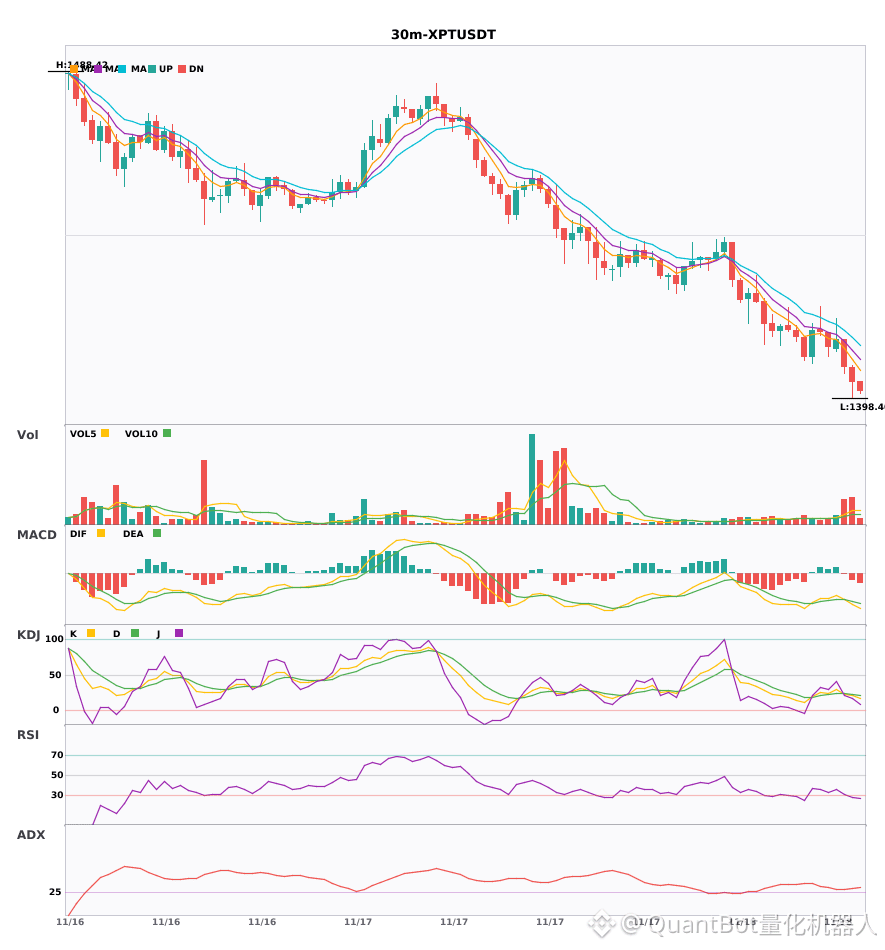
📉 $XPT | 30-minute bearish signal
━━━━━━━━━━━━━━━━━━
Technical analysis: ADX27 indicates the trend is taking shape, making it worth considering; MACD has formed a death cross below the zero line, with bearish momentum strengthening; EMA5<8<13 are in bearish alignment; KDJ death cross (K23.1/D24.2), indicating a short-term bearish bias; volume has expanded to 2.9x.
Price change: -0.5400%
📉 $SKYAI | 30-minute bearish signal
━━━━━━━━━━━━━━━━━━
Technical analysis: ADX(25) indicates the trend is starting; participation is recommended | MACD has formed a death cross below zero, with bearish momentum strengthening | EMA5<8<13 are in bearish alignment | KDJ is moving weakly, with bears in control (K25.1,D36.9) | Volume has increased 1.9x
Price change: -1.1600%
━━━━━━━━━━━━━━━━━━
#技术分析 #XPT #SKYAI
📌 The above content is for reference only and does not constitute investment advice
10
·
--
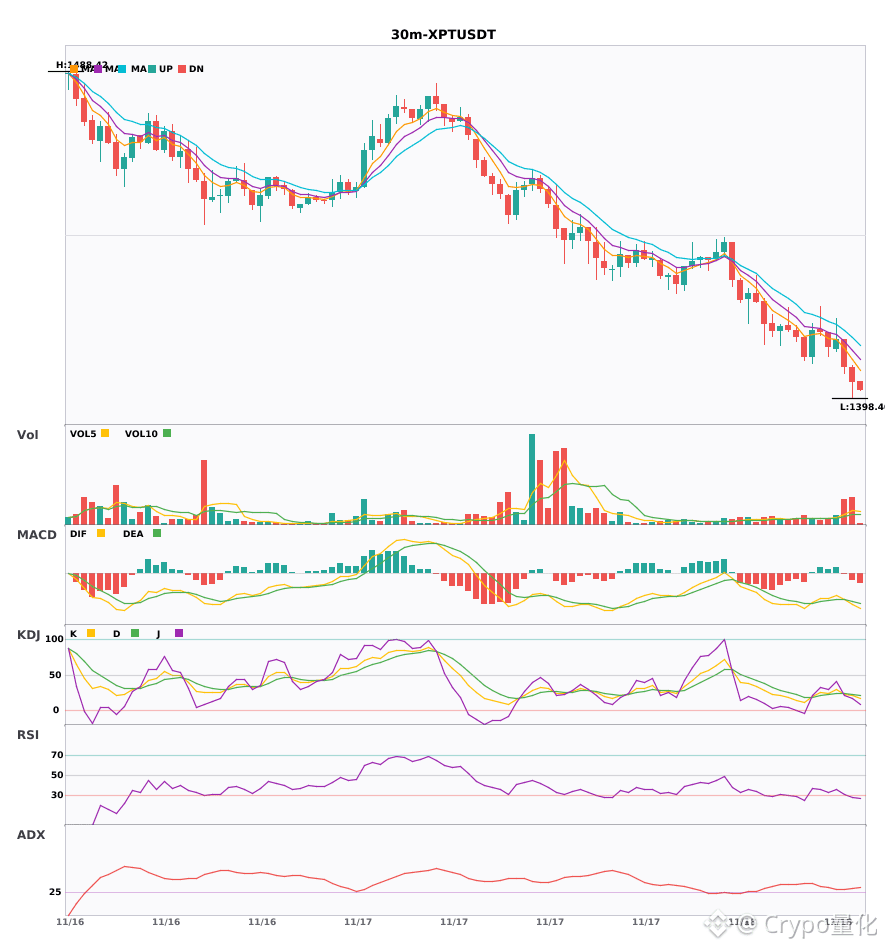
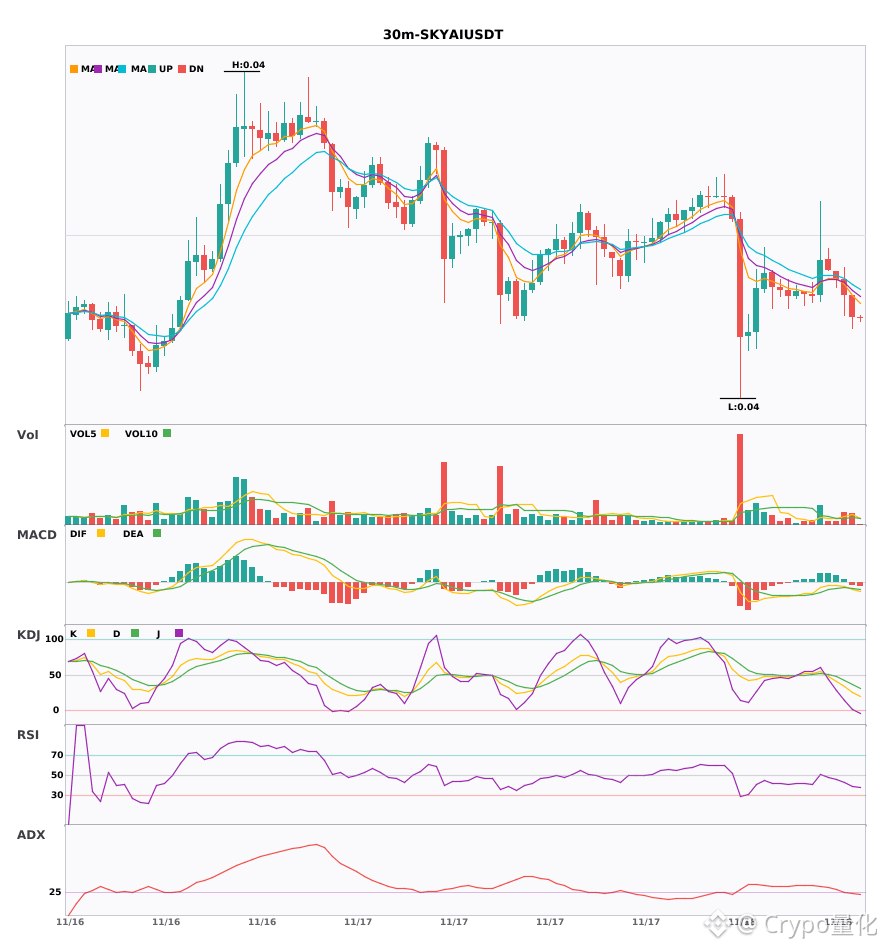
$XPT / $SKYAI 30-minute decline, short-term price action remains under pressure 🔥
════════════════════
🟢 $XPT 30-minute bearish signal
⚠️ Technical analysis: ADX(27) trend just starting, suitable for participation | MACD below zero, bearish crossover accelerating | Bearish moving average alignment | KDJ bearish crossover (K23.1 D24.2) | Volume surged 2.9x
════════════════════
🟢 $SKYAI 30-minute bearish signal
⚠️ Technical analysis: Trend just formed, MACD bearish crossover accelerating, bearish moving average alignment, KDJ weak with K below D, volume nearly doubled; bearish bias, suitable for participation
════════════════════
🔔 Follow for the latest market movements 🔔
#技术分析 #XPT #SKYAI
📌 When trading, watch whether the candlestick pattern aligns
$XPT / $SKYAI 30-minute decline, short-term price action remains under pressure 🔥
════════════════════
🟢 $XPT 30-minute bearish signal
⚠️ Technical analysis: ADX(27) trend just starting, suitable for participation | MACD below zero, bearish crossover accelerating | Bearish moving average alignment | KDJ bearish crossover (K23.1 D24.2) | Volume surged 2.9x
════════════════════
🟢 $SKYAI 30-minute bearish signal
⚠️ Technical analysis: Trend just formed, MACD bearish crossover accelerating, bearish moving average alignment, KDJ weak with K below D, volume nearly doubled; bearish bias, suitable for participation
════════════════════
🔔 Follow for the latest market movements 🔔
#技术分析 #XPT #SKYAI
📌 When trading, watch whether the candlestick pattern aligns
════════════════════
🟢 $XPT 30-minute bearish signal
⚠️ Technical analysis: ADX(27) trend just starting, suitable for participation | MACD below zero, bearish crossover accelerating | Bearish moving average alignment | KDJ bearish crossover (K23.1 D24.2) | Volume surged 2.9x
════════════════════
🟢 $SKYAI 30-minute bearish signal
⚠️ Technical analysis: Trend just formed, MACD bearish crossover accelerating, bearish moving average alignment, KDJ weak with K below D, volume nearly doubled; bearish bias, suitable for participation
════════════════════
🔔 Follow for the latest market movements 🔔
#技术分析 #XPT #SKYAI
📌 When trading, watch whether the candlestick pattern aligns
6
·
--
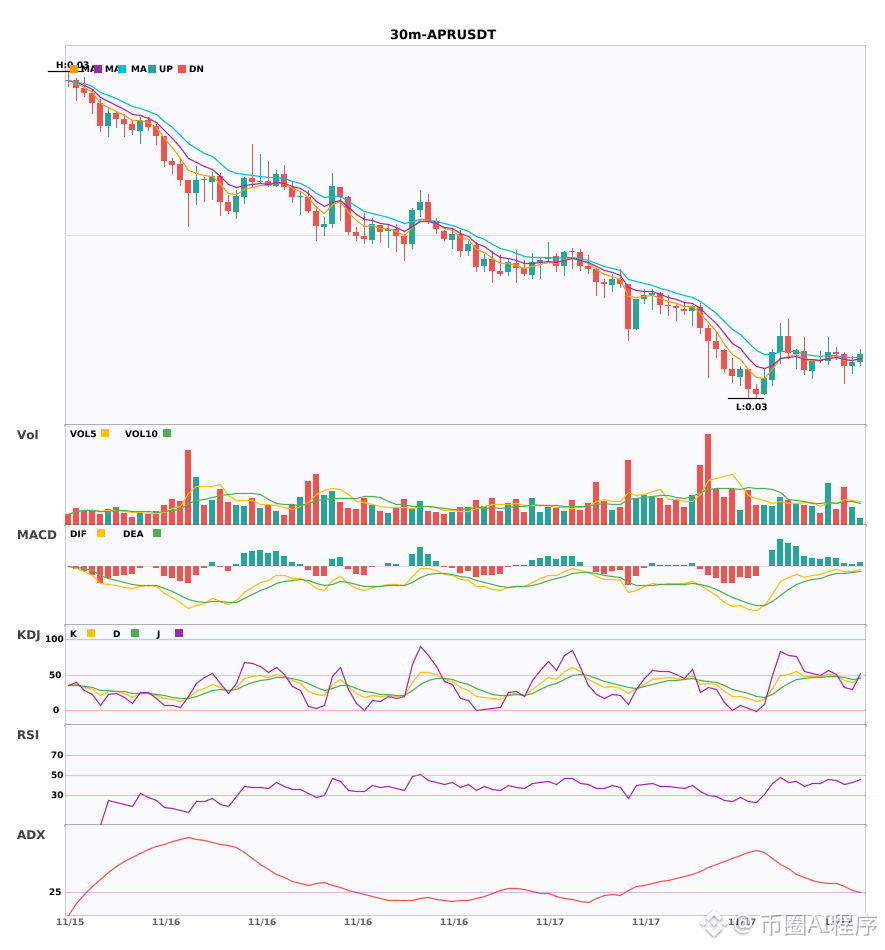
$APR $XPT 30-minute and 4-hour confluence; bearish alignment diverging 🔥
════════════════════
🟢 $APR 30-minute bearish signal
⚠️Technical analysis: 4-hour bearish + 30-minute bearish multi-timeframe confluence! The 30-minute moving averages have just formed a bearish crossover, KDJ has crossed bearishly in the middle zone, and volume is 1.6x higher—confluence points to a bearish outlook.
📢Market update: MyShell (SHELL) airdrop continues: Binance HODLer’s second-round airdrop has launched. BNB Simple Earn holdings can be used to claim SHELL retroactively, and SHELL locked products offer an annualized yield of up to 29.9%.
════════════════════
🟢 $XPT 30-minute bearish signal
⚠️Technical analysis: A signal has appeared on the 30-minute chart, confirmed by 4-hour bearish confluence! MACD’s bearish crossover is accelerating the downtrend, moving averages are diverging downward in bearish alignment, and volume is 1.6x higher.
════════════════════
🔔 Follow for first-hand market alerts 🔔
#多周期共振 #APR #XPT
📌 When trading, pay attention to whether the candlestick pattern matches.
$APR $XPT 30-minute and 4-hour confluence; bearish alignment diverging 🔥
════════════════════
🟢 $APR 30-minute bearish signal
⚠️Technical analysis: 4-hour bearish + 30-minute bearish multi-timeframe confluence! The 30-minute moving averages have just formed a bearish crossover, KDJ has crossed bearishly in the middle zone, and volume is 1.6x higher—confluence points to a bearish outlook.
📢Market update: MyShell (SHELL) airdrop continues: Binance HODLer’s second-round airdrop has launched. BNB Simple Earn holdings can be used to claim SHELL retroactively, and SHELL locked products offer an annualized yield of up to 29.9%.
════════════════════
🟢 $XPT 30-minute bearish signal
⚠️Technical analysis: A signal has appeared on the 30-minute chart, confirmed by 4-hour bearish confluence! MACD’s bearish crossover is accelerating the downtrend, moving averages are diverging downward in bearish alignment, and volume is 1.6x higher.
════════════════════
🔔 Follow for first-hand market alerts 🔔
#多周期共振 #APR #XPT
📌 When trading, pay attention to whether the candlestick pattern matches.
════════════════════
🟢 $APR 30-minute bearish signal
⚠️Technical analysis: 4-hour bearish + 30-minute bearish multi-timeframe confluence! The 30-minute moving averages have just formed a bearish crossover, KDJ has crossed bearishly in the middle zone, and volume is 1.6x higher—confluence points to a bearish outlook.
📢Market update: MyShell (SHELL) airdrop continues: Binance HODLer’s second-round airdrop has launched. BNB Simple Earn holdings can be used to claim SHELL retroactively, and SHELL locked products offer an annualized yield of up to 29.9%.
════════════════════
🟢 $XPT 30-minute bearish signal
⚠️Technical analysis: A signal has appeared on the 30-minute chart, confirmed by 4-hour bearish confluence! MACD’s bearish crossover is accelerating the downtrend, moving averages are diverging downward in bearish alignment, and volume is 1.6x higher.
════════════════════
🔔 Follow for first-hand market alerts 🔔
#多周期共振 #APR #XPT
📌 When trading, pay attention to whether the candlestick pattern matches.
35
·
--
4-hour and daily charts are both bearish; the downtrend is confirmed for 3 coins 🔥
════════════════════
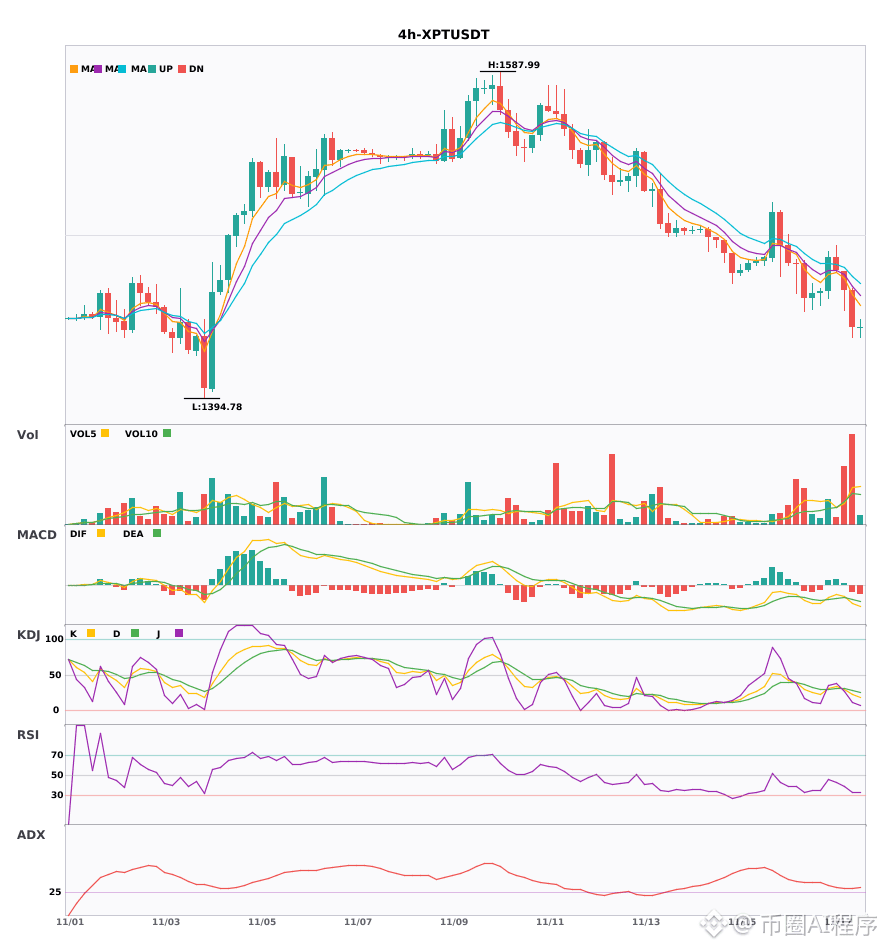
🟢 $XPT 4-hour Bearish Signal
⚠️ Technical analysis: 4-hour MACD bearish crossover with rising volume, moving averages in bearish alignment, weakening KDJ, and a surge in volume—all in sync with the daily bearish trend. Bears have the upper hand.
════════════════════
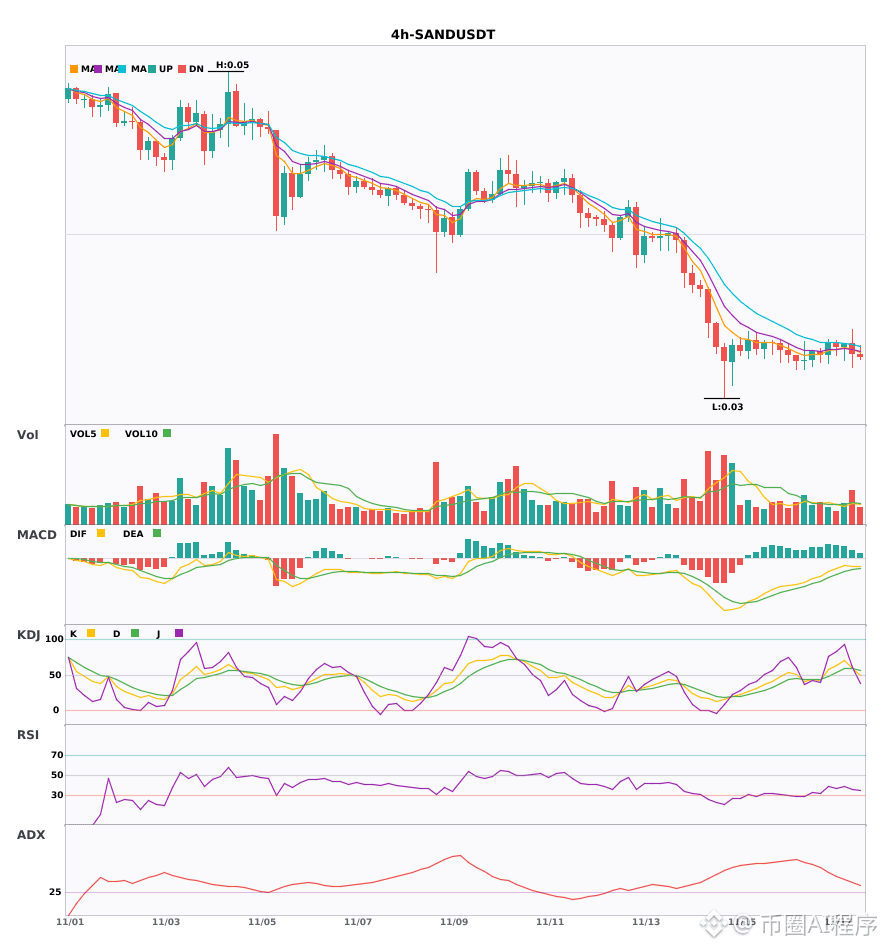
🟢 $SAND 4-hour Bearish Signal
⚠️ Technical analysis: Daily bearish trend confirmed by the 4-hour chart! The 4-hour EMA5 has just crossed below EMA8, turning bearish. KDJ is strongly bullish, with a 1.6x increase in volume confirming the move.
════════════════════
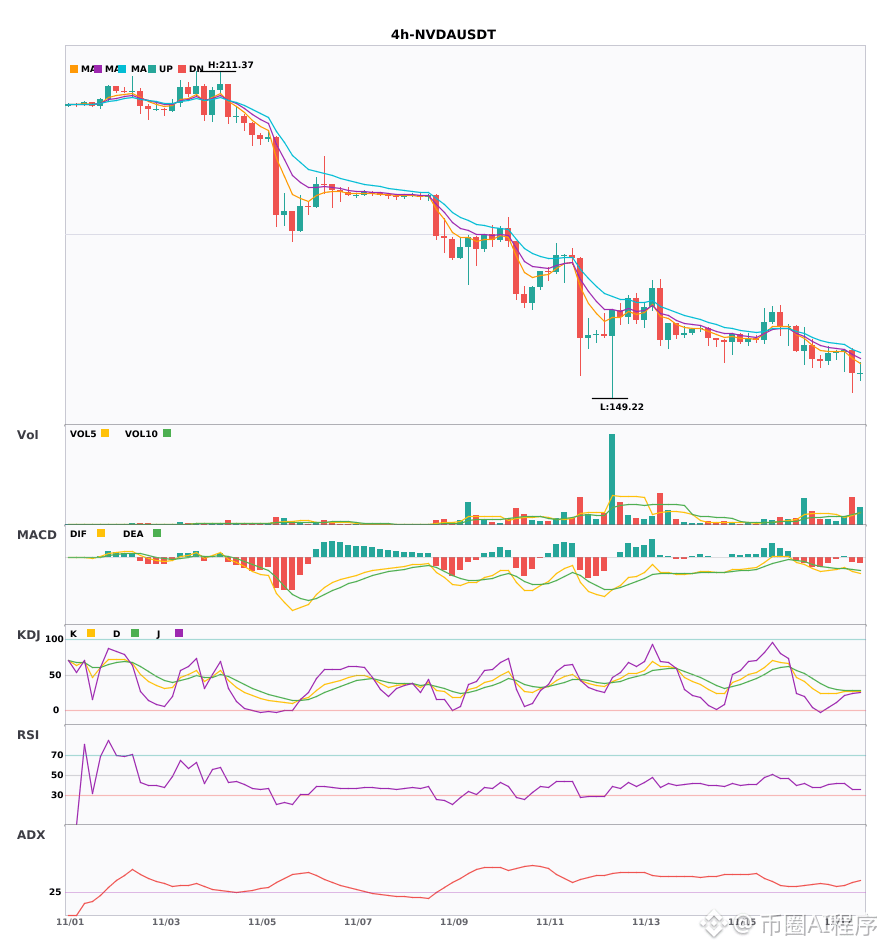
🟢 $NVDA 4-hour Bearish Signal
⚠️ Technical analysis: Daily and 4-hour bearish trends confirmed. MACD has formed a bearish crossover below zero with rising volume; moving averages are bearishly aligned and diverging downward. KDJ is weak in the lower range, giving bears the upper hand. Volume is up 2.5x.
════════════════════
🔔 Follow for first-hand updates on unusual market movements 🔔
#多周期共振 #XPT #SAND #NVDA
📌 When trading, pay attention to whether the candlestick patterns match
4-hour and daily charts are both bearish; the downtrend is confirmed for 3 coins 🔥
════════════════════
🟢 $XPT 4-hour Bearish Signal
⚠️ Technical analysis: 4-hour MACD bearish crossover with rising volume, moving averages in bearish alignment, weakening KDJ, and a surge in volume—all in sync with the daily bearish trend. Bears have the upper hand.
════════════════════
🟢 $SAND 4-hour Bearish Signal
⚠️ Technical analysis: Daily bearish trend confirmed by the 4-hour chart! The 4-hour EMA5 has just crossed below EMA8, turning bearish. KDJ is strongly bullish, with a 1.6x increase in volume confirming the move.
════════════════════
🟢 $NVDA 4-hour Bearish Signal
⚠️ Technical analysis: Daily and 4-hour bearish trends confirmed. MACD has formed a bearish crossover below zero with rising volume; moving averages are bearishly aligned and diverging downward. KDJ is weak in the lower range, giving bears the upper hand. Volume is up 2.5x.
════════════════════
🔔 Follow for first-hand updates on unusual market movements 🔔
#多周期共振 #XPT #SAND #NVDA
📌 When trading, pay attention to whether the candlestick patterns match
════════════════════
🟢 $XPT 4-hour Bearish Signal
⚠️ Technical analysis: 4-hour MACD bearish crossover with rising volume, moving averages in bearish alignment, weakening KDJ, and a surge in volume—all in sync with the daily bearish trend. Bears have the upper hand.
════════════════════
🟢 $SAND 4-hour Bearish Signal
⚠️ Technical analysis: Daily bearish trend confirmed by the 4-hour chart! The 4-hour EMA5 has just crossed below EMA8, turning bearish. KDJ is strongly bullish, with a 1.6x increase in volume confirming the move.
════════════════════
🟢 $NVDA 4-hour Bearish Signal
⚠️ Technical analysis: Daily and 4-hour bearish trends confirmed. MACD has formed a bearish crossover below zero with rising volume; moving averages are bearishly aligned and diverging downward. KDJ is weak in the lower range, giving bears the upper hand. Volume is up 2.5x.
════════════════════
🔔 Follow for first-hand updates on unusual market movements 🔔
#多周期共振 #XPT #SAND #NVDA
📌 When trading, pay attention to whether the candlestick patterns match
4
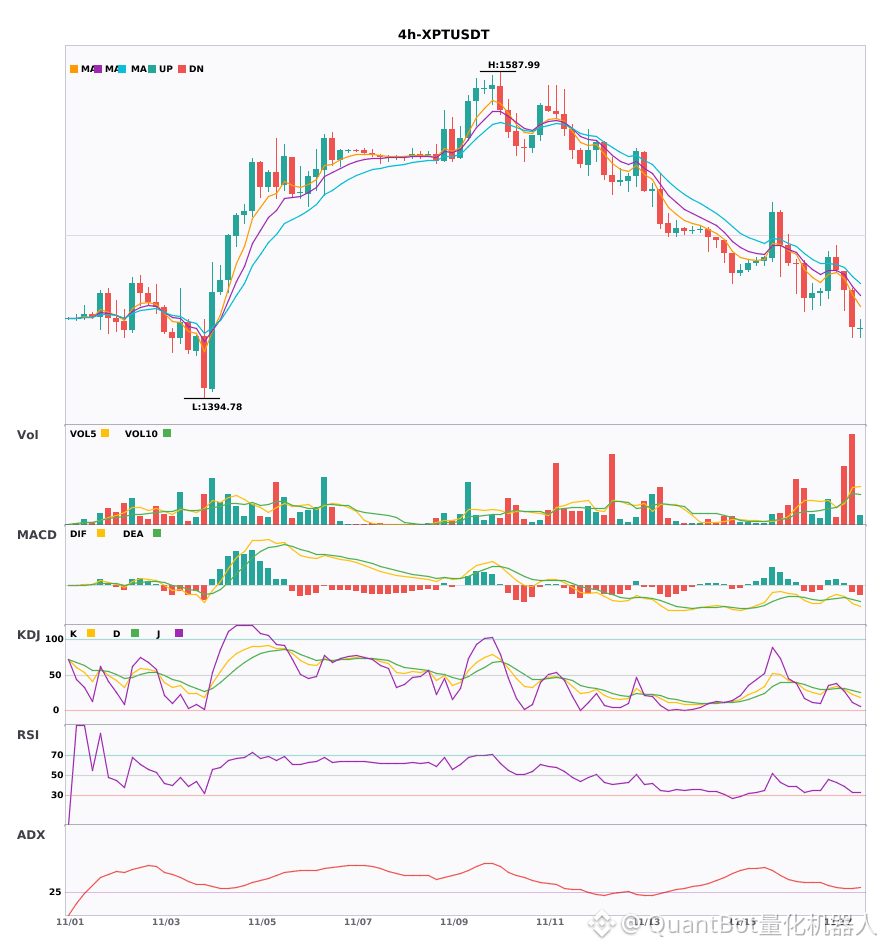
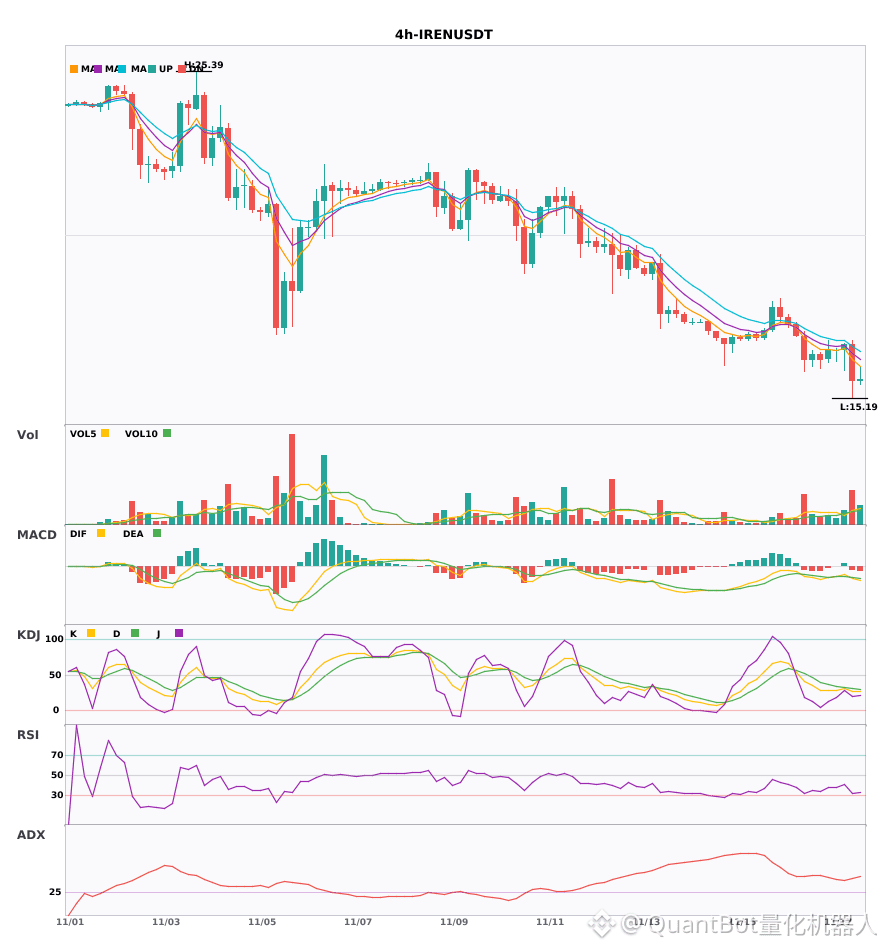
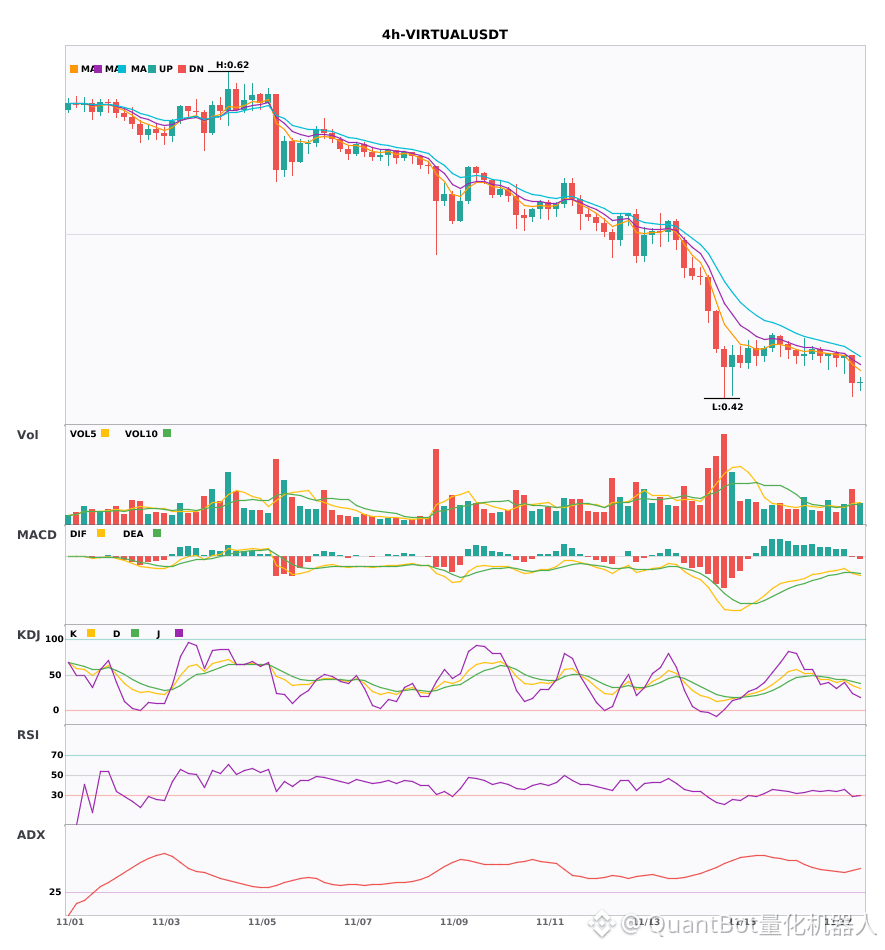
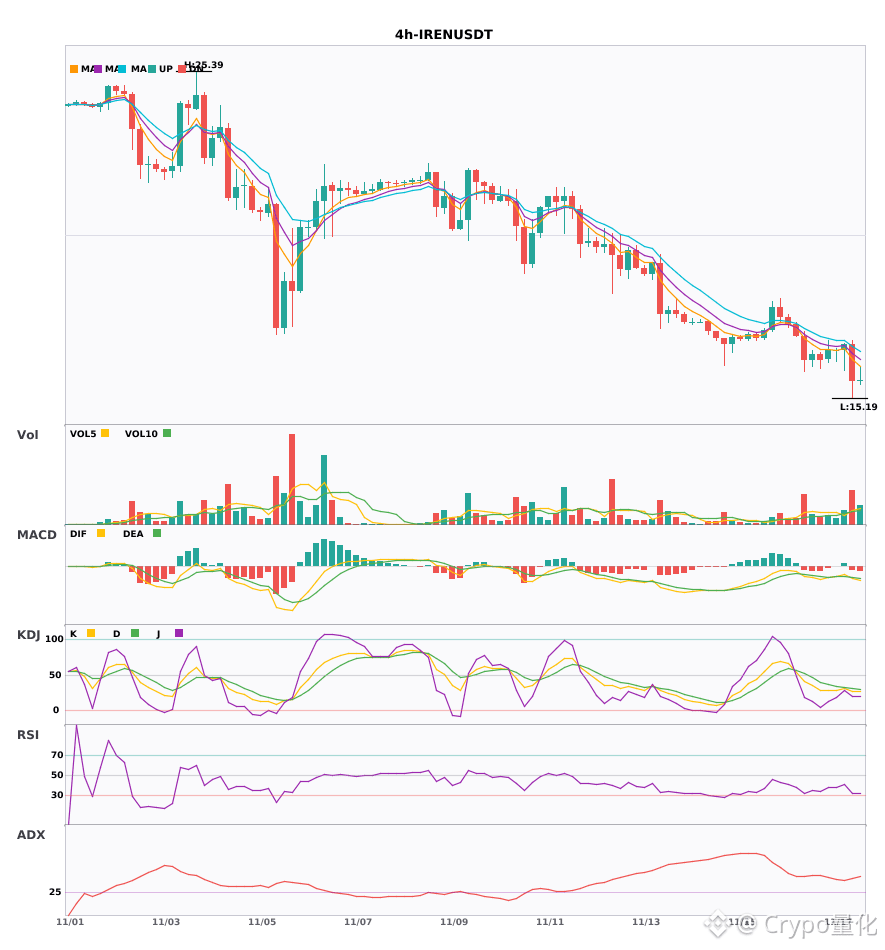
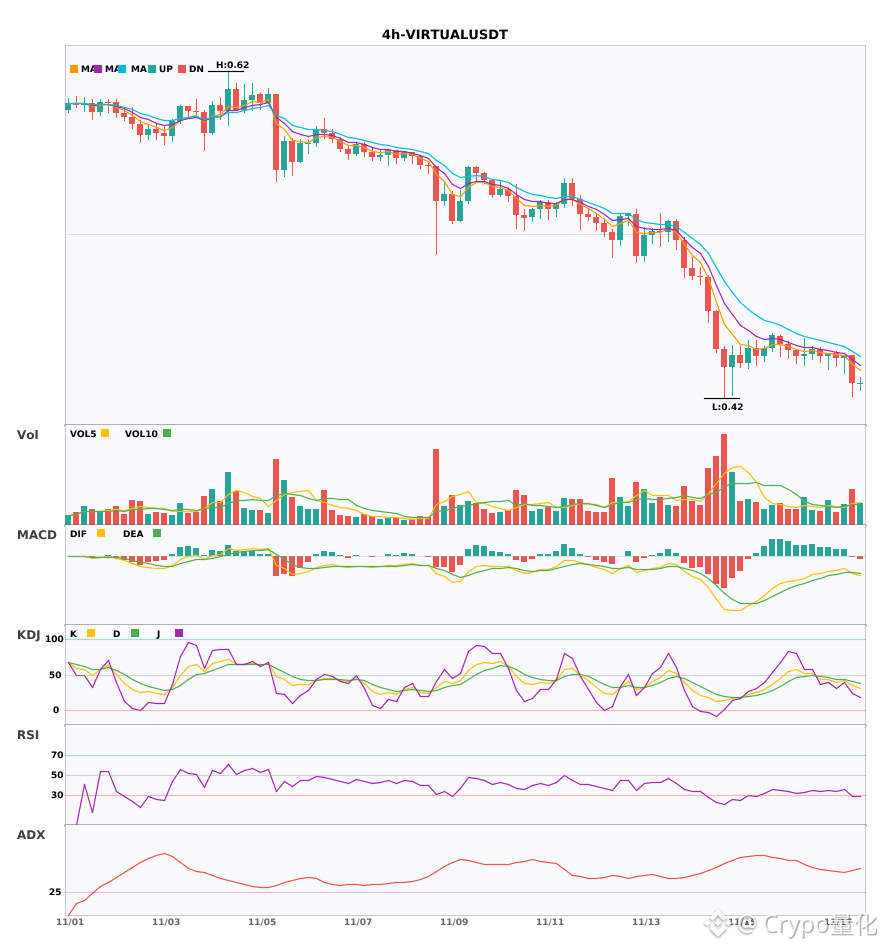
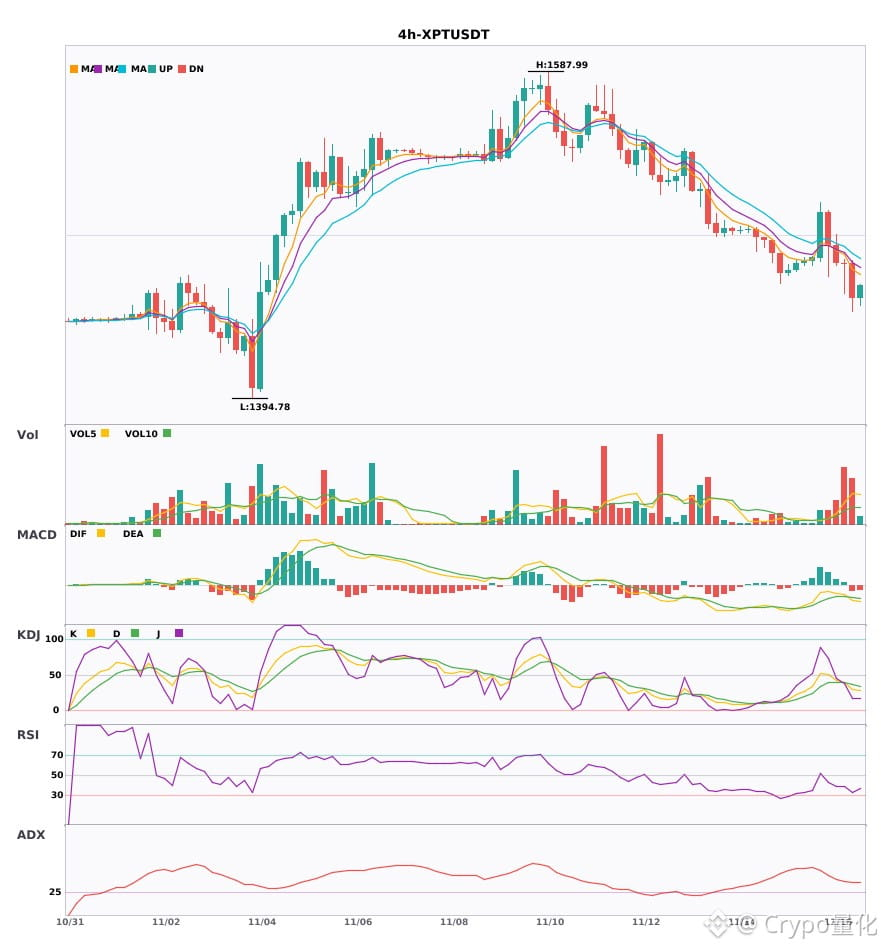
$XPT $IREN $VIRTUAL 4H Bearish signal confirmed, under short-term pressure
📉 $XPT | 4-hour bearish signal
━━━━━━━━━━━━━━━━━━
Technical analysis: ADX(31), pronounced trend | MACD bearish crossover below zero, accelerating bearish momentum | EMA5<8<13 bearish alignment | KDJ weak, bears in control (K22.8,D28.1) | Volume up 2.9x
Price change: -1.5100%
📉 $IREN | 4-hour bearish signal
━━━━━━━━━━━━━━━━━━
Technical analysis: ADX(40), pronounced trend|MACD bearish crossover below zero, bearish momentum strengthening|Bearish EMA alignment|KDJ weak (K27.5 D31.0)|Volume up 2.5x
Price change: -6.9300%
📉 $VIRTUAL | 4-hour bearish signal
━━━━━━━━━━━━━━━━━━
Technical analysis: ADX(47), strong trend|MACD bearish crossover below zero|Bearish EMA alignment|KDJ weak (K35.5 D40.9)|Volume up 1.8x
Price change: -3.8800%
━━━━━━━━━━━━━━━━━━
#技术分析 #XPT #IREN #VIRTUAL
📌 The above is for reference only and does not constitute investment advice
$XPT $IREN $VIRTUAL 4H Bearish signal confirmed, under short-term pressure
📉 $XPT | 4-hour bearish signal
━━━━━━━━━━━━━━━━━━
Technical analysis: ADX(31), pronounced trend | MACD bearish crossover below zero, accelerating bearish momentum | EMA5<8<13 bearish alignment | KDJ weak, bears in control (K22.8,D28.1) | Volume up 2.9x
Price change: -1.5100%
📉 $IREN | 4-hour bearish signal
━━━━━━━━━━━━━━━━━━
Technical analysis: ADX(40), pronounced trend|MACD bearish crossover below zero, bearish momentum strengthening|Bearish EMA alignment|KDJ weak (K27.5 D31.0)|Volume up 2.5x
Price change: -6.9300%
📉 $VIRTUAL | 4-hour bearish signal
━━━━━━━━━━━━━━━━━━
Technical analysis: ADX(47), strong trend|MACD bearish crossover below zero|Bearish EMA alignment|KDJ weak (K35.5 D40.9)|Volume up 1.8x
Price change: -3.8800%
━━━━━━━━━━━━━━━━━━
#技术分析 #XPT #IREN #VIRTUAL
📌 The above is for reference only and does not constitute investment advice
📉 $XPT | 4-hour bearish signal
━━━━━━━━━━━━━━━━━━
Technical analysis: ADX(31), pronounced trend | MACD bearish crossover below zero, accelerating bearish momentum | EMA5<8<13 bearish alignment | KDJ weak, bears in control (K22.8,D28.1) | Volume up 2.9x
Price change: -1.5100%
📉 $IREN | 4-hour bearish signal
━━━━━━━━━━━━━━━━━━
Technical analysis: ADX(40), pronounced trend|MACD bearish crossover below zero, bearish momentum strengthening|Bearish EMA alignment|KDJ weak (K27.5 D31.0)|Volume up 2.5x
Price change: -6.9300%
📉 $VIRTUAL | 4-hour bearish signal
━━━━━━━━━━━━━━━━━━
Technical analysis: ADX(47), strong trend|MACD bearish crossover below zero|Bearish EMA alignment|KDJ weak (K35.5 D40.9)|Volume up 1.8x
Price change: -3.8800%
━━━━━━━━━━━━━━━━━━
#技术分析 #XPT #IREN #VIRTUAL
📌 The above is for reference only and does not constitute investment advice
23
·
--
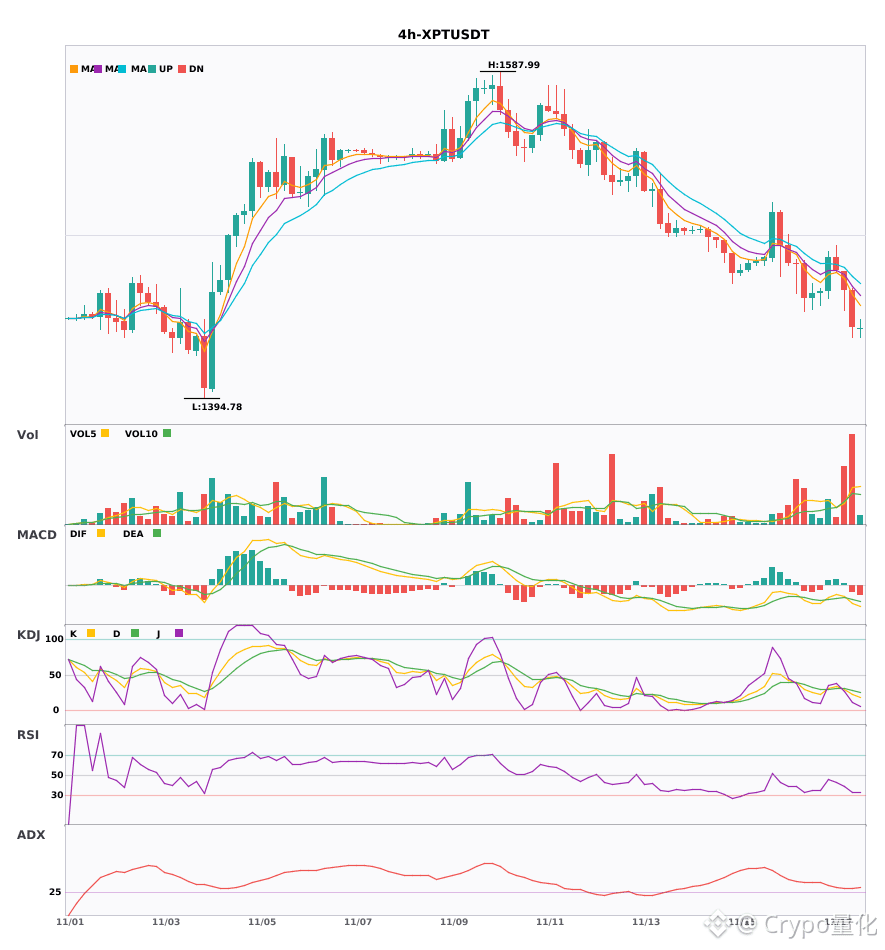
$XPT/$IREN/$VIRTUAL 4-hour MACD green bars continue to expand; beware of risk🔥
════════════════════
🟢 $XPT 4-hour bearish signal
⚠️Technical analysis: The trend is clear. The MACD has formed a death cross and the green bars are expanding. The moving averages are bearishly aligned and trending down. KDJ is in low territory, with bears in control. Trading volume surged 2.9x; bearish outlook.
════════════════════
🟢 $IREN 4-hour bearish signal
⚠️Technical analysis: ADX is at 40, indicating a strong trend. The MACD has formed a death cross below zero, with bears gaining momentum. The moving averages are bearishly aligned. KDJ is weak, with K below D. Trading volume is up 2.5x.
════════════════════
🟢 $VIRTUAL 4-hour bearish signal
⚠️Technical analysis: ADX has reached 47. The trend is very strong, but beware of a pullback due to overbought conditions. The MACD has formed a death cross, and bears are gaining momentum. The moving averages are bearishly aligned and diverging downward. KDJ remains in the weak zone, with bears in control. Trading volume is up 1.8x.
════════════════════
🔔 Follow for first-hand market updates 🔔
#技术分析 #XPT #IREN #VIRTUAL
📌 When trading, pay attention to whether the candlestick pattern confirms the signal.
$XPT /$IREN /$VIRTUAL 4-hour MACD green bars continue to expand; beware of risk🔥
════════════════════
🟢 $XPT 4-hour bearish signal
⚠️Technical analysis: The trend is clear. The MACD has formed a death cross and the green bars are expanding. The moving averages are bearishly aligned and trending down. KDJ is in low territory, with bears in control. Trading volume surged 2.9x; bearish outlook.
════════════════════
🟢 $IREN 4-hour bearish signal
⚠️Technical analysis: ADX is at 40, indicating a strong trend. The MACD has formed a death cross below zero, with bears gaining momentum. The moving averages are bearishly aligned. KDJ is weak, with K below D. Trading volume is up 2.5x.
════════════════════
🟢 $VIRTUAL 4-hour bearish signal
⚠️Technical analysis: ADX has reached 47. The trend is very strong, but beware of a pullback due to overbought conditions. The MACD has formed a death cross, and bears are gaining momentum. The moving averages are bearishly aligned and diverging downward. KDJ remains in the weak zone, with bears in control. Trading volume is up 1.8x.
════════════════════
🔔 Follow for first-hand market updates 🔔
#技术分析 #XPT #IREN #VIRTUAL
📌 When trading, pay attention to whether the candlestick pattern confirms the signal.
════════════════════
🟢 $XPT 4-hour bearish signal
⚠️Technical analysis: The trend is clear. The MACD has formed a death cross and the green bars are expanding. The moving averages are bearishly aligned and trending down. KDJ is in low territory, with bears in control. Trading volume surged 2.9x; bearish outlook.
════════════════════
🟢 $IREN 4-hour bearish signal
⚠️Technical analysis: ADX is at 40, indicating a strong trend. The MACD has formed a death cross below zero, with bears gaining momentum. The moving averages are bearishly aligned. KDJ is weak, with K below D. Trading volume is up 2.5x.
════════════════════
🟢 $VIRTUAL 4-hour bearish signal
⚠️Technical analysis: ADX has reached 47. The trend is very strong, but beware of a pullback due to overbought conditions. The MACD has formed a death cross, and bears are gaining momentum. The moving averages are bearishly aligned and diverging downward. KDJ remains in the weak zone, with bears in control. Trading volume is up 1.8x.
════════════════════
🔔 Follow for first-hand market updates 🔔
#技术分析 #XPT #IREN #VIRTUAL
📌 When trading, pay attention to whether the candlestick pattern confirms the signal.
22
·
--
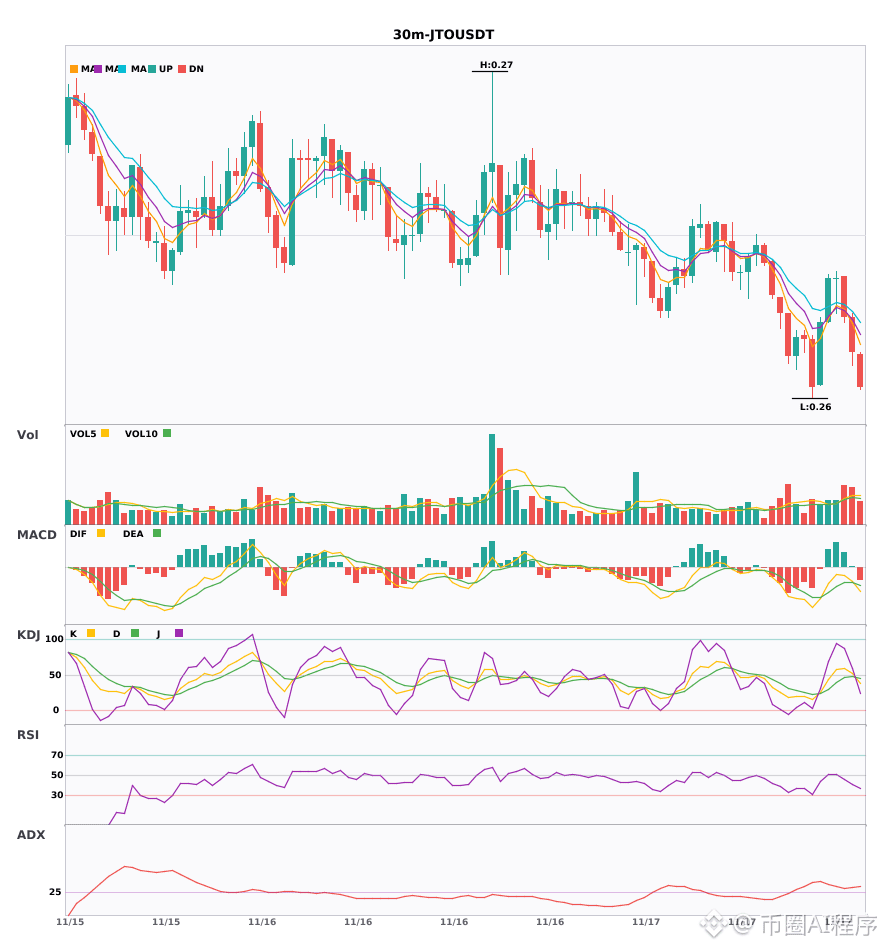
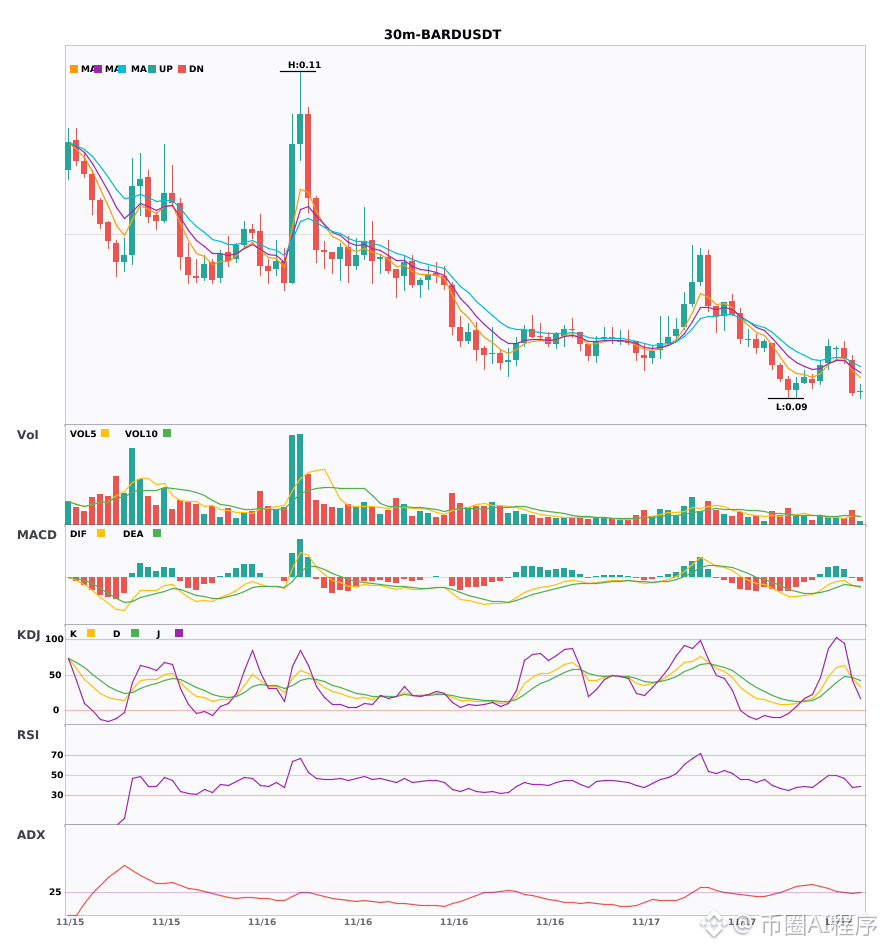
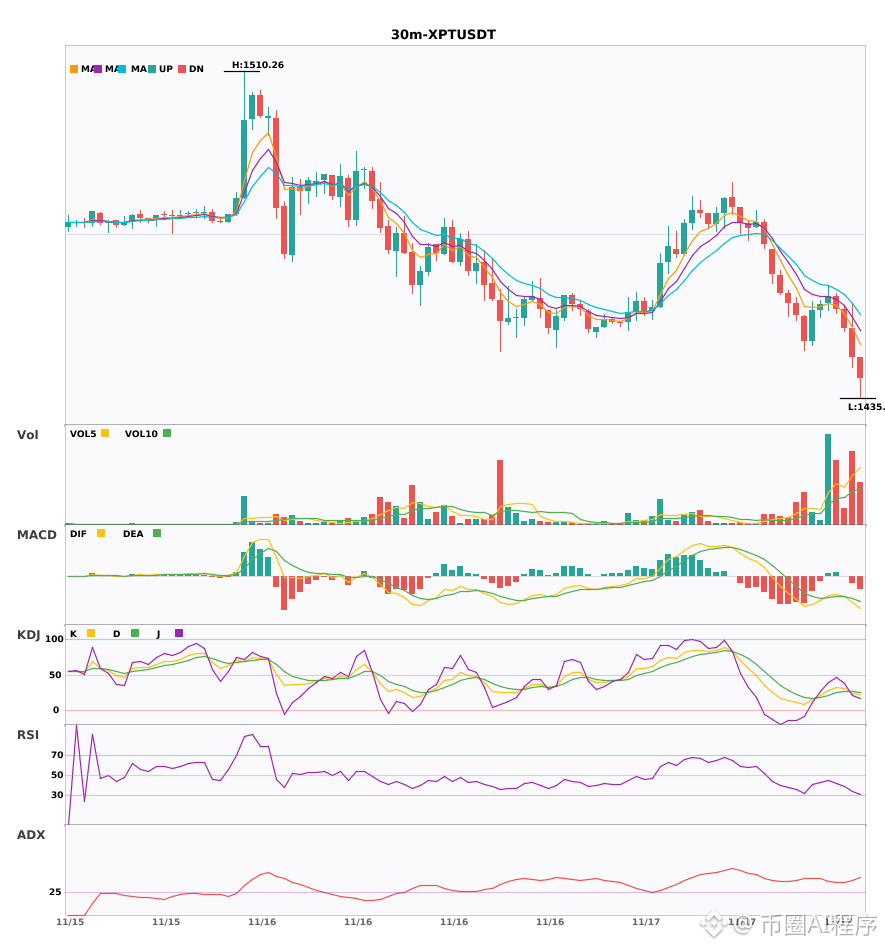
$JTO $BARD $XPT 30-minute and 4-hour signals turning bearish together—multi-timeframe confluence 🔥
════════════════════
🟢 $JTO 30-minute bearish signal
⚠️ Technical analysis: 4-hour bearish + 30-minute bearish confluence confirmed. The 30-minute moving averages have formed a death cross and are trending downward; volume is up 1.6x, indicating a short-term bearish turn.
════════════════════
🟢 $BARD 30-minute bearish signal
⚠️ Technical analysis: 4-hour bearish confluence confirmed! 30-minute entry: MACD death cross accelerating, moving averages diverging bearishly, KDJ death cross but not yet oversold, and volume up 1.6x.
════════════════════
🟢 $XPT 30-minute bearish signal
⚠️ Technical analysis: 4-hour bearish + 30-minute confluence points to downside! MACD death cross with expanding green bars, moving averages in a bearish alignment and diverging downward, KDJ death cross but not yet oversold, and volume up 2.2x—a short-term short opportunity.
════════════════════
🔔 Follow for first-hand market alerts 🔔
#多周期共振 #JTO #BARD #XPT
📌 When trading, pay attention to whether the candlestick pattern confirms the setup.
$JTO $BARD $XPT 30-minute and 4-hour signals turning bearish together—multi-timeframe confluence 🔥
════════════════════
🟢 $JTO 30-minute bearish signal
⚠️ Technical analysis: 4-hour bearish + 30-minute bearish confluence confirmed. The 30-minute moving averages have formed a death cross and are trending downward; volume is up 1.6x, indicating a short-term bearish turn.
════════════════════
🟢 $BARD 30-minute bearish signal
⚠️ Technical analysis: 4-hour bearish confluence confirmed! 30-minute entry: MACD death cross accelerating, moving averages diverging bearishly, KDJ death cross but not yet oversold, and volume up 1.6x.
════════════════════
🟢 $XPT 30-minute bearish signal
⚠️ Technical analysis: 4-hour bearish + 30-minute confluence points to downside! MACD death cross with expanding green bars, moving averages in a bearish alignment and diverging downward, KDJ death cross but not yet oversold, and volume up 2.2x—a short-term short opportunity.
════════════════════
🔔 Follow for first-hand market alerts 🔔
#多周期共振 #JTO #BARD #XPT
📌 When trading, pay attention to whether the candlestick pattern confirms the setup.
════════════════════
🟢 $JTO 30-minute bearish signal
⚠️ Technical analysis: 4-hour bearish + 30-minute bearish confluence confirmed. The 30-minute moving averages have formed a death cross and are trending downward; volume is up 1.6x, indicating a short-term bearish turn.
════════════════════
🟢 $BARD 30-minute bearish signal
⚠️ Technical analysis: 4-hour bearish confluence confirmed! 30-minute entry: MACD death cross accelerating, moving averages diverging bearishly, KDJ death cross but not yet oversold, and volume up 1.6x.
════════════════════
🟢 $XPT 30-minute bearish signal
⚠️ Technical analysis: 4-hour bearish + 30-minute confluence points to downside! MACD death cross with expanding green bars, moving averages in a bearish alignment and diverging downward, KDJ death cross but not yet oversold, and volume up 2.2x—a short-term short opportunity.
════════════════════
🔔 Follow for first-hand market alerts 🔔
#多周期共振 #JTO #BARD #XPT
📌 When trading, pay attention to whether the candlestick pattern confirms the setup.
37
·
--
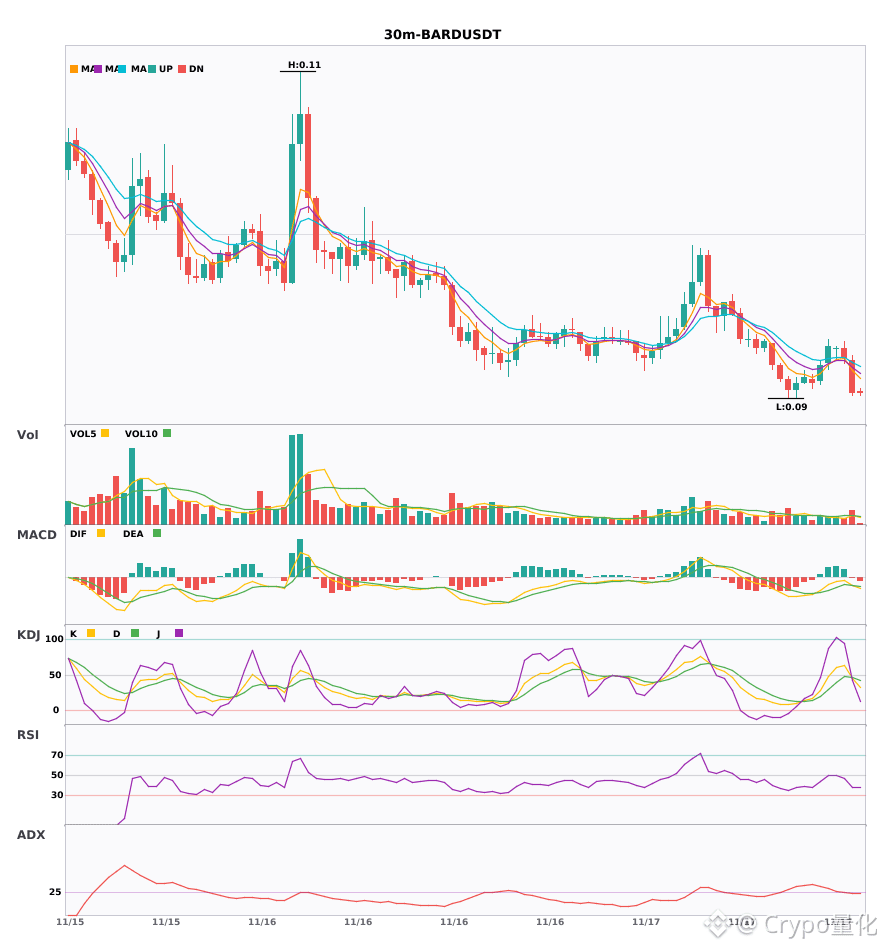
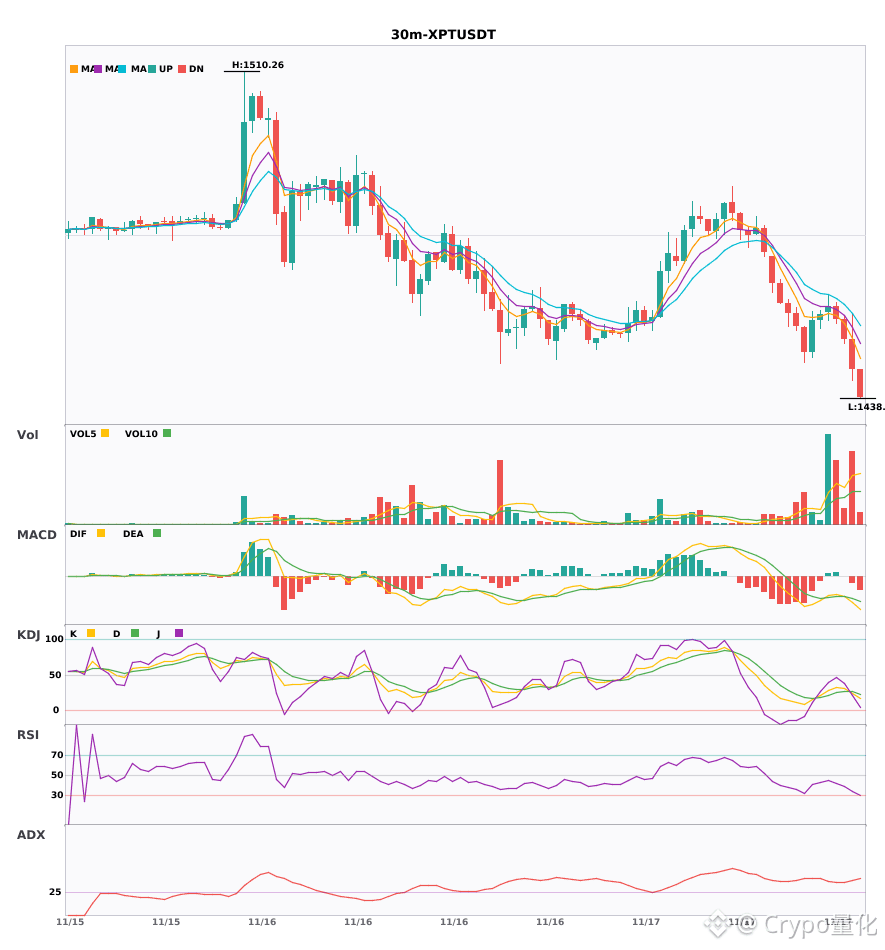
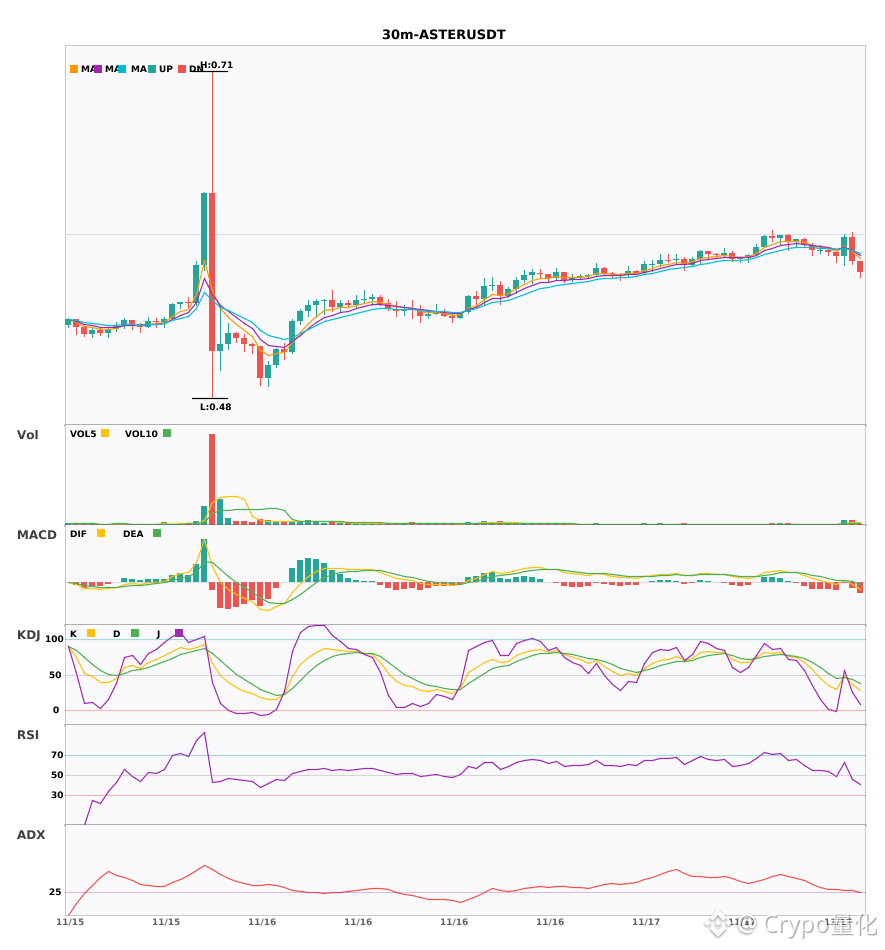
$BARD $XPT $ASTER 30-minute all turning bearish; short positions can be entered 🔥
════════════════════
🟢 $BARD 30-minute bearish signal
⚠️Technical analysis: ADX shows the trend has just begun. MACD has formed a bearish cross below zero, with rising volume and accelerating bearish momentum. EMA5 has crossed below EMA8, turning bearish in the short term. KDJ has formed a death cross, with K below D. Volume is up 1.6x, indicating a short-term bearish bias.
════════════════════
🟢 $XPT 30-minute bearish signal
⚠️Technical analysis: Clear trend | MACD death cross with rising volume and falling prices | Moving averages bearishly aligned and diverging downward | KDJ death cross | Volume up 2.2x
════════════════════
🟢 $ASTER 30-minute bearish signal
⚠️Technical analysis: The ADX trend has just started and can be followed. MACD green bars are expanding and breaking below the zero line, turning bearish. Moving averages have formed a bearish cross. KDJ death cross, with K crossing below D, signals bearishness. Volume has surged 3.8x.
════════════════════
🔔 Follow for first-hand market updates 🔔
#技术分析 #BARD #XPT #ASTER
📌 When trading, check whether the candlestick pattern matches
$BARD $XPT $ASTER 30-minute all turning bearish; short positions can be entered 🔥
════════════════════
🟢 $BARD 30-minute bearish signal
⚠️Technical analysis: ADX shows the trend has just begun. MACD has formed a bearish cross below zero, with rising volume and accelerating bearish momentum. EMA5 has crossed below EMA8, turning bearish in the short term. KDJ has formed a death cross, with K below D. Volume is up 1.6x, indicating a short-term bearish bias.
════════════════════
🟢 $XPT 30-minute bearish signal
⚠️Technical analysis: Clear trend | MACD death cross with rising volume and falling prices | Moving averages bearishly aligned and diverging downward | KDJ death cross | Volume up 2.2x
════════════════════
🟢 $ASTER 30-minute bearish signal
⚠️Technical analysis: The ADX trend has just started and can be followed. MACD green bars are expanding and breaking below the zero line, turning bearish. Moving averages have formed a bearish cross. KDJ death cross, with K crossing below D, signals bearishness. Volume has surged 3.8x.
════════════════════
🔔 Follow for first-hand market updates 🔔
#技术分析 #BARD #XPT #ASTER
📌 When trading, check whether the candlestick pattern matches
════════════════════
🟢 $BARD 30-minute bearish signal
⚠️Technical analysis: ADX shows the trend has just begun. MACD has formed a bearish cross below zero, with rising volume and accelerating bearish momentum. EMA5 has crossed below EMA8, turning bearish in the short term. KDJ has formed a death cross, with K below D. Volume is up 1.6x, indicating a short-term bearish bias.
════════════════════
🟢 $XPT 30-minute bearish signal
⚠️Technical analysis: Clear trend | MACD death cross with rising volume and falling prices | Moving averages bearishly aligned and diverging downward | KDJ death cross | Volume up 2.2x
════════════════════
🟢 $ASTER 30-minute bearish signal
⚠️Technical analysis: The ADX trend has just started and can be followed. MACD green bars are expanding and breaking below the zero line, turning bearish. Moving averages have formed a bearish cross. KDJ death cross, with K crossing below D, signals bearishness. Volume has surged 3.8x.
════════════════════
🔔 Follow for first-hand market updates 🔔
#技术分析 #BARD #XPT #ASTER
📌 When trading, check whether the candlestick pattern matches
10
·
--
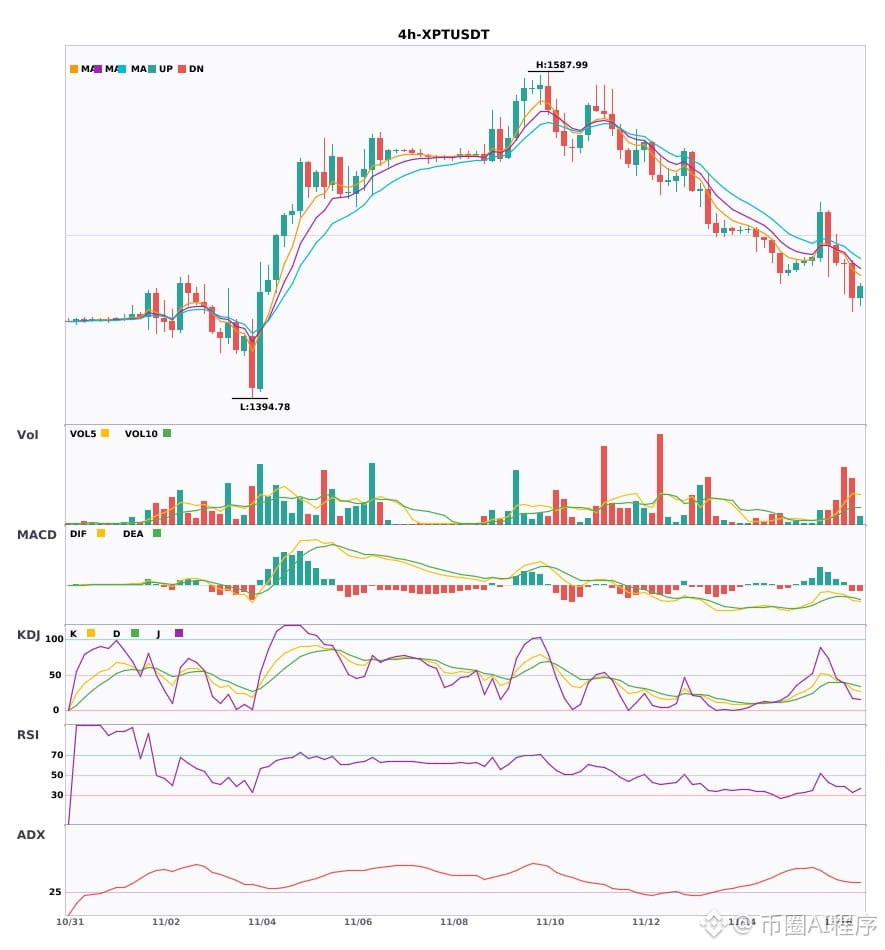
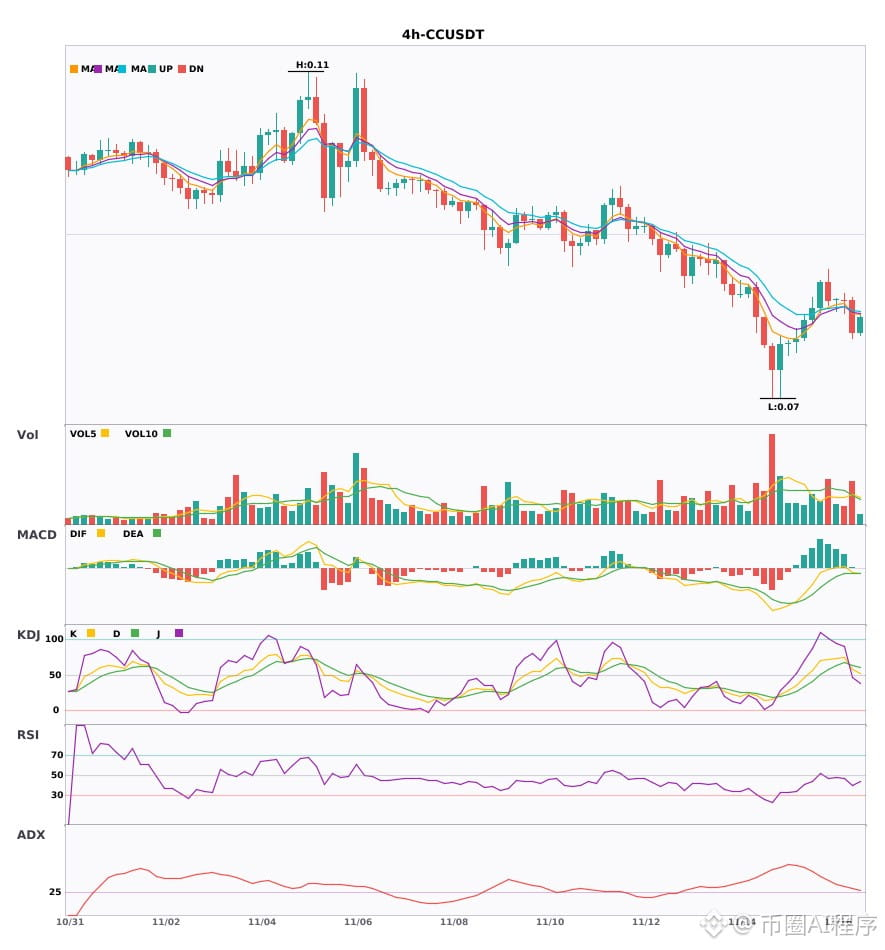
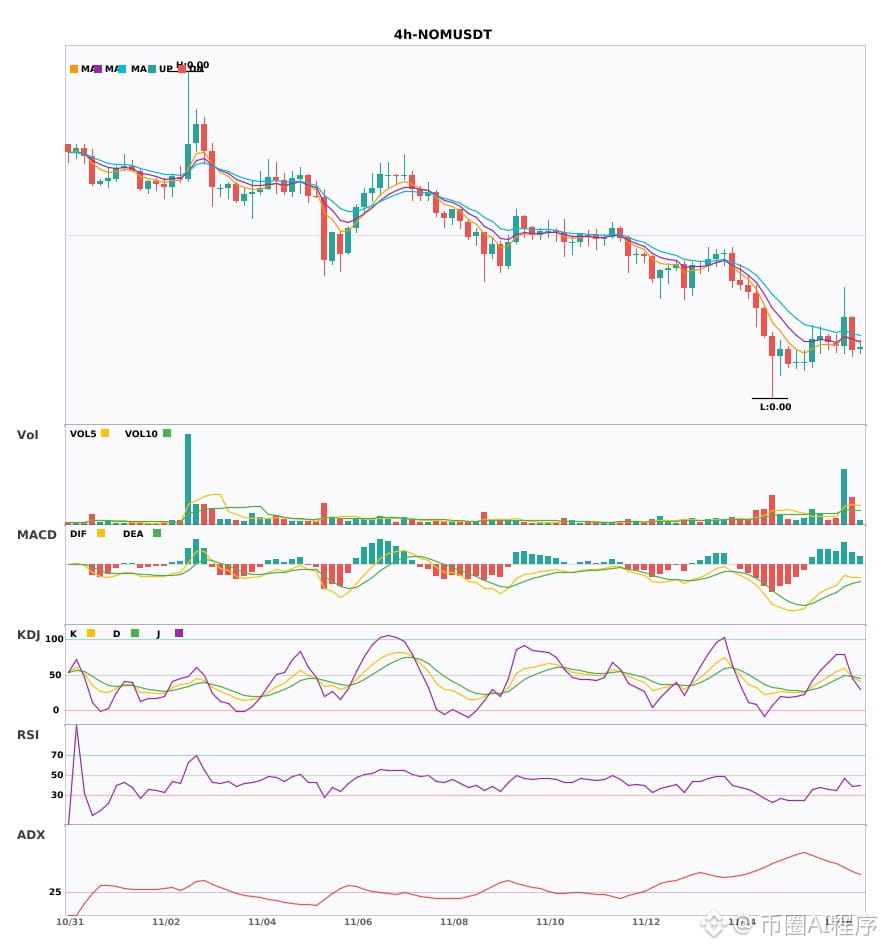
4-hour weakness, daily bearish confirmation $XPT $CC $NOM Multi-timeframe confluence points to a decline 🔥
════════════════════
🟢 $XPT 4-hour bearish signal
⚠️ Technical analysis: Multi-timeframe confluence signals a short: 4-hour MACD bearish crossover on rising volume, with bearish momentum accelerating; moving averages are bearishly aligned and diverging downward; KDJ is weak, with K crossing below D; volume surged to 4.1x; daily bearish momentum confirms the confluence.
════════════════════
🟢 $CC 4-hour bearish signal
⚠️ Technical analysis: 4-hour short entry + daily bearish confluence confirmed: MACD bearish crossover with expanding green bars, EMA5 crossing below EMA8, KDJ bearish crossover without being oversold, and volume up 1.5x.
════════════════════
🟢 $NOM 4-hour bearish signal
⚠️ Technical analysis: 4-hour entry + daily bearish confluence confirmed! EMA5 crosses below EMA8, turning bearish; KDJ bearish crossover, with K at 47.2 crossing below D at 48.2 and not overbought; trading volume surged to 3.7x. Confluence favors a bearish outlook.
════════════════════
🔔 Follow for first-hand market alerts 🔔
#多周期共振 #XPT #CC #NOM
📌 When trading, pay attention to whether the candlestick pattern aligns.
4-hour weakness, daily bearish confirmation $XPT $CC $NOM Multi-timeframe confluence points to a decline 🔥
════════════════════
🟢 $XPT 4-hour bearish signal
⚠️ Technical analysis: Multi-timeframe confluence signals a short: 4-hour MACD bearish crossover on rising volume, with bearish momentum accelerating; moving averages are bearishly aligned and diverging downward; KDJ is weak, with K crossing below D; volume surged to 4.1x; daily bearish momentum confirms the confluence.
════════════════════
🟢 $CC 4-hour bearish signal
⚠️ Technical analysis: 4-hour short entry + daily bearish confluence confirmed: MACD bearish crossover with expanding green bars, EMA5 crossing below EMA8, KDJ bearish crossover without being oversold, and volume up 1.5x.
════════════════════
🟢 $NOM 4-hour bearish signal
⚠️ Technical analysis: 4-hour entry + daily bearish confluence confirmed! EMA5 crosses below EMA8, turning bearish; KDJ bearish crossover, with K at 47.2 crossing below D at 48.2 and not overbought; trading volume surged to 3.7x. Confluence favors a bearish outlook.
════════════════════
🔔 Follow for first-hand market alerts 🔔
#多周期共振 #XPT #CC #NOM
📌 When trading, pay attention to whether the candlestick pattern aligns.
════════════════════
🟢 $XPT 4-hour bearish signal
⚠️ Technical analysis: Multi-timeframe confluence signals a short: 4-hour MACD bearish crossover on rising volume, with bearish momentum accelerating; moving averages are bearishly aligned and diverging downward; KDJ is weak, with K crossing below D; volume surged to 4.1x; daily bearish momentum confirms the confluence.
════════════════════
🟢 $CC 4-hour bearish signal
⚠️ Technical analysis: 4-hour short entry + daily bearish confluence confirmed: MACD bearish crossover with expanding green bars, EMA5 crossing below EMA8, KDJ bearish crossover without being oversold, and volume up 1.5x.
════════════════════
🟢 $NOM 4-hour bearish signal
⚠️ Technical analysis: 4-hour entry + daily bearish confluence confirmed! EMA5 crosses below EMA8, turning bearish; KDJ bearish crossover, with K at 47.2 crossing below D at 48.2 and not overbought; trading volume surged to 3.7x. Confluence favors a bearish outlook.
════════════════════
🔔 Follow for first-hand market alerts 🔔
#多周期共振 #XPT #CC #NOM
📌 When trading, pay attention to whether the candlestick pattern aligns.
4
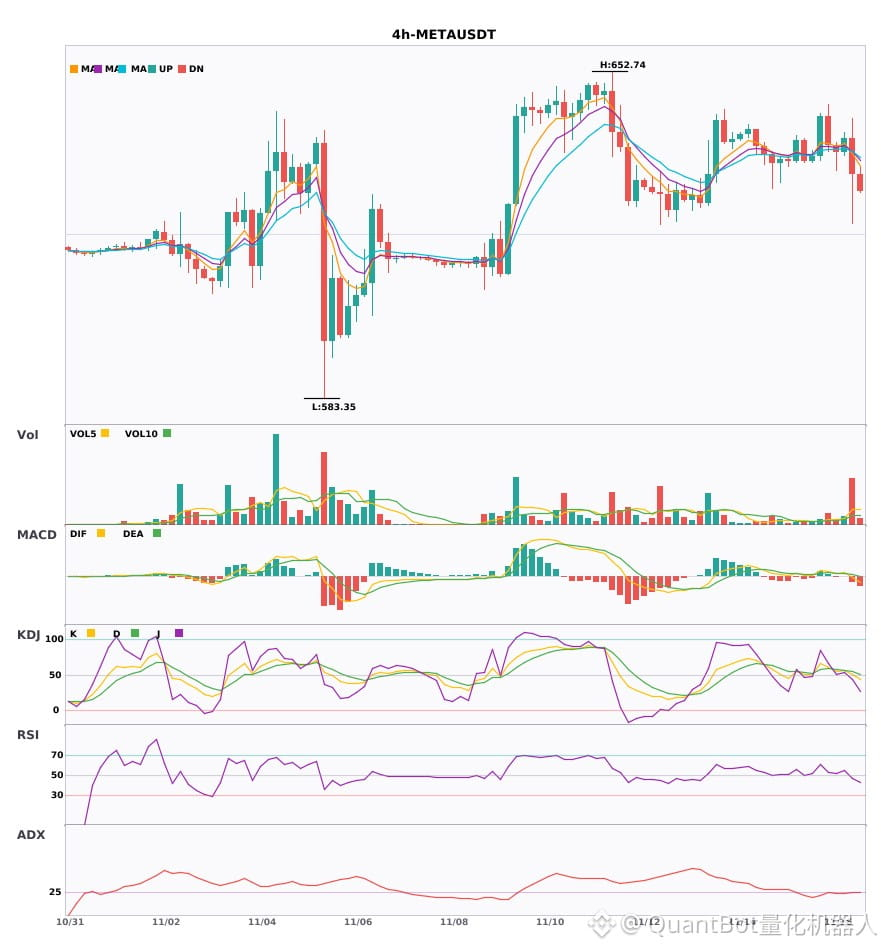
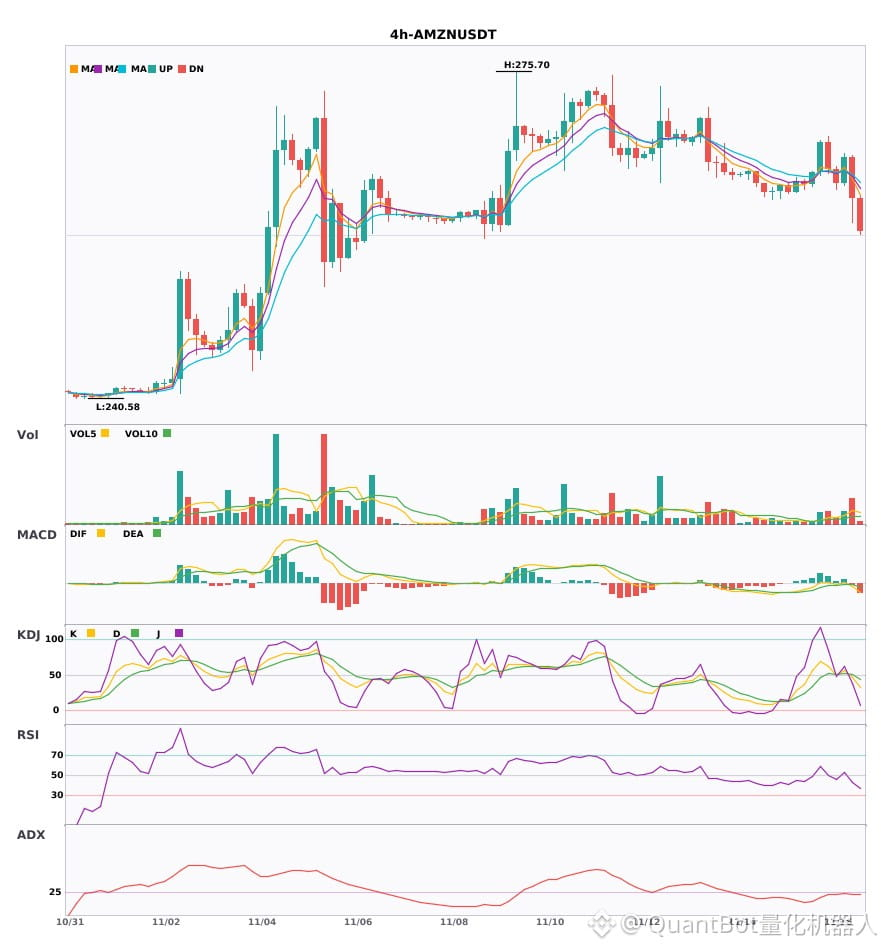
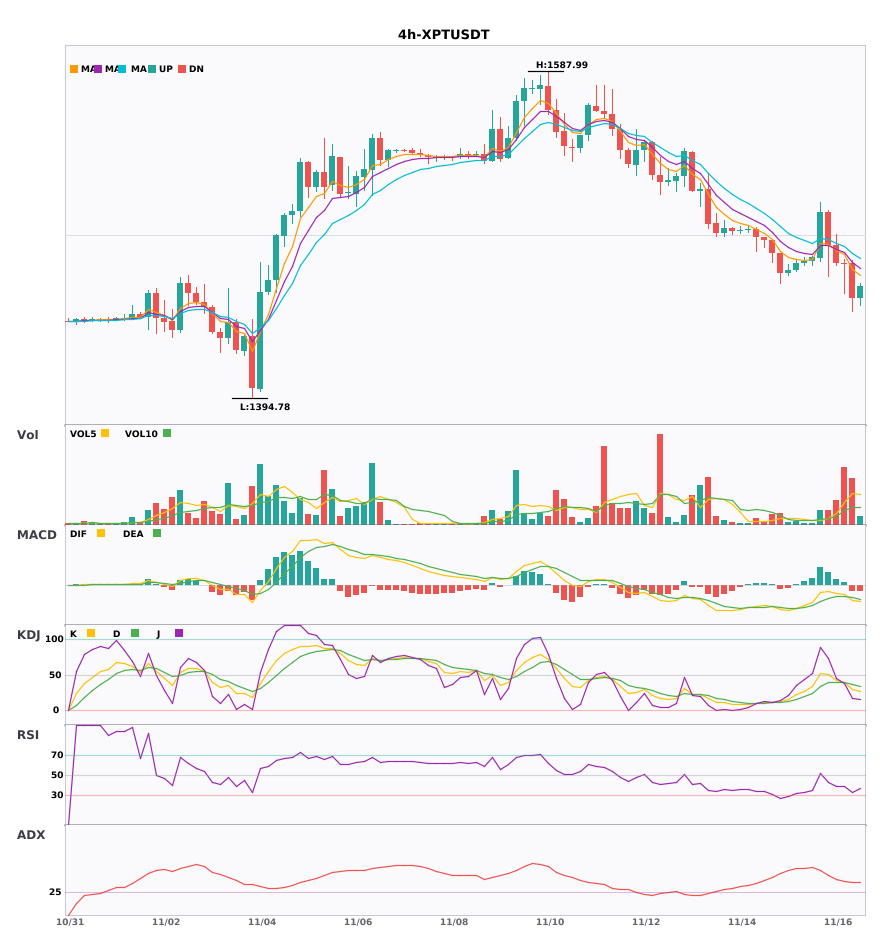
$META/$AMZN/$XPT 4H-level bearish confluence signal confirmed
📉 $META | 4-hour bearish signal
━━━━━━━━━━━━━━━━━━
Technical analysis: ADX(27) trend established; MACD bearish cross below zero; EMA5 breaks below 8, turning bearish; strong KDJ at 50.9/54.8; volume 5.1x
Price change: -1.2000%
📉 $AMZN | 4-hour bearish signal
━━━━━━━━━━━━━━━━━━
Technical analysis: ADX(25) trend formed, suitable for entry|MACD bearish cross below zero|EMA5/8 bearish cross|KDJ bearish cross (46.5/50.6)|Volume up 3x
Price change: -1.6700%
📉 $XPT | 4-hour bearish signal
━━━━━━━━━━━━━━━━━━
Technical analysis: ADX(38) strong trend | MACD bearish cross below zero accelerating | EMA5/8/13 bearish alignment | Weak KDJ (K:29.9, D:36.5) | Volume up 4.1x
Price change: -1.4100%
━━━━━━━━━━━━━━━━━━
#技术分析 #META #AMZN #XPT
📌 The above is for reference only and does not constitute investment advice
$META /$AMZN /$XPT 4H-level bearish confluence signal confirmed
📉 $META | 4-hour bearish signal
━━━━━━━━━━━━━━━━━━
Technical analysis: ADX(27) trend established; MACD bearish cross below zero; EMA5 breaks below 8, turning bearish; strong KDJ at 50.9/54.8; volume 5.1x
Price change: -1.2000%
📉 $AMZN | 4-hour bearish signal
━━━━━━━━━━━━━━━━━━
Technical analysis: ADX(25) trend formed, suitable for entry|MACD bearish cross below zero|EMA5/8 bearish cross|KDJ bearish cross (46.5/50.6)|Volume up 3x
Price change: -1.6700%
📉 $XPT | 4-hour bearish signal
━━━━━━━━━━━━━━━━━━
Technical analysis: ADX(38) strong trend | MACD bearish cross below zero accelerating | EMA5/8/13 bearish alignment | Weak KDJ (K:29.9, D:36.5) | Volume up 4.1x
Price change: -1.4100%
━━━━━━━━━━━━━━━━━━
#技术分析 #META #AMZN #XPT
📌 The above is for reference only and does not constitute investment advice
📉 $META | 4-hour bearish signal
━━━━━━━━━━━━━━━━━━
Technical analysis: ADX(27) trend established; MACD bearish cross below zero; EMA5 breaks below 8, turning bearish; strong KDJ at 50.9/54.8; volume 5.1x
Price change: -1.2000%
📉 $AMZN | 4-hour bearish signal
━━━━━━━━━━━━━━━━━━
Technical analysis: ADX(25) trend formed, suitable for entry|MACD bearish cross below zero|EMA5/8 bearish cross|KDJ bearish cross (46.5/50.6)|Volume up 3x
Price change: -1.6700%
📉 $XPT | 4-hour bearish signal
━━━━━━━━━━━━━━━━━━
Technical analysis: ADX(38) strong trend | MACD bearish cross below zero accelerating | EMA5/8/13 bearish alignment | Weak KDJ (K:29.9, D:36.5) | Volume up 4.1x
Price change: -1.4100%
━━━━━━━━━━━━━━━━━━
#技术分析 #META #AMZN #XPT
📌 The above is for reference only and does not constitute investment advice
2
·
--
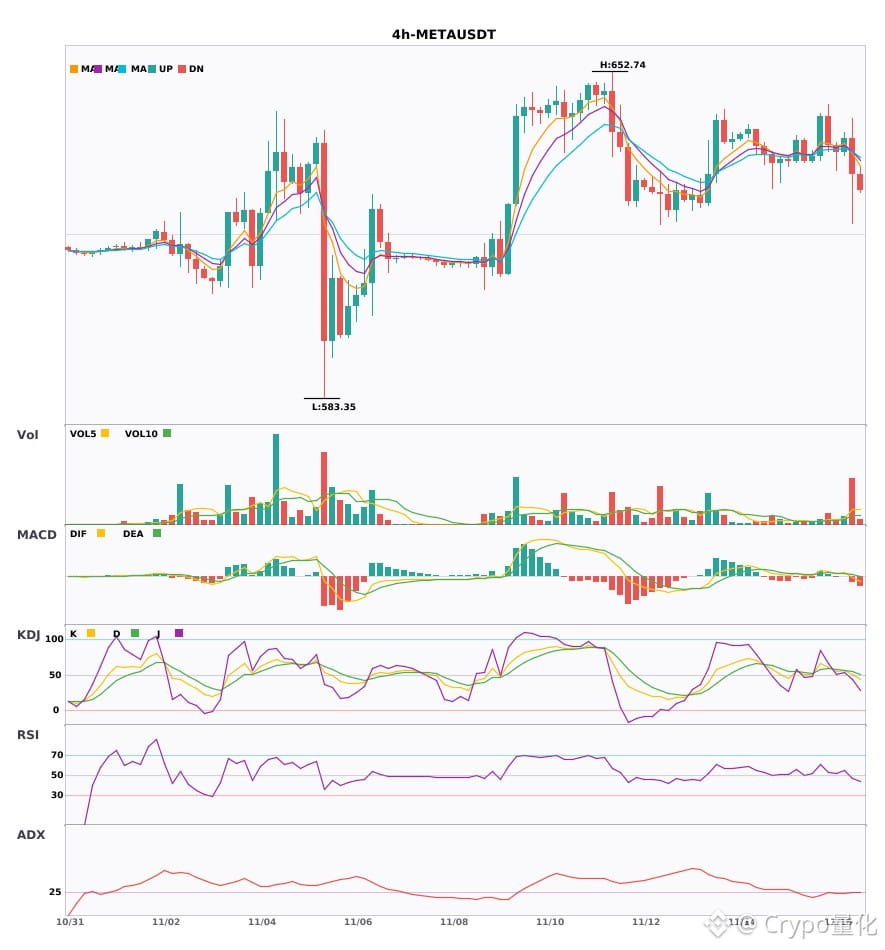
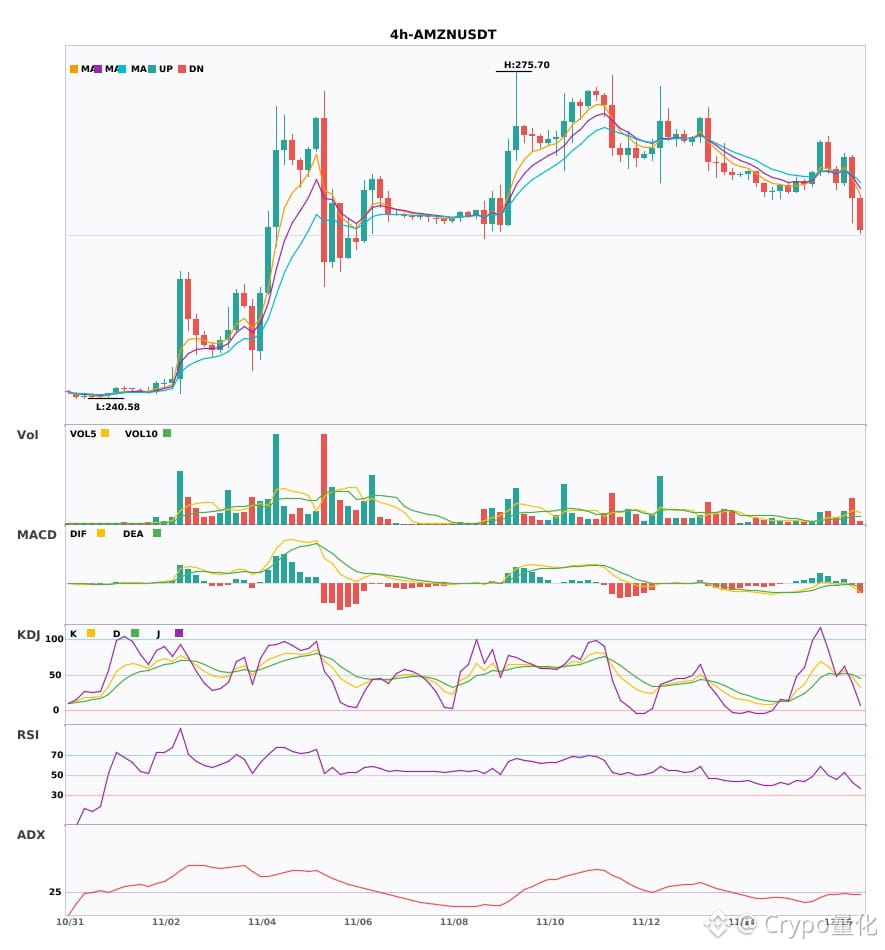
$META/$AMZN/$XPT 4-hour charts are all weakening; don't rush to buy the dip 🔥
════════════════════
🟢 $META 4-hour bearish signal
⚠️ Technicals: The ADX trend is just starting, so there may be an opportunity to enter|MACD death cross, bears are gaining momentum|EMA has turned bearish in the short term|KDJ favors the bulls|Trading volume surged 5.1x
════════════════════
🟢 $AMZN 4-hour bearish signal
⚠️ Technicals: The trend is just taking shape, so there may be an opportunity to enter. MACD death cross below zero, bears are gaining momentum. Moving averages have turned bearish in the short term. KDJ death cross, but not oversold. Volume surged 3x.
════════════════════
🟢 $XPT 4-hour bearish signal
⚠️ Technicals: The trend is clear. MACD death cross below zero, with bears gaining momentum. Moving averages are bearishly aligned and heading down. KDJ is weak, favoring the bears. Trading volume increased 4.1x.
════════════════════
🔔 Follow for first-hand market alerts 🔔
#技术分析 #META #AMZN #XPT
📌 When trading, watch for whether the candlestick pattern meets your criteria
$META /$AMZN /$XPT 4-hour charts are all weakening; don't rush to buy the dip 🔥
════════════════════
🟢 $META 4-hour bearish signal
⚠️ Technicals: The ADX trend is just starting, so there may be an opportunity to enter|MACD death cross, bears are gaining momentum|EMA has turned bearish in the short term|KDJ favors the bulls|Trading volume surged 5.1x
════════════════════
🟢 $AMZN 4-hour bearish signal
⚠️ Technicals: The trend is just taking shape, so there may be an opportunity to enter. MACD death cross below zero, bears are gaining momentum. Moving averages have turned bearish in the short term. KDJ death cross, but not oversold. Volume surged 3x.
════════════════════
🟢 $XPT 4-hour bearish signal
⚠️ Technicals: The trend is clear. MACD death cross below zero, with bears gaining momentum. Moving averages are bearishly aligned and heading down. KDJ is weak, favoring the bears. Trading volume increased 4.1x.
════════════════════
🔔 Follow for first-hand market alerts 🔔
#技术分析 #META #AMZN #XPT
📌 When trading, watch for whether the candlestick pattern meets your criteria
════════════════════
🟢 $META 4-hour bearish signal
⚠️ Technicals: The ADX trend is just starting, so there may be an opportunity to enter|MACD death cross, bears are gaining momentum|EMA has turned bearish in the short term|KDJ favors the bulls|Trading volume surged 5.1x
════════════════════
🟢 $AMZN 4-hour bearish signal
⚠️ Technicals: The trend is just taking shape, so there may be an opportunity to enter. MACD death cross below zero, bears are gaining momentum. Moving averages have turned bearish in the short term. KDJ death cross, but not oversold. Volume surged 3x.
════════════════════
🟢 $XPT 4-hour bearish signal
⚠️ Technicals: The trend is clear. MACD death cross below zero, with bears gaining momentum. Moving averages are bearishly aligned and heading down. KDJ is weak, favoring the bears. Trading volume increased 4.1x.
════════════════════
🔔 Follow for first-hand market alerts 🔔
#技术分析 #META #AMZN #XPT
📌 When trading, watch for whether the candlestick pattern meets your criteria
2
·
--
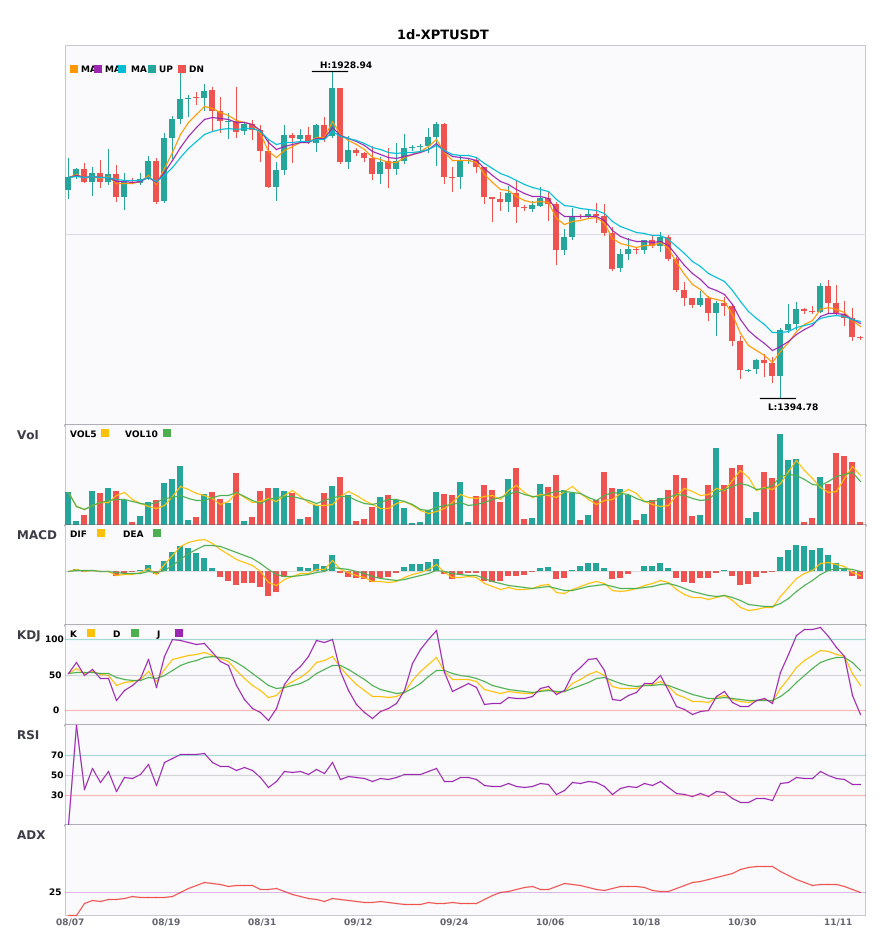
$XPT Daily and weekly charts align bearish; bearish signals are emerging. Watch out for risk 🔥
════════════════════
🟢 $XPT Daily chart: Bearish signal
⚠️ Technical analysis: Weekly and daily bearish signals align! MACD death cross below zero, with expanding green bars; EMA5 crosses below EMA8, turning bearish; KDJ death cross (K51.8 D67.1); volume at 1.4×
════════════════════
🔔 Follow to get first-hand market updates 🔔
#多周期共振 #XPT
📌 When trading, check whether the candlestick pattern confirms the signal
$XPT Daily and weekly charts align bearish; bearish signals are emerging. Watch out for risk 🔥
════════════════════
🟢 $XPT Daily chart: Bearish signal
⚠️ Technical analysis: Weekly and daily bearish signals align! MACD death cross below zero, with expanding green bars; EMA5 crosses below EMA8, turning bearish; KDJ death cross (K51.8 D67.1); volume at 1.4×
════════════════════
🔔 Follow to get first-hand market updates 🔔
#多周期共振 #XPT
📌 When trading, check whether the candlestick pattern confirms the signal
════════════════════
🟢 $XPT Daily chart: Bearish signal
⚠️ Technical analysis: Weekly and daily bearish signals align! MACD death cross below zero, with expanding green bars; EMA5 crosses below EMA8, turning bearish; KDJ death cross (K51.8 D67.1); volume at 1.4×
════════════════════
🔔 Follow to get first-hand market updates 🔔
#多周期共振 #XPT
📌 When trading, check whether the candlestick pattern confirms the signal
11

·
--
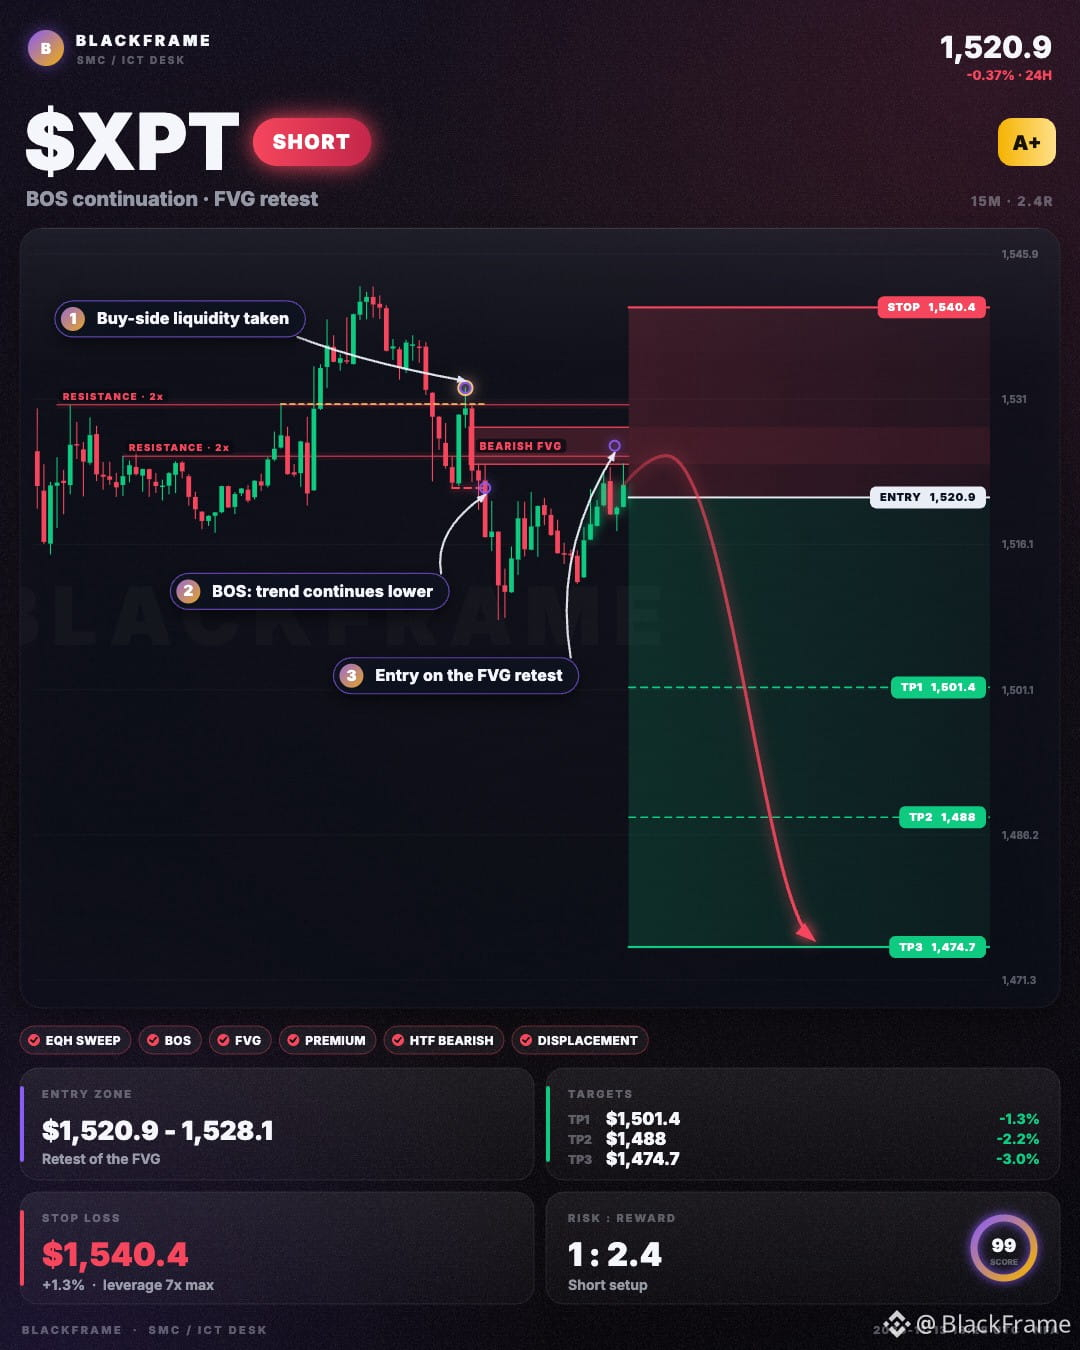
🔎 $XPT breaks lower structure in NY killzone
SHORT · 15M
Entry: $1,520.9 - $1,524.3
TP1: $1,501.4
TP2: $1,488
TP3: $1,474.7
SL: $1,540.4
Equal highs were swept, taking buy‑side liquidity. BOS on 15M confirms downtrend and price hit the bearish FVG from premium. Entry at $1,520.9 with stop at $1,540.4; target at $1,474.7 when sell‑side liquidity is taken.
#XPT #ICT · NFA
🔎 $XPT breaks lower structure in NY killzone
SHORT · 15M
Entry: $1,520.9 - $1,524.3
TP1: $1,501.4
TP2: $1,488
TP3: $1,474.7
SL: $1,540.4
Equal highs were swept, taking buy‑side liquidity. BOS on 15M confirms downtrend and price hit the bearish FVG from premium. Entry at $1,520.9 with stop at $1,540.4; target at $1,474.7 when sell‑side liquidity is taken.
#XPT #ICT · NFA
SHORT · 15M
Entry: $1,520.9 - $1,524.3
TP1: $1,501.4
TP2: $1,488
TP3: $1,474.7
SL: $1,540.4
Equal highs were swept, taking buy‑side liquidity. BOS on 15M confirms downtrend and price hit the bearish FVG from premium. Entry at $1,520.9 with stop at $1,540.4; target at $1,474.7 when sell‑side liquidity is taken.
#XPT #ICT · NFA
25
Log in to explore more content
Join global crypto users on Binance Square
⚡️ Get latest and useful information about crypto.
💬 Trusted by the world’s largest crypto exchange.
👍 Discover real insights from verified creators.
Email / Phone number
Trending Topics
1
#BTCReboundsAbove$60KAmidWhaleDipBuying
5,597 views
59 Discussing
2
#NvidiaLoses$2.7TrillionInMonthAndAHalf
44,691 views
209 Discussing
3
#GlobalStocksFaceLongestLosingStreakSince2023
402,328 views
2,659 Discussing
4
#BlackRockIBITPostsRecord$541MSingleDayOutflow
59,256 views
145 Discussing
5
#AnthropicPlungesTowardIPOPriceonDay2
215,608 views
1,713 Discussing
6
#TwentyOneCapitalAdds172.25BTC
104,431 views
1,110 Discussing
7
#HKBillWouldExcludeTokenizedDepositsFromVirtualAssets
14,573 views
66 Discussing
8
#HKBillProposesHK$100KFineForUnauthorizedCryptoTitles
3,621 views
30 Discussing
9
#BitMineFaces$10.1BUnrealizedETHLoss
6,986 views
32 Discussing
10
#StrategyReports$35BNetReserves
3,724 views
24 Discussing