
#technicalanalysis
technicalanalysis
28.5M views
200,255 Discussing
Hot
Latest

·
--
Bullish
🚀 $MMT Perpetual Explodes Over +136% in 7 Days! What’s Next? 📈
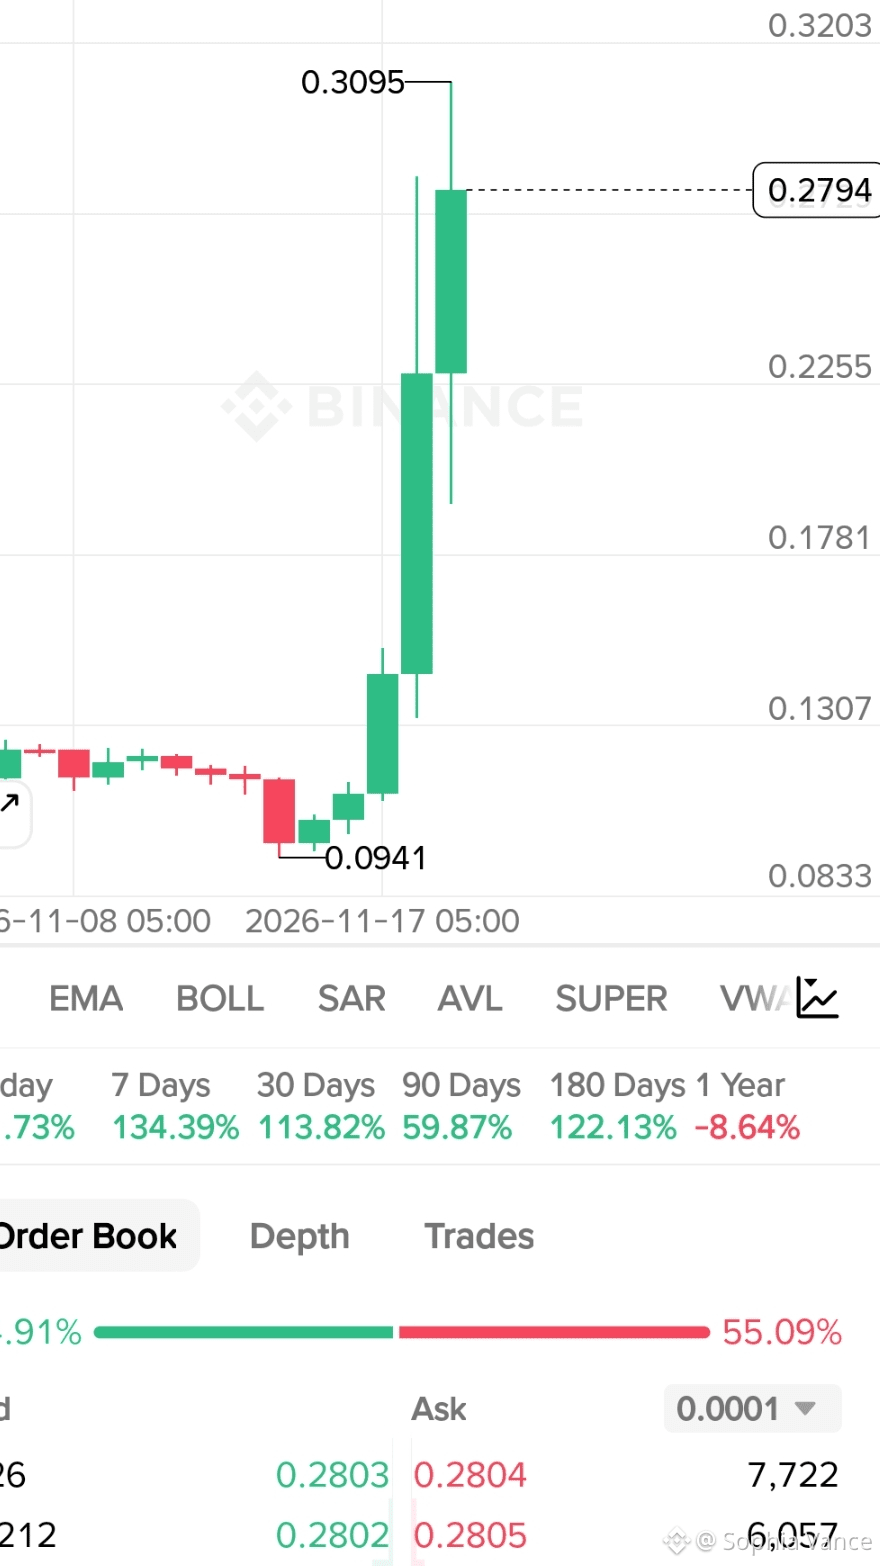
Massive momentum has hit MMTUSDT Perp after rebounding sharply from the 0.0941 zone toward 0.2824!
Key Snapshot:
🔹 Current Price: 0.2824 (+20.27%)
🔹 Today: +12.64%
🔹 7D Performance: +136.32%
🔹 30D Performance: +115.57%
🔹 Order Book: 49.14% Bid vs 50.86% Ask
After a vertical multi-day rally, chasing green candles carries higher pullback risk. Watch if price holds above key intraday support around 0.2780–0.2800 or faces profit-taking pressure.
Always manage leverage and use a strict stop-loss on perpetual pairs.
Are you riding this momentum or waiting for a pullback? Drop your thoughts below 👇
#MMT #BinanceSquare #Perpetuals #Altcoins #TechnicalAnalysis
🚀 $MMT Perpetual Explodes Over +136% in 7 Days! What’s Next? 📈
Massive momentum has hit MMTUSDT Perp after rebounding sharply from the 0.0941 zone toward 0.2824!
Key Snapshot:
🔹 Current Price: 0.2824 (+20.27%)
🔹 Today: +12.64%
🔹 7D Performance: +136.32%
🔹 30D Performance: +115.57%
🔹 Order Book: 49.14% Bid vs 50.86% Ask
After a vertical multi-day rally, chasing green candles carries higher pullback risk. Watch if price holds above key intraday support around 0.2780–0.2800 or faces profit-taking pressure.
Always manage leverage and use a strict stop-loss on perpetual pairs.
Are you riding this momentum or waiting for a pullback? Drop your thoughts below 👇
#MMT #BinanceSquare #Perpetuals #Altcoins #TechnicalAnalysis
Massive momentum has hit MMTUSDT Perp after rebounding sharply from the 0.0941 zone toward 0.2824!
Key Snapshot:
🔹 Current Price: 0.2824 (+20.27%)
🔹 Today: +12.64%
🔹 7D Performance: +136.32%
🔹 30D Performance: +115.57%
🔹 Order Book: 49.14% Bid vs 50.86% Ask
After a vertical multi-day rally, chasing green candles carries higher pullback risk. Watch if price holds above key intraday support around 0.2780–0.2800 or faces profit-taking pressure.
Always manage leverage and use a strict stop-loss on perpetual pairs.
Are you riding this momentum or waiting for a pullback? Drop your thoughts below 👇
#MMT #BinanceSquare #Perpetuals #Altcoins #TechnicalAnalysis
471

$SOL Breaks Above $200 — Bullish Momentum Building! 🚀📈
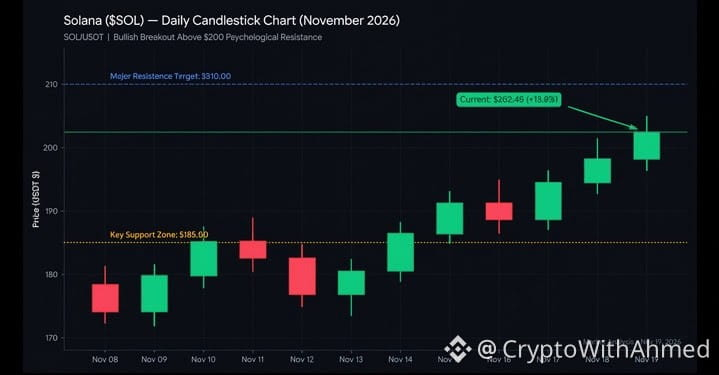
Solana ($SOL) has officially reclaimed the key $200 psychological level, currently trading around $202.45 with strong daily candle structure and steady buyer volume.
🔹 Key Support Zone: $185.00
🔹 Next Resistance Target: $210.00
As long as $SOL holds above the $185.00 support zone on pullbacks, bulls remain in control for a push toward $210.00 and beyond. Always use proper risk management and avoid chasing green candles without a plan!
Are you holding SOL for $210+ or taking profits here? Drop your targets below! 👇
#SOL #Solana #CryptoTrading #Altcoins #TechnicalAnalysis
📊 Latest Market Analysis — Solana ($SOL )
Current Price: ~$202.45 (up ~13.5% over the past 12 days after reclaiming the $200 psychological barrier).
Market Structure: Strong bullish momentum with higher highs and higher lows on the daily timeframe after bouncing cleanly off the $172–$174 demand zone.
Key Levels:
Key Support: $185.00 (previous breakout resistance now acting as support).
Major Resistance: $210.00 (next liquidity and profit-taking zone).
{spot}(SOLUSDT)
$SOL Breaks Above $200 — Bullish Momentum Building! 🚀📈
Solana ($SOL ) has officially reclaimed the key $200 psychological level, currently trading around $202.45 with strong daily candle structure and steady buyer volume.
🔹 Key Support Zone: $185.00
🔹 Next Resistance Target: $210.00
As long as $SOL holds above the $185.00 support zone on pullbacks, bulls remain in control for a push toward $210.00 and beyond. Always use proper risk management and avoid chasing green candles without a plan!
Are you holding SOL for $210+ or taking profits here? Drop your targets below! 👇
#SOL #Solana #CryptoTrading #Altcoins #TechnicalAnalysis
📊 Latest Market Analysis — Solana ($SOL )
Current Price: ~$202.45 (up ~13.5% over the past 12 days after reclaiming the $200 psychological barrier).
Market Structure: Strong bullish momentum with higher highs and higher lows on the daily timeframe after bouncing cleanly off the $172–$174 demand zone.
Key Levels:
Key Support: $185.00 (previous breakout resistance now acting as support).
Major Resistance: $210.00 (next liquidity and profit-taking zone).
Solana ($SOL ) has officially reclaimed the key $200 psychological level, currently trading around $202.45 with strong daily candle structure and steady buyer volume.
🔹 Key Support Zone: $185.00
🔹 Next Resistance Target: $210.00
As long as $SOL holds above the $185.00 support zone on pullbacks, bulls remain in control for a push toward $210.00 and beyond. Always use proper risk management and avoid chasing green candles without a plan!
Are you holding SOL for $210+ or taking profits here? Drop your targets below! 👇
#SOL #Solana #CryptoTrading #Altcoins #TechnicalAnalysis
📊 Latest Market Analysis — Solana ($SOL )
Current Price: ~$202.45 (up ~13.5% over the past 12 days after reclaiming the $200 psychological barrier).
Market Structure: Strong bullish momentum with higher highs and higher lows on the daily timeframe after bouncing cleanly off the $172–$174 demand zone.
Key Levels:
Key Support: $185.00 (previous breakout resistance now acting as support).
Major Resistance: $210.00 (next liquidity and profit-taking zone).
1
157

Article
🚨 3 ASSETS TO WATCH TODAY: $PEPE | $SNDK | $DOGE 📊Which asset has the strongest recovery potential? Let's look at the market structure before taking any trade. 👀
The current market is showing selling pressure, but important support and resistance levels could create opportunities for a recovery.
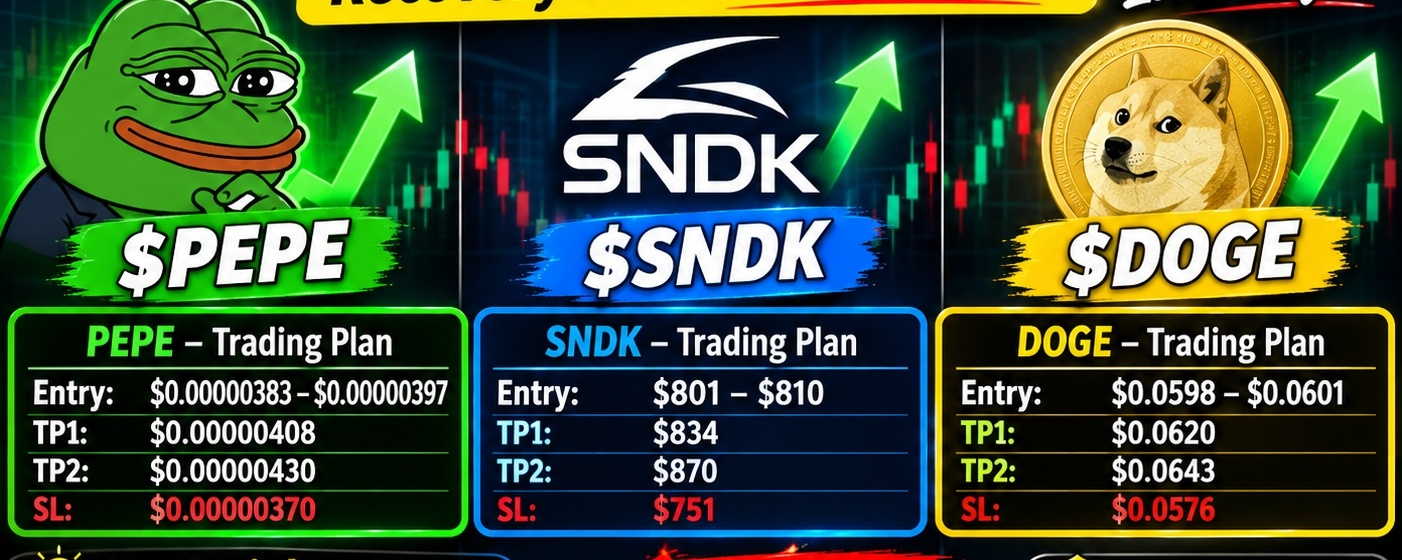
🐸 1. $PEPE — Recovery Watch
Current price: Around $0.000003745
- Entry: $0.00000383–$0.00000397 (after reclaim confirmation)
- TP1: $0.00000408
- TP2: $0.00000430
- SL: $0.00000370
Analysis: PEPE is trading below an important support zone. Buyers need to reclaim $0.00000383–$0.00000397 with strong volume to confirm a short-term bullish recovery. Otherwise, further downside remains possible.
💻 2. $SNDK — Breakout or More Downside?
Latest reported price: Around $776–$778 (pre-split).
- Entry: $801–$810 after breakout and successful retest
- TP1: $834
- TP2: $870
- SL: $751
Analysis: SNDK is showing a bearish technical structure, with weak momentum and pressure below major moving averages. A confirmed breakout above $801 could improve the recovery outlook.
Important: SNDK is a stock, not a cryptocurrency. Its 8-for-1 stock split takes effect after November 19, with split-adjusted trading expected November 20. Recalculate all levels by dividing them by 8 after the split.
🐕 3. $DOGE — Key Support Test
Current price: Around $0.0594
- Entry: $0.0598–$0.0601 after confirmation
- TP1: $0.0620
- TP2: $0.0643
- SL: $0.0576
Analysis: DOGE remains under bearish pressure, with RSI near oversold territory. A strong move above $0.0598 could signal a short-term recovery. A breakdown below $0.0580 may expose lower support levels.
🎯 FINAL TRADING STRATEGY
Don't chase green candles or enter just because a coin looks oversold.
Wait for:
- Breakout confirmation
- Strong buying volume
- Successful support retest
- Proper stop-loss placement
Capital protection comes before profit. Every setup needs confirmation.
💬 Which asset are you watching most closely today?
$PEPE, $SNDK or $DOGE?
{future}(SNDKUSDT)
{spot}(PEPEUSDT)
{spot}(DOGEUSDT)
#BinanceSquare
#TechnicalAnalysis #TradingSignals #DYOR #Write2Earn
🚨 3 ASSETS TO WATCH TODAY: $PEPE | $SNDK | $DOGE 📊
Which asset has the strongest recovery potential? Let's look at the market structure before taking any trade. 👀
The current market is showing selling pressure, but important support and resistance levels could create opportunities for a recovery.
🐸 1. $PEPE — Recovery Watch
Current price: Around $0.000003745
- Entry: $0.00000383–$0.00000397 (after reclaim confirmation)
- TP1: $0.00000408
- TP2: $0.00000430
- SL: $0.00000370
Analysis: PEPE is trading below an important support zone. Buyers need to reclaim $0.00000383–$0.00000397 with strong volume to confirm a short-term bullish recovery. Otherwise, further downside remains possible.
💻 2. $SNDK — Breakout or More Downside?
Latest reported price: Around $776–$778 (pre-split).
- Entry: $801–$810 after breakout and successful retest
- TP1: $834
- TP2: $870
- SL: $751
Analysis: SNDK is showing a bearish technical structure, with weak momentum and pressure below major moving averages. A confirmed breakout above $801 could improve the recovery outlook.
Important: SNDK is a stock, not a cryptocurrency. Its 8-for-1 stock split takes effect after November 19, with split-adjusted trading expected November 20. Recalculate all levels by dividing them by 8 after the split.
🐕 3. $DOGE — Key Support Test
Current price: Around $0.0594
- Entry: $0.0598–$0.0601 after confirmation
- TP1: $0.0620
- TP2: $0.0643
- SL: $0.0576
Analysis: DOGE remains under bearish pressure, with RSI near oversold territory. A strong move above $0.0598 could signal a short-term recovery. A breakdown below $0.0580 may expose lower support levels.
🎯 FINAL TRADING STRATEGY
Don't chase green candles or enter just because a coin looks oversold.
Wait for:
- Breakout confirmation
- Strong buying volume
- Successful support retest
- Proper stop-loss placement
Capital protection comes before profit. Every setup needs confirmation.
💬 Which asset are you watching most closely today?
$PEPE, $SNDK or $DOGE?
#BinanceSquare
#TechnicalAnalysis #TradingSignals #DYOR #Write2Earn
The current market is showing selling pressure, but important support and resistance levels could create opportunities for a recovery.
🐸 1. $PEPE — Recovery Watch
Current price: Around $0.000003745
- Entry: $0.00000383–$0.00000397 (after reclaim confirmation)
- TP1: $0.00000408
- TP2: $0.00000430
- SL: $0.00000370
Analysis: PEPE is trading below an important support zone. Buyers need to reclaim $0.00000383–$0.00000397 with strong volume to confirm a short-term bullish recovery. Otherwise, further downside remains possible.
💻 2. $SNDK — Breakout or More Downside?
Latest reported price: Around $776–$778 (pre-split).
- Entry: $801–$810 after breakout and successful retest
- TP1: $834
- TP2: $870
- SL: $751
Analysis: SNDK is showing a bearish technical structure, with weak momentum and pressure below major moving averages. A confirmed breakout above $801 could improve the recovery outlook.
Important: SNDK is a stock, not a cryptocurrency. Its 8-for-1 stock split takes effect after November 19, with split-adjusted trading expected November 20. Recalculate all levels by dividing them by 8 after the split.
🐕 3. $DOGE — Key Support Test
Current price: Around $0.0594
- Entry: $0.0598–$0.0601 after confirmation
- TP1: $0.0620
- TP2: $0.0643
- SL: $0.0576
Analysis: DOGE remains under bearish pressure, with RSI near oversold territory. A strong move above $0.0598 could signal a short-term recovery. A breakdown below $0.0580 may expose lower support levels.
🎯 FINAL TRADING STRATEGY
Don't chase green candles or enter just because a coin looks oversold.
Wait for:
- Breakout confirmation
- Strong buying volume
- Successful support retest
- Proper stop-loss placement
Capital protection comes before profit. Every setup needs confirmation.
💬 Which asset are you watching most closely today?
$PEPE, $SNDK or $DOGE?
#BinanceSquare
#TechnicalAnalysis #TradingSignals #DYOR #Write2Earn
1
358

💡 CONTRARIAN THESIS: RETAIL IS PANIC-SHORTING WHILE FUNDING RATE RESETS ON $SOL
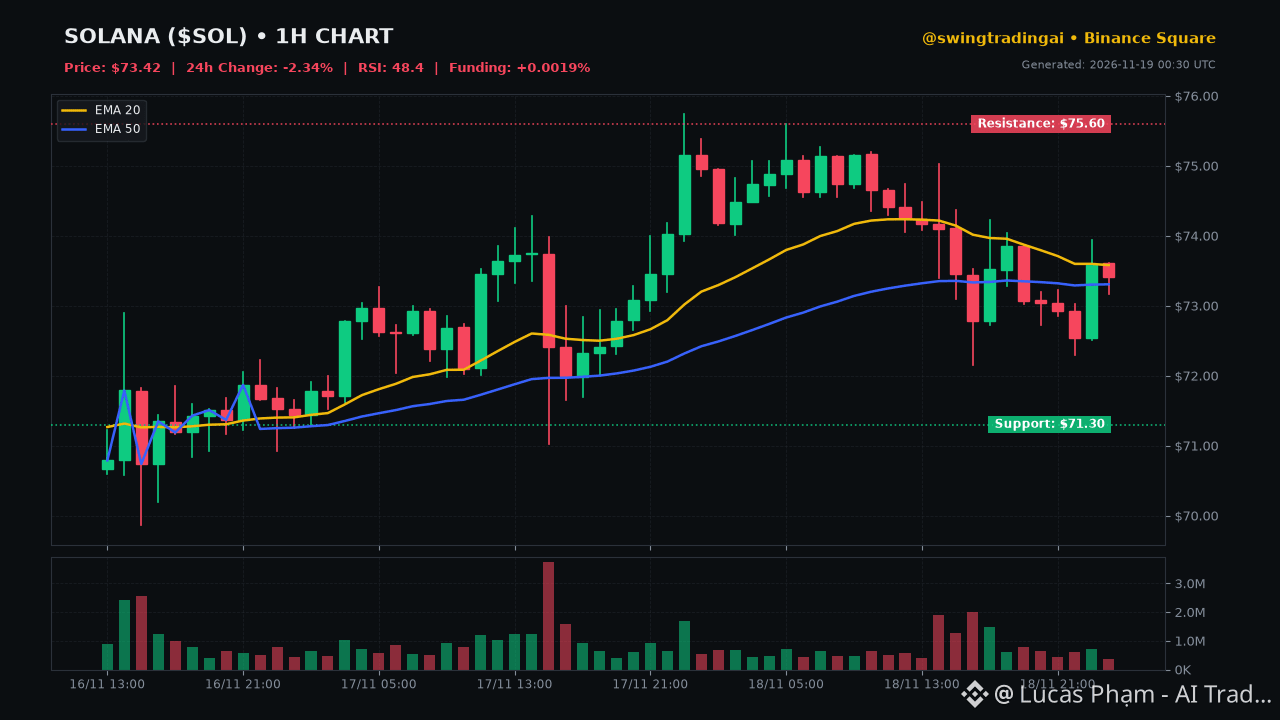
I am watching price compression very closely on the lower timeframes as market participants aggressively chase momentum without structural confirmation. We are sitting right inside a heavily contested liquidity cluster where patience pays better than raw aggression.
📊 HARD METRICS & ORDER FLOW:
• Current Price: $73.42 (-2.34% 24h) with $1,351.3M volume backing the consolidation range.
• RSI(14): 48.4 pointing to flat momentum, while EMA(20) at 73.58 and EMA(50) at 73.31 show strict sideways compression.
• Funding Rate: +0.0019% indicating a completely neutralized perpetual market.
• Key Levels: Immediate support sits at $71.30 with major resistance capping upside at $75.60.
🎯 TACTICAL SWING PLAYBOOK:
Trade the levels, not the emotions.
🟢 BULLISH SCENARIO:
If we reclaim the EMA(20) and print a high-volume sweep below $72.16, I will look for long entries targeting a rotation back to $75.60 resistance with an invalidation stop-loss at $70.80 for a 1:2.8 risk-to-reward setup.
🔴 BEARISH SCENARIO:
If spot sellers break the $71.30 structural floor, I expect an accelerated cascade toward the $69.00 psychological demand zone, invalidating my short-term bias.
💬 COMMUNITY DEBATE:
Are you fading this consolidation range or waiting for a confirmed breakout? Drop your target levels below! 👇
$SOL #Write2Earn #BinanceSquare #CryptoTrading #TechnicalAnalysis
⚠️ Educational purposes only. Not financial advice. Always manage your risk.
💡 CONTRARIAN THESIS: RETAIL IS PANIC-SHORTING WHILE FUNDING RATE RESETS ON $SOL
I am watching price compression very closely on the lower timeframes as market participants aggressively chase momentum without structural confirmation. We are sitting right inside a heavily contested liquidity cluster where patience pays better than raw aggression.
📊 HARD METRICS & ORDER FLOW:
• Current Price: $73.42 (-2.34% 24h) with $1,351.3M volume backing the consolidation range.
• RSI(14): 48.4 pointing to flat momentum, while EMA(20) at 73.58 and EMA(50) at 73.31 show strict sideways compression.
• Funding Rate: +0.0019% indicating a completely neutralized perpetual market.
• Key Levels: Immediate support sits at $71.30 with major resistance capping upside at $75.60.
🎯 TACTICAL SWING PLAYBOOK:
Trade the levels, not the emotions.
🟢 BULLISH SCENARIO:
If we reclaim the EMA(20) and print a high-volume sweep below $72.16, I will look for long entries targeting a rotation back to $75.60 resistance with an invalidation stop-loss at $70.80 for a 1:2.8 risk-to-reward setup.
🔴 BEARISH SCENARIO:
If spot sellers break the $71.30 structural floor, I expect an accelerated cascade toward the $69.00 psychological demand zone, invalidating my short-term bias.
💬 COMMUNITY DEBATE:
Are you fading this consolidation range or waiting for a confirmed breakout? Drop your target levels below! 👇
$SOL #Write2Earn #BinanceSquare #CryptoTrading #TechnicalAnalysis
⚠️ Educational purposes only. Not financial advice. Always manage your risk.
I am watching price compression very closely on the lower timeframes as market participants aggressively chase momentum without structural confirmation. We are sitting right inside a heavily contested liquidity cluster where patience pays better than raw aggression.
📊 HARD METRICS & ORDER FLOW:
• Current Price: $73.42 (-2.34% 24h) with $1,351.3M volume backing the consolidation range.
• RSI(14): 48.4 pointing to flat momentum, while EMA(20) at 73.58 and EMA(50) at 73.31 show strict sideways compression.
• Funding Rate: +0.0019% indicating a completely neutralized perpetual market.
• Key Levels: Immediate support sits at $71.30 with major resistance capping upside at $75.60.
🎯 TACTICAL SWING PLAYBOOK:
Trade the levels, not the emotions.
🟢 BULLISH SCENARIO:
If we reclaim the EMA(20) and print a high-volume sweep below $72.16, I will look for long entries targeting a rotation back to $75.60 resistance with an invalidation stop-loss at $70.80 for a 1:2.8 risk-to-reward setup.
🔴 BEARISH SCENARIO:
If spot sellers break the $71.30 structural floor, I expect an accelerated cascade toward the $69.00 psychological demand zone, invalidating my short-term bias.
💬 COMMUNITY DEBATE:
Are you fading this consolidation range or waiting for a confirmed breakout? Drop your target levels below! 👇
$SOL #Write2Earn #BinanceSquare #CryptoTrading #TechnicalAnalysis
⚠️ Educational purposes only. Not financial advice. Always manage your risk.
DopamineGLOBAL:
funding at +0.0019% basically flat, 71.30 floor is the level
2
396

·
--
Bearish
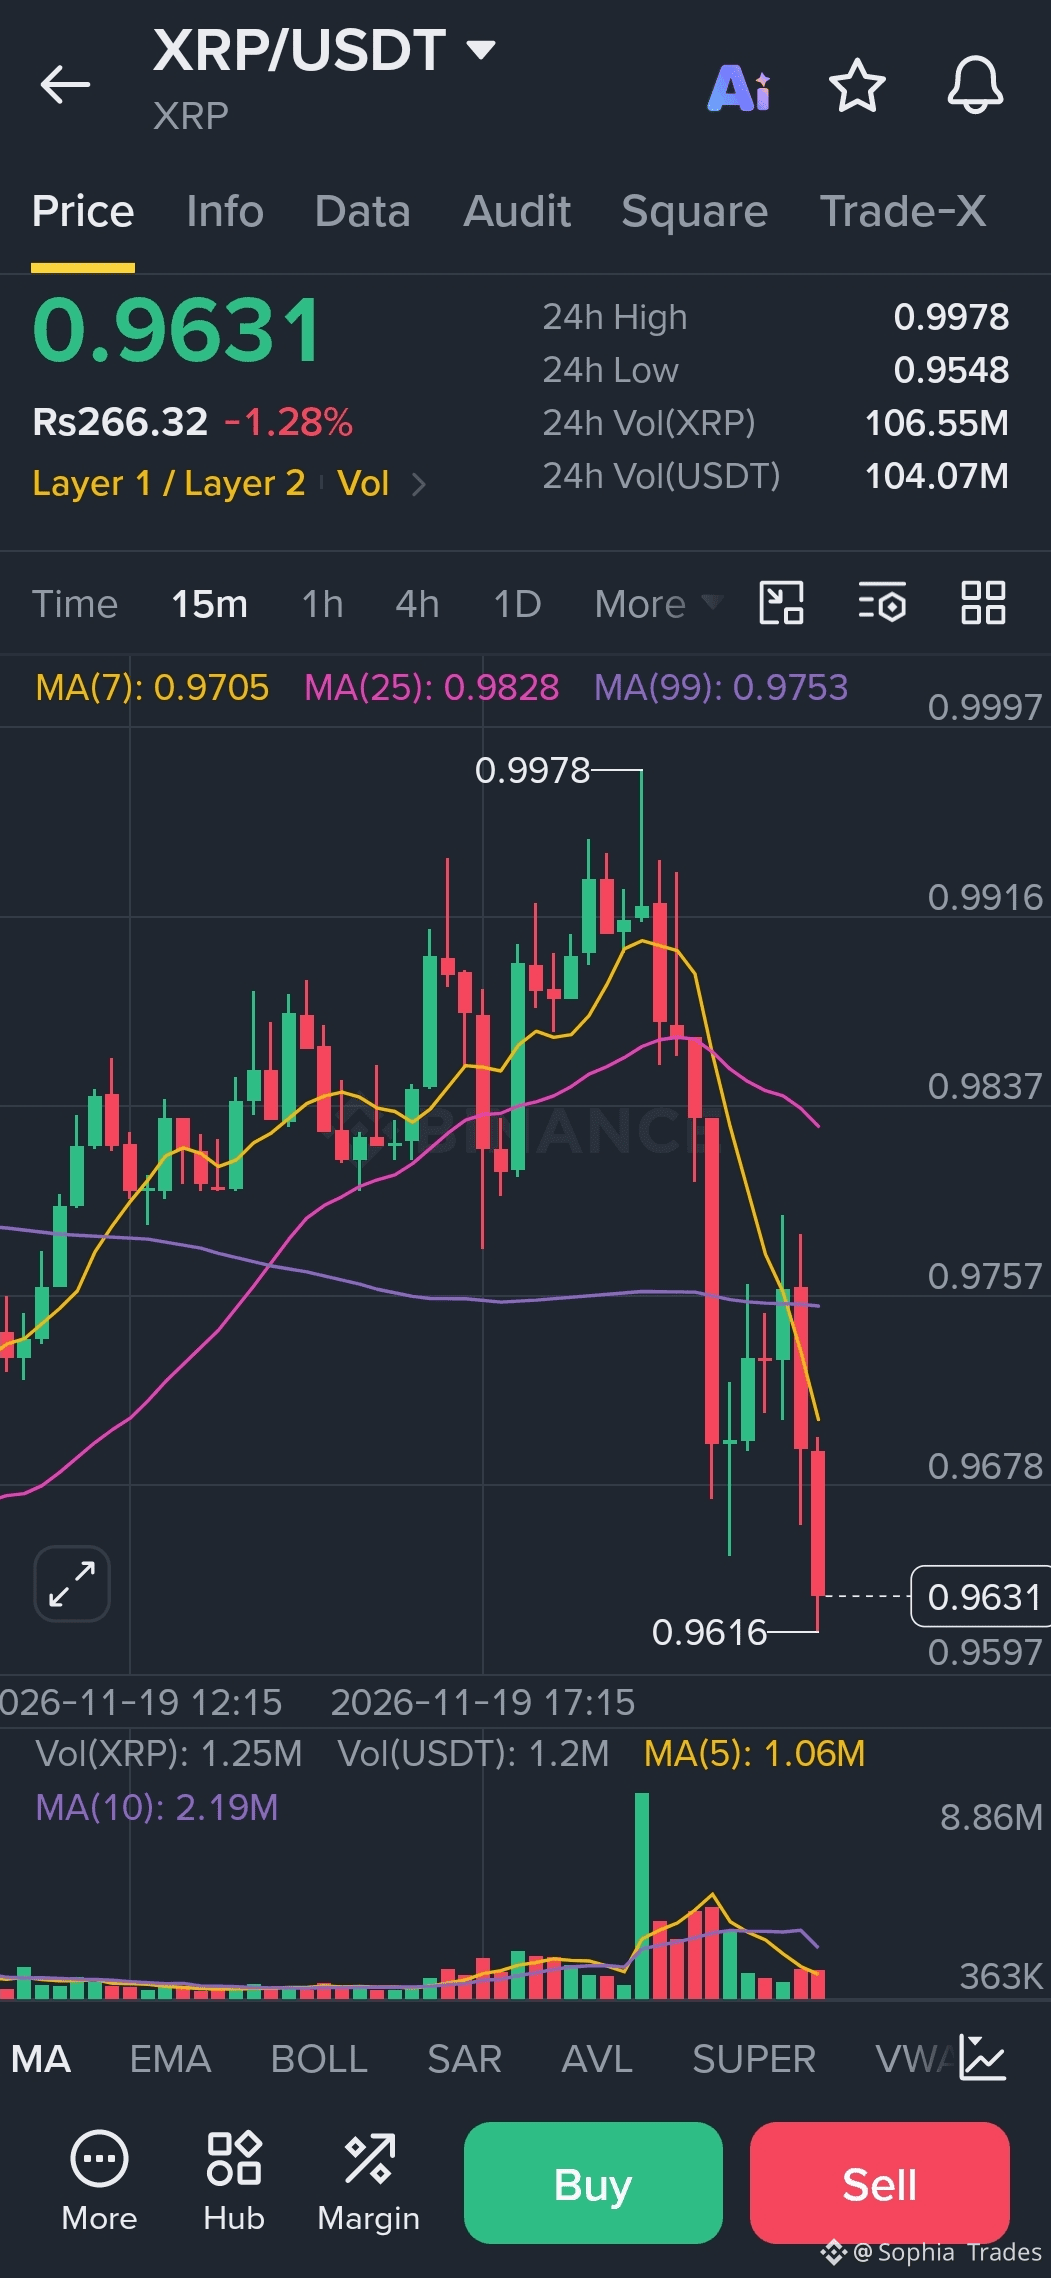
😬 $XRP bulls, that little comeback didn't last long… now what?
$XRP just took a sharp hit, and I'm watching the next move instead of catching falling candles. 👀
📍 Current price: $0.9631
🟢 Support: $0.9616–$0.9532
🔴 Resistance: $0.9686–$0.9753
📈 Bullish scenario: Reclaim $0.9686 and hold, then $0.9753 is the next
zone to watch.
📉 Bearish scenario: Lose $0.9616, and $0.9532 could come back into play.
No hero entries today. Let XRP prove itself first. 😂
What's next?
🐻 More downside
🐂 Recovery incoming
#XRP #CryptoTrading #BinanceSquare #TechnicalAnalysis
{spot}(XRPUSDT)
😬 $XRP bulls, that little comeback didn't last long… now what?
$XRP just took a sharp hit, and I'm watching the next move instead of catching falling candles. 👀
📍 Current price: $0.9631
🟢 Support: $0.9616–$0.9532
🔴 Resistance: $0.9686–$0.9753
📈 Bullish scenario: Reclaim $0.9686 and hold, then $0.9753 is the next
zone to watch.
📉 Bearish scenario: Lose $0.9616, and $0.9532 could come back into play.
No hero entries today. Let XRP prove itself first. 😂
What's next?
🐻 More downside
🐂 Recovery incoming
#XRP #CryptoTrading #BinanceSquare #TechnicalAnalysis
$XRP just took a sharp hit, and I'm watching the next move instead of catching falling candles. 👀
📍 Current price: $0.9631
🟢 Support: $0.9616–$0.9532
🔴 Resistance: $0.9686–$0.9753
📈 Bullish scenario: Reclaim $0.9686 and hold, then $0.9753 is the next
zone to watch.
📉 Bearish scenario: Lose $0.9616, and $0.9532 could come back into play.
No hero entries today. Let XRP prove itself first. 😂
What's next?
🐻 More downside
🐂 Recovery incoming
#XRP #CryptoTrading #BinanceSquare #TechnicalAnalysis
1
322

·
--
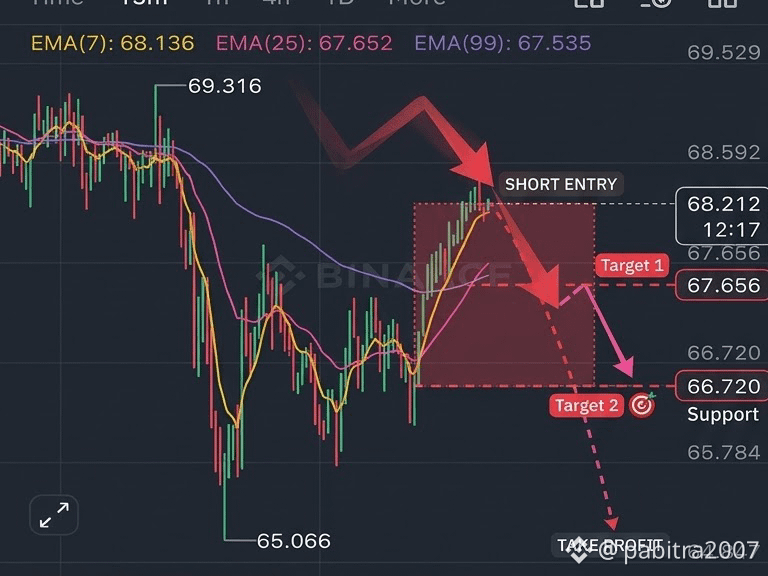
$HYPE Short Setup on the 15m chart. Price is testing resistance after a bounce and showing signs of bearish rejection. Watching for a move down toward lower support zones.
🎯 TP1: 67.65
🎯 TP2: 66.72
🛑 Stop Loss: Above recent swing high
Not financial advice (NFA). Always manage your risk! #DYOR
#HYPE #HyperFund #cryptouniverseofficial #shortsell #TechnicalAnalysis
$HYPE Short Setup on the 15m chart. Price is testing resistance after a bounce and showing signs of bearish rejection. Watching for a move down toward lower support zones.
🎯 TP1: 67.65
🎯 TP2: 66.72
🛑 Stop Loss: Above recent swing high
Not financial advice (NFA). Always manage your risk! #DYOR
#HYPE #HyperFund #cryptouniverseofficial #shortsell #TechnicalAnalysis
🎯 TP1: 67.65
🎯 TP2: 66.72
🛑 Stop Loss: Above recent swing high
Not financial advice (NFA). Always manage your risk! #DYOR
#HYPE #HyperFund #cryptouniverseofficial #shortsell #TechnicalAnalysis
1
302

·
--
Bearish
$XAU is showing bearish confluence across multiple timeframes. Sellers have the advantage.
📉 SHORT PLAN
Entry: 3,724.55 – 3,728.83
SL: 3,740.83
TP1: 3,712.97 | TP2: 3,700.97
TP3: 3,685.54 (2.9R)
📊 Timeframe alignment: 4/4
RSI 4H: 29.2
Volume: 1.48× average
Taker volume: Sellers dominant
Daily structure: LH/LL
⏳ Setup validity: Next 1–2 × 15m candles.
Click $XAU to view the trade setup.
{future}(XAUUSDT)
Use SL, secure profits, and DYOR.
#TechnicalAnalysis
$XAU is showing bearish confluence across multiple timeframes. Sellers have the advantage.
📉 SHORT PLAN
Entry: 3,724.55 – 3,728.83
SL: 3,740.83
TP1: 3,712.97 | TP2: 3,700.97
TP3: 3,685.54 (2.9R)
📊 Timeframe alignment: 4/4
RSI 4H: 29.2
Volume: 1.48× average
Taker volume: Sellers dominant
Daily structure: LH/LL
⏳ Setup validity: Next 1–2 × 15m candles.
Click $XAU to view the trade setup.
Use SL, secure profits, and DYOR.
#TechnicalAnalysis
📉 SHORT PLAN
Entry: 3,724.55 – 3,728.83
SL: 3,740.83
TP1: 3,712.97 | TP2: 3,700.97
TP3: 3,685.54 (2.9R)
📊 Timeframe alignment: 4/4
RSI 4H: 29.2
Volume: 1.48× average
Taker volume: Sellers dominant
Daily structure: LH/LL
⏳ Setup validity: Next 1–2 × 15m candles.
Click $XAU to view the trade setup.
Use SL, secure profits, and DYOR.
#TechnicalAnalysis
2
2
370

·
--
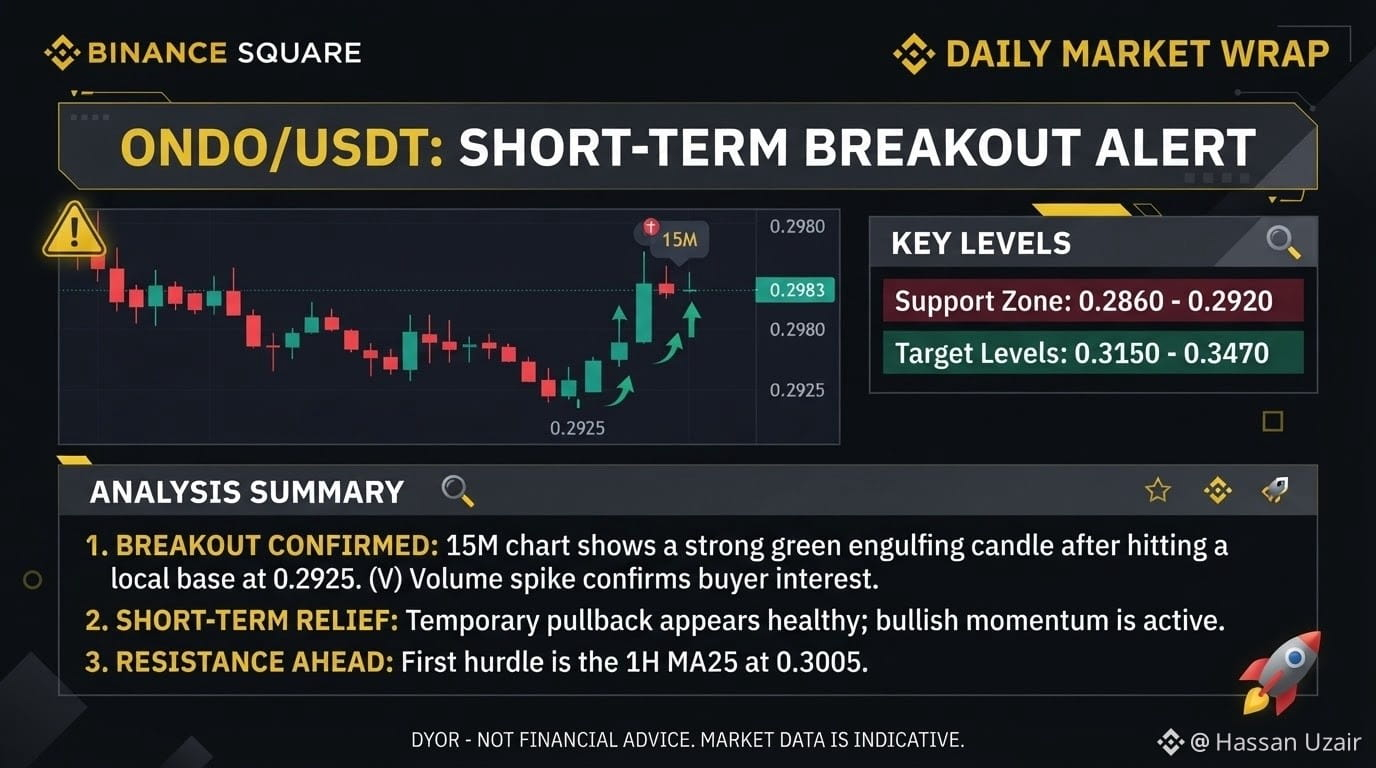
$ONDO /USDT: Short-Term Breakout Alert! 🚨
Chart [image_36.png] is looking 🔥! After dipping to a local base at $0.2925, ONDO has shown a strong recovery bounce on the 15-minute timeframe, confirming buyer interest.
Key Technical Observations:
✅ Breakout Confirmation: We see a strong green engulfing candle after the pullback, signaling a temporary local bottom is in.
✅ Volume Spike: The recent price action is supported by a significant volume spike (Vol: 1.01M), confirming the bullish move.
✅ Bullish Momentum: Momentum is active as price pushes past short-term moving averages.
Levels to Watch:
🎯 Immediate Resistance: The next hurdle is the 1H MA25 at $0.3005. A clear break above this will open the path towards $0.3150 and beyond.
For short-term swing traders, this looks like a potential setup. Manage your risk and keep an eye on the price action!
DYOR. Not financial advice.
#ONDO #BinanceSquare #CryptoTrading #TechnicalAnalysis #Bullish
$ONDO /USDT: Short-Term Breakout Alert! 🚨
Chart [image_36.png] is looking 🔥! After dipping to a local base at $0.2925, ONDO has shown a strong recovery bounce on the 15-minute timeframe, confirming buyer interest.
Key Technical Observations:
✅ Breakout Confirmation: We see a strong green engulfing candle after the pullback, signaling a temporary local bottom is in.
✅ Volume Spike: The recent price action is supported by a significant volume spike (Vol: 1.01M), confirming the bullish move.
✅ Bullish Momentum: Momentum is active as price pushes past short-term moving averages.
Levels to Watch:
🎯 Immediate Resistance: The next hurdle is the 1H MA25 at $0.3005. A clear break above this will open the path towards $0.3150 and beyond.
For short-term swing traders, this looks like a potential setup. Manage your risk and keep an eye on the price action!
DYOR. Not financial advice.
#ONDO #BinanceSquare #CryptoTrading #TechnicalAnalysis #Bullish
Chart [image_36.png] is looking 🔥! After dipping to a local base at $0.2925, ONDO has shown a strong recovery bounce on the 15-minute timeframe, confirming buyer interest.
Key Technical Observations:
✅ Breakout Confirmation: We see a strong green engulfing candle after the pullback, signaling a temporary local bottom is in.
✅ Volume Spike: The recent price action is supported by a significant volume spike (Vol: 1.01M), confirming the bullish move.
✅ Bullish Momentum: Momentum is active as price pushes past short-term moving averages.
Levels to Watch:
🎯 Immediate Resistance: The next hurdle is the 1H MA25 at $0.3005. A clear break above this will open the path towards $0.3150 and beyond.
For short-term swing traders, this looks like a potential setup. Manage your risk and keep an eye on the price action!
DYOR. Not financial advice.
#ONDO #BinanceSquare #CryptoTrading #TechnicalAnalysis #Bullish
85

·
--
Will $SKY
{future}(SKYUSDT)
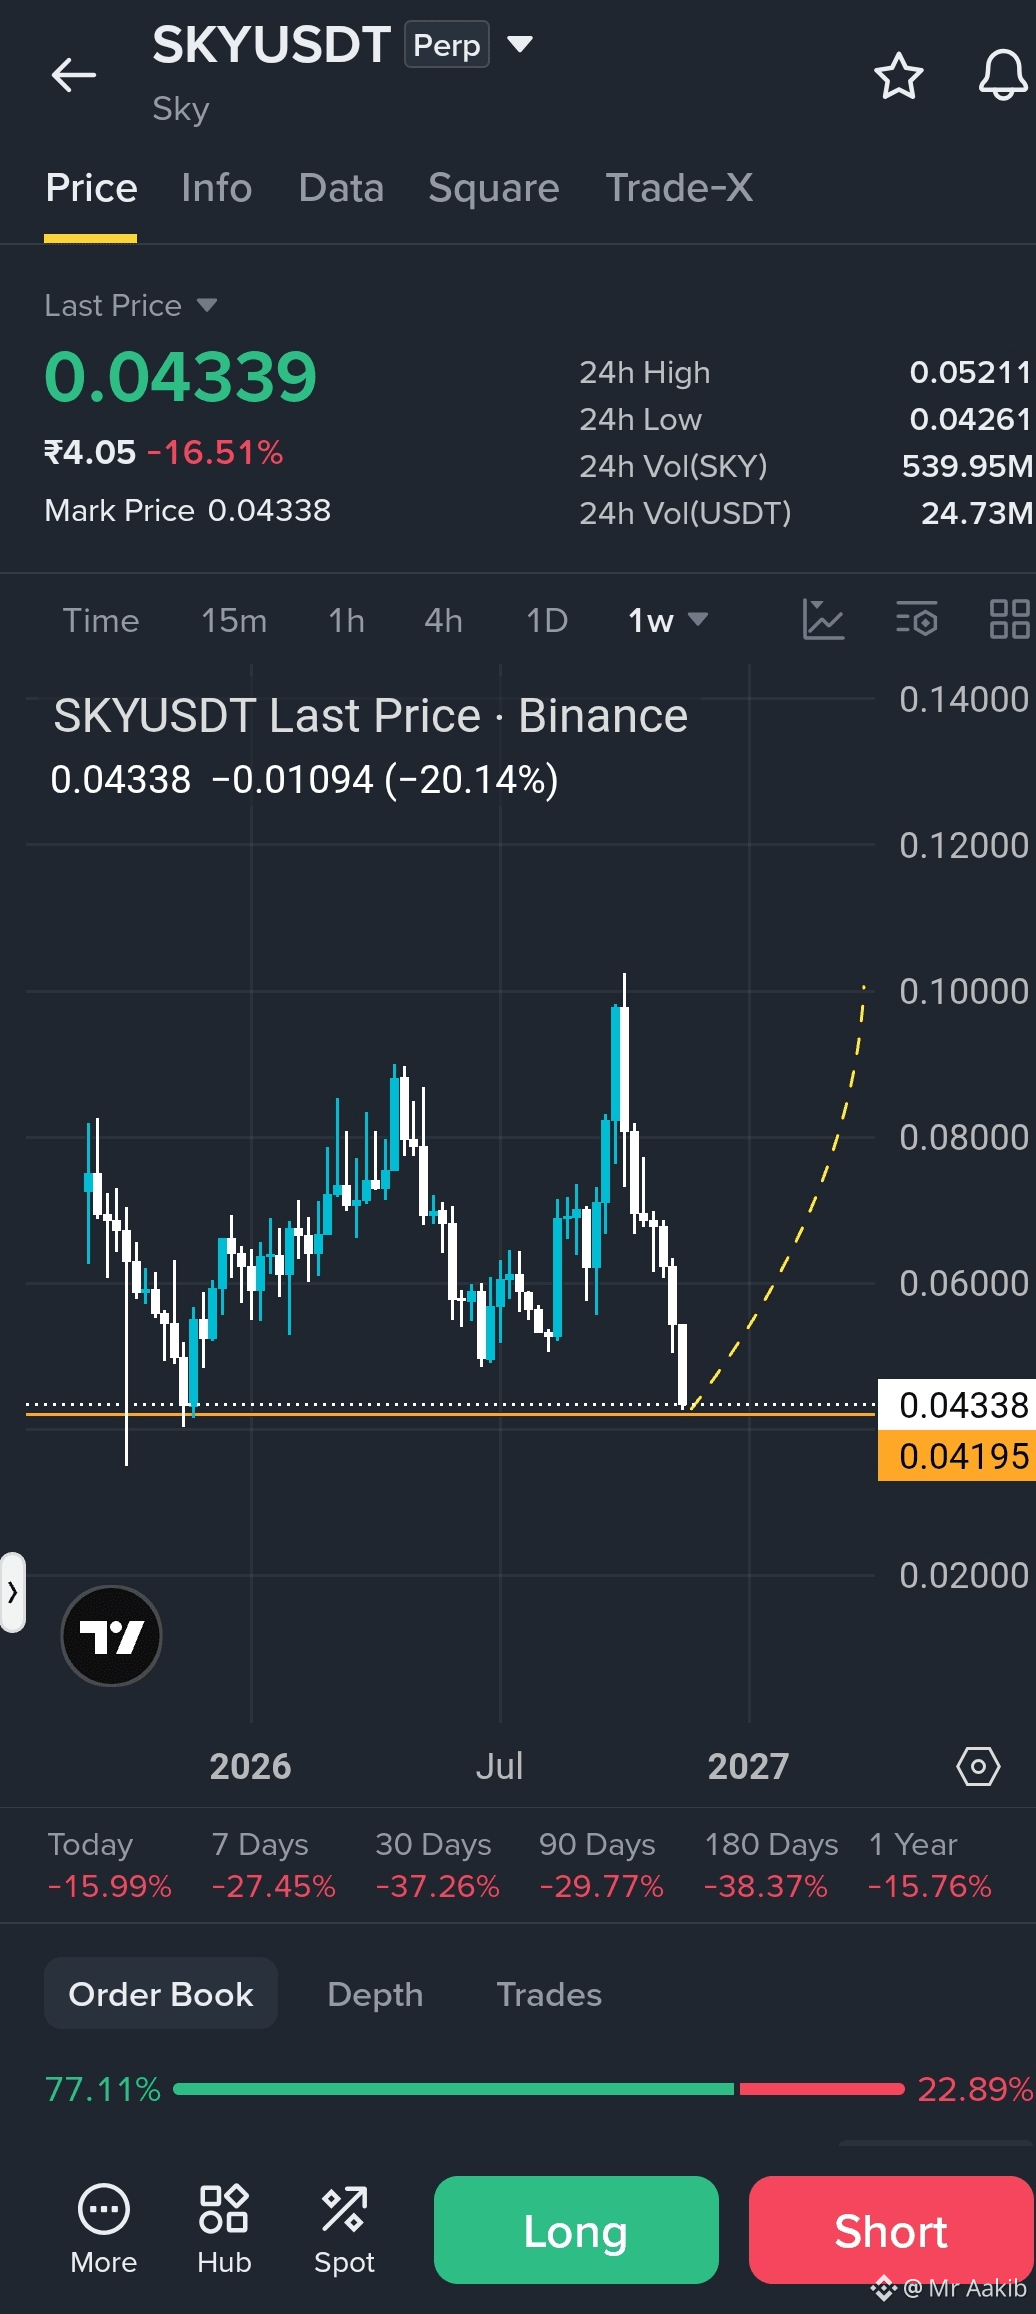
defend this critical $0.04195 macro support floor for a reversal, or will the breakdown continue? 📉
$SKY (Sky) on the 1-week chart is trading down at $0.04339 (-15.99% today, -27.45% over 7 days), pulling back sharply to retest major multi-month horizontal support around $0.04195.
With 24h volume printing 539.95M SKY ($24.73M USDT) and order book depth showing heavy buyer accumulation at 77.11% Bids vs 22.89% Asks, will bulls hold this structural floor to ignite the projected recovery curve toward $0.1000, or will sellers break the support zone?
Drop your prediction below! 👇
#SKY #BinanceSquare #CryptoUpdate #TechnicalAnalysis #Accumulation
Will $SKY
defend this critical $0.04195 macro support floor for a reversal, or will the breakdown continue? 📉
$SKY (Sky) on the 1-week chart is trading down at $0.04339 (-15.99% today, -27.45% over 7 days), pulling back sharply to retest major multi-month horizontal support around $0.04195.
With 24h volume printing 539.95M SKY ($24.73M USDT) and order book depth showing heavy buyer accumulation at 77.11% Bids vs 22.89% Asks, will bulls hold this structural floor to ignite the projected recovery curve toward $0.1000, or will sellers break the support zone?
Drop your prediction below! 👇
#SKY #BinanceSquare #CryptoUpdate #TechnicalAnalysis #Accumulation
defend this critical $0.04195 macro support floor for a reversal, or will the breakdown continue? 📉
$SKY (Sky) on the 1-week chart is trading down at $0.04339 (-15.99% today, -27.45% over 7 days), pulling back sharply to retest major multi-month horizontal support around $0.04195.
With 24h volume printing 539.95M SKY ($24.73M USDT) and order book depth showing heavy buyer accumulation at 77.11% Bids vs 22.89% Asks, will bulls hold this structural floor to ignite the projected recovery curve toward $0.1000, or will sellers break the support zone?
Drop your prediction below! 👇
#SKY #BinanceSquare #CryptoUpdate #TechnicalAnalysis #Accumulation
1
296
·
--
Bullish
🚨 **3 COINS, 3 SETUPS — WHICH ONE WILL MOVE NEXT?** 👀📊
The latest charts reveal mixed momentum, but some important trading levels are coming into focus!
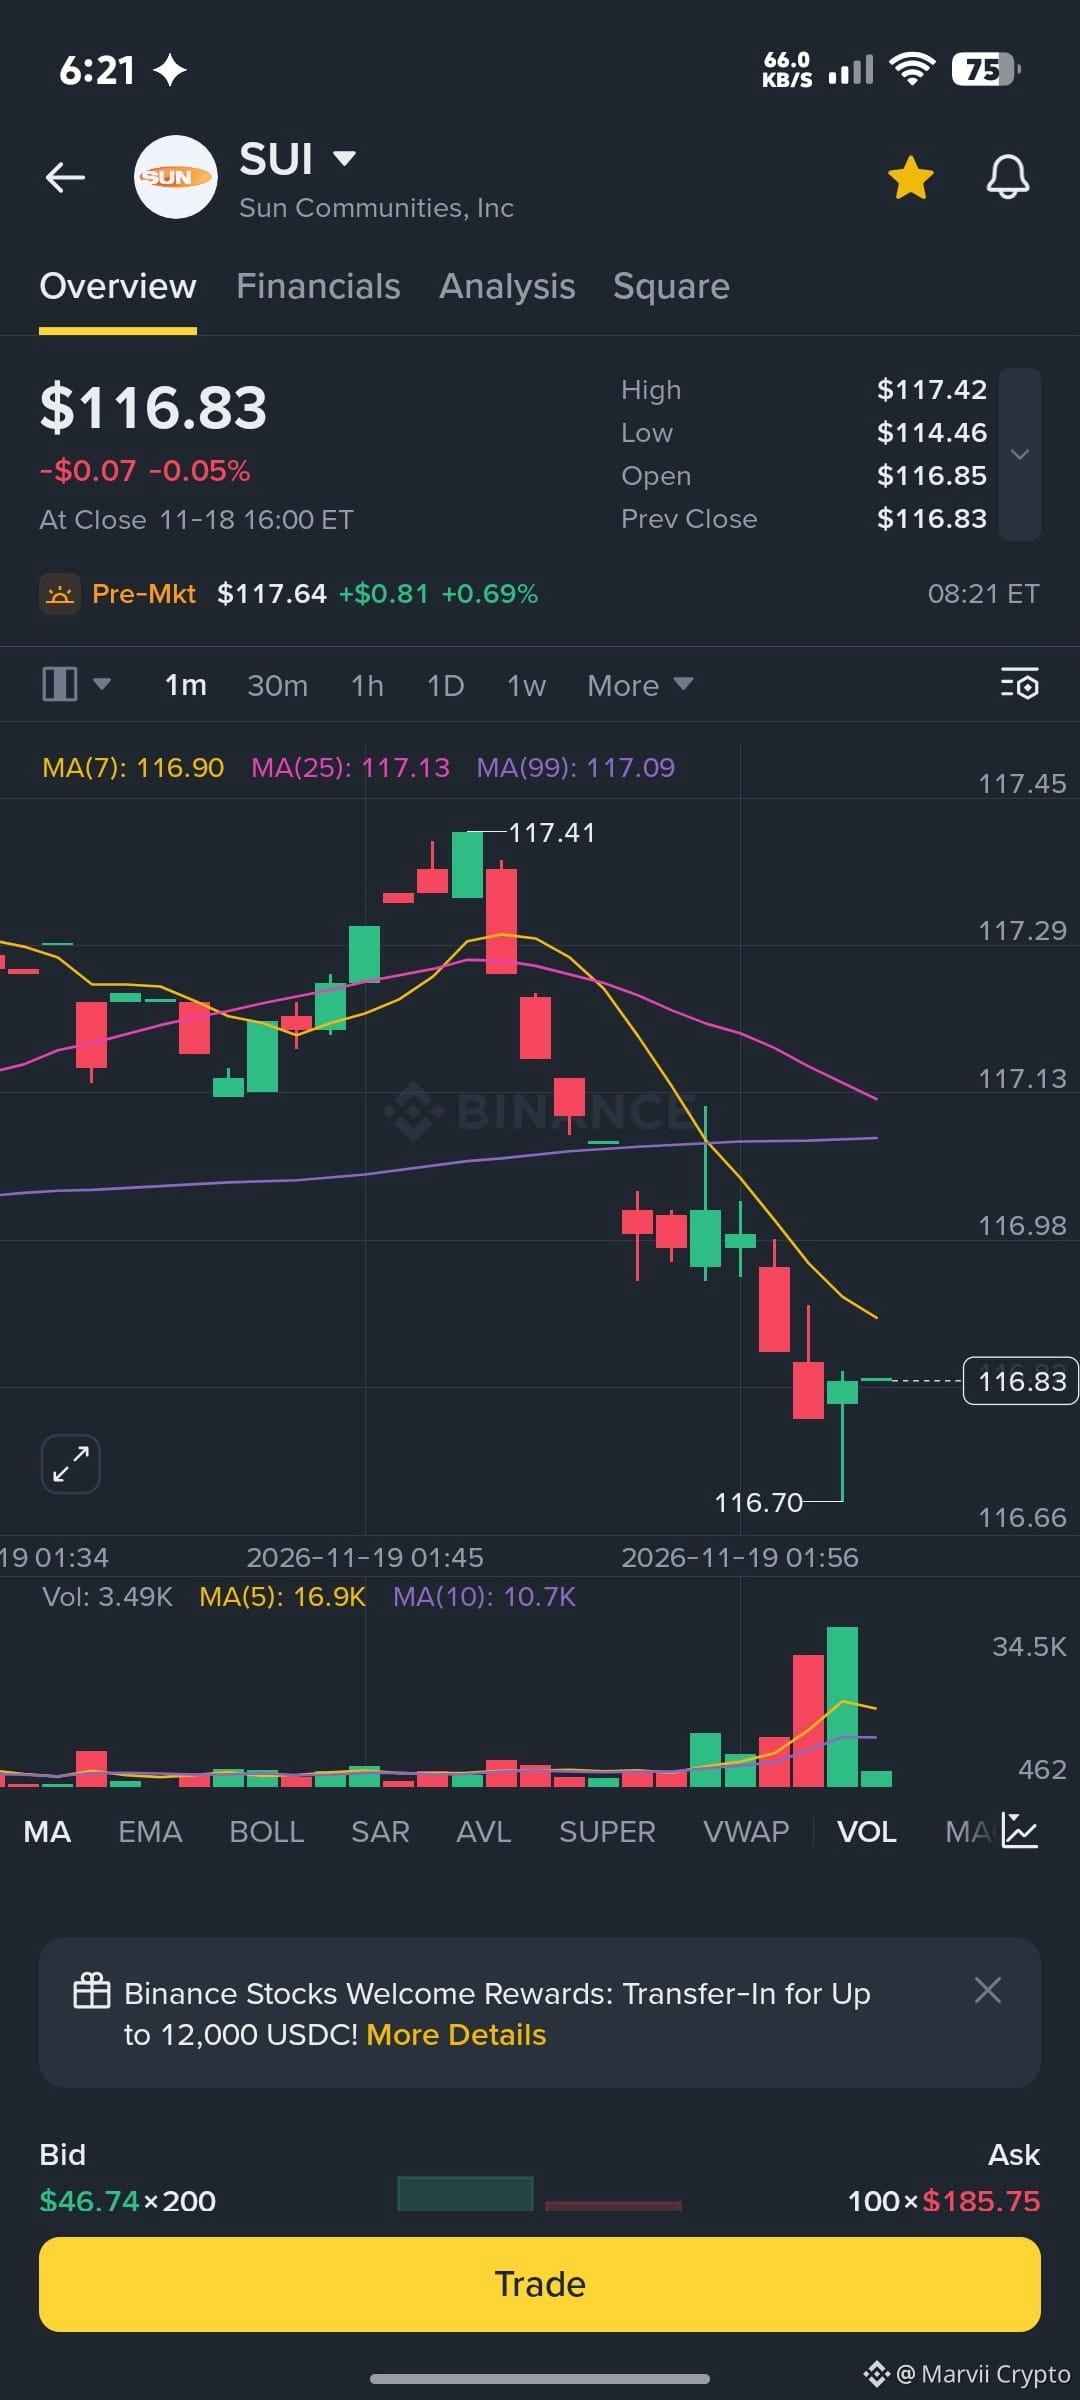
🟢 **$SUI
{spot}(SUIUSDT)
** — Recovery needs confirmation above $117.13.
- Entry: $117.00–117.13
- TP: $117.30 / $117.41
- SL: $116.65
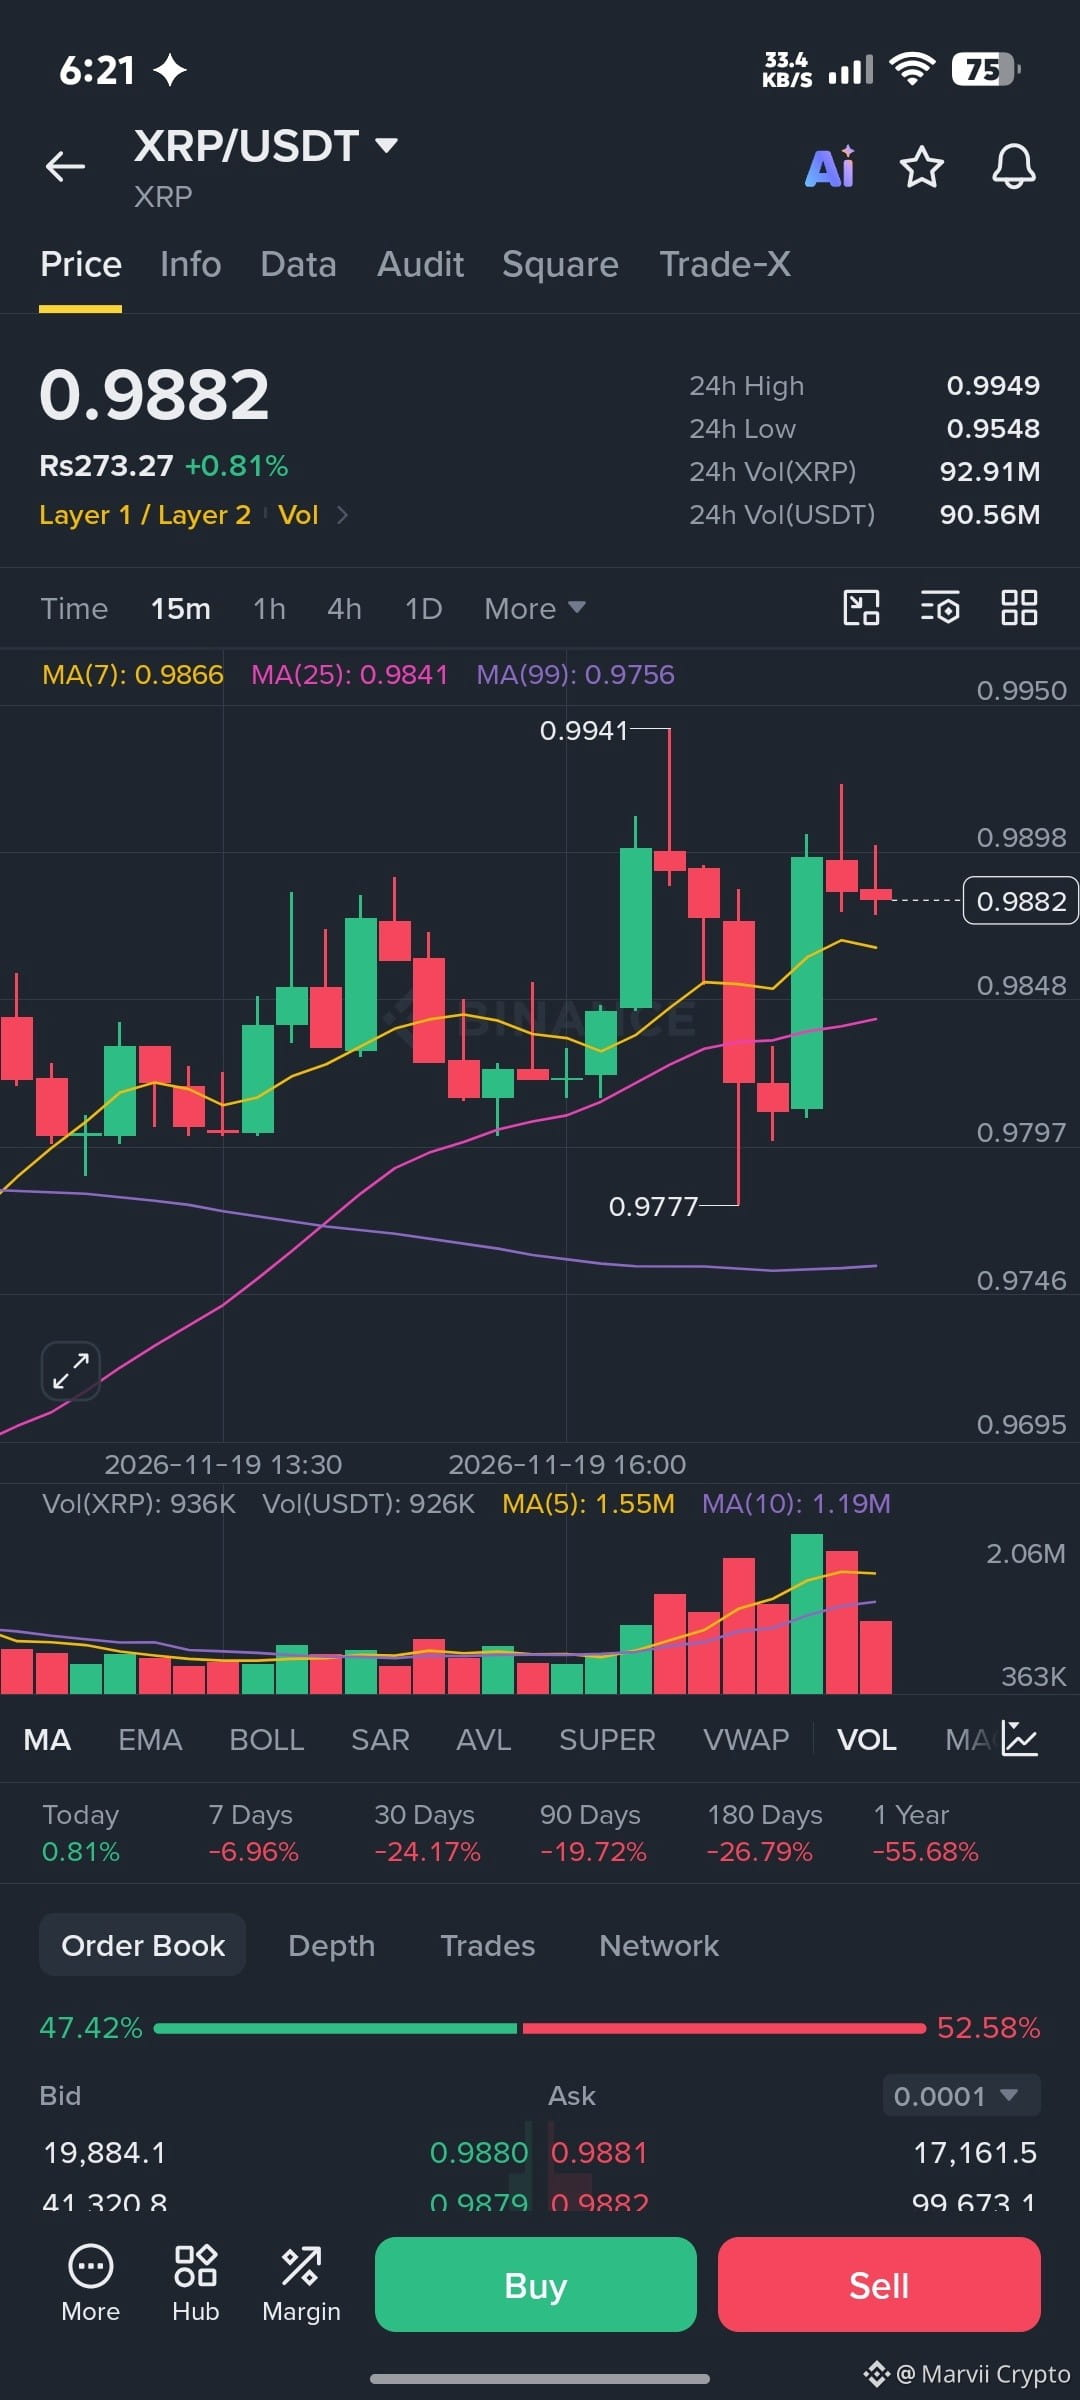
🔥 **$XRP
{spot}(XRPUSDT)
** — Showing stronger short-term momentum.
- Entry: $0.9850–0.9870
- TP: $0.9920 / $0.9940
- SL: $0.9810
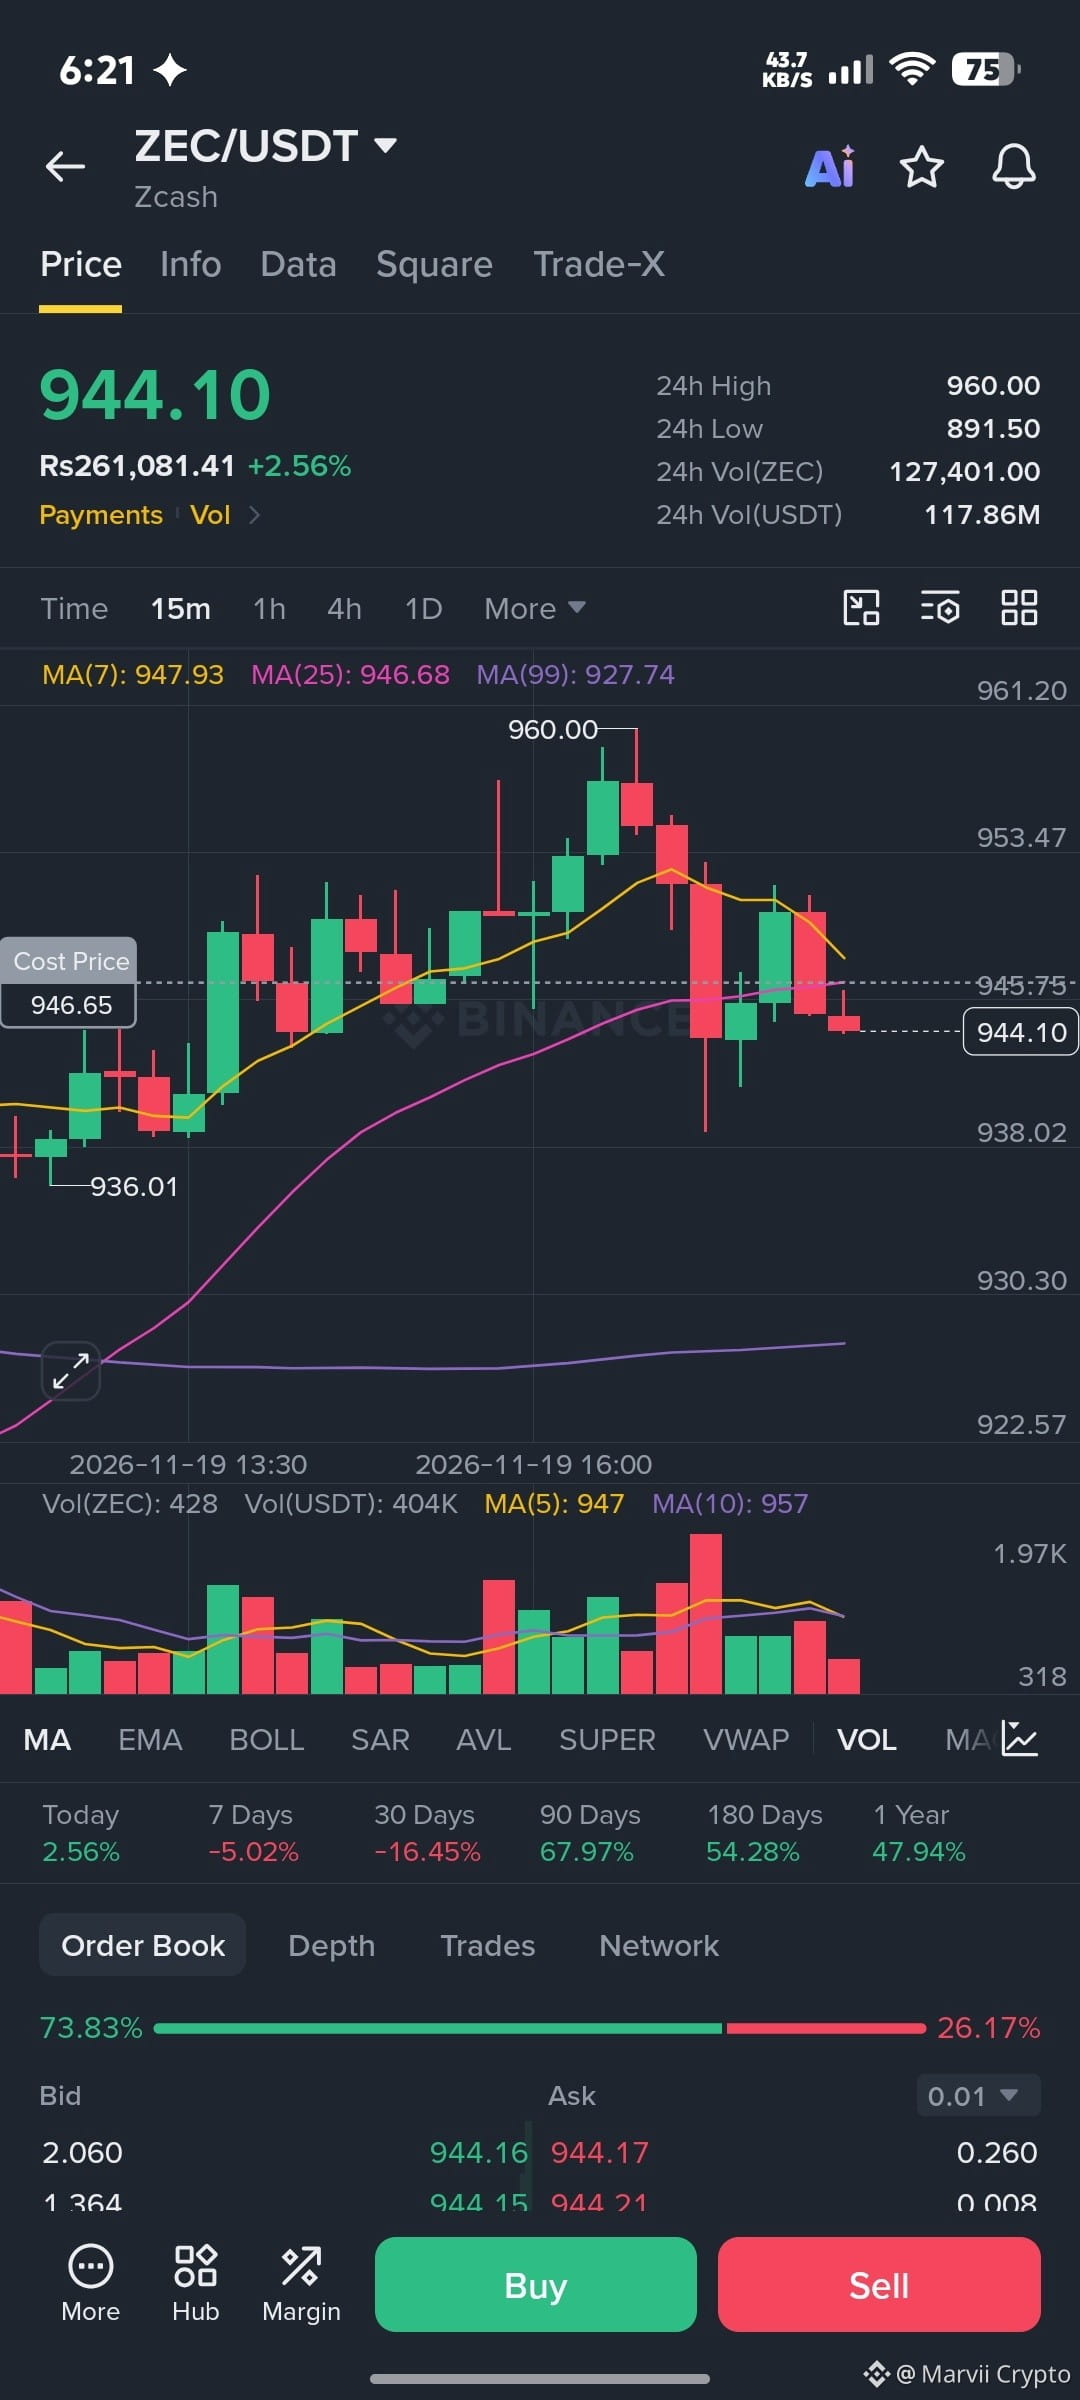
🔴 **$ZEC
{spot}(ZECUSDT)
** — Facing resistance near $948.
- Entry: $946–948 (short on rejection)
- TP: $940 / $936
- SL: $952
**My View:** XRP has the strongest short-term structure, while SUI and ZEC need clear confirmation before their next move.
💬 *Which coin would you trade right now — SUI, XRP or ZEC? Drop your pick below!👇🏻
#CanGTA6'sLaunchLiftTTWOShares? #BinanceSquare #TechnicalAnalysis #DYOR
🚨 **3 COINS, 3 SETUPS — WHICH ONE WILL MOVE NEXT?** 👀📊
The latest charts reveal mixed momentum, but some important trading levels are coming into focus!
🟢 **$SUI
** — Recovery needs confirmation above $117.13.
- Entry: $117.00–117.13
- TP: $117.30 / $117.41
- SL: $116.65
🔥 **$XRP
** — Showing stronger short-term momentum.
- Entry: $0.9850–0.9870
- TP: $0.9920 / $0.9940
- SL: $0.9810
🔴 **$ZEC
** — Facing resistance near $948.
- Entry: $946–948 (short on rejection)
- TP: $940 / $936
- SL: $952
**My View:** XRP has the strongest short-term structure, while SUI and ZEC need clear confirmation before their next move.
💬 *Which coin would you trade right now — SUI, XRP or ZEC? Drop your pick below!👇🏻
#CanGTA6'sLaunchLiftTTWOShares? #BinanceSquare #TechnicalAnalysis #DYOR
The latest charts reveal mixed momentum, but some important trading levels are coming into focus!
🟢 **$SUI
** — Recovery needs confirmation above $117.13.
- Entry: $117.00–117.13
- TP: $117.30 / $117.41
- SL: $116.65
🔥 **$XRP
** — Showing stronger short-term momentum.
- Entry: $0.9850–0.9870
- TP: $0.9920 / $0.9940
- SL: $0.9810
🔴 **$ZEC
** — Facing resistance near $948.
- Entry: $946–948 (short on rejection)
- TP: $940 / $936
- SL: $952
**My View:** XRP has the strongest short-term structure, while SUI and ZEC need clear confirmation before their next move.
💬 *Which coin would you trade right now — SUI, XRP or ZEC? Drop your pick below!👇🏻
#CanGTA6'sLaunchLiftTTWOShares? #BinanceSquare #TechnicalAnalysis #DYOR
BongTraderX:
Hey 👋 miss which one buy
2
3
328

·
--
Bullish
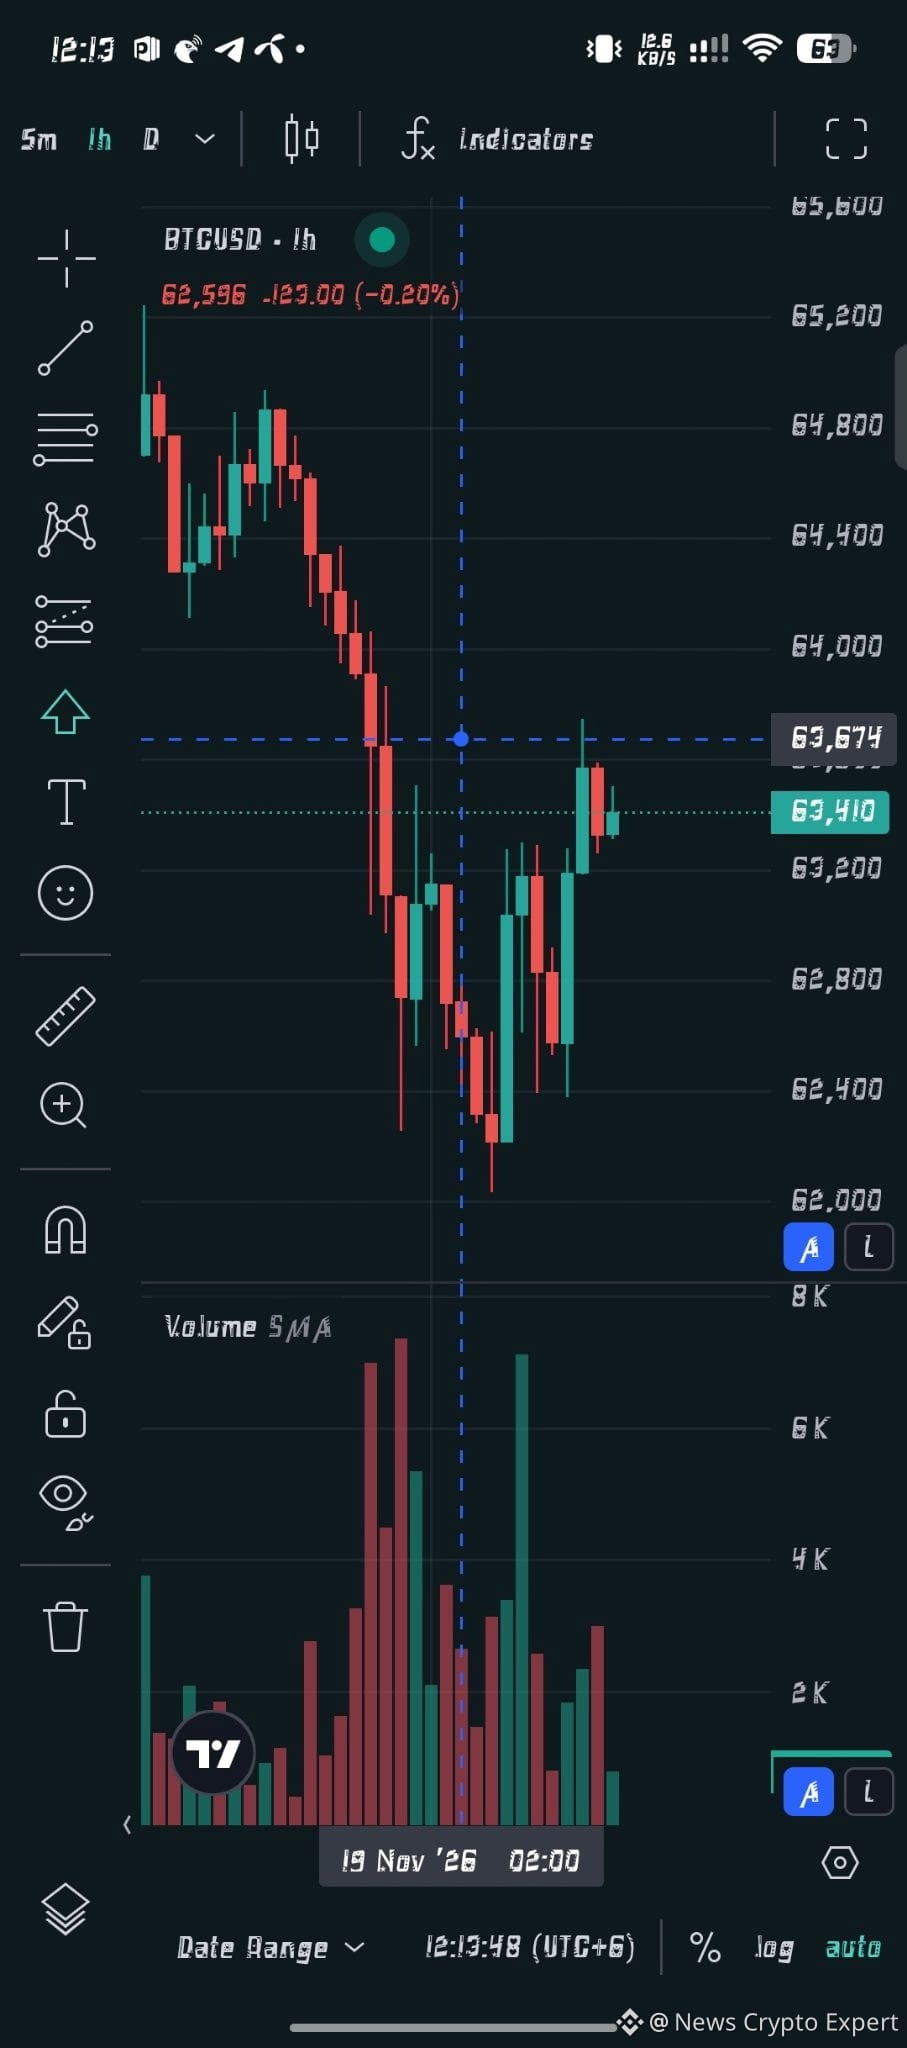
BTC/USD 1-Hour Market Update: Bulls Defend $62.2K Support After Sharp Pullback
Bitcoin ($BTC) experienced heightened intraday volatility on the 1-hour timeframe, staging a notable recovery after a steep sell-off tested key lower support zones.
Price Action Breakdown
Following a rejection near the $65,000 psychological level, BTC/USD faced sustained selling pressure across consecutive hourly candles. The downward move accelerated on rising sell volume, driving price down to a local swing low in the $62,200 – $62,300 region.
At those lows, strong buying interest stepped in—confirmed by a spike in green volume bars—triggering a rebound back above $63,200. Price is currently hovering around the $63,400 mark as traders assess whether bulls can reclaim higher ground or if sellers will defend overhead resistance.
Key Technical Levels to Watch
• Immediate Resistance ($63,400 – $63,700): The current recovery is testing a short-term reaction zone. A clean 1-hour candle close above $63,700 could open the door for a push toward $64,400 and eventually a retest of $65,000.
• Immediate Support ($62,200 – $62,400): Buyers successfully defended this area on the recent dip. Holding above this floor keeps the short-term recovery structure intact.
• Major Psychological Support ($62,000): If selling pressure resumes and breaks below $62,200, $62,000 remains the critical line in the sand for intraday bulls.
Market Outlook
While the broader hourly structure shows lower highs from the $65,000 peak, the high-volume bounce off $62,200 suggests active demand at discounted levels. Traders should watch for volume confirmation on a breakout above $63,700 or a breakdown below $62,200 before committing to directional setups.
Disclaimer: This analysis is for informational purposes only and does not constitute financial advice. Always conduct your own research (DYOR) and manage risk appropriately.
#Bitcoin #BTC #cryptotrading #TechnicalAnalysis #BinanceSquare
BTC/USD 1-Hour Market Update: Bulls Defend $62.2K Support After Sharp Pullback
Bitcoin ($BTC) experienced heightened intraday volatility on the 1-hour timeframe, staging a notable recovery after a steep sell-off tested key lower support zones.
Price Action Breakdown
Following a rejection near the $65,000 psychological level, BTC/USD faced sustained selling pressure across consecutive hourly candles. The downward move accelerated on rising sell volume, driving price down to a local swing low in the $62,200 – $62,300 region.
At those lows, strong buying interest stepped in—confirmed by a spike in green volume bars—triggering a rebound back above $63,200. Price is currently hovering around the $63,400 mark as traders assess whether bulls can reclaim higher ground or if sellers will defend overhead resistance.
Key Technical Levels to Watch
• Immediate Resistance ($63,400 – $63,700): The current recovery is testing a short-term reaction zone. A clean 1-hour candle close above $63,700 could open the door for a push toward $64,400 and eventually a retest of $65,000.
• Immediate Support ($62,200 – $62,400): Buyers successfully defended this area on the recent dip. Holding above this floor keeps the short-term recovery structure intact.
• Major Psychological Support ($62,000): If selling pressure resumes and breaks below $62,200, $62,000 remains the critical line in the sand for intraday bulls.
Market Outlook
While the broader hourly structure shows lower highs from the $65,000 peak, the high-volume bounce off $62,200 suggests active demand at discounted levels. Traders should watch for volume confirmation on a breakout above $63,700 or a breakdown below $62,200 before committing to directional setups.
Disclaimer: This analysis is for informational purposes only and does not constitute financial advice. Always conduct your own research (DYOR) and manage risk appropriately.
#Bitcoin #BTC #cryptotrading #TechnicalAnalysis #BinanceSquare
Bitcoin ($BTC) experienced heightened intraday volatility on the 1-hour timeframe, staging a notable recovery after a steep sell-off tested key lower support zones.
Price Action Breakdown
Following a rejection near the $65,000 psychological level, BTC/USD faced sustained selling pressure across consecutive hourly candles. The downward move accelerated on rising sell volume, driving price down to a local swing low in the $62,200 – $62,300 region.
At those lows, strong buying interest stepped in—confirmed by a spike in green volume bars—triggering a rebound back above $63,200. Price is currently hovering around the $63,400 mark as traders assess whether bulls can reclaim higher ground or if sellers will defend overhead resistance.
Key Technical Levels to Watch
• Immediate Resistance ($63,400 – $63,700): The current recovery is testing a short-term reaction zone. A clean 1-hour candle close above $63,700 could open the door for a push toward $64,400 and eventually a retest of $65,000.
• Immediate Support ($62,200 – $62,400): Buyers successfully defended this area on the recent dip. Holding above this floor keeps the short-term recovery structure intact.
• Major Psychological Support ($62,000): If selling pressure resumes and breaks below $62,200, $62,000 remains the critical line in the sand for intraday bulls.
Market Outlook
While the broader hourly structure shows lower highs from the $65,000 peak, the high-volume bounce off $62,200 suggests active demand at discounted levels. Traders should watch for volume confirmation on a breakout above $63,700 or a breakdown below $62,200 before committing to directional setups.
Disclaimer: This analysis is for informational purposes only and does not constitute financial advice. Always conduct your own research (DYOR) and manage risk appropriately.
#Bitcoin #BTC #cryptotrading #TechnicalAnalysis #BinanceSquare
108

·
--
Bullish
$SENT
{spot}(SENTUSDT)
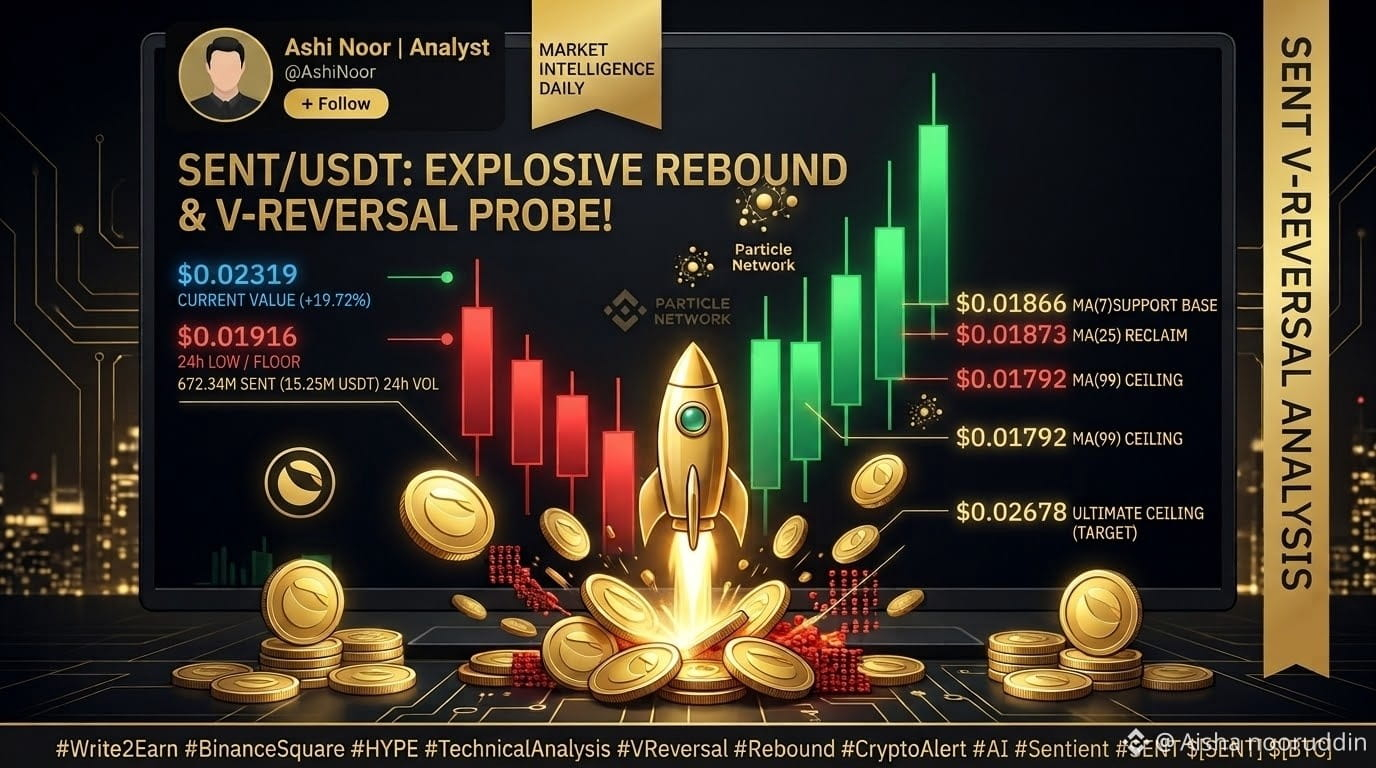
/USDT (Sentient) has caught a massive bullish wave, surging +19.72% to $0.02319! In a high-volume move, buyers successfully trigger a V-reversal from a multi-week local floor at $0.01538, fueled by a huge 672.34M SENT ($15.25M USDT) 24h trading volume spike.
📊 Key Levels (1D Chart):
Dynamic Resistance Breakout: $SENT has cleanly pierced and closed above all major daily moving averages: $0.01866 (MA7), $0.01873 (MA25), and $0.01792 (MA99), which now form a massive combined support cushion.
Immediate Resistance Target: $0.02678 (24h High).
Ultimate Local Floor: $0.01538.
💡 Outlook & Next Moves:
Hold above $0.01866 – $0.01873 (MA7/MA25) to confirm that this breakout has long-term sustainability. If buyers maintain control, they can drive the momentum toward $0.02678. However, look out for potential profit-taking and possible pullbacks—always manage risk tightly!
👇 Did you catch this major +19% $SENT breakout? Share your trading strategy below! 👇
📌 Follow @Ashi Noor | Analyst
#Write2Earn #BinanceSquare #SENT #SENTUSDT #Sentient #TechnicalAnalysis #CryptoBreakout $[SENT] $[BTC]
$SENT
/USDT (Sentient) has caught a massive bullish wave, surging +19.72% to $0.02319! In a high-volume move, buyers successfully trigger a V-reversal from a multi-week local floor at $0.01538, fueled by a huge 672.34M SENT ($15.25M USDT) 24h trading volume spike.
📊 Key Levels (1D Chart):
Dynamic Resistance Breakout: $SENT has cleanly pierced and closed above all major daily moving averages: $0.01866 (MA7), $0.01873 (MA25), and $0.01792 (MA99), which now form a massive combined support cushion.
Immediate Resistance Target: $0.02678 (24h High).
Ultimate Local Floor: $0.01538.
💡 Outlook & Next Moves:
Hold above $0.01866 – $0.01873 (MA7/MA25) to confirm that this breakout has long-term sustainability. If buyers maintain control, they can drive the momentum toward $0.02678. However, look out for potential profit-taking and possible pullbacks—always manage risk tightly!
👇 Did you catch this major +19% $SENT breakout? Share your trading strategy below! 👇
📌 Follow @Ashi Noor | Analyst
#Write2Earn #BinanceSquare #SENT #SENTUSDT #Sentient #TechnicalAnalysis #CryptoBreakout $[SENT] $[BTC]
/USDT (Sentient) has caught a massive bullish wave, surging +19.72% to $0.02319! In a high-volume move, buyers successfully trigger a V-reversal from a multi-week local floor at $0.01538, fueled by a huge 672.34M SENT ($15.25M USDT) 24h trading volume spike.
📊 Key Levels (1D Chart):
Dynamic Resistance Breakout: $SENT has cleanly pierced and closed above all major daily moving averages: $0.01866 (MA7), $0.01873 (MA25), and $0.01792 (MA99), which now form a massive combined support cushion.
Immediate Resistance Target: $0.02678 (24h High).
Ultimate Local Floor: $0.01538.
💡 Outlook & Next Moves:
Hold above $0.01866 – $0.01873 (MA7/MA25) to confirm that this breakout has long-term sustainability. If buyers maintain control, they can drive the momentum toward $0.02678. However, look out for potential profit-taking and possible pullbacks—always manage risk tightly!
👇 Did you catch this major +19% $SENT breakout? Share your trading strategy below! 👇
📌 Follow @Ashi Noor | Analyst
#Write2Earn #BinanceSquare #SENT #SENTUSDT #Sentient #TechnicalAnalysis #CryptoBreakout $[SENT] $[BTC]
106

·
--
Bullish
🚀 DEXE/USDT – HIGH PRICE SIGNAL | BULLISH MOMENTUM
DEXE is showing impressive short-term bullish momentum, with buyers currently taking the lead. The price is trading around $1.179, up approximately 1.46%.
📊 Key Market Highlights:
- Current Price: $1.179
- 24H High: $1.187
- 24H Low: $1.146
- Buyers' Order Book Share: 57.05%
- Key Resistance: $1.187
- Support Zone: $1.174 – $1.161
🔥 Potential Upside Targets:
If DEXE breaks above $1.187 with strong trading volume and holds the breakout, the next potential targets are:
🎯 Target 1: $1.195
🎯 Target 2: $1.205
Market Outlook:
The current technical structure suggests improving bullish strength. Buyers are showing interest, and a confirmed resistance breakout could create further upside opportunities.
However, traders should remain alert to possible rejection and short-term volatility.
💎 My Strategy: Patience, confirmation, and proper risk management are essential. Never chase a breakout without confirmation.
DEXE Could Be Preparing for Its Next Big Move! 🚀
#DEXE #DEXEUSDT #Binance #BullishMomentum #CryptoTrading #TechnicalAnalysis
$TAO $NEAR $DEXE
{future}(DEXEUSDT)
🚀 DEXE/USDT – HIGH PRICE SIGNAL | BULLISH MOMENTUM
DEXE is showing impressive short-term bullish momentum, with buyers currently taking the lead. The price is trading around $1.179, up approximately 1.46%.
📊 Key Market Highlights:
- Current Price: $1.179
- 24H High: $1.187
- 24H Low: $1.146
- Buyers' Order Book Share: 57.05%
- Key Resistance: $1.187
- Support Zone: $1.174 – $1.161
🔥 Potential Upside Targets:
If DEXE breaks above $1.187 with strong trading volume and holds the breakout, the next potential targets are:
🎯 Target 1: $1.195
🎯 Target 2: $1.205
Market Outlook:
The current technical structure suggests improving bullish strength. Buyers are showing interest, and a confirmed resistance breakout could create further upside opportunities.
However, traders should remain alert to possible rejection and short-term volatility.
💎 My Strategy: Patience, confirmation, and proper risk management are essential. Never chase a breakout without confirmation.
DEXE Could Be Preparing for Its Next Big Move! 🚀
#DEXE #DEXEUSDT #Binance #BullishMomentum #CryptoTrading #TechnicalAnalysis
$TAO $NEAR $DEXE
DEXE is showing impressive short-term bullish momentum, with buyers currently taking the lead. The price is trading around $1.179, up approximately 1.46%.
📊 Key Market Highlights:
- Current Price: $1.179
- 24H High: $1.187
- 24H Low: $1.146
- Buyers' Order Book Share: 57.05%
- Key Resistance: $1.187
- Support Zone: $1.174 – $1.161
🔥 Potential Upside Targets:
If DEXE breaks above $1.187 with strong trading volume and holds the breakout, the next potential targets are:
🎯 Target 1: $1.195
🎯 Target 2: $1.205
Market Outlook:
The current technical structure suggests improving bullish strength. Buyers are showing interest, and a confirmed resistance breakout could create further upside opportunities.
However, traders should remain alert to possible rejection and short-term volatility.
💎 My Strategy: Patience, confirmation, and proper risk management are essential. Never chase a breakout without confirmation.
DEXE Could Be Preparing for Its Next Big Move! 🚀
#DEXE #DEXEUSDT #Binance #BullishMomentum #CryptoTrading #TechnicalAnalysis
$TAO $NEAR $DEXE

1
414

·
--
$PUMP PRICE IS PRESSING THE UPPER RANGE 📈
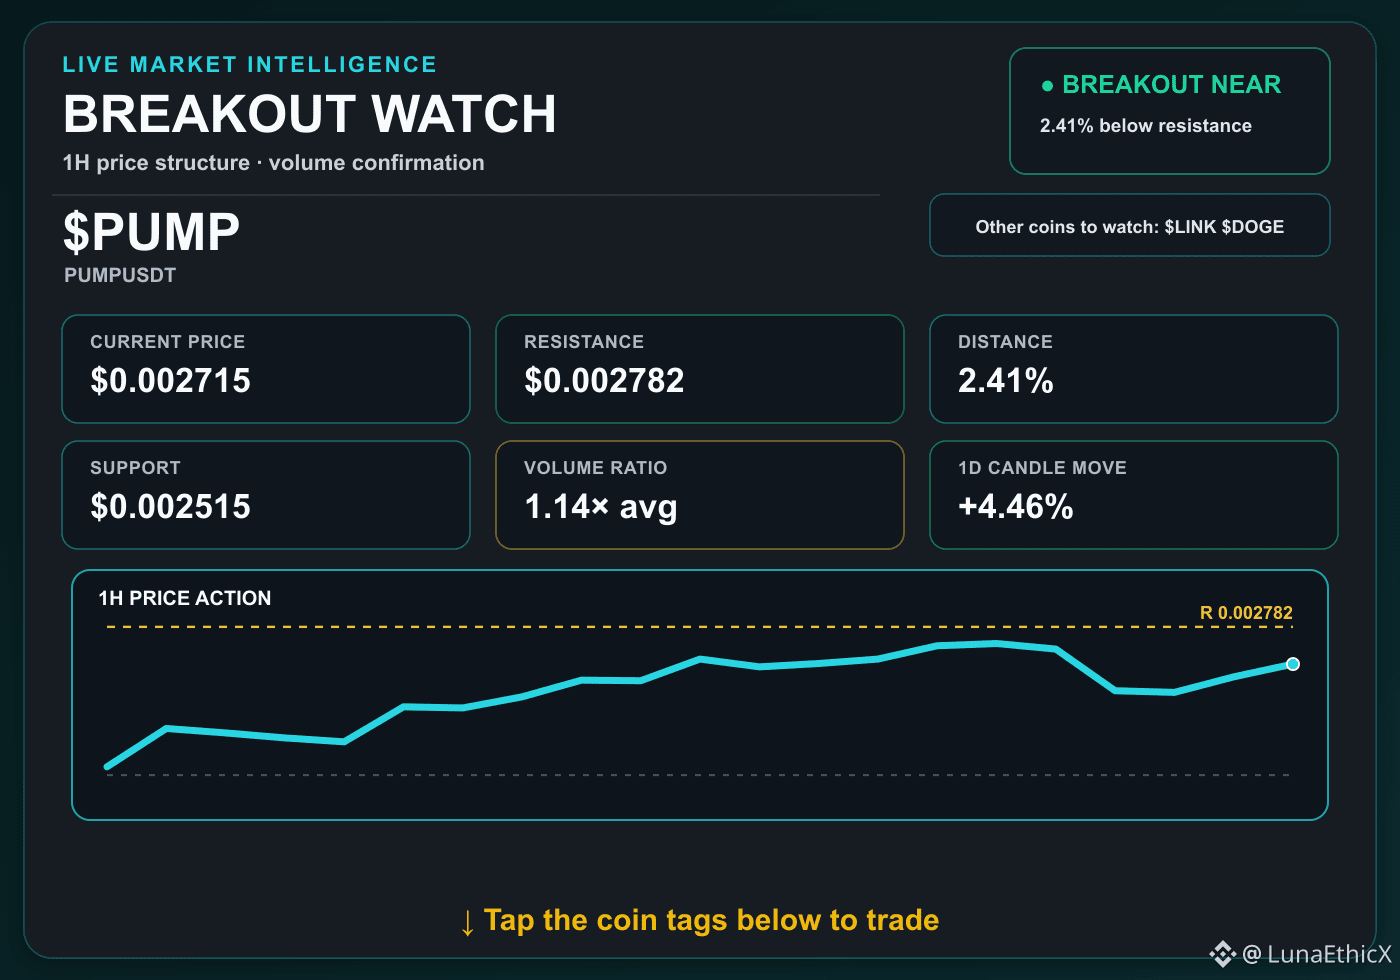
From 0.002715, the chart is 2.41% below the recent resistance at 0.002782. The current 1H candle shows 1.14× average volume. Does participation remain strong into the level test?
Two additional names I’m following: $LINK and $DOGE. 🔍
🔥 Want a closer look? Tap the tags below.
#TechnicalAnalysis #CryptoAnalysis #BinanceSquare
$PUMP $LINK $DOGE
$PUMP PRICE IS PRESSING THE UPPER RANGE 📈
From 0.002715, the chart is 2.41% below the recent resistance at 0.002782. The current 1H candle shows 1.14× average volume. Does participation remain strong into the level test?
Two additional names I’m following: $LINK and $DOGE . 🔍
🔥 Want a closer look? Tap the tags below.
#TechnicalAnalysis #CryptoAnalysis #BinanceSquare
$PUMP $LINK $DOGE
From 0.002715, the chart is 2.41% below the recent resistance at 0.002782. The current 1H candle shows 1.14× average volume. Does participation remain strong into the level test?
Two additional names I’m following: $LINK and $DOGE . 🔍
🔥 Want a closer look? Tap the tags below.
#TechnicalAnalysis #CryptoAnalysis #BinanceSquare
$PUMP $LINK $DOGE
2
·
--
$SOXSB 1D TECHNICAL SETUP TO WATCH 👀
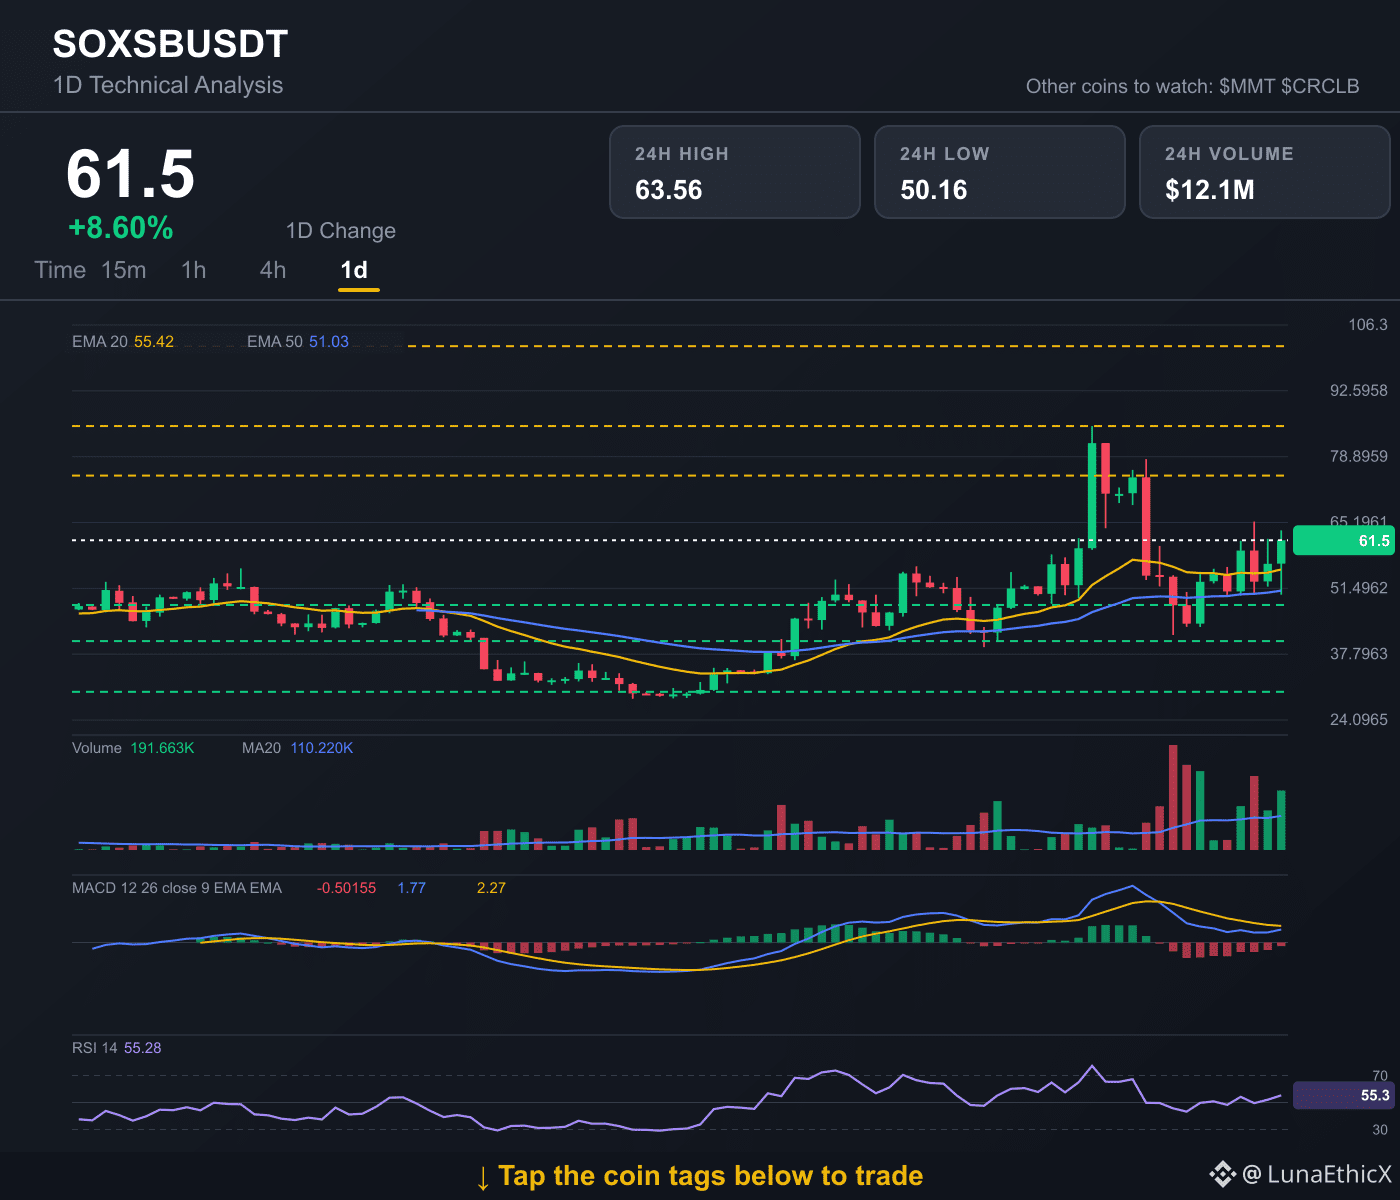
Price 61.5 continues to sit above EMA20 55.4175 and EMA50 51.0276, keeping the trend technically firm. Momentum is less decisive with RSI 55.28 and MACD 1.77338 near its 2.27493 signal. Upside levels worth tracking are 74.964, 85.26 and 101.8921. Downside cushions remain around 48.036, 40.5143 and 29.955.
Also tracking $MMT and $CRCLB without drawing conclusions yet. 📊
🔥 Click the coin tags below to check the live market and trade.
#TechnicalAnalysis #CryptoAnalysis #BinanceSquare
$SOXSB $MMT $CRCLB
$SOXSB 1D TECHNICAL SETUP TO WATCH 👀
Price 61.5 continues to sit above EMA20 55.4175 and EMA50 51.0276, keeping the trend technically firm. Momentum is less decisive with RSI 55.28 and MACD 1.77338 near its 2.27493 signal. Upside levels worth tracking are 74.964, 85.26 and 101.8921. Downside cushions remain around 48.036, 40.5143 and 29.955.
Also tracking $MMT and $CRCLB without drawing conclusions yet. 📊
🔥 Click the coin tags below to check the live market and trade.
#TechnicalAnalysis #CryptoAnalysis #BinanceSquare
$SOXSB $MMT $CRCLB
Price 61.5 continues to sit above EMA20 55.4175 and EMA50 51.0276, keeping the trend technically firm. Momentum is less decisive with RSI 55.28 and MACD 1.77338 near its 2.27493 signal. Upside levels worth tracking are 74.964, 85.26 and 101.8921. Downside cushions remain around 48.036, 40.5143 and 29.955.
Also tracking $MMT and $CRCLB without drawing conclusions yet. 📊
🔥 Click the coin tags below to check the live market and trade.
#TechnicalAnalysis #CryptoAnalysis #BinanceSquare
$SOXSB $MMT $CRCLB
11

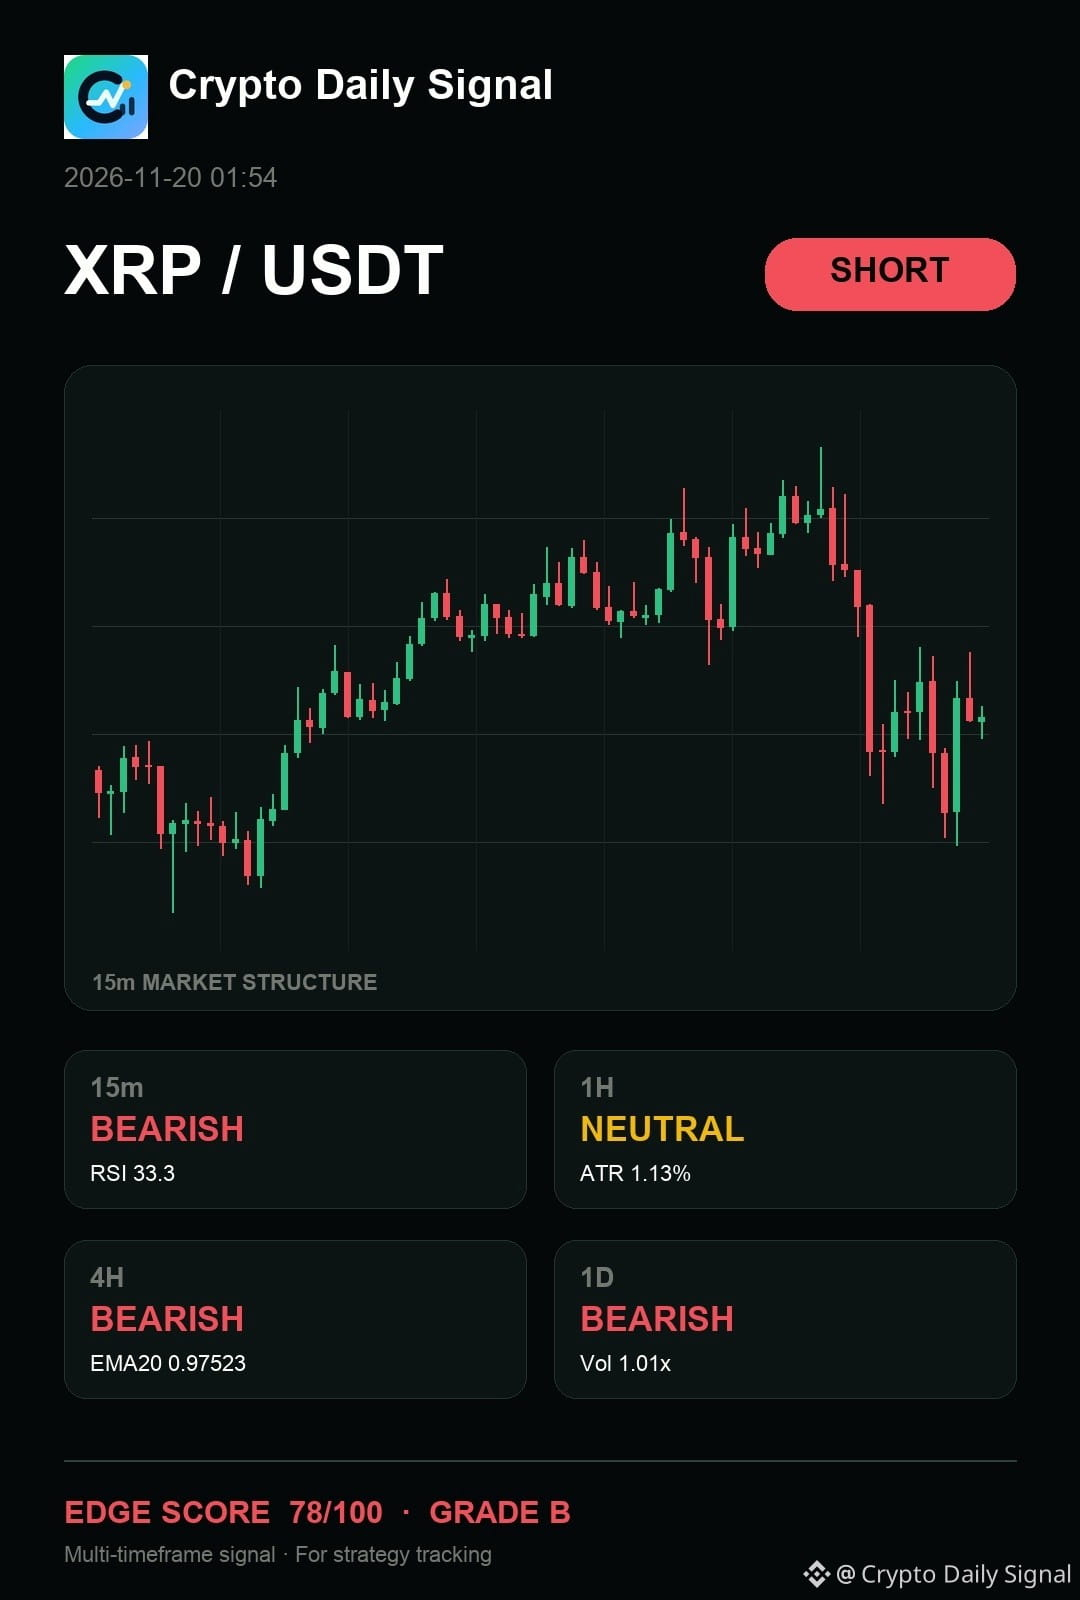
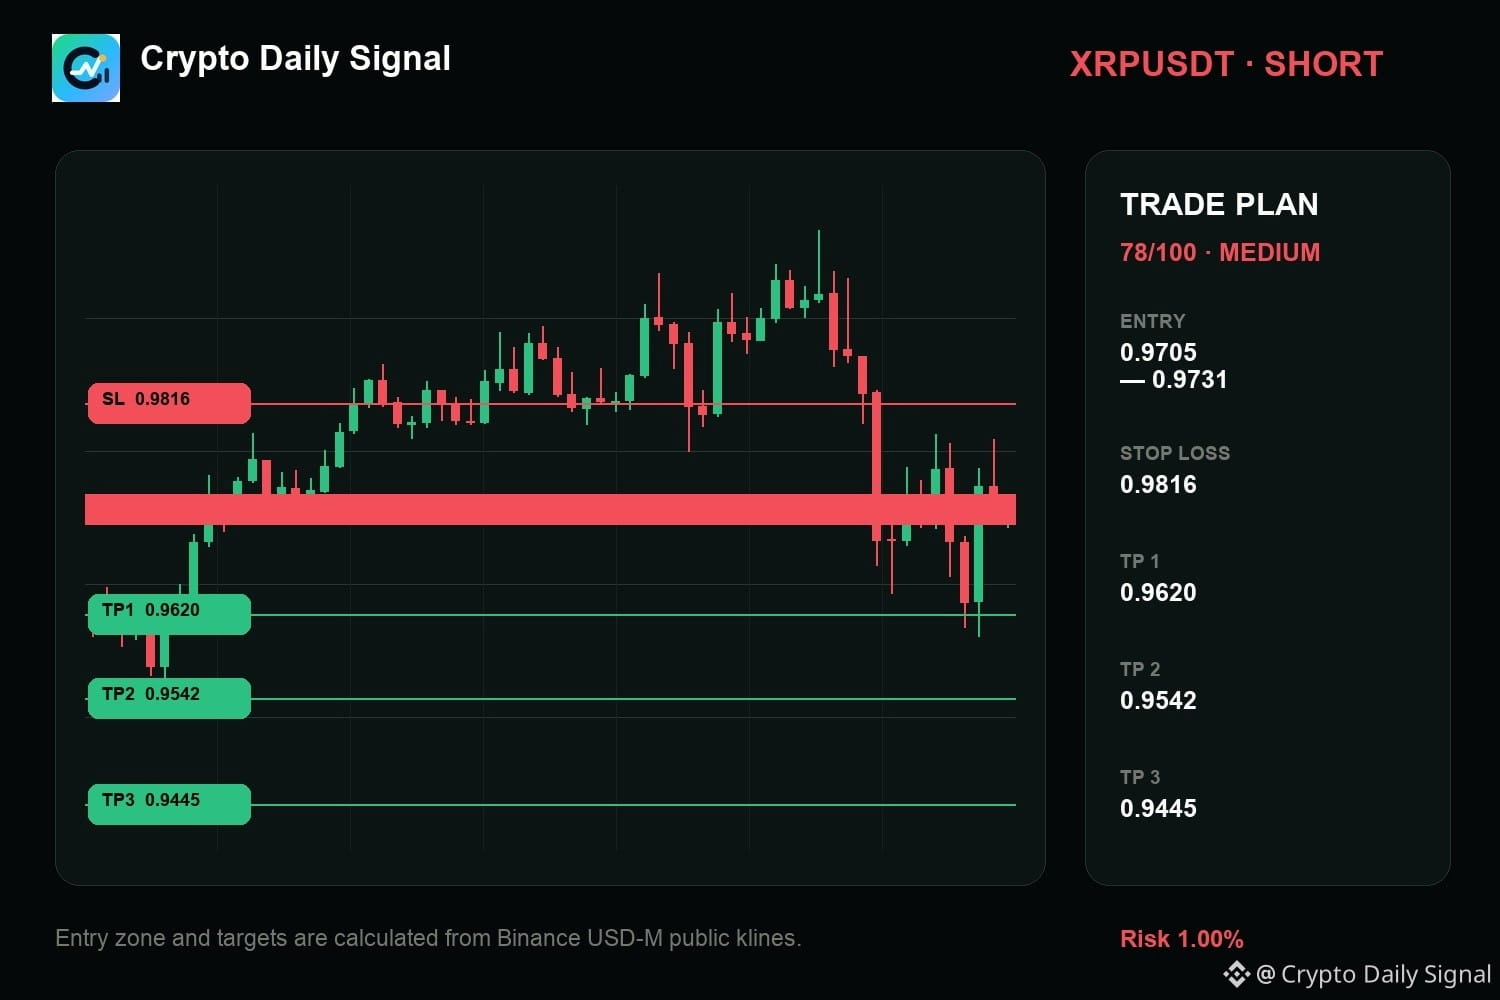
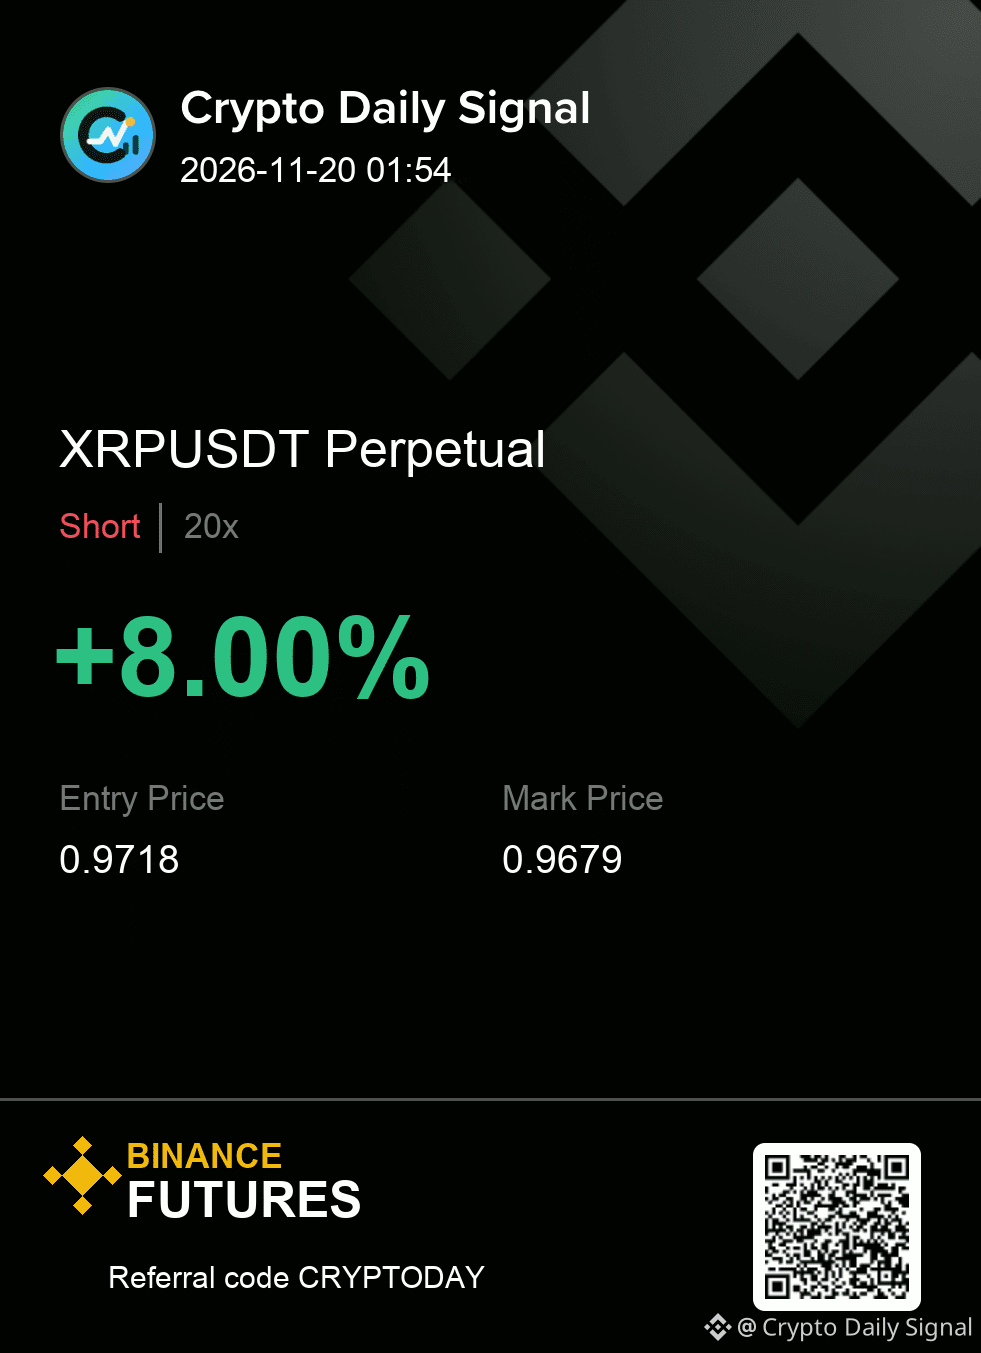
$XRP — right now, I would say it is a patience trade on the short side, even though the short-term price action is squeezed within a relatively tight trading band. The longer-term picture shows a bearish leaning across the daily and four-hour charts, which makes the recent rejection at the range top meaningful. What would make this idea stronger is a decisive close below the low of this current containment.
The levels matter more than the prediction. Size it accordingly.
Execution plan (XRPUSDT — SHORT)
Entry: 0.9705 - 0.9731 | SL: 0.9816
Take profit: 0.9620 → 0.9542 → 0.9445
#TechnicalAnalysis
{future}(XRPUSDT)
$XRP — right now, I would say it is a patience trade on the short side, even though the short-term price action is squeezed within a relatively tight trading band. The longer-term picture shows a bearish leaning across the daily and four-hour charts, which makes the recent rejection at the range top meaningful. What would make this idea stronger is a decisive close below the low of this current containment.
The levels matter more than the prediction. Size it accordingly.
Execution plan (XRPUSDT — SHORT)
Entry: 0.9705 - 0.9731 | SL: 0.9816
Take profit: 0.9620 → 0.9542 → 0.9445
#TechnicalAnalysis
The levels matter more than the prediction. Size it accordingly.
Execution plan (XRPUSDT — SHORT)
Entry: 0.9705 - 0.9731 | SL: 0.9816
Take profit: 0.9620 → 0.9542 → 0.9445
#TechnicalAnalysis
6

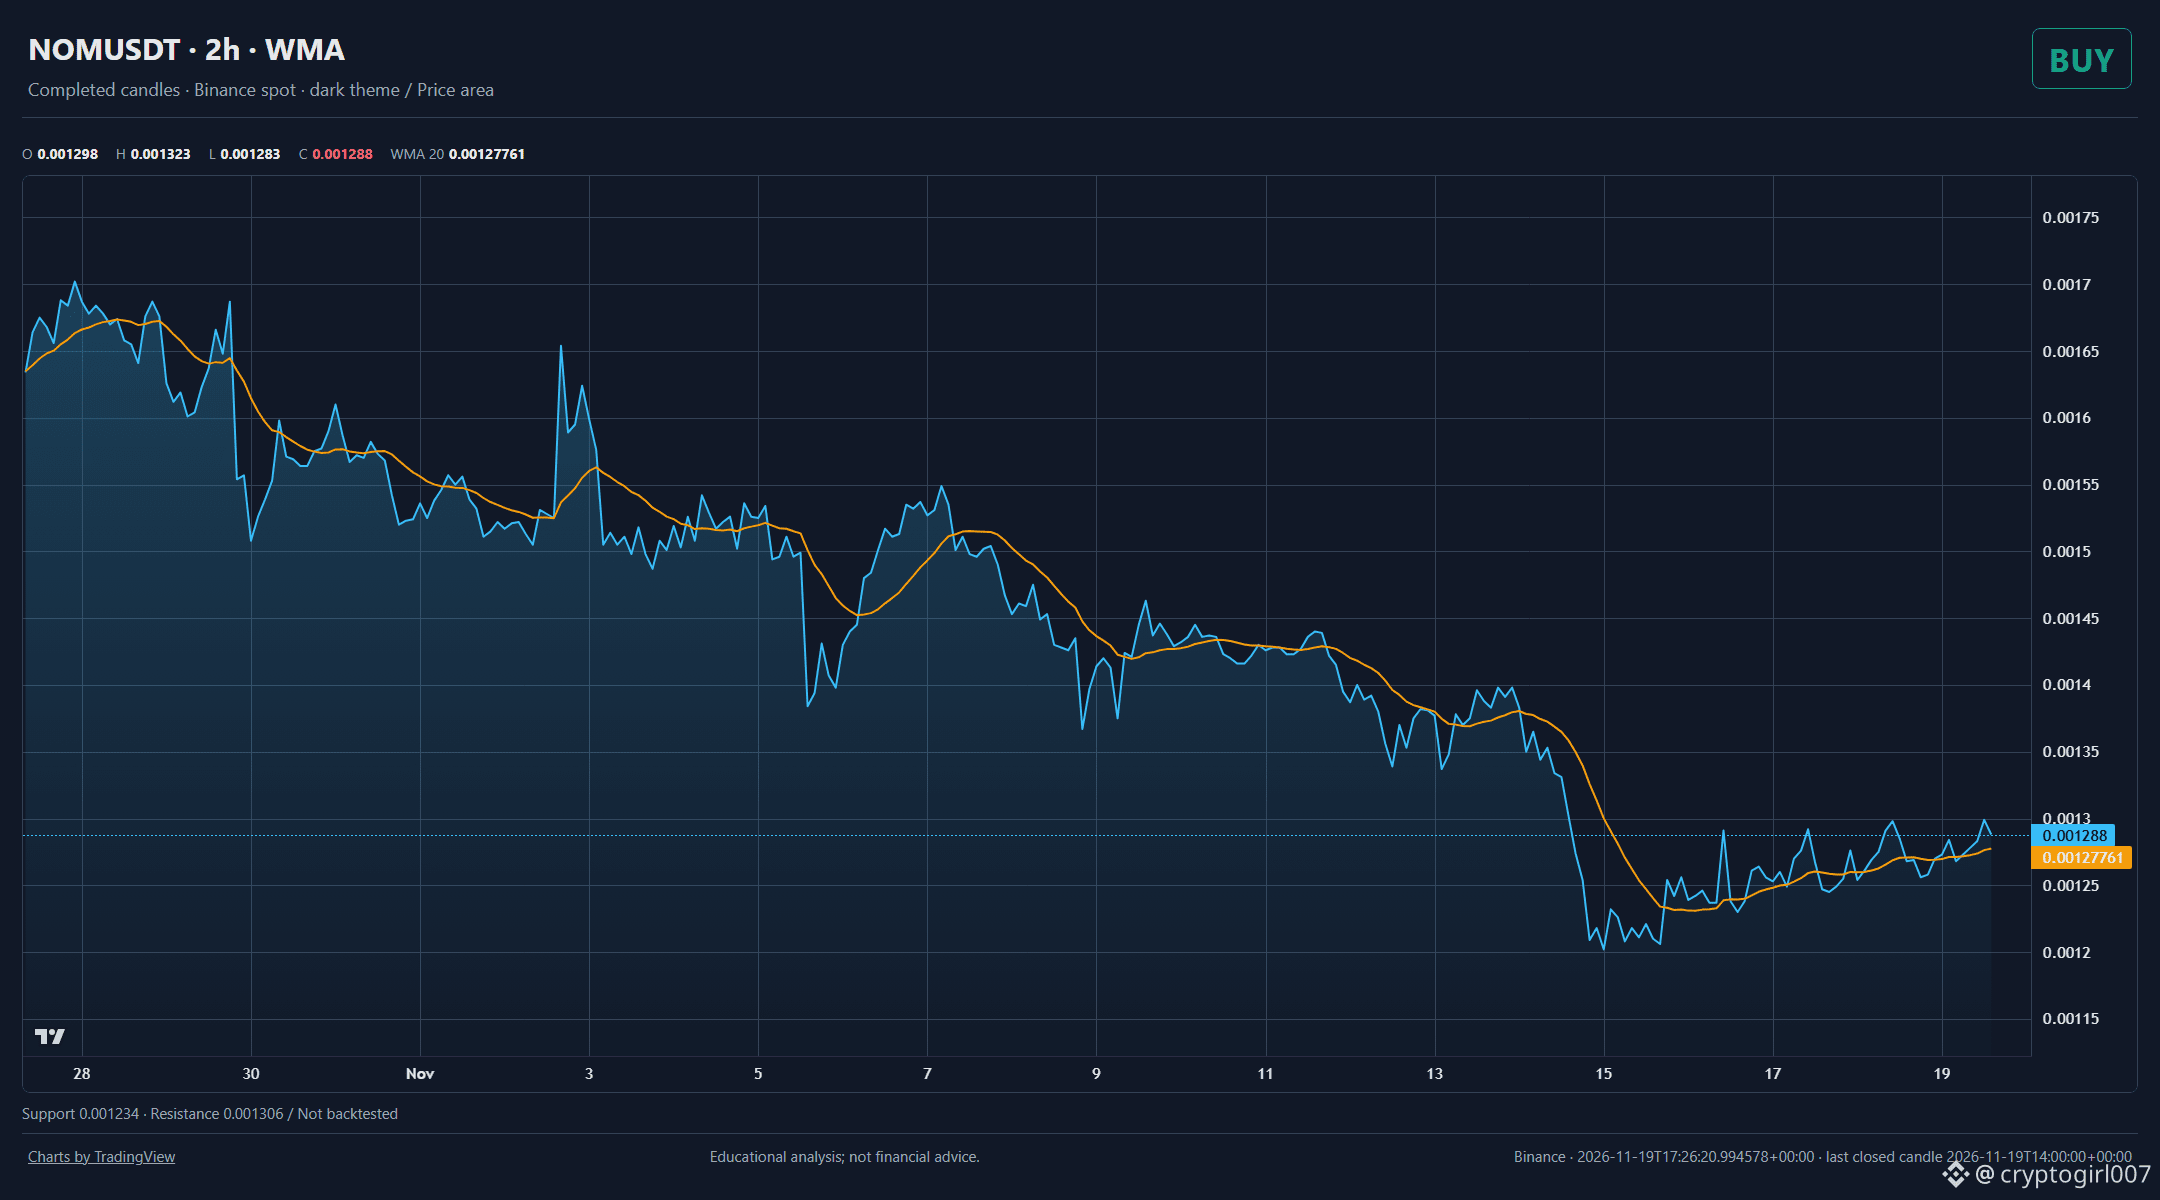
The weighted moving average aligns with the bullish bias, confirming that price structure respects this dynamic support level during recent consolidation.
$NOM is showing a bullish setup on the two-hour chart.
WMA supports the bullish reading. This supports the Buy signal. The last closed candle was around 0.001288 USDT. Support sits near 0.001234, with resistance around 0.001306.
Closed-candle analysis, not a live quote or trade instruction; not backtested.
#TechnicalAnalysis #DYOR
Educational analysis; not financial advice.
{spot}(NOMUSDT)
The weighted moving average aligns with the bullish bias, confirming that price structure respects this dynamic support level during recent consolidation.
$NOM is showing a bullish setup on the two-hour chart.
WMA supports the bullish reading. This supports the Buy signal. The last closed candle was around 0.001288 USDT. Support sits near 0.001234, with resistance around 0.001306.
Closed-candle analysis, not a live quote or trade instruction; not backtested.
#TechnicalAnalysis #DYOR
Educational analysis; not financial advice.
$NOM is showing a bullish setup on the two-hour chart.
WMA supports the bullish reading. This supports the Buy signal. The last closed candle was around 0.001288 USDT. Support sits near 0.001234, with resistance around 0.001306.
Closed-candle analysis, not a live quote or trade instruction; not backtested.
#TechnicalAnalysis #DYOR
Educational analysis; not financial advice.
2
·
--
$HYPE PRESSING TOWARD RESISTANCE 📈
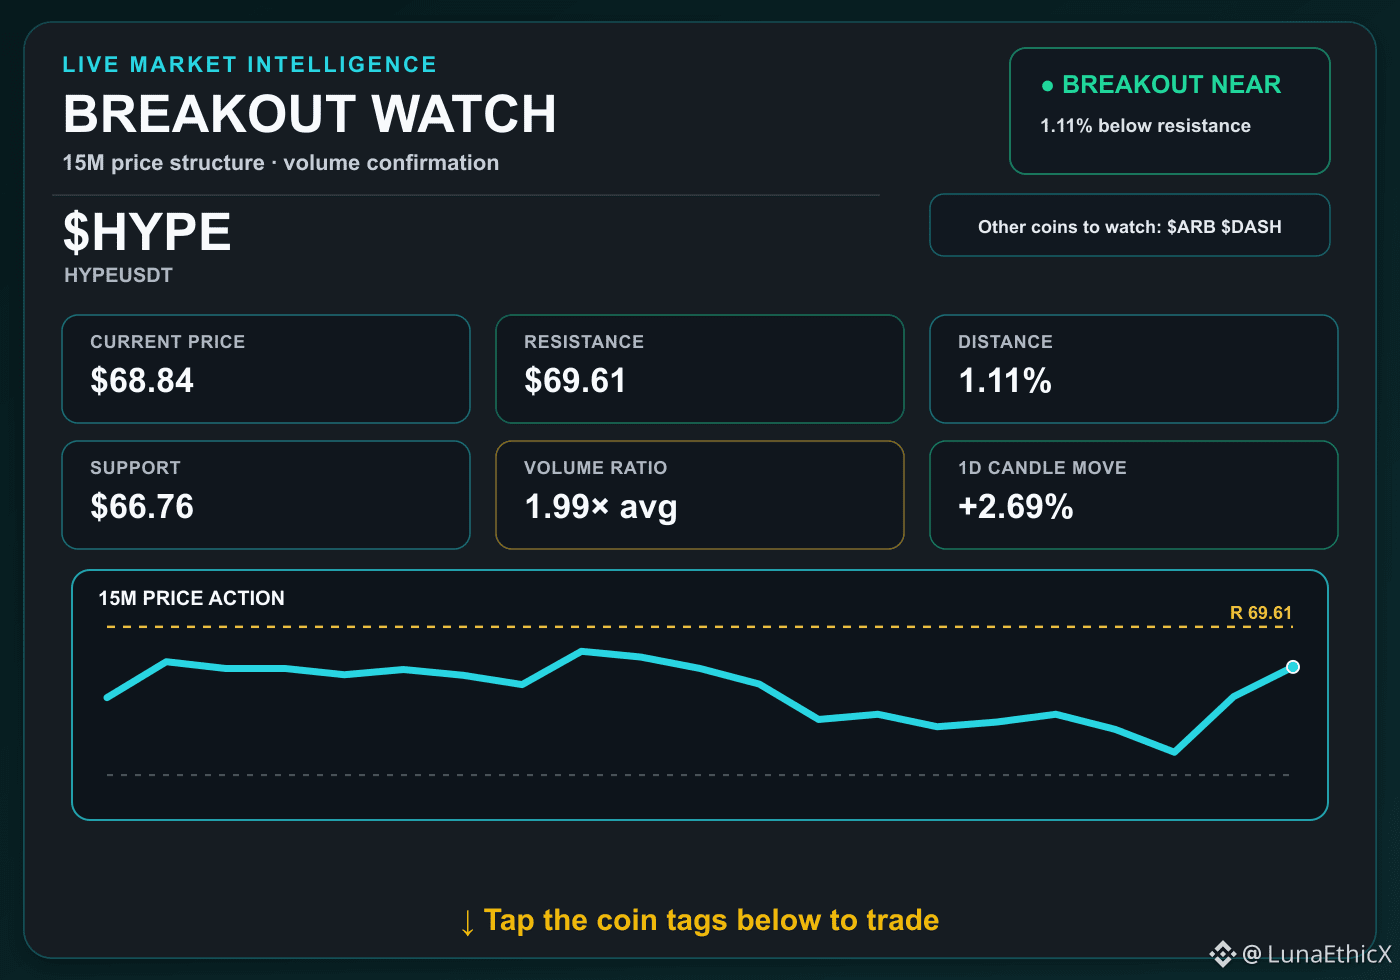
Current price 68.84 is approaching the 69.61 barrier from 1.11% below it. Volume on the current 15M candle is 1.99× average. Does price clear the level, or get pushed back again?
Watching this level while keeping $ARB and $DASH in sight. 🔍
👇 Check the live charts through the coin tags below.
#TechnicalAnalysis #CryptoAnalysis #BinanceSquare
$HYPE $ARB $DASH
$HYPE PRESSING TOWARD RESISTANCE 📈
Current price 68.84 is approaching the 69.61 barrier from 1.11% below it. Volume on the current 15M candle is 1.99× average. Does price clear the level, or get pushed back again?
Watching this level while keeping $ARB and $DASH in sight. 🔍
👇 Check the live charts through the coin tags below.
#TechnicalAnalysis #CryptoAnalysis #BinanceSquare
$HYPE $ARB $DASH
Current price 68.84 is approaching the 69.61 barrier from 1.11% below it. Volume on the current 15M candle is 1.99× average. Does price clear the level, or get pushed back again?
Watching this level while keeping $ARB and $DASH in sight. 🔍
👇 Check the live charts through the coin tags below.
#TechnicalAnalysis #CryptoAnalysis #BinanceSquare
$HYPE $ARB $DASH
9
·
--
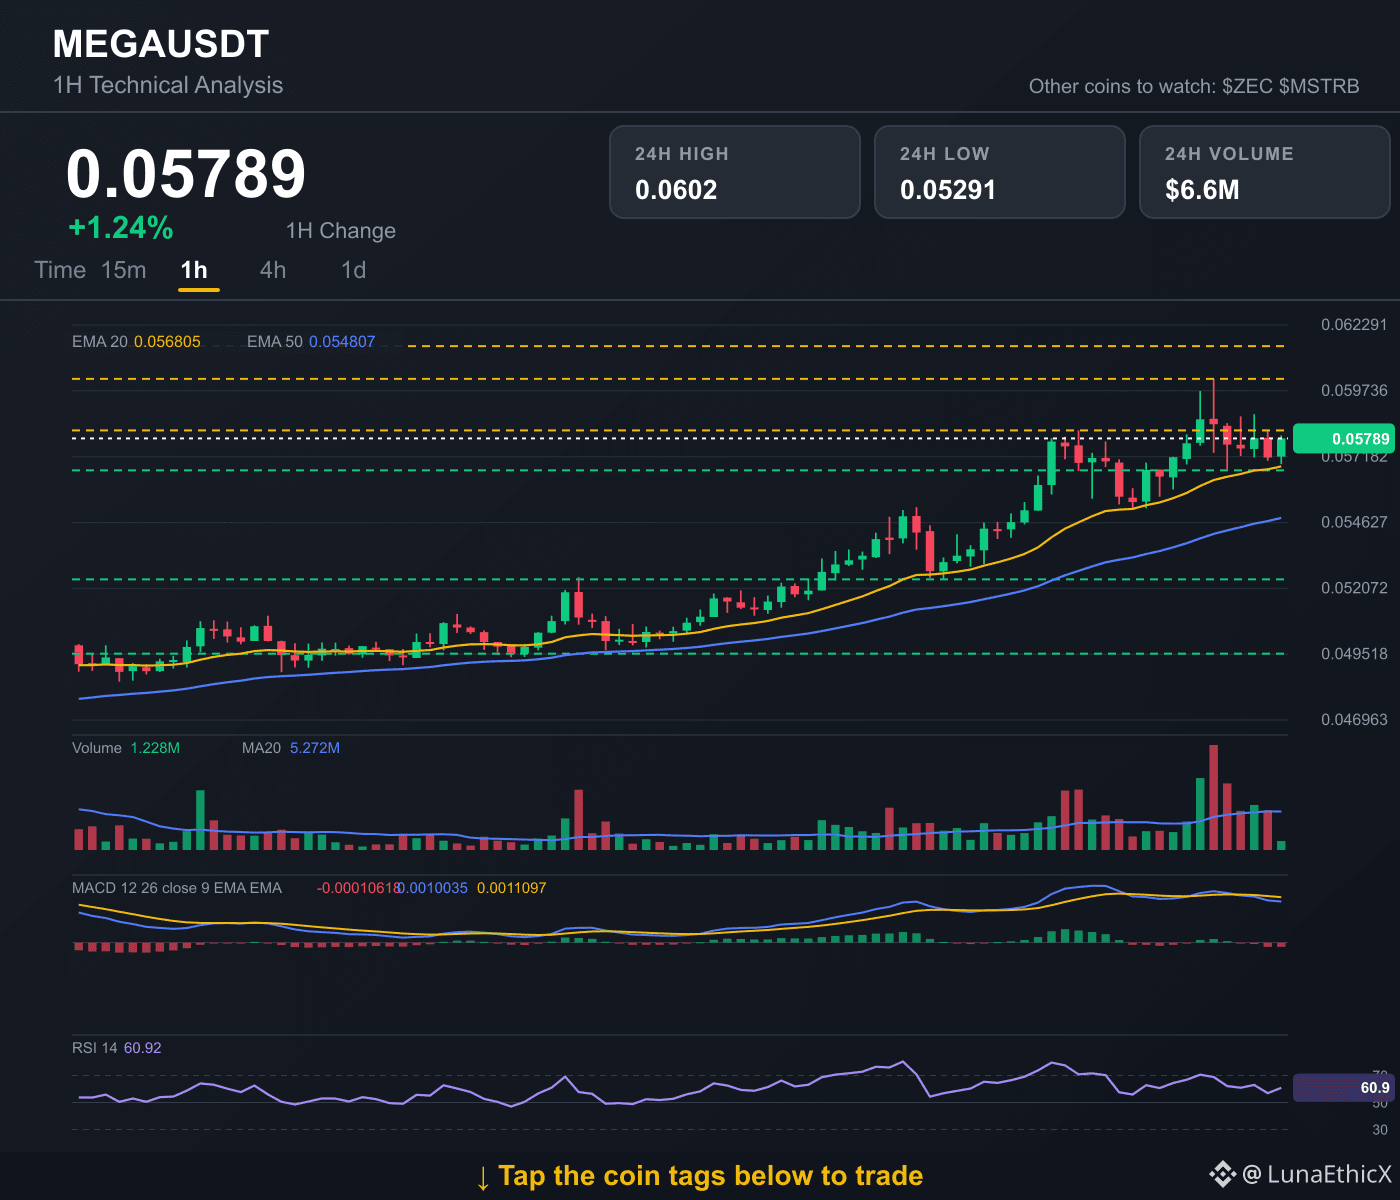
$MEGA 1H TREND STRUCTURE REMAINS STRONG 📊
Price 0.0579 continues to sit above EMA20 0.0568 and EMA50 0.0548, keeping the trend technically firm. RSI at 60.92 is neutral, with MACD 0.001004 and signal 0.00111 providing the next momentum clue, though histogram momentum is fading. Price could encounter selling pressure near 0.0582, 0.0602 and 0.0615. Buyers may look for support around 0.0566, 0.0524 and 0.0495.
Two more names on the radar: $ZEC and $MSTRB. 🔍
👇 Open the coin tags below and see if the charts match your view.
#TechnicalAnalysis #CryptoAnalysis #BinanceSquare
$MEGA $ZEC $MSTRB
$MEGA 1H TREND STRUCTURE REMAINS STRONG 📊
Price 0.0579 continues to sit above EMA20 0.0568 and EMA50 0.0548, keeping the trend technically firm. RSI at 60.92 is neutral, with MACD 0.001004 and signal 0.00111 providing the next momentum clue, though histogram momentum is fading. Price could encounter selling pressure near 0.0582, 0.0602 and 0.0615. Buyers may look for support around 0.0566, 0.0524 and 0.0495.
Two more names on the radar: $ZEC and $MSTRB . 🔍
👇 Open the coin tags below and see if the charts match your view.
#TechnicalAnalysis #CryptoAnalysis #BinanceSquare
$MEGA $ZEC $MSTRB
Price 0.0579 continues to sit above EMA20 0.0568 and EMA50 0.0548, keeping the trend technically firm. RSI at 60.92 is neutral, with MACD 0.001004 and signal 0.00111 providing the next momentum clue, though histogram momentum is fading. Price could encounter selling pressure near 0.0582, 0.0602 and 0.0615. Buyers may look for support around 0.0566, 0.0524 and 0.0495.
Two more names on the radar: $ZEC and $MSTRB . 🔍
👇 Open the coin tags below and see if the charts match your view.
#TechnicalAnalysis #CryptoAnalysis #BinanceSquare
$MEGA $ZEC $MSTRB
2

·
--
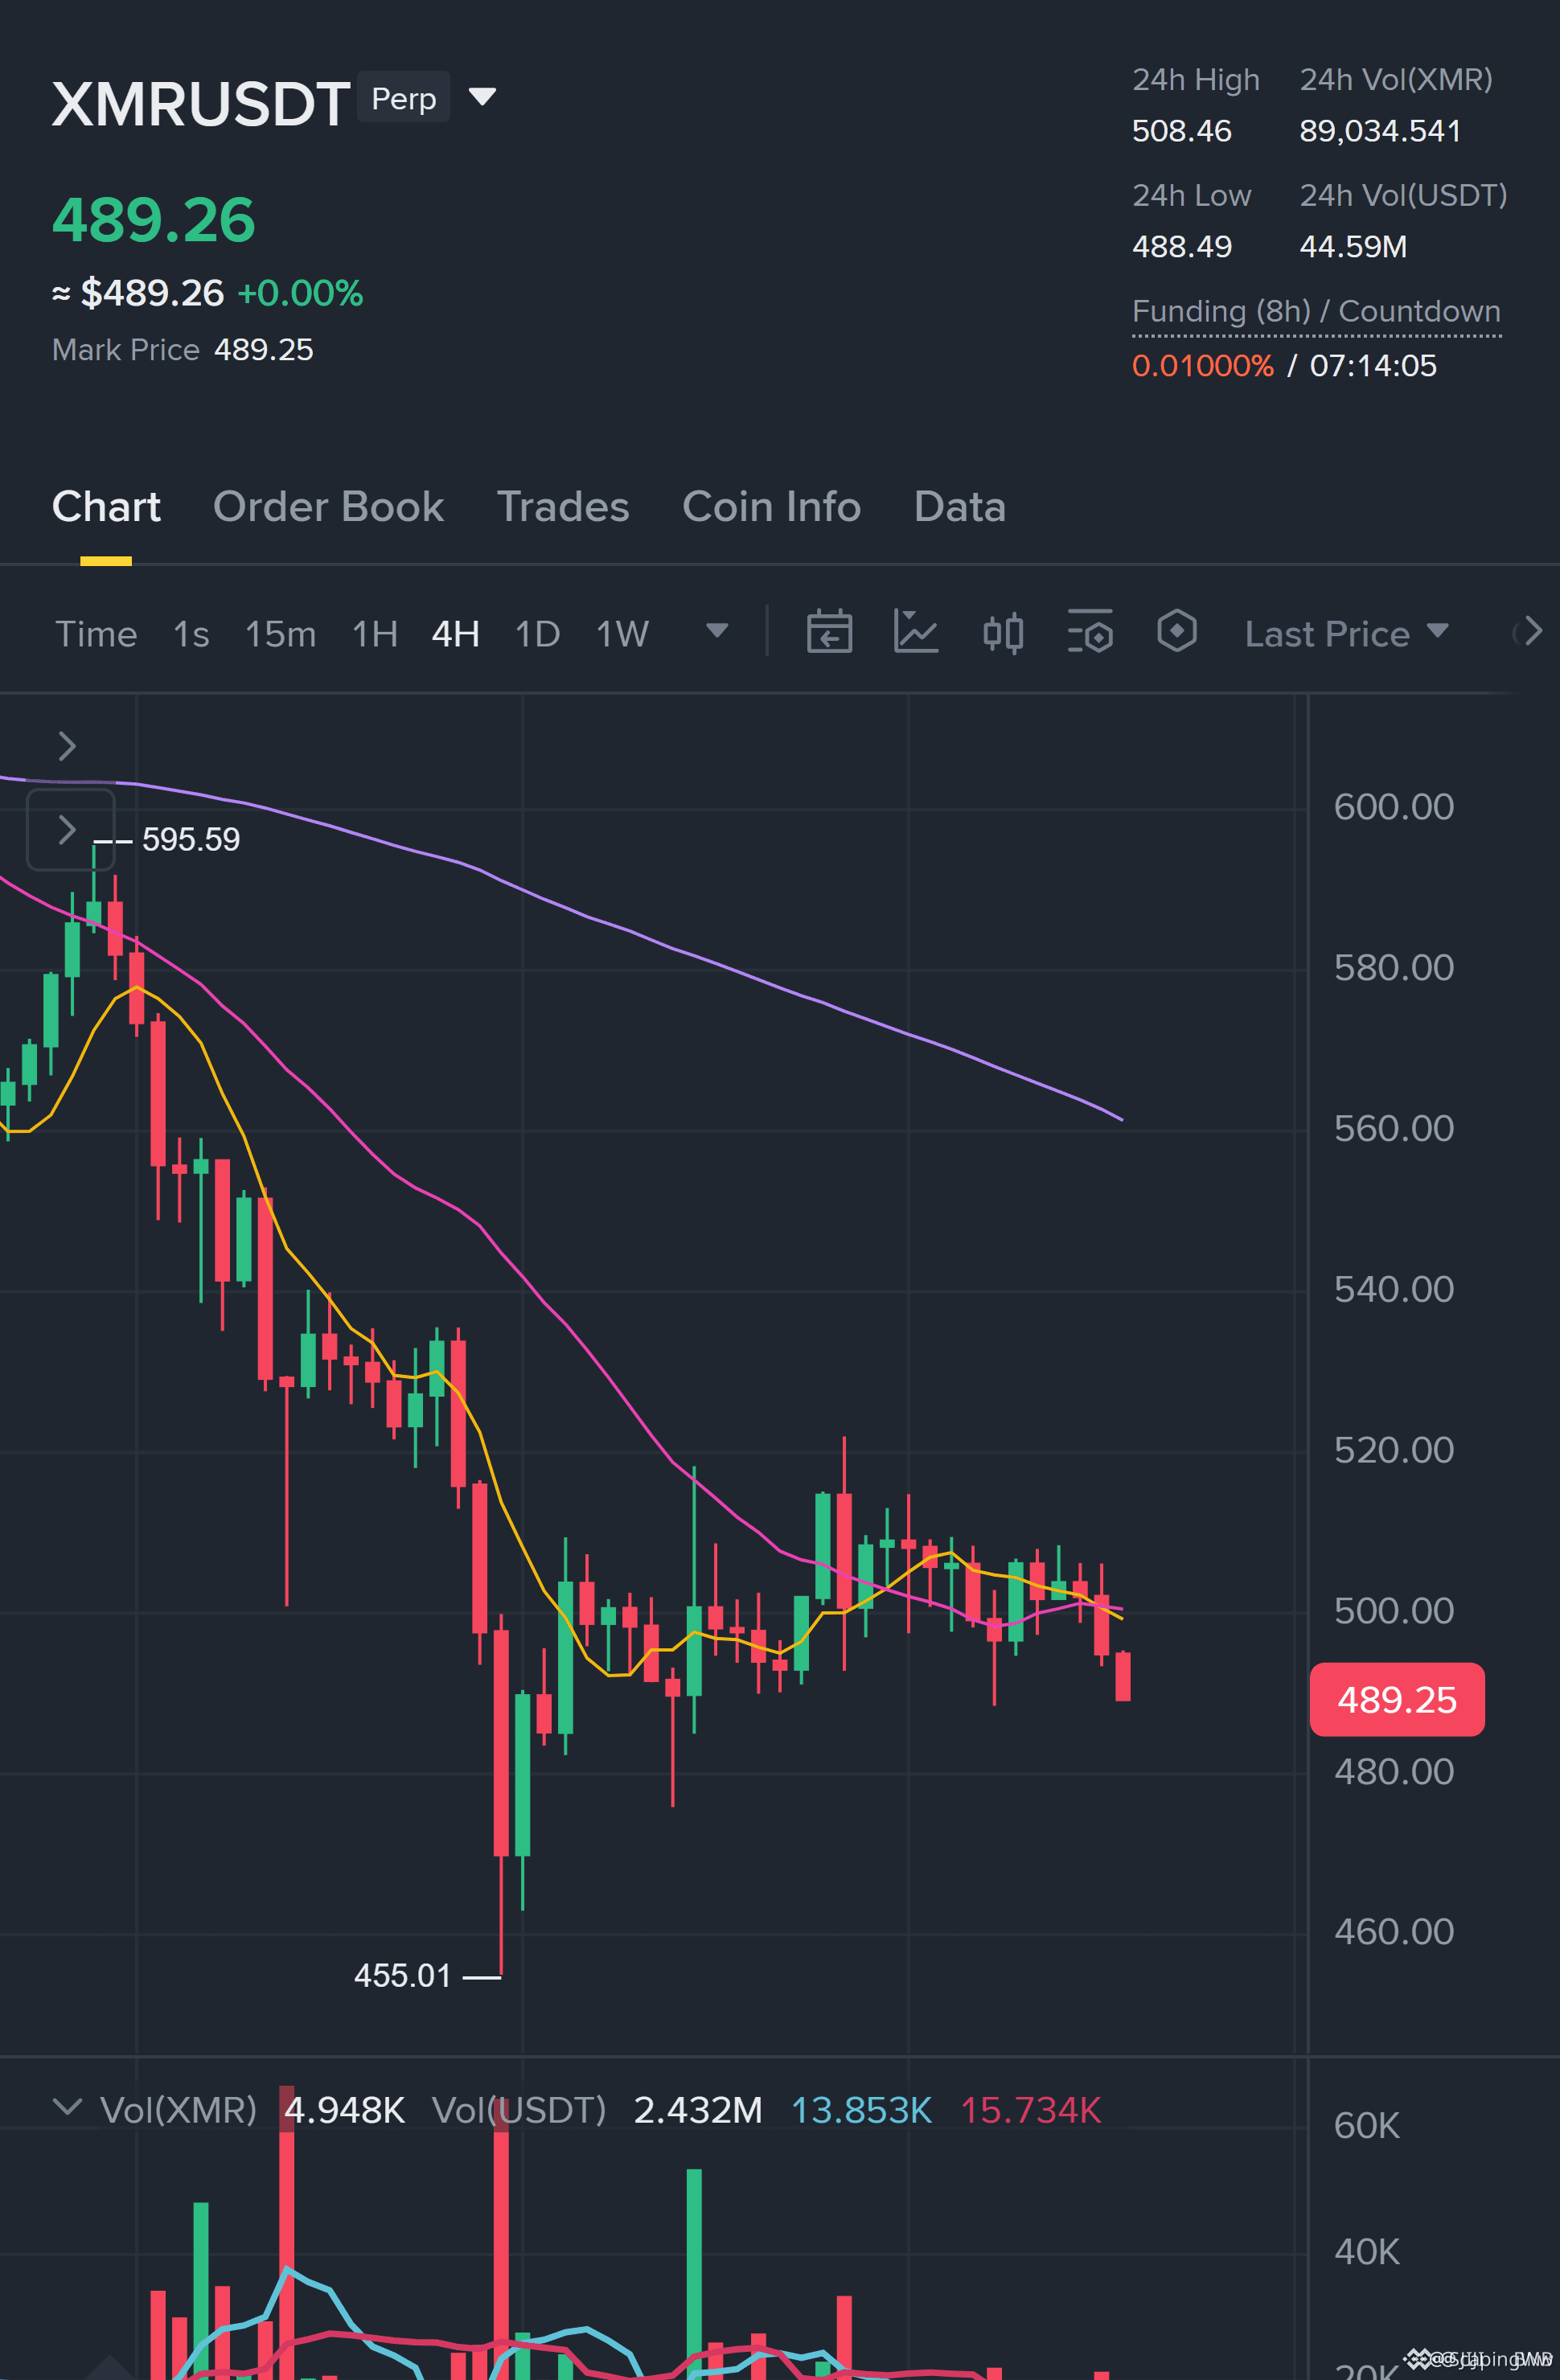
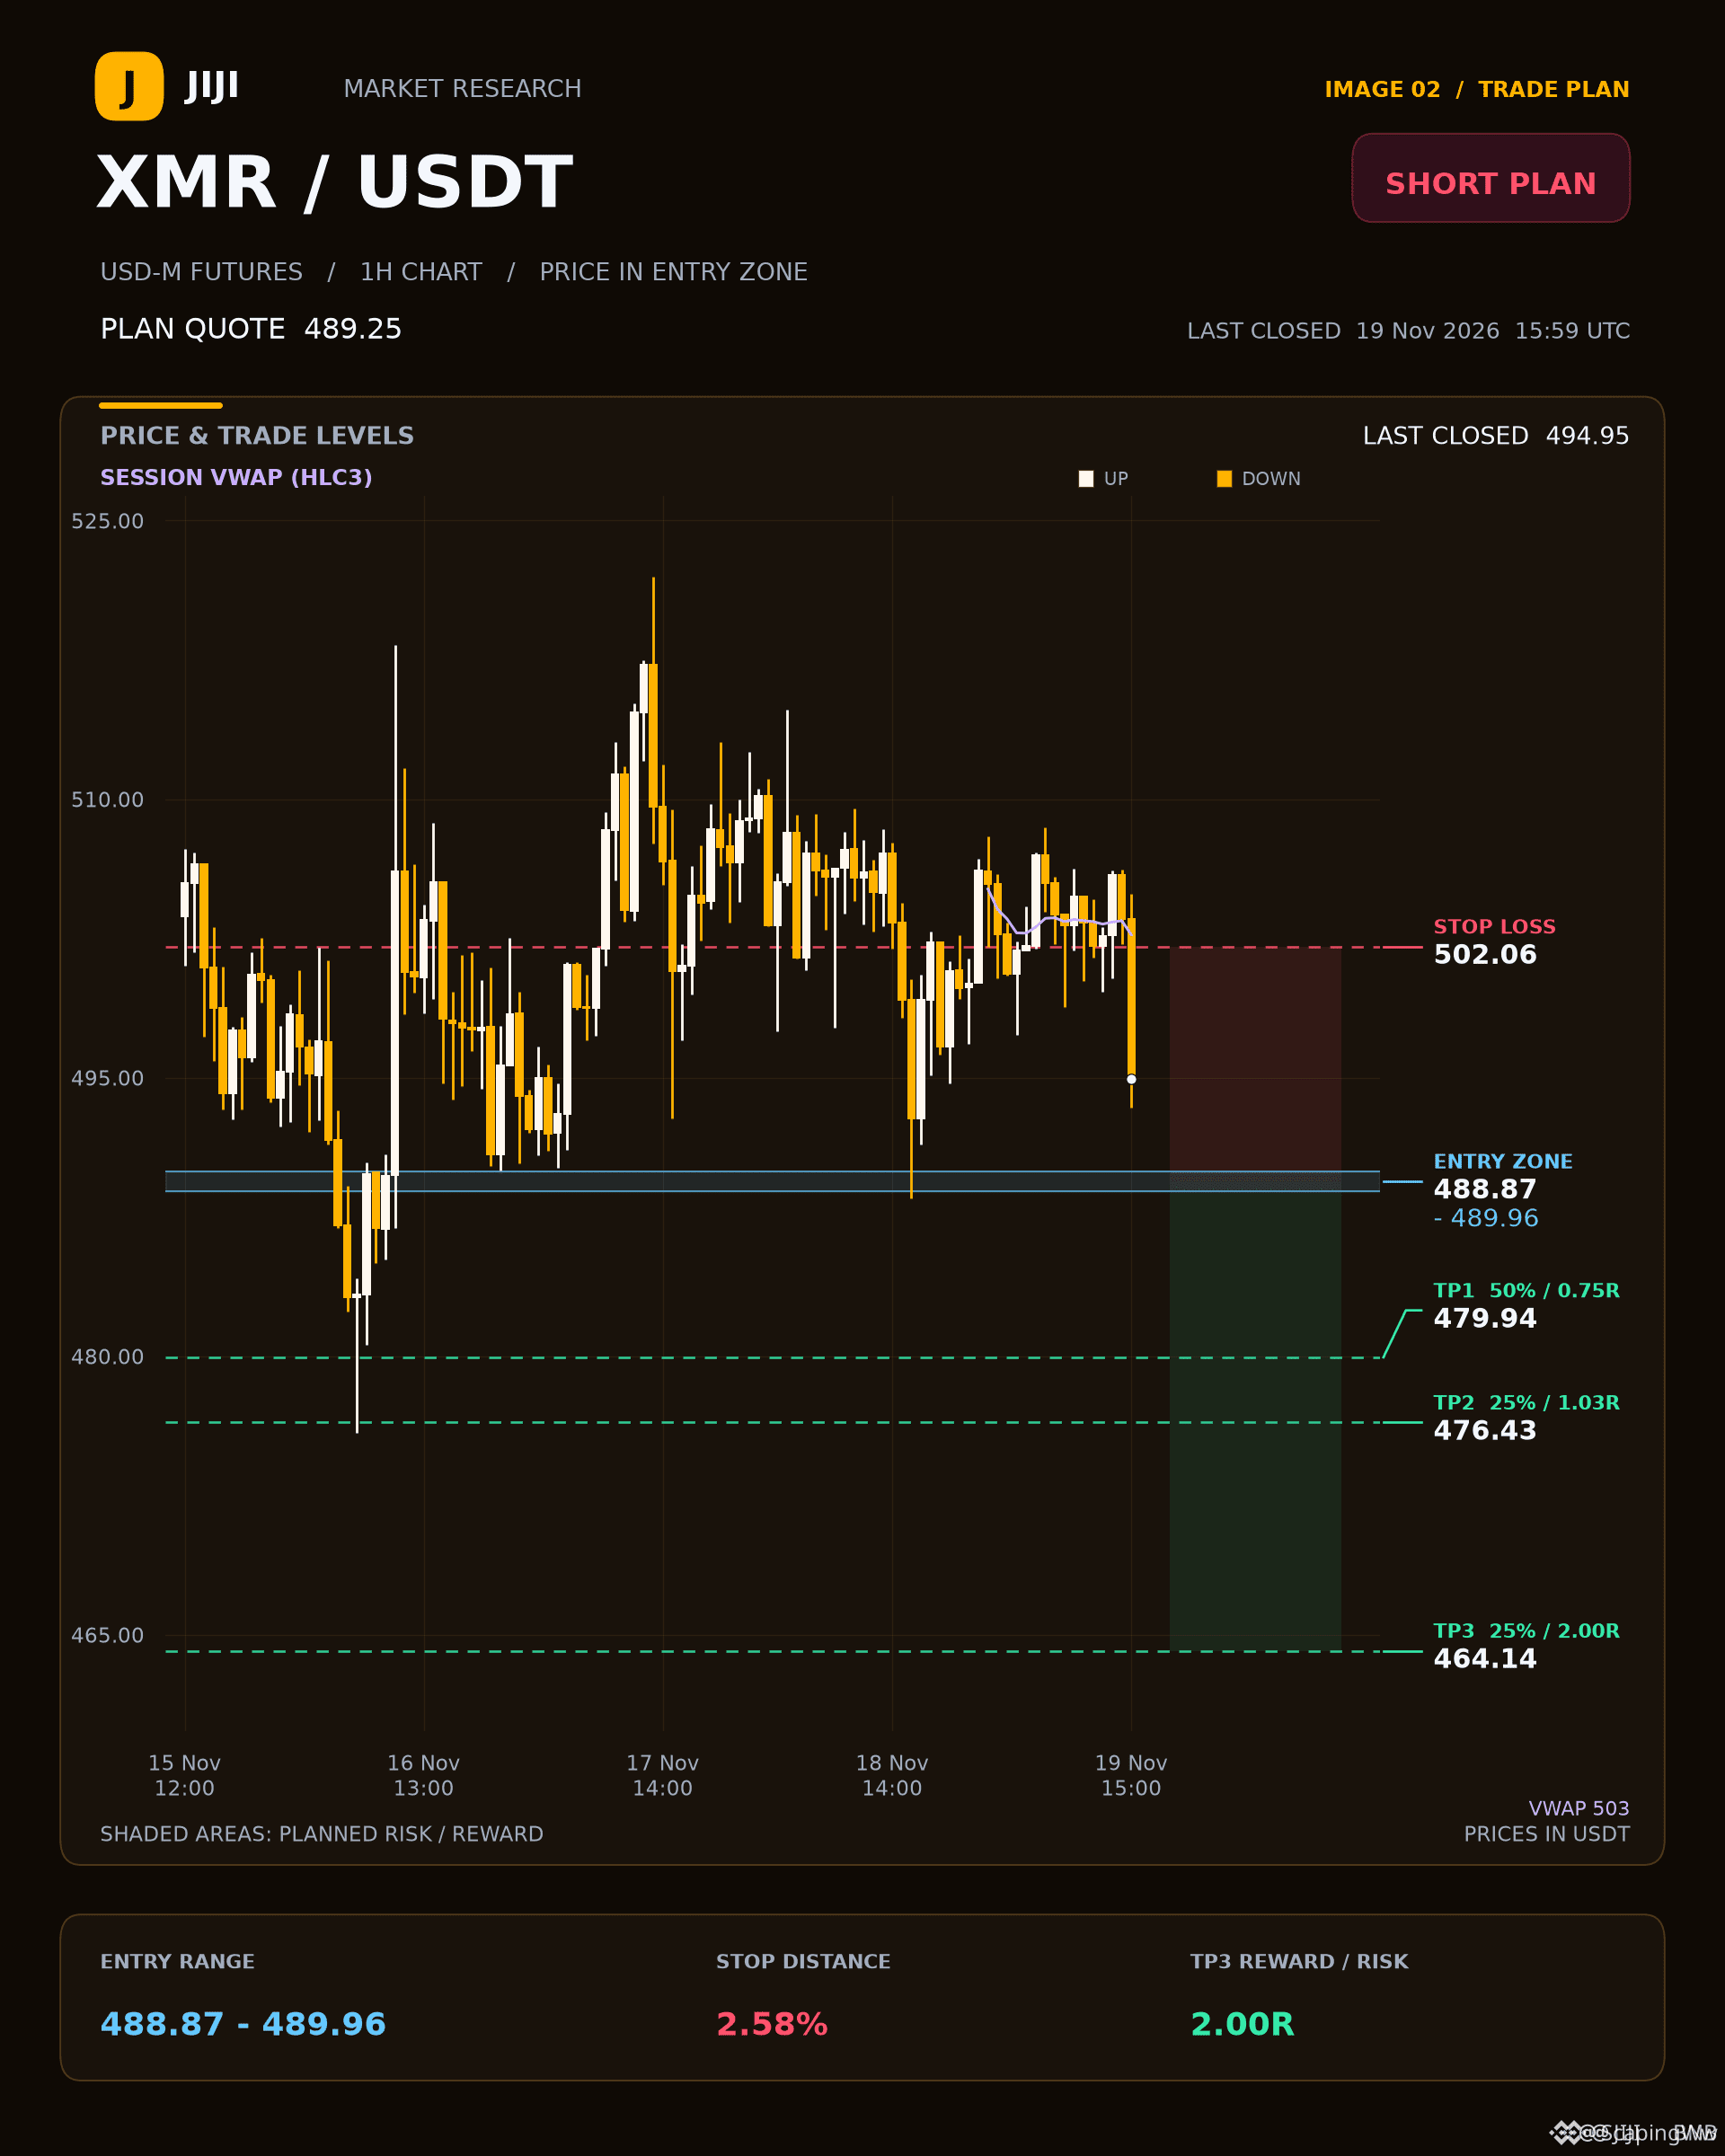
🔴 $XMR BEARS STACKING PRESSURE AS MOVING AVERAGES ROLL OVER HARD 📉
Entry: 488.87 ⚡
Target: 476.43 🚀
Stop Loss: 502.06 ⚠️
Sellers are firmly in the driver seat with a clean bearish moving average stack on the four-hour chart. 📊 Momentum indicators like the directional index confirm heavy downside momentum building up beneath the current zone. ⚡
Price action needs to slice cleanly through the immediate support shelf to unlock the next leg lower toward our objective. 🔍 Are you positioning for this continuation or waiting for a deeper retest? 👇
⚠️ Not financial advice. Always manage your risk. 🛡️
🏷️ #XMR #ShortSetup #CryptoFutures #TechnicalAnalysis
🐻 📉
🔴 $XMR BEARS STACKING PRESSURE AS MOVING AVERAGES ROLL OVER HARD 📉
Entry: 488.87 ⚡
Target: 476.43 🚀
Stop Loss: 502.06 ⚠️
Sellers are firmly in the driver seat with a clean bearish moving average stack on the four-hour chart. 📊 Momentum indicators like the directional index confirm heavy downside momentum building up beneath the current zone. ⚡
Price action needs to slice cleanly through the immediate support shelf to unlock the next leg lower toward our objective. 🔍 Are you positioning for this continuation or waiting for a deeper retest? 👇
⚠️ Not financial advice. Always manage your risk. 🛡️
🏷️ #XMR #ShortSetup #CryptoFutures #TechnicalAnalysis
🐻 📉
Entry: 488.87 ⚡
Target: 476.43 🚀
Stop Loss: 502.06 ⚠️
Sellers are firmly in the driver seat with a clean bearish moving average stack on the four-hour chart. 📊 Momentum indicators like the directional index confirm heavy downside momentum building up beneath the current zone. ⚡
Price action needs to slice cleanly through the immediate support shelf to unlock the next leg lower toward our objective. 🔍 Are you positioning for this continuation or waiting for a deeper retest? 👇
⚠️ Not financial advice. Always manage your risk. 🛡️
🏷️ #XMR #ShortSetup #CryptoFutures #TechnicalAnalysis
🐻 📉
8
Log in to explore more content
Join global crypto users on Binance Square
⚡️ Get latest and useful information about crypto.
💬 Trusted by the world’s largest crypto exchange.
👍 Discover real insights from verified creators.
Email / Phone number
Trending Topics
1
#IsAnthropic’s$1.5TMarketCapJustified?
4,753 views
43 Discussing
2
#BTCRemainsUnderPressureAfterHawkishFOMCMinutes
183,447 views
1,891 Discussing
3
#NvidiaBoardReportedlySplitOverHuang’sReturn
88,405 views
1,003 Discussing
4
#StrategySTRCPreferredSlips3.65%Below$100Par
3,996 views
59 Discussing
5
#MASToUpgradeSGDTestnetToSGDigitalLedger
11,823 views
189 Discussing
6
#CanGTA6'sLaunchLiftTTWOShares?
61,129 views
748 Discussing
7
#Solana2027RoadmapTargetsDoubleComputeCapacity
3,224 views
91 Discussing
8
#InjectiveTokenizedRealEstateMortgagesTop$1.5B
853 views
27 Discussing
9
#TetherMakesStrategicInvestmentInSCRYPT
3,766 views
78 Discussing
10
#CapitalGroupAdds1264500StrategyShares
18,818 views
208 Discussing