
#cryptoanalysis
cryptoanalysis
29M views
129,717 Discussing
Hot
Latest

🔥 $PEPE /USDT – Bulls Are Taking Control! 🚀
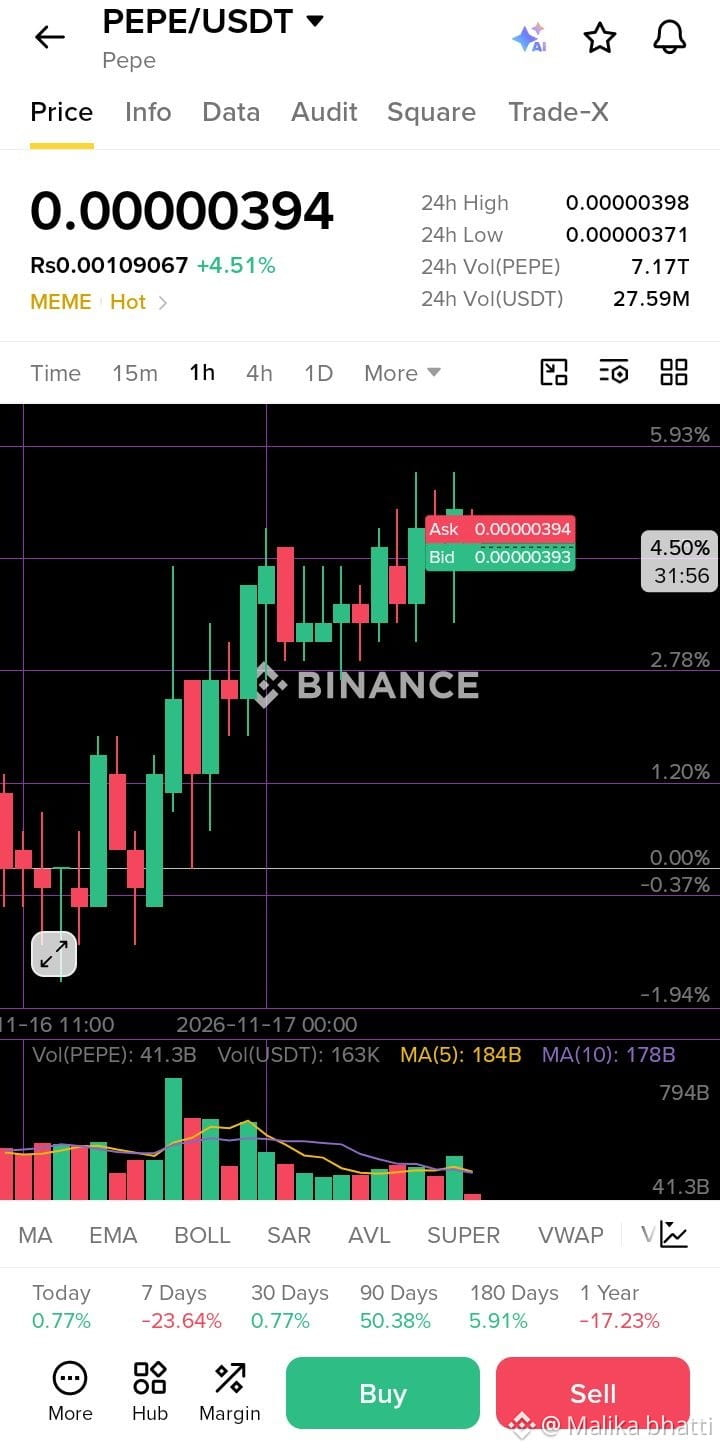
$PEPE is showing bullish momentum, currently trading at 0.00000394 (+4.51%) on the 1H chart.
📈 Buyers are pushing the price upward, but resistance at 0.00000398 is the key level to watch. A breakout could bring further upside, while 0.00000371 remains an important support.
👀 Will PEPE break resistance or face a pullback? Watch closely!
#PEPE
#CryptoAnalysis #BullishTrend #CryptoTrading #Memecoin
{spot}(PEPEUSDT)
🔥 $PEPE /USDT – Bulls Are Taking Control! 🚀
$PEPE is showing bullish momentum, currently trading at 0.00000394 (+4.51%) on the 1H chart.
📈 Buyers are pushing the price upward, but resistance at 0.00000398 is the key level to watch. A breakout could bring further upside, while 0.00000371 remains an important support.
👀 Will PEPE break resistance or face a pullback? Watch closely!
#PEPE
#CryptoAnalysis #BullishTrend #CryptoTrading #Memecoin
$PEPE is showing bullish momentum, currently trading at 0.00000394 (+4.51%) on the 1H chart.
📈 Buyers are pushing the price upward, but resistance at 0.00000398 is the key level to watch. A breakout could bring further upside, while 0.00000371 remains an important support.
👀 Will PEPE break resistance or face a pullback? Watch closely!
#PEPE
#CryptoAnalysis #BullishTrend #CryptoTrading #Memecoin
54

🚨 $ADA BLEEDING TO 0.15 WHILE SMART MONEY EYES INSTITUTIONAL TOKENIZATION DEEP VALUE! 🦈
Entry: 0.15 ⚡
Extreme fear has pushed $ADA into deeply oversold territory with the 14-day RSI printing near 28 and price compressed below major moving averages. 📊
Beneath this brutal price action, institutional infrastructure is quietly expanding through CIP-0113 tokenization frameworks and multi-client node adoption. 💡
With nearly 58 percent of supply staked and regulatory exposure building, this disconnect between valuation and underlying network development is fascinating. 🌊
💬 Are you accumulating this structural discount or waiting for confirmation of a macro trend reversal? 👇
⚠️ Not financial advice. Always manage your risk. 🛡️
🏷️ #ADA #Cardano #SmartMoney #CryptoAnalysis
🦈 ⚖️
🚨 $ADA BLEEDING TO 0.15 WHILE SMART MONEY EYES INSTITUTIONAL TOKENIZATION DEEP VALUE! 🦈
Entry: 0.15 ⚡
Extreme fear has pushed $ADA into deeply oversold territory with the 14-day RSI printing near 28 and price compressed below major moving averages. 📊
Beneath this brutal price action, institutional infrastructure is quietly expanding through CIP-0113 tokenization frameworks and multi-client node adoption. 💡
With nearly 58 percent of supply staked and regulatory exposure building, this disconnect between valuation and underlying network development is fascinating. 🌊
💬 Are you accumulating this structural discount or waiting for confirmation of a macro trend reversal? 👇
⚠️ Not financial advice. Always manage your risk. 🛡️
🏷️ #ADA #Cardano #SmartMoney #CryptoAnalysis
🦈 ⚖️
Entry: 0.15 ⚡
Extreme fear has pushed $ADA into deeply oversold territory with the 14-day RSI printing near 28 and price compressed below major moving averages. 📊
Beneath this brutal price action, institutional infrastructure is quietly expanding through CIP-0113 tokenization frameworks and multi-client node adoption. 💡
With nearly 58 percent of supply staked and regulatory exposure building, this disconnect between valuation and underlying network development is fascinating. 🌊
💬 Are you accumulating this structural discount or waiting for confirmation of a macro trend reversal? 👇
⚠️ Not financial advice. Always manage your risk. 🛡️
🏷️ #ADA #Cardano #SmartMoney #CryptoAnalysis
🦈 ⚖️
12

·
--
$BTC Bitcoin (BTC) Latest Market Analysis 📊
📅 November 17, 2026
Bitcoin is trading around $64,500, showing weakness after a recent market correction.
🔴 Resistance: $65,200 – $65,600
🟢 Support: $63,800 – $62,000
Market Outlook: Short-term trend remains bearish. A breakout above $65,600 could signal recovery, while a drop below $63,800 may bring more downside pressure.
⚠️ Watch key levels and manage your risk carefully.
What do you think? Will BTC recover or fall further? 🚀
#bitcoin.” #BTC #CryptoAnalysis #BinanceSquar #CryptoMarket
$BTC Bitcoin (BTC) Latest Market Analysis 📊
📅 November 17, 2026
Bitcoin is trading around $64,500, showing weakness after a recent market correction.
🔴 Resistance: $65,200 – $65,600
🟢 Support: $63,800 – $62,000
Market Outlook: Short-term trend remains bearish. A breakout above $65,600 could signal recovery, while a drop below $63,800 may bring more downside pressure.
⚠️ Watch key levels and manage your risk carefully.
What do you think? Will BTC recover or fall further? 🚀
#bitcoin.” #BTC #CryptoAnalysis #BinanceSquar #CryptoMarket
📅 November 17, 2026
Bitcoin is trading around $64,500, showing weakness after a recent market correction.
🔴 Resistance: $65,200 – $65,600
🟢 Support: $63,800 – $62,000
Market Outlook: Short-term trend remains bearish. A breakout above $65,600 could signal recovery, while a drop below $63,800 may bring more downside pressure.
⚠️ Watch key levels and manage your risk carefully.
What do you think? Will BTC recover or fall further? 🚀
#bitcoin.” #BTC #CryptoAnalysis #BinanceSquar #CryptoMarket

3


·
--
$BTC 🚨 BITCOIN WHALES ARE BUYING! 2,479 BTC NET INFLOW — IS A RECOVERY COMING?
Something interesting is happening in the Bitcoin market! 🐋
According to the Binance screenshots, BTC is trading around $64,840, while the 1-day Money Flow data shows approximately 2,479 BTC in net buying pressure.
But the biggest signal comes from large orders!
📊 WHALE ACTIVITY
🟢 Large Orders Net Inflow: +2,049 BTC
🟢 Medium Orders Net Inflow: +339 BTC
🟢 Small Orders Net Inflow: +91 BTC
🟢 Total Net Inflow: +2,479 BTC
This suggests buyers were more active than sellers during the displayed 1-day period.
📈 TECHNICAL ANALYSIS (1H)
• Current Price: $64,840
• Recent High: $65,696
• Recent Low: $63,905
• Supertrend: $63,831
• RSI(6): 47.23
• MACD Histogram: +3.45
🐂 BULLISH SCENARIO
If BTC holds above $63,831 and breaks $65,696 with strong volume, a further recovery could become possible.
🐻 BEARISH SCENARIO
If BTC loses $63,831, the recovery structure could weaken, bringing the $63,000 area into focus.
⚠️ ONE IMPORTANT WARNING
Despite the positive daily inflow, the 5-day large-order net inflow remains negative at approximately 7,285 BTC.
This means one day of buying does not yet confirm a complete change in market sentiment.
💡 MY VIEW
Whale buying activity is encouraging, and short-term technical indicators are showing signs of stabilization.
However, confirmation is still needed before calling this a bullish reversal.
🔥 WHAT DO YOU THINK?
Are whales accumulating Bitcoin before the next rally, or is this just a temporary bounce?
🐂 BULLISH or 🐻 BEARISH?
#Bitcoin #BTC #WhaleActivity #CryptoAnalysis #BinanceSquare
$BTC 🚨 BITCOIN WHALES ARE BUYING! 2,479 BTC NET INFLOW — IS A RECOVERY COMING?
Something interesting is happening in the Bitcoin market! 🐋
According to the Binance screenshots, BTC is trading around $64,840, while the 1-day Money Flow data shows approximately 2,479 BTC in net buying pressure.
But the biggest signal comes from large orders!
📊 WHALE ACTIVITY
🟢 Large Orders Net Inflow: +2,049 BTC
🟢 Medium Orders Net Inflow: +339 BTC
🟢 Small Orders Net Inflow: +91 BTC
🟢 Total Net Inflow: +2,479 BTC
This suggests buyers were more active than sellers during the displayed 1-day period.
📈 TECHNICAL ANALYSIS (1H)
• Current Price: $64,840
• Recent High: $65,696
• Recent Low: $63,905
• Supertrend: $63,831
• RSI(6): 47.23
• MACD Histogram: +3.45
🐂 BULLISH SCENARIO
If BTC holds above $63,831 and breaks $65,696 with strong volume, a further recovery could become possible.
🐻 BEARISH SCENARIO
If BTC loses $63,831, the recovery structure could weaken, bringing the $63,000 area into focus.
⚠️ ONE IMPORTANT WARNING
Despite the positive daily inflow, the 5-day large-order net inflow remains negative at approximately 7,285 BTC.
This means one day of buying does not yet confirm a complete change in market sentiment.
💡 MY VIEW
Whale buying activity is encouraging, and short-term technical indicators are showing signs of stabilization.
However, confirmation is still needed before calling this a bullish reversal.
🔥 WHAT DO YOU THINK?
Are whales accumulating Bitcoin before the next rally, or is this just a temporary bounce?
🐂 BULLISH or 🐻 BEARISH?
#Bitcoin #BTC #WhaleActivity #CryptoAnalysis #BinanceSquare
Something interesting is happening in the Bitcoin market! 🐋
According to the Binance screenshots, BTC is trading around $64,840, while the 1-day Money Flow data shows approximately 2,479 BTC in net buying pressure.
But the biggest signal comes from large orders!
📊 WHALE ACTIVITY
🟢 Large Orders Net Inflow: +2,049 BTC
🟢 Medium Orders Net Inflow: +339 BTC
🟢 Small Orders Net Inflow: +91 BTC
🟢 Total Net Inflow: +2,479 BTC
This suggests buyers were more active than sellers during the displayed 1-day period.
📈 TECHNICAL ANALYSIS (1H)
• Current Price: $64,840
• Recent High: $65,696
• Recent Low: $63,905
• Supertrend: $63,831
• RSI(6): 47.23
• MACD Histogram: +3.45
🐂 BULLISH SCENARIO
If BTC holds above $63,831 and breaks $65,696 with strong volume, a further recovery could become possible.
🐻 BEARISH SCENARIO
If BTC loses $63,831, the recovery structure could weaken, bringing the $63,000 area into focus.
⚠️ ONE IMPORTANT WARNING
Despite the positive daily inflow, the 5-day large-order net inflow remains negative at approximately 7,285 BTC.
This means one day of buying does not yet confirm a complete change in market sentiment.
💡 MY VIEW
Whale buying activity is encouraging, and short-term technical indicators are showing signs of stabilization.
However, confirmation is still needed before calling this a bullish reversal.
🔥 WHAT DO YOU THINK?
Are whales accumulating Bitcoin before the next rally, or is this just a temporary bounce?
🐂 BULLISH or 🐻 BEARISH?
#Bitcoin #BTC #WhaleActivity #CryptoAnalysis #BinanceSquare
🐂 BULLISH
🐻 BEARISH
🤔
16 hr(s) left
225

·
--
$BTC
📊 BTC/USDT Market Analysis – What's Next for Bitcoin?
Bitcoin is currently trading around $64,700, showing signs of consolidation after a significant price decline.
🔍 15-Minute Chart Analysis
📌 Current Price: $64,700
📈 24H High: $65,696.16
📉 24H Low: $63,905.01
Important Levels:
🔴 Resistance: $65,000 – $65,300
🔴 Major Resistance: $65,500 – $65,700
🟢 Support: $64,000
🟢 Major Support: $63,900
📊 Market Direction:
My current outlook is SIDEWAYS with a slight bearish bias.
🚀 Bullish Scenario:
If BTC breaks above $65,300 and maintains momentum, it could move toward $65,500–$65,700.
🔻 Bearish Scenario:
If BTC breaks below $64,000 with strong selling pressure, a move toward $63,900 or lower becomes possible.
⚠️ My Observation:
The market has not confirmed a clear trend reversal yet. Wait for breakout confirmation before making any trading decisions.
What do you think?
🚀 Bullish or 🔻 Bearish?
#BTC #Bitcoin #CryptoAnalysis #Binance #trading
{spot}(BTCUSDT)
$BTC
📊 BTC/USDT Market Analysis – What's Next for Bitcoin?
Bitcoin is currently trading around $64,700, showing signs of consolidation after a significant price decline.
🔍 15-Minute Chart Analysis
📌 Current Price: $64,700
📈 24H High: $65,696.16
📉 24H Low: $63,905.01
Important Levels:
🔴 Resistance: $65,000 – $65,300
🔴 Major Resistance: $65,500 – $65,700
🟢 Support: $64,000
🟢 Major Support: $63,900
📊 Market Direction:
My current outlook is SIDEWAYS with a slight bearish bias.
🚀 Bullish Scenario:
If BTC breaks above $65,300 and maintains momentum, it could move toward $65,500–$65,700.
🔻 Bearish Scenario:
If BTC breaks below $64,000 with strong selling pressure, a move toward $63,900 or lower becomes possible.
⚠️ My Observation:
The market has not confirmed a clear trend reversal yet. Wait for breakout confirmation before making any trading decisions.
What do you think?
🚀 Bullish or 🔻 Bearish?
#BTC #Bitcoin #CryptoAnalysis #Binance #trading
📊 BTC/USDT Market Analysis – What's Next for Bitcoin?
Bitcoin is currently trading around $64,700, showing signs of consolidation after a significant price decline.
🔍 15-Minute Chart Analysis
📌 Current Price: $64,700
📈 24H High: $65,696.16
📉 24H Low: $63,905.01
Important Levels:
🔴 Resistance: $65,000 – $65,300
🔴 Major Resistance: $65,500 – $65,700
🟢 Support: $64,000
🟢 Major Support: $63,900
📊 Market Direction:
My current outlook is SIDEWAYS with a slight bearish bias.
🚀 Bullish Scenario:
If BTC breaks above $65,300 and maintains momentum, it could move toward $65,500–$65,700.
🔻 Bearish Scenario:
If BTC breaks below $64,000 with strong selling pressure, a move toward $63,900 or lower becomes possible.
⚠️ My Observation:
The market has not confirmed a clear trend reversal yet. Wait for breakout confirmation before making any trading decisions.
What do you think?
🚀 Bullish or 🔻 Bearish?
#BTC #Bitcoin #CryptoAnalysis #Binance #trading

19

·
--
🚨 $ONG BEARISH EMA STACK SUGGESTS LOWER LIQUIDITY TARGETS AHEAD 📉
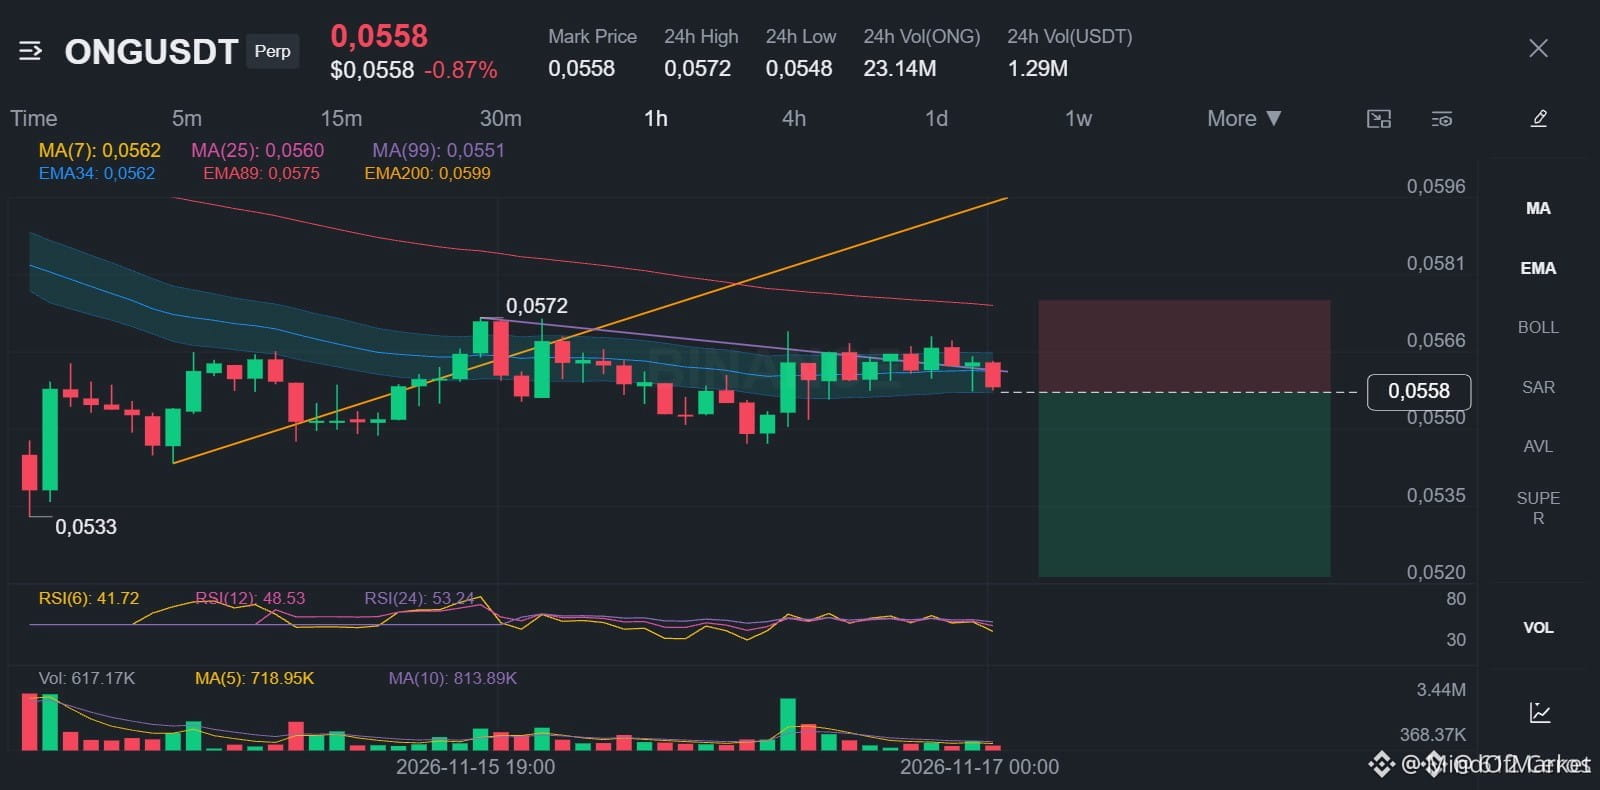
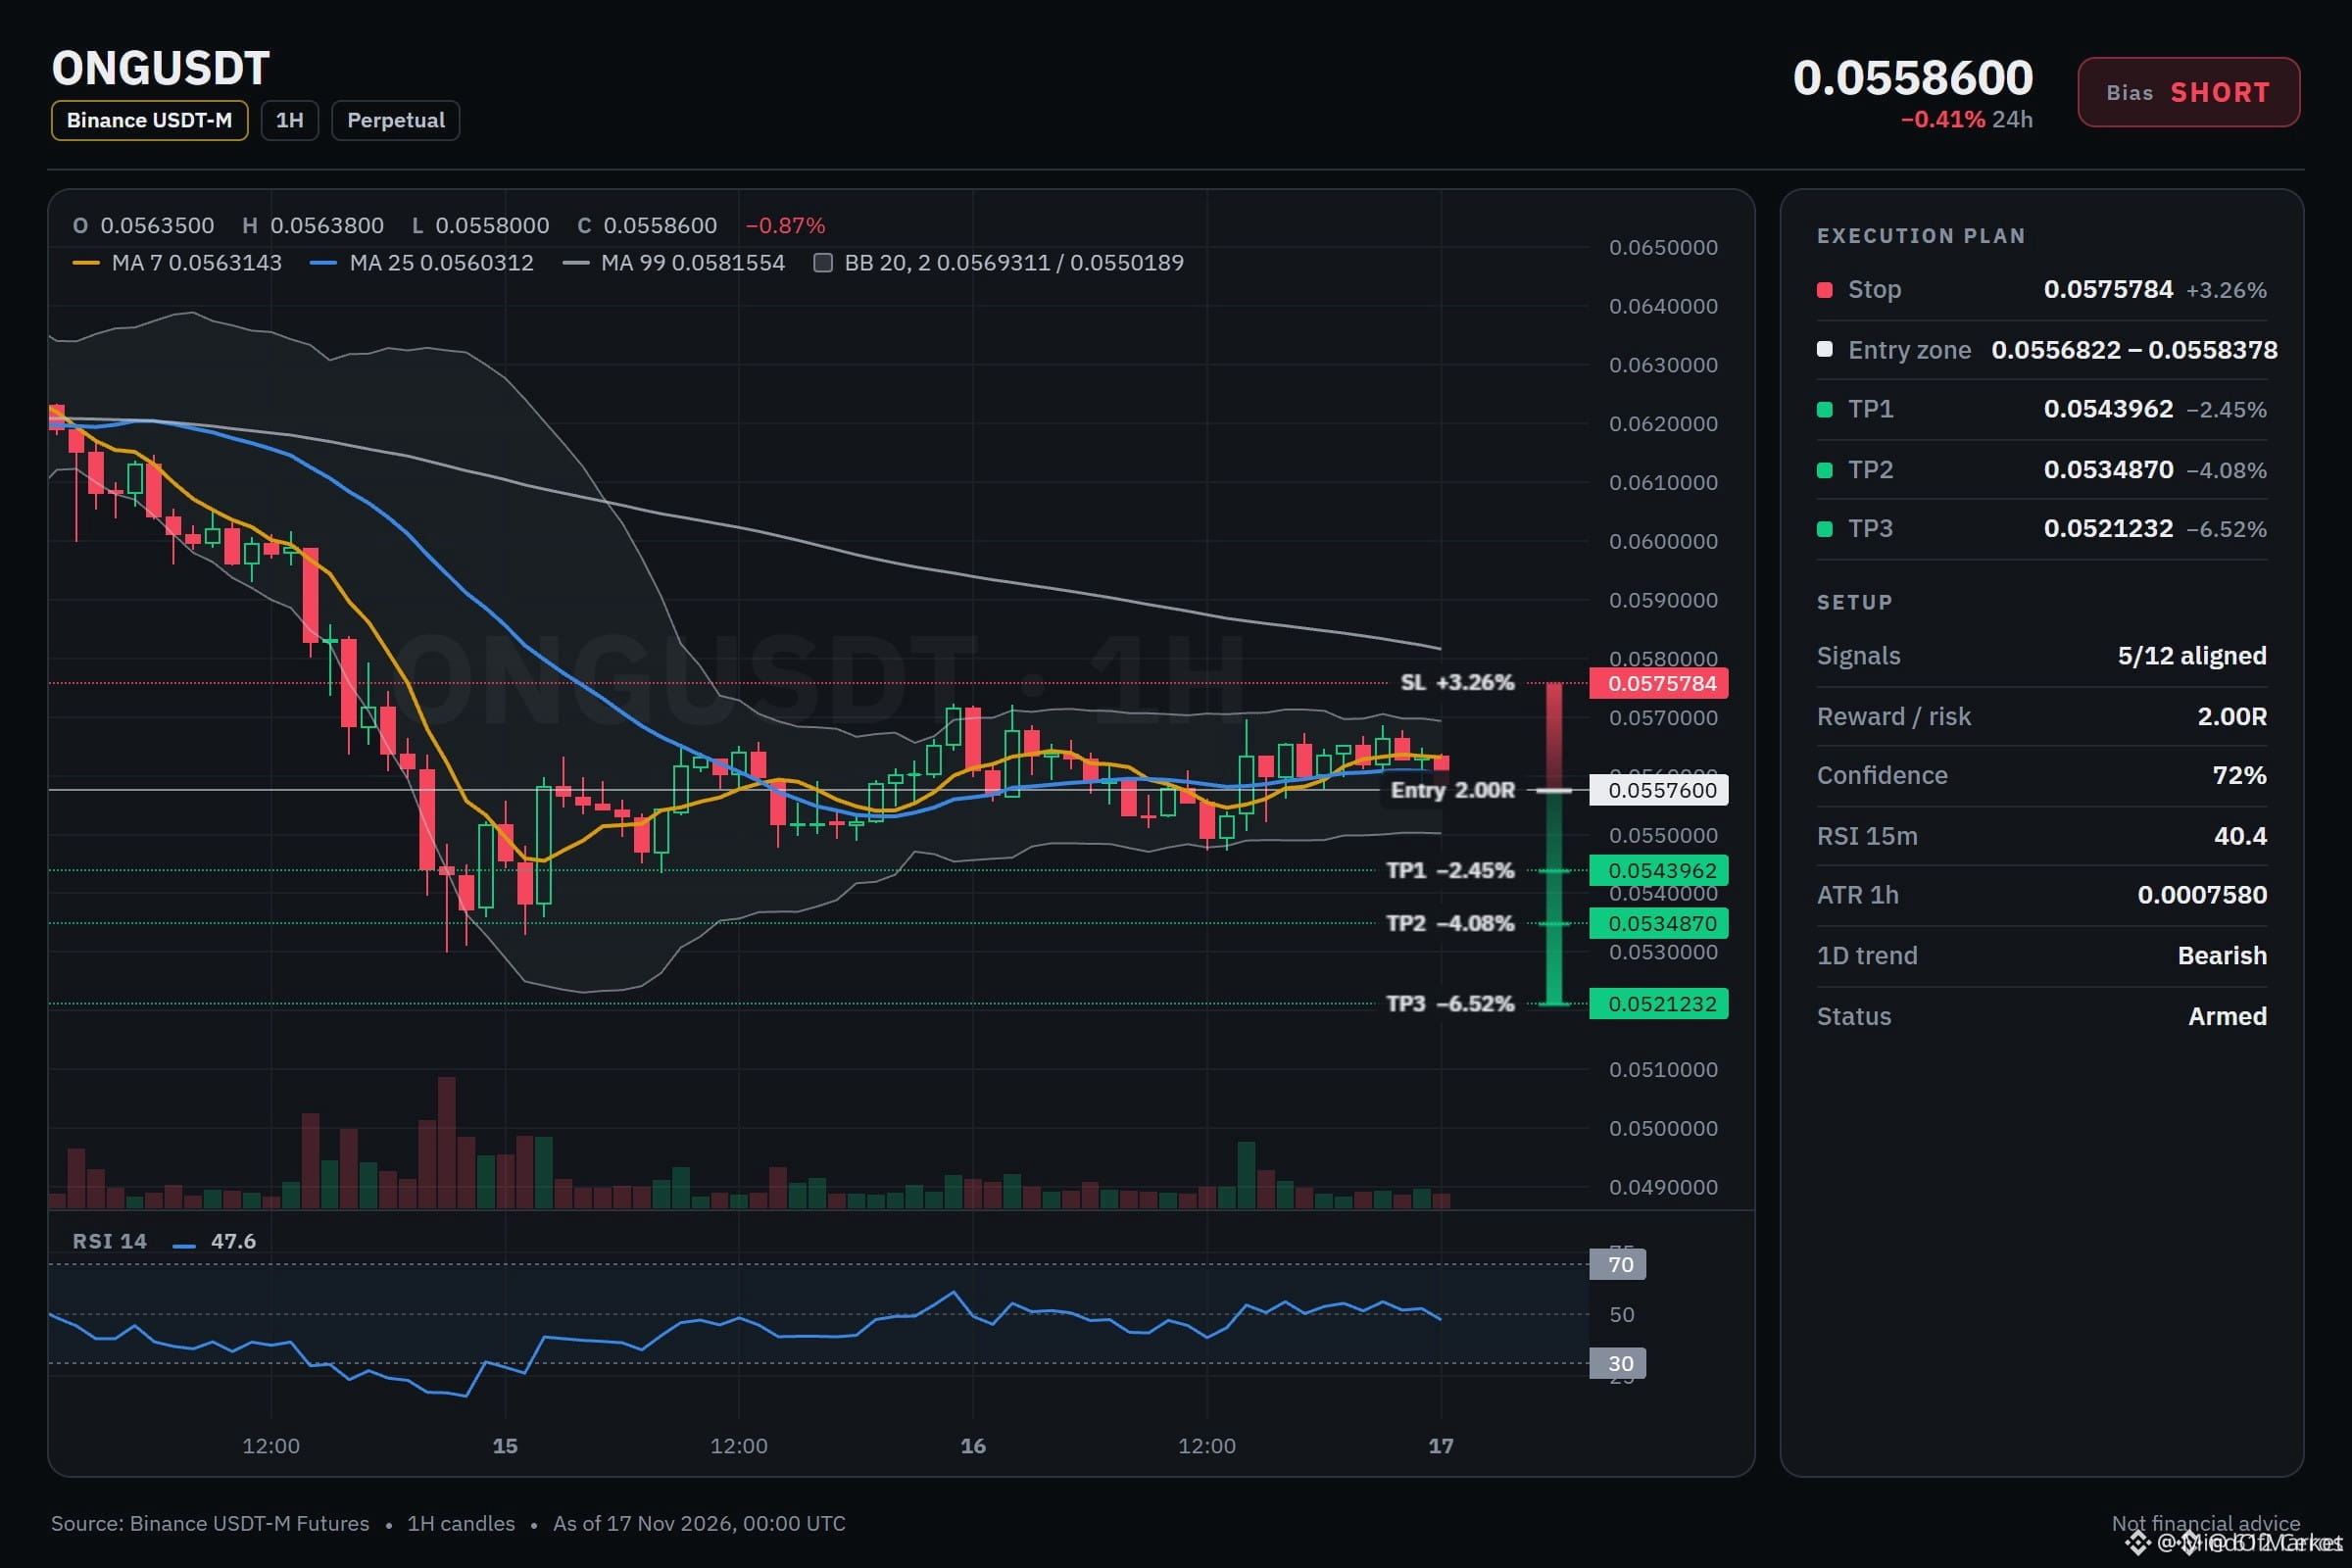
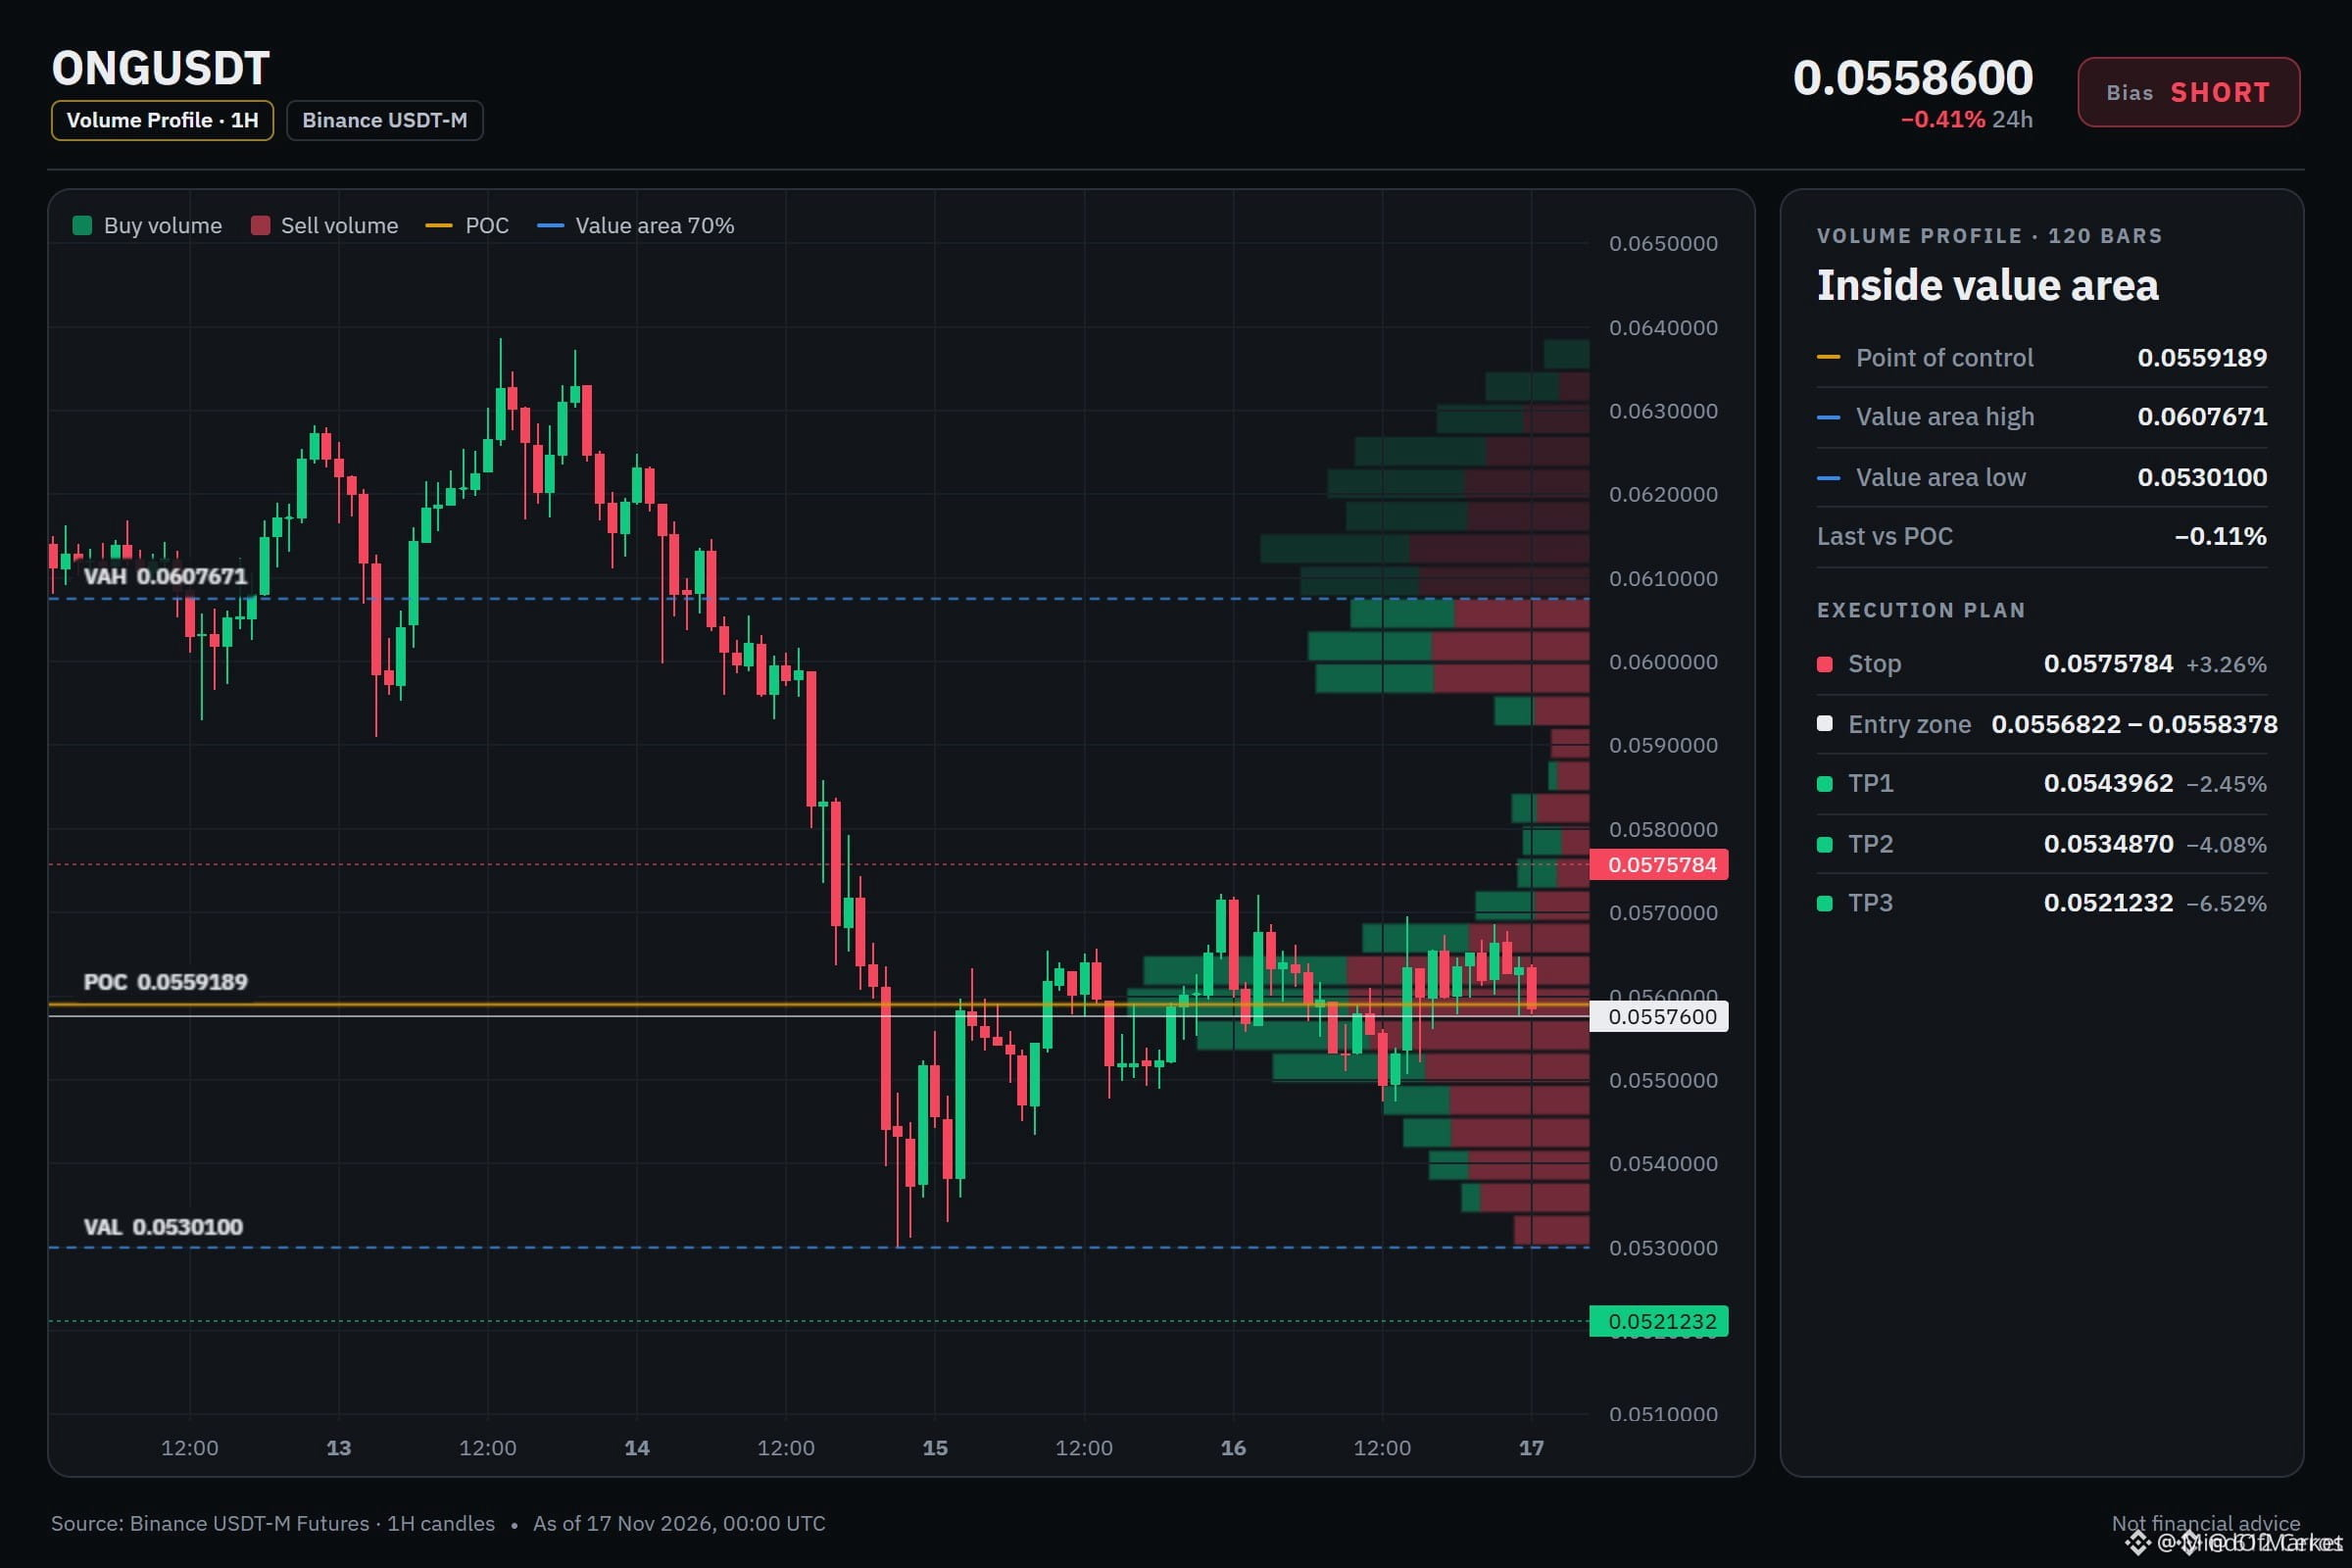
Entry: 0.0556822 - 0.0558378 ⚡
Target 1: 0.0543962 🚀
Target 2: 0.0534870 🎯
Target 3: 0.0521232 💥
Stop Loss: 0.0575784 ⚠️
Multi-timeframe analysis reveals a persistent macro downtrend with the daily price lingering beneath the EMA50 and EMA200 bands. Bearish EMA stacks across the daily, 4-hour, and 1-hour charts confirm that institutional sellers maintain full control of the distribution phase. 📊
Given the moderate conviction score, size your exposure conservatively and manage risk tightly. The distribution plan involves scaling out fifty percent at the first target, twenty-five at the second, and the remaining quarter at the final level, while trailing the stop to entry once initial realization occurs. 💡
💬 Do you see $ONG continuing this downward trajectory toward deeper support or finding a sudden liquidity bid here? 👇
⚠️ Not financial advice. Always manage your risk. 🛡️
🏷️ #ONG #ShortSetup #CryptoAnalysis #SmartMoney
🦈 📉
🚨 $ONG BEARISH EMA STACK SUGGESTS LOWER LIQUIDITY TARGETS AHEAD 📉
Entry: 0.0556822 - 0.0558378 ⚡
Target 1: 0.0543962 🚀
Target 2: 0.0534870 🎯
Target 3: 0.0521232 💥
Stop Loss: 0.0575784 ⚠️
Multi-timeframe analysis reveals a persistent macro downtrend with the daily price lingering beneath the EMA50 and EMA200 bands. Bearish EMA stacks across the daily, 4-hour, and 1-hour charts confirm that institutional sellers maintain full control of the distribution phase. 📊
Given the moderate conviction score, size your exposure conservatively and manage risk tightly. The distribution plan involves scaling out fifty percent at the first target, twenty-five at the second, and the remaining quarter at the final level, while trailing the stop to entry once initial realization occurs. 💡
💬 Do you see $ONG continuing this downward trajectory toward deeper support or finding a sudden liquidity bid here? 👇
⚠️ Not financial advice. Always manage your risk. 🛡️
🏷️ #ONG #ShortSetup #CryptoAnalysis #SmartMoney
🦈 📉
Entry: 0.0556822 - 0.0558378 ⚡
Target 1: 0.0543962 🚀
Target 2: 0.0534870 🎯
Target 3: 0.0521232 💥
Stop Loss: 0.0575784 ⚠️
Multi-timeframe analysis reveals a persistent macro downtrend with the daily price lingering beneath the EMA50 and EMA200 bands. Bearish EMA stacks across the daily, 4-hour, and 1-hour charts confirm that institutional sellers maintain full control of the distribution phase. 📊
Given the moderate conviction score, size your exposure conservatively and manage risk tightly. The distribution plan involves scaling out fifty percent at the first target, twenty-five at the second, and the remaining quarter at the final level, while trailing the stop to entry once initial realization occurs. 💡
💬 Do you see $ONG continuing this downward trajectory toward deeper support or finding a sudden liquidity bid here? 👇
⚠️ Not financial advice. Always manage your risk. 🛡️
🏷️ #ONG #ShortSetup #CryptoAnalysis #SmartMoney
🦈 📉
2

·
--
Bearish
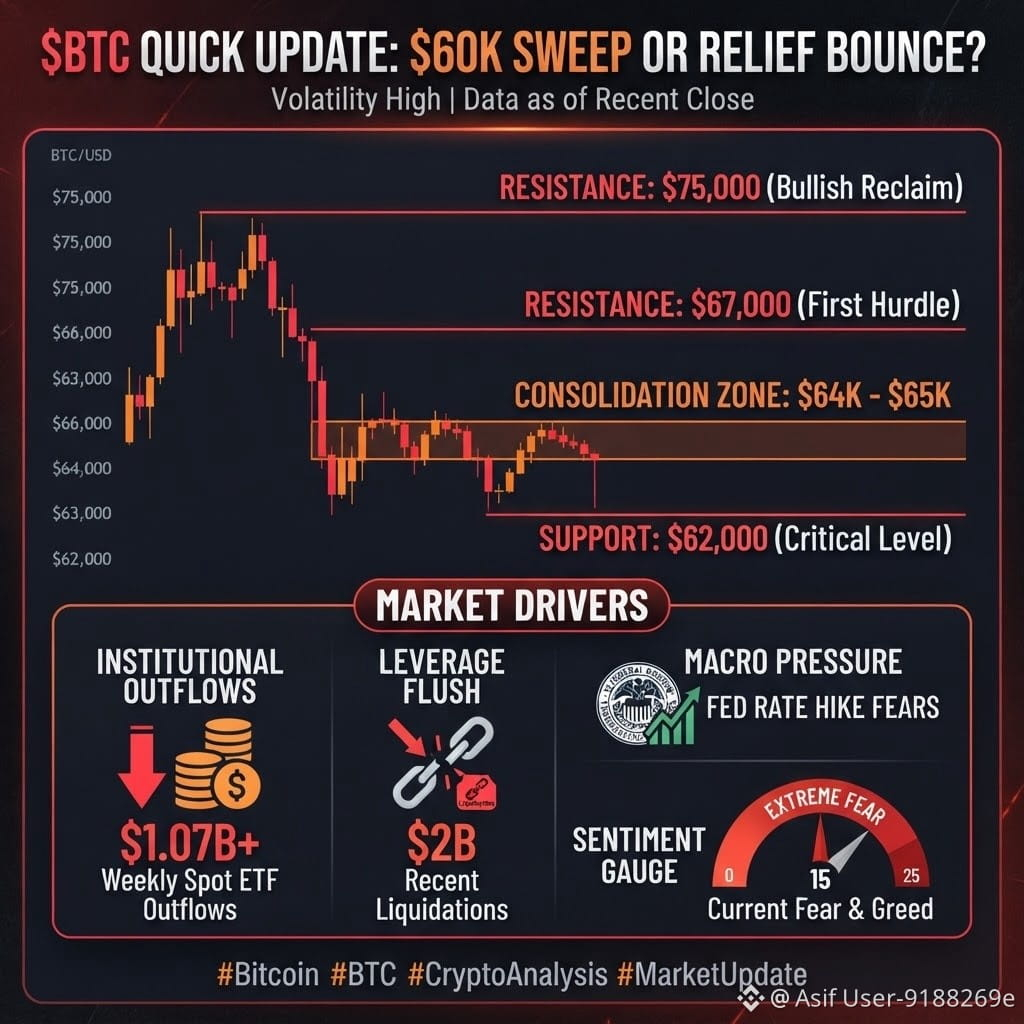
🚨 $BTC Quick Update: $60K Sweep or Relief Bounce? 📉👀
Bitcoin is consolidating around $64,000 – $65,000 after dipping near $62,000. With $1.07B+ in weekly spot ETF outflows, $2B in recent liquidations, and Fed rate hike fears weighing on risk assets, short-term volatility remains high.
📊 Key Levels to Watch:
Support: $62,000 (lose this, and $60,000 is next)
Resistance: $67,000 (first hurdle) & $75,000 (bullish reclaim)
Extreme fear often marks local accumulation zones, so avoid high leverage until a clear floor forms.
Your move? 👇
🟢 Buying $64K | 🟡 Waiting for $60K | 🔴 Sitting in stables
#Bitcoin #BTC #CryptoAnalysis #MarketUpdate #BitcoinExtendsLosingStreakToSixWeeks
{spot}(BTCUSDT)
🚨 $BTC Quick Update: $60K Sweep or Relief Bounce? 📉👀
Bitcoin is consolidating around $64,000 – $65,000 after dipping near $62,000. With $1.07B+ in weekly spot ETF outflows, $2B in recent liquidations, and Fed rate hike fears weighing on risk assets, short-term volatility remains high.
📊 Key Levels to Watch:
Support: $62,000 (lose this, and $60,000 is next)
Resistance: $67,000 (first hurdle) & $75,000 (bullish reclaim)
Extreme fear often marks local accumulation zones, so avoid high leverage until a clear floor forms.
Your move? 👇
🟢 Buying $64K | 🟡 Waiting for $60K | 🔴 Sitting in stables
#Bitcoin #BTC #CryptoAnalysis #MarketUpdate #BitcoinExtendsLosingStreakToSixWeeks
Bitcoin is consolidating around $64,000 – $65,000 after dipping near $62,000. With $1.07B+ in weekly spot ETF outflows, $2B in recent liquidations, and Fed rate hike fears weighing on risk assets, short-term volatility remains high.
📊 Key Levels to Watch:
Support: $62,000 (lose this, and $60,000 is next)
Resistance: $67,000 (first hurdle) & $75,000 (bullish reclaim)
Extreme fear often marks local accumulation zones, so avoid high leverage until a clear floor forms.
Your move? 👇
🟢 Buying $64K | 🟡 Waiting for $60K | 🔴 Sitting in stables
#Bitcoin #BTC #CryptoAnalysis #MarketUpdate #BitcoinExtendsLosingStreakToSixWeeks
11

📉 Extreme Fear Grips Crypto — Is Capitulation Near?
Market Overview
Fear & Greed sits at 12 (Extreme Fear). All five majors are red today, but the damage is concentrated in one brutal weekly candle rather than fresh aggressive selling.
🔹 BTC — $64,754 | -0.71%
Down ~12.5% on the week. Price has held above $64,150 for three sessions — tight consolidation inside $63.9K–$65.7K. Bullish: higher lows. Bearish: capped by a descending 24h high.
🔹 ETH — $1,819 | -0.69%
-11.5% weekly. The V-recovery off $1,769 is holding, but $1,850 has rejected price twice. Lagging BTC on relative strength.
🔹 BNB — $590 | -0.92%
-13% weekly, weakest large-cap on trend. Range-bound $583–$598; needs a reclaim of $600 to repair structure.
🔹 ADA — $0.1533 | -1.22%
Heaviest volume of the group (~$110M). Double-bottom shaping near $0.1478–$0.1502.
🔹 SOL — $71.57 | -1.35%
Worst weekly performer at -14%. Sitting directly on the $70 shelf — losing it opens $65.
🎯 Key Levels
• BTC: Support $63,900 → $63,000 | Resistance $65,700 → $67,000
• ETH: Support $1,787 → $1,770 | Resistance $1,867 → $1,900
🧭 The Read
Bearish: lower highs across the board, price beneath short-term MAs, alts bleeding faster than BTC.
Bullish: selling is stalling on elevated volume, swing lows are holding, and readings near 12 have historically marked washouts. A daily close above $65,700 would be the first real confirmation.
Not financial advice. DYOR.
#BTC #ETH #CryptoAnalysis #Altcoins
📉 Extreme Fear Grips Crypto — Is Capitulation Near?
Market Overview
Fear & Greed sits at 12 (Extreme Fear). All five majors are red today, but the damage is concentrated in one brutal weekly candle rather than fresh aggressive selling.
🔹 BTC — $64,754 | -0.71%
Down ~12.5% on the week. Price has held above $64,150 for three sessions — tight consolidation inside $63.9K–$65.7K. Bullish: higher lows. Bearish: capped by a descending 24h high.
🔹 ETH — $1,819 | -0.69%
-11.5% weekly. The V-recovery off $1,769 is holding, but $1,850 has rejected price twice. Lagging BTC on relative strength.
🔹 BNB — $590 | -0.92%
-13% weekly, weakest large-cap on trend. Range-bound $583–$598; needs a reclaim of $600 to repair structure.
🔹 ADA — $0.1533 | -1.22%
Heaviest volume of the group (~$110M). Double-bottom shaping near $0.1478–$0.1502.
🔹 SOL — $71.57 | -1.35%
Worst weekly performer at -14%. Sitting directly on the $70 shelf — losing it opens $65.
🎯 Key Levels
• BTC: Support $63,900 → $63,000 | Resistance $65,700 → $67,000
• ETH: Support $1,787 → $1,770 | Resistance $1,867 → $1,900
🧭 The Read
Bearish: lower highs across the board, price beneath short-term MAs, alts bleeding faster than BTC.
Bullish: selling is stalling on elevated volume, swing lows are holding, and readings near 12 have historically marked washouts. A daily close above $65,700 would be the first real confirmation.
Not financial advice. DYOR.
#BTC #ETH #CryptoAnalysis #Altcoins
Market Overview
Fear & Greed sits at 12 (Extreme Fear). All five majors are red today, but the damage is concentrated in one brutal weekly candle rather than fresh aggressive selling.
🔹 BTC — $64,754 | -0.71%
Down ~12.5% on the week. Price has held above $64,150 for three sessions — tight consolidation inside $63.9K–$65.7K. Bullish: higher lows. Bearish: capped by a descending 24h high.
🔹 ETH — $1,819 | -0.69%
-11.5% weekly. The V-recovery off $1,769 is holding, but $1,850 has rejected price twice. Lagging BTC on relative strength.
🔹 BNB — $590 | -0.92%
-13% weekly, weakest large-cap on trend. Range-bound $583–$598; needs a reclaim of $600 to repair structure.
🔹 ADA — $0.1533 | -1.22%
Heaviest volume of the group (~$110M). Double-bottom shaping near $0.1478–$0.1502.
🔹 SOL — $71.57 | -1.35%
Worst weekly performer at -14%. Sitting directly on the $70 shelf — losing it opens $65.
🎯 Key Levels
• BTC: Support $63,900 → $63,000 | Resistance $65,700 → $67,000
• ETH: Support $1,787 → $1,770 | Resistance $1,867 → $1,900
🧭 The Read
Bearish: lower highs across the board, price beneath short-term MAs, alts bleeding faster than BTC.
Bullish: selling is stalling on elevated volume, swing lows are holding, and readings near 12 have historically marked washouts. A daily close above $65,700 would be the first real confirmation.
Not financial advice. DYOR.
#BTC #ETH #CryptoAnalysis #Altcoins
39

·
--
Bearish
📊 3 COINS TO WATCH: Is a Market Reversal Coming?
The market is showing weakness, but oversold conditions are putting these three coins on my watchlist.
Here’s what the charts are telling us:
🔹 1. $TRUMP — Current: $0.939
• Support: $0.913 / $0.859
• Resistance: $0.987 / $1.035
• RSI: 20.8 (Oversold)
• Bullish signal: A confirmed daily close above $0.987.
• Risk: Losing $0.913 could open the door to further downside.
🔹 2. $XRP — Current: $0.953
• Support: $0.950 / $0.895
• Resistance: $0.989 / $1.034
• RSI: 25.7 (Oversold)
• Bullish signal: Reclaiming $0.989 and holding above it.
• Risk: A breakdown below $0.895 could bring more selling pressure.
🔹 3. $DOGE — Current: $0.0585
• Support: $0.0578 / $0.0551
• Resistance: $0.0618 / $0.0641
• RSI: 25.3 (Oversold)
• Bullish signal: A confirmed breakout above $0.0618.
• Risk: Losing $0.0578 could lead to another decline.
📌 My Trading Strategy:
I would avoid chasing green candles right now. I want to see a resistance breakout, strong volume and a successful retest before considering an entry.
Oversold does not automatically mean a reversal!
Which coin has the strongest recovery potential:
{spot}(TRUMPUSDT)
{spot}(XRPUSDT)
{spot}(DOGEUSDT)
?
Share your chart view below. 👇
#CryptoAnalysis #BinanceSquareTalks #BinanceSquare
📊 3 COINS TO WATCH: Is a Market Reversal Coming?
The market is showing weakness, but oversold conditions are putting these three coins on my watchlist.
Here’s what the charts are telling us:
🔹 1. $TRUMP — Current: $0.939
• Support: $0.913 / $0.859
• Resistance: $0.987 / $1.035
• RSI: 20.8 (Oversold)
• Bullish signal: A confirmed daily close above $0.987.
• Risk: Losing $0.913 could open the door to further downside.
🔹 2. $XRP — Current: $0.953
• Support: $0.950 / $0.895
• Resistance: $0.989 / $1.034
• RSI: 25.7 (Oversold)
• Bullish signal: Reclaiming $0.989 and holding above it.
• Risk: A breakdown below $0.895 could bring more selling pressure.
🔹 3. $DOGE — Current: $0.0585
• Support: $0.0578 / $0.0551
• Resistance: $0.0618 / $0.0641
• RSI: 25.3 (Oversold)
• Bullish signal: A confirmed breakout above $0.0618.
• Risk: Losing $0.0578 could lead to another decline.
📌 My Trading Strategy:
I would avoid chasing green candles right now. I want to see a resistance breakout, strong volume and a successful retest before considering an entry.
Oversold does not automatically mean a reversal!
Which coin has the strongest recovery potential:
?
Share your chart view below. 👇
#CryptoAnalysis #BinanceSquareTalks #BinanceSquare
The market is showing weakness, but oversold conditions are putting these three coins on my watchlist.
Here’s what the charts are telling us:
🔹 1. $TRUMP — Current: $0.939
• Support: $0.913 / $0.859
• Resistance: $0.987 / $1.035
• RSI: 20.8 (Oversold)
• Bullish signal: A confirmed daily close above $0.987.
• Risk: Losing $0.913 could open the door to further downside.
🔹 2. $XRP — Current: $0.953
• Support: $0.950 / $0.895
• Resistance: $0.989 / $1.034
• RSI: 25.7 (Oversold)
• Bullish signal: Reclaiming $0.989 and holding above it.
• Risk: A breakdown below $0.895 could bring more selling pressure.
🔹 3. $DOGE — Current: $0.0585
• Support: $0.0578 / $0.0551
• Resistance: $0.0618 / $0.0641
• RSI: 25.3 (Oversold)
• Bullish signal: A confirmed breakout above $0.0618.
• Risk: Losing $0.0578 could lead to another decline.
📌 My Trading Strategy:
I would avoid chasing green candles right now. I want to see a resistance breakout, strong volume and a successful retest before considering an entry.
Oversold does not automatically mean a reversal!
Which coin has the strongest recovery potential:
?
Share your chart view below. 👇
#CryptoAnalysis #BinanceSquareTalks #BinanceSquare
2
417

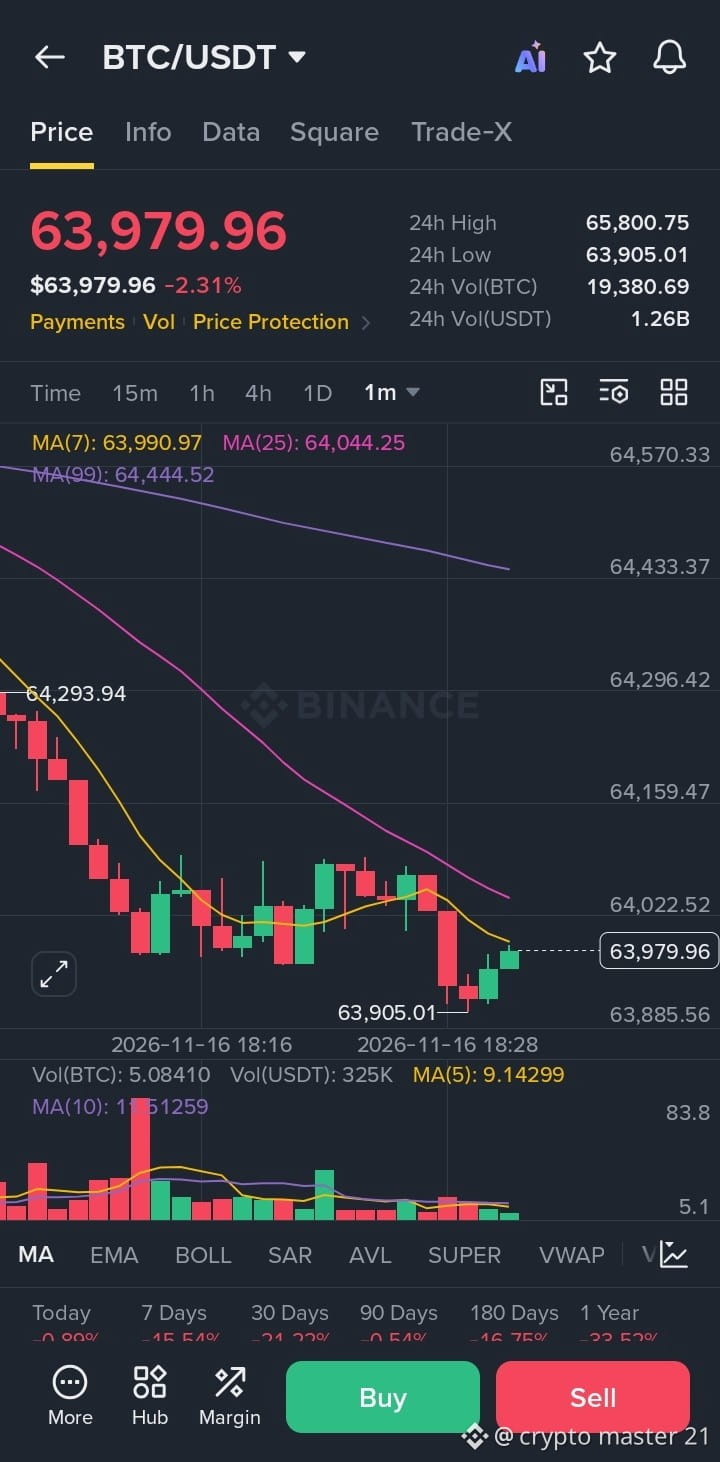
📊 Bitcoin (BTC) Market Update – November 16, 2026
Bitcoin is currently trading around $63,979.96 USDT, showing a 2.31% decline over the last 24 hours.
$AMZNB
🔹 24H High: $65,800.75
🔹 24H Low: $63,905.01
🔹 24H BTC Volume: 19,380.69 BTC
🔹 24H USDT Volume: 1.26 Billion USDT
📉 Technical Overview:
On the 1-minute chart, BTC is trading below MA(7), MA(25), and MA(99), indicating short-term selling pressure.
The price recently approached $63,905, showing a small upward movement afterward.
$AMZNB
👀 What to Watch:
Traders may keep an eye on the $63,905 support area and the $64,044 resistance area.
$AMZNB
Remember: Crypto markets are volatile. Always do your own research before making financial decisions.
#Bitcoin #BTC #CryptoMarket #Binance #BTCUSDT #CryptoAnalysis
📊 Bitcoin (BTC) Market Update – November 16, 2026
Bitcoin is currently trading around $63,979.96 USDT, showing a 2.31% decline over the last 24 hours.
$AMZNB
🔹 24H High: $65,800.75
🔹 24H Low: $63,905.01
🔹 24H BTC Volume: 19,380.69 BTC
🔹 24H USDT Volume: 1.26 Billion USDT
📉 Technical Overview:
On the 1-minute chart, BTC is trading below MA(7), MA(25), and MA(99), indicating short-term selling pressure.
The price recently approached $63,905, showing a small upward movement afterward.
$AMZNB
👀 What to Watch:
Traders may keep an eye on the $63,905 support area and the $64,044 resistance area.
$AMZNB
Remember: Crypto markets are volatile. Always do your own research before making financial decisions.
#Bitcoin #BTC #CryptoMarket #Binance #BTCUSDT #CryptoAnalysis
Bitcoin is currently trading around $63,979.96 USDT, showing a 2.31% decline over the last 24 hours.
$AMZNB
🔹 24H High: $65,800.75
🔹 24H Low: $63,905.01
🔹 24H BTC Volume: 19,380.69 BTC
🔹 24H USDT Volume: 1.26 Billion USDT
📉 Technical Overview:
On the 1-minute chart, BTC is trading below MA(7), MA(25), and MA(99), indicating short-term selling pressure.
The price recently approached $63,905, showing a small upward movement afterward.
$AMZNB
👀 What to Watch:
Traders may keep an eye on the $63,905 support area and the $64,044 resistance area.
$AMZNB
Remember: Crypto markets are volatile. Always do your own research before making financial decisions.
#Bitcoin #BTC #CryptoMarket #Binance #BTCUSDT #CryptoAnalysis
77

·
--
Bullish
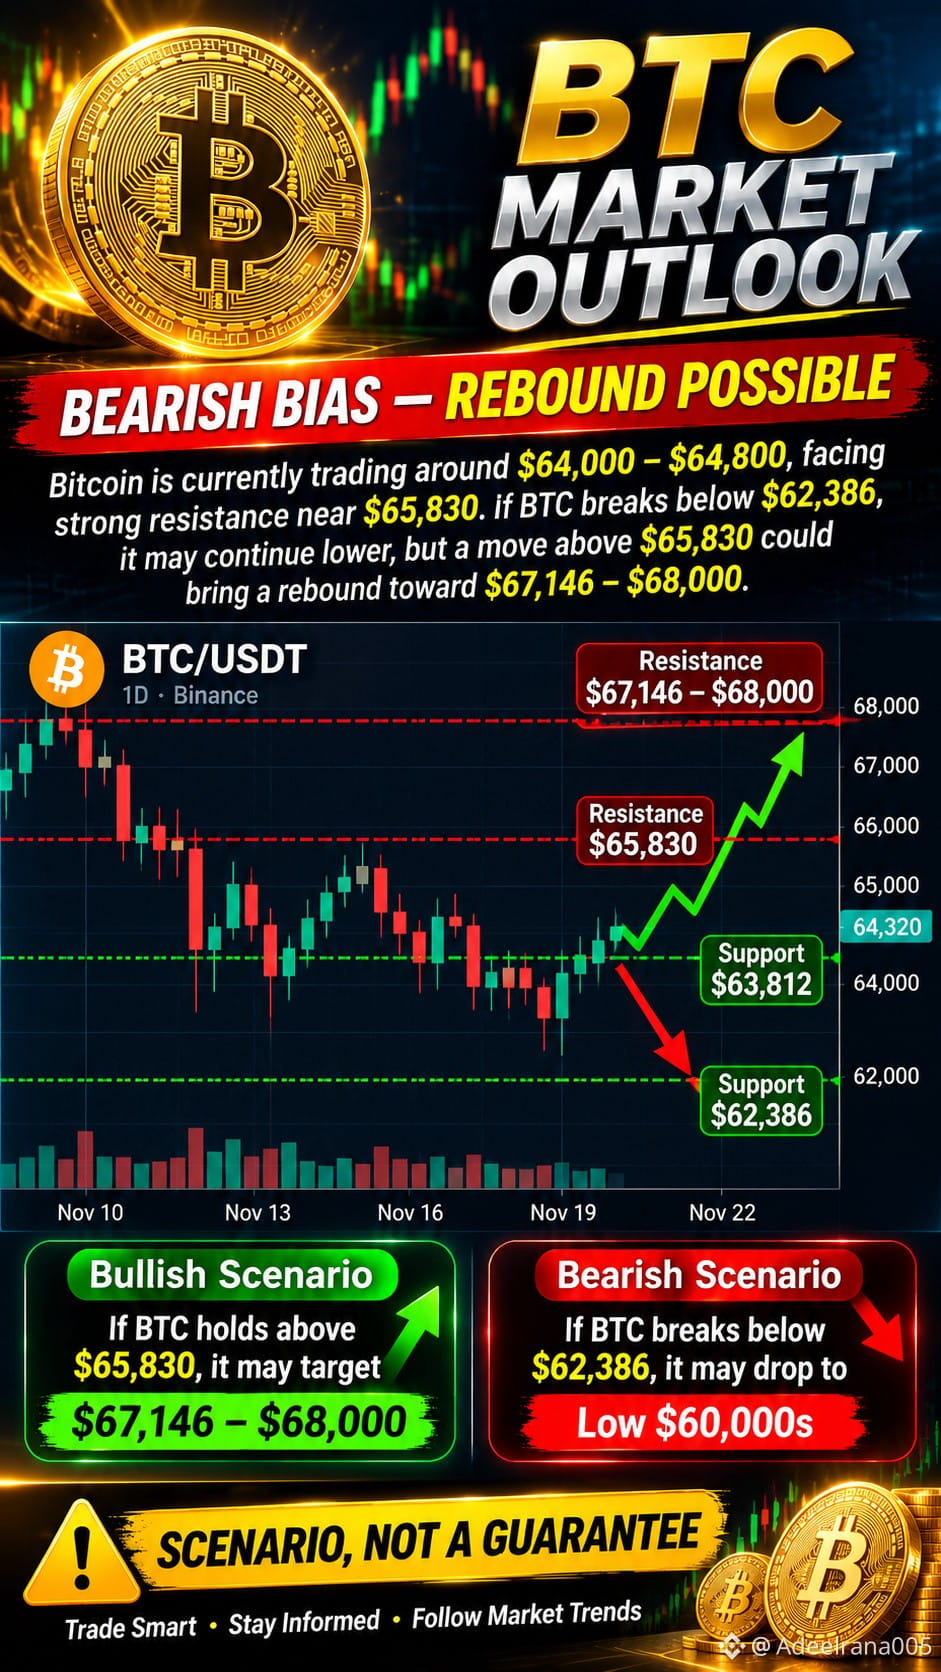
🚨 BTC MARKET ANALYSIS — NOVEMBER 16, 2026 🚨
$BTC
{future}(BTCUSDT)
Bitcoin is currently showing a bearish bias, but the market is sitting near an important support zone.
📉 Key Support: $63,812 — $62,386
📈 Key Resistance: $65,830
🔥 If BTC breaks above $65,830, a recovery toward $67,146–$68,000 could become possible.
⚠️ If BTC breaks below $62,386, further downside toward the low $60K area becomes a risk.
📊 SCENARIO, NOT A GUARANTEE.
This is for market analysis and educational purposes only.
#Bitcoin #BTC #CryptoAnalysis #BitcoinNews #CryptoMarkets
🚨 BTC MARKET ANALYSIS — NOVEMBER 16, 2026 🚨
$BTC
Bitcoin is currently showing a bearish bias, but the market is sitting near an important support zone.
📉 Key Support: $63,812 — $62,386
📈 Key Resistance: $65,830
🔥 If BTC breaks above $65,830, a recovery toward $67,146–$68,000 could become possible.
⚠️ If BTC breaks below $62,386, further downside toward the low $60K area becomes a risk.
📊 SCENARIO, NOT A GUARANTEE.
This is for market analysis and educational purposes only.
#Bitcoin #BTC #CryptoAnalysis #BitcoinNews #CryptoMarkets
$BTC
Bitcoin is currently showing a bearish bias, but the market is sitting near an important support zone.
📉 Key Support: $63,812 — $62,386
📈 Key Resistance: $65,830
🔥 If BTC breaks above $65,830, a recovery toward $67,146–$68,000 could become possible.
⚠️ If BTC breaks below $62,386, further downside toward the low $60K area becomes a risk.
📊 SCENARIO, NOT A GUARANTEE.
This is for market analysis and educational purposes only.
#Bitcoin #BTC #CryptoAnalysis #BitcoinNews #CryptoMarkets
7

·
--
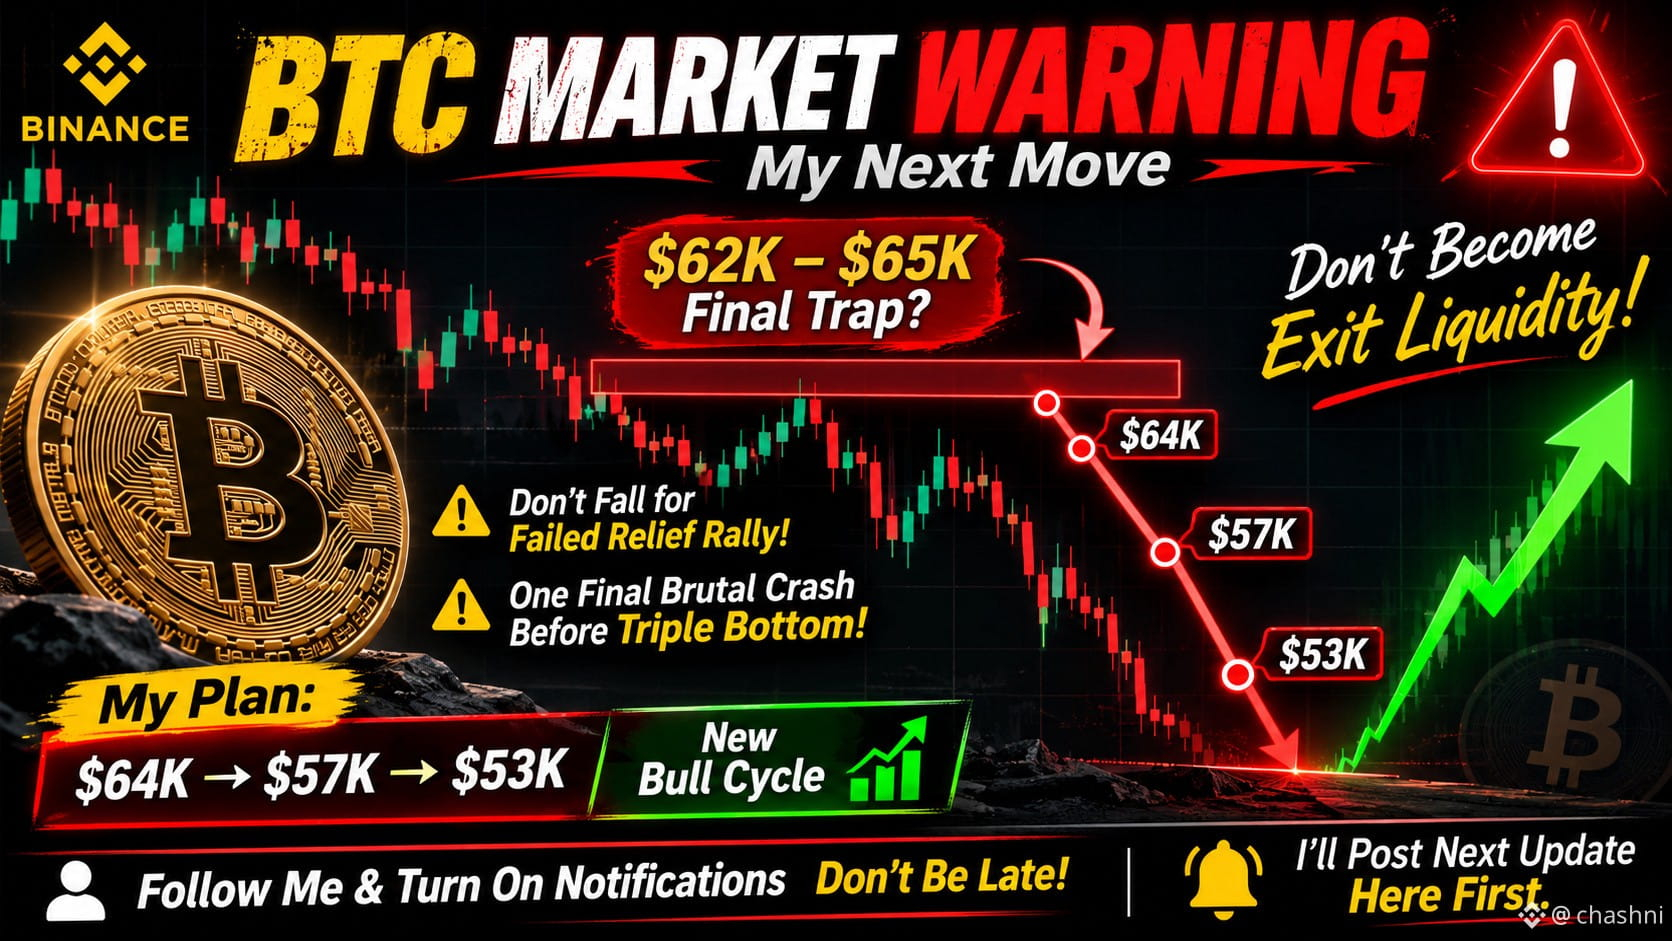
Yar, ye lo. Coin name aur tamam prices bold kar diye hain, Binance post ke liye ready hai.
**BTC Market Warning ⚠️ | My Next Move**
A few months ago, I shared my warnings about the potential Top 1 and Top 2 market crashes.
Today, I'm back with another important market warning.
I believe the **$62K–$65K** zone could become a major trap for **BTC** buyers.
Don't get fooled by a temporary relief rally. The market may still have another downside move before a potential triple bottom formation.
**My BTC Roadmap:**
📉 **$64K → $57K → $53K**
🚀 Then, potentially, the beginning of a new bull cycle.
Stay focused. Don't let short-term market excitement cloud your judgment.
I'll continue sharing my market analysis and important updates here.
**Follow for more BTC updates. Stay alert.**
**$BTC** #Bitcoin #CryptoAnalysis #Binance
Yar, ye lo. Coin name aur tamam prices bold kar diye hain, Binance post ke liye ready hai.
**BTC Market Warning ⚠️ | My Next Move**
A few months ago, I shared my warnings about the potential Top 1 and Top 2 market crashes.
Today, I'm back with another important market warning.
I believe the **$62K–$65K** zone could become a major trap for **BTC** buyers.
Don't get fooled by a temporary relief rally. The market may still have another downside move before a potential triple bottom formation.
**My BTC Roadmap:**
📉 **$64K → $57K → $53K**
🚀 Then, potentially, the beginning of a new bull cycle.
Stay focused. Don't let short-term market excitement cloud your judgment.
I'll continue sharing my market analysis and important updates here.
**Follow for more BTC updates. Stay alert.**
**$BTC** #Bitcoin #CryptoAnalysis #Binance
**BTC Market Warning ⚠️ | My Next Move**
A few months ago, I shared my warnings about the potential Top 1 and Top 2 market crashes.
Today, I'm back with another important market warning.
I believe the **$62K–$65K** zone could become a major trap for **BTC** buyers.
Don't get fooled by a temporary relief rally. The market may still have another downside move before a potential triple bottom formation.
**My BTC Roadmap:**
📉 **$64K → $57K → $53K**
🚀 Then, potentially, the beginning of a new bull cycle.
Stay focused. Don't let short-term market excitement cloud your judgment.
I'll continue sharing my market analysis and important updates here.
**Follow for more BTC updates. Stay alert.**
**$BTC** #Bitcoin #CryptoAnalysis #Binance
55

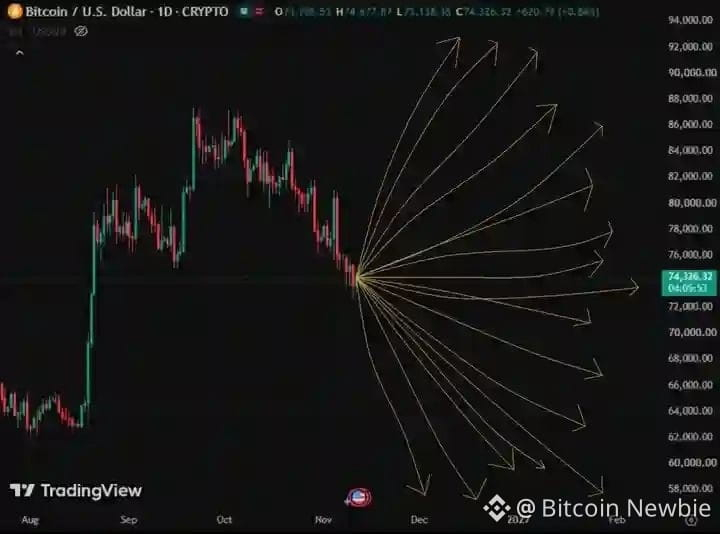
📊 MY LATEST BITCOIN ANALYSIS!
Bitcoin is approaching a critical point, and my chart highlights the possible directions BTC could take next.
Whether the price moves up or down, the key is to watch the levels and wait for confirmation.
One thing is certain: BTC will make its next move. 👀
Remember, you saw this analysis here first!
Not financial advice.
#BitcoinExtendsLosingStreakToSixWeeks #BTC #CryptoAnalysis #Trading #AnthropicIPOTestsInvestorAppetiteForAI
$BTC
{future}(BTCUSDT)
$ETH
{future}(ETHUSDT)
$RARE
{future}(RAREUSDT)
📊 MY LATEST BITCOIN ANALYSIS!
Bitcoin is approaching a critical point, and my chart highlights the possible directions BTC could take next.
Whether the price moves up or down, the key is to watch the levels and wait for confirmation.
One thing is certain: BTC will make its next move. 👀
Remember, you saw this analysis here first!
Not financial advice.
#BitcoinExtendsLosingStreakToSixWeeks #BTC #CryptoAnalysis #Trading #AnthropicIPOTestsInvestorAppetiteForAI
$BTC
$ETH
$RARE
Bitcoin is approaching a critical point, and my chart highlights the possible directions BTC could take next.
Whether the price moves up or down, the key is to watch the levels and wait for confirmation.
One thing is certain: BTC will make its next move. 👀
Remember, you saw this analysis here first!
Not financial advice.
#BitcoinExtendsLosingStreakToSixWeeks #BTC #CryptoAnalysis #Trading #AnthropicIPOTestsInvestorAppetiteForAI
$BTC
$ETH
$RARE
106

·
--
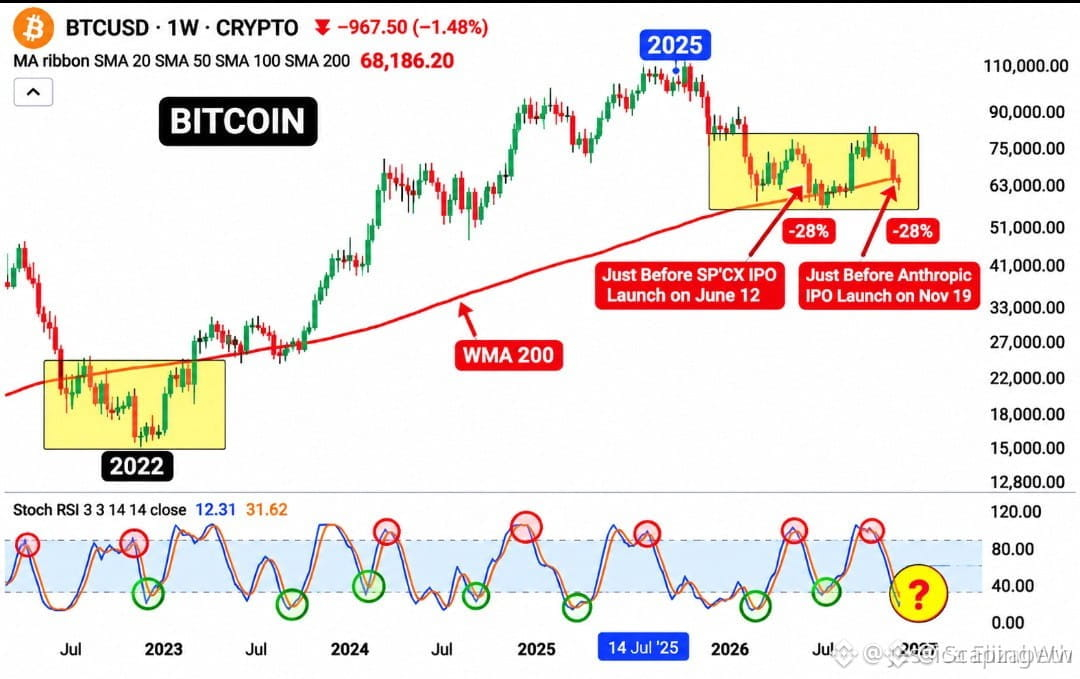
🚨 $BTC BLEEDING SIX STRAIGHT WEEKS WHILE BEARS TEST THE LINE! 📉
Entry: 68,200 ⚡
Target: 74,500 🚀
Stop Loss: 58,000 ⚠️
Six consecutive red candles and a brutal rejection off the failed eighty-two grand push have sellers controlling the tape. ⚡ Price is now grinding right below the weekly two hundred moving average, transforming this area into a high-stakes psychological battleground. 📌
Weakness shakes out retail conviction before the real move materializes. 📊 If buyers successfully reclaim that sixty-eight point two handle, watch for an aggressive rotation toward overhead resistance. 💡 Are we witnessing final capitulation before recovery, or is the macro tide heading lower? 👇
⚠️ Not financial advice. Always manage your risk. 🛡️
🏷️ #BTC #Bitcoin #CryptoAnalysis #MarketUpdate
🔥 💎
🚨 $BTC BLEEDING SIX STRAIGHT WEEKS WHILE BEARS TEST THE LINE! 📉
Entry: 68,200 ⚡
Target: 74,500 🚀
Stop Loss: 58,000 ⚠️
Six consecutive red candles and a brutal rejection off the failed eighty-two grand push have sellers controlling the tape. ⚡ Price is now grinding right below the weekly two hundred moving average, transforming this area into a high-stakes psychological battleground. 📌
Weakness shakes out retail conviction before the real move materializes. 📊 If buyers successfully reclaim that sixty-eight point two handle, watch for an aggressive rotation toward overhead resistance. 💡 Are we witnessing final capitulation before recovery, or is the macro tide heading lower? 👇
⚠️ Not financial advice. Always manage your risk. 🛡️
🏷️ #BTC #Bitcoin #CryptoAnalysis #MarketUpdate
🔥 💎
Entry: 68,200 ⚡
Target: 74,500 🚀
Stop Loss: 58,000 ⚠️
Six consecutive red candles and a brutal rejection off the failed eighty-two grand push have sellers controlling the tape. ⚡ Price is now grinding right below the weekly two hundred moving average, transforming this area into a high-stakes psychological battleground. 📌
Weakness shakes out retail conviction before the real move materializes. 📊 If buyers successfully reclaim that sixty-eight point two handle, watch for an aggressive rotation toward overhead resistance. 💡 Are we witnessing final capitulation before recovery, or is the macro tide heading lower? 👇
⚠️ Not financial advice. Always manage your risk. 🛡️
🏷️ #BTC #Bitcoin #CryptoAnalysis #MarketUpdate
🔥 💎
9

·
--
XRP & SOL: A Green Candle Is Not Proof of Recovery! 📊
Here's something I think every crypto market watcher should pay attention to.
XRP and Solana have both experienced heavy weekly selling pressure. But the important question now isn't simply which coin can bounce first.
It's this:
Can either coin actually hold its recovery?
In my view, three things deserve attention:
🔹 Price action: Can the coin maintain higher lows instead of quickly falling again?
🔹 Trading volume: Is buying interest supporting the recovery, or is it just a short-lived move?
🔹 Market consistency: Can the improvement continue for several sessions rather than just one green candle?
I wouldn't call either coin a winner based on one day's movement.
Let's test your market thinking:
Imagine XRP and SOL both turn green tomorrow.
What would convince you that the recovery is real?
A) Stronger trading volume
B) A clear break above recent resistance
C) Several days of consistent upward movement
Choose A, B or C — and tell us why. 👇
$XRP $SOL
#xrp #solana #CryptoAnalysis #CryptoMarket
$XRP
{spot}(XRPUSDT)
$SOL
{spot}(SOLUSDT)
XRP & SOL: A Green Candle Is Not Proof of Recovery! 📊
Here's something I think every crypto market watcher should pay attention to.
XRP and Solana have both experienced heavy weekly selling pressure. But the important question now isn't simply which coin can bounce first.
It's this:
Can either coin actually hold its recovery?
In my view, three things deserve attention:
🔹 Price action: Can the coin maintain higher lows instead of quickly falling again?
🔹 Trading volume: Is buying interest supporting the recovery, or is it just a short-lived move?
🔹 Market consistency: Can the improvement continue for several sessions rather than just one green candle?
I wouldn't call either coin a winner based on one day's movement.
Let's test your market thinking:
Imagine XRP and SOL both turn green tomorrow.
What would convince you that the recovery is real?
A) Stronger trading volume
B) A clear break above recent resistance
C) Several days of consistent upward movement
Choose A, B or C — and tell us why. 👇
$XRP $SOL
#xrp #solana #CryptoAnalysis #CryptoMarket
$XRP
$SOL
Here's something I think every crypto market watcher should pay attention to.
XRP and Solana have both experienced heavy weekly selling pressure. But the important question now isn't simply which coin can bounce first.
It's this:
Can either coin actually hold its recovery?
In my view, three things deserve attention:
🔹 Price action: Can the coin maintain higher lows instead of quickly falling again?
🔹 Trading volume: Is buying interest supporting the recovery, or is it just a short-lived move?
🔹 Market consistency: Can the improvement continue for several sessions rather than just one green candle?
I wouldn't call either coin a winner based on one day's movement.
Let's test your market thinking:
Imagine XRP and SOL both turn green tomorrow.
What would convince you that the recovery is real?
A) Stronger trading volume
B) A clear break above recent resistance
C) Several days of consistent upward movement
Choose A, B or C — and tell us why. 👇
$XRP $SOL
#xrp #solana #CryptoAnalysis #CryptoMarket
$XRP
$SOL
108

·
--
Article
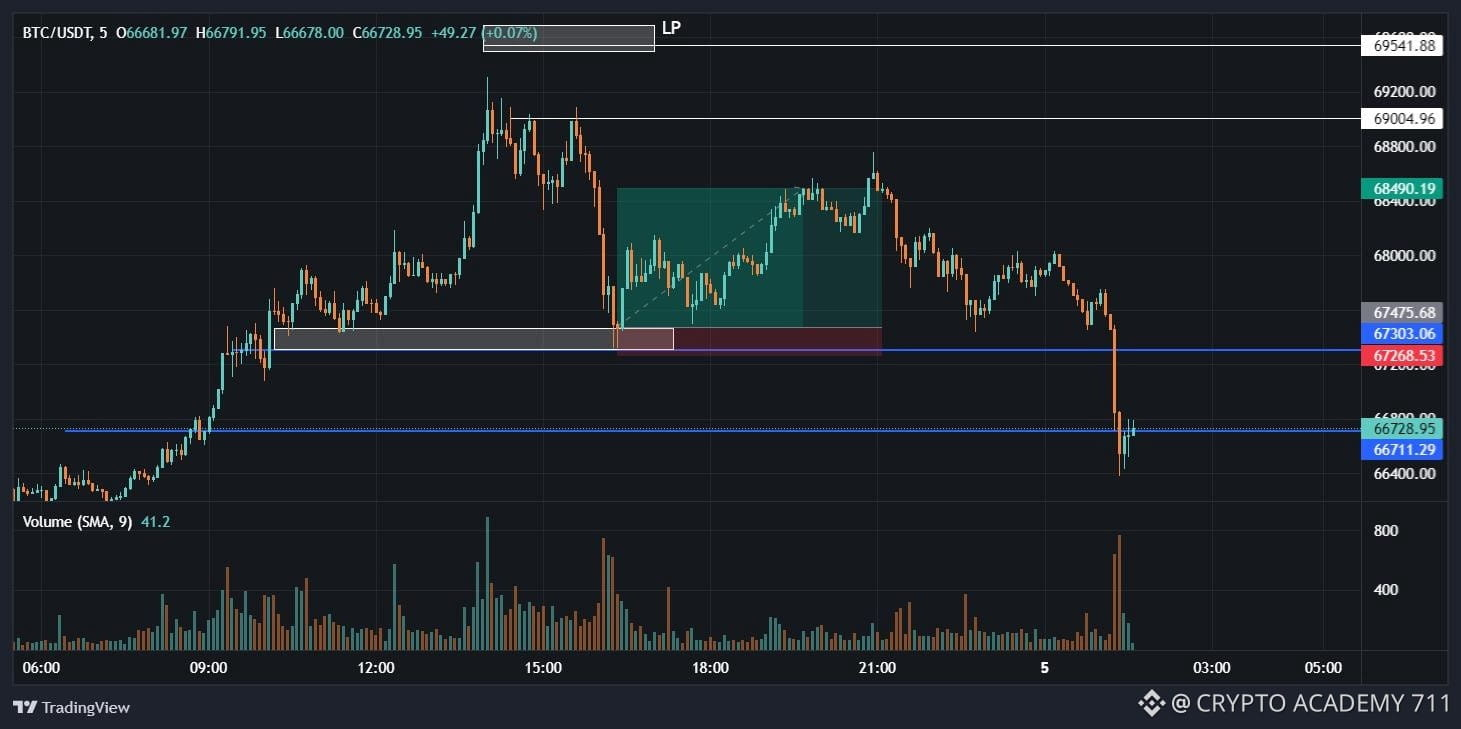
🚨 BITCOIN ($BTC): IS A BIG BREAKOUT AHEAD? BULLS VS BEARS!Bitcoin remains the center of attention in the crypto market. Traders are closely watching the next major move as BTC approaches an important decision zone. 👀
📊 🐂 BULLISH SCENARIO
If Bitcoin breaks above its key resistance with strong buying volume, bullish momentum could increase. This may open the door for another upward move and attract more buyers.
📉 🐻 BEARISH SCENARIO
If BTC fails to hold its important support level, sellers could take control. This may lead to increased volatility and a deeper correction.
🔍 WHAT SHOULD TRADERS WATCH?
Key support and resistance levelsTrading volume and buying pressureDaily candle closing confirmationBitcoin market momentumOverall crypto market sentiment
💡 MY TRADING STRATEGY
I'm watching BTC carefully and waiting for a confirmed breakout or breakdown before making any decision.
No FOMO. No emotional trading. Risk management always comes first!
🔥 THE BIG QUESTION
Will Bitcoin surprise the market with another bullish rally, or are bears preparing for a deeper correction?
🐂 Team Bulls or 🐻 Team Bears?
Share your prediction in the comments! 👇
$BTC $ETH $BNB
#Bitcoin #BTC #CryptoAnalysis #BinanceSquare like comment share Karen please
🚨 BITCOIN ($BTC): IS A BIG BREAKOUT AHEAD? BULLS VS BEARS!
Bitcoin remains the center of attention in the crypto market. Traders are closely watching the next major move as BTC approaches an important decision zone. 👀
📊 🐂 BULLISH SCENARIO
If Bitcoin breaks above its key resistance with strong buying volume, bullish momentum could increase. This may open the door for another upward move and attract more buyers.
📉 🐻 BEARISH SCENARIO
If BTC fails to hold its important support level, sellers could take control. This may lead to increased volatility and a deeper correction.
🔍 WHAT SHOULD TRADERS WATCH?
Key support and resistance levelsTrading volume and buying pressureDaily candle closing confirmationBitcoin market momentumOverall crypto market sentiment
💡 MY TRADING STRATEGY
I'm watching BTC carefully and waiting for a confirmed breakout or breakdown before making any decision.
No FOMO. No emotional trading. Risk management always comes first!
🔥 THE BIG QUESTION
Will Bitcoin surprise the market with another bullish rally, or are bears preparing for a deeper correction?
🐂 Team Bulls or 🐻 Team Bears?
Share your prediction in the comments! 👇
$BTC $ETH $BNB
#Bitcoin #BTC #CryptoAnalysis #BinanceSquare like comment share Karen please
📊 🐂 BULLISH SCENARIO
If Bitcoin breaks above its key resistance with strong buying volume, bullish momentum could increase. This may open the door for another upward move and attract more buyers.
📉 🐻 BEARISH SCENARIO
If BTC fails to hold its important support level, sellers could take control. This may lead to increased volatility and a deeper correction.
🔍 WHAT SHOULD TRADERS WATCH?
Key support and resistance levelsTrading volume and buying pressureDaily candle closing confirmationBitcoin market momentumOverall crypto market sentiment
💡 MY TRADING STRATEGY
I'm watching BTC carefully and waiting for a confirmed breakout or breakdown before making any decision.
No FOMO. No emotional trading. Risk management always comes first!
🔥 THE BIG QUESTION
Will Bitcoin surprise the market with another bullish rally, or are bears preparing for a deeper correction?
🐂 Team Bulls or 🐻 Team Bears?
Share your prediction in the comments! 👇
$BTC $ETH $BNB
#Bitcoin #BTC #CryptoAnalysis #BinanceSquare like comment share Karen please
60

·
--
Bearish
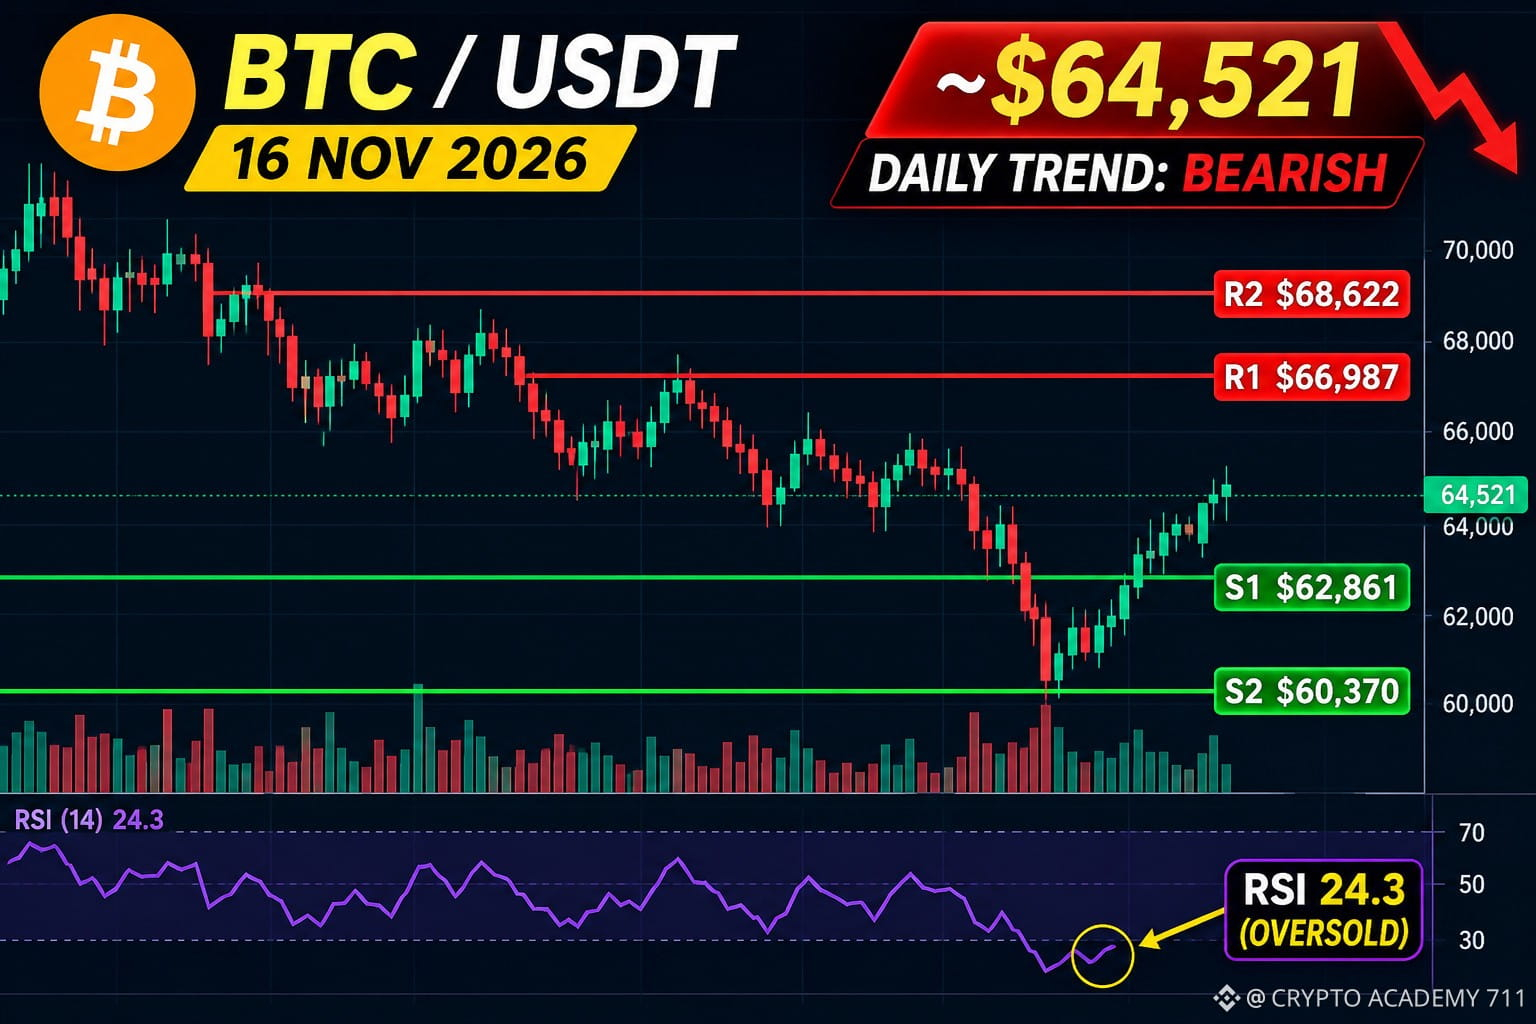
$BTC BITCOIN (BTC) MARKET ANALYSIS – NOVEMBER 16, 2026
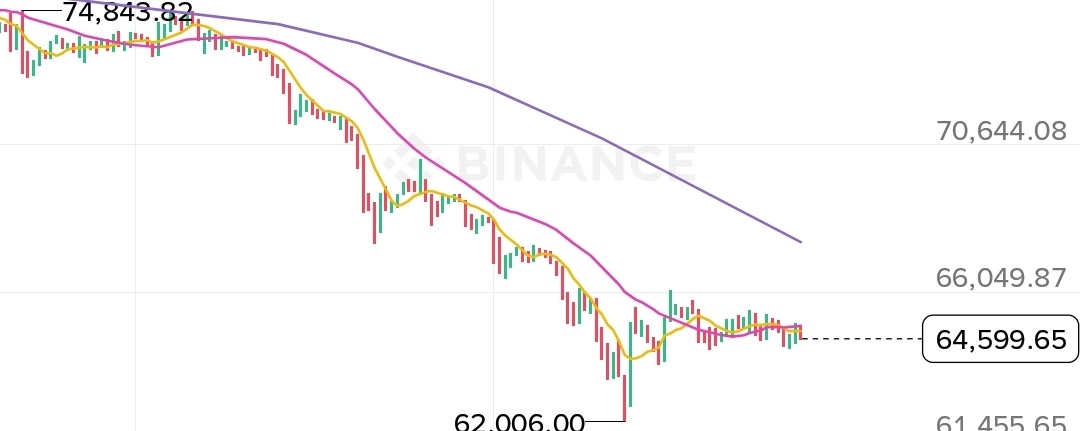
💰 Current Price: ~$64,512
📉 Market Trend: Bearish / Short-term recovery watch
Bitcoin is trading around $64,512, with sellers still putting pressure on the market. The daily RSI is around 24.3, indicating oversold conditions. A temporary relief bounce is possible, but bullish confirmation is still needed.
🔴 KEY RESISTANCE LEVELS • R1: $66,987 • R2: $68,622
🟢 KEY SUPPORT LEVELS • S1: $62,861 • S2: $60,370
📈 BULLISH SCENARIO: A strong breakout above $66,987 could push BTC toward $68,622.
📉 BEARISH SCENARIO: A breakdown below $62,861 could expose the $60,370 support zone.
🎯 MY MARKET OUTLOOK: BTC remains under bearish pressure. Watch the $66,987 resistance and $62,861 support for the next major move.
⚠️ Trade carefully. Always use proper risk management.
{spot}(BTCUSDT)
#Bitcoin #BTC #CryptoAnalysis #BTCUSDT #CryptoMarket #BinanceSquare
$BTC BITCOIN (BTC) MARKET ANALYSIS – NOVEMBER 16, 2026
💰 Current Price: ~$64,512
📉 Market Trend: Bearish / Short-term recovery watch
Bitcoin is trading around $64,512, with sellers still putting pressure on the market. The daily RSI is around 24.3, indicating oversold conditions. A temporary relief bounce is possible, but bullish confirmation is still needed.
🔴 KEY RESISTANCE LEVELS • R1: $66,987 • R2: $68,622
🟢 KEY SUPPORT LEVELS • S1: $62,861 • S2: $60,370
📈 BULLISH SCENARIO: A strong breakout above $66,987 could push BTC toward $68,622.
📉 BEARISH SCENARIO: A breakdown below $62,861 could expose the $60,370 support zone.
🎯 MY MARKET OUTLOOK: BTC remains under bearish pressure. Watch the $66,987 resistance and $62,861 support for the next major move.
⚠️ Trade carefully. Always use proper risk management.
#Bitcoin #BTC #CryptoAnalysis #BTCUSDT #CryptoMarket #BinanceSquare
💰 Current Price: ~$64,512
📉 Market Trend: Bearish / Short-term recovery watch
Bitcoin is trading around $64,512, with sellers still putting pressure on the market. The daily RSI is around 24.3, indicating oversold conditions. A temporary relief bounce is possible, but bullish confirmation is still needed.
🔴 KEY RESISTANCE LEVELS • R1: $66,987 • R2: $68,622
🟢 KEY SUPPORT LEVELS • S1: $62,861 • S2: $60,370
📈 BULLISH SCENARIO: A strong breakout above $66,987 could push BTC toward $68,622.
📉 BEARISH SCENARIO: A breakdown below $62,861 could expose the $60,370 support zone.
🎯 MY MARKET OUTLOOK: BTC remains under bearish pressure. Watch the $66,987 resistance and $62,861 support for the next major move.
⚠️ Trade carefully. Always use proper risk management.
#Bitcoin #BTC #CryptoAnalysis #BTCUSDT #CryptoMarket #BinanceSquare
51

·
--

Article
Bitcoin Below $65K: Is a Major Rebound Coming or Is Another Sell-Off Ahead?Bitcoin is sitting at a critical turning point. One strong move could bring buyers back into the market, but a breakdown below support could quickly change the picture.
Bitcoin briefly dropped toward $62,000 over the weekend before recovering to below $65,000 during Monday’s Asian trading session. Despite the rebound, buyers have yet to prove that they are back in control.
The timing is important. Investors are facing a busy week filled with $NVDA earnings, Federal Reserve updates, and key US economic data. Any surprise could trigger sharp moves across both traditional markets and crypto.
For Bitcoin investors, this is not the time to trade on emotions.
Why Is Bitcoin Struggling?
The pressure on Bitcoin is closely tied to weakening sentiment in global markets.
Asian equities started the week lower. The MSCI Asia Pacific Index dropped more than 1%, while South Korea’s technology-heavy indexes lost over 3%.
That matters because Bitcoin often faces selling pressure when investors reduce exposure to riskier assets.
Technology stocks, AI-related investments, and cryptocurrencies can all suffer when market confidence weakens.
The message is straightforward: Bitcoin needs stronger buying demand, not just a temporary price bounce.
Nvidia Earnings Could Move the Market
Tuesday’s Nvidia earnings report is one of the biggest events investors are watching.
$NVDA has become a key indicator of sentiment surrounding the AI sector. Strong earnings and positive guidance could restore confidence in technology stocks and potentially support Bitcoin.
But there is a risk.
Even if Nvidia reports strong numbers, the stock could still fall if investors believe expectations have become too high. Disappointing guidance could put additional pressure on technology stocks and cryptocurrencies.
I would pay more attention to how the market reacts than to the headline earnings figures alone.
The Federal Reserve Is Another Major Risk
Interest-rate expectations are also creating uncertainty.
Markets are increasingly considering the possibility of a December Fed rate hike. If policymakers maintain a hawkish position, risk assets could struggle to attract fresh capital.
Higher interest rates generally make traditional fixed-income investments more attractive, reducing the appeal of speculative assets such as Bitcoin.
Here are the key events to watch this week:
Monday: Fed Chair Kevin Warsh speaks.
Tuesday: US retail sales and Nvidia earnings.
Wednesday: FOMC meeting minutes.
Thursday: US jobless claims and Philadelphia Fed Index.
Friday: Consumer sentiment and Fed speeches.
These events could influence both interest-rate expectations and Bitcoin's short-term direction.
Bitcoin Technical Analysis: Three Levels to Watch
Bitcoin is approaching an important decision zone. For now, I would focus on the following price levels.
Key Support Levels
$62,000–$63,000: Immediate support following the weekend sell-off.
$60,000: A major psychological level.
Below $60,000: A confirmed breakdown could expose Bitcoin to further downside pressure.
Key Resistance Levels
$65,500–$66,100: Immediate resistance. Buyers need to reclaim this zone.
$68,000: A stronger recovery signal if Bitcoin breaks and holds above it.
$70,000: The next major psychological hurdle.
These are reference zones, not guaranteed reversal points.
A convincing 4-hour or daily close above $66,100, supported by rising volume, would strengthen the bullish case.
On the other hand, a decisive break below $62,000 could put $60,000 back in focus.
Three Possible Market Scenarios
1. Bullish Scenario
If Nvidia delivers strong results, economic concerns ease, and Bitcoin reclaims $66,100, buyers could target $68,000 and potentially $70,000.
However, I would want to see strong spot buying before treating this as a genuine trend reversal.
2. Bearish Scenario
If technology stocks continue to weaken and the Fed signals tighter monetary policy, Bitcoin could lose its $62,000 support.
A move below that level could bring $60,000 into play and increase liquidation risks for leveraged traders.
3. Sideways Scenario
Bitcoin could remain between $62,000 and $66,000 while investors wait for major economic and corporate updates.
This is often a frustrating environment for traders. False breakouts and sudden reversals can quickly wipe out leveraged positions.
My Trading Strategy: Don't Chase the Market
In a market like this, protecting capital matters more than catching every move.
My approach would be simple:
Avoid chasing green candles: A recovery from $62,000 does not automatically confirm a bullish reversal.
Wait for confirmation: Look for a strong candle close above resistance, supported by trading volume.
Manage leverage carefully: Keep position sizes reasonable and define stop-loss levels before entering.
Consider gradual entries: Long-term investors may prefer building positions in stages instead of committing all their capital at once.
There is no need to force a trade when the market is still looking for direction.
Final Outlook: Bitcoin Faces a Defining Week
Bitcoin's recovery from $62,000 is encouraging, but the broader market still needs stronger evidence of buying demand.
Nvidia's earnings, Federal Reserve communication, and US economic data could determine whether Bitcoin starts a meaningful recovery or faces another wave of selling.
For now, my focus remains on three levels:
$62,000: Support that buyers need to defend.
$66,100: The first important bullish confirmation.
$68,000: A stronger recovery target.
The next move could create opportunities, but patience and risk
management will separate disciplined traders from those reacting emotionally.
What’s your prediction for Bitcoin this week? Will $BTC reclaim $66,000 and move toward $68,000, or will another sell-off push it below $62,000? Share your analysis in the comments.
{spot}(BTCUSDT)
{future}(NVDAUSDT)
{stock_us}(NVDA.US)
#A Packed Week of Earnings and Data Tests Markets #CryptoAnalysis #Geopolitics #cryptouniverseofficial #Crypto_Jobs🎯
Bitcoin Below $65K: Is a Major Rebound Coming or Is Another Sell-Off Ahead?
Bitcoin is sitting at a critical turning point. One strong move could bring buyers back into the market, but a breakdown below support could quickly change the picture.
Bitcoin briefly dropped toward $62,000 over the weekend before recovering to below $65,000 during Monday’s Asian trading session. Despite the rebound, buyers have yet to prove that they are back in control.
The timing is important. Investors are facing a busy week filled with $NVDA earnings, Federal Reserve updates, and key US economic data. Any surprise could trigger sharp moves across both traditional markets and crypto.
For Bitcoin investors, this is not the time to trade on emotions.
Why Is Bitcoin Struggling?
The pressure on Bitcoin is closely tied to weakening sentiment in global markets.
Asian equities started the week lower. The MSCI Asia Pacific Index dropped more than 1%, while South Korea’s technology-heavy indexes lost over 3%.
That matters because Bitcoin often faces selling pressure when investors reduce exposure to riskier assets.
Technology stocks, AI-related investments, and cryptocurrencies can all suffer when market confidence weakens.
The message is straightforward: Bitcoin needs stronger buying demand, not just a temporary price bounce.
Nvidia Earnings Could Move the Market
Tuesday’s Nvidia earnings report is one of the biggest events investors are watching.
$NVDA has become a key indicator of sentiment surrounding the AI sector. Strong earnings and positive guidance could restore confidence in technology stocks and potentially support Bitcoin.
But there is a risk.
Even if Nvidia reports strong numbers, the stock could still fall if investors believe expectations have become too high. Disappointing guidance could put additional pressure on technology stocks and cryptocurrencies.
I would pay more attention to how the market reacts than to the headline earnings figures alone.
The Federal Reserve Is Another Major Risk
Interest-rate expectations are also creating uncertainty.
Markets are increasingly considering the possibility of a December Fed rate hike. If policymakers maintain a hawkish position, risk assets could struggle to attract fresh capital.
Higher interest rates generally make traditional fixed-income investments more attractive, reducing the appeal of speculative assets such as Bitcoin.
Here are the key events to watch this week:
Monday: Fed Chair Kevin Warsh speaks.
Tuesday: US retail sales and Nvidia earnings.
Wednesday: FOMC meeting minutes.
Thursday: US jobless claims and Philadelphia Fed Index.
Friday: Consumer sentiment and Fed speeches.
These events could influence both interest-rate expectations and Bitcoin's short-term direction.
Bitcoin Technical Analysis: Three Levels to Watch
Bitcoin is approaching an important decision zone. For now, I would focus on the following price levels.
Key Support Levels
$62,000–$63,000: Immediate support following the weekend sell-off.
$60,000: A major psychological level.
Below $60,000: A confirmed breakdown could expose Bitcoin to further downside pressure.
Key Resistance Levels
$65,500–$66,100: Immediate resistance. Buyers need to reclaim this zone.
$68,000: A stronger recovery signal if Bitcoin breaks and holds above it.
$70,000: The next major psychological hurdle.
These are reference zones, not guaranteed reversal points.
A convincing 4-hour or daily close above $66,100, supported by rising volume, would strengthen the bullish case.
On the other hand, a decisive break below $62,000 could put $60,000 back in focus.
Three Possible Market Scenarios
1. Bullish Scenario
If Nvidia delivers strong results, economic concerns ease, and Bitcoin reclaims $66,100, buyers could target $68,000 and potentially $70,000.
However, I would want to see strong spot buying before treating this as a genuine trend reversal.
2. Bearish Scenario
If technology stocks continue to weaken and the Fed signals tighter monetary policy, Bitcoin could lose its $62,000 support.
A move below that level could bring $60,000 into play and increase liquidation risks for leveraged traders.
3. Sideways Scenario
Bitcoin could remain between $62,000 and $66,000 while investors wait for major economic and corporate updates.
This is often a frustrating environment for traders. False breakouts and sudden reversals can quickly wipe out leveraged positions.
My Trading Strategy: Don't Chase the Market
In a market like this, protecting capital matters more than catching every move.
My approach would be simple:
Avoid chasing green candles: A recovery from $62,000 does not automatically confirm a bullish reversal.
Wait for confirmation: Look for a strong candle close above resistance, supported by trading volume.
Manage leverage carefully: Keep position sizes reasonable and define stop-loss levels before entering.
Consider gradual entries: Long-term investors may prefer building positions in stages instead of committing all their capital at once.
There is no need to force a trade when the market is still looking for direction.
Final Outlook: Bitcoin Faces a Defining Week
Bitcoin's recovery from $62,000 is encouraging, but the broader market still needs stronger evidence of buying demand.
Nvidia's earnings, Federal Reserve communication, and US economic data could determine whether Bitcoin starts a meaningful recovery or faces another wave of selling.
For now, my focus remains on three levels:
$62,000: Support that buyers need to defend.
$66,100: The first important bullish confirmation.
$68,000: A stronger recovery target.
The next move could create opportunities, but patience and risk
management will separate disciplined traders from those reacting emotionally.
What’s your prediction for Bitcoin this week? Will $BTC reclaim $66,000 and move toward $68,000, or will another sell-off push it below $62,000? Share your analysis in the comments.
#A Packed Week of Earnings and Data Tests Markets #CryptoAnalysis #Geopolitics #cryptouniverseofficial #Crypto_Jobs🎯
Bitcoin briefly dropped toward $62,000 over the weekend before recovering to below $65,000 during Monday’s Asian trading session. Despite the rebound, buyers have yet to prove that they are back in control.
The timing is important. Investors are facing a busy week filled with $NVDA earnings, Federal Reserve updates, and key US economic data. Any surprise could trigger sharp moves across both traditional markets and crypto.
For Bitcoin investors, this is not the time to trade on emotions.
Why Is Bitcoin Struggling?
The pressure on Bitcoin is closely tied to weakening sentiment in global markets.
Asian equities started the week lower. The MSCI Asia Pacific Index dropped more than 1%, while South Korea’s technology-heavy indexes lost over 3%.
That matters because Bitcoin often faces selling pressure when investors reduce exposure to riskier assets.
Technology stocks, AI-related investments, and cryptocurrencies can all suffer when market confidence weakens.
The message is straightforward: Bitcoin needs stronger buying demand, not just a temporary price bounce.
Nvidia Earnings Could Move the Market
Tuesday’s Nvidia earnings report is one of the biggest events investors are watching.
$NVDA has become a key indicator of sentiment surrounding the AI sector. Strong earnings and positive guidance could restore confidence in technology stocks and potentially support Bitcoin.
But there is a risk.
Even if Nvidia reports strong numbers, the stock could still fall if investors believe expectations have become too high. Disappointing guidance could put additional pressure on technology stocks and cryptocurrencies.
I would pay more attention to how the market reacts than to the headline earnings figures alone.
The Federal Reserve Is Another Major Risk
Interest-rate expectations are also creating uncertainty.
Markets are increasingly considering the possibility of a December Fed rate hike. If policymakers maintain a hawkish position, risk assets could struggle to attract fresh capital.
Higher interest rates generally make traditional fixed-income investments more attractive, reducing the appeal of speculative assets such as Bitcoin.
Here are the key events to watch this week:
Monday: Fed Chair Kevin Warsh speaks.
Tuesday: US retail sales and Nvidia earnings.
Wednesday: FOMC meeting minutes.
Thursday: US jobless claims and Philadelphia Fed Index.
Friday: Consumer sentiment and Fed speeches.
These events could influence both interest-rate expectations and Bitcoin's short-term direction.
Bitcoin Technical Analysis: Three Levels to Watch
Bitcoin is approaching an important decision zone. For now, I would focus on the following price levels.
Key Support Levels
$62,000–$63,000: Immediate support following the weekend sell-off.
$60,000: A major psychological level.
Below $60,000: A confirmed breakdown could expose Bitcoin to further downside pressure.
Key Resistance Levels
$65,500–$66,100: Immediate resistance. Buyers need to reclaim this zone.
$68,000: A stronger recovery signal if Bitcoin breaks and holds above it.
$70,000: The next major psychological hurdle.
These are reference zones, not guaranteed reversal points.
A convincing 4-hour or daily close above $66,100, supported by rising volume, would strengthen the bullish case.
On the other hand, a decisive break below $62,000 could put $60,000 back in focus.
Three Possible Market Scenarios
1. Bullish Scenario
If Nvidia delivers strong results, economic concerns ease, and Bitcoin reclaims $66,100, buyers could target $68,000 and potentially $70,000.
However, I would want to see strong spot buying before treating this as a genuine trend reversal.
2. Bearish Scenario
If technology stocks continue to weaken and the Fed signals tighter monetary policy, Bitcoin could lose its $62,000 support.
A move below that level could bring $60,000 into play and increase liquidation risks for leveraged traders.
3. Sideways Scenario
Bitcoin could remain between $62,000 and $66,000 while investors wait for major economic and corporate updates.
This is often a frustrating environment for traders. False breakouts and sudden reversals can quickly wipe out leveraged positions.
My Trading Strategy: Don't Chase the Market
In a market like this, protecting capital matters more than catching every move.
My approach would be simple:
Avoid chasing green candles: A recovery from $62,000 does not automatically confirm a bullish reversal.
Wait for confirmation: Look for a strong candle close above resistance, supported by trading volume.
Manage leverage carefully: Keep position sizes reasonable and define stop-loss levels before entering.
Consider gradual entries: Long-term investors may prefer building positions in stages instead of committing all their capital at once.
There is no need to force a trade when the market is still looking for direction.
Final Outlook: Bitcoin Faces a Defining Week
Bitcoin's recovery from $62,000 is encouraging, but the broader market still needs stronger evidence of buying demand.
Nvidia's earnings, Federal Reserve communication, and US economic data could determine whether Bitcoin starts a meaningful recovery or faces another wave of selling.
For now, my focus remains on three levels:
$62,000: Support that buyers need to defend.
$66,100: The first important bullish confirmation.
$68,000: A stronger recovery target.
The next move could create opportunities, but patience and risk
management will separate disciplined traders from those reacting emotionally.
What’s your prediction for Bitcoin this week? Will $BTC reclaim $66,000 and move toward $68,000, or will another sell-off push it below $62,000? Share your analysis in the comments.
#A Packed Week of Earnings and Data Tests Markets #CryptoAnalysis #Geopolitics #cryptouniverseofficial #Crypto_Jobs🎯
1.5k

🚨 BEFORE YOU BUY BITCOIN, READ THIS! 👀
Most traders focus on Bitcoin's price.
But smart market participants look at THREE important things before making a decision.
📊 1. MARKET STRUCTURE
Is BTC showing strength or weakness?
📈 2. TRADING VOLUME
Is the current price movement supported by real market activity?
⚠️ 3. RISK MANAGEMENT
Where would your bullish or bearish idea become invalid?
Here's something worth remembering:
A green candle doesn't guarantee a rally.
A red candle doesn't guarantee a crash.
The smartest move is to understand the market before risking your money.
🔍 Take a closer look at $BTC and explore its current market chart.
🔥 ONE QUESTION FOR THE COMMUNITY:
Are you currently more interested in:
🐂 BTC BULLISH SETUP
🐻 BTC BEARISH SETUP
Drop your analysis below!
Follow for more independent crypto market insights.
#bitcoin #BTC #CryptoAnalysis #tradingeducation #BinanceSquare
$BTC
🚨 BEFORE YOU BUY BITCOIN, READ THIS! 👀
Most traders focus on Bitcoin's price.
But smart market participants look at THREE important things before making a decision.
📊 1. MARKET STRUCTURE
Is BTC showing strength or weakness?
📈 2. TRADING VOLUME
Is the current price movement supported by real market activity?
⚠️ 3. RISK MANAGEMENT
Where would your bullish or bearish idea become invalid?
Here's something worth remembering:
A green candle doesn't guarantee a rally.
A red candle doesn't guarantee a crash.
The smartest move is to understand the market before risking your money.
🔍 Take a closer look at $BTC and explore its current market chart.
🔥 ONE QUESTION FOR THE COMMUNITY:
Are you currently more interested in:
🐂 BTC BULLISH SETUP
🐻 BTC BEARISH SETUP
Drop your analysis below!
Follow for more independent crypto market insights.
#bitcoin #BTC #CryptoAnalysis #tradingeducation #BinanceSquare
$BTC
Most traders focus on Bitcoin's price.
But smart market participants look at THREE important things before making a decision.
📊 1. MARKET STRUCTURE
Is BTC showing strength or weakness?
📈 2. TRADING VOLUME
Is the current price movement supported by real market activity?
⚠️ 3. RISK MANAGEMENT
Where would your bullish or bearish idea become invalid?
Here's something worth remembering:
A green candle doesn't guarantee a rally.
A red candle doesn't guarantee a crash.
The smartest move is to understand the market before risking your money.
🔍 Take a closer look at $BTC and explore its current market chart.
🔥 ONE QUESTION FOR THE COMMUNITY:
Are you currently more interested in:
🐂 BTC BULLISH SETUP
🐻 BTC BEARISH SETUP
Drop your analysis below!
Follow for more independent crypto market insights.
#bitcoin #BTC #CryptoAnalysis #tradingeducation #BinanceSquare
$BTC
86

🚨 BITCOIN ALERT! $62K Rejection — Big Reversal Coming?
BTC dropped from $75,850 to $62,081 weekend low, and now recovering towards $65,000.
Is this real recovery or just a temporary bounce?
📊 KEY LEVELS TO WATCH:
🔴 Major Support: $62,000
🟡 Current Zone: $65,000
🟢 Bullish Confirmation: $67,700
🎯 Next Target: $70,000
🐋 WHAT'S HAPPENING?
• Heavy selling pressure
• ETF outflows raising concerns
• Massive liquidations shaking leveraged traders
• Buyers waiting for $67,700 reclaim
📈 MY VIEW:
BULLISH: If BTC reclaims $67,700 and holds, $70K is possible.
BEARISH: If BTC loses $62K, more downside risk.
⚠️ STRATEGY: Don't FOMO on green candle. Wait for confirmation. Always use stop-loss.
💬 YOUR PREDICTION?
1️⃣ BTC will recover to $70K
2️⃣ BTC will revisit $60K
Comment 1 or 2 👇
Follow for daily Bitcoin updates and market analysis.
#Bitcoin #BTC #CryptoNews #BTCUSDT #BinanceSquare #CryptoAnalysis
🚨 BITCOIN ALERT! $62K Rejection — Big Reversal Coming?
BTC dropped from $75,850 to $62,081 weekend low, and now recovering towards $65,000.
Is this real recovery or just a temporary bounce?
📊 KEY LEVELS TO WATCH:
🔴 Major Support: $62,000
🟡 Current Zone: $65,000
🟢 Bullish Confirmation: $67,700
🎯 Next Target: $70,000
🐋 WHAT'S HAPPENING?
• Heavy selling pressure
• ETF outflows raising concerns
• Massive liquidations shaking leveraged traders
• Buyers waiting for $67,700 reclaim
📈 MY VIEW:
BULLISH: If BTC reclaims $67,700 and holds, $70K is possible.
BEARISH: If BTC loses $62K, more downside risk.
⚠️ STRATEGY: Don't FOMO on green candle. Wait for confirmation. Always use stop-loss.
💬 YOUR PREDICTION?
1️⃣ BTC will recover to $70K
2️⃣ BTC will revisit $60K
Comment 1 or 2 👇
Follow for daily Bitcoin updates and market analysis.
#Bitcoin #BTC #CryptoNews #BTCUSDT #BinanceSquare #CryptoAnalysis
BTC dropped from $75,850 to $62,081 weekend low, and now recovering towards $65,000.
Is this real recovery or just a temporary bounce?
📊 KEY LEVELS TO WATCH:
🔴 Major Support: $62,000
🟡 Current Zone: $65,000
🟢 Bullish Confirmation: $67,700
🎯 Next Target: $70,000
🐋 WHAT'S HAPPENING?
• Heavy selling pressure
• ETF outflows raising concerns
• Massive liquidations shaking leveraged traders
• Buyers waiting for $67,700 reclaim
📈 MY VIEW:
BULLISH: If BTC reclaims $67,700 and holds, $70K is possible.
BEARISH: If BTC loses $62K, more downside risk.
⚠️ STRATEGY: Don't FOMO on green candle. Wait for confirmation. Always use stop-loss.
💬 YOUR PREDICTION?
1️⃣ BTC will recover to $70K
2️⃣ BTC will revisit $60K
Comment 1 or 2 👇
Follow for daily Bitcoin updates and market analysis.
#Bitcoin #BTC #CryptoNews #BTCUSDT #BinanceSquare #CryptoAnalysis

65
Log in to explore more content
Join global crypto users on Binance Square
⚡️ Get latest and useful information about crypto.
💬 Trusted by the world’s largest crypto exchange.
👍 Discover real insights from verified creators.
Email / Phone number
Trending Topics
1
#NvidiaEarningsTonight:AIStocks’NextMove?
32,206 views
546 Discussing
2
#A Packed Week of Earnings and Data Tests Markets
110,801 views
568 Discussing
3
#AnthropicIPOTestsInvestorAppetiteForAI
233,803 views
2,331 Discussing
4
#NvidiaBoardNotConsideringHuang’sReturnasCEO
55,382 views
608 Discussing
5
#KOSPIFalls2.59%ToLowestCloseSinceFebruary
896 views
47 Discussing
6
#AnthropicClearedToListOnNasdaqAsANT
2,534 views
73 Discussing
7
#WhatInvestmentSignalsDo13FFilingsReveal?
32,414 views
463 Discussing
8
#EvernorthRecords$505MImpairmentOnPreListingXRP
735 views
14 Discussing
9
#GoldmanSachsReports$1.22BInEtherETFHoldings
560 views
9 Discussing
10
#GoldmanSachsAndMillenniumEachHeldOver$1.2BInBitcoinETFs
5,148 views
13 Discussing