
#solana
solana
162.4M views
275,913 Discussing
Hot
Latest

·
--
Bullish
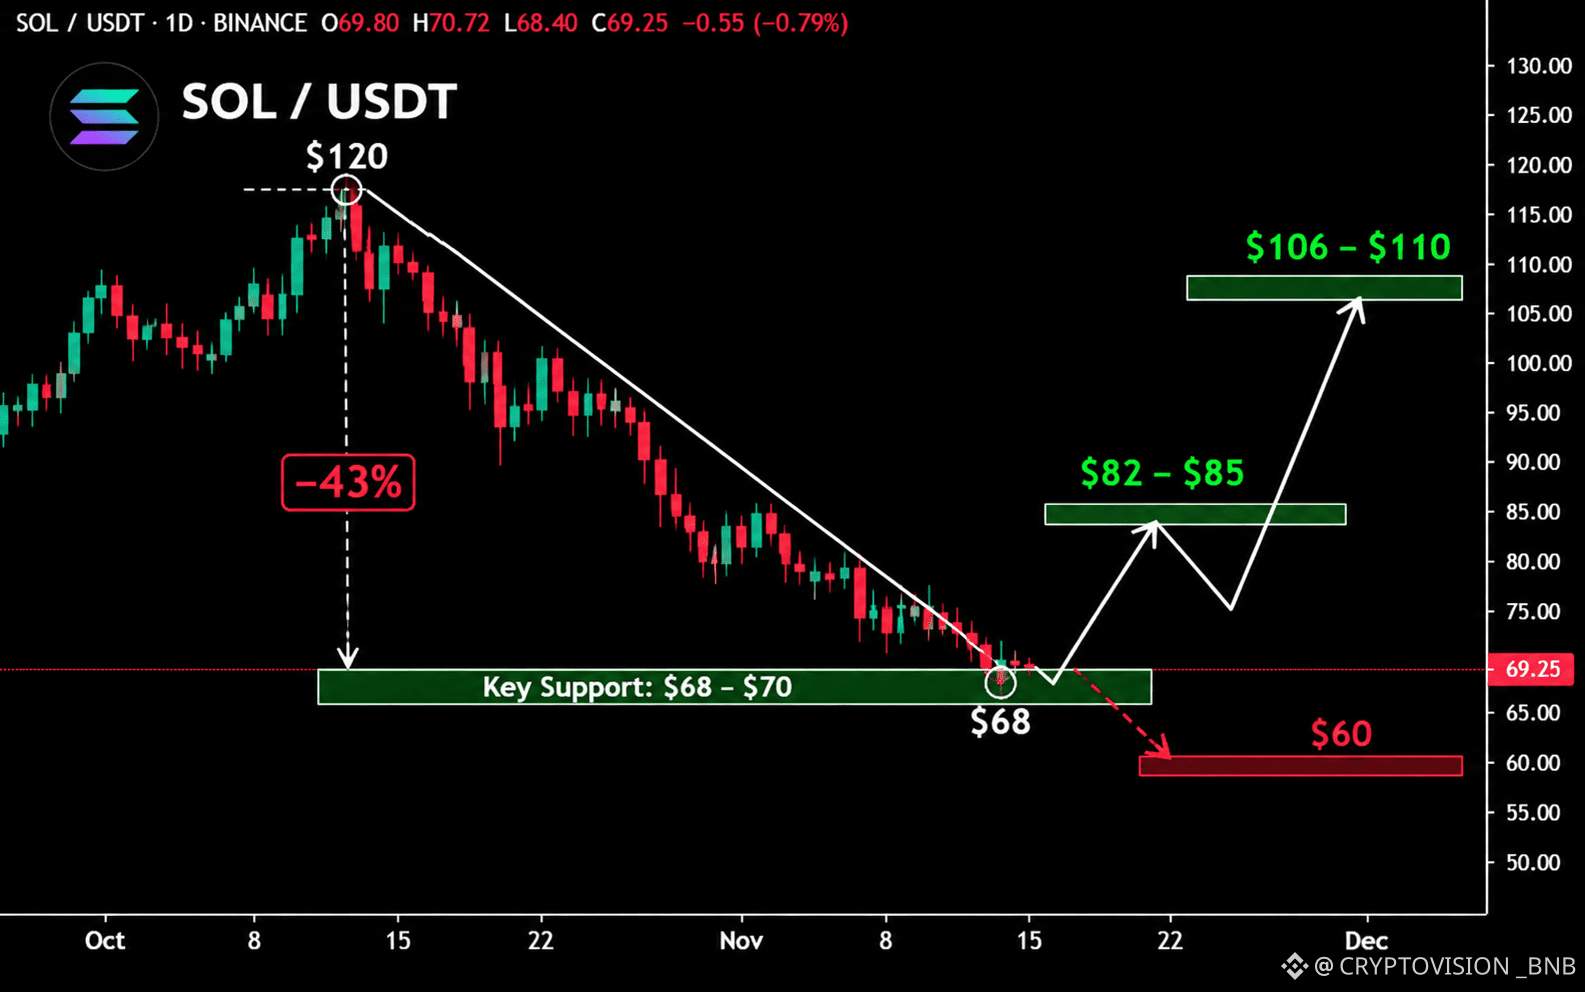
$SOL has reportedly fallen from $120 to $68 in one month, a decline of approximately 43.3%.
That puts the $68–$70 area at the center of my recovery scenario.
SOLUSDT | BULLISH WATCH
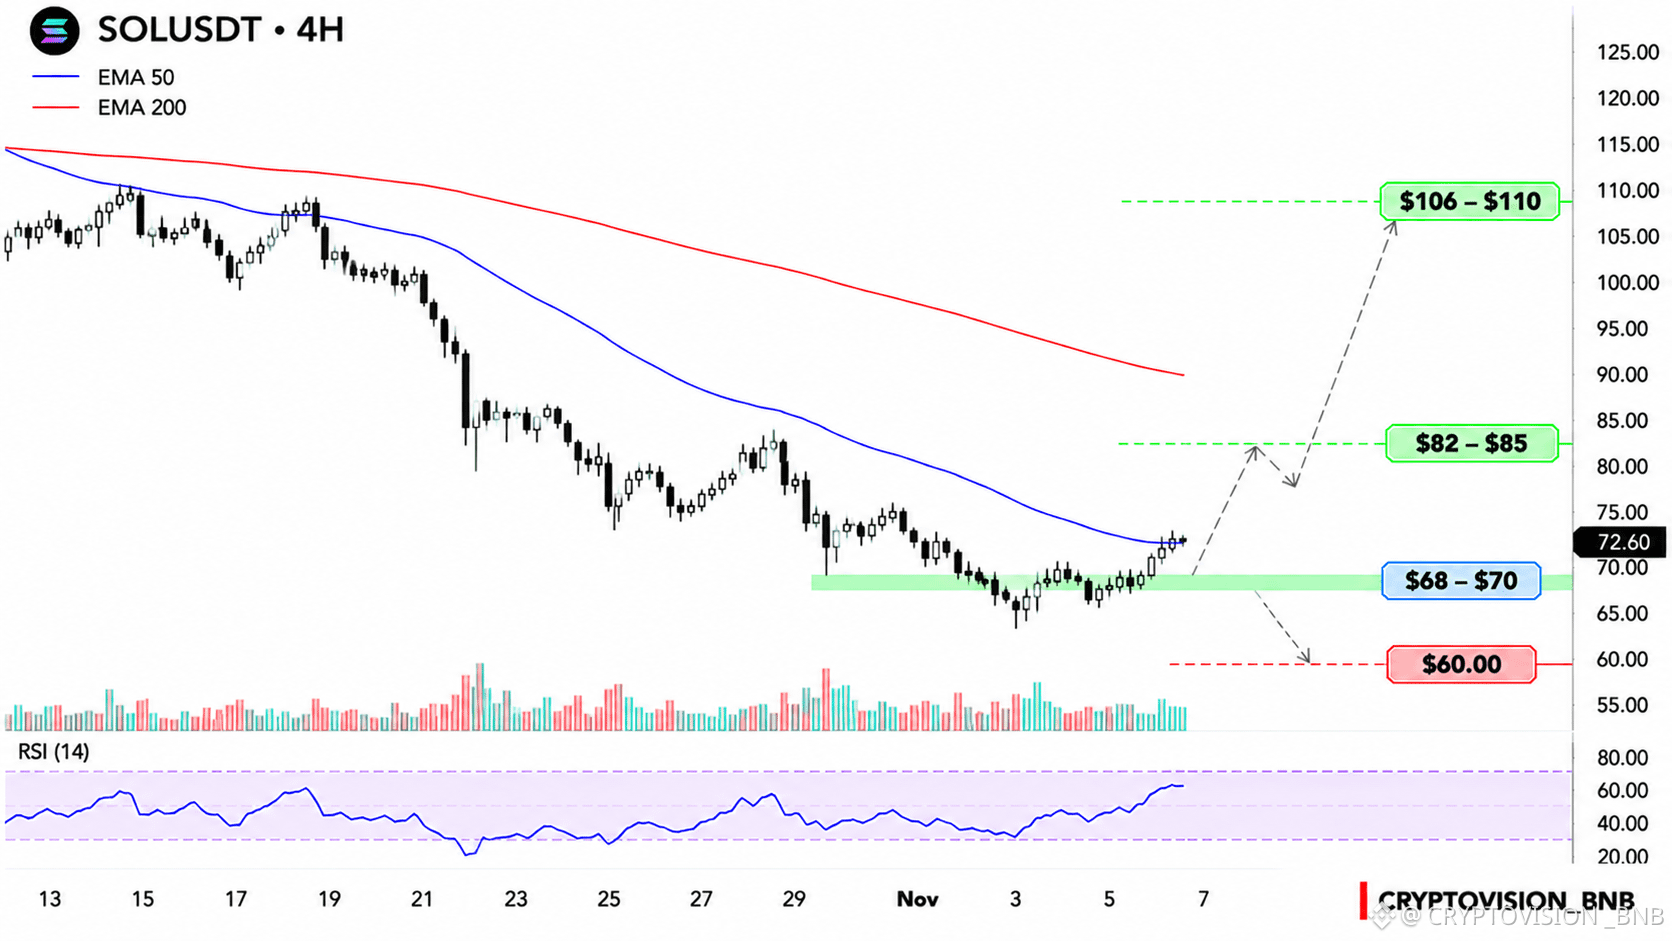
Key support: $68–$70
First upside zone: $82–$85
Extended targets: $106–$110
Bearish level: $60 if $68 fails
A confirmed rebound from support could open the way toward $82–$85. Reaching $106–$110 would require a more sustained recovery.
But a steep decline doesn't automatically mean SOL is oversold or that a bottom has formed.
If $68 breaks and sellers maintain control, $60 becomes a potential downside level.
I'm cautiously bullish while support holds, but I want confirmation from buyers before treating this as a reversal.
Is $68 the beginning of a recovery or just another pause in the downtrend?
$SOL
{spot}(SOLUSDT)
#solana
$SOL has reportedly fallen from $120 to $68 in one month, a decline of approximately 43.3%.
That puts the $68–$70 area at the center of my recovery scenario.
SOLUSDT | BULLISH WATCH
Key support: $68–$70
First upside zone: $82–$85
Extended targets: $106–$110
Bearish level: $60 if $68 fails
A confirmed rebound from support could open the way toward $82–$85. Reaching $106–$110 would require a more sustained recovery.
But a steep decline doesn't automatically mean SOL is oversold or that a bottom has formed.
If $68 breaks and sellers maintain control, $60 becomes a potential downside level.
I'm cautiously bullish while support holds, but I want confirmation from buyers before treating this as a reversal.
Is $68 the beginning of a recovery or just another pause in the downtrend?
$SOL
#solana
That puts the $68–$70 area at the center of my recovery scenario.
SOLUSDT | BULLISH WATCH
Key support: $68–$70
First upside zone: $82–$85
Extended targets: $106–$110
Bearish level: $60 if $68 fails
A confirmed rebound from support could open the way toward $82–$85. Reaching $106–$110 would require a more sustained recovery.
But a steep decline doesn't automatically mean SOL is oversold or that a bottom has formed.
If $68 breaks and sellers maintain control, $60 becomes a potential downside level.
I'm cautiously bullish while support holds, but I want confirmation from buyers before treating this as a reversal.
Is $68 the beginning of a recovery or just another pause in the downtrend?
$SOL
#solana
1.1k

Everyone has a different $SOL target for 2027. $150, $250 or even $400? 👀
But smart investors are watching more than price predictions. 👇
🔹 No fixed maximum supply
🔹 New SOL issued through staking rewards 🔹 Inflation declines 15% annually
🔹 50% of base transaction fees are burned
The real question: Can Solana's growing demand offset its new token supply?
Because network adoption doesn't automatically translate into token price growth.
💎 Watch the supply. Measure the demand.
What's your realistic $SOL target for 2027 — and what's your biggest reason?
#sol #solana #Crypto
Everyone has a different $SOL target for 2027. $150, $250 or even $400? 👀
But smart investors are watching more than price predictions. 👇
🔹 No fixed maximum supply
🔹 New SOL issued through staking rewards 🔹 Inflation declines 15% annually
🔹 50% of base transaction fees are burned
The real question: Can Solana's growing demand offset its new token supply?
Because network adoption doesn't automatically translate into token price growth.
💎 Watch the supply. Measure the demand.
What's your realistic $SOL target for 2027 — and what's your biggest reason?
#sol #solana #Crypto
But smart investors are watching more than price predictions. 👇
🔹 No fixed maximum supply
🔹 New SOL issued through staking rewards 🔹 Inflation declines 15% annually
🔹 50% of base transaction fees are burned
The real question: Can Solana's growing demand offset its new token supply?
Because network adoption doesn't automatically translate into token price growth.
💎 Watch the supply. Measure the demand.
What's your realistic $SOL target for 2027 — and what's your biggest reason?
#sol #solana #Crypto

7
5.1k

·
--
$SOL IS AT A CRITICAL TURNING POINT!
Solana is under heavy selling pressure, but deeply oversold conditions could trigger a sharp bounce.
🟢 Support: $67
🔴 Breakdown: $63 → $58
⚡ Resistance: $74 → $76
Bulls need to reclaim $74 to regain momentum. Until then, the risk remains high.
Is this a golden buying opportunity or another trap for bulls? 👀
#solana #TradingSignals
{spot}(SOLUSDT)
$SOL IS AT A CRITICAL TURNING POINT!
Solana is under heavy selling pressure, but deeply oversold conditions could trigger a sharp bounce.
🟢 Support: $67
🔴 Breakdown: $63 → $58
⚡ Resistance: $74 → $76
Bulls need to reclaim $74 to regain momentum. Until then, the risk remains high.
Is this a golden buying opportunity or another trap for bulls? 👀
#solana #TradingSignals
Solana is under heavy selling pressure, but deeply oversold conditions could trigger a sharp bounce.
🟢 Support: $67
🔴 Breakdown: $63 → $58
⚡ Resistance: $74 → $76
Bulls need to reclaim $74 to regain momentum. Until then, the risk remains high.
Is this a golden buying opportunity or another trap for bulls? 👀
#solana #TradingSignals
2
772

SOLANA (SOL) UNDER PRESSURE: A DEEPER CORRECTION OR THE BEGINNING OF A LARGER DOWNTREND?#Solana is facing renewed selling pressure, and the latest price action is sending a message that traders should not ignore. The market has experienced a sharp decline, with SOL trading around $68.32 at the time of this chart, after falling from the $74–$75 region.
The question now is not simply whether Solana will bounce. The real question is whether buyers can regain control of the market structure or whether sellers are preparing for another leg lower.
📉 The Current Market Situation
According to the chart:
• Current price: $68.32
• 24-hour high: $74.69
• 24-hour low: $67.91
• 24-hour change: -7.39%
• 24-hour trading volume: $223.82 million (USDT)
SOL has experienced a substantial decline, while the latest candle shows a strong bearish move toward the $67.91 area. This indicates that selling pressure has intensified and buyers have struggled to defend higher price levels.
However, a sharp decline does not automatically mean that the market must continue falling. After aggressive selling, markets can experience relief rallies, liquidity grabs, short-covering, or temporary recoveries.
The key is to understand what happens next—not to react emotionally to the red candles.
🔍 Technical Structure: Sellers Currently Have the Advantage
On the 1-hour timeframe, Solana is trading below its major moving averages:
• MA(7): $71.16
• MA(25): $72.49
• MA(99): $73.17
Price being below all three moving averages suggests that short-term momentum remains bearish. The moving averages are acting as potential dynamic resistance zones rather than immediate support.
A recovery toward $71–$73 would not necessarily mean a bullish reversal. The market would need to reclaim these levels, establish acceptance above them, and demonstrate stronger buying pressure before a convincing trend reversal could be considered.
Until then, rallies may face selling pressure.
🟢 Key Support Zone: $67.90–$68.00
The recent low near $67.91 is an important short-term level.
If buyers successfully defend this zone and price begins forming higher lows, we could see a relief rally toward:
$69.80 → $71.15 → $72.50
These levels represent potential reaction areas, not guaranteed targets.
A strong recovery accompanied by increasing buying volume could gradually improve the short-term structure. However, a weak bounce followed by another rejection would indicate that sellers remain dominant.
🔴 What If $67.90 Breaks?
If SOL loses the $67.90 support area and fails to reclaim it, the market could enter another bearish expansion phase.
A breakdown accompanied by strong volume and sustained price acceptance below support could expose lower price zones. Traders should avoid assuming the exact bottom because markets can continue declining much longer than expected.
The most important confirmation would be how price behaves after the breakdown:
• Does it immediately reclaim $67.90?
• Does it remain below support?
• Does selling volume continue increasing?
• Does the market form lower highs and lower lows?
These signals may provide a clearer picture of whether the breakdown is genuine or simply a liquidity sweep.
🧠 The Smart Money Perspective
One of the biggest mistakes traders make during sharp market declines is entering a position simply because the price looks cheap.
A falling price is not automatically undervalued.
Professional traders generally focus on liquidity, market structure, volume, key levels, and confirmation. They do not need to predict the exact bottom to find a trade opportunity.
At this stage, SOL could present two different scenarios:
Scenario 1 — Bullish Recovery
Price holds the $67.90 area, selling pressure begins weakening, and buyers reclaim important resistance levels. A recovery toward the moving averages could develop, potentially changing short-term sentiment.
Scenario 2 — Bearish Continuation
Price breaks below $67.90, fails to recover the level, and continues creating lower highs and lower lows. In this situation, downside risk remains elevated, and attempting to catch the bottom could be dangerous.
⚠️ The Biggest Risk Right Now
The biggest risk is trading based on emotion.
When a coin drops 7%, traders often rush to buy because they believe the discount is attractive. Others panic-sell at the bottom because they fear further losses.
Both reactions can lead to poor decisions.
A better approach is to wait for confirmation, define risk in advance, and understand where your trading idea becomes invalid.
The market rewards patience more often than impulsive decisions.
📌 My View
Solana is currently in a weak short-term position. Price is below the 7, 25, and 99 moving averages, selling pressure is strong, and the recent support near $67.91 is now an important level to watch.
I am not treating this decline as an automatic buying opportunity, nor am I assuming that SOL will continue falling without a bounce.
The next move will depend on the reaction around support, the strength of any recovery, volume, and the broader crypto market.
The market is not giving us a reason to rush. It is giving us a reason to observe carefully.
Sometimes the best trade is not the one you enter first—it is the one you enter after the market confirms your idea.
Stay disciplined. Protect your capital. Trade the structure, not your emotions.
This analysis is for educational and informational purposes only and is not financial advice. Cryptocurrency markets are highly volatile. Always conduct your own research and manage your risk.
SOLANA (SOL) UNDER PRESSURE: A DEEPER CORRECTION OR THE BEGINNING OF A LARGER DOWNTREND?
#Solana is facing renewed selling pressure, and the latest price action is sending a message that traders should not ignore. The market has experienced a sharp decline, with SOL trading around $68.32 at the time of this chart, after falling from the $74–$75 region.
The question now is not simply whether Solana will bounce. The real question is whether buyers can regain control of the market structure or whether sellers are preparing for another leg lower.
📉 The Current Market Situation
According to the chart:
• Current price: $68.32
• 24-hour high: $74.69
• 24-hour low: $67.91
• 24-hour change: -7.39%
• 24-hour trading volume: $223.82 million (USDT)
SOL has experienced a substantial decline, while the latest candle shows a strong bearish move toward the $67.91 area. This indicates that selling pressure has intensified and buyers have struggled to defend higher price levels.
However, a sharp decline does not automatically mean that the market must continue falling. After aggressive selling, markets can experience relief rallies, liquidity grabs, short-covering, or temporary recoveries.
The key is to understand what happens next—not to react emotionally to the red candles.
🔍 Technical Structure: Sellers Currently Have the Advantage
On the 1-hour timeframe, Solana is trading below its major moving averages:
• MA(7): $71.16
• MA(25): $72.49
• MA(99): $73.17
Price being below all three moving averages suggests that short-term momentum remains bearish. The moving averages are acting as potential dynamic resistance zones rather than immediate support.
A recovery toward $71–$73 would not necessarily mean a bullish reversal. The market would need to reclaim these levels, establish acceptance above them, and demonstrate stronger buying pressure before a convincing trend reversal could be considered.
Until then, rallies may face selling pressure.
🟢 Key Support Zone: $67.90–$68.00
The recent low near $67.91 is an important short-term level.
If buyers successfully defend this zone and price begins forming higher lows, we could see a relief rally toward:
$69.80 → $71.15 → $72.50
These levels represent potential reaction areas, not guaranteed targets.
A strong recovery accompanied by increasing buying volume could gradually improve the short-term structure. However, a weak bounce followed by another rejection would indicate that sellers remain dominant.
🔴 What If $67.90 Breaks?
If SOL loses the $67.90 support area and fails to reclaim it, the market could enter another bearish expansion phase.
A breakdown accompanied by strong volume and sustained price acceptance below support could expose lower price zones. Traders should avoid assuming the exact bottom because markets can continue declining much longer than expected.
The most important confirmation would be how price behaves after the breakdown:
• Does it immediately reclaim $67.90?
• Does it remain below support?
• Does selling volume continue increasing?
• Does the market form lower highs and lower lows?
These signals may provide a clearer picture of whether the breakdown is genuine or simply a liquidity sweep.
🧠 The Smart Money Perspective
One of the biggest mistakes traders make during sharp market declines is entering a position simply because the price looks cheap.
A falling price is not automatically undervalued.
Professional traders generally focus on liquidity, market structure, volume, key levels, and confirmation. They do not need to predict the exact bottom to find a trade opportunity.
At this stage, SOL could present two different scenarios:
Scenario 1 — Bullish Recovery
Price holds the $67.90 area, selling pressure begins weakening, and buyers reclaim important resistance levels. A recovery toward the moving averages could develop, potentially changing short-term sentiment.
Scenario 2 — Bearish Continuation
Price breaks below $67.90, fails to recover the level, and continues creating lower highs and lower lows. In this situation, downside risk remains elevated, and attempting to catch the bottom could be dangerous.
⚠️ The Biggest Risk Right Now
The biggest risk is trading based on emotion.
When a coin drops 7%, traders often rush to buy because they believe the discount is attractive. Others panic-sell at the bottom because they fear further losses.
Both reactions can lead to poor decisions.
A better approach is to wait for confirmation, define risk in advance, and understand where your trading idea becomes invalid.
The market rewards patience more often than impulsive decisions.
📌 My View
Solana is currently in a weak short-term position. Price is below the 7, 25, and 99 moving averages, selling pressure is strong, and the recent support near $67.91 is now an important level to watch.
I am not treating this decline as an automatic buying opportunity, nor am I assuming that SOL will continue falling without a bounce.
The next move will depend on the reaction around support, the strength of any recovery, volume, and the broader crypto market.
The market is not giving us a reason to rush. It is giving us a reason to observe carefully.
Sometimes the best trade is not the one you enter first—it is the one you enter after the market confirms your idea.
Stay disciplined. Protect your capital. Trade the structure, not your emotions.
This analysis is for educational and informational purposes only and is not financial advice. Cryptocurrency markets are highly volatile. Always conduct your own research and manage your risk.
The question now is not simply whether Solana will bounce. The real question is whether buyers can regain control of the market structure or whether sellers are preparing for another leg lower.
📉 The Current Market Situation
According to the chart:
• Current price: $68.32
• 24-hour high: $74.69
• 24-hour low: $67.91
• 24-hour change: -7.39%
• 24-hour trading volume: $223.82 million (USDT)
SOL has experienced a substantial decline, while the latest candle shows a strong bearish move toward the $67.91 area. This indicates that selling pressure has intensified and buyers have struggled to defend higher price levels.
However, a sharp decline does not automatically mean that the market must continue falling. After aggressive selling, markets can experience relief rallies, liquidity grabs, short-covering, or temporary recoveries.
The key is to understand what happens next—not to react emotionally to the red candles.
🔍 Technical Structure: Sellers Currently Have the Advantage
On the 1-hour timeframe, Solana is trading below its major moving averages:
• MA(7): $71.16
• MA(25): $72.49
• MA(99): $73.17
Price being below all three moving averages suggests that short-term momentum remains bearish. The moving averages are acting as potential dynamic resistance zones rather than immediate support.
A recovery toward $71–$73 would not necessarily mean a bullish reversal. The market would need to reclaim these levels, establish acceptance above them, and demonstrate stronger buying pressure before a convincing trend reversal could be considered.
Until then, rallies may face selling pressure.
🟢 Key Support Zone: $67.90–$68.00
The recent low near $67.91 is an important short-term level.
If buyers successfully defend this zone and price begins forming higher lows, we could see a relief rally toward:
$69.80 → $71.15 → $72.50
These levels represent potential reaction areas, not guaranteed targets.
A strong recovery accompanied by increasing buying volume could gradually improve the short-term structure. However, a weak bounce followed by another rejection would indicate that sellers remain dominant.
🔴 What If $67.90 Breaks?
If SOL loses the $67.90 support area and fails to reclaim it, the market could enter another bearish expansion phase.
A breakdown accompanied by strong volume and sustained price acceptance below support could expose lower price zones. Traders should avoid assuming the exact bottom because markets can continue declining much longer than expected.
The most important confirmation would be how price behaves after the breakdown:
• Does it immediately reclaim $67.90?
• Does it remain below support?
• Does selling volume continue increasing?
• Does the market form lower highs and lower lows?
These signals may provide a clearer picture of whether the breakdown is genuine or simply a liquidity sweep.
🧠 The Smart Money Perspective
One of the biggest mistakes traders make during sharp market declines is entering a position simply because the price looks cheap.
A falling price is not automatically undervalued.
Professional traders generally focus on liquidity, market structure, volume, key levels, and confirmation. They do not need to predict the exact bottom to find a trade opportunity.
At this stage, SOL could present two different scenarios:
Scenario 1 — Bullish Recovery
Price holds the $67.90 area, selling pressure begins weakening, and buyers reclaim important resistance levels. A recovery toward the moving averages could develop, potentially changing short-term sentiment.
Scenario 2 — Bearish Continuation
Price breaks below $67.90, fails to recover the level, and continues creating lower highs and lower lows. In this situation, downside risk remains elevated, and attempting to catch the bottom could be dangerous.
⚠️ The Biggest Risk Right Now
The biggest risk is trading based on emotion.
When a coin drops 7%, traders often rush to buy because they believe the discount is attractive. Others panic-sell at the bottom because they fear further losses.
Both reactions can lead to poor decisions.
A better approach is to wait for confirmation, define risk in advance, and understand where your trading idea becomes invalid.
The market rewards patience more often than impulsive decisions.
📌 My View
Solana is currently in a weak short-term position. Price is below the 7, 25, and 99 moving averages, selling pressure is strong, and the recent support near $67.91 is now an important level to watch.
I am not treating this decline as an automatic buying opportunity, nor am I assuming that SOL will continue falling without a bounce.
The next move will depend on the reaction around support, the strength of any recovery, volume, and the broader crypto market.
The market is not giving us a reason to rush. It is giving us a reason to observe carefully.
Sometimes the best trade is not the one you enter first—it is the one you enter after the market confirms your idea.
Stay disciplined. Protect your capital. Trade the structure, not your emotions.
This analysis is for educational and informational purposes only and is not financial advice. Cryptocurrency markets are highly volatile. Always conduct your own research and manage your risk.
2
426

·
--
🚨 $SOL Is Testing a Critical Support Zone!
Solana is going through a difficult market phase, but its long-term development story remains interesting.
The network's latest 2027 roadmap focuses on improving computing capacity, faster performance, and stronger infrastructure.
Levels I'm watching:
🔹 $65–$70 – Important support zone
🔹 $80 – Key recovery level
🔹 Below $65 – More downside risk
The price is under pressure, but development continues. I'm watching for signs of recovery before making any big decisions.
Can $SOL surprise the market with a strong comeback?
What's your strategy: Buy, Hold, or Wait?
$SOL #Solana #Crypto #Altcoins
🚨 $SOL Is Testing a Critical Support Zone!
Solana is going through a difficult market phase, but its long-term development story remains interesting.
The network's latest 2027 roadmap focuses on improving computing capacity, faster performance, and stronger infrastructure.
Levels I'm watching:
🔹 $65–$70 – Important support zone
🔹 $80 – Key recovery level
🔹 Below $65 – More downside risk
The price is under pressure, but development continues. I'm watching for signs of recovery before making any big decisions.
Can $SOL surprise the market with a strong comeback?
What's your strategy: Buy, Hold, or Wait?
$SOL #Solana #Crypto #Altcoins
Solana is going through a difficult market phase, but its long-term development story remains interesting.
The network's latest 2027 roadmap focuses on improving computing capacity, faster performance, and stronger infrastructure.
Levels I'm watching:
🔹 $65–$70 – Important support zone
🔹 $80 – Key recovery level
🔹 Below $65 – More downside risk
The price is under pressure, but development continues. I'm watching for signs of recovery before making any big decisions.
Can $SOL surprise the market with a strong comeback?
What's your strategy: Buy, Hold, or Wait?
$SOL #Solana #Crypto #Altcoins
Feed-Creator-b60637957:
There is talk that Solana might touch the $50–$55 range within this very week. Based on my observations, these predictions are actually coming true, and given the current state of the global market, my confidence has grown that it will indeed reach those levels—allowing us to capitalize on the opportunity. I truly hope this happens, God willing. Please share your own insights in the comments so that we can all continue to exercise patience.
1
1
2
396

·
--
🍃 $SOL : SOLANA OFFICIALLY DROPS ITS “BETA” LABEL!
Solana has reached a major network milestone:
- November 16: Solana announced its transition from “Mainnet Beta” to Solana 1.0.
- Alpenglow live: The October upgrade targets around 150ms transaction finality.
- Firedancer: An independently developed validator client adds software diversity to the network.
- Institutional growth: Solana's real-world asset value reached a record $5 billion in October.
Can Solana turn its technical progress into even wider adoption?
$SOL
{future}(SOLUSDT)
.
.
.
#SOL #Solana #blockchain
Not financial advice. DYOR.
🍃 $SOL : SOLANA OFFICIALLY DROPS ITS “BETA” LABEL!
Solana has reached a major network milestone:
- November 16: Solana announced its transition from “Mainnet Beta” to Solana 1.0.
- Alpenglow live: The October upgrade targets around 150ms transaction finality.
- Firedancer: An independently developed validator client adds software diversity to the network.
- Institutional growth: Solana's real-world asset value reached a record $5 billion in October.
Can Solana turn its technical progress into even wider adoption?
$SOL
.
.
.
#SOL #Solana #blockchain
Not financial advice. DYOR.
Solana has reached a major network milestone:
- November 16: Solana announced its transition from “Mainnet Beta” to Solana 1.0.
- Alpenglow live: The October upgrade targets around 150ms transaction finality.
- Firedancer: An independently developed validator client adds software diversity to the network.
- Institutional growth: Solana's real-world asset value reached a record $5 billion in October.
Can Solana turn its technical progress into even wider adoption?
$SOL
.
.
.
#SOL #Solana #blockchain
Not financial advice. DYOR.

1
319

·
--
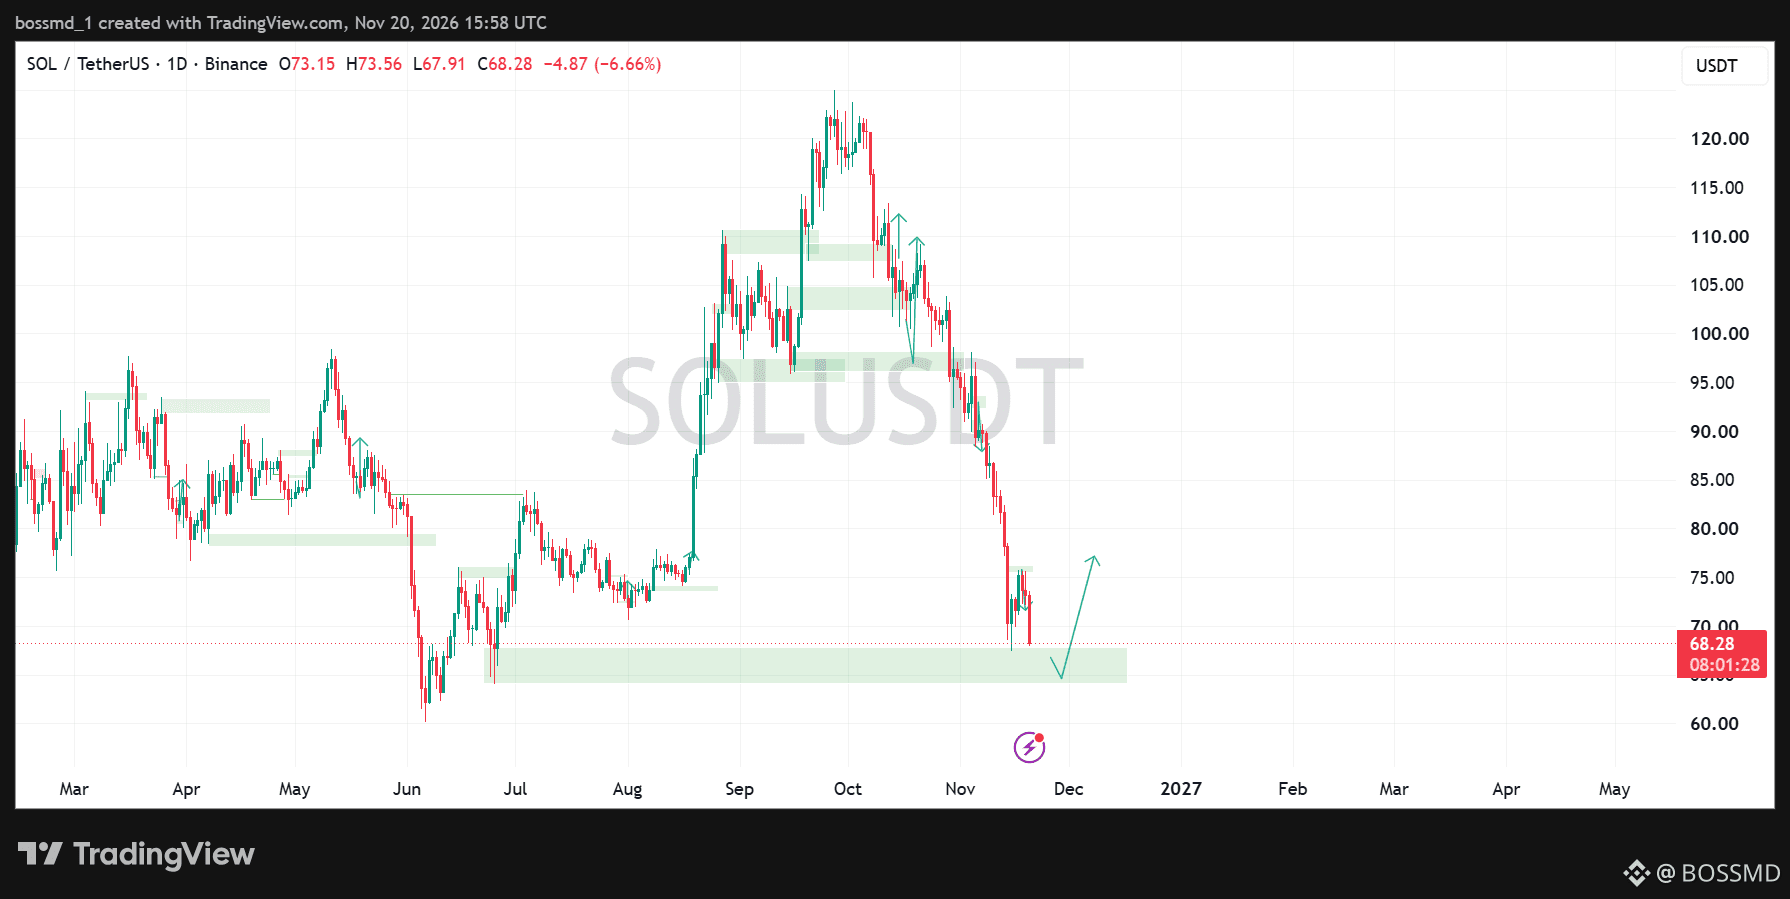
#solana is facing strong selling pressure after dropping sharply from its recent highs above $120.
Price is now approaching a major support zone around $64–$67.
This is an important area to watch. If buyers defend this zone, we could see a relief bounce toward $75–$77. However, a breakdown below support could bring further downside.
For now, I’m watching how $SOL reacts at this demand zone. Bulls need to step in if a recovery is going to happen.
#solana is facing strong selling pressure after dropping sharply from its recent highs above $120.
Price is now approaching a major support zone around $64–$67.
This is an important area to watch. If buyers defend this zone, we could see a relief bounce toward $75–$77. However, a breakdown below support could bring further downside.
For now, I’m watching how $SOL reacts at this demand zone. Bulls need to step in if a recovery is going to happen.
Price is now approaching a major support zone around $64–$67.
This is an important area to watch. If buyers defend this zone, we could see a relief bounce toward $75–$77. However, a breakdown below support could bring further downside.
For now, I’m watching how $SOL reacts at this demand zone. Bulls need to step in if a recovery is going to happen.
2
3.4k

·
--
🚨 SOLANA ($SOL): IS A RECOVERY COMING?
Solana is facing selling pressure, with its price testing the $68–$70 support zone.
📈 Bullish scenario: If buyers defend this level, SOL could recover toward $75 and potentially $80.
📉 Bearish scenario: If support breaks, we could see $64 or even $60.
🔥 My Take: Solana still has long-term potential, but a strong recovery needs buying volume and a Bitcoin rebound.
What do you think? Will SOL bounce back or fall to $60 first
$SOL
#solana #sol #SolanaUSTD #solanAnalysis
🚨 SOLANA ($SOL ): IS A RECOVERY COMING?
Solana is facing selling pressure, with its price testing the $68–$70 support zone.
📈 Bullish scenario: If buyers defend this level, SOL could recover toward $75 and potentially $80.
📉 Bearish scenario: If support breaks, we could see $64 or even $60.
🔥 My Take: Solana still has long-term potential, but a strong recovery needs buying volume and a Bitcoin rebound.
What do you think? Will SOL bounce back or fall to $60 first
$SOL
#solana #sol #SolanaUSTD #solanAnalysis
Solana is facing selling pressure, with its price testing the $68–$70 support zone.
📈 Bullish scenario: If buyers defend this level, SOL could recover toward $75 and potentially $80.
📉 Bearish scenario: If support breaks, we could see $64 or even $60.
🔥 My Take: Solana still has long-term potential, but a strong recovery needs buying volume and a Bitcoin rebound.
What do you think? Will SOL bounce back or fall to $60 first
$SOL
#solana #sol #SolanaUSTD #solanAnalysis
1
457

·
--
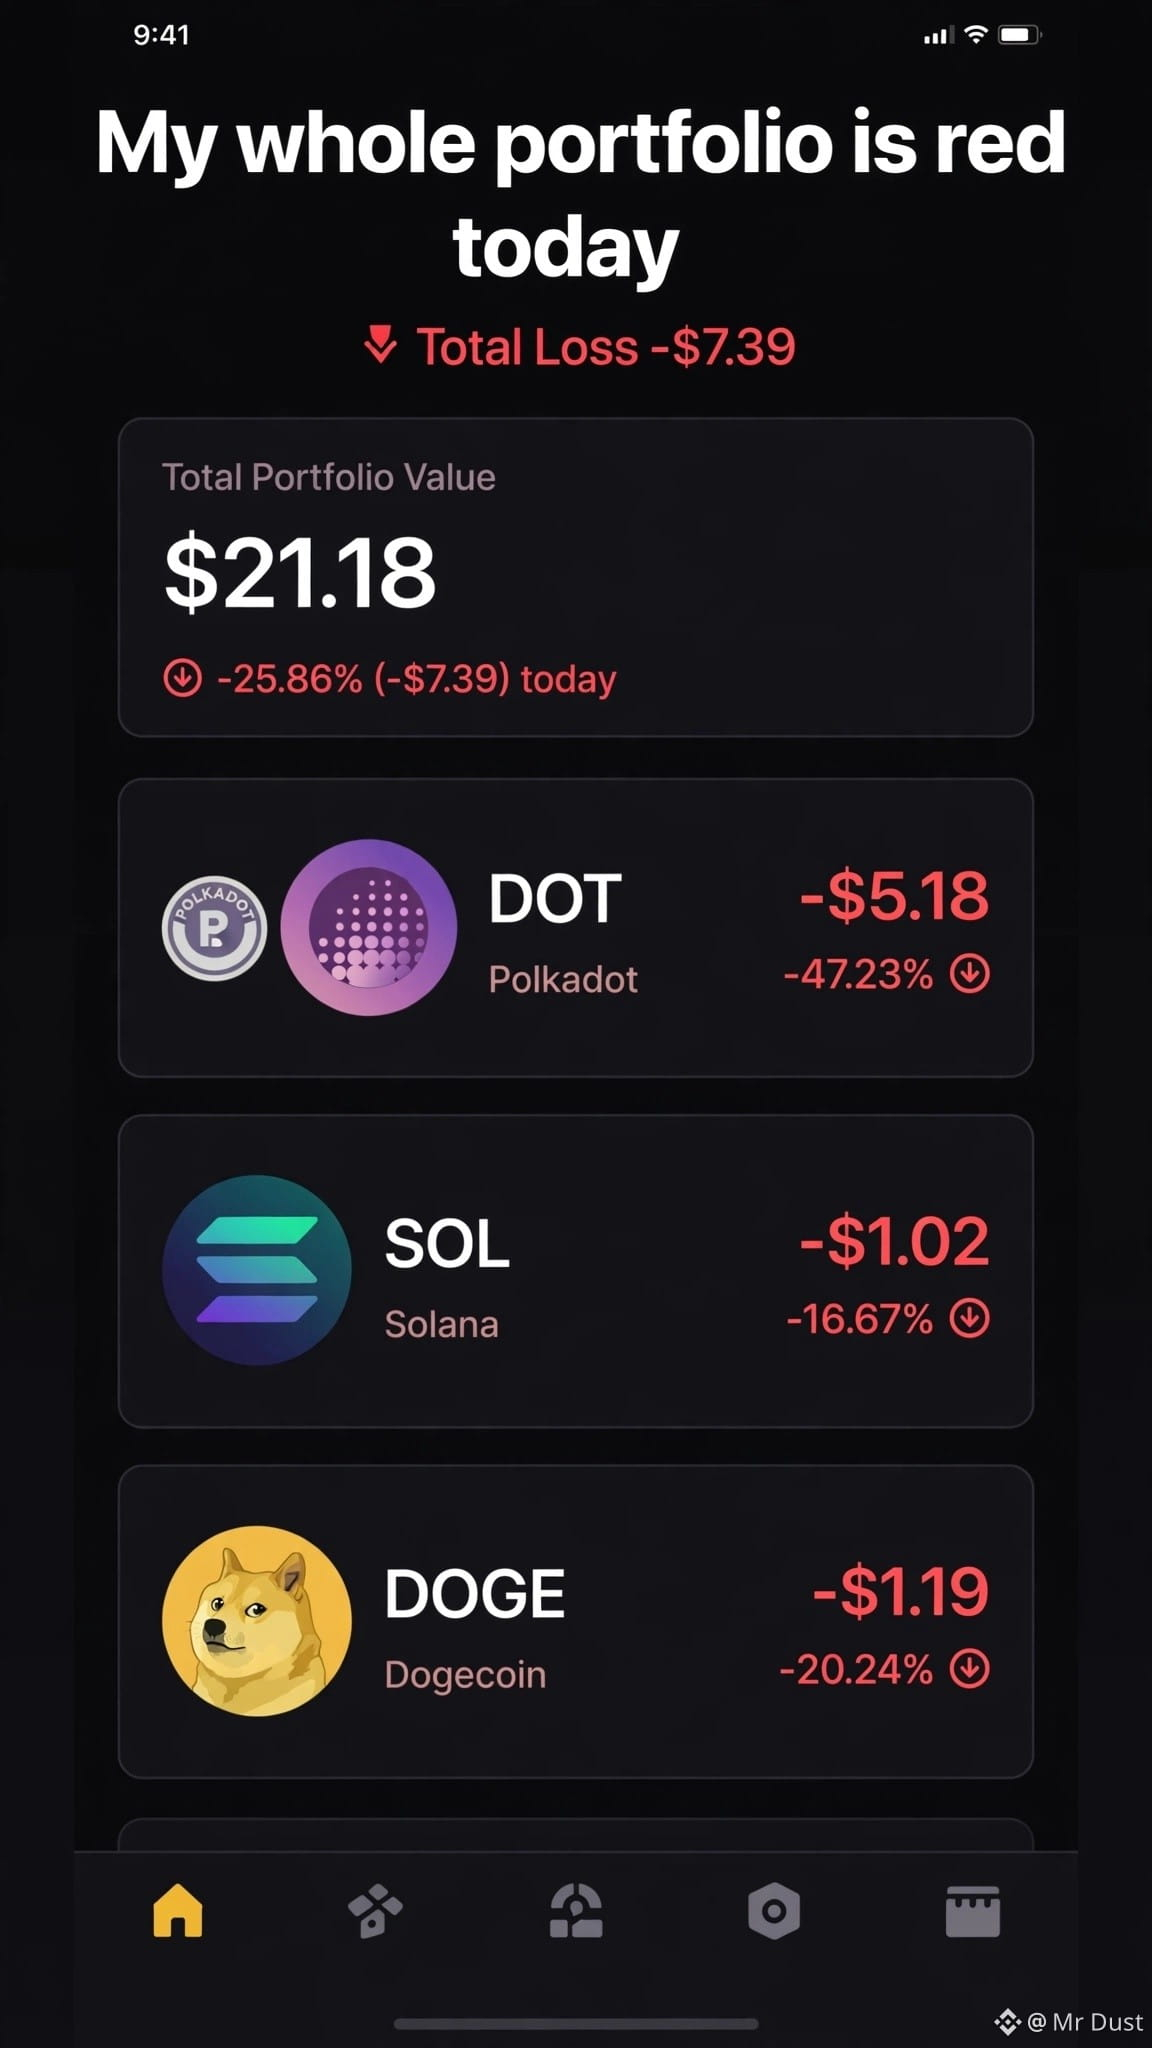
My whole portfolio is red today 💔
DOT: -47.23% (-$5.18)
SOL: -16.67% (-$1.02)
DOGE: -20.24% (-$1.19)
Total loss: -$7.39 and still holding. It hurts to see red every day, but selling now means locking this loss forever.
So I'm not selling, just holding and waiting for a green day.$DOT $DOGE
Is your portfolio also red or just mine? Tell me in comments 👇
#dot $SOL $ #solana #Dogecoin #crypto #MrDust
My whole portfolio is red today 💔
DOT: -47.23% (-$5.18)
SOL: -16.67% (-$1.02)
DOGE: -20.24% (-$1.19)
Total loss: -$7.39 and still holding. It hurts to see red every day, but selling now means locking this loss forever.
So I'm not selling, just holding and waiting for a green day.$DOT $DOGE
Is your portfolio also red or just mine? Tell me in comments 👇
#dot $SOL $ #solana #Dogecoin #crypto #MrDust
DOT: -47.23% (-$5.18)
SOL: -16.67% (-$1.02)
DOGE: -20.24% (-$1.19)
Total loss: -$7.39 and still holding. It hurts to see red every day, but selling now means locking this loss forever.
So I'm not selling, just holding and waiting for a green day.$DOT $DOGE
Is your portfolio also red or just mine? Tell me in comments 👇
#dot $SOL $ #solana #Dogecoin #crypto #MrDust
1.1k

·
--
Bearish
💥 Many traders watch the price of $SOL , but smart investors watch what happens behind the chart.
🚦 3 IMPORTANT THINGS TO WATCH:
🐋 Whale Activity: Are large holders accumulating or selling?
📊 Trading Volume: Is buying volume supporting the price movement?
🛡️ Key Support: Can SOL hold its important support levels during market pressure?
$SOL
{spot}(SOLUSDT)
⚠️ Remember: A green candle doesn't guarantee a bullish trend. Always wait for confirmation before making a decision.
💡 Awareness is more powerful than FOMO. Protect your capital before chasing profits.
What do you think is $SOL preparing for recovery, or could more pressure be ahead?
#Solana #SOL #CryptoAwareness #BinanceSquare
💥 Many traders watch the price of $SOL , but smart investors watch what happens behind the chart.
🚦 3 IMPORTANT THINGS TO WATCH:
🐋 Whale Activity: Are large holders accumulating or selling?
📊 Trading Volume: Is buying volume supporting the price movement?
🛡️ Key Support: Can SOL hold its important support levels during market pressure?
$SOL
⚠️ Remember: A green candle doesn't guarantee a bullish trend. Always wait for confirmation before making a decision.
💡 Awareness is more powerful than FOMO. Protect your capital before chasing profits.
What do you think is $SOL preparing for recovery, or could more pressure be ahead?
#Solana #SOL #CryptoAwareness #BinanceSquare
🚦 3 IMPORTANT THINGS TO WATCH:
🐋 Whale Activity: Are large holders accumulating or selling?
📊 Trading Volume: Is buying volume supporting the price movement?
🛡️ Key Support: Can SOL hold its important support levels during market pressure?
$SOL
⚠️ Remember: A green candle doesn't guarantee a bullish trend. Always wait for confirmation before making a decision.
💡 Awareness is more powerful than FOMO. Protect your capital before chasing profits.
What do you think is $SOL preparing for recovery, or could more pressure be ahead?
#Solana #SOL #CryptoAwareness #BinanceSquare
1
368

·
--
Fumbled $SOL badly. Bought the bounce, then watched it bleed.
Brutal lesson. 😵💫
It’s $67.28 now, down 7.34% in 24h after an 8% 4h flush, with $266.4M traded. RSI is 25, volume is 1.3x average, and shorts are paying funding at -0.020%. Oversold doesn’t cancel the bearish stack under the 20d and 50d MAs.
If it tags $60, I’m watching, not chasing. $BTC strength won’t magically fix this chart.
What’s your SOL target here? 👀
#Solana #Crypto
Fumbled $SOL badly. Bought the bounce, then watched it bleed.
Brutal lesson. 😵💫
It’s $67.28 now, down 7.34% in 24h after an 8% 4h flush, with $266.4M traded. RSI is 25, volume is 1.3x average, and shorts are paying funding at -0.020%. Oversold doesn’t cancel the bearish stack under the 20d and 50d MAs.
If it tags $60, I’m watching, not chasing. $BTC strength won’t magically fix this chart.
What’s your SOL target here? 👀
#Solana #Crypto
Brutal lesson. 😵💫
It’s $67.28 now, down 7.34% in 24h after an 8% 4h flush, with $266.4M traded. RSI is 25, volume is 1.3x average, and shorts are paying funding at -0.020%. Oversold doesn’t cancel the bearish stack under the 20d and 50d MAs.
If it tags $60, I’m watching, not chasing. $BTC strength won’t magically fix this chart.
What’s your SOL target here? 👀
#Solana #Crypto
188

Bought the $SOL dip at $69.10… but the market had other plans. 🥲📉
20x Isolated Long. Already seeing red, while SOL struggles to recover.
Not every trade starts with green. Sometimes the real test is patience and risk management.
Would you hold this position or cut the loss and wait for a better entry? 👀
#SOL #solana #BinanceFutures #cryptotrading $BTC $ETH
Bought the $SOL dip at $69.10… but the market had other plans. 🥲📉
20x Isolated Long. Already seeing red, while SOL struggles to recover.
Not every trade starts with green. Sometimes the real test is patience and risk management.
Would you hold this position or cut the loss and wait for a better entry? 👀
#SOL #solana #BinanceFutures #cryptotrading $BTC $ETH
20x Isolated Long. Already seeing red, while SOL struggles to recover.
Not every trade starts with green. Sometimes the real test is patience and risk management.
Would you hold this position or cut the loss and wait for a better entry? 👀
#SOL #solana #BinanceFutures #cryptotrading $BTC $ETH
1
1
163

🚨 $SOL : 43% DROP IN JUST ONE MONTH!
$SOL has fallen from $120 to $67 in just one month. 📉
Now all eyes are on the $82–$85 resistance zone.
🔥 Bullish Scenario:
If SOL reclaims $82–$85 and holds above this zone, we could see a recovery toward $106–$110.
⚠️ Bearish Scenario:
If SOL gets rejected from this resistance, another downward move could follow.
Remember: One bounce doesn't mean the downtrend is over!
Watch the key levels, wait for confirmation, and avoid FOMO.
DYOR | NFA | Manage your risk. 📊
$SOL #solana #GlobalStocksFaceLongestLosingStreakSince2023 #BTC #football #CanBTCReboundAfterFallingBelow60K?
{spot}(SOLUSDT)
🚨 $SOL : 43% DROP IN JUST ONE MONTH!
$SOL has fallen from $120 to $67 in just one month. 📉
Now all eyes are on the $82–$85 resistance zone.
🔥 Bullish Scenario:
If SOL reclaims $82–$85 and holds above this zone, we could see a recovery toward $106–$110.
⚠️ Bearish Scenario:
If SOL gets rejected from this resistance, another downward move could follow.
Remember: One bounce doesn't mean the downtrend is over!
Watch the key levels, wait for confirmation, and avoid FOMO.
DYOR | NFA | Manage your risk. 📊
$SOL #solana #GlobalStocksFaceLongestLosingStreakSince2023 #BTC #football #CanBTCReboundAfterFallingBelow60K?
$SOL has fallen from $120 to $67 in just one month. 📉
Now all eyes are on the $82–$85 resistance zone.
🔥 Bullish Scenario:
If SOL reclaims $82–$85 and holds above this zone, we could see a recovery toward $106–$110.
⚠️ Bearish Scenario:
If SOL gets rejected from this resistance, another downward move could follow.
Remember: One bounce doesn't mean the downtrend is over!
Watch the key levels, wait for confirmation, and avoid FOMO.
DYOR | NFA | Manage your risk. 📊
$SOL #solana #GlobalStocksFaceLongestLosingStreakSince2023 #BTC #football #CanBTCReboundAfterFallingBelow60K?

1
54

·
--
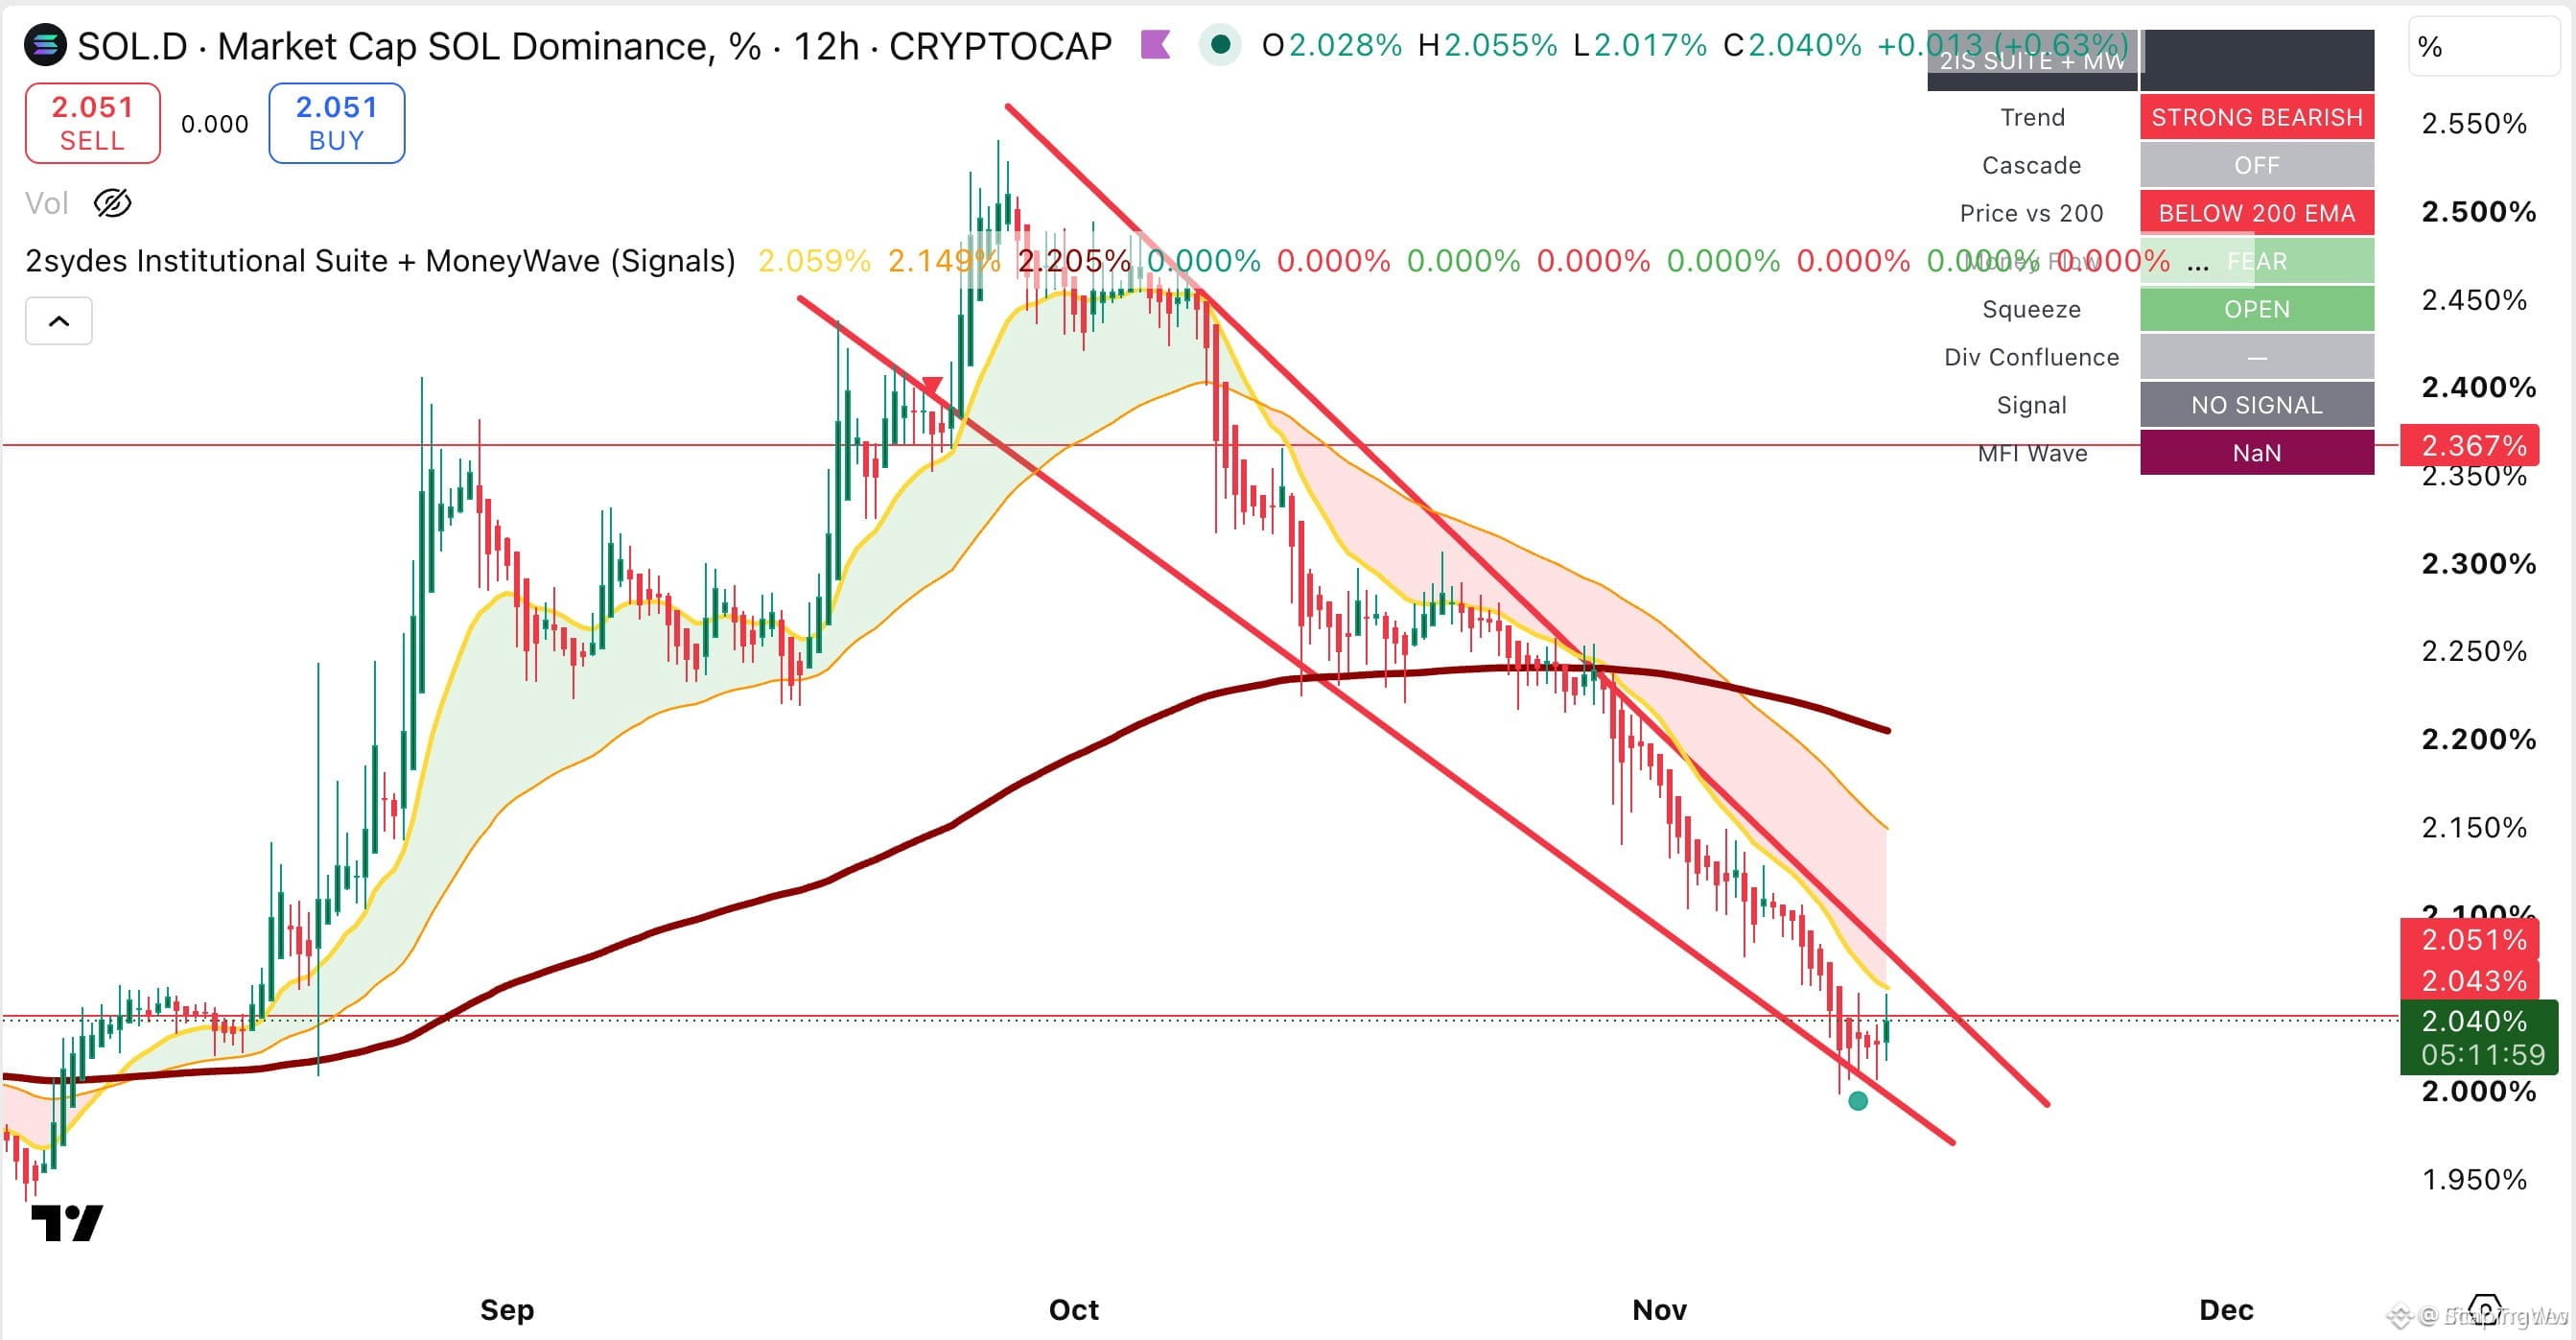
🚨 $SOL .D TESTS THE 2.00% FLOOR AS BEARS AND BULLS CLASH AT CHANNEL SUPPORT! 💥
Entry: 2.00% ⚡
Target: 2.367% 🚀
Solana dominance has been bleeding from 2.50% down to 2.04% inside a relentless descending channel, now testing the psychological 2.00% floor. Price action remains pinned below the 200 EMA while immediate overhead resistance stacks heavily between 2.05% and 2.10%. 📊
While this early bounce off the lower boundary hints at exhausted sellers, order flow still flashes a strong bearish bias with zero confirmed reversal signals. ⚡
💬 Are you betting on a structural reclaim here, or is this just another trap before a deeper flush? 👇
⚠️ Not financial advice. Always manage your risk. 🛡️
🏷️ #SOL .D #Solana #Crypto #Trading
🔥 💎
🚨 $SOL .D TESTS THE 2.00% FLOOR AS BEARS AND BULLS CLASH AT CHANNEL SUPPORT! 💥
Entry: 2.00% ⚡
Target: 2.367% 🚀
Solana dominance has been bleeding from 2.50% down to 2.04% inside a relentless descending channel, now testing the psychological 2.00% floor. Price action remains pinned below the 200 EMA while immediate overhead resistance stacks heavily between 2.05% and 2.10%. 📊
While this early bounce off the lower boundary hints at exhausted sellers, order flow still flashes a strong bearish bias with zero confirmed reversal signals. ⚡
💬 Are you betting on a structural reclaim here, or is this just another trap before a deeper flush? 👇
⚠️ Not financial advice. Always manage your risk. 🛡️
🏷️ #SOL .D #Solana #Crypto #Trading
🔥 💎
Entry: 2.00% ⚡
Target: 2.367% 🚀
Solana dominance has been bleeding from 2.50% down to 2.04% inside a relentless descending channel, now testing the psychological 2.00% floor. Price action remains pinned below the 200 EMA while immediate overhead resistance stacks heavily between 2.05% and 2.10%. 📊
While this early bounce off the lower boundary hints at exhausted sellers, order flow still flashes a strong bearish bias with zero confirmed reversal signals. ⚡
💬 Are you betting on a structural reclaim here, or is this just another trap before a deeper flush? 👇
⚠️ Not financial advice. Always manage your risk. 🛡️
🏷️ #SOL .D #Solana #Crypto #Trading
🔥 💎
6


·
--
$SOL slipped 6.8% to $75.80 in the last 24 hours, extending its weekly pullback amid a broader market-wide correction and heavy long liquidations.
Despite short-term selling pressure, institutional interest and ecosystem expansion remain on traders' radar as network activity stays active.
Watch the $72.00 support zone closely for a potential bounce, while reclaiming $80.00 is key to easing bearish pressure.
#solana #Binance #CryptoNews
$SOL slipped 6.8% to $75.80 in the last 24 hours, extending its weekly pullback amid a broader market-wide correction and heavy long liquidations.
Despite short-term selling pressure, institutional interest and ecosystem expansion remain on traders' radar as network activity stays active.
Watch the $72.00 support zone closely for a potential bounce, while reclaiming $80.00 is key to easing bearish pressure.
#solana #Binance #CryptoNews
Despite short-term selling pressure, institutional interest and ecosystem expansion remain on traders' radar as network activity stays active.
Watch the $72.00 support zone closely for a potential bounce, while reclaiming $80.00 is key to easing bearish pressure.
#solana #Binance #CryptoNews
91

·
--
Bearish
Back on $SOL , and on the same side as last time.
New short, opened few hours ago:
📍 Entry: 68.84
💰 Now: 68.00
🛑 Stop: 74.64
It opened into a heavy day. Over the last 24h, BTC dropped −5.1% and $SOL fell −5.9%.
My last $SOL short closed at +49.2%.
That result doesn't carry over to this trade. This one starts at zero. 🧊
The stop is set, and it stays where it is.
If it gets hit, you'll see the loss here, same as you'd see a win.
I'll post updates as it moves and the exit when it's done.
Does opening a short after a red day make you more nervous or less?
#SOL #Solana #CryptoTrading #FuturesTrading
Back on $SOL , and on the same side as last time.
New short, opened few hours ago:
📍 Entry: 68.84
💰 Now: 68.00
🛑 Stop: 74.64
It opened into a heavy day. Over the last 24h, BTC dropped −5.1% and $SOL fell −5.9%.
My last $SOL short closed at +49.2%.
That result doesn't carry over to this trade. This one starts at zero. 🧊
The stop is set, and it stays where it is.
If it gets hit, you'll see the loss here, same as you'd see a win.
I'll post updates as it moves and the exit when it's done.
Does opening a short after a red day make you more nervous or less?
#SOL #Solana #CryptoTrading #FuturesTrading
New short, opened few hours ago:
📍 Entry: 68.84
💰 Now: 68.00
🛑 Stop: 74.64
It opened into a heavy day. Over the last 24h, BTC dropped −5.1% and $SOL fell −5.9%.
My last $SOL short closed at +49.2%.
That result doesn't carry over to this trade. This one starts at zero. 🧊
The stop is set, and it stays where it is.
If it gets hit, you'll see the loss here, same as you'd see a win.
I'll post updates as it moves and the exit when it's done.
Does opening a short after a red day make you more nervous or less?
#SOL #Solana #CryptoTrading #FuturesTrading
199

$SOL AT $67.97: WHO WINS THE $67 BATTLEGROUND?
Solana ($SOL) is sitting on a knife-edge at $67.97 after sliding from $95.35 this month. Both sides have clear triggers:
🐂 THE BULL CASE
• Testing a major multi-month support shelf ($67.00) after a 29% drawdown.
• Reclaiming $72.34 signals supply absorption and opens a bounce toward $75.46–$80.00.
🐻 THE BEAR CASE
• Trading ~24% below its $88.68 200-day average.
• Ongoing staking exits (2.31M SOL) and soft ETF flows pressure sentiment.
• Losing $67.00 exposes a sweep toward $60.00–$62.00.
🎯 VERDICT: Bearish trend, critical support test. Trade the reaction at $67.00.
Which side wins—🐂 Bulls back to $75+ or 🐻 Bears below $67?
#solana
{future}(SOLUSDT)
$SOL AT $67.97: WHO WINS THE $67 BATTLEGROUND?
Solana ($SOL ) is sitting on a knife-edge at $67.97 after sliding from $95.35 this month. Both sides have clear triggers:
🐂 THE BULL CASE
• Testing a major multi-month support shelf ($67.00) after a 29% drawdown.
• Reclaiming $72.34 signals supply absorption and opens a bounce toward $75.46–$80.00.
🐻 THE BEAR CASE
• Trading ~24% below its $88.68 200-day average.
• Ongoing staking exits (2.31M SOL) and soft ETF flows pressure sentiment.
• Losing $67.00 exposes a sweep toward $60.00–$62.00.
🎯 VERDICT: Bearish trend, critical support test. Trade the reaction at $67.00.
Which side wins—🐂 Bulls back to $75+ or 🐻 Bears below $67?
#solana
Solana ($SOL ) is sitting on a knife-edge at $67.97 after sliding from $95.35 this month. Both sides have clear triggers:
🐂 THE BULL CASE
• Testing a major multi-month support shelf ($67.00) after a 29% drawdown.
• Reclaiming $72.34 signals supply absorption and opens a bounce toward $75.46–$80.00.
🐻 THE BEAR CASE
• Trading ~24% below its $88.68 200-day average.
• Ongoing staking exits (2.31M SOL) and soft ETF flows pressure sentiment.
• Losing $67.00 exposes a sweep toward $60.00–$62.00.
🎯 VERDICT: Bearish trend, critical support test. Trade the reaction at $67.00.
Which side wins—🐂 Bulls back to $75+ or 🐻 Bears below $67?
#solana
114

😂 Today's Market: Is a "Red Sale" Going On?!
Opened the screen and saw the trio handing out discounts like it's a clearance event! 😅👇
$SOL
{spot}(SOLUSDT)
$XRP
{spot}(XRPUSDT)
$ZEC
{spot}(ZECUSDT)
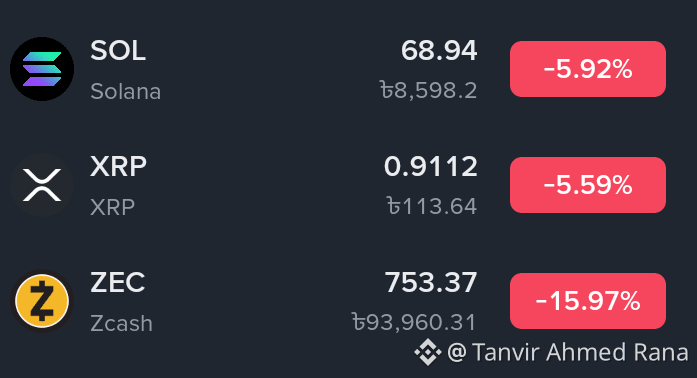
$ SOL(Solana): Sitting at 68.94 (৳8,598.2) — down -5.92%! Looks like the king of speed is taking a slow stroll downhill today.
$XRP: At 0.9112 (৳113.64) — down -5.59%! Basically saying, "Bro, five or six percent is nothing, I'm just taking a deep breath!"
$ ZEC(Zcash): Trading at 753.37 (৳93,960.31) — dropped -15.97%! True to its privacy roots, it slipped down with a massive discount before anyone even noticed! 🙈
Real Talk:
For anyone ready to hit panic sell at the first sight of red—take a breath, check the chart calmly, and don't rush! The real game is all about patience and solid risk management.
📌 Disclaimer:
Just lighthearted market banter, not financial advice. Always do your own research (DYOR) before making any moves.
#BinanceSquareFamily #Binance #solana #xrp #zec
😂 Today's Market: Is a "Red Sale" Going On?!
Opened the screen and saw the trio handing out discounts like it's a clearance event! 😅👇
$SOL
$XRP
$ZEC
$ SOL(Solana): Sitting at 68.94 (৳8,598.2) — down -5.92%! Looks like the king of speed is taking a slow stroll downhill today.
$XRP : At 0.9112 (৳113.64) — down -5.59%! Basically saying, "Bro, five or six percent is nothing, I'm just taking a deep breath!"
$ ZEC(Zcash): Trading at 753.37 (৳93,960.31) — dropped -15.97%! True to its privacy roots, it slipped down with a massive discount before anyone even noticed! 🙈
Real Talk:
For anyone ready to hit panic sell at the first sight of red—take a breath, check the chart calmly, and don't rush! The real game is all about patience and solid risk management.
📌 Disclaimer:
Just lighthearted market banter, not financial advice. Always do your own research (DYOR) before making any moves.
#BinanceSquareFamily #Binance #solana #xrp #zec
Opened the screen and saw the trio handing out discounts like it's a clearance event! 😅👇
$SOL
$XRP
$ZEC
$ SOL(Solana): Sitting at 68.94 (৳8,598.2) — down -5.92%! Looks like the king of speed is taking a slow stroll downhill today.
$XRP : At 0.9112 (৳113.64) — down -5.59%! Basically saying, "Bro, five or six percent is nothing, I'm just taking a deep breath!"
$ ZEC(Zcash): Trading at 753.37 (৳93,960.31) — dropped -15.97%! True to its privacy roots, it slipped down with a massive discount before anyone even noticed! 🙈
Real Talk:
For anyone ready to hit panic sell at the first sight of red—take a breath, check the chart calmly, and don't rush! The real game is all about patience and solid risk management.
📌 Disclaimer:
Just lighthearted market banter, not financial advice. Always do your own research (DYOR) before making any moves.
#BinanceSquareFamily #Binance #solana #xrp #zec
321

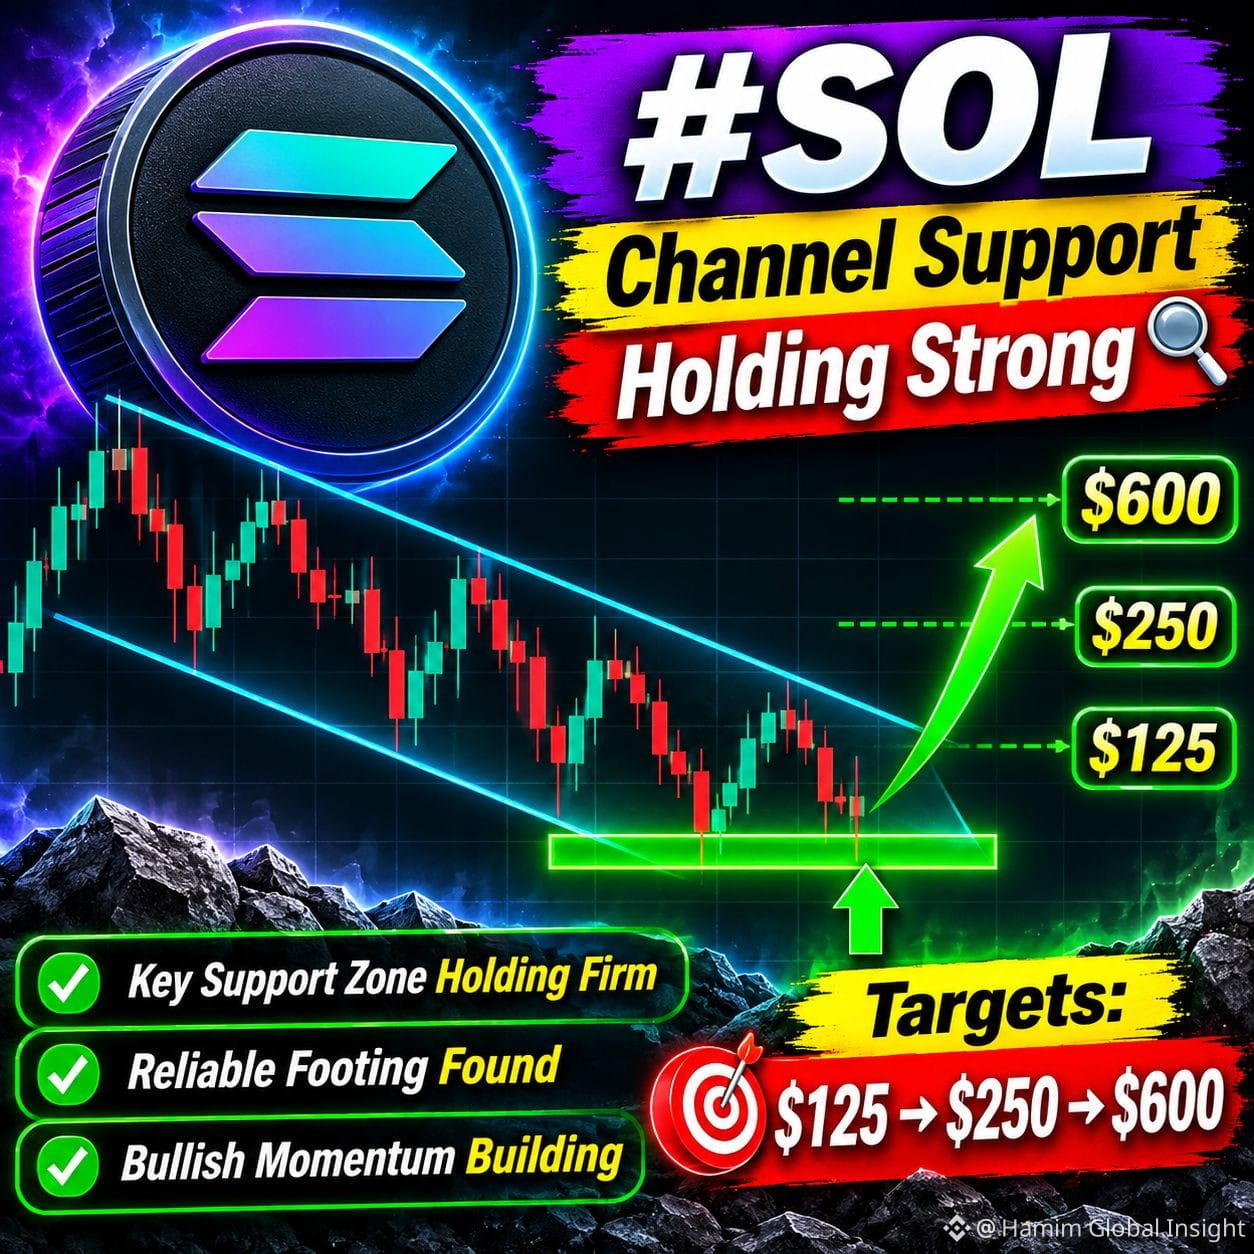
🔍 $SOL is trading near the lower boundary of its descending weekly channel, and the key support zone is still holding strong.
📈 Buyers may be gaining momentum around this important level, putting these targets on the radar:
🎯 $125 → $250 → $600
If support continues to hold, a bigger recovery could be possible. 👀
Can Solana make its next major comeback?
#Solana #SOL #CryptoTrading #Altcoins #CryptoMarket
🔍 $SOL is trading near the lower boundary of its descending weekly channel, and the key support zone is still holding strong.
📈 Buyers may be gaining momentum around this important level, putting these targets on the radar:
🎯 $125 → $250 → $600
If support continues to hold, a bigger recovery could be possible. 👀
Can Solana make its next major comeback?
#Solana #SOL #CryptoTrading #Altcoins #CryptoMarket
📈 Buyers may be gaining momentum around this important level, putting these targets on the radar:
🎯 $125 → $250 → $600
If support continues to hold, a bigger recovery could be possible. 👀
Can Solana make its next major comeback?
#Solana #SOL #CryptoTrading #Altcoins #CryptoMarket
1
148
Log in to explore more content
Join global crypto users on Binance Square
⚡️ Get latest and useful information about crypto.
💬 Trusted by the world’s largest crypto exchange.
👍 Discover real insights from verified creators.
Email / Phone number
Trending Topics
1
#CanBTCReboundAfterFallingBelow60K?
355,715 views
1,482 Discussing
2
#GlobalStocksFaceLongestLosingStreakSince2023
117,251 views
1,055 Discussing
3
#BlackRockIBITPostsRecord$541MSingleDayOutflow
588 views
15 Discussing
4
#AnthropicPlungesTowardIPOPriceonDay2
56,610 views
564 Discussing
5
#TwentyOneCapitalAdds172.25BTC
9,276 views
143 Discussing
6
#HKBillWouldExcludeTokenizedDepositsFromVirtualAssets
819 views
14 Discussing
7
#BNBDropsBelow540USDTWith8.46%DailyDecline
30,205 views
247 Discussing
8
#HKBillProposesHK$100KFineForUnauthorizedCryptoTitles
999 views
14 Discussing
9
#BitMineFaces$10.1BUnrealizedETHLoss
1,955 views
18 Discussing
10
#StrategyReports$35BNetReserves
1,814 views
17 Discussing