
#sol
sol
121.5M views
298,547 Discussing
Hot
Latest

Everyone has a different $SOL target for 2027. $150, $250 or even $400? 👀
But smart investors are watching more than price predictions. 👇
🔹 No fixed maximum supply
🔹 New SOL issued through staking rewards 🔹 Inflation declines 15% annually
🔹 50% of base transaction fees are burned
The real question: Can Solana's growing demand offset its new token supply?
Because network adoption doesn't automatically translate into token price growth.
💎 Watch the supply. Measure the demand.
What's your realistic $SOL target for 2027 — and what's your biggest reason?
#sol #solana #Crypto
Everyone has a different $SOL target for 2027. $150, $250 or even $400? 👀
But smart investors are watching more than price predictions. 👇
🔹 No fixed maximum supply
🔹 New SOL issued through staking rewards 🔹 Inflation declines 15% annually
🔹 50% of base transaction fees are burned
The real question: Can Solana's growing demand offset its new token supply?
Because network adoption doesn't automatically translate into token price growth.
💎 Watch the supply. Measure the demand.
What's your realistic $SOL target for 2027 — and what's your biggest reason?
#sol #solana #Crypto
But smart investors are watching more than price predictions. 👇
🔹 No fixed maximum supply
🔹 New SOL issued through staking rewards 🔹 Inflation declines 15% annually
🔹 50% of base transaction fees are burned
The real question: Can Solana's growing demand offset its new token supply?
Because network adoption doesn't automatically translate into token price growth.
💎 Watch the supply. Measure the demand.
What's your realistic $SOL target for 2027 — and what's your biggest reason?
#sol #solana #Crypto

2
2k
·
--
Bearish
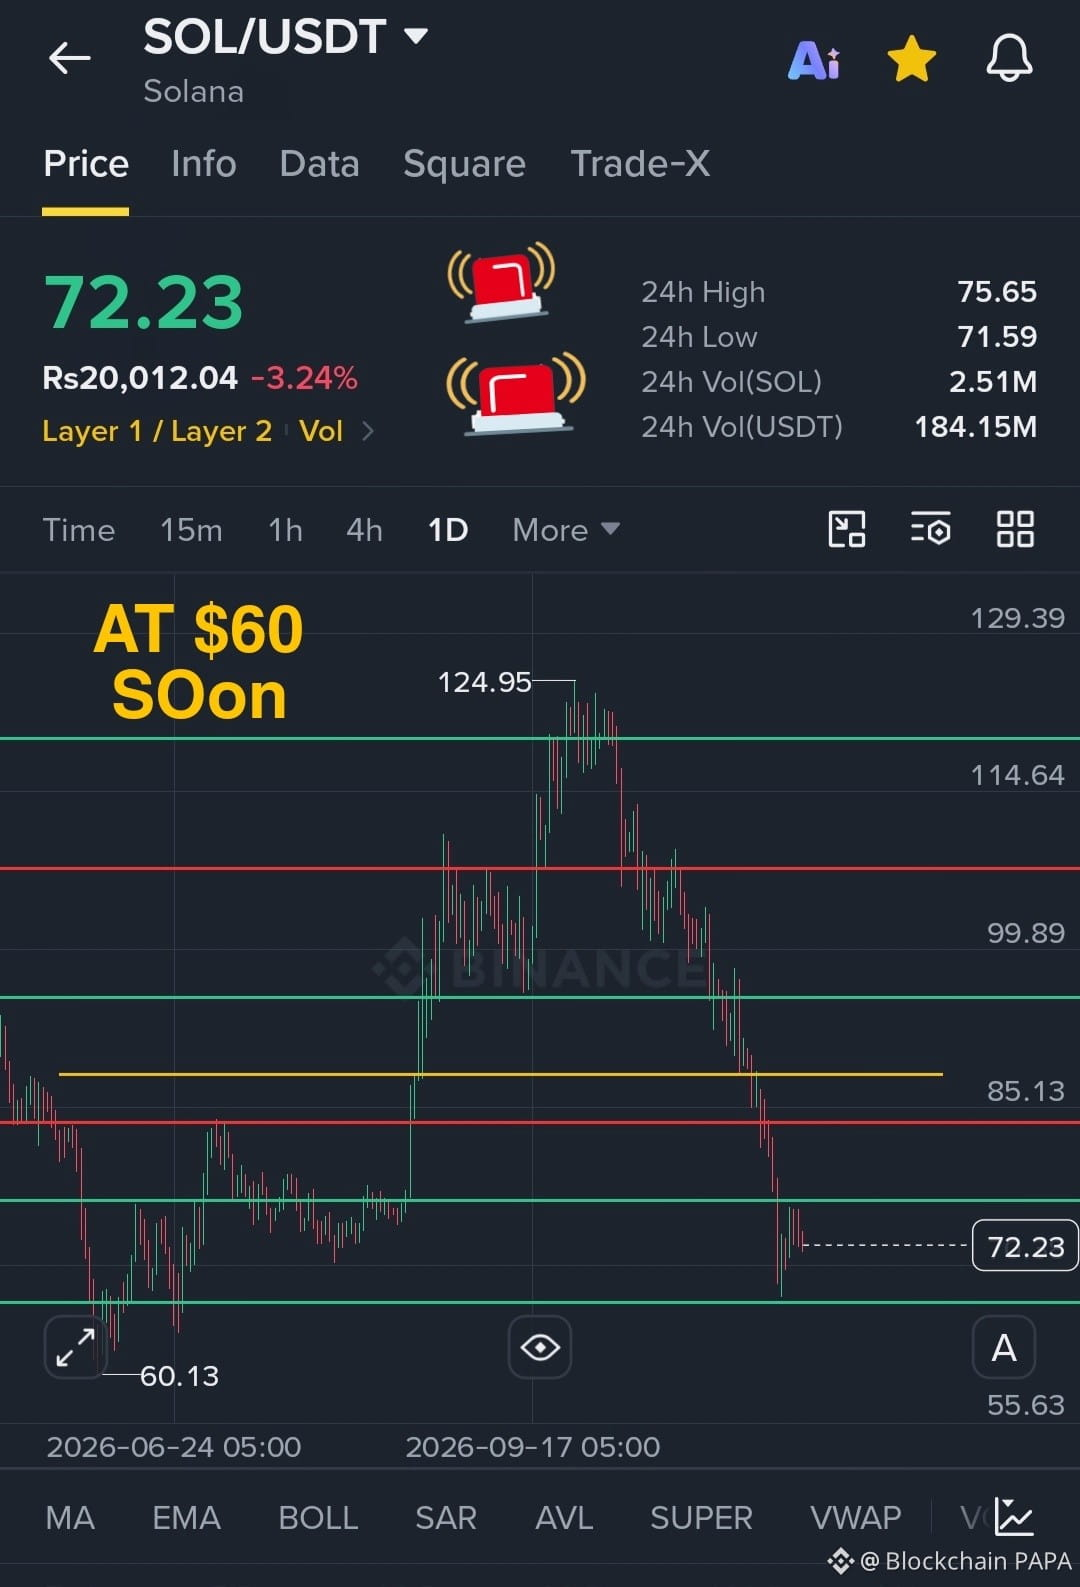
🚨 $SOL BE CAREFUL! $60 COULD BE THE NEXT BIG LEVEL!
#sol
Solana's chart structure looks bearish with $60.13 emerging as a potential downside target. A bounce toward $78 $80 could offer a short opportunity while resistance above $85 is an important invalidation zone
🚨 $SOL BE CAREFUL! $60 COULD BE THE NEXT BIG LEVEL!
#sol
Solana's chart structure looks bearish with $60.13 emerging as a potential downside target. A bounce toward $78 $80 could offer a short opportunity while resistance above $85 is an important invalidation zone
#sol
Solana's chart structure looks bearish with $60.13 emerging as a potential downside target. A bounce toward $78 $80 could offer a short opportunity while resistance above $85 is an important invalidation zone
Ayesha maqbool:
yes next is 60
3
7
3.1k

·
--
Bullish
#sol $SOL listen guys why I think the market will go up in the up coming days.
I have been looking at the charts for the past couple of years and It had taught me many things.
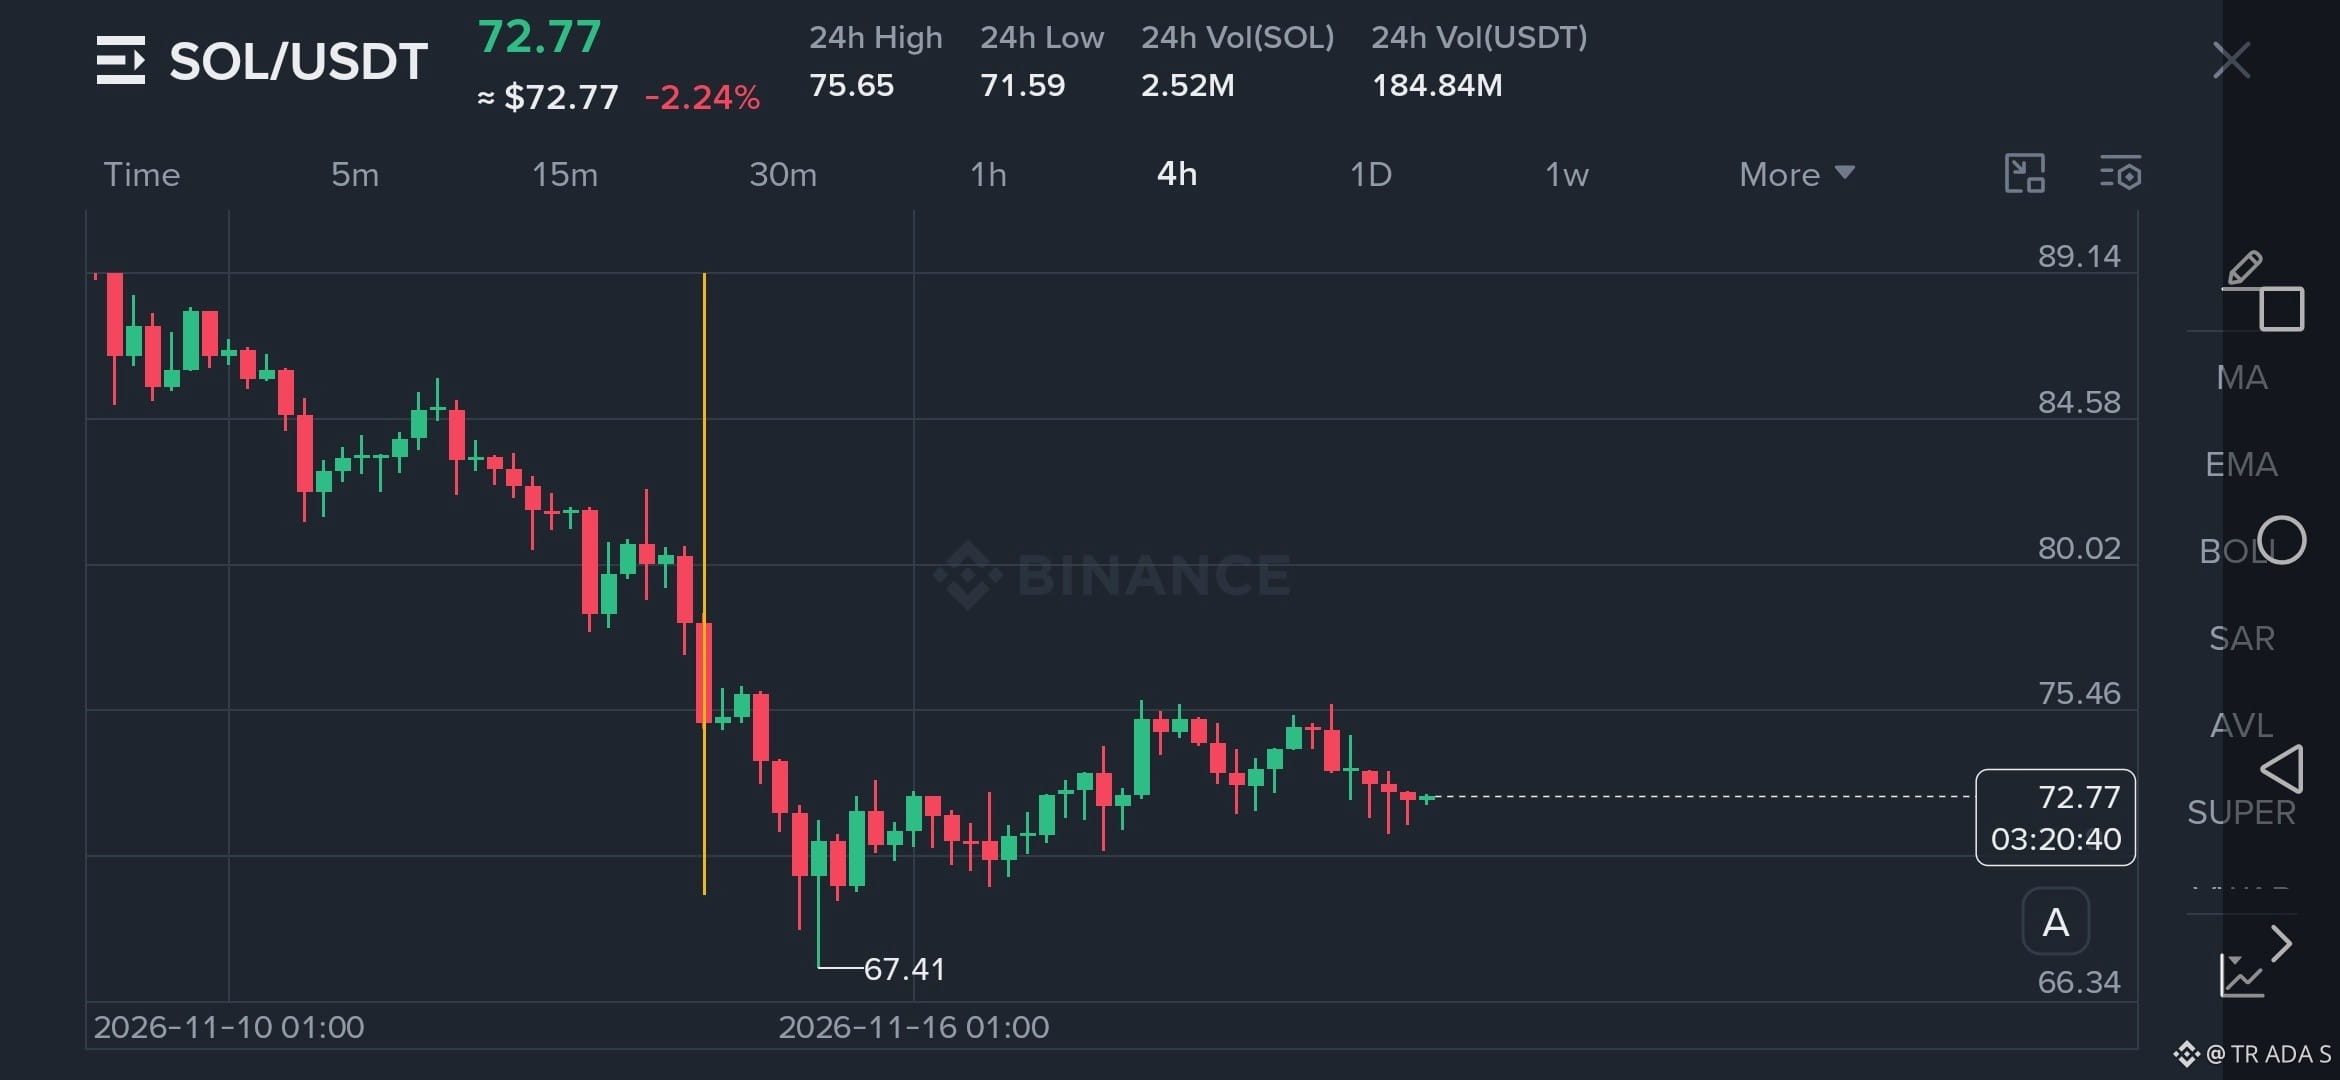
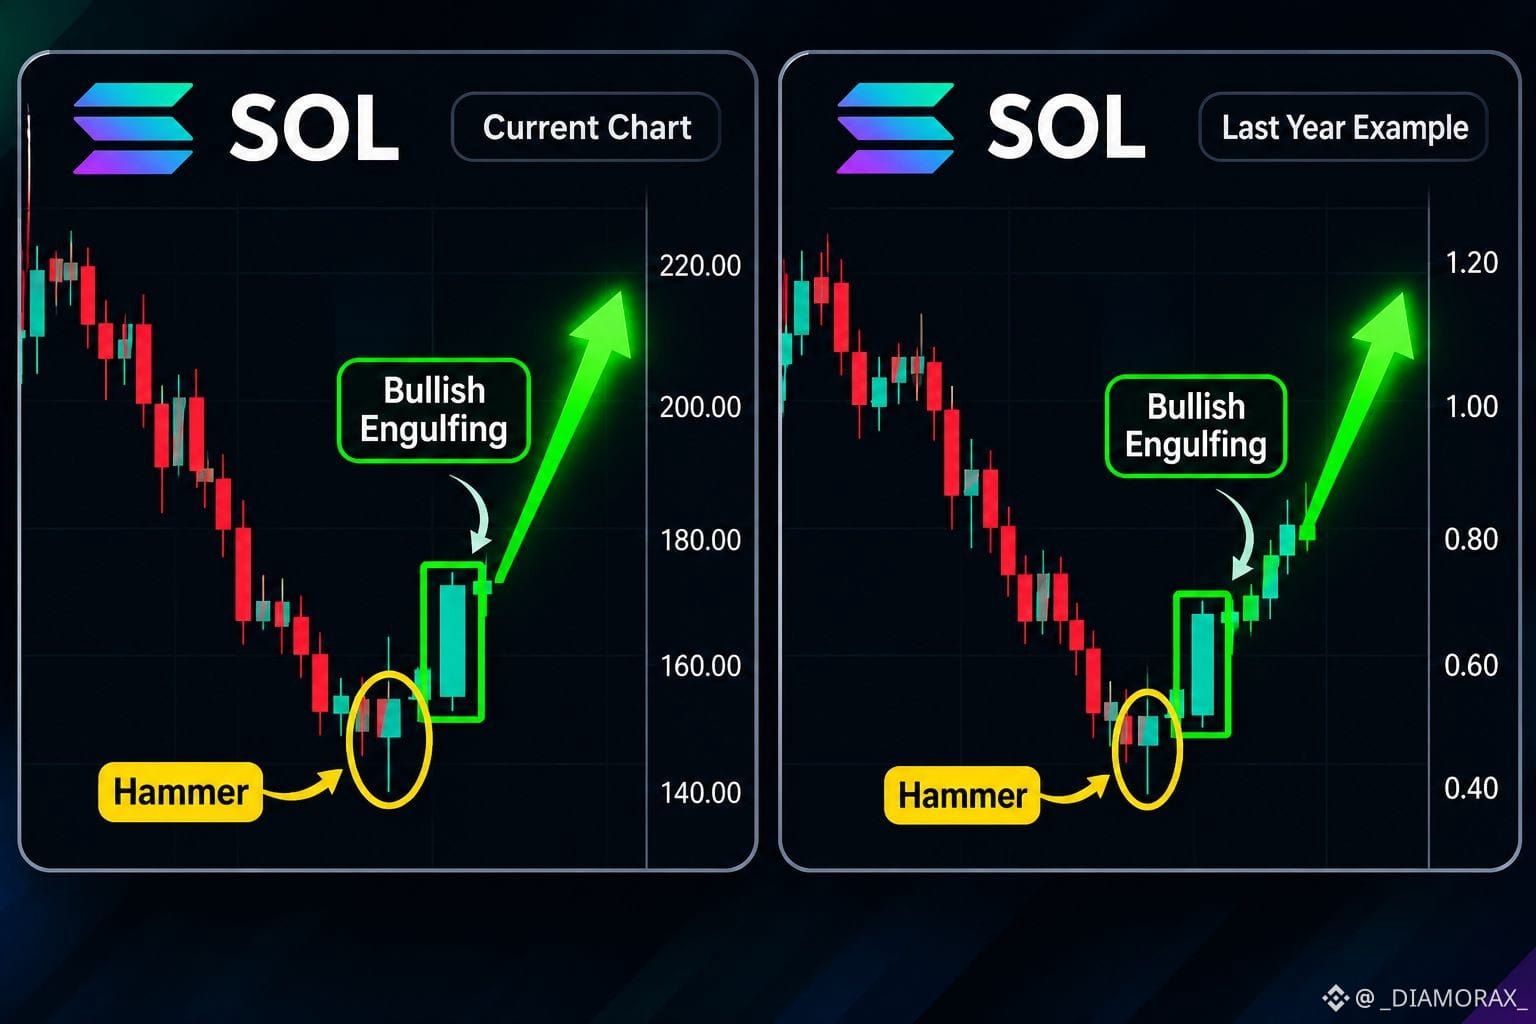
1. On the left side is the chart of #sol , currently at this price, which has made a hammer and then a bullish engulfing.
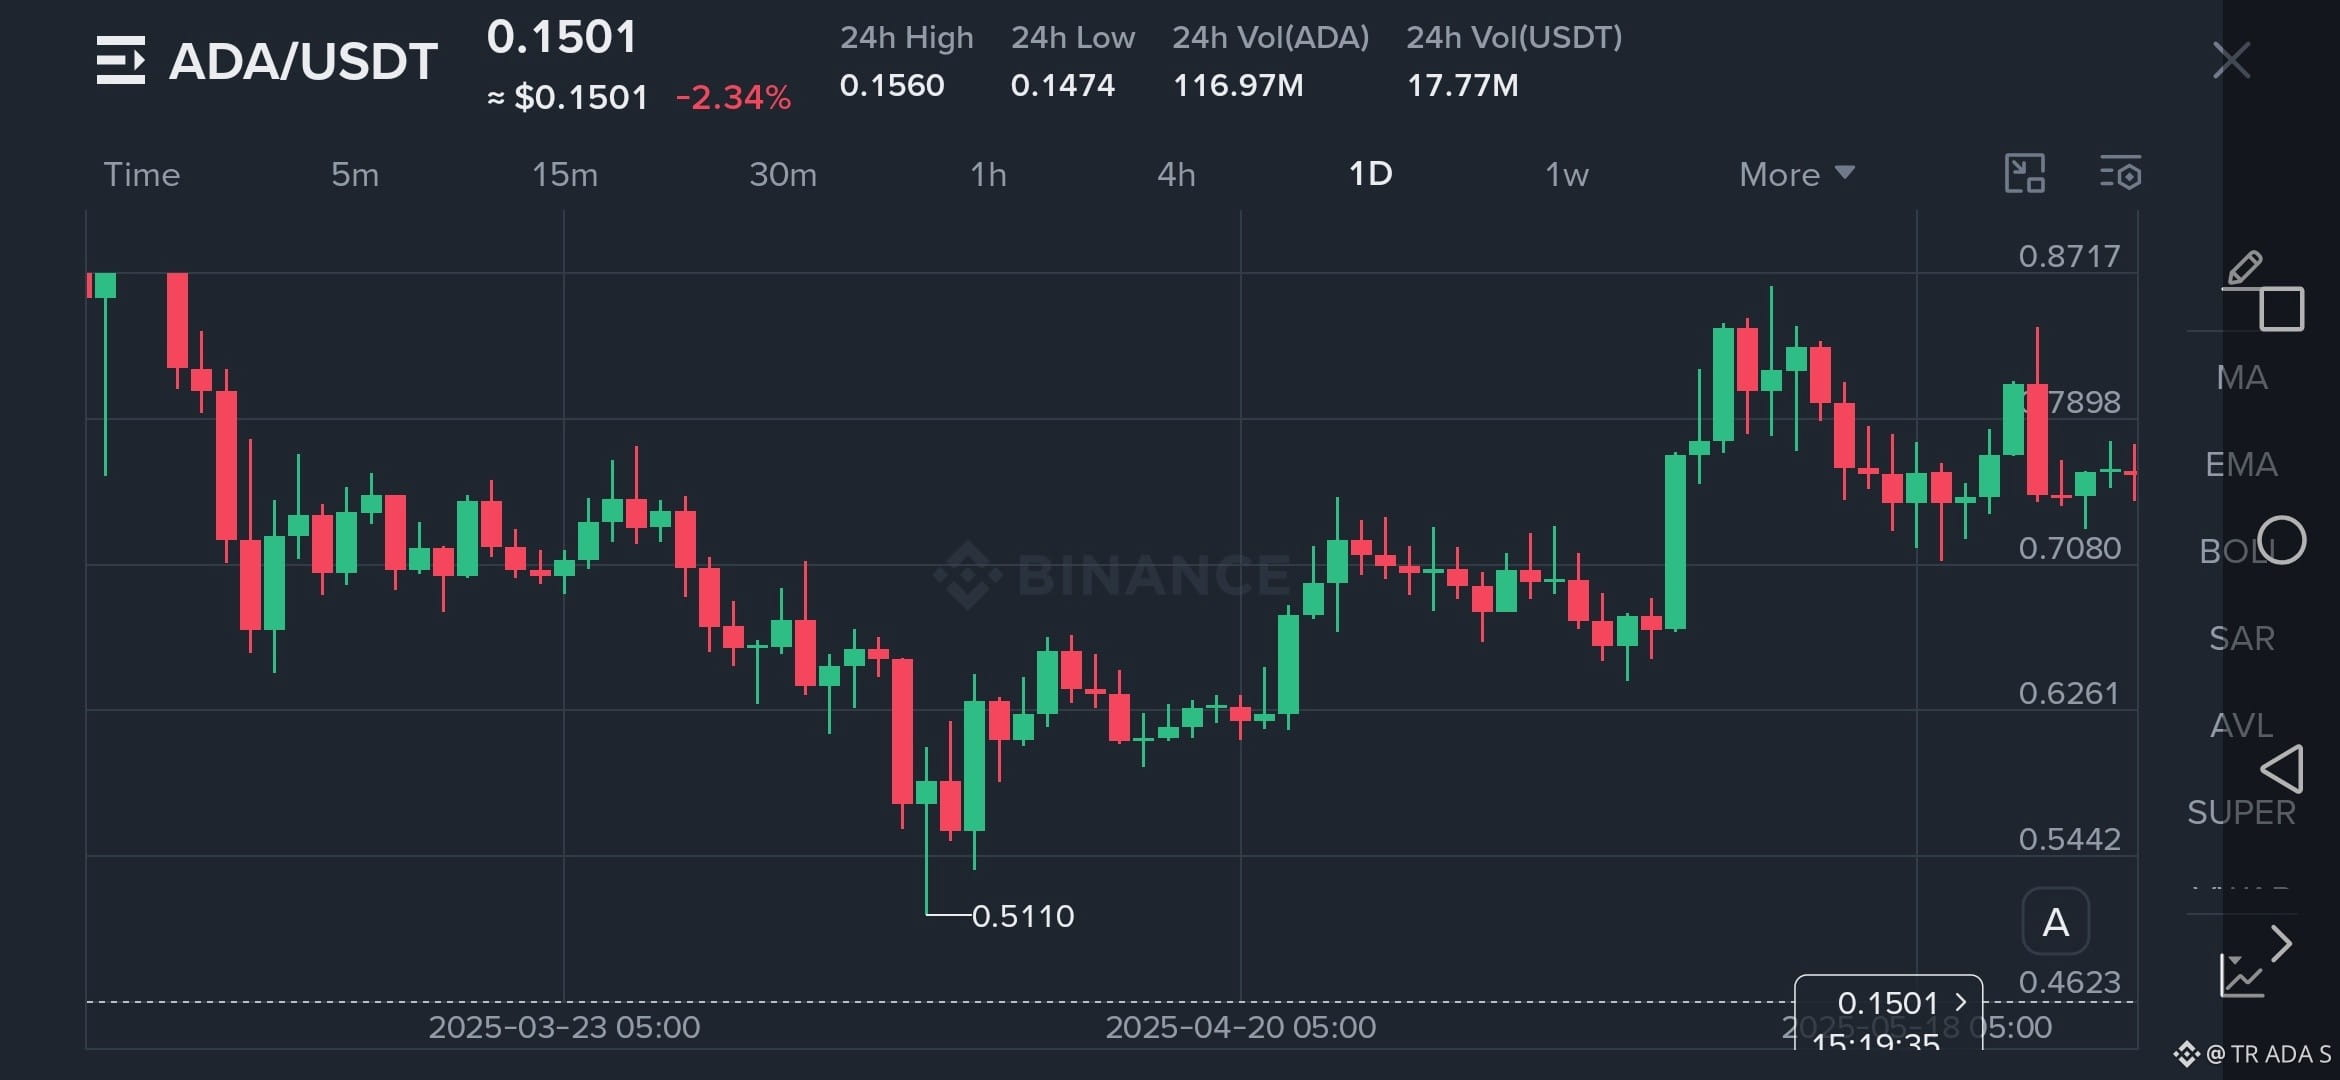
2. On the right side is the chart of #ada from
Almost a year ago. It had made the same hammer, the same bullish engulfing, and then after some time it gave a beautiful move to the upside.
So the thing is, place your SL below that hammer, if you are couatious, and buy.
#sol $SOL listen guys why I think the market will go up in the up coming days.
I have been looking at the charts for the past couple of years and It had taught me many things.
1. On the left side is the chart of #sol , currently at this price, which has made a hammer and then a bullish engulfing.
2. On the right side is the chart of #ada from
Almost a year ago. It had made the same hammer, the same bullish engulfing, and then after some time it gave a beautiful move to the upside.
So the thing is, place your SL below that hammer, if you are couatious, and buy.
I have been looking at the charts for the past couple of years and It had taught me many things.
1. On the left side is the chart of #sol , currently at this price, which has made a hammer and then a bullish engulfing.
2. On the right side is the chart of #ada from
Almost a year ago. It had made the same hammer, the same bullish engulfing, and then after some time it gave a beautiful move to the upside.
So the thing is, place your SL below that hammer, if you are couatious, and buy.
opaleleowl:
it Can be misleading analize different time frames...I Couldn't follow the hypothesis
20
20
42.5k
·
--
🚨 SOLANA ($SOL): IS A RECOVERY COMING?
Solana is facing selling pressure, with its price testing the $68–$70 support zone.
📈 Bullish scenario: If buyers defend this level, SOL could recover toward $75 and potentially $80.
📉 Bearish scenario: If support breaks, we could see $64 or even $60.
🔥 My Take: Solana still has long-term potential, but a strong recovery needs buying volume and a Bitcoin rebound.
What do you think? Will SOL bounce back or fall to $60 first
$SOL
#solana #sol #SolanaUSTD #solanAnalysis
🚨 SOLANA ($SOL ): IS A RECOVERY COMING?
Solana is facing selling pressure, with its price testing the $68–$70 support zone.
📈 Bullish scenario: If buyers defend this level, SOL could recover toward $75 and potentially $80.
📉 Bearish scenario: If support breaks, we could see $64 or even $60.
🔥 My Take: Solana still has long-term potential, but a strong recovery needs buying volume and a Bitcoin rebound.
What do you think? Will SOL bounce back or fall to $60 first
$SOL
#solana #sol #SolanaUSTD #solanAnalysis
Solana is facing selling pressure, with its price testing the $68–$70 support zone.
📈 Bullish scenario: If buyers defend this level, SOL could recover toward $75 and potentially $80.
📉 Bearish scenario: If support breaks, we could see $64 or even $60.
🔥 My Take: Solana still has long-term potential, but a strong recovery needs buying volume and a Bitcoin rebound.
What do you think? Will SOL bounce back or fall to $60 first
$SOL
#solana #sol #SolanaUSTD #solanAnalysis
1
435

·
--
Bearish
$SOL outperformed briefly:
{spot}(SOLUSDT)
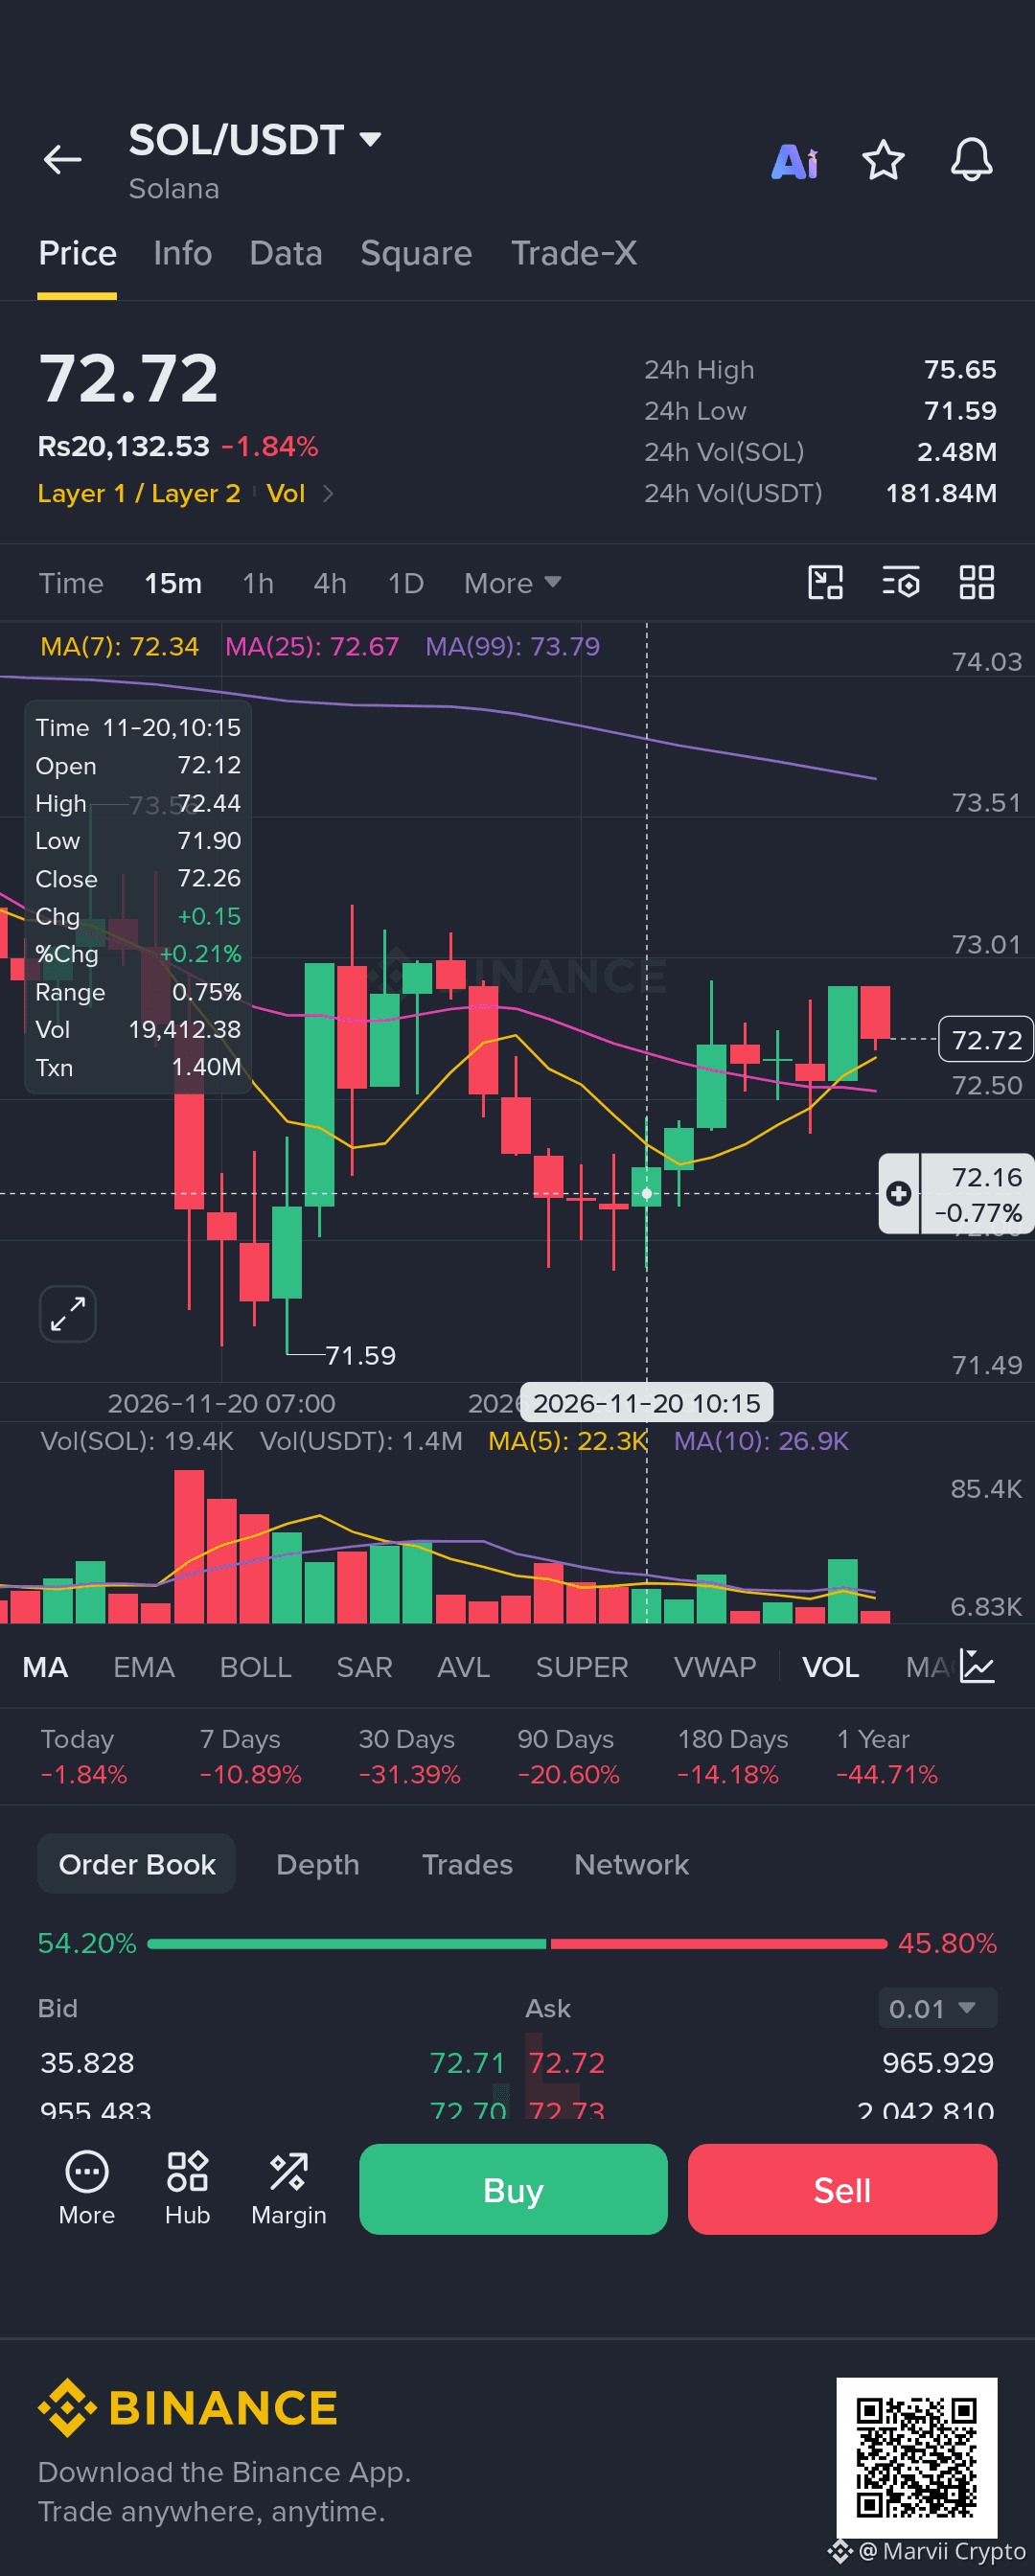
it rose 6.95% during the three-day Breakpoint conference, beat bitcoin and ether, reclaimed $75 on Nov 19, then slipped to $72.85 and stayed down 10.9% over seven days.
#CanGTA6'sLaunchLiftTTWOShares? #sol
$SOL outperformed briefly:
it rose 6.95% during the three-day Breakpoint conference, beat bitcoin and ether, reclaimed $75 on Nov 19, then slipped to $72.85 and stayed down 10.9% over seven days.
#CanGTA6'sLaunchLiftTTWOShares? #sol
it rose 6.95% during the three-day Breakpoint conference, beat bitcoin and ether, reclaimed $75 on Nov 19, then slipped to $72.85 and stayed down 10.9% over seven days.
#CanGTA6'sLaunchLiftTTWOShares? #sol
ALI DOST balochi:
🌹
8
4
2.1k

·
--
$SOL testing major support! 👀🔥
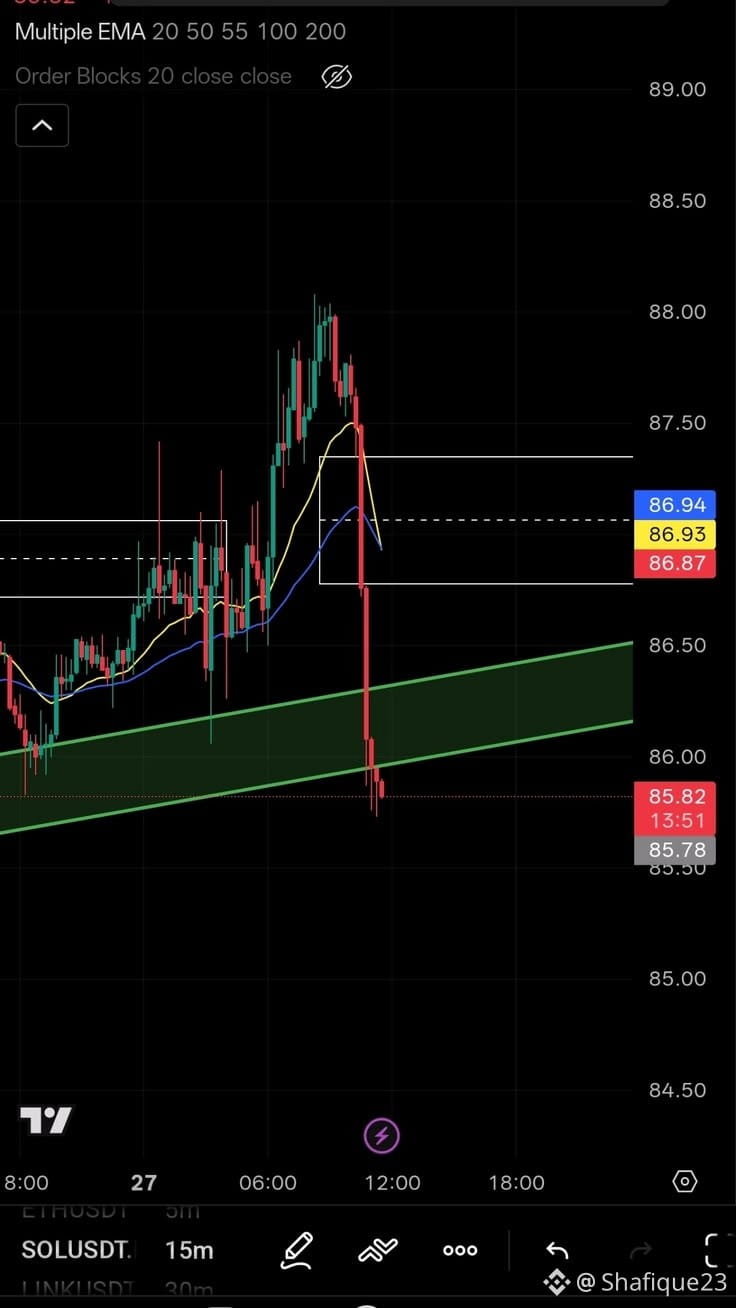
Sharp drop from $88 down to $85.82 on the 15-minute chart. Right now, SOL is sitting directly on a crucial ascending support zone.
Will the bulls defend this level, or are we heading lower? Drop your targets below! 💬👇
#Solana #SOL #BinanceSquare #CryptoAnalysis
$SOL testing major support! 👀🔥
Sharp drop from $88 down to $85.82 on the 15-minute chart. Right now, SOL is sitting directly on a crucial ascending support zone.
Will the bulls defend this level, or are we heading lower? Drop your targets below! 💬👇
#Solana #SOL #BinanceSquare #CryptoAnalysis
Sharp drop from $88 down to $85.82 on the 15-minute chart. Right now, SOL is sitting directly on a crucial ascending support zone.
Will the bulls defend this level, or are we heading lower? Drop your targets below! 💬👇
#Solana #SOL #BinanceSquare #CryptoAnalysis
Easypay link:
SOL 85؟ copyright ©️ trader 🙄
1
439

·
--
🚨$SOL
{spot}(SOLUSDT)
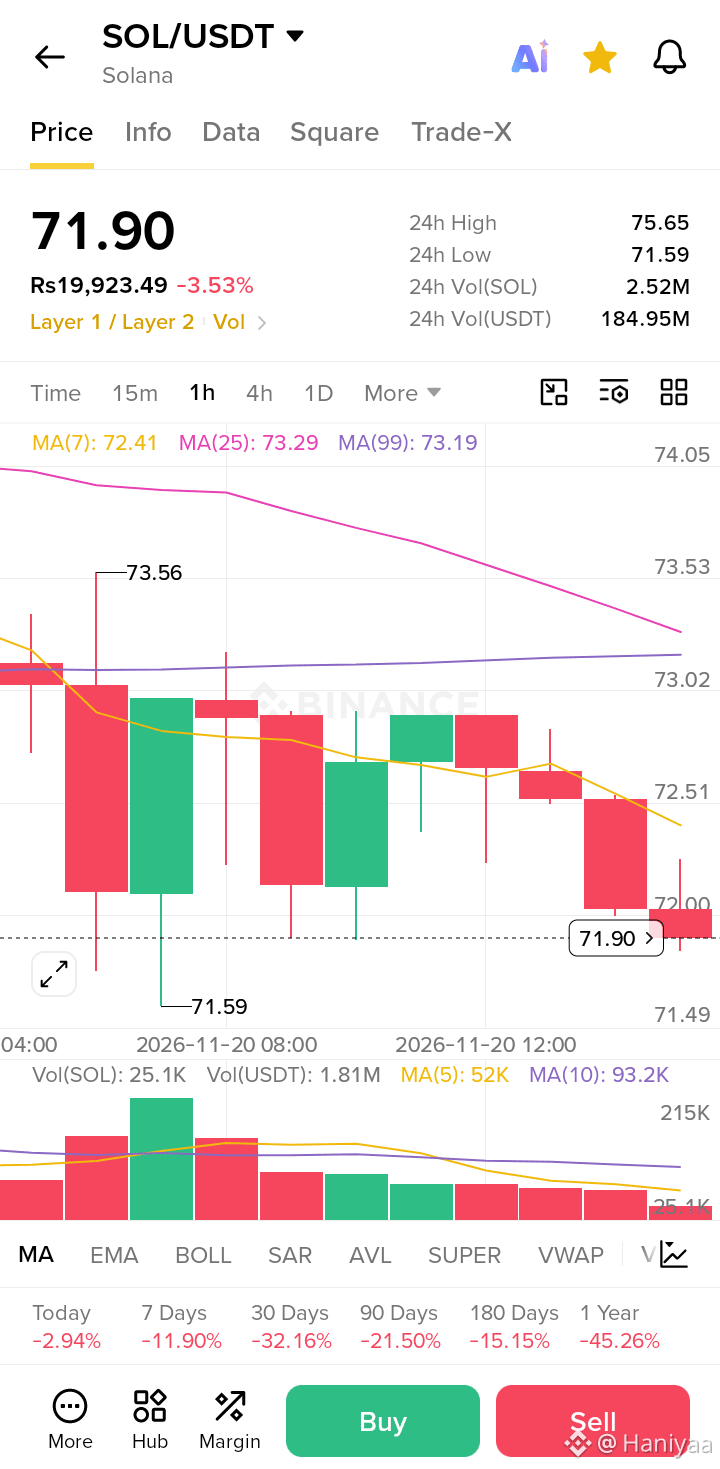
at $71.89! 👀
Everyone is asking - Will SOL go to $50?
$SOL is down -3.61% today, market is red! If $65 breaks, $50 is possible. But if $70 holds, bounce can come!
I think waiting for $50 with full money is risky, DCA is better!
Are you buying $SOL at $71 or waiting for $50? Comment your entry! 👇
#sol #Crypto
🚨$SOL
at $71.89! 👀
Everyone is asking - Will SOL go to $50?
$SOL is down -3.61% today, market is red! If $65 breaks, $50 is possible. But if $70 holds, bounce can come!
I think waiting for $50 with full money is risky, DCA is better!
Are you buying $SOL at $71 or waiting for $50? Comment your entry! 👇
#sol #Crypto
at $71.89! 👀
Everyone is asking - Will SOL go to $50?
$SOL is down -3.61% today, market is red! If $65 breaks, $50 is possible. But if $70 holds, bounce can come!
I think waiting for $50 with full money is risky, DCA is better!
Are you buying $SOL at $71 or waiting for $50? Comment your entry! 👇
#sol #Crypto
4
892

·
--
Bearish
💥 Many traders watch the price of $SOL , but smart investors watch what happens behind the chart.
🚦 3 IMPORTANT THINGS TO WATCH:
🐋 Whale Activity: Are large holders accumulating or selling?
📊 Trading Volume: Is buying volume supporting the price movement?
🛡️ Key Support: Can SOL hold its important support levels during market pressure?
$SOL
{spot}(SOLUSDT)
⚠️ Remember: A green candle doesn't guarantee a bullish trend. Always wait for confirmation before making a decision.
💡 Awareness is more powerful than FOMO. Protect your capital before chasing profits.
What do you think is $SOL preparing for recovery, or could more pressure be ahead?
#Solana #SOL #CryptoAwareness #BinanceSquare
💥 Many traders watch the price of $SOL , but smart investors watch what happens behind the chart.
🚦 3 IMPORTANT THINGS TO WATCH:
🐋 Whale Activity: Are large holders accumulating or selling?
📊 Trading Volume: Is buying volume supporting the price movement?
🛡️ Key Support: Can SOL hold its important support levels during market pressure?
$SOL
⚠️ Remember: A green candle doesn't guarantee a bullish trend. Always wait for confirmation before making a decision.
💡 Awareness is more powerful than FOMO. Protect your capital before chasing profits.
What do you think is $SOL preparing for recovery, or could more pressure be ahead?
#Solana #SOL #CryptoAwareness #BinanceSquare
🚦 3 IMPORTANT THINGS TO WATCH:
🐋 Whale Activity: Are large holders accumulating or selling?
📊 Trading Volume: Is buying volume supporting the price movement?
🛡️ Key Support: Can SOL hold its important support levels during market pressure?
$SOL
⚠️ Remember: A green candle doesn't guarantee a bullish trend. Always wait for confirmation before making a decision.
💡 Awareness is more powerful than FOMO. Protect your capital before chasing profits.
What do you think is $SOL preparing for recovery, or could more pressure be ahead?
#Solana #SOL #CryptoAwareness #BinanceSquare
1
355

Bought the $SOL dip at $69.10… but the market had other plans. 🥲📉
20x Isolated Long. Already seeing red, while SOL struggles to recover.
Not every trade starts with green. Sometimes the real test is patience and risk management.
Would you hold this position or cut the loss and wait for a better entry? 👀
#SOL #solana #BinanceFutures #cryptotrading $BTC $ETH
Bought the $SOL dip at $69.10… but the market had other plans. 🥲📉
20x Isolated Long. Already seeing red, while SOL struggles to recover.
Not every trade starts with green. Sometimes the real test is patience and risk management.
Would you hold this position or cut the loss and wait for a better entry? 👀
#SOL #solana #BinanceFutures #cryptotrading $BTC $ETH
20x Isolated Long. Already seeing red, while SOL struggles to recover.
Not every trade starts with green. Sometimes the real test is patience and risk management.
Would you hold this position or cut the loss and wait for a better entry? 👀
#SOL #solana #BinanceFutures #cryptotrading $BTC $ETH
1
1
157

·
--
Bullish
🚀 $SOL – Major Reversal Opportunity?
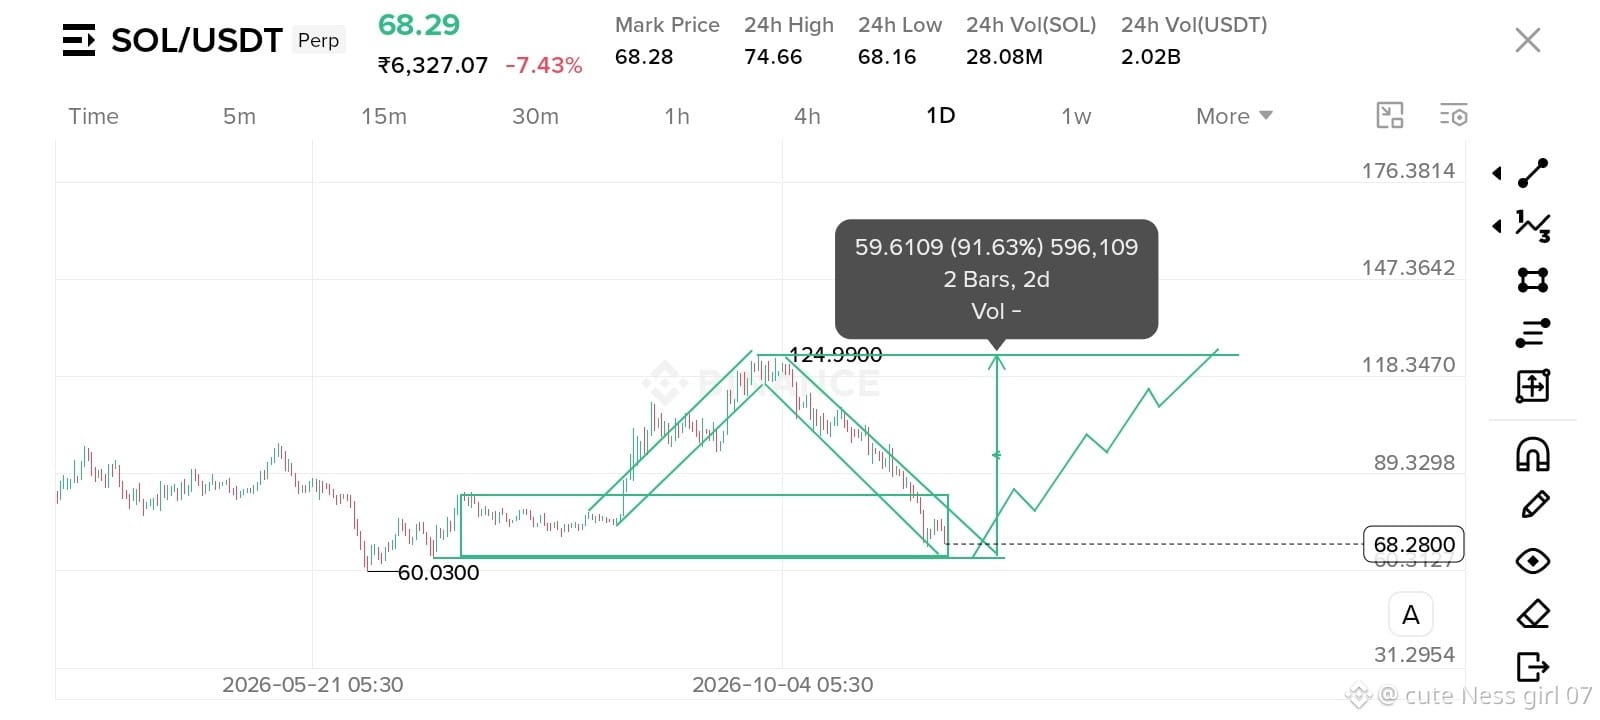
Current Price: $68.29
📊 Daily Timeframe Analysis
SOL is approaching an important historical support zone. The $60–68 region could become a potential accumulation area if buyers step in and defend this level.
A successful bullish reversal could open the door to a strong recovery.
🎯 Potential Upside Targets:
- TP1: $80
- TP2: $90
- TP3: $105
- TP4: $118
- TP5: $125
🟢 Entry Zone: $65–$69 (after bullish confirmation)
🛑 Stop Loss: Below $60
My View:
$SOL is testing a critical support area. If buyers regain control, a recovery toward $90 and potentially $125 could develop.
⚠️ Watch the daily candle close. A breakdown below support would invalidate this bullish setup.
Are you accumulating SOL at these levels? 👀
#sol #Solana
#CryptoTrading #GaoTengBitcoinETFListsOnHKEX #CanGTA6'sLaunchLiftTTWOShares?
{future}(SOLUSDT)
🚀 $SOL – Major Reversal Opportunity?
Current Price: $68.29
📊 Daily Timeframe Analysis
SOL is approaching an important historical support zone. The $60–68 region could become a potential accumulation area if buyers step in and defend this level.
A successful bullish reversal could open the door to a strong recovery.
🎯 Potential Upside Targets:
- TP1: $80
- TP2: $90
- TP3: $105
- TP4: $118
- TP5: $125
🟢 Entry Zone: $65–$69 (after bullish confirmation)
🛑 Stop Loss: Below $60
My View:
$SOL is testing a critical support area. If buyers regain control, a recovery toward $90 and potentially $125 could develop.
⚠️ Watch the daily candle close. A breakdown below support would invalidate this bullish setup.
Are you accumulating SOL at these levels? 👀
#sol #Solana
#CryptoTrading #GaoTengBitcoinETFListsOnHKEX #CanGTA6'sLaunchLiftTTWOShares?
Current Price: $68.29
📊 Daily Timeframe Analysis
SOL is approaching an important historical support zone. The $60–68 region could become a potential accumulation area if buyers step in and defend this level.
A successful bullish reversal could open the door to a strong recovery.
🎯 Potential Upside Targets:
- TP1: $80
- TP2: $90
- TP3: $105
- TP4: $118
- TP5: $125
🟢 Entry Zone: $65–$69 (after bullish confirmation)
🛑 Stop Loss: Below $60
My View:
$SOL is testing a critical support area. If buyers regain control, a recovery toward $90 and potentially $125 could develop.
⚠️ Watch the daily candle close. A breakdown below support would invalidate this bullish setup.
Are you accumulating SOL at these levels? 👀
#sol #Solana
#CryptoTrading #GaoTengBitcoinETFListsOnHKEX #CanGTA6'sLaunchLiftTTWOShares?
1
232

·
--
Article
🚨 $SOLANA: BEARISH PRESSURE OR A POWERFUL COMEBACK AHEAD?Solana ( $SOL ) is approaching a critical technical zone where the next move could define its short-term direction.
📊 Technical Breakdown:
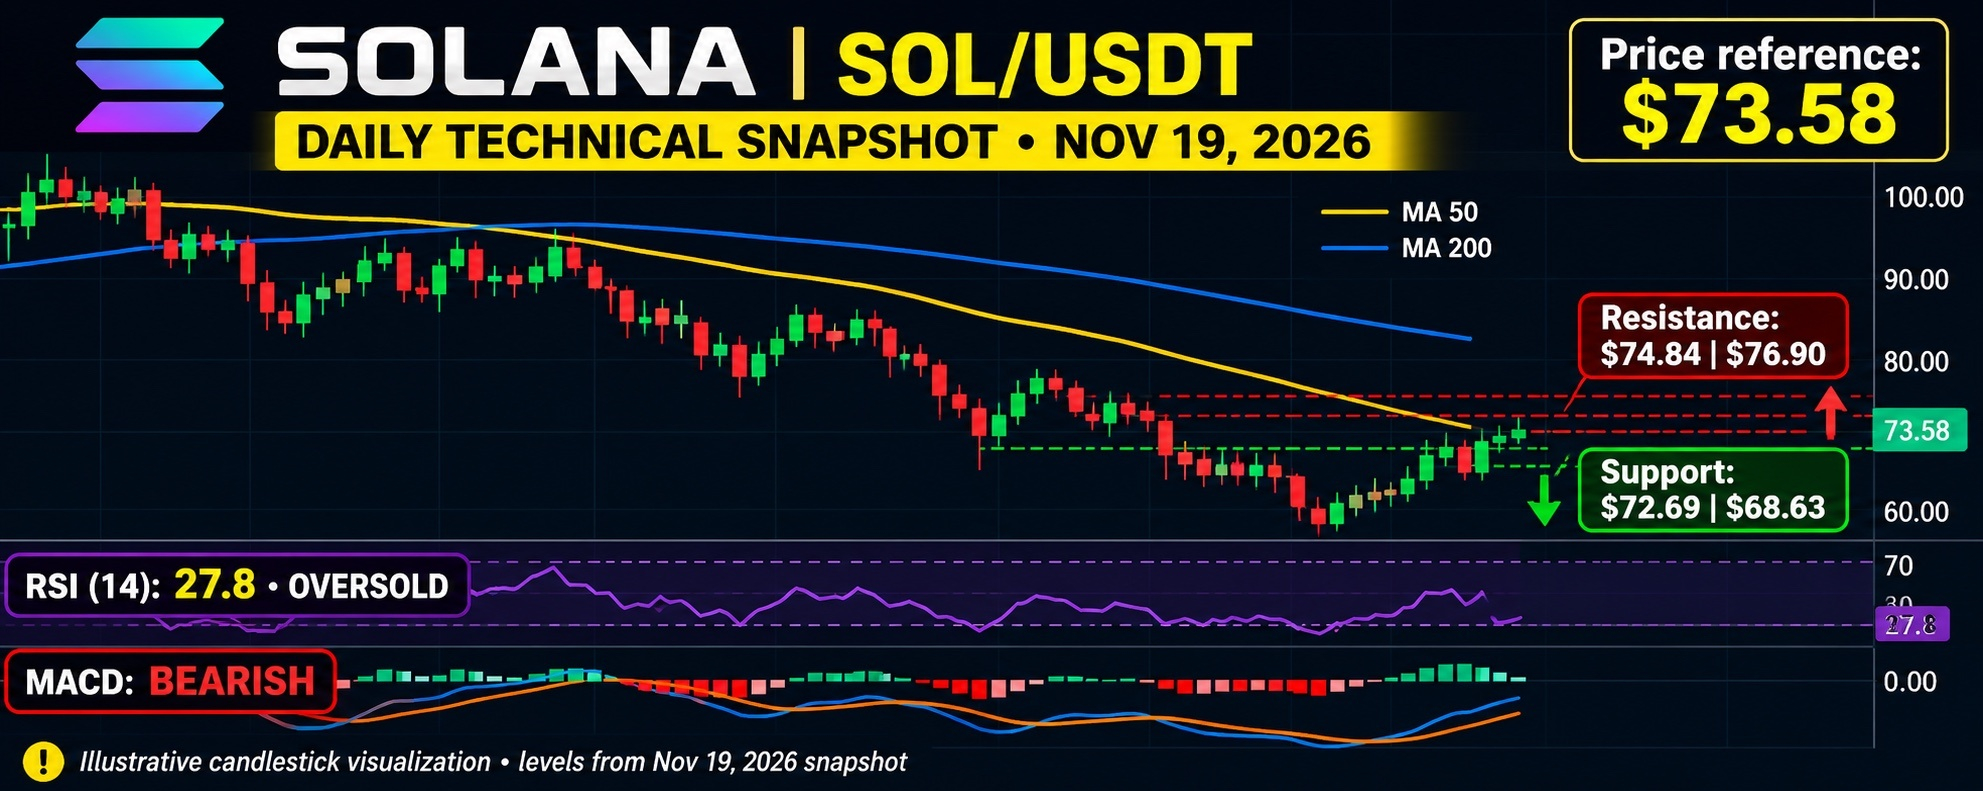
$SOL is showing a strong bearish structure, with price trading below major moving averages. RSI near 28 signals oversold conditions, while MACD remains negative, confirming that sellers still have momentum. Key support sits around $72.70, followed by $68.60. Resistance stands near $74.80–$76.90.
🔥 Market Prediction:
A strong-volume breakout above $77 could open the door toward $87 and potentially $95. However, losing $72 could expose SOL to another move toward $68 or even $64. An oversold RSI may trigger a relief bounce, but a confirmed trend reversal requires stronger buying pressure.
💡 Smart Insight: Watch volume, RSI recovery and MACD crossover before assuming the bulls are back. Solana’s next major move could create opportunities—but risk management remains essential.
#sol #solana #cryptouniverseofficial #altcoins
{future}(SOLUSDT)
🚨 $SOLANA: BEARISH PRESSURE OR A POWERFUL COMEBACK AHEAD?
Solana ( $SOL ) is approaching a critical technical zone where the next move could define its short-term direction.
📊 Technical Breakdown:
$SOL is showing a strong bearish structure, with price trading below major moving averages. RSI near 28 signals oversold conditions, while MACD remains negative, confirming that sellers still have momentum. Key support sits around $72.70, followed by $68.60. Resistance stands near $74.80–$76.90.
🔥 Market Prediction:
A strong-volume breakout above $77 could open the door toward $87 and potentially $95. However, losing $72 could expose SOL to another move toward $68 or even $64. An oversold RSI may trigger a relief bounce, but a confirmed trend reversal requires stronger buying pressure.
💡 Smart Insight: Watch volume, RSI recovery and MACD crossover before assuming the bulls are back. Solana’s next major move could create opportunities—but risk management remains essential.
#sol #solana #cryptouniverseofficial #altcoins
📊 Technical Breakdown:
$SOL is showing a strong bearish structure, with price trading below major moving averages. RSI near 28 signals oversold conditions, while MACD remains negative, confirming that sellers still have momentum. Key support sits around $72.70, followed by $68.60. Resistance stands near $74.80–$76.90.
🔥 Market Prediction:
A strong-volume breakout above $77 could open the door toward $87 and potentially $95. However, losing $72 could expose SOL to another move toward $68 or even $64. An oversold RSI may trigger a relief bounce, but a confirmed trend reversal requires stronger buying pressure.
💡 Smart Insight: Watch volume, RSI recovery and MACD crossover before assuming the bulls are back. Solana’s next major move could create opportunities—but risk management remains essential.
#sol #solana #cryptouniverseofficial #altcoins
2
1.1k

·
--
🚀 $SOL is worth watching closely!
Solana continues to attract attention in the crypto market as traders look for potential bullish opportunities.
A strong breakout with increasing trading volume could open the door to further upside.
#sol #CryptoMarkets #BinanceSquare
{spot}(SOLUSDT)
🚀 $SOL is worth watching closely!
Solana continues to attract attention in the crypto market as traders look for potential bullish opportunities.
A strong breakout with increasing trading volume could open the door to further upside.
#sol #CryptoMarkets #BinanceSquare
Solana continues to attract attention in the crypto market as traders look for potential bullish opportunities.
A strong breakout with increasing trading volume could open the door to further upside.
#sol #CryptoMarkets #BinanceSquare
1
254


·
--
Bearish
Goiz wake up Crypto Market is bleeding and panic everywhere. But this is exactly where the real money is made
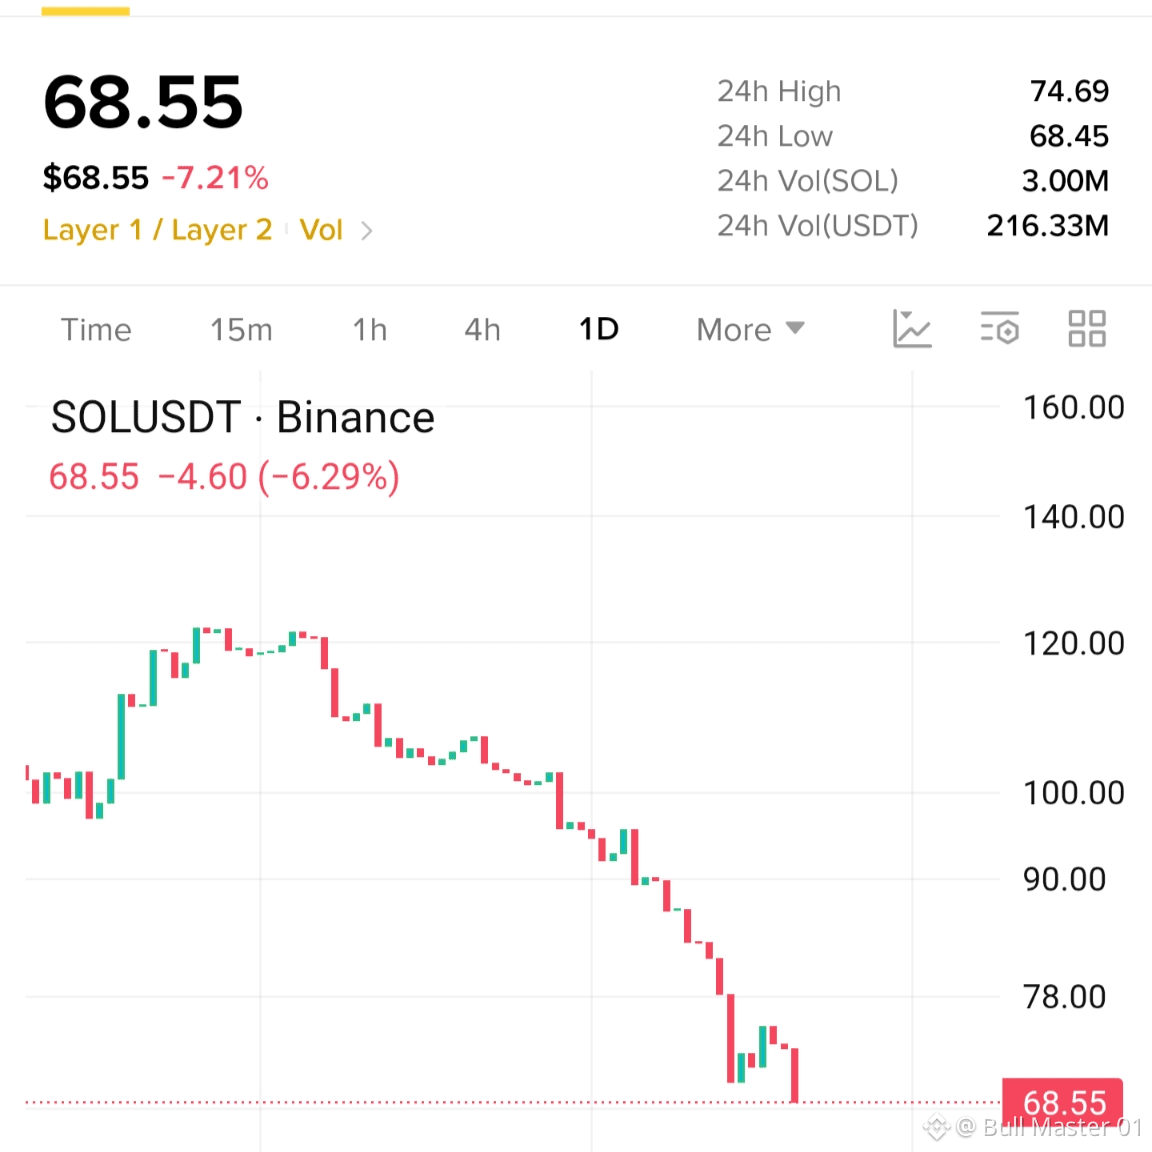
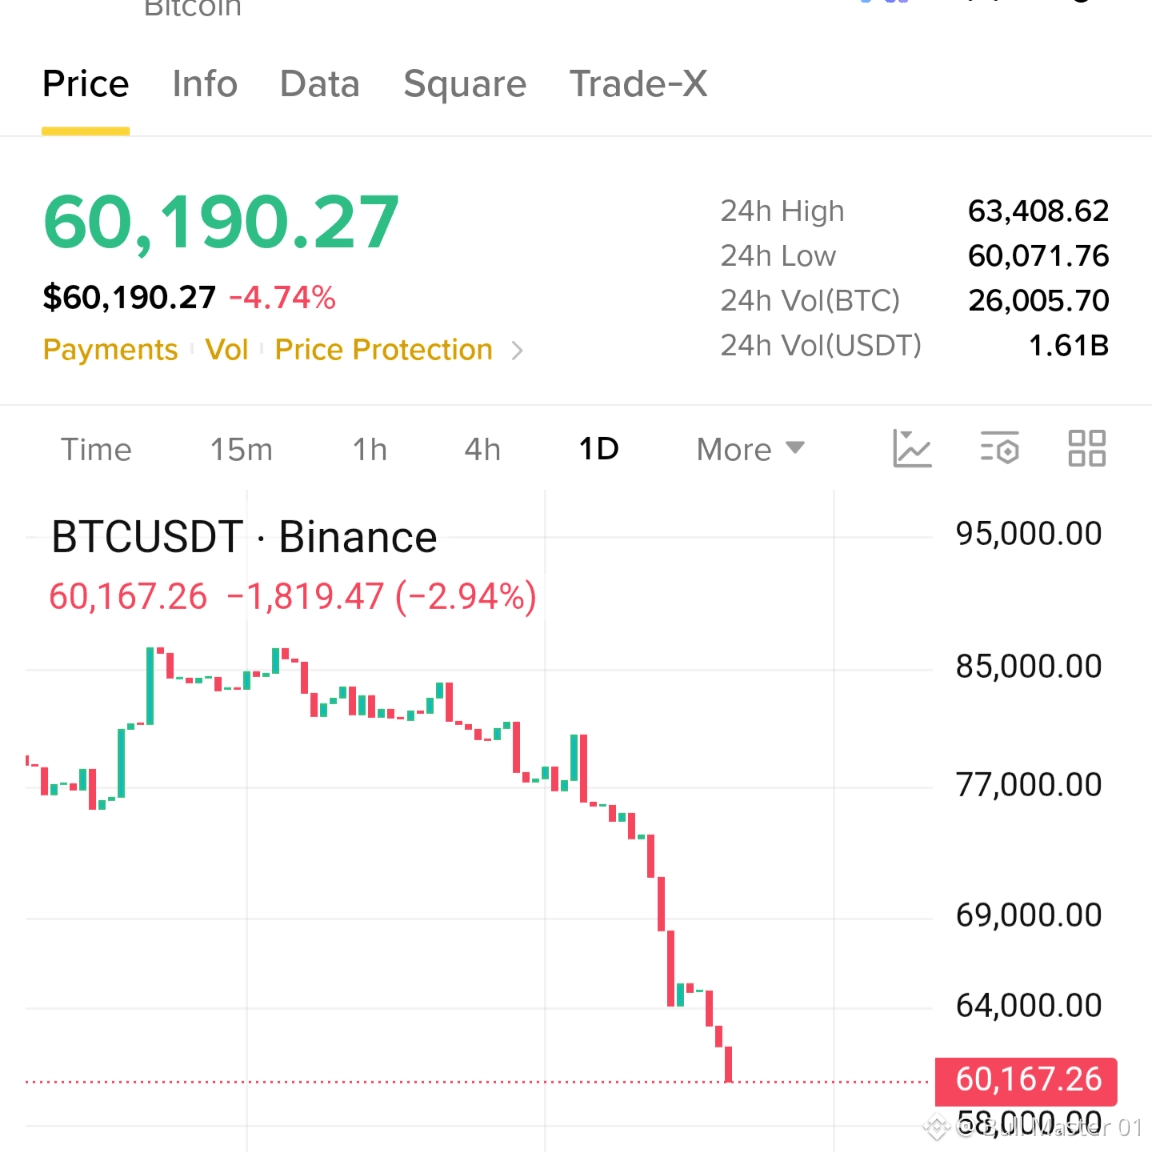
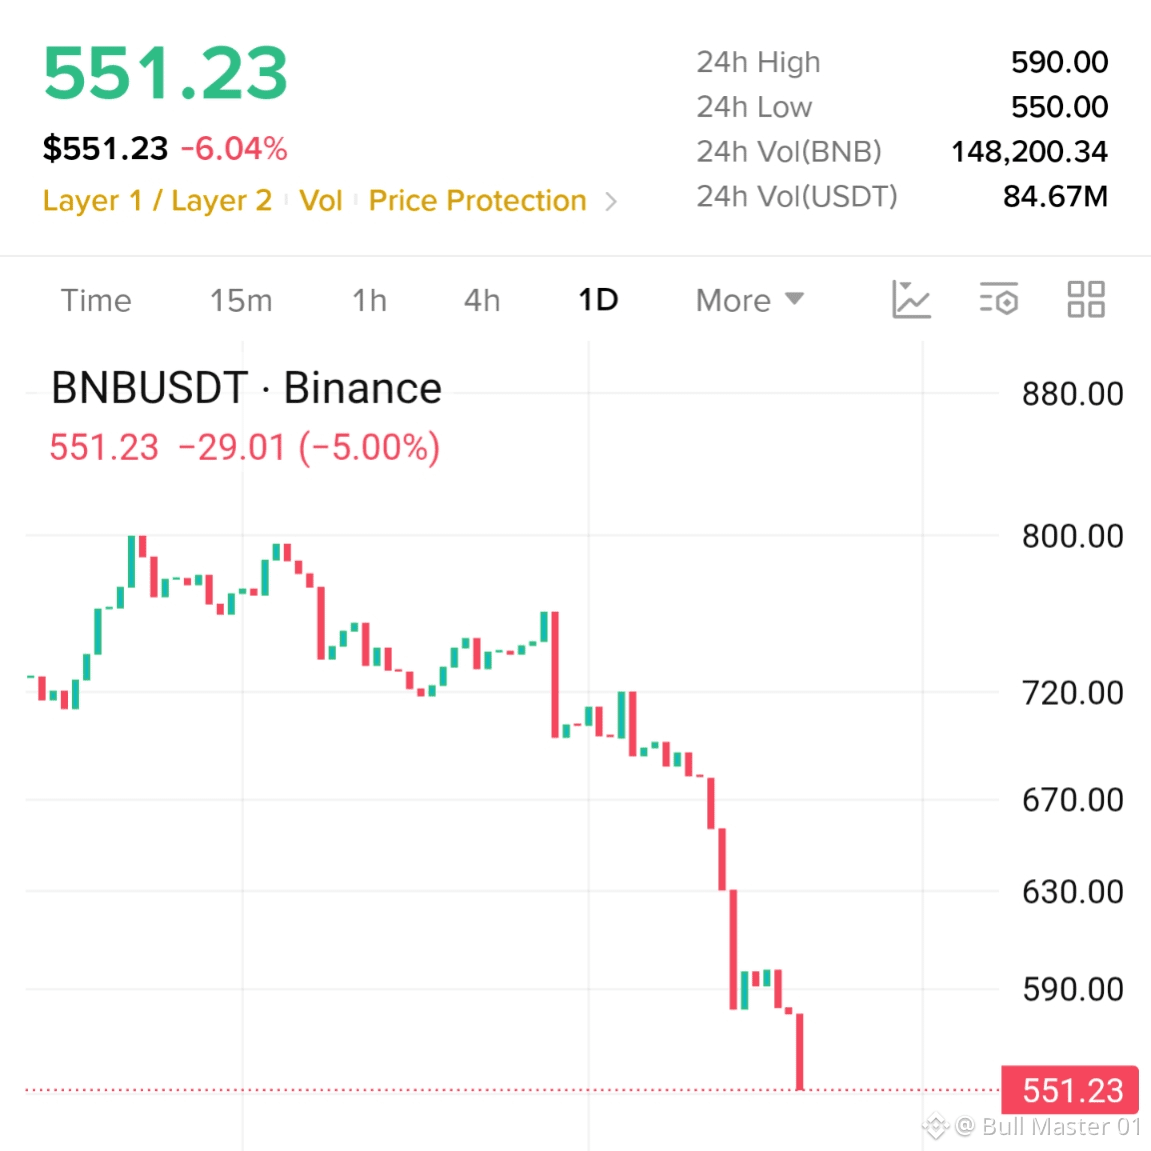
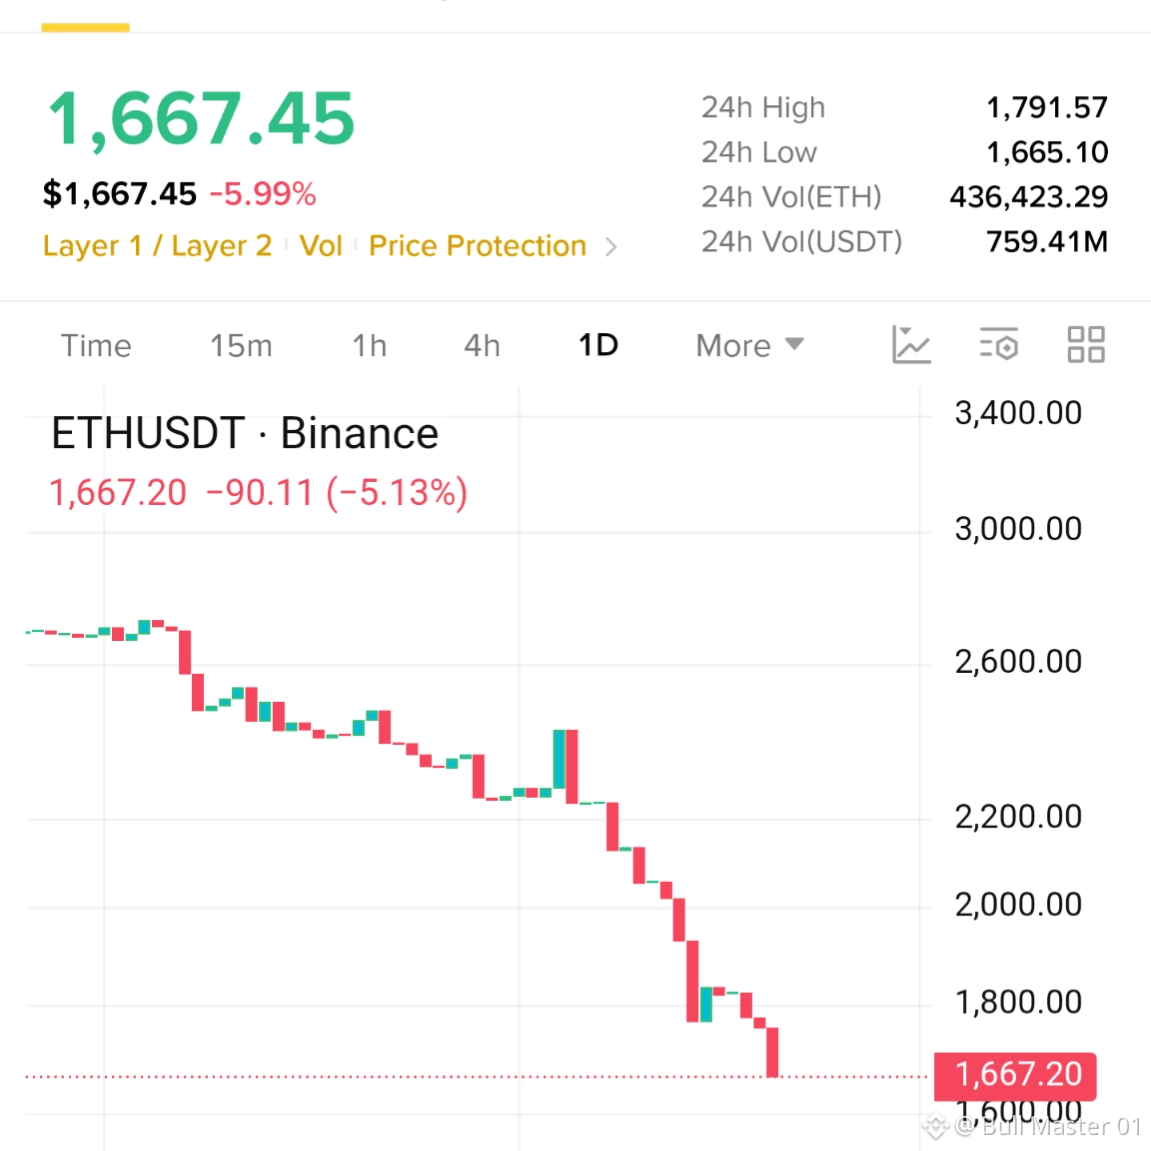
Look at these charts. #BTC is down to $60,000. #ETH is getting destroyed at $1,667. #BNB is falling to $551. #SOL is crashing to $68. The retail crowd is terrified, closing their positions, and crying about the end of the cycle.
Let them panic. I am smiling.
This is the part of the cycle where weak hands get shaken out and smart money builds their position. Opportunities like this, where the entire market goes on a massive discount, do not come around often.
I am not here to panic. I am here to DCA. I am buying the blood.
Here is what I am watching:
$BTC : I am adding heavily under $60K.
{future}(BTCUSDT)
$ETH : Grabbing this discount under $1,700.
{future}(ETHUSDT)
$BNB : Accumulating at these prices.
{future}(BNBUSDT)
SOL: Holding my spot bag, buying more under $70.
Stop watching the red candles with fear. Start looking at them as opportunities. The market rewards the brave.
The chart does not lie. The cycle always comes back. See you at the top.
Not financial advice. Always manage your risk.
Goiz wake up Crypto Market is bleeding and panic everywhere. But this is exactly where the real money is made
Look at these charts. #BTC is down to $60,000. #ETH is getting destroyed at $1,667. #BNB is falling to $551. #SOL is crashing to $68. The retail crowd is terrified, closing their positions, and crying about the end of the cycle.
Let them panic. I am smiling.
This is the part of the cycle where weak hands get shaken out and smart money builds their position. Opportunities like this, where the entire market goes on a massive discount, do not come around often.
I am not here to panic. I am here to DCA. I am buying the blood.
Here is what I am watching:
$BTC : I am adding heavily under $60K.
$ETH : Grabbing this discount under $1,700.
$BNB : Accumulating at these prices.
SOL: Holding my spot bag, buying more under $70.
Stop watching the red candles with fear. Start looking at them as opportunities. The market rewards the brave.
The chart does not lie. The cycle always comes back. See you at the top.
Not financial advice. Always manage your risk.
Look at these charts. #BTC is down to $60,000. #ETH is getting destroyed at $1,667. #BNB is falling to $551. #SOL is crashing to $68. The retail crowd is terrified, closing their positions, and crying about the end of the cycle.
Let them panic. I am smiling.
This is the part of the cycle where weak hands get shaken out and smart money builds their position. Opportunities like this, where the entire market goes on a massive discount, do not come around often.
I am not here to panic. I am here to DCA. I am buying the blood.
Here is what I am watching:
$BTC : I am adding heavily under $60K.
$ETH : Grabbing this discount under $1,700.
$BNB : Accumulating at these prices.
SOL: Holding my spot bag, buying more under $70.
Stop watching the red candles with fear. Start looking at them as opportunities. The market rewards the brave.
The chart does not lie. The cycle always comes back. See you at the top.
Not financial advice. Always manage your risk.
3
478

·
--
Bearish
$SOL / USDT Market Update | Nov 21, 2026*
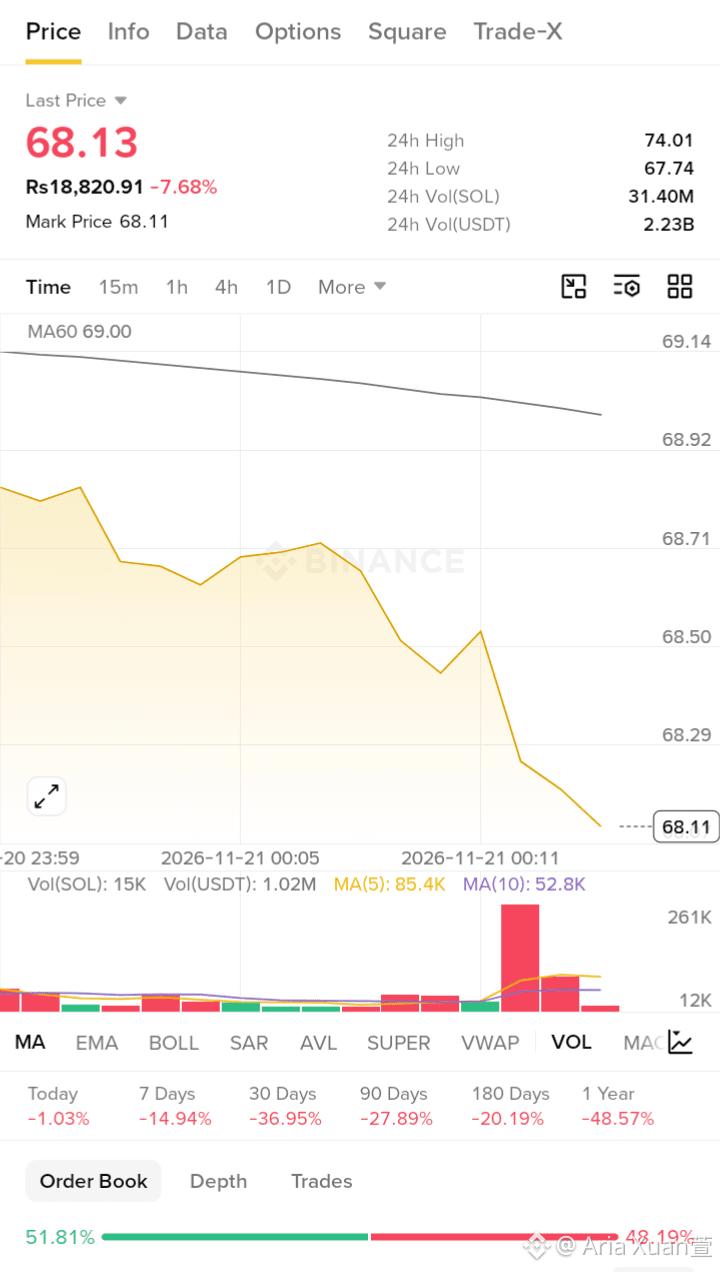
Last Price:* $68.13 (Rs 18,820.91) *-7.68%*
Mark Price:* $68.11
24H High:* $74.01
24H Low:* $67.74
24H Vol:* 31.40M SOL / 2.23B USDT
*Technical Analysis (15m):*
SOL breaking down after failing to hold $68.50!
After holding near $68.71 and bouncing to $68.50 around 00:11, SOL faced heavy rejection and crashed straight to $68.13. Price making lower highs and lower lows - clear bearish breakdown.
Currently at *$68.13*, trading *BELOW MA60 at $69.00*. MA60 is sloping down at $68.92 - $69.00, acting as strong resistance far above. Price has been below MA60 for the whole session - sellers fully in control.
Volume: Vol(SOL) 15K Vol(USDT) 1.02M. MA(5) 85.4K above MA(10) 52.8K - bullish volume crossover on crash, showing heavy selling. Massive red volume spike (261K) at the breakdown from $68.50 to $68.29 confirms panic selling / distribution. Recent bars small, sellers still active.
Performance: Today -1.03%, 7 Days -14.94%, 30 Days -36.95%, 90 Days -27.89%, 180 Days -20.19%, 1 Year -48.57% - SOL in deep correction, near 24H Low.
*Key Levels:*
Resistance: $68.29 / $68.50 / $68.71 / $69.00 (MA60) / $69.14
Support: $68.11 / $67.74 (24H Low)
If SOL holds above $67.74, bounce towards $68.50 expected. Breakdown below $67.74 will open new downside towards $67.00.
Bearish below MA60 - $67.74 is must-hold support.
{spot}(SOLUSDT)
Not Financial Advice. DYOR.
#SOL #Solana #Binance
$SOL / USDT Market Update | Nov 21, 2026*
Last Price:* $68.13 (Rs 18,820.91) *-7.68%*
Mark Price:* $68.11
24H High:* $74.01
24H Low:* $67.74
24H Vol:* 31.40M SOL / 2.23B USDT
*Technical Analysis (15m):*
SOL breaking down after failing to hold $68.50!
After holding near $68.71 and bouncing to $68.50 around 00:11, SOL faced heavy rejection and crashed straight to $68.13. Price making lower highs and lower lows - clear bearish breakdown.
Currently at *$68.13*, trading *BELOW MA60 at $69.00*. MA60 is sloping down at $68.92 - $69.00, acting as strong resistance far above. Price has been below MA60 for the whole session - sellers fully in control.
Volume: Vol(SOL) 15K Vol(USDT) 1.02M. MA(5) 85.4K above MA(10) 52.8K - bullish volume crossover on crash, showing heavy selling. Massive red volume spike (261K) at the breakdown from $68.50 to $68.29 confirms panic selling / distribution. Recent bars small, sellers still active.
Performance: Today -1.03%, 7 Days -14.94%, 30 Days -36.95%, 90 Days -27.89%, 180 Days -20.19%, 1 Year -48.57% - SOL in deep correction, near 24H Low.
*Key Levels:*
Resistance: $68.29 / $68.50 / $68.71 / $69.00 (MA60) / $69.14
Support: $68.11 / $67.74 (24H Low)
If SOL holds above $67.74, bounce towards $68.50 expected. Breakdown below $67.74 will open new downside towards $67.00.
Bearish below MA60 - $67.74 is must-hold support.
Not Financial Advice. DYOR.
#SOL #Solana #Binance
Last Price:* $68.13 (Rs 18,820.91) *-7.68%*
Mark Price:* $68.11
24H High:* $74.01
24H Low:* $67.74
24H Vol:* 31.40M SOL / 2.23B USDT
*Technical Analysis (15m):*
SOL breaking down after failing to hold $68.50!
After holding near $68.71 and bouncing to $68.50 around 00:11, SOL faced heavy rejection and crashed straight to $68.13. Price making lower highs and lower lows - clear bearish breakdown.
Currently at *$68.13*, trading *BELOW MA60 at $69.00*. MA60 is sloping down at $68.92 - $69.00, acting as strong resistance far above. Price has been below MA60 for the whole session - sellers fully in control.
Volume: Vol(SOL) 15K Vol(USDT) 1.02M. MA(5) 85.4K above MA(10) 52.8K - bullish volume crossover on crash, showing heavy selling. Massive red volume spike (261K) at the breakdown from $68.50 to $68.29 confirms panic selling / distribution. Recent bars small, sellers still active.
Performance: Today -1.03%, 7 Days -14.94%, 30 Days -36.95%, 90 Days -27.89%, 180 Days -20.19%, 1 Year -48.57% - SOL in deep correction, near 24H Low.
*Key Levels:*
Resistance: $68.29 / $68.50 / $68.71 / $69.00 (MA60) / $69.14
Support: $68.11 / $67.74 (24H Low)
If SOL holds above $67.74, bounce towards $68.50 expected. Breakdown below $67.74 will open new downside towards $67.00.
Bearish below MA60 - $67.74 is must-hold support.
Not Financial Advice. DYOR.
#SOL #Solana #Binance
53

·
--
🌐 $SOL: SOLANA FOUNDATION MAKES A BIG COINGECKO MOVE!
Solana has announced a major ecosystem development:
- November 17: Solana Foundation announced its backing of CoinGecko.
- Major reach: CoinGecko has around 18 million registered users.
- New plans: The partnership aims to expand crypto data, market intelligence, and Solana-powered trading features.
- Network progress: Solana 1.0 has officially replaced the old Mainnet Beta label.
- Institutional adoption: DTCC plans to connect its tokenization service to Solana in the second half of 2027.
Could this partnership bring Solana closer to mainstream crypto users?
$SOL
{future}(SOLUSDT)
.
.
.
#SOL #Solana #crypto
Not financial advice. DYOR.
🌐 $SOL : SOLANA FOUNDATION MAKES A BIG COINGECKO MOVE!
Solana has announced a major ecosystem development:
- November 17: Solana Foundation announced its backing of CoinGecko.
- Major reach: CoinGecko has around 18 million registered users.
- New plans: The partnership aims to expand crypto data, market intelligence, and Solana-powered trading features.
- Network progress: Solana 1.0 has officially replaced the old Mainnet Beta label.
- Institutional adoption: DTCC plans to connect its tokenization service to Solana in the second half of 2027.
Could this partnership bring Solana closer to mainstream crypto users?
$SOL
.
.
.
#SOL #Solana #crypto
Not financial advice. DYOR.
Solana has announced a major ecosystem development:
- November 17: Solana Foundation announced its backing of CoinGecko.
- Major reach: CoinGecko has around 18 million registered users.
- New plans: The partnership aims to expand crypto data, market intelligence, and Solana-powered trading features.
- Network progress: Solana 1.0 has officially replaced the old Mainnet Beta label.
- Institutional adoption: DTCC plans to connect its tokenization service to Solana in the second half of 2027.
Could this partnership bring Solana closer to mainstream crypto users?
$SOL
.
.
.
#SOL #Solana #crypto
Not financial advice. DYOR.

143

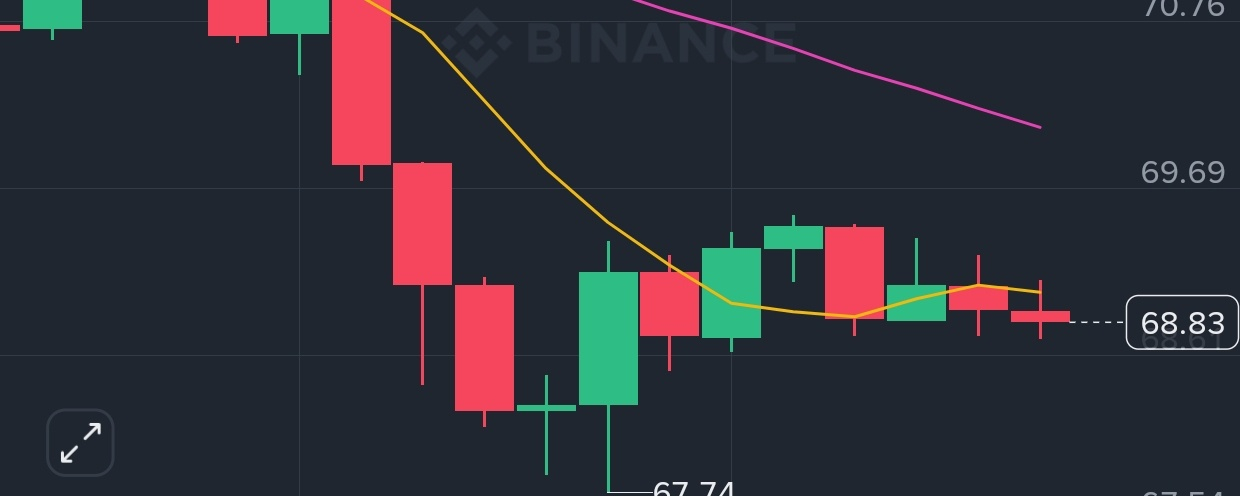
Article
🚀 Is the Crypto Market Preparing for Another Bullish Move? $SOL & $ADA🚀 Is the Crypto Market Preparing for Another Bullish Move? $SOL & $ADA
I've been studying crypto charts for the past few years, and one thing I've learned is that history sometimes gives us interesting clues about what could happen next.
Right now, I'm watching a pattern on $SOL that caught my attention.
📊 1. SOL – A Potential Bullish Signal
On the current SOL chart, we can see a Hammer candlestick followed by a Bullish Engulfing pattern. This combination can sometimes signal that buyers are stepping back into the market.
📊 2. ADA – A Similar Pattern From the Past
Looking back at the $ADA chart from almost a year ago, I noticed something interesting. ADA formed a similar Hammer followed by a Bullish Engulfing candle. After that, the price made a strong move to the upside.
Could SOL be preparing for a similar move?
Of course, nothing is guaranteed in crypto, but this pattern is definitely worth watching.
🎯 My Trading Strategy:
- Watch for confirmation of bullish momentum.
- Consider an entry after confirmation.
- Place your Stop Loss below the Hammer candle.
- Always manage your risk carefully.
Sometimes the best opportunities appear when the market is still uncertain.
What do you think? Could $SOL repeat the kind of move we saw in $ADA?
#SOL #ADA #CryptoMarke t #BTC走势分析 #BinanceSquare
$SOL
{future}(SOLUSDT)
🚀 Is the Crypto Market Preparing for Another Bullish Move? $SOL & $ADA
🚀 Is the Crypto Market Preparing for Another Bullish Move? $SOL & $ADA
I've been studying crypto charts for the past few years, and one thing I've learned is that history sometimes gives us interesting clues about what could happen next.
Right now, I'm watching a pattern on $SOL that caught my attention.
📊 1. SOL – A Potential Bullish Signal
On the current SOL chart, we can see a Hammer candlestick followed by a Bullish Engulfing pattern. This combination can sometimes signal that buyers are stepping back into the market.
📊 2. ADA – A Similar Pattern From the Past
Looking back at the $ADA chart from almost a year ago, I noticed something interesting. ADA formed a similar Hammer followed by a Bullish Engulfing candle. After that, the price made a strong move to the upside.
Could SOL be preparing for a similar move?
Of course, nothing is guaranteed in crypto, but this pattern is definitely worth watching.
🎯 My Trading Strategy:
- Watch for confirmation of bullish momentum.
- Consider an entry after confirmation.
- Place your Stop Loss below the Hammer candle.
- Always manage your risk carefully.
Sometimes the best opportunities appear when the market is still uncertain.
What do you think? Could $SOL repeat the kind of move we saw in $ADA?
#SOL #ADA #CryptoMarke t #BTC走势分析 #BinanceSquare
$SOL
I've been studying crypto charts for the past few years, and one thing I've learned is that history sometimes gives us interesting clues about what could happen next.
Right now, I'm watching a pattern on $SOL that caught my attention.
📊 1. SOL – A Potential Bullish Signal
On the current SOL chart, we can see a Hammer candlestick followed by a Bullish Engulfing pattern. This combination can sometimes signal that buyers are stepping back into the market.
📊 2. ADA – A Similar Pattern From the Past
Looking back at the $ADA chart from almost a year ago, I noticed something interesting. ADA formed a similar Hammer followed by a Bullish Engulfing candle. After that, the price made a strong move to the upside.
Could SOL be preparing for a similar move?
Of course, nothing is guaranteed in crypto, but this pattern is definitely worth watching.
🎯 My Trading Strategy:
- Watch for confirmation of bullish momentum.
- Consider an entry after confirmation.
- Place your Stop Loss below the Hammer candle.
- Always manage your risk carefully.
Sometimes the best opportunities appear when the market is still uncertain.
What do you think? Could $SOL repeat the kind of move we saw in $ADA?
#SOL #ADA #CryptoMarke t #BTC走势分析 #BinanceSquare
$SOL
353

·
--
$SOL SOL Price Action: Lower Trend, Bearish Candles, and Smart Entry Strategy
Solana (SOL) is trading within a clear lower trend on the chart, where consecutive red bearish candles highlight ongoing seller pressure. When a coin forms a sequence of lower highs and lower lows, waiting for clear market structure and confirmation is generally safer than chasing early long entries.
1. What the Chart Is Showing
* Bearish Momentum: A steady sequence of red candles and a downward slope point to weaker buyer follow-through while sellers press price lower.
* Liquidity and Sweeps: Price often sweeps prior swing lows or support levels during a downtrend. Entering mid-range out of FOMO increases the risk of getting stopped out on a liquidity grab.
* Higher Timeframe Context: Check the 1H and 4H trend before trading lower timeframes like 1m or 5m so you stay aligned with broader momentum.
2. Smart Trading Approach (Risk Management First)
* Wait for Candle Closes: Let candles close before acting on a breakdown, retest, or shift in structure to reduce false signals and repainting noise.
* Key Support and Resistance Zones: Mark areas where price previously saw strong rejections or reactions instead of relying blindly on a single indicator or trendline.
* Strict Risk Control: Size positions to fit your account, place clear invalidation (stop-loss) levels, and avoid excessive leverage.
3. What Is Your Plan?
Are you watching SOL for breakdown/retest short setups, or waiting for a strong demand zone to test for a reversal? Share your view in the comments below!
#SOL #Sol ana #Binance #BinanceSquare #CryptoTrading #TechnicalAnalysis #BearishTrend end #priceaction #RiskManagement
$SOL SOL Price Action: Lower Trend, Bearish Candles, and Smart Entry Strategy
Solana (SOL) is trading within a clear lower trend on the chart, where consecutive red bearish candles highlight ongoing seller pressure. When a coin forms a sequence of lower highs and lower lows, waiting for clear market structure and confirmation is generally safer than chasing early long entries.
1. What the Chart Is Showing
* Bearish Momentum: A steady sequence of red candles and a downward slope point to weaker buyer follow-through while sellers press price lower.
* Liquidity and Sweeps: Price often sweeps prior swing lows or support levels during a downtrend. Entering mid-range out of FOMO increases the risk of getting stopped out on a liquidity grab.
* Higher Timeframe Context: Check the 1H and 4H trend before trading lower timeframes like 1m or 5m so you stay aligned with broader momentum.
2. Smart Trading Approach (Risk Management First)
* Wait for Candle Closes: Let candles close before acting on a breakdown, retest, or shift in structure to reduce false signals and repainting noise.
* Key Support and Resistance Zones: Mark areas where price previously saw strong rejections or reactions instead of relying blindly on a single indicator or trendline.
* Strict Risk Control: Size positions to fit your account, place clear invalidation (stop-loss) levels, and avoid excessive leverage.
3. What Is Your Plan?
Are you watching SOL for breakdown/retest short setups, or waiting for a strong demand zone to test for a reversal? Share your view in the comments below!
#SOL #Sol ana #Binance #BinanceSquare #CryptoTrading #TechnicalAnalysis #BearishTrend end #priceaction #RiskManagement
Solana (SOL) is trading within a clear lower trend on the chart, where consecutive red bearish candles highlight ongoing seller pressure. When a coin forms a sequence of lower highs and lower lows, waiting for clear market structure and confirmation is generally safer than chasing early long entries.
1. What the Chart Is Showing
* Bearish Momentum: A steady sequence of red candles and a downward slope point to weaker buyer follow-through while sellers press price lower.
* Liquidity and Sweeps: Price often sweeps prior swing lows or support levels during a downtrend. Entering mid-range out of FOMO increases the risk of getting stopped out on a liquidity grab.
* Higher Timeframe Context: Check the 1H and 4H trend before trading lower timeframes like 1m or 5m so you stay aligned with broader momentum.
2. Smart Trading Approach (Risk Management First)
* Wait for Candle Closes: Let candles close before acting on a breakdown, retest, or shift in structure to reduce false signals and repainting noise.
* Key Support and Resistance Zones: Mark areas where price previously saw strong rejections or reactions instead of relying blindly on a single indicator or trendline.
* Strict Risk Control: Size positions to fit your account, place clear invalidation (stop-loss) levels, and avoid excessive leverage.
3. What Is Your Plan?
Are you watching SOL for breakdown/retest short setups, or waiting for a strong demand zone to test for a reversal? Share your view in the comments below!
#SOL #Sol ana #Binance #BinanceSquare #CryptoTrading #TechnicalAnalysis #BearishTrend end #priceaction #RiskManagement

276

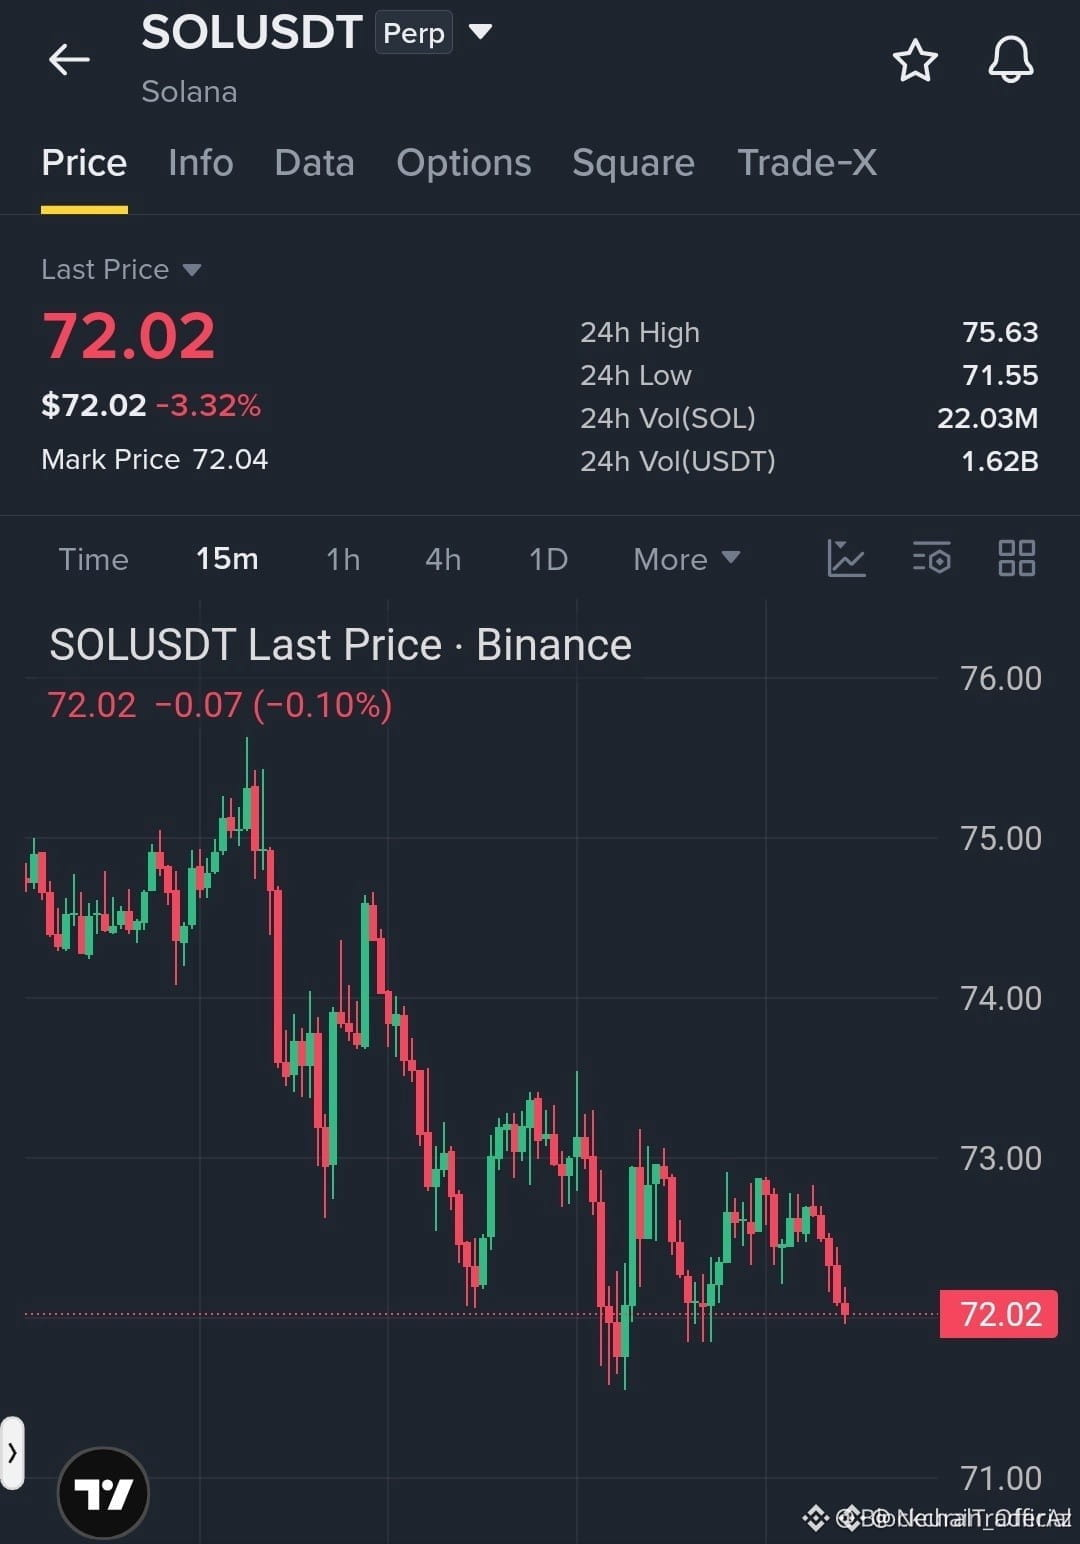
🔴 $SOL STRUCTURAL SUPPORT BREAKING AS SELLERS DRIVE LOWER TIMEFRAME MOMENTUM 📉
Entry: 72.00 – 72.40 ⚡
Target: 70.50 🚀
Stop Loss: 73.00 ⚠️
Lower highs printing across the lower timeframe charts confirm institutional distribution is actively underway near current boundaries. 📊 Smart money sellers are aggressively defending minor order blocks, pressing price directly toward structural liquidity pools resting below immediate demand. 📉
If this fragile support floor fails to absorb incoming sell-side pressure, expect an accelerated sweep into deeper inefficiency zones. 🔍 Are you positioning for this downside continuation or waiting for a counter-trend reaction? 🤔
⚠️ Not financial advice. Always manage your risk. 🛡️
🏷️ #SOL #ShortSetup #PriceAction #Crypto
🦈 📉
🔴 $SOL STRUCTURAL SUPPORT BREAKING AS SELLERS DRIVE LOWER TIMEFRAME MOMENTUM 📉
Entry: 72.00 – 72.40 ⚡
Target: 70.50 🚀
Stop Loss: 73.00 ⚠️
Lower highs printing across the lower timeframe charts confirm institutional distribution is actively underway near current boundaries. 📊 Smart money sellers are aggressively defending minor order blocks, pressing price directly toward structural liquidity pools resting below immediate demand. 📉
If this fragile support floor fails to absorb incoming sell-side pressure, expect an accelerated sweep into deeper inefficiency zones. 🔍 Are you positioning for this downside continuation or waiting for a counter-trend reaction? 🤔
⚠️ Not financial advice. Always manage your risk. 🛡️
🏷️ #SOL #ShortSetup #PriceAction #Crypto
🦈 📉
Entry: 72.00 – 72.40 ⚡
Target: 70.50 🚀
Stop Loss: 73.00 ⚠️
Lower highs printing across the lower timeframe charts confirm institutional distribution is actively underway near current boundaries. 📊 Smart money sellers are aggressively defending minor order blocks, pressing price directly toward structural liquidity pools resting below immediate demand. 📉
If this fragile support floor fails to absorb incoming sell-side pressure, expect an accelerated sweep into deeper inefficiency zones. 🔍 Are you positioning for this downside continuation or waiting for a counter-trend reaction? 🤔
⚠️ Not financial advice. Always manage your risk. 🛡️
🏷️ #SOL #ShortSetup #PriceAction #Crypto
🦈 📉
11

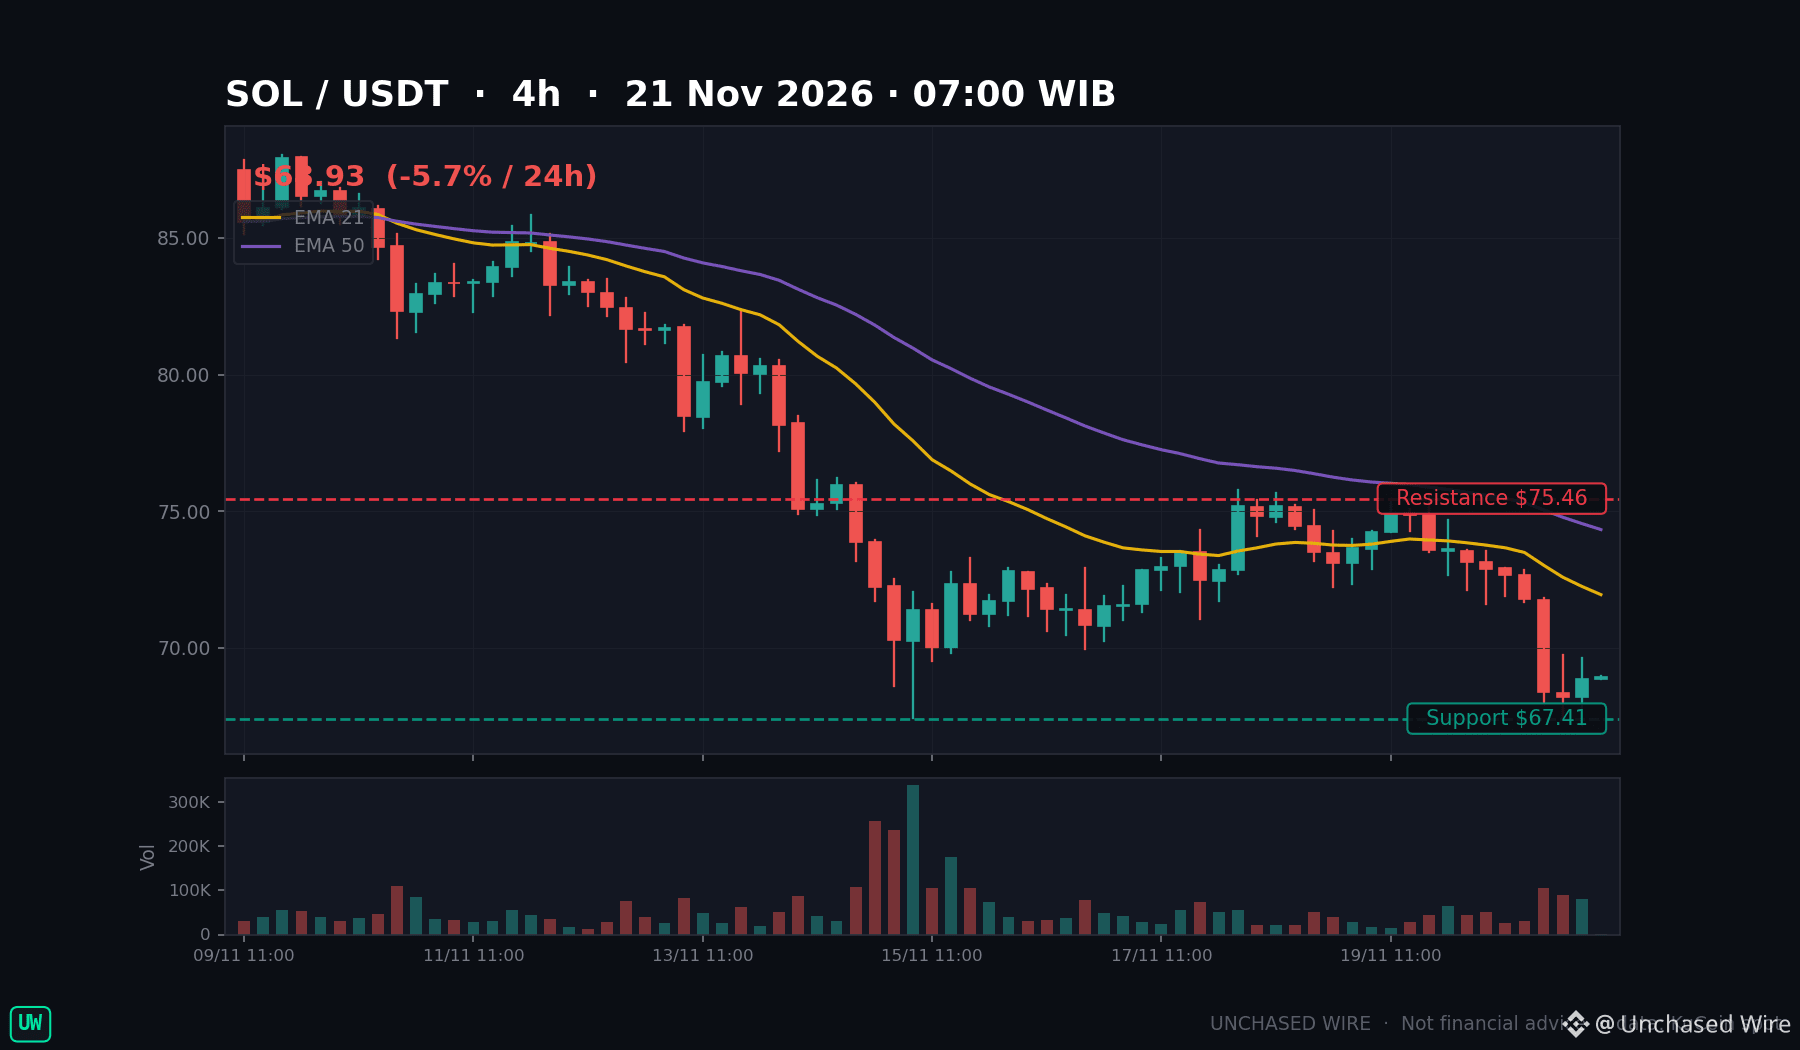
Solana lost its summer floor on Friday. I'm watching whether the June low is next.
SOL is near $69, down about 6% today and a third in a month, after Friday's flush took it under the $74 line. Three hits landed together. First, Bitcoin broke $60,000 and dragged the tape with it. Second, SOL's 0.786 retracement near $74 — the base of its summer range — gave way after capping every bounce since mid-November. Third, US spot ETF flows reversed in Breakpoint week, and futures open interest slid toward $768 million.
RSI near 23 says deeply oversold — but oversold is not a floor. Below $67.41 sits $62.18, the June 7 low, then the full retracement near $60.
Key support: $67.41, then $62.18. Key resistance: $75.46, then $80.72. A daily close under $67.41 opens $62.18; a close above $75.46 recasts Friday as a flush.
A) SOL bounces off $67.41, B) $62.18 tests next, or C) $75.46 reclaims first — which prints first?
NFA, DYOR.
$SOL $BTC #Altcoins #Solana #SOL #Breakpoint
Solana lost its summer floor on Friday. I'm watching whether the June low is next.
SOL is near $69, down about 6% today and a third in a month, after Friday's flush took it under the $74 line. Three hits landed together. First, Bitcoin broke $60,000 and dragged the tape with it. Second, SOL's 0.786 retracement near $74 — the base of its summer range — gave way after capping every bounce since mid-November. Third, US spot ETF flows reversed in Breakpoint week, and futures open interest slid toward $768 million.
RSI near 23 says deeply oversold — but oversold is not a floor. Below $67.41 sits $62.18, the June 7 low, then the full retracement near $60.
Key support: $67.41, then $62.18. Key resistance: $75.46, then $80.72. A daily close under $67.41 opens $62.18; a close above $75.46 recasts Friday as a flush.
A) SOL bounces off $67.41, B) $62.18 tests next, or C) $75.46 reclaims first — which prints first?
NFA, DYOR.
$SOL $BTC #Altcoins #Solana #SOL #Breakpoint
SOL is near $69, down about 6% today and a third in a month, after Friday's flush took it under the $74 line. Three hits landed together. First, Bitcoin broke $60,000 and dragged the tape with it. Second, SOL's 0.786 retracement near $74 — the base of its summer range — gave way after capping every bounce since mid-November. Third, US spot ETF flows reversed in Breakpoint week, and futures open interest slid toward $768 million.
RSI near 23 says deeply oversold — but oversold is not a floor. Below $67.41 sits $62.18, the June 7 low, then the full retracement near $60.
Key support: $67.41, then $62.18. Key resistance: $75.46, then $80.72. A daily close under $67.41 opens $62.18; a close above $75.46 recasts Friday as a flush.
A) SOL bounces off $67.41, B) $62.18 tests next, or C) $75.46 reclaims first — which prints first?
NFA, DYOR.
$SOL $BTC #Altcoins #Solana #SOL #Breakpoint
191

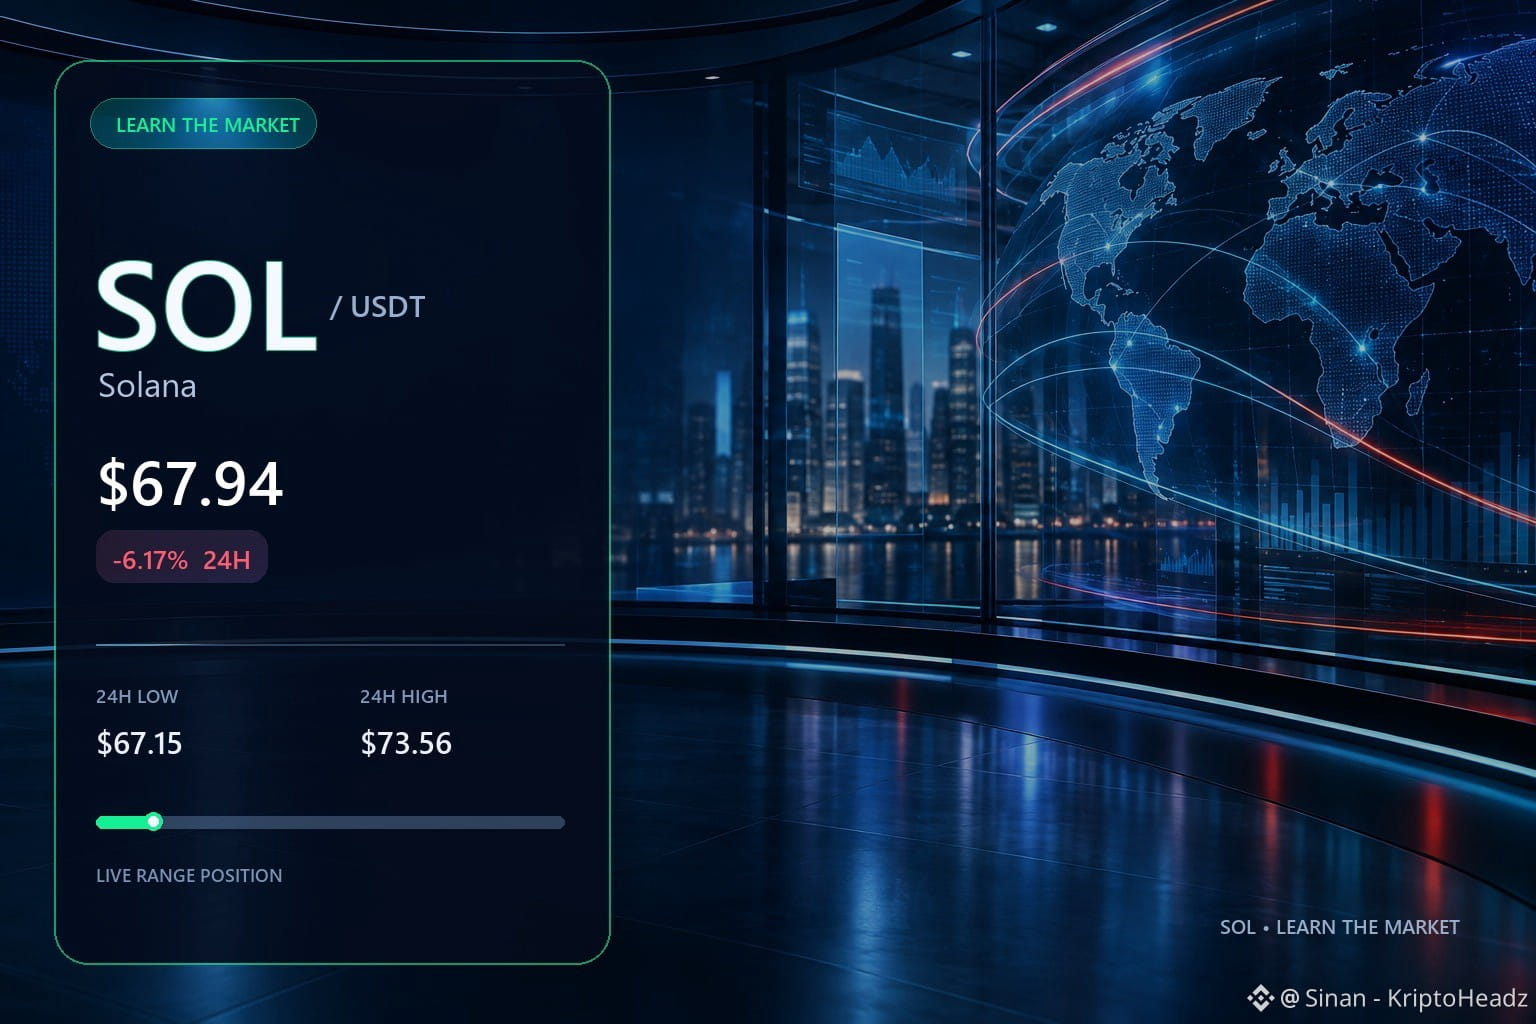
Stop letting 24-hour volatility trade your emotions for you.
$SOL took a -6.173% hit today, sliding from a peak of $73.56 down to $67.15 before printing $67.94. Big intraday swings test your execution framework, not just your patience. Understanding daily ranges is critical for managing leverage and stops.
⚡ High of $73.56 set the upper boundary for the session.
📉 Low of $67.15 established local intraday liquidity below.
🎯 Current level of $67.94 shows price stabilizing near the session low.
Measure the total range before opening positions so market noise does not trigger bad exits. Not financial advice, always DYOR.
#Write2Earn #CryptoTrading #SOL #RiskManagement
Stop letting 24-hour volatility trade your emotions for you.
$SOL took a -6.173% hit today, sliding from a peak of $73.56 down to $67.15 before printing $67.94. Big intraday swings test your execution framework, not just your patience. Understanding daily ranges is critical for managing leverage and stops.
⚡ High of $73.56 set the upper boundary for the session.
📉 Low of $67.15 established local intraday liquidity below.
🎯 Current level of $67.94 shows price stabilizing near the session low.
Measure the total range before opening positions so market noise does not trigger bad exits. Not financial advice, always DYOR.
#Write2Earn #CryptoTrading #SOL #RiskManagement
$SOL took a -6.173% hit today, sliding from a peak of $73.56 down to $67.15 before printing $67.94. Big intraday swings test your execution framework, not just your patience. Understanding daily ranges is critical for managing leverage and stops.
⚡ High of $73.56 set the upper boundary for the session.
📉 Low of $67.15 established local intraday liquidity below.
🎯 Current level of $67.94 shows price stabilizing near the session low.
Measure the total range before opening positions so market noise does not trigger bad exits. Not financial advice, always DYOR.
#Write2Earn #CryptoTrading #SOL #RiskManagement
115
Log in to explore more content
Join global crypto users on Binance Square
⚡️ Get latest and useful information about crypto.
💬 Trusted by the world’s largest crypto exchange.
👍 Discover real insights from verified creators.
Email / Phone number
Trending Topics
1
#CanBTCReboundAfterFallingBelow60K?
138,954 views
583 Discussing
2
#GlobalStocksFaceLongestLosingStreakSince2023
58,584 views
543 Discussing
3
#AnthropicPlungesTowardIPOPriceonDay2
20,918 views
228 Discussing
4
#BNBDropsBelow540USDTWith8.46%DailyDecline
342 views
16 Discussing
5
#MorganStanleyEndsAnthropicStockSupportAfterOneDay
312 views
10 Discussing
6
#CryptoBilisAttackerMoves25000ETHToTornadoCash
306 views
13 Discussing
7
#GaoTengBitcoinETFListsOnHKEX
39,132 views
397 Discussing
8
#TradFiForBeginners
1M views
5,849 Discussing
9
#NvidiaBoardReportedlySplitOverHuang’sReturn
409,751 views
2,588 Discussing
10
#TetherBurns8BillionUSDTInPast20Days
49,341 views
167 Discussing