
#trading
trading
118.3M views
776,592 Discussing
Hot
Latest


·
--
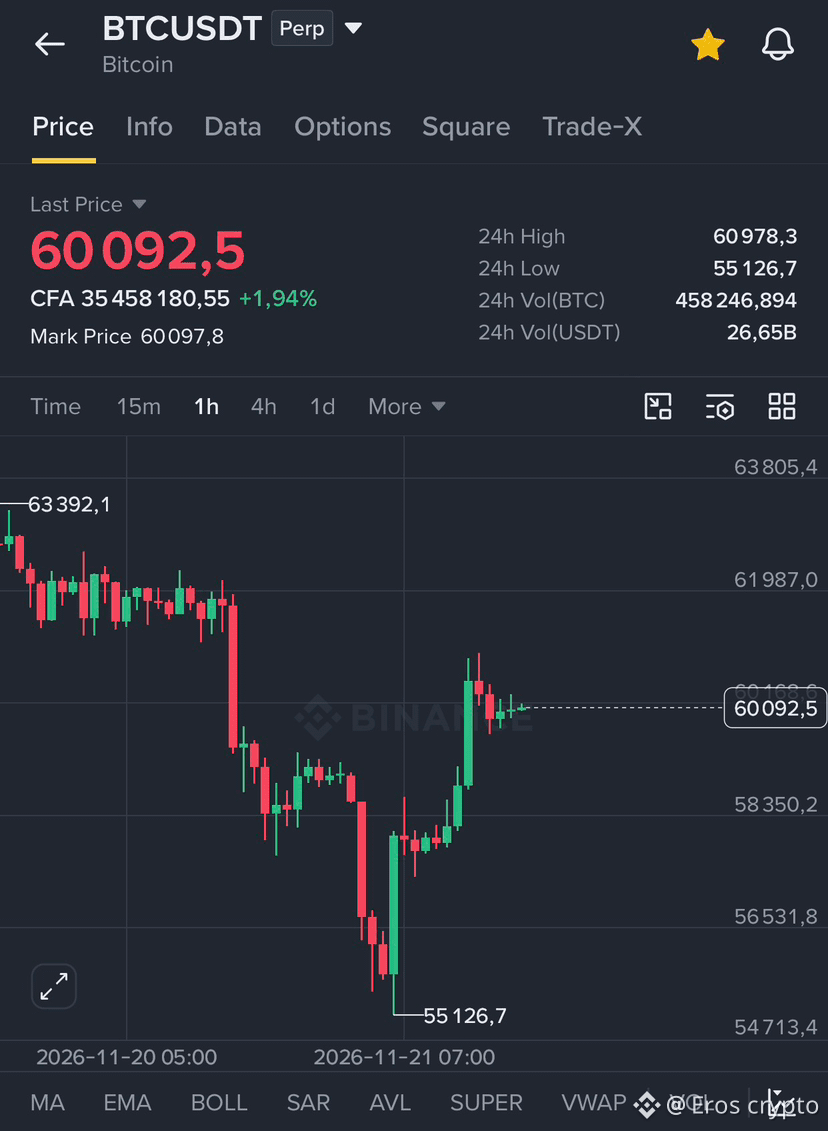
🚨 The more I observe what’s happening with Bitcoin, the more I feel that the 4-year cycle is still very much alive.
Market makers have managed to push BTC down to $55,000, below the summer 2026 lows, sweeping up all the available liquidity and liquidating a large number of positions along the way.
But what’s quite interesting is that we seem to be returning to the familiar 4-year cycle scenario: Bitcoin could be forming its bottom after a 48-month cycle.
Looking back, everything that’s happened over the past few months looks like a series of pump-and-dump moves. Sharp rallies to attract buyers, followed by brutal corrections to capture more liquidity and discourage long-term investors.
For the past year and a half, the crypto market has been putting us through the same cycle: short bursts of euphoria followed by major disappointments.
But I believe things could start changing over the coming months.
My conviction remains the same: 2026 will be a year of accumulation, while 2027 and 2028 could mark the return of expansion for the crypto industry.
Of course, nobody has a crystal ball. But I’d rather use this period to prepare myself than chase the market when euphoria returns.
Sometimes, the best opportunities are built during the very periods when everyone else is starting to lose patience.
#trading $BTC
🚨 The more I observe what’s happening with Bitcoin, the more I feel that the 4-year cycle is still very much alive.
Market makers have managed to push BTC down to $55,000, below the summer 2026 lows, sweeping up all the available liquidity and liquidating a large number of positions along the way.
But what’s quite interesting is that we seem to be returning to the familiar 4-year cycle scenario: Bitcoin could be forming its bottom after a 48-month cycle.
Looking back, everything that’s happened over the past few months looks like a series of pump-and-dump moves. Sharp rallies to attract buyers, followed by brutal corrections to capture more liquidity and discourage long-term investors.
For the past year and a half, the crypto market has been putting us through the same cycle: short bursts of euphoria followed by major disappointments.
But I believe things could start changing over the coming months.
My conviction remains the same: 2026 will be a year of accumulation, while 2027 and 2028 could mark the return of expansion for the crypto industry.
Of course, nobody has a crystal ball. But I’d rather use this period to prepare myself than chase the market when euphoria returns.
Sometimes, the best opportunities are built during the very periods when everyone else is starting to lose patience.
#trading $BTC
Market makers have managed to push BTC down to $55,000, below the summer 2026 lows, sweeping up all the available liquidity and liquidating a large number of positions along the way.
But what’s quite interesting is that we seem to be returning to the familiar 4-year cycle scenario: Bitcoin could be forming its bottom after a 48-month cycle.
Looking back, everything that’s happened over the past few months looks like a series of pump-and-dump moves. Sharp rallies to attract buyers, followed by brutal corrections to capture more liquidity and discourage long-term investors.
For the past year and a half, the crypto market has been putting us through the same cycle: short bursts of euphoria followed by major disappointments.
But I believe things could start changing over the coming months.
My conviction remains the same: 2026 will be a year of accumulation, while 2027 and 2028 could mark the return of expansion for the crypto industry.
Of course, nobody has a crystal ball. But I’d rather use this period to prepare myself than chase the market when euphoria returns.
Sometimes, the best opportunities are built during the very periods when everyone else is starting to lose patience.
#trading $BTC
3
2.3k

·
--
Bullish
💰 Another Successful Trade! 📈🔥
Another step forward, another profit secured!
Every trade is a lesson, and every smart decision brings me closer to my goals.
Stay focused, stay disciplined, and keep growing! 🚀💎
#Trading #Profit #CryptoTrading #Success
$SKYAI 🔥🔥🔥
🔥🔥$PIEVERSE
💰 Another Successful Trade! 📈🔥
Another step forward, another profit secured!
Every trade is a lesson, and every smart decision brings me closer to my goals.
Stay focused, stay disciplined, and keep growing! 🚀💎
#Trading #Profit #CryptoTrading #Success
$SKYAI 🔥🔥🔥
🔥🔥$PIEVERSE
Another step forward, another profit secured!
Every trade is a lesson, and every smart decision brings me closer to my goals.
Stay focused, stay disciplined, and keep growing! 🚀💎
#Trading #Profit #CryptoTrading #Success
$SKYAI 🔥🔥🔥
🔥🔥$PIEVERSE

TOMIOKA_sama:
💰 Transaksi Sukses Lainnya! 📈🔥
31
2
940

·
--
Bullish
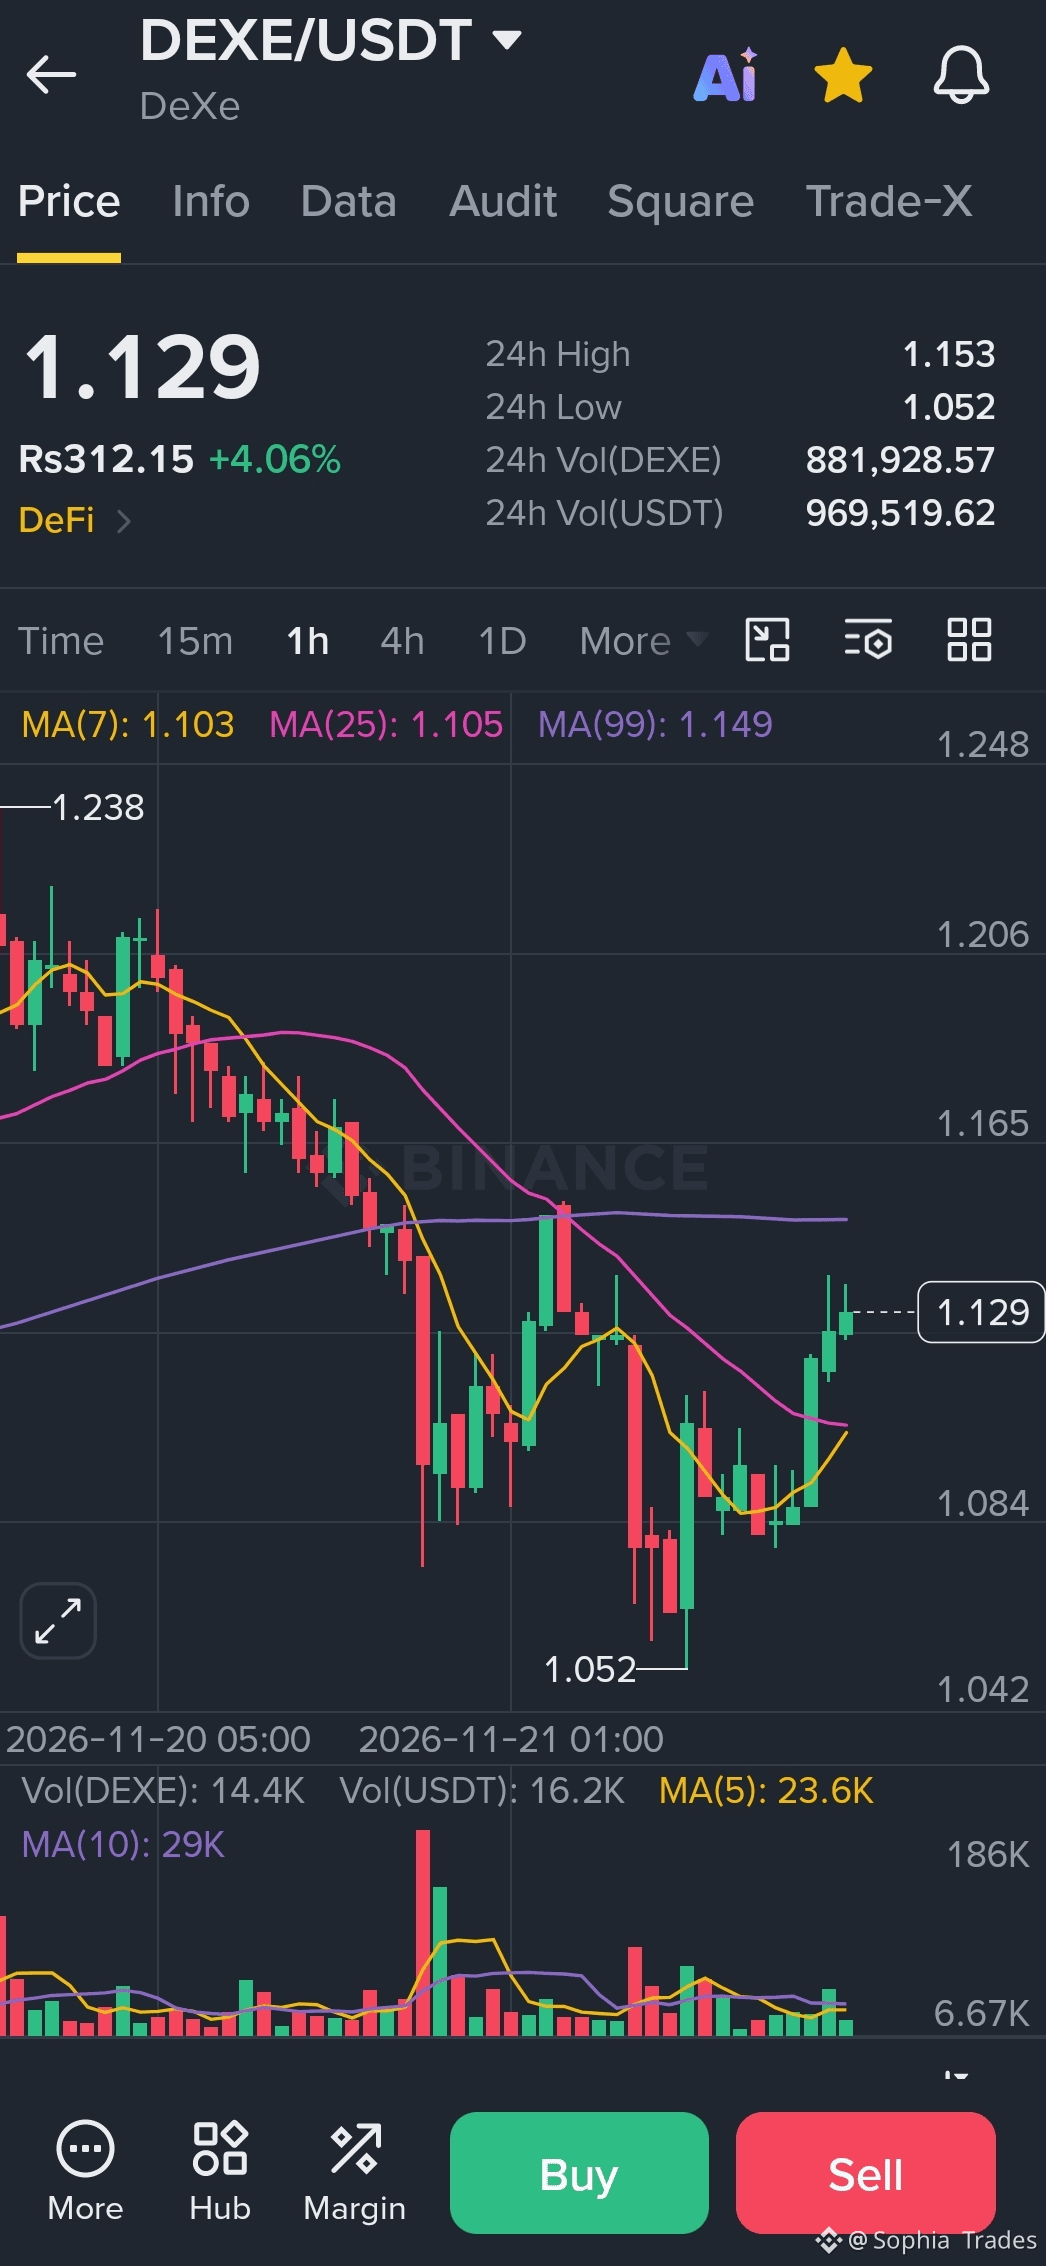
🚨 $DEXE is back on the move… but can bulls actually break this level? 👀
DEXE bounced from $1.052 and is now holding around $1.129. Buyers have stepped in, but there's still a resistance zone to deal with.
👀 Levels I'm watching:
🟢 Support: $1.102–$1.105
🟡 Short-term resistance: $1.137
🔴 Major resistance: $1.149–$1.153
A clean breakout above $1.137 with volume could give bulls another shot at $1.149–$1.153.
But if momentum fades, I'm watching $1.102–$1.105 for support.
No chasing green candles today. Let the chart confirm first. 😅
Are $DEXE bulls ready for another push? 👀
#DEXE #Crypto #Trading #BinanceSquare
{spot}(DEXEUSDT)
🚨 $DEXE is back on the move… but can bulls actually break this level? 👀
DEXE bounced from $1.052 and is now holding around $1.129. Buyers have stepped in, but there's still a resistance zone to deal with.
👀 Levels I'm watching:
🟢 Support: $1.102–$1.105
🟡 Short-term resistance: $1.137
🔴 Major resistance: $1.149–$1.153
A clean breakout above $1.137 with volume could give bulls another shot at $1.149–$1.153.
But if momentum fades, I'm watching $1.102–$1.105 for support.
No chasing green candles today. Let the chart confirm first. 😅
Are $DEXE bulls ready for another push? 👀
#DEXE #Crypto #Trading #BinanceSquare
DEXE bounced from $1.052 and is now holding around $1.129. Buyers have stepped in, but there's still a resistance zone to deal with.
👀 Levels I'm watching:
🟢 Support: $1.102–$1.105
🟡 Short-term resistance: $1.137
🔴 Major resistance: $1.149–$1.153
A clean breakout above $1.137 with volume could give bulls another shot at $1.149–$1.153.
But if momentum fades, I'm watching $1.102–$1.105 for support.
No chasing green candles today. Let the chart confirm first. 😅
Are $DEXE bulls ready for another push? 👀
#DEXE #Crypto #Trading #BinanceSquare
3
996

·
--
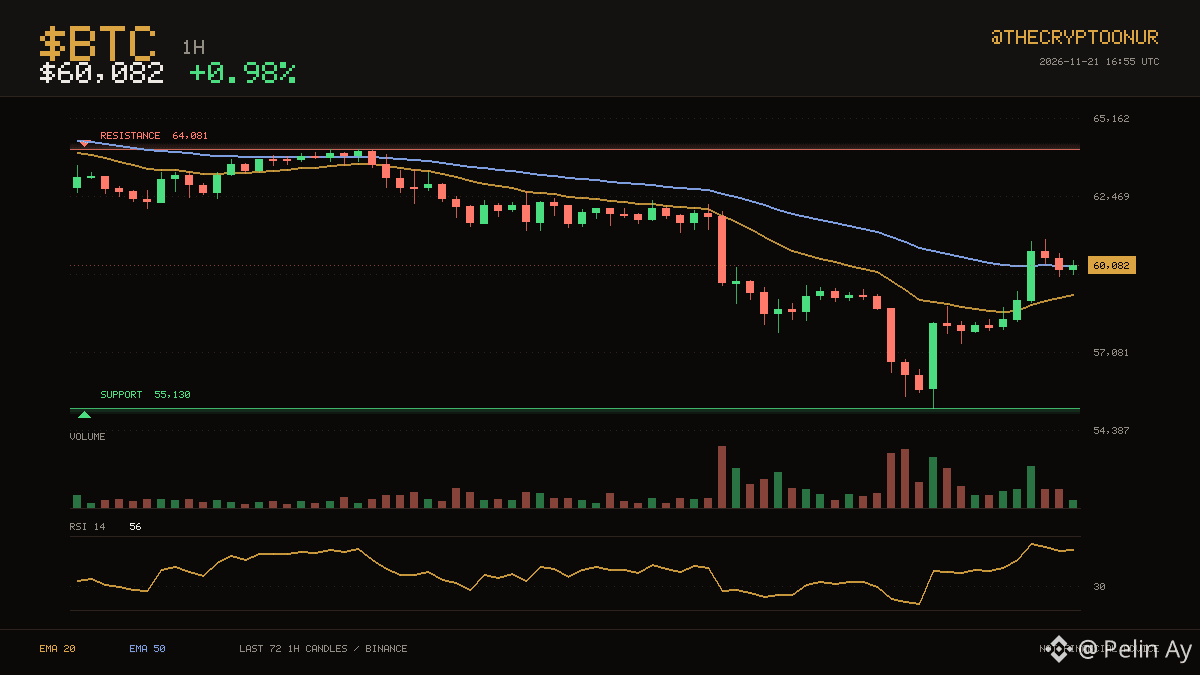
📈 $BTC · 1H
$BTC is at $60,082, with one average above price and one below. The three day range runs from $55,130 up to $64,081. That puts price in the middle of the range. That is 6.7% to the ceiling and 8.2% to the floor. The 20 has stayed below the 50 for a long stretch now. RSI at 56 is neutral, so momentum is not blocking a move either way. Over the past day it has traded between $55,130 and $60,996, sitting near the top of it now. The last 24 hours carried roughly 2.3x normal volume. The 20 average is at $59,095 and the 50 at $60,099. Up 1.0% over 24 hours.
DYOR
$BTC #Trading
📈 $BTC · 1H
$BTC is at $60,082, with one average above price and one below. The three day range runs from $55,130 up to $64,081. That puts price in the middle of the range. That is 6.7% to the ceiling and 8.2% to the floor. The 20 has stayed below the 50 for a long stretch now. RSI at 56 is neutral, so momentum is not blocking a move either way. Over the past day it has traded between $55,130 and $60,996, sitting near the top of it now. The last 24 hours carried roughly 2.3x normal volume. The 20 average is at $59,095 and the 50 at $60,099. Up 1.0% over 24 hours.
DYOR
$BTC #Trading
$BTC is at $60,082, with one average above price and one below. The three day range runs from $55,130 up to $64,081. That puts price in the middle of the range. That is 6.7% to the ceiling and 8.2% to the floor. The 20 has stayed below the 50 for a long stretch now. RSI at 56 is neutral, so momentum is not blocking a move either way. Over the past day it has traded between $55,130 and $60,996, sitting near the top of it now. The last 24 hours carried roughly 2.3x normal volume. The 20 average is at $59,095 and the 50 at $60,099. Up 1.0% over 24 hours.
DYOR
$BTC #Trading
1
531

·
--
Fumbled $ENA badly. 😅
I bought the bounce, then watched it bleed while pretending $0.10 would hold. Bad timing.
Now it’s $0.0979, down 0.71% today, with $34.76M traded. The 4h RSI is 37, price is below both the 20d and 50d MAs, and volume is only 1.3x average. Meanwhile $ETH looks far healthier.
At $0.10, I’m waiting for a clean reclaim, not forcing another entry. 📉
Watching how ENA reacts at $0.10?
#ENA #Trading #Web3
Fumbled $ENA badly. 😅
I bought the bounce, then watched it bleed while pretending $0.10 would hold. Bad timing.
Now it’s $0.0979, down 0.71% today, with $34.76M traded. The 4h RSI is 37, price is below both the 20d and 50d MAs, and volume is only 1.3x average. Meanwhile $ETH looks far healthier.
At $0.10, I’m waiting for a clean reclaim, not forcing another entry. 📉
Watching how ENA reacts at $0.10?
#ENA #Trading #Web3
I bought the bounce, then watched it bleed while pretending $0.10 would hold. Bad timing.
Now it’s $0.0979, down 0.71% today, with $34.76M traded. The 4h RSI is 37, price is below both the 20d and 50d MAs, and volume is only 1.3x average. Meanwhile $ETH looks far healthier.
At $0.10, I’m waiting for a clean reclaim, not forcing another entry. 📉
Watching how ENA reacts at $0.10?
#ENA #Trading #Web3
318

·
--
Bullish
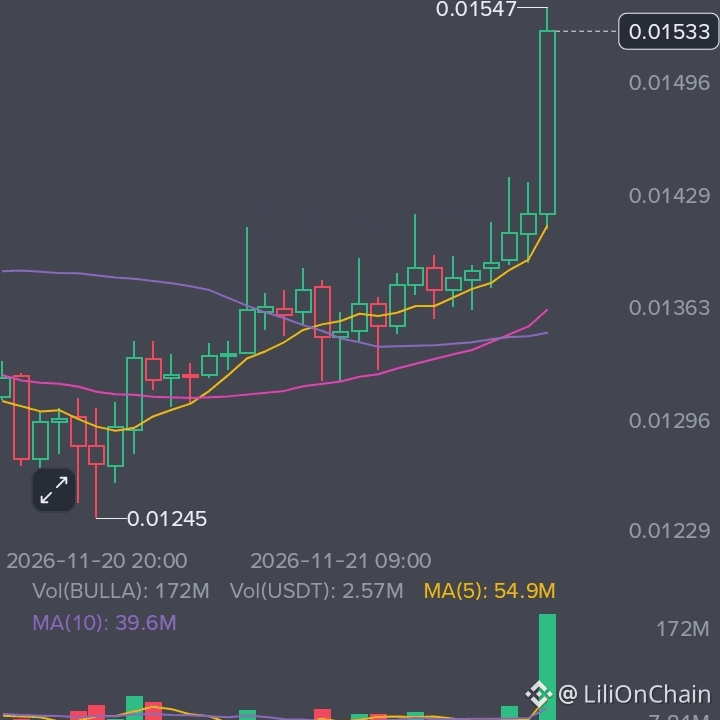
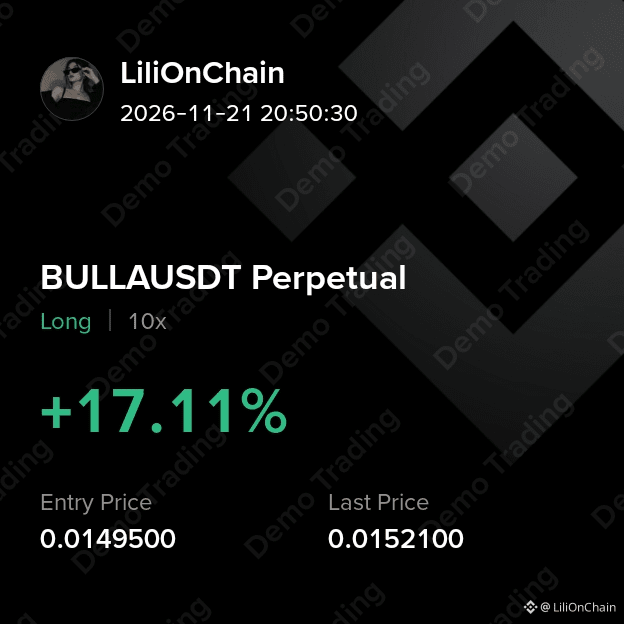
Remember the $BULLA short we discussed❓Sometimes the best opportunities come when the market changes direction.
What's happening on the chart?
#BULLA has pushed above its moving averages with a strong bullish candle and a noticeable volume spike. Buyers are clearly showing strength, but RSI is now around 93 which signals extremely overbought conditions.
📍Levels I'm watching:
- $0.01547 – Immediate resistance
- $0.01496 – First pullback area
- $0.01418 – MA7 support
A clean breakout above $0.01547 could open the door for another move up, while rejection may bring a short-term correction.
OPEN TRADE 👇🏻
{future}(BULLAUSDT)
$IDOL #trading $KERNEL
Remember the $BULLA short we discussed❓Sometimes the best opportunities come when the market changes direction.
What's happening on the chart?
#BULLA has pushed above its moving averages with a strong bullish candle and a noticeable volume spike. Buyers are clearly showing strength, but RSI is now around 93 which signals extremely overbought conditions.
📍Levels I'm watching:
- $0.01547 – Immediate resistance
- $0.01496 – First pullback area
- $0.01418 – MA7 support
A clean breakout above $0.01547 could open the door for another move up, while rejection may bring a short-term correction.
OPEN TRADE 👇🏻
$IDOL #trading $KERNEL
What's happening on the chart?
#BULLA has pushed above its moving averages with a strong bullish candle and a noticeable volume spike. Buyers are clearly showing strength, but RSI is now around 93 which signals extremely overbought conditions.
📍Levels I'm watching:
- $0.01547 – Immediate resistance
- $0.01496 – First pullback area
- $0.01418 – MA7 support
A clean breakout above $0.01547 could open the door for another move up, while rejection may bring a short-term correction.
OPEN TRADE 👇🏻
$IDOL #trading $KERNEL
2
2
617

🚨 XRP PRICE PREDICTION – IS ANOTHER DUMP COMING? 📉
📅 22 NOVEMBER 2026
Trading Pair: XRP/USDT
🔴 **MARKET OUTLOOK: BEARISH**
XRP is showing weakness, and the bears are still controlling the higher timeframes.
Let's understand why XRP could move lower.
### 🔍 WHY XRP COULD GO DOWN
1️⃣ **EMA Pressure:** XRP is trading below its major moving averages, indicating a weak overall trend.
2️⃣ **RSI Indicator:** Daily RSI is around 29, showing oversold conditions. A temporary bounce is possible, but it does not confirm a trend reversal.
3️⃣ **MACRO SENTIMENT:** Weak institutional and retail demand is putting additional pressure on XRP.
4️⃣ **Resistance:** Buyers need to reclaim $0.9519 to show signs of short-term strength.
### 📊 IMPORTANT LEVELS
Current reference price: $0.93
🟢 Support:
- $0.8990
- $0.8586
- $0.7996
🔴 Resistance:
- $0.9519
- $0.9824
- $1.0227
### 🎯 MY PREDICTION
**BEARISH SCENARIO 📉**
If XRP breaks below $0.8990 with strong selling volume, the next support could be $0.8586.
**BULLISH SCENARIO 🚀**
If XRP reclaims $0.9519 and holds above it, a recovery towards $0.9824 could happen.
### 🧠 FINAL VERDICT
My short-term bias is BEARISH until XRP confirms a strong breakout.
I would wait for confirmation before entering any trade.
⚠️ This is a technical market outlook, not a guaranteed prediction.
👇 What do you think?
Will XRP fall towards $0.85 or recover above $1.00?
#XRP #Ripple #XRPUSDT #CryptoAnalysis #BinanceSquare #Altcoins #Trading #XRPPredictions $XRP
🚨 XRP PRICE PREDICTION – IS ANOTHER DUMP COMING? 📉
📅 22 NOVEMBER 2026
Trading Pair: XRP/USDT
🔴 **MARKET OUTLOOK: BEARISH**
XRP is showing weakness, and the bears are still controlling the higher timeframes.
Let's understand why XRP could move lower.
### 🔍 WHY XRP COULD GO DOWN
1️⃣ **EMA Pressure:** XRP is trading below its major moving averages, indicating a weak overall trend.
2️⃣ **RSI Indicator:** Daily RSI is around 29, showing oversold conditions. A temporary bounce is possible, but it does not confirm a trend reversal.
3️⃣ **MACRO SENTIMENT:** Weak institutional and retail demand is putting additional pressure on XRP.
4️⃣ **Resistance:** Buyers need to reclaim $0.9519 to show signs of short-term strength.
### 📊 IMPORTANT LEVELS
Current reference price: $0.93
🟢 Support:
- $0.8990
- $0.8586
- $0.7996
🔴 Resistance:
- $0.9519
- $0.9824
- $1.0227
### 🎯 MY PREDICTION
**BEARISH SCENARIO 📉**
If XRP breaks below $0.8990 with strong selling volume, the next support could be $0.8586.
**BULLISH SCENARIO 🚀**
If XRP reclaims $0.9519 and holds above it, a recovery towards $0.9824 could happen.
### 🧠 FINAL VERDICT
My short-term bias is BEARISH until XRP confirms a strong breakout.
I would wait for confirmation before entering any trade.
⚠️ This is a technical market outlook, not a guaranteed prediction.
👇 What do you think?
Will XRP fall towards $0.85 or recover above $1.00?
#XRP #Ripple #XRPUSDT #CryptoAnalysis #BinanceSquare #Altcoins #Trading #XRPPredictions $XRP
📅 22 NOVEMBER 2026
Trading Pair: XRP/USDT
🔴 **MARKET OUTLOOK: BEARISH**
XRP is showing weakness, and the bears are still controlling the higher timeframes.
Let's understand why XRP could move lower.
### 🔍 WHY XRP COULD GO DOWN
1️⃣ **EMA Pressure:** XRP is trading below its major moving averages, indicating a weak overall trend.
2️⃣ **RSI Indicator:** Daily RSI is around 29, showing oversold conditions. A temporary bounce is possible, but it does not confirm a trend reversal.
3️⃣ **MACRO SENTIMENT:** Weak institutional and retail demand is putting additional pressure on XRP.
4️⃣ **Resistance:** Buyers need to reclaim $0.9519 to show signs of short-term strength.
### 📊 IMPORTANT LEVELS
Current reference price: $0.93
🟢 Support:
- $0.8990
- $0.8586
- $0.7996
🔴 Resistance:
- $0.9519
- $0.9824
- $1.0227
### 🎯 MY PREDICTION
**BEARISH SCENARIO 📉**
If XRP breaks below $0.8990 with strong selling volume, the next support could be $0.8586.
**BULLISH SCENARIO 🚀**
If XRP reclaims $0.9519 and holds above it, a recovery towards $0.9824 could happen.
### 🧠 FINAL VERDICT
My short-term bias is BEARISH until XRP confirms a strong breakout.
I would wait for confirmation before entering any trade.
⚠️ This is a technical market outlook, not a guaranteed prediction.
👇 What do you think?
Will XRP fall towards $0.85 or recover above $1.00?
#XRP #Ripple #XRPUSDT #CryptoAnalysis #BinanceSquare #Altcoins #Trading #XRPPredictions $XRP
1
120

·
--
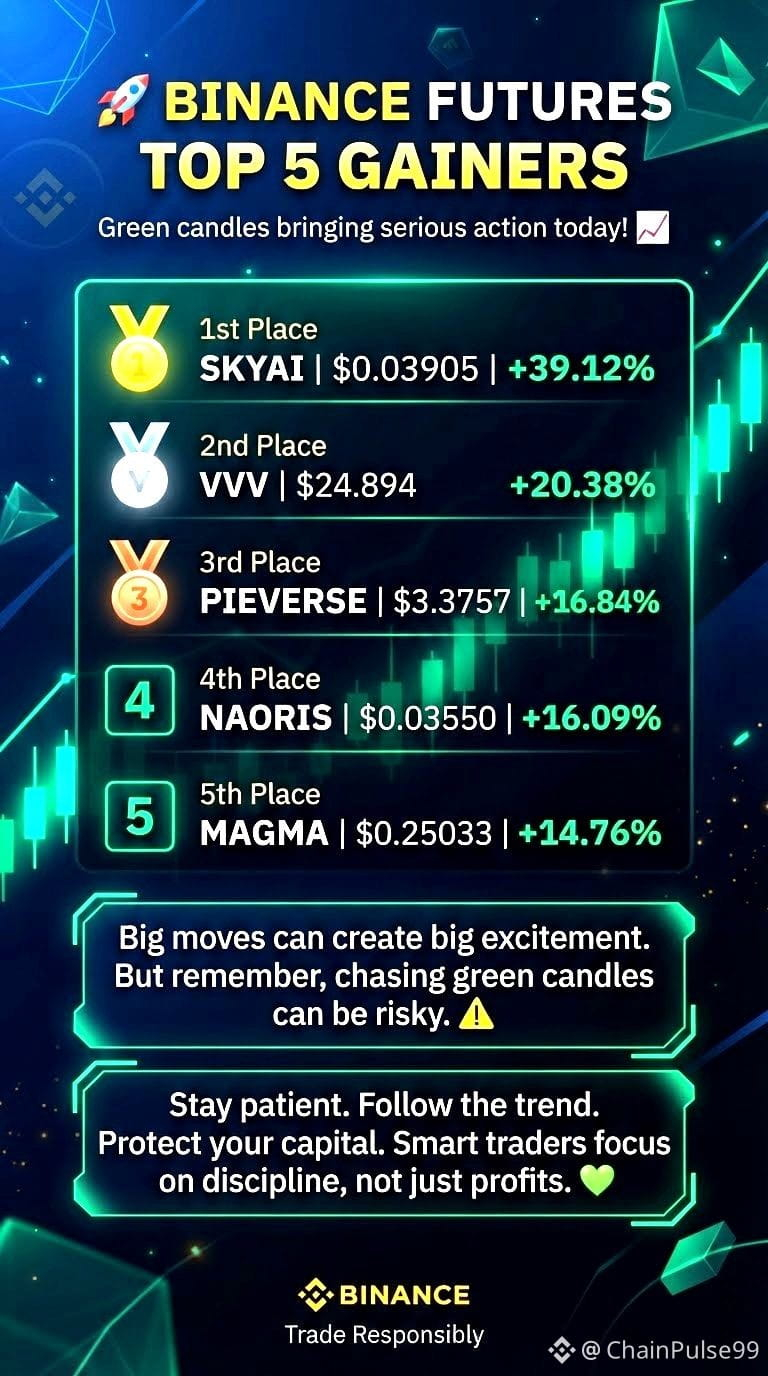
🚀 BINANCE FUTURES TOP 5 GAINERS
Green candles are bringing some serious action today! 📈
Here are the top 5 USDT Futures gainers:
🥇 $SKYAI : $0.03905 | +39.12%
🥈 $VVV : $24.894 | +20.38%
🥉 $PIEVERSE : $3.3757 | +16.84%
4️⃣ NAORIS: $0.03550 | +16.09%
5️⃣ MAGMA: $0.25033 | +14.76%
Big moves can create big excitement.
But remember, chasing green candles can be risky.
Stay patient. Follow the trend. Protect your capital.
Smart traders focus on discipline, not just profits. 💚
#Binance #futuresignal #GAINERS #trading
🚀 BINANCE FUTURES TOP 5 GAINERS
Green candles are bringing some serious action today! 📈
Here are the top 5 USDT Futures gainers:
🥇 $SKYAI : $0.03905 | +39.12%
🥈 $VVV : $24.894 | +20.38%
🥉 $PIEVERSE : $3.3757 | +16.84%
4️⃣ NAORIS: $0.03550 | +16.09%
5️⃣ MAGMA: $0.25033 | +14.76%
Big moves can create big excitement.
But remember, chasing green candles can be risky.
Stay patient. Follow the trend. Protect your capital.
Smart traders focus on discipline, not just profits. 💚
#Binance #futuresignal #GAINERS #trading
Green candles are bringing some serious action today! 📈
Here are the top 5 USDT Futures gainers:
🥇 $SKYAI : $0.03905 | +39.12%
🥈 $VVV : $24.894 | +20.38%
🥉 $PIEVERSE : $3.3757 | +16.84%
4️⃣ NAORIS: $0.03550 | +16.09%
5️⃣ MAGMA: $0.25033 | +14.76%
Big moves can create big excitement.
But remember, chasing green candles can be risky.
Stay patient. Follow the trend. Protect your capital.
Smart traders focus on discipline, not just profits. 💚
#Binance #futuresignal #GAINERS #trading
759

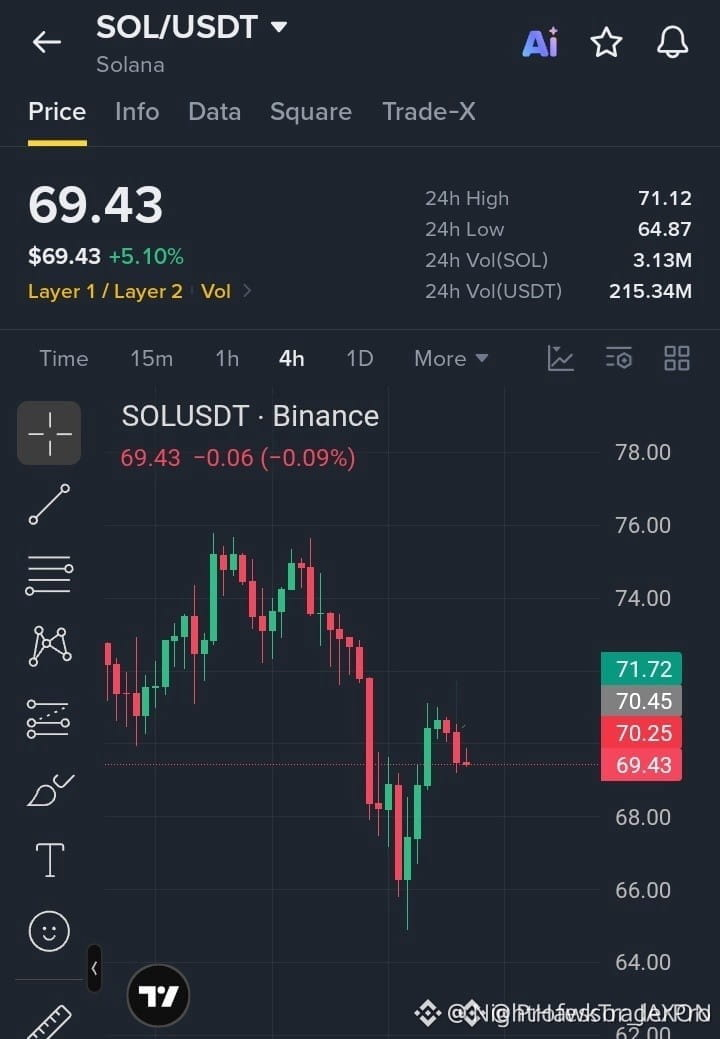
📉 $SOL FAILS TO RECLAIM KEY SUPPLY AS SMART MONEY DISTRIBUTES INTO STRENGTH
Entry: 69.40 - 70.20 ⚡
Target: 68.20 - 67.00 - 65.80 🚀
Stop Loss: 71.30 🛑
Price action stalls right beneath the seventy-dollar psychological barrier, printing a clean institutional rejection after a lackluster relief bounce. Sellers are actively absorbing bids while momentum indicators roll over decisively on the lower timeframes.
A sustained structural breakdown beneath the sixty-nine-dollar support level should accelerate liquidation cascades toward deeper structural liquidity pools.
💬 Are you positioning for this downside continuation or waiting for a secondary mitigation block? 👇
⚠️ Not financial advice. Always manage your risk. 🛡️
🏷️ #SOL #ShortSetup #PriceAction #Trading
🦈 📉
📉 $SOL FAILS TO RECLAIM KEY SUPPLY AS SMART MONEY DISTRIBUTES INTO STRENGTH
Entry: 69.40 - 70.20 ⚡
Target: 68.20 - 67.00 - 65.80 🚀
Stop Loss: 71.30 🛑
Price action stalls right beneath the seventy-dollar psychological barrier, printing a clean institutional rejection after a lackluster relief bounce. Sellers are actively absorbing bids while momentum indicators roll over decisively on the lower timeframes.
A sustained structural breakdown beneath the sixty-nine-dollar support level should accelerate liquidation cascades toward deeper structural liquidity pools.
💬 Are you positioning for this downside continuation or waiting for a secondary mitigation block? 👇
⚠️ Not financial advice. Always manage your risk. 🛡️
🏷️ #SOL #ShortSetup #PriceAction #Trading
🦈 📉
Entry: 69.40 - 70.20 ⚡
Target: 68.20 - 67.00 - 65.80 🚀
Stop Loss: 71.30 🛑
Price action stalls right beneath the seventy-dollar psychological barrier, printing a clean institutional rejection after a lackluster relief bounce. Sellers are actively absorbing bids while momentum indicators roll over decisively on the lower timeframes.
A sustained structural breakdown beneath the sixty-nine-dollar support level should accelerate liquidation cascades toward deeper structural liquidity pools.
💬 Are you positioning for this downside continuation or waiting for a secondary mitigation block? 👇
⚠️ Not financial advice. Always manage your risk. 🛡️
🏷️ #SOL #ShortSetup #PriceAction #Trading
🦈 📉
14
🚨 TRON (TRX) PRICE ANALYSIS – WILL TRX BREAK BELOW $0.30? 📉
📅 November 22, 2026
**Market Sentim🚨 TRON (TRX) PRICE ANALYSIS – WILL TRX BREAK BELOW $0.30? 📉
📅 November 22, 2026
Market Sentiment: BEARISH 🔴
TRON is currently showing weakness, and sellers appear to have control of the daily trend.
🔍 WHY COULD TRX GO DOWN?
1️⃣ Weak Momentum: Daily RSI is around 39, showing weak buying momentum.
2️⃣ EMA Pressure: TRX is trading below its 20-day and 50-day moving averages.
3️⃣ MACD Signal: MACD remains below its signal line, indicating bearish momentum.
4️⃣ Important Support: The $0.30 level is a critical psychological support zone.
📊 KEY LEVELS
Current Price: Around $0.3047
Resistance:
$0.3135$0.3195$0.3230
Support:
$0.3018$0.2957$0.2922
🎯 MY PREDICTION
🔴 Bearish Scenario:
If TRX breaks below $0.3000, it could move towards $0.2957 and $0.2922.
🟢 Bullish Scenario:
If TRX reclaims $0.3135 with strong volume, a recovery towards $0.3195 could happen.
FINAL VERDICT
My short-term outlook is BEARISH.
I will be watching the $0.3000 support level very closely.
What do you think?
Will TRX break $0.30 or surprise everyone with a bullish reversal? 👇
#TRON #TRX #CryptoAnalysis #BinanceSquare #Altcoins #Trading #NvidiaLoses$2.7TrillionInMonthAndAHalf #Trxusdt #BearishAlert $TRX
🚨 TRON (TRX) PRICE ANALYSIS – WILL TRX BREAK BELOW $0.30? 📉 📅 November 22, 2026 **Market Sentim
🚨 TRON (TRX) PRICE ANALYSIS – WILL TRX BREAK BELOW $0.30? 📉
📅 November 22, 2026
Market Sentiment: BEARISH 🔴
TRON is currently showing weakness, and sellers appear to have control of the daily trend.
🔍 WHY COULD TRX GO DOWN?
1️⃣ Weak Momentum: Daily RSI is around 39, showing weak buying momentum.
2️⃣ EMA Pressure: TRX is trading below its 20-day and 50-day moving averages.
3️⃣ MACD Signal: MACD remains below its signal line, indicating bearish momentum.
4️⃣ Important Support: The $0.30 level is a critical psychological support zone.
📊 KEY LEVELS
Current Price: Around $0.3047
Resistance:
$0.3135$0.3195$0.3230
Support:
$0.3018$0.2957$0.2922
🎯 MY PREDICTION
🔴 Bearish Scenario:
If TRX breaks below $0.3000, it could move towards $0.2957 and $0.2922.
🟢 Bullish Scenario:
If TRX reclaims $0.3135 with strong volume, a recovery towards $0.3195 could happen.
FINAL VERDICT
My short-term outlook is BEARISH.
I will be watching the $0.3000 support level very closely.
What do you think?
Will TRX break $0.30 or surprise everyone with a bullish reversal? 👇
#TRON #TRX #CryptoAnalysis #BinanceSquare #Altcoins #Trading #NvidiaLoses$2.7TrillionInMonthAndAHalf #Trxusdt #BearishAlert $TRX
📅 November 22, 2026
Market Sentiment: BEARISH 🔴
TRON is currently showing weakness, and sellers appear to have control of the daily trend.
🔍 WHY COULD TRX GO DOWN?
1️⃣ Weak Momentum: Daily RSI is around 39, showing weak buying momentum.
2️⃣ EMA Pressure: TRX is trading below its 20-day and 50-day moving averages.
3️⃣ MACD Signal: MACD remains below its signal line, indicating bearish momentum.
4️⃣ Important Support: The $0.30 level is a critical psychological support zone.
📊 KEY LEVELS
Current Price: Around $0.3047
Resistance:
$0.3135$0.3195$0.3230
Support:
$0.3018$0.2957$0.2922
🎯 MY PREDICTION
🔴 Bearish Scenario:
If TRX breaks below $0.3000, it could move towards $0.2957 and $0.2922.
🟢 Bullish Scenario:
If TRX reclaims $0.3135 with strong volume, a recovery towards $0.3195 could happen.
FINAL VERDICT
My short-term outlook is BEARISH.
I will be watching the $0.3000 support level very closely.
What do you think?
Will TRX break $0.30 or surprise everyone with a bullish reversal? 👇
#TRON #TRX #CryptoAnalysis #BinanceSquare #Altcoins #Trading #NvidiaLoses$2.7TrillionInMonthAndAHalf #Trxusdt #BearishAlert $TRX
78
·
--
$BANK is closer to a squeeze than a collapse.
Yeah, the chart looks ugly. Down 4.24% today, another 4.8% in the latest 4h window, and price is sitting under both the 20d and 50d averages. Bearish stack, no debate.
But RSI is 21. That’s not strength, it’s exhaustion. Volume is only 1.2x the 20d average while longs are paying 0.005% funding. Sellers aren’t exactly showing up with a flamethrower 🔥
At $0.0158, I’m not chasing downside. I’d watch $0.016 closely and expect a violent relief bounce before believing the trend has actually healed.
$XRP taught this market one thing: oversold can stay oversold, but crowded positioning still gets punished. BANK feels like that setup now ⚡
#BANK #Trading
$BANK is closer to a squeeze than a collapse.
Yeah, the chart looks ugly. Down 4.24% today, another 4.8% in the latest 4h window, and price is sitting under both the 20d and 50d averages. Bearish stack, no debate.
But RSI is 21. That’s not strength, it’s exhaustion. Volume is only 1.2x the 20d average while longs are paying 0.005% funding. Sellers aren’t exactly showing up with a flamethrower 🔥
At $0.0158, I’m not chasing downside. I’d watch $0.016 closely and expect a violent relief bounce before believing the trend has actually healed.
$XRP taught this market one thing: oversold can stay oversold, but crowded positioning still gets punished. BANK feels like that setup now ⚡
#BANK #Trading
Yeah, the chart looks ugly. Down 4.24% today, another 4.8% in the latest 4h window, and price is sitting under both the 20d and 50d averages. Bearish stack, no debate.
But RSI is 21. That’s not strength, it’s exhaustion. Volume is only 1.2x the 20d average while longs are paying 0.005% funding. Sellers aren’t exactly showing up with a flamethrower 🔥
At $0.0158, I’m not chasing downside. I’d watch $0.016 closely and expect a violent relief bounce before believing the trend has actually healed.
$XRP taught this market one thing: oversold can stay oversold, but crowded positioning still gets punished. BANK feels like that setup now ⚡
#BANK #Trading
554


·
--
Bullish
$VVV / USDT - LONG Setup 🚀
Momentum is building up on $VVV and price is holding above key support. Looking for a bounce from here.
My Plan:
Entry: Around $24.944
Stop Loss: $23.800
Targets:
TP1: $25.480
TP2: $26.200
TP3: $27.000
Risk is well-defined, reward is almost 2.5x the risk. If price holds above entry, TP1 and TP2 look very achievable.
I will move SL to breakeven after TP1 hits to secure the trade.
Not financial advice. Always manage your own risk and do your own research.
Do you think $VVV will hit TP3 today? Drop your thoughts in comments 👇
#VVV #Crypto #BinanceSquare #Trading
$VVV / USDT - LONG Setup 🚀
Momentum is building up on $VVV and price is holding above key support. Looking for a bounce from here.
My Plan:
Entry: Around $24.944
Stop Loss: $23.800
Targets:
TP1: $25.480
TP2: $26.200
TP3: $27.000
Risk is well-defined, reward is almost 2.5x the risk. If price holds above entry, TP1 and TP2 look very achievable.
I will move SL to breakeven after TP1 hits to secure the trade.
Not financial advice. Always manage your own risk and do your own research.
Do you think $VVV will hit TP3 today? Drop your thoughts in comments 👇
#VVV #Crypto #BinanceSquare #Trading
Momentum is building up on $VVV and price is holding above key support. Looking for a bounce from here.
My Plan:
Entry: Around $24.944
Stop Loss: $23.800
Targets:
TP1: $25.480
TP2: $26.200
TP3: $27.000
Risk is well-defined, reward is almost 2.5x the risk. If price holds above entry, TP1 and TP2 look very achievable.
I will move SL to breakeven after TP1 hits to secure the trade.
Not financial advice. Always manage your own risk and do your own research.
Do you think $VVV will hit TP3 today? Drop your thoughts in comments 👇
#VVV #Crypto #BinanceSquare #Trading
179
·
--
$RENDER or $TAO for the next leg? Only one.
$RENDER is up 7.91% to $1.31, with $4.36M traded. The 4h move is +6.3%, but don't confuse one green candle with a trend flip.
Still below the 20d and 50d MAs. RSI sits at 46, while volume is only 0.1x its 20d average. Weak participation. 👀
At $1.30, I’d wait for a clean reclaim, not chase. $BTC strength can help, but RENDER needs its own bid.
TAO has the narrative. RENDER has the bounce. Pick your side. 🔥
#RENDER #Trading
$RENDER or $TAO for the next leg? Only one.
$RENDER is up 7.91% to $1.31, with $4.36M traded. The 4h move is +6.3%, but don't confuse one green candle with a trend flip.
Still below the 20d and 50d MAs. RSI sits at 46, while volume is only 0.1x its 20d average. Weak participation. 👀
At $1.30, I’d wait for a clean reclaim, not chase. $BTC strength can help, but RENDER needs its own bid.
TAO has the narrative. RENDER has the bounce. Pick your side. 🔥
#RENDER #Trading
$RENDER is up 7.91% to $1.31, with $4.36M traded. The 4h move is +6.3%, but don't confuse one green candle with a trend flip.
Still below the 20d and 50d MAs. RSI sits at 46, while volume is only 0.1x its 20d average. Weak participation. 👀
At $1.30, I’d wait for a clean reclaim, not chase. $BTC strength can help, but RENDER needs its own bid.
TAO has the narrative. RENDER has the bounce. Pick your side. 🔥
#RENDER #Trading
127

·
--
Bullish
$DODO /USDT – Bullish Trade Setup
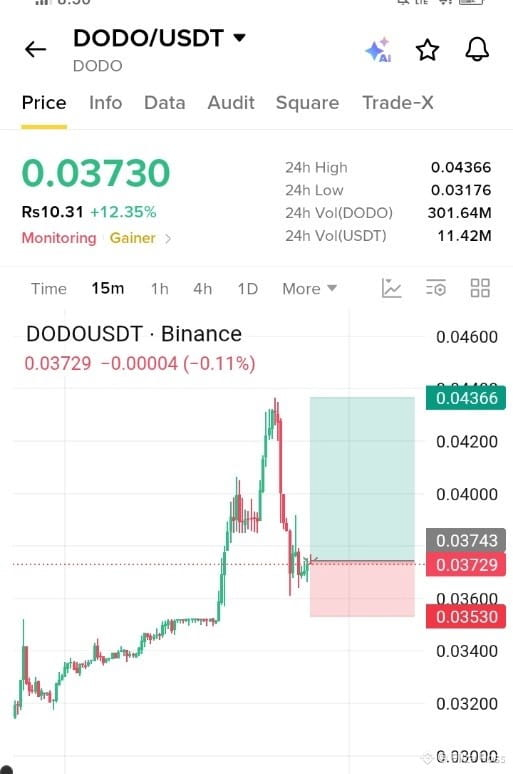
$DODO is showing renewed buying interest, gaining 12.35% in the last 24 hours. Price is trading around $0.03730 after recovering from the $0.03176 low.
The key resistance stands at $0.04000, followed by the recent high of $0.04366. A confirmed breakout could open the door for further upside.
Entry Zone: $0.0365 – $0.0375
Take Profit Targets:
TP1: $0.0390
TP2: $0.0400
TP3: $0.0415
TP4: $0.0435
TP5: $0.0460
Stop Loss: $0.0345
Key Resistance: $0.0400
Key Support: $0.0353
Market Outlook:
$DODO remains interesting while buyers defend the $0.0353 support zone. A breakout above $0.0400 could strengthen bullish momentum toward higher targets. Wait for confirmation before entering.
Trade smart and manage your risk.
{spot}(DODOUSDT)
#DODO #Binance #CryptoSignals #Trading
$DODO /USDT – Bullish Trade Setup
$DODO is showing renewed buying interest, gaining 12.35% in the last 24 hours. Price is trading around $0.03730 after recovering from the $0.03176 low.
The key resistance stands at $0.04000, followed by the recent high of $0.04366. A confirmed breakout could open the door for further upside.
Entry Zone: $0.0365 – $0.0375
Take Profit Targets:
TP1: $0.0390
TP2: $0.0400
TP3: $0.0415
TP4: $0.0435
TP5: $0.0460
Stop Loss: $0.0345
Key Resistance: $0.0400
Key Support: $0.0353
Market Outlook:
$DODO remains interesting while buyers defend the $0.0353 support zone. A breakout above $0.0400 could strengthen bullish momentum toward higher targets. Wait for confirmation before entering.
Trade smart and manage your risk.
#DODO #Binance #CryptoSignals #Trading
$DODO is showing renewed buying interest, gaining 12.35% in the last 24 hours. Price is trading around $0.03730 after recovering from the $0.03176 low.
The key resistance stands at $0.04000, followed by the recent high of $0.04366. A confirmed breakout could open the door for further upside.
Entry Zone: $0.0365 – $0.0375
Take Profit Targets:
TP1: $0.0390
TP2: $0.0400
TP3: $0.0415
TP4: $0.0435
TP5: $0.0460
Stop Loss: $0.0345
Key Resistance: $0.0400
Key Support: $0.0353
Market Outlook:
$DODO remains interesting while buyers defend the $0.0353 support zone. A breakout above $0.0400 could strengthen bullish momentum toward higher targets. Wait for confirmation before entering.
Trade smart and manage your risk.
#DODO #Binance #CryptoSignals #Trading
1
3
294

·
--
If you're still panic selling every time the market bleeds, stop now.
This is one of the most expensive mistakes in crypto. You get flushed out at support then watch the rebound from the sidelines.
While $BTC and $ETH were bleeding, $SKYAI bounced from the $0.027 demand zone and delivered a 40.8% move.
Plenty of people will call this a fakeout or dead cat. I think the opposite. That kind of outperformance in a red market usually means the token has buyers willing to step in when others are selling.
Most traders miss these because they're too busy reacting to Bitcoin instead of looking at relative strength.
Where do you think this goes from here?
#Crypto #Altcoins #Trading
If you're still panic selling every time the market bleeds, stop now.
This is one of the most expensive mistakes in crypto. You get flushed out at support then watch the rebound from the sidelines.
While $BTC and $ETH were bleeding, $SKYAI bounced from the $0.027 demand zone and delivered a 40.8% move.
Plenty of people will call this a fakeout or dead cat. I think the opposite. That kind of outperformance in a red market usually means the token has buyers willing to step in when others are selling.
Most traders miss these because they're too busy reacting to Bitcoin instead of looking at relative strength.
Where do you think this goes from here?
#Crypto #Altcoins #Trading
This is one of the most expensive mistakes in crypto. You get flushed out at support then watch the rebound from the sidelines.
While $BTC and $ETH were bleeding, $SKYAI bounced from the $0.027 demand zone and delivered a 40.8% move.
Plenty of people will call this a fakeout or dead cat. I think the opposite. That kind of outperformance in a red market usually means the token has buyers willing to step in when others are selling.
Most traders miss these because they're too busy reacting to Bitcoin instead of looking at relative strength.
Where do you think this goes from here?
#Crypto #Altcoins #Trading

1
167

·
--
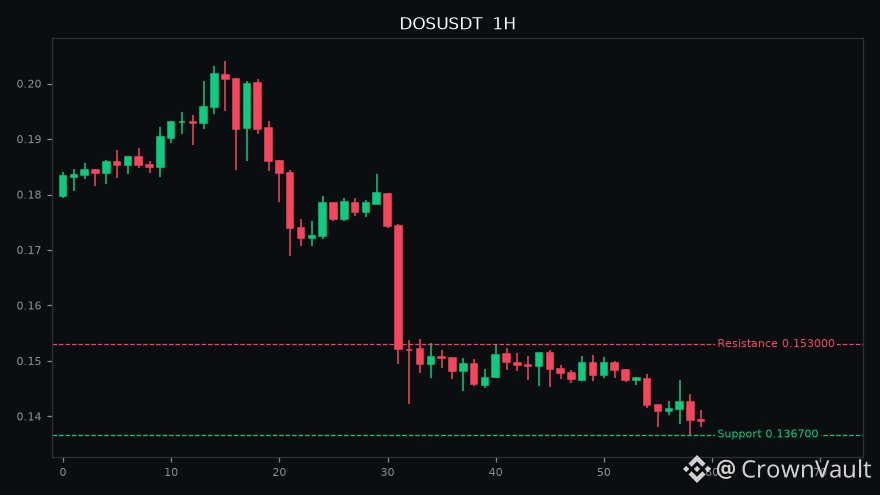
📉 A steady look at $DOS, down -7.6% in 24 hours.
🔹 Price: 0.139200
🔹 24h High: 0.153000 | 24h Low: 0.136700
🔹 24h Volume: $13.2M
🔹 It is trading close to the 24h low (1.8% above it).
🔎 What the data says (1H)
🔹 Momentum is very low (RSI 30). Be careful with fresh shorts.
🔹 Only 0.7x average volume. Without volume, breakouts can fail.
🔹 MACD histogram is positive, a good sign for buyers.
📍 Important levels
🔹 On 1H, buyers defend 0.136700 and sellers wait near 0.153000.
🔹 Bears need a close below 0.136700 to continue.
🔹 If price closes above 0.153000, buyers can push it higher.
BTC is +1.4% in 24h, which supports the mood of the market.
Patience is important in trading. Follow the plan.
#DOS #CryptoTrading #Trading
⚠️ Not financial advice. Trade at your own risk.
📉 A steady look at $DOS , down -7.6% in 24 hours.
🔹 Price: 0.139200
🔹 24h High: 0.153000 | 24h Low: 0.136700
🔹 24h Volume: $13.2M
🔹 It is trading close to the 24h low (1.8% above it).
🔎 What the data says (1H)
🔹 Momentum is very low (RSI 30). Be careful with fresh shorts.
🔹 Only 0.7x average volume. Without volume, breakouts can fail.
🔹 MACD histogram is positive, a good sign for buyers.
📍 Important levels
🔹 On 1H, buyers defend 0.136700 and sellers wait near 0.153000.
🔹 Bears need a close below 0.136700 to continue.
🔹 If price closes above 0.153000, buyers can push it higher.
BTC is +1.4% in 24h, which supports the mood of the market.
Patience is important in trading. Follow the plan.
#DOS #CryptoTrading #Trading
⚠️ Not financial advice. Trade at your own risk.
🔹 Price: 0.139200
🔹 24h High: 0.153000 | 24h Low: 0.136700
🔹 24h Volume: $13.2M
🔹 It is trading close to the 24h low (1.8% above it).
🔎 What the data says (1H)
🔹 Momentum is very low (RSI 30). Be careful with fresh shorts.
🔹 Only 0.7x average volume. Without volume, breakouts can fail.
🔹 MACD histogram is positive, a good sign for buyers.
📍 Important levels
🔹 On 1H, buyers defend 0.136700 and sellers wait near 0.153000.
🔹 Bears need a close below 0.136700 to continue.
🔹 If price closes above 0.153000, buyers can push it higher.
BTC is +1.4% in 24h, which supports the mood of the market.
Patience is important in trading. Follow the plan.
#DOS #CryptoTrading #Trading
⚠️ Not financial advice. Trade at your own risk.
Log in to explore more content
Join global crypto users on Binance Square
⚡️ Get latest and useful information about crypto.
💬 Trusted by the world’s largest crypto exchange.
👍 Discover real insights from verified creators.
Email / Phone number
Trending Topics
1
#BTCReboundsAbove$60KAmidWhaleDipBuying
4,357 views
49 Discussing
2
#NvidiaLoses$2.7TrillionInMonthAndAHalf
43,107 views
202 Discussing
3
#GlobalStocksFaceLongestLosingStreakSince2023
393,139 views
2,592 Discussing
4
#BlackRockIBITPostsRecord$541MSingleDayOutflow
57,295 views
140 Discussing
5
#AnthropicPlungesTowardIPOPriceonDay2
208,427 views
1,671 Discussing
6
#TwentyOneCapitalAdds172.25BTC
100,391 views
1,069 Discussing
7
#HKBillWouldExcludeTokenizedDepositsFromVirtualAssets
14,399 views
65 Discussing
8
#HKBillProposesHK$100KFineForUnauthorizedCryptoTitles
3,545 views
30 Discussing
9
#BitMineFaces$10.1BUnrealizedETHLoss
6,903 views
32 Discussing
10
#StrategyReports$35BNetReserves
3,668 views
23 Discussing