
#cc
cc
499,523 views
3,012 Discussing
Hot
Latest

·
--
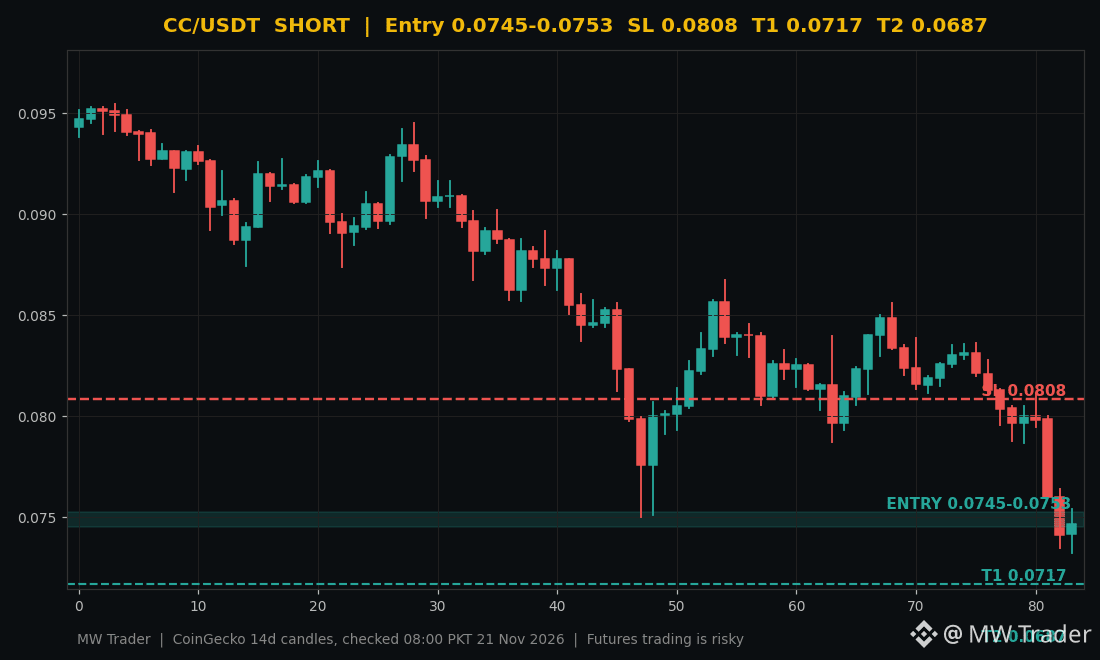
$CC #CC 📉 Canton is down 6.18 percent today and I am shorting the bounce.
Direction: SHORT 🔴
Entry zone: 0.0745 to 0.0753
Stop loss: 0.0808
Target 1: 0.0717
Target 2: 0.0687
Canton is trading near $0.0747 after losing 6.18 percent in 24 hours, according to CoinGecko, and the live price sits right inside my entry zone of 0.0745 to 0.0753. The coin fell from a 24 hour high of $0.0811 to a low of $0.0732 while Bitcoin broke below $60,000, and it is sitting near its daily low with no sign of buyers stepping in yet. My plan is short the zone, stop above $0.0808, take the first profit at $0.0717, with $0.0687 as the second target. 📉
Would you short CC here, or wait for a bounce back toward $0.0808 first? 🤔
Futures trading is risky, trade small, manage risk, do your own research. ⚠️
Follow for more trades.
#Canton #Crypto #FuturesTrading #TradingSignals
$CC #CC 📉 Canton is down 6.18 percent today and I am shorting the bounce.
Direction: SHORT 🔴
Entry zone: 0.0745 to 0.0753
Stop loss: 0.0808
Target 1: 0.0717
Target 2: 0.0687
Canton is trading near $0.0747 after losing 6.18 percent in 24 hours, according to CoinGecko, and the live price sits right inside my entry zone of 0.0745 to 0.0753. The coin fell from a 24 hour high of $0.0811 to a low of $0.0732 while Bitcoin broke below $60,000, and it is sitting near its daily low with no sign of buyers stepping in yet. My plan is short the zone, stop above $0.0808, take the first profit at $0.0717, with $0.0687 as the second target. 📉
Would you short CC here, or wait for a bounce back toward $0.0808 first? 🤔
Futures trading is risky, trade small, manage risk, do your own research. ⚠️
Follow for more trades.
#Canton #Crypto #FuturesTrading #TradingSignals
Direction: SHORT 🔴
Entry zone: 0.0745 to 0.0753
Stop loss: 0.0808
Target 1: 0.0717
Target 2: 0.0687
Canton is trading near $0.0747 after losing 6.18 percent in 24 hours, according to CoinGecko, and the live price sits right inside my entry zone of 0.0745 to 0.0753. The coin fell from a 24 hour high of $0.0811 to a low of $0.0732 while Bitcoin broke below $60,000, and it is sitting near its daily low with no sign of buyers stepping in yet. My plan is short the zone, stop above $0.0808, take the first profit at $0.0717, with $0.0687 as the second target. 📉
Would you short CC here, or wait for a bounce back toward $0.0808 first? 🤔
Futures trading is risky, trade small, manage risk, do your own research. ⚠️
Follow for more trades.
#Canton #Crypto #FuturesTrading #TradingSignals
1
·
--
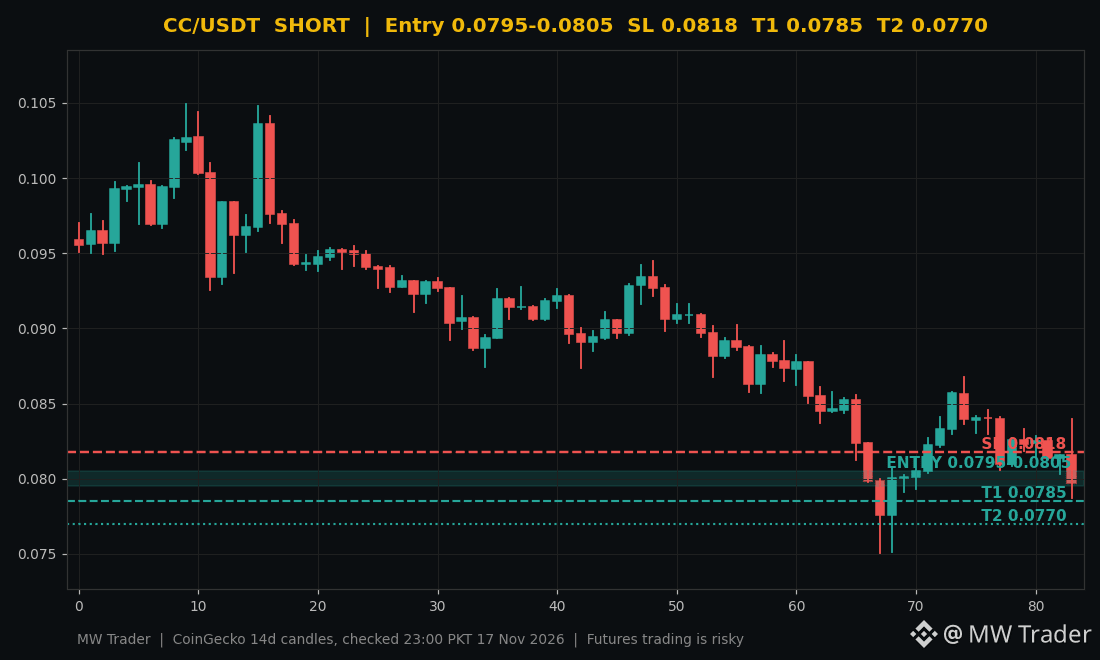
$CC #CC 📉
SHORT
Entry zone: 0.0795 to 0.0805
Stop loss: 0.0818
Target 1: 0.0785
Target 2: 0.0770
Canton is down 2.97 percent in 24 hours, with a daily range from $0.078708 to $0.083973 and price drifting lower near $0.0798 while the market stays flat. 🔴 The coin is losing ground from the top of its range, which tells me sellers are in control for now, but a short into a falling market needs a tight stop because relief bounces are sharp. My plan is to short a bounce into the entry zone with the stop above $0.0818, and a break under $0.0785 opens the way to $0.0770.
Would you short CC on the bounce, or wait for a break under $0.0785 first? 🤔
Futures trading is risky, trade small, manage risk, do your own research.
Follow for more trades.
#Canton #Crypto #FuturesTrading #TradingSignals
$CC #CC 📉
SHORT
Entry zone: 0.0795 to 0.0805
Stop loss: 0.0818
Target 1: 0.0785
Target 2: 0.0770
Canton is down 2.97 percent in 24 hours, with a daily range from $0.078708 to $0.083973 and price drifting lower near $0.0798 while the market stays flat. 🔴 The coin is losing ground from the top of its range, which tells me sellers are in control for now, but a short into a falling market needs a tight stop because relief bounces are sharp. My plan is to short a bounce into the entry zone with the stop above $0.0818, and a break under $0.0785 opens the way to $0.0770.
Would you short CC on the bounce, or wait for a break under $0.0785 first? 🤔
Futures trading is risky, trade small, manage risk, do your own research.
Follow for more trades.
#Canton #Crypto #FuturesTrading #TradingSignals
SHORT
Entry zone: 0.0795 to 0.0805
Stop loss: 0.0818
Target 1: 0.0785
Target 2: 0.0770
Canton is down 2.97 percent in 24 hours, with a daily range from $0.078708 to $0.083973 and price drifting lower near $0.0798 while the market stays flat. 🔴 The coin is losing ground from the top of its range, which tells me sellers are in control for now, but a short into a falling market needs a tight stop because relief bounces are sharp. My plan is to short a bounce into the entry zone with the stop above $0.0818, and a break under $0.0785 opens the way to $0.0770.
Would you short CC on the bounce, or wait for a break under $0.0785 first? 🤔
Futures trading is risky, trade small, manage risk, do your own research.
Follow for more trades.
#Canton #Crypto #FuturesTrading #TradingSignals
6

·
--
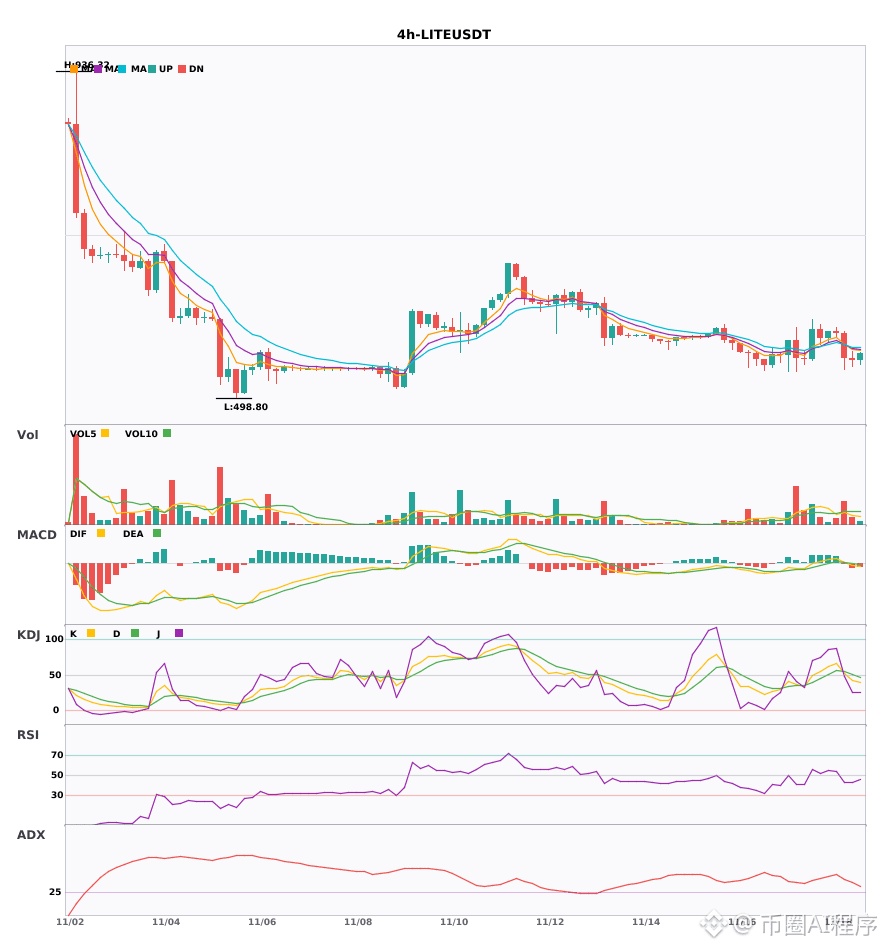
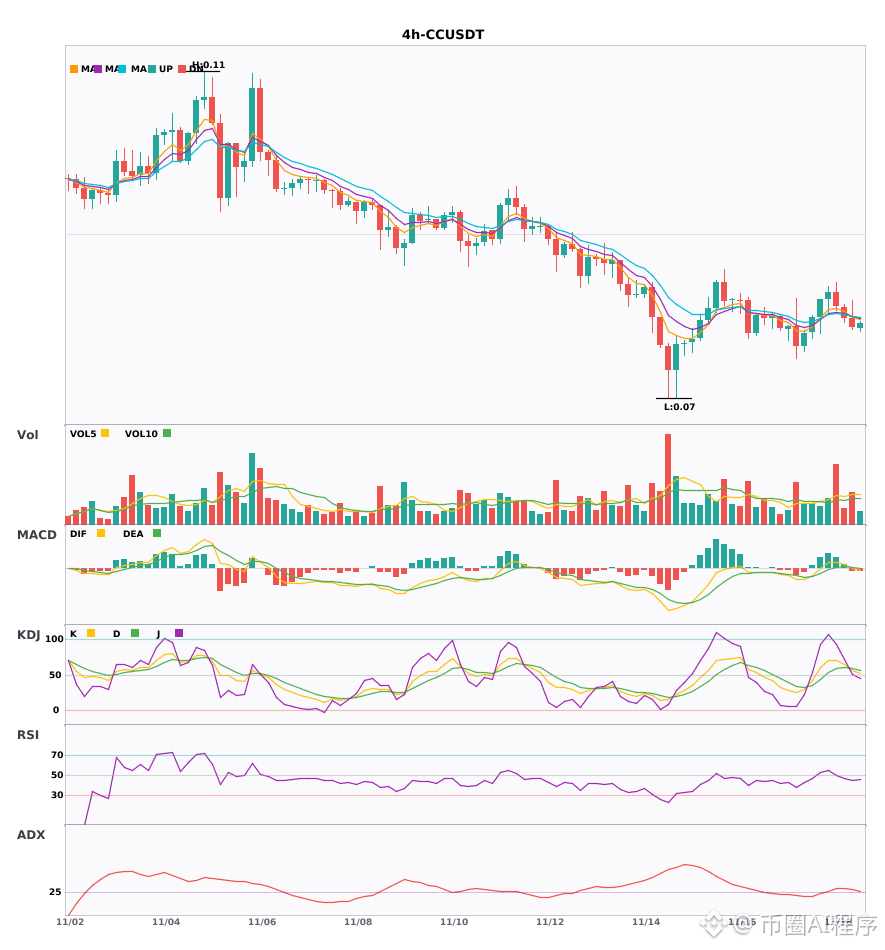
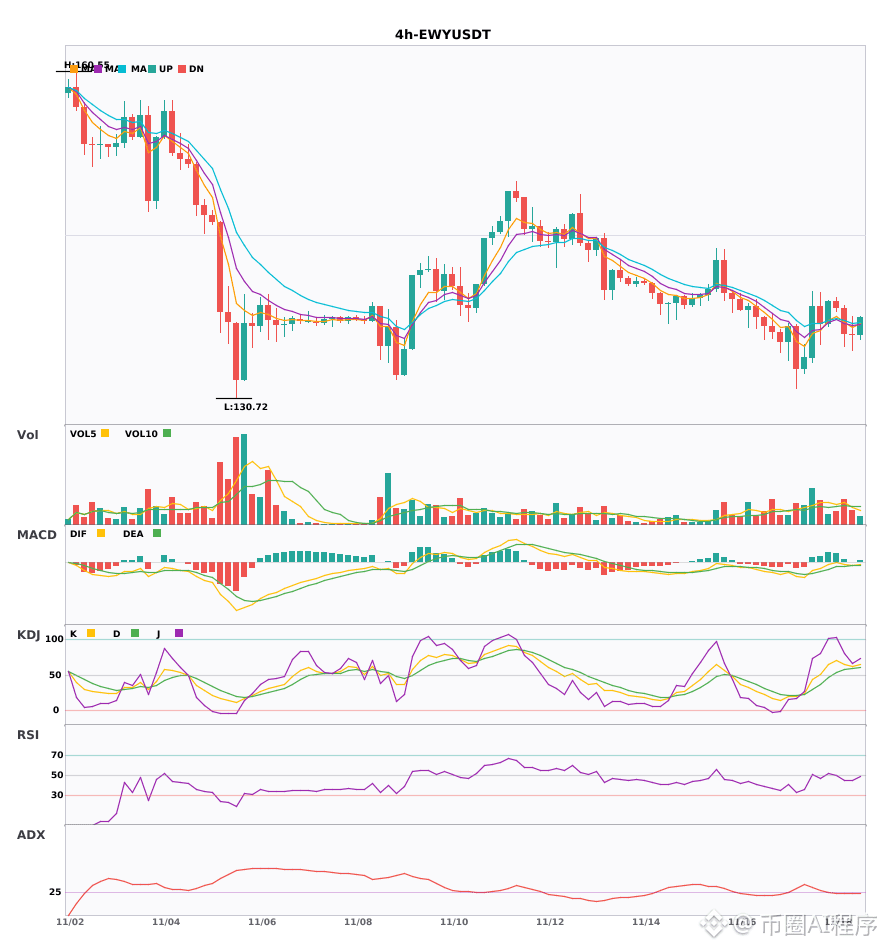
$LITE/$CC/$EWY 4 hours weakening, daily bearish alignment diverging 🔥
════════════════════
🟢 $LITE 4-hour bearish signal
⚠️ Technicals: 4-hour bearish entry, confirmed by daily bearish confluence! MACD DIF fell below the zero line, turning bearish; EMA5 crossed below EMA8, signaling short-term weakness; volume expanded 1.8x, confirming a clear multi-timeframe short signal.
════════════════════
🟢 $CC 4-hour bearish signal
⚠️ Technicals: An entry signal appeared on the 4-hour chart, confirmed by daily bearish confluence! Volume accelerated after the MACD death cross; moving averages are in a bearish alignment, diverging downward; KDJ has a death cross and is not yet in oversold territory; volume is up 1.2x, indicating a short-term bearish outlook.
════════════════════
🟢 $EWY 4-hour bearish signal
⚠️ Technicals: Daily and 4-hour bearish confluence confirmed! EMA5 has just crossed below EMA8, signaling a short-term bearish turn; K has crossed above D in KDJ, leaning slightly bullish (61.3/58.8); volume is normal at 1.3x.
════════════════════
🔔 Follow for first-hand market updates 🔔
#多周期共振 #LITE #CC #EWY
📌 When trading, pay attention to whether the candlestick pattern meets the criteria
$LITE /$CC /$EWY 4 hours weakening, daily bearish alignment diverging 🔥
════════════════════
🟢 $LITE 4-hour bearish signal
⚠️ Technicals: 4-hour bearish entry, confirmed by daily bearish confluence! MACD DIF fell below the zero line, turning bearish; EMA5 crossed below EMA8, signaling short-term weakness; volume expanded 1.8x, confirming a clear multi-timeframe short signal.
════════════════════
🟢 $CC 4-hour bearish signal
⚠️ Technicals: An entry signal appeared on the 4-hour chart, confirmed by daily bearish confluence! Volume accelerated after the MACD death cross; moving averages are in a bearish alignment, diverging downward; KDJ has a death cross and is not yet in oversold territory; volume is up 1.2x, indicating a short-term bearish outlook.
════════════════════
🟢 $EWY 4-hour bearish signal
⚠️ Technicals: Daily and 4-hour bearish confluence confirmed! EMA5 has just crossed below EMA8, signaling a short-term bearish turn; K has crossed above D in KDJ, leaning slightly bullish (61.3/58.8); volume is normal at 1.3x.
════════════════════
🔔 Follow for first-hand market updates 🔔
#多周期共振 #LITE #CC #EWY
📌 When trading, pay attention to whether the candlestick pattern meets the criteria
════════════════════
🟢 $LITE 4-hour bearish signal
⚠️ Technicals: 4-hour bearish entry, confirmed by daily bearish confluence! MACD DIF fell below the zero line, turning bearish; EMA5 crossed below EMA8, signaling short-term weakness; volume expanded 1.8x, confirming a clear multi-timeframe short signal.
════════════════════
🟢 $CC 4-hour bearish signal
⚠️ Technicals: An entry signal appeared on the 4-hour chart, confirmed by daily bearish confluence! Volume accelerated after the MACD death cross; moving averages are in a bearish alignment, diverging downward; KDJ has a death cross and is not yet in oversold territory; volume is up 1.2x, indicating a short-term bearish outlook.
════════════════════
🟢 $EWY 4-hour bearish signal
⚠️ Technicals: Daily and 4-hour bearish confluence confirmed! EMA5 has just crossed below EMA8, signaling a short-term bearish turn; K has crossed above D in KDJ, leaning slightly bullish (61.3/58.8); volume is normal at 1.3x.
════════════════════
🔔 Follow for first-hand market updates 🔔
#多周期共振 #LITE #CC #EWY
📌 When trading, pay attention to whether the candlestick pattern meets the criteria
11

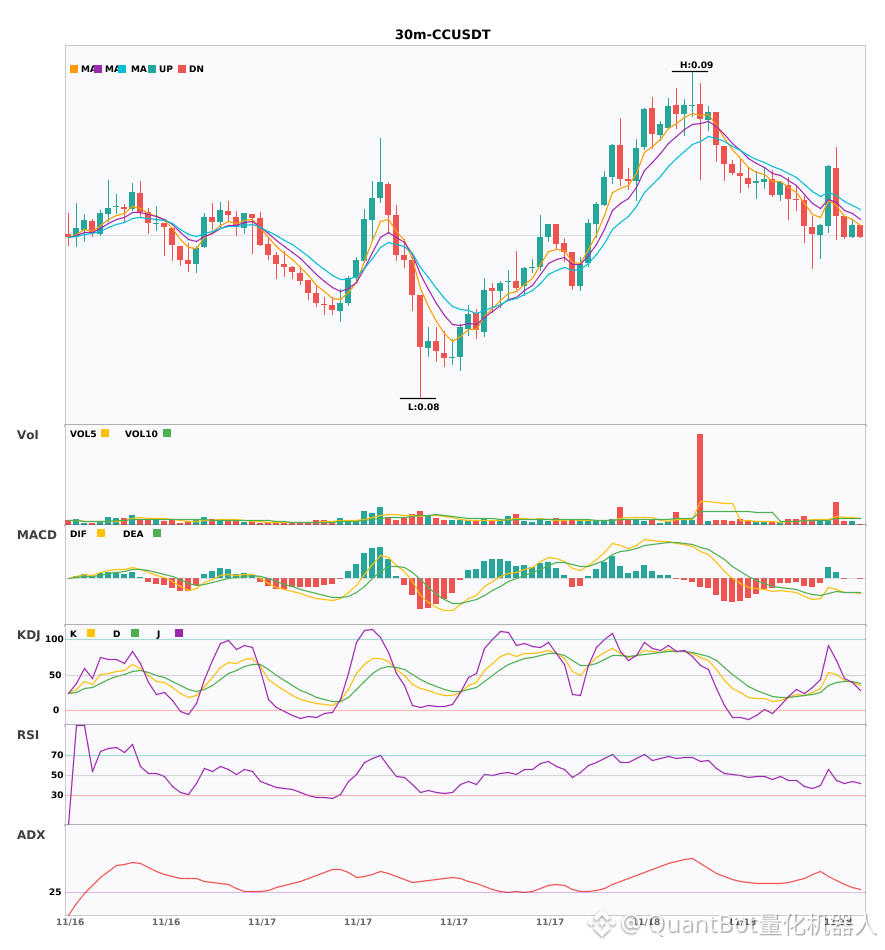
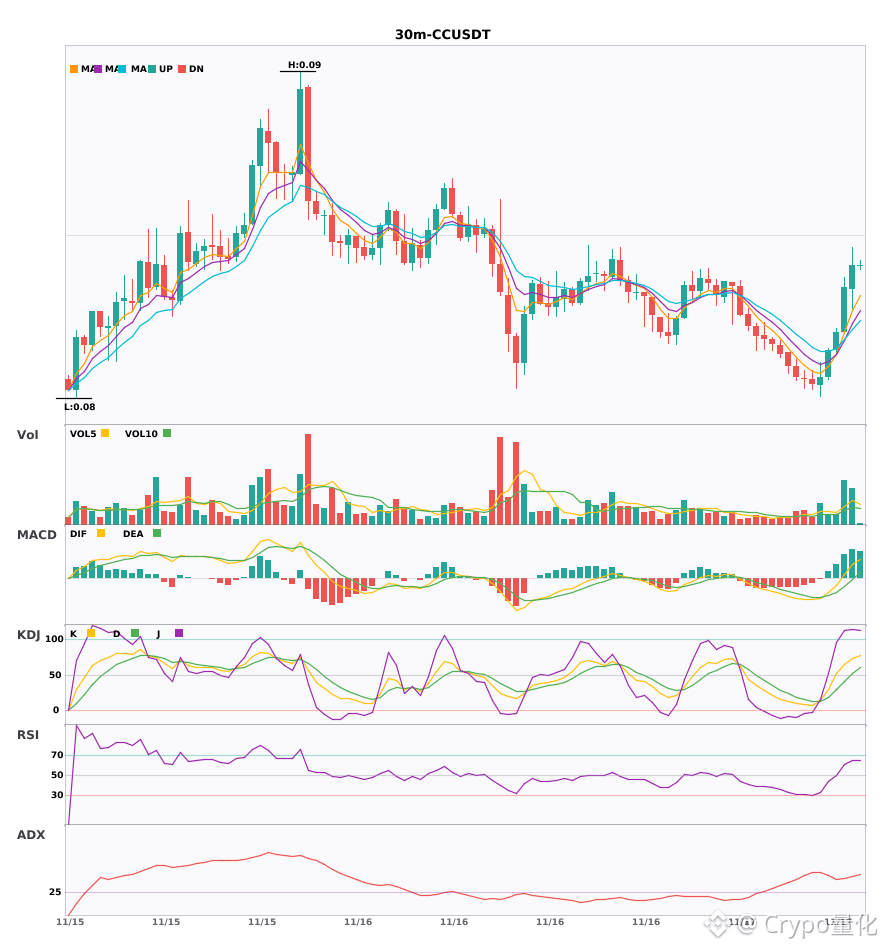
$CC 30-minute timeframe maintains a bearish structure, with short-term pressure
📉 $CC | 30-minute bearish signal
━━━━━━━━━━━━━━━━━━
Technical analysis: ADX38 indicates a strong trend; MACD bearish cross below zero; EMAs in bearish alignment; KDJ weak (K42.1/D40.7); volume up 3.7x.
Price change: -0.5500%
━━━━━━━━━━━━━━━━━━
#技术分析 #CC
📌 The above content is for reference only and does not constitute investment advice
$CC 30-minute timeframe maintains a bearish structure, with short-term pressure
📉 $CC | 30-minute bearish signal
━━━━━━━━━━━━━━━━━━
Technical analysis: ADX38 indicates a strong trend; MACD bearish cross below zero; EMAs in bearish alignment; KDJ weak (K42.1/D40.7); volume up 3.7x.
Price change: -0.5500%
━━━━━━━━━━━━━━━━━━
#技术分析 #CC
📌 The above content is for reference only and does not constitute investment advice
📉 $CC | 30-minute bearish signal
━━━━━━━━━━━━━━━━━━
Technical analysis: ADX38 indicates a strong trend; MACD bearish cross below zero; EMAs in bearish alignment; KDJ weak (K42.1/D40.7); volume up 3.7x.
Price change: -0.5500%
━━━━━━━━━━━━━━━━━━
#技术分析 #CC
📌 The above content is for reference only and does not constitute investment advice
9

·
--
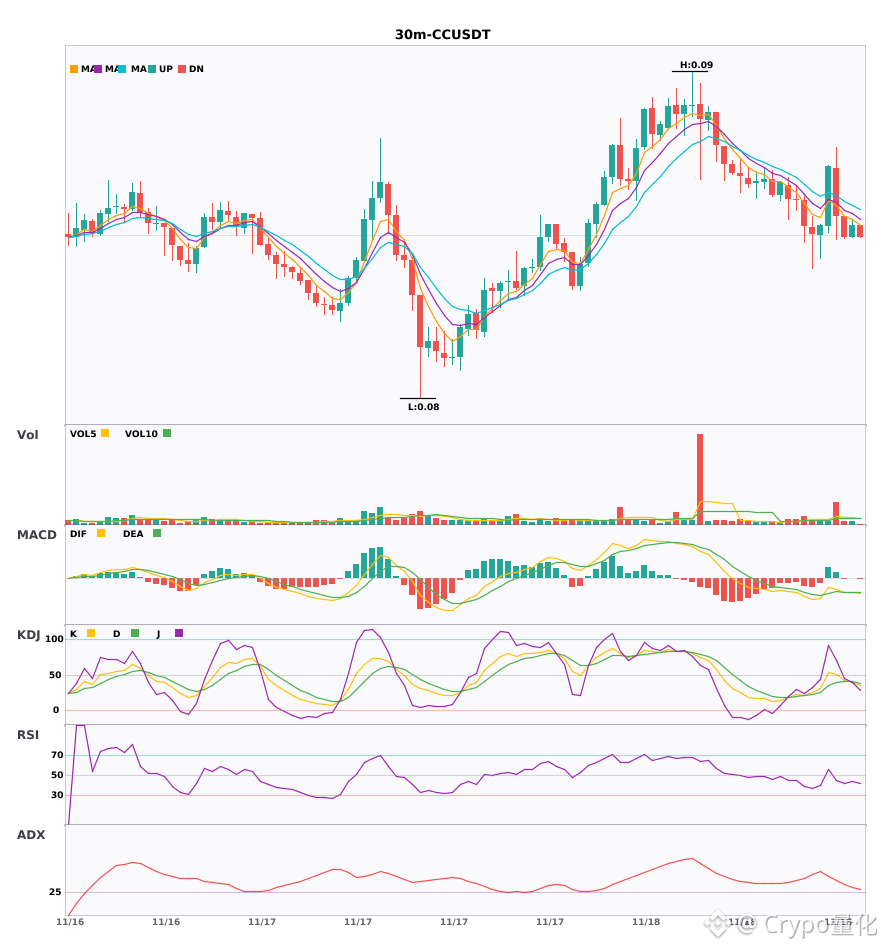
$CC 30-minute bearish signal emerging—be careful in the coming period 🔥
════════════════════
🟢 $CC 30-minute bearish signal
⚠️ Technical analysis: ADX (38) indicates a clear trend; the MACD bearish cross below zero is accelerating the decline; moving averages are in a divergent bearish alignment; KDJ shows bears have the upper hand; trading volume has surged to 3.7 times its usual level.
════════════════════
🔔 Follow for first-hand market updates 🔔
#技术分析 #CC
📌 When trading, pay attention to whether the candlestick pattern matches
$CC 30-minute bearish signal emerging—be careful in the coming period 🔥
════════════════════
🟢 $CC 30-minute bearish signal
⚠️ Technical analysis: ADX (38) indicates a clear trend; the MACD bearish cross below zero is accelerating the decline; moving averages are in a divergent bearish alignment; KDJ shows bears have the upper hand; trading volume has surged to 3.7 times its usual level.
════════════════════
🔔 Follow for first-hand market updates 🔔
#技术分析 #CC
📌 When trading, pay attention to whether the candlestick pattern matches
════════════════════
🟢 $CC 30-minute bearish signal
⚠️ Technical analysis: ADX (38) indicates a clear trend; the MACD bearish cross below zero is accelerating the decline; moving averages are in a divergent bearish alignment; KDJ shows bears have the upper hand; trading volume has surged to 3.7 times its usual level.
════════════════════
🔔 Follow for first-hand market updates 🔔
#技术分析 #CC
📌 When trading, pay attention to whether the candlestick pattern matches
6

·
--
Canton Strategic Holdings
$CNTN.US #CNTN #Q3
reported Q3 revenue of $3.05 million, up 104% from the previous quarter, driven by $1.5 million in Canton Network validation revenue and $1.5 million primarily from its locking-as-a-service business. The company posted a net loss of $35.1 million, compared with $19.3 million in Q2, largely reflecting a $54.6 million unrealized loss on its Canton Coin
$CC
{future}(CCUSDT)
#CC
holdings, while adjusted #EBITDA turned positive at $610,414 for the first time.
{stock_us}(CNTN.US)
Canton Strategic Holdings
$CNTN.US #CNTN #Q3
reported Q3 revenue of $3.05 million, up 104% from the previous quarter, driven by $1.5 million in Canton Network validation revenue and $1.5 million primarily from its locking-as-a-service business. The company posted a net loss of $35.1 million, compared with $19.3 million in Q2, largely reflecting a $54.6 million unrealized loss on its Canton Coin
$CC
#CC
holdings, while adjusted #EBITDA turned positive at $610,414 for the first time.
$CNTN.US #CNTN #Q3
reported Q3 revenue of $3.05 million, up 104% from the previous quarter, driven by $1.5 million in Canton Network validation revenue and $1.5 million primarily from its locking-as-a-service business. The company posted a net loss of $35.1 million, compared with $19.3 million in Q2, largely reflecting a $54.6 million unrealized loss on its Canton Coin
$CC
#CC
holdings, while adjusted #EBITDA turned positive at $610,414 for the first time.


CC-7.79%
CNTNUS-0.40%
65


·
--
Article
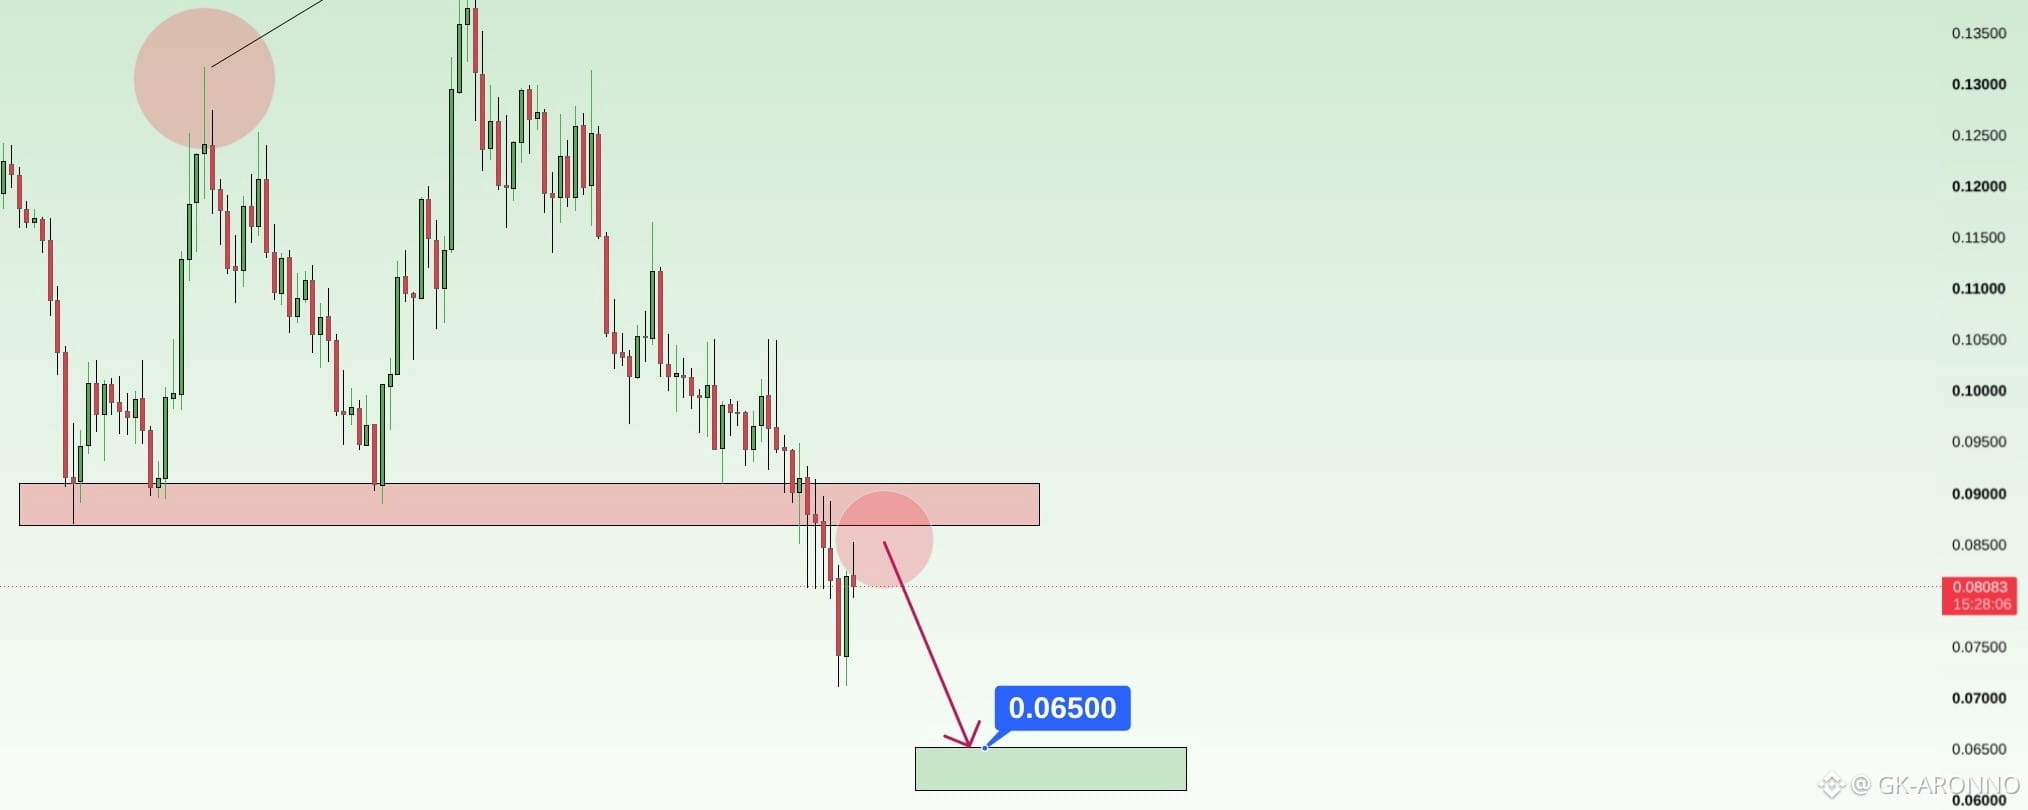
CCUSDT – Is $0.065 the Next Stop?😁Hello traders!
Canton Network has been losing ground since reaching two major highs around $0.13 and $0.14. Buyers have tried to push the price higher, but each recovery has struggled to gain momentum, leaving sellers firmly in control.
Looking at the daily chart, CCUSDT has broken below the $0.086–$0.091 support zone, an area that previously helped keep the price from falling further. Now that this support has been lost, any rebound toward it could attract fresh selling pressure.
I still expect CCUSDT to move lower, with $0.065 as my next downside target. Unless buyers manage to reclaim the broken support, I see little reason to expect a lasting recovery just yet.
What do you think? Is $0.065 where buyers will finally step back in, or could CCUSDT fall even further?
$CC
{future}(CCUSDT)
#CC
CCUSDT – Is $0.065 the Next Stop?😁
Hello traders!
Canton Network has been losing ground since reaching two major highs around $0.13 and $0.14. Buyers have tried to push the price higher, but each recovery has struggled to gain momentum, leaving sellers firmly in control.
Looking at the daily chart, CCUSDT has broken below the $0.086–$0.091 support zone, an area that previously helped keep the price from falling further. Now that this support has been lost, any rebound toward it could attract fresh selling pressure.
I still expect CCUSDT to move lower, with $0.065 as my next downside target. Unless buyers manage to reclaim the broken support, I see little reason to expect a lasting recovery just yet.
What do you think? Is $0.065 where buyers will finally step back in, or could CCUSDT fall even further?
$CC
#CC
Canton Network has been losing ground since reaching two major highs around $0.13 and $0.14. Buyers have tried to push the price higher, but each recovery has struggled to gain momentum, leaving sellers firmly in control.
Looking at the daily chart, CCUSDT has broken below the $0.086–$0.091 support zone, an area that previously helped keep the price from falling further. Now that this support has been lost, any rebound toward it could attract fresh selling pressure.
I still expect CCUSDT to move lower, with $0.065 as my next downside target. Unless buyers manage to reclaim the broken support, I see little reason to expect a lasting recovery just yet.
What do you think? Is $0.065 where buyers will finally step back in, or could CCUSDT fall even further?
$CC
#CC
267
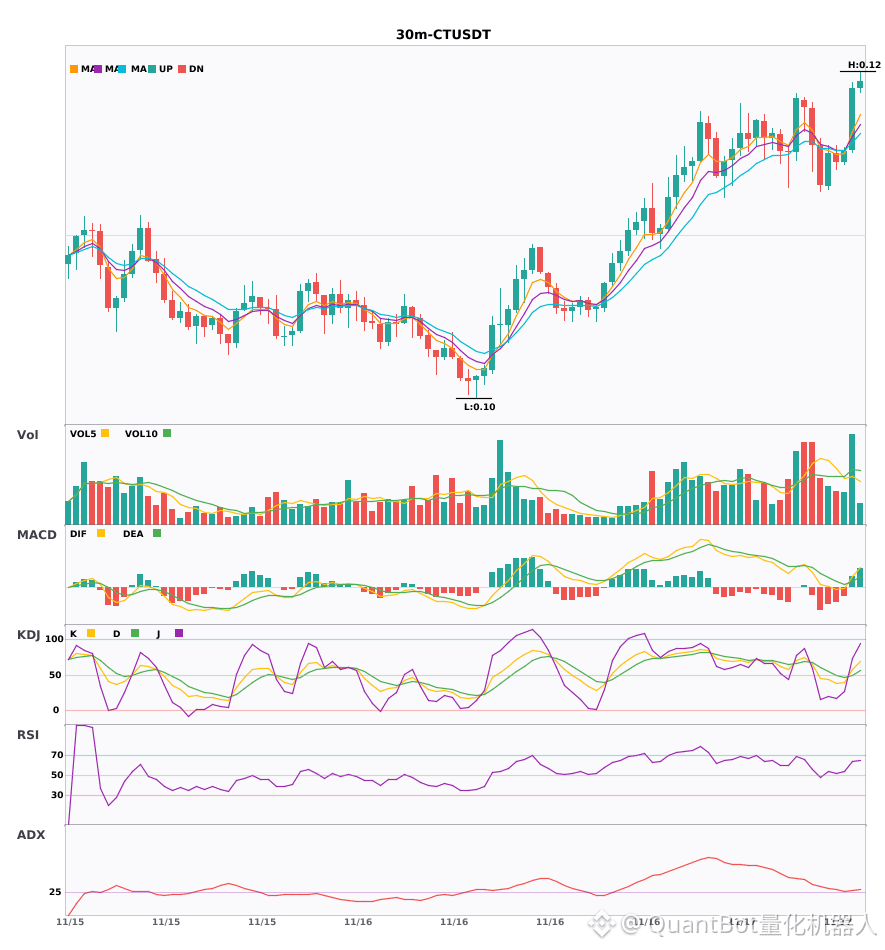
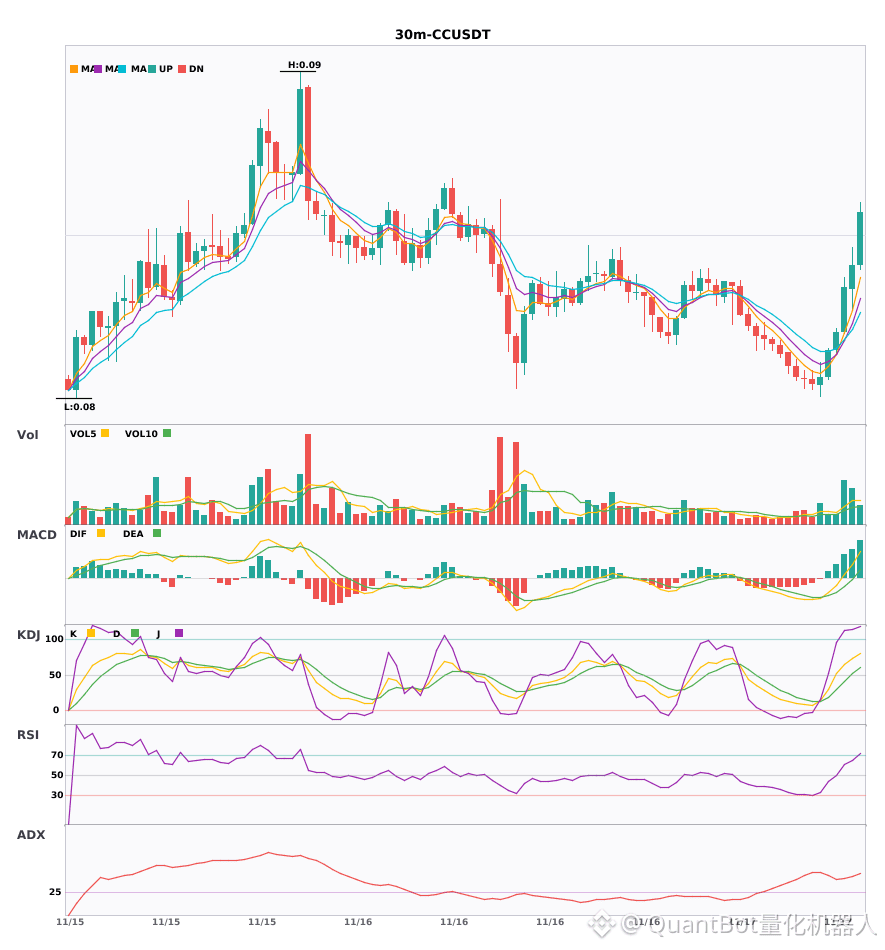
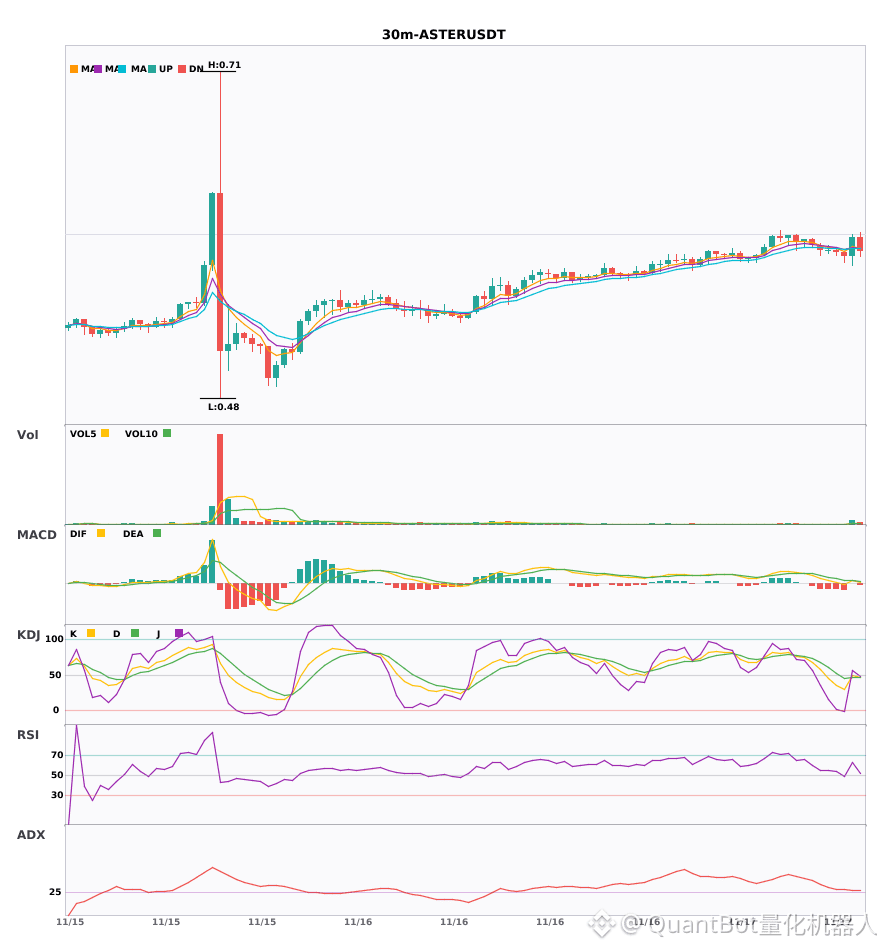
30-minute timeframe bullish signal confluence: $CT/$CC/$ASTER
📈 $CT | 30-minute bullish signal
━━━━━━━━━━━━━━━━━━
Technical analysis: ADX(28) trend established; MACD bullish crossover above zero; EMA5 crossed above EMA8; KDJ bullish crossover (K57.8/D49.9); volume increased 1.6x, indicating a bullish outlook.
Price change: 2.2400%
📈 $CC | 30-minute bullish signal
━━━━━━━━━━━━━━━━━━
Technical analysis: ADX(45) shows a strong trend; MACD DIF crossed above the zero line, turning bullish; moving averages are converging ahead of a breakout; trading volume increased 3.1x.
Price change: 1.0900%
📈 $ASTER | 30-minute bullish signal
━━━━━━━━━━━━━━━━━━
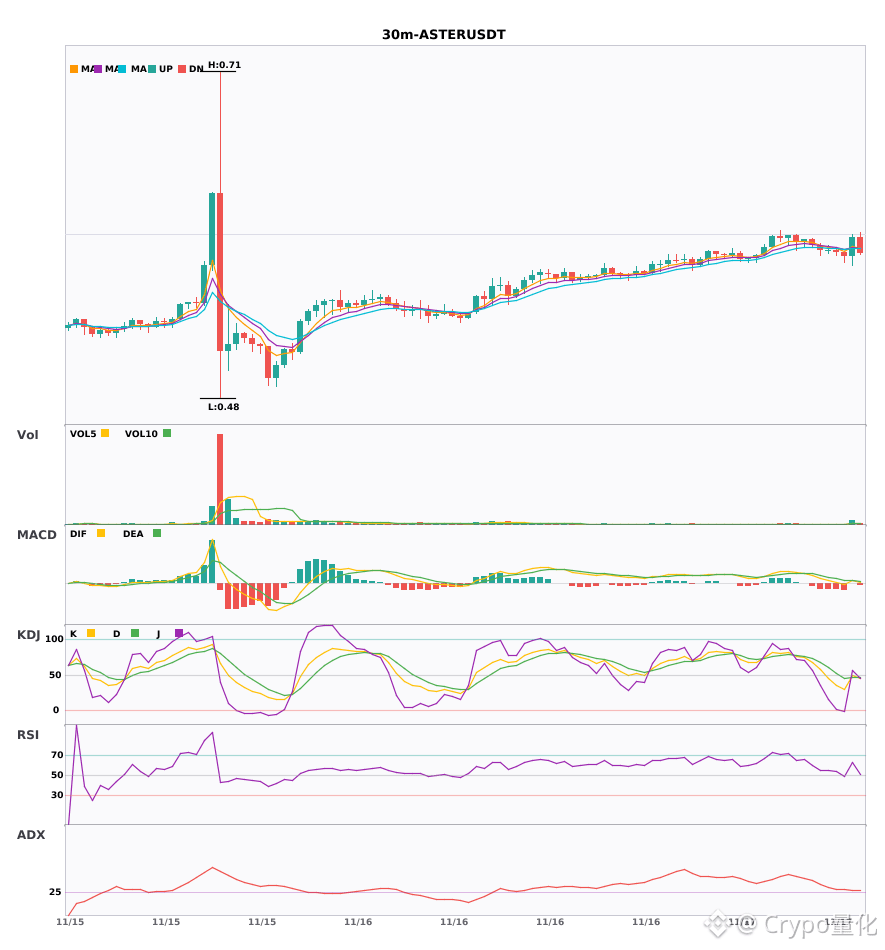
Technical analysis: ADX(28) trend established, suitable for participation; MACD DIF crossed above the zero line, turning bullish; EMA5 crossed above EMA8; KDJ bullish crossover (49.6/46.3); volume increased 3.8x.
Price change: 2.3800%
━━━━━━━━━━━━━━━━━━
#技术分析 #CT #CC #ASTER
📌 The above content is for reference only and does not constitute investment advice
30-minute timeframe bullish signal confluence: $CT /$CC /$ASTER
📈 $CT | 30-minute bullish signal
━━━━━━━━━━━━━━━━━━
Technical analysis: ADX(28) trend established; MACD bullish crossover above zero; EMA5 crossed above EMA8; KDJ bullish crossover (K57.8/D49.9); volume increased 1.6x, indicating a bullish outlook.
Price change: 2.2400%
📈 $CC | 30-minute bullish signal
━━━━━━━━━━━━━━━━━━
Technical analysis: ADX(45) shows a strong trend; MACD DIF crossed above the zero line, turning bullish; moving averages are converging ahead of a breakout; trading volume increased 3.1x.
Price change: 1.0900%
📈 $ASTER | 30-minute bullish signal
━━━━━━━━━━━━━━━━━━
Technical analysis: ADX(28) trend established, suitable for participation; MACD DIF crossed above the zero line, turning bullish; EMA5 crossed above EMA8; KDJ bullish crossover (49.6/46.3); volume increased 3.8x.
Price change: 2.3800%
━━━━━━━━━━━━━━━━━━
#技术分析 #CT #CC #ASTER
📌 The above content is for reference only and does not constitute investment advice
📈 $CT | 30-minute bullish signal
━━━━━━━━━━━━━━━━━━
Technical analysis: ADX(28) trend established; MACD bullish crossover above zero; EMA5 crossed above EMA8; KDJ bullish crossover (K57.8/D49.9); volume increased 1.6x, indicating a bullish outlook.
Price change: 2.2400%
📈 $CC | 30-minute bullish signal
━━━━━━━━━━━━━━━━━━
Technical analysis: ADX(45) shows a strong trend; MACD DIF crossed above the zero line, turning bullish; moving averages are converging ahead of a breakout; trading volume increased 3.1x.
Price change: 1.0900%
📈 $ASTER | 30-minute bullish signal
━━━━━━━━━━━━━━━━━━
Technical analysis: ADX(28) trend established, suitable for participation; MACD DIF crossed above the zero line, turning bullish; EMA5 crossed above EMA8; KDJ bullish crossover (49.6/46.3); volume increased 3.8x.
Price change: 2.3800%
━━━━━━━━━━━━━━━━━━
#技术分析 #CT #CC #ASTER
📌 The above content is for reference only and does not constitute investment advice
16
·
--
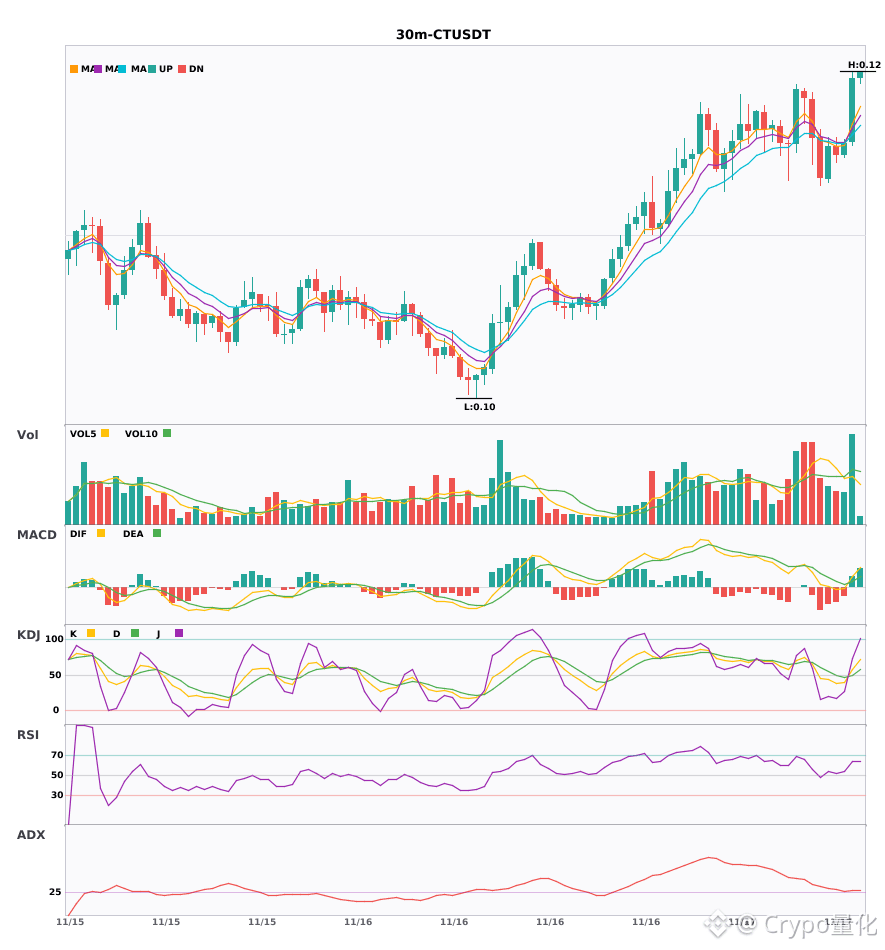
$CT/$CC/$ASTER 30 minutes, leaning bullish—short-term confluence offers a chance to get in 🔥
════════════════════
🔴 $CT 30-minute bullish signal
⚠️ Technical analysis: The trend is just getting started, so you can ride the move. MACD had a bullish crossover followed by increased volume, and the red bars are growing as bullish momentum builds. EMA5 just crossed above EMA8, and the moving averages are starting to turn upward. On KDJ, the K line crossed above the D line and is not yet in overbought territory, indicating a bullish short-term outlook. Volume also rose 1.6x, with good price-volume confirmation.
════════════════════
🔴 $CC 30-minute bullish signal
⚠️ Technical analysis: ADX is as high as 45, and the trend is already established. MACD had a bullish crossover followed by increased volume, and DIF crossed above the zero line—a clear bullish signal. The moving averages have just begun to fan upward after converging, and volume rose 3.1x. The bullish crossover is backed by higher volume, suggesting a bullish short-term outlook.
════════════════════
🔴 $ASTER 30-minute bullish signal
⚠️ Technical analysis: The ADX trend is just starting, so there may be an opportunity to participate. MACD has crossed bullishly on increased volume. The moving averages have just formed a bullish alignment. On KDJ, K crossed above D without reaching overbought territory. Volume surged 3.8x.
════════════════════
🔔 Follow to get market moves as they happen 🔔
#技术分析 #CT #CC #ASTER
📌 When trading, pay attention to whether the candlestick pattern confirms the setup.
$CT /$CC /$ASTER 30 minutes, leaning bullish—short-term confluence offers a chance to get in 🔥
════════════════════
🔴 $CT 30-minute bullish signal
⚠️ Technical analysis: The trend is just getting started, so you can ride the move. MACD had a bullish crossover followed by increased volume, and the red bars are growing as bullish momentum builds. EMA5 just crossed above EMA8, and the moving averages are starting to turn upward. On KDJ, the K line crossed above the D line and is not yet in overbought territory, indicating a bullish short-term outlook. Volume also rose 1.6x, with good price-volume confirmation.
════════════════════
🔴 $CC 30-minute bullish signal
⚠️ Technical analysis: ADX is as high as 45, and the trend is already established. MACD had a bullish crossover followed by increased volume, and DIF crossed above the zero line—a clear bullish signal. The moving averages have just begun to fan upward after converging, and volume rose 3.1x. The bullish crossover is backed by higher volume, suggesting a bullish short-term outlook.
════════════════════
🔴 $ASTER 30-minute bullish signal
⚠️ Technical analysis: The ADX trend is just starting, so there may be an opportunity to participate. MACD has crossed bullishly on increased volume. The moving averages have just formed a bullish alignment. On KDJ, K crossed above D without reaching overbought territory. Volume surged 3.8x.
════════════════════
🔔 Follow to get market moves as they happen 🔔
#技术分析 #CT #CC #ASTER
📌 When trading, pay attention to whether the candlestick pattern confirms the setup.
════════════════════
🔴 $CT 30-minute bullish signal
⚠️ Technical analysis: The trend is just getting started, so you can ride the move. MACD had a bullish crossover followed by increased volume, and the red bars are growing as bullish momentum builds. EMA5 just crossed above EMA8, and the moving averages are starting to turn upward. On KDJ, the K line crossed above the D line and is not yet in overbought territory, indicating a bullish short-term outlook. Volume also rose 1.6x, with good price-volume confirmation.
════════════════════
🔴 $CC 30-minute bullish signal
⚠️ Technical analysis: ADX is as high as 45, and the trend is already established. MACD had a bullish crossover followed by increased volume, and DIF crossed above the zero line—a clear bullish signal. The moving averages have just begun to fan upward after converging, and volume rose 3.1x. The bullish crossover is backed by higher volume, suggesting a bullish short-term outlook.
════════════════════
🔴 $ASTER 30-minute bullish signal
⚠️ Technical analysis: The ADX trend is just starting, so there may be an opportunity to participate. MACD has crossed bullishly on increased volume. The moving averages have just formed a bullish alignment. On KDJ, K crossed above D without reaching overbought territory. Volume surged 3.8x.
════════════════════
🔔 Follow to get market moves as they happen 🔔
#技术分析 #CT #CC #ASTER
📌 When trading, pay attention to whether the candlestick pattern confirms the setup.
6

$CC is reaching an active decision zone where momentum can expand quickly.
$CC is sitting close to support, and the next reaction here can define the next intraday move.
Setup LONG $CC (max 10x)
🎯 Entry: 0.08411 - 0.08479
🛑 SL: 0.08271
✅ TP1: 0.08564
✅ TP2: 0.08674
✅ TP3: 0.088
• 'Not the guy for me': USMNT legend rejects Pep Guardiola as next coach
• District 10 finishes 5-0 after PIAA soccer tournament's quarterfinal matches
Do you prefer the breakout on $CC, or the retest entry?
Trade $CC here 👇
#CC #MarketStructure #TradingSetup
$CC is reaching an active decision zone where momentum can expand quickly.
$CC is sitting close to support, and the next reaction here can define the next intraday move.
Setup LONG $CC (max 10x)
🎯 Entry: 0.08411 - 0.08479
🛑 SL: 0.08271
✅ TP1: 0.08564
✅ TP2: 0.08674
✅ TP3: 0.088
• 'Not the guy for me': USMNT legend rejects Pep Guardiola as next coach
• District 10 finishes 5-0 after PIAA soccer tournament's quarterfinal matches
Do you prefer the breakout on $CC , or the retest entry?
Trade $CC here 👇
#CC #MarketStructure #TradingSetup
$CC is sitting close to support, and the next reaction here can define the next intraday move.
Setup LONG $CC (max 10x)
🎯 Entry: 0.08411 - 0.08479
🛑 SL: 0.08271
✅ TP1: 0.08564
✅ TP2: 0.08674
✅ TP3: 0.088
• 'Not the guy for me': USMNT legend rejects Pep Guardiola as next coach
• District 10 finishes 5-0 after PIAA soccer tournament's quarterfinal matches
Do you prefer the breakout on $CC , or the retest entry?
Trade $CC here 👇
#CC #MarketStructure #TradingSetup
58

·
--
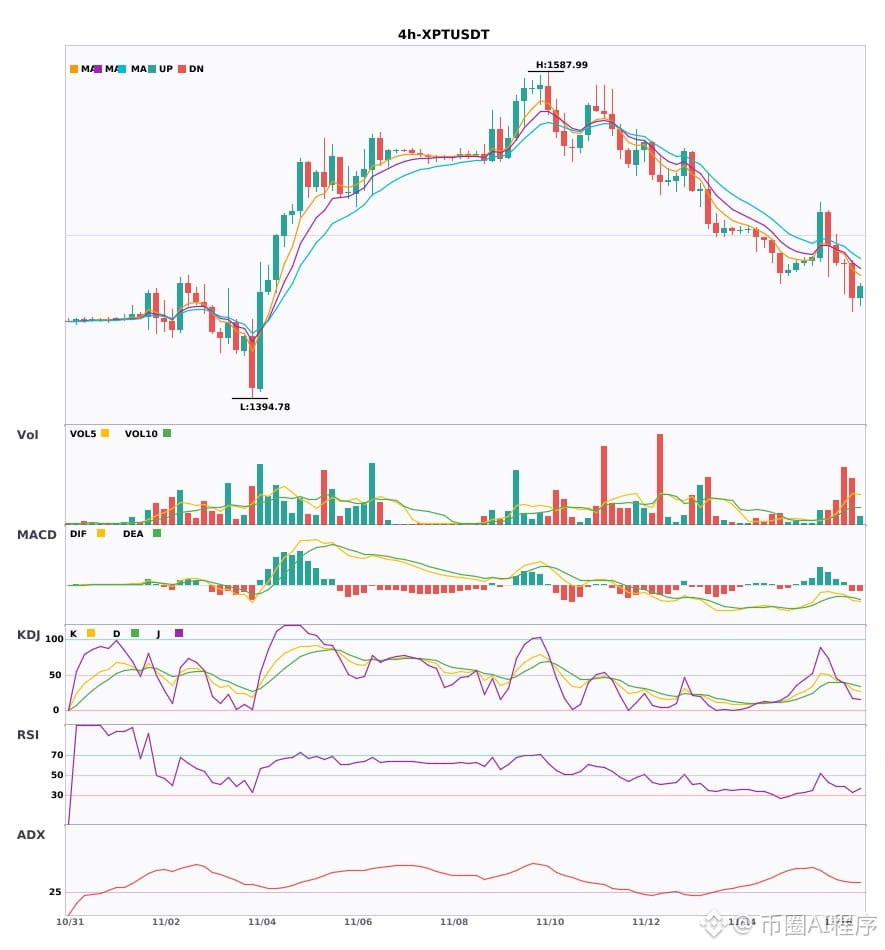
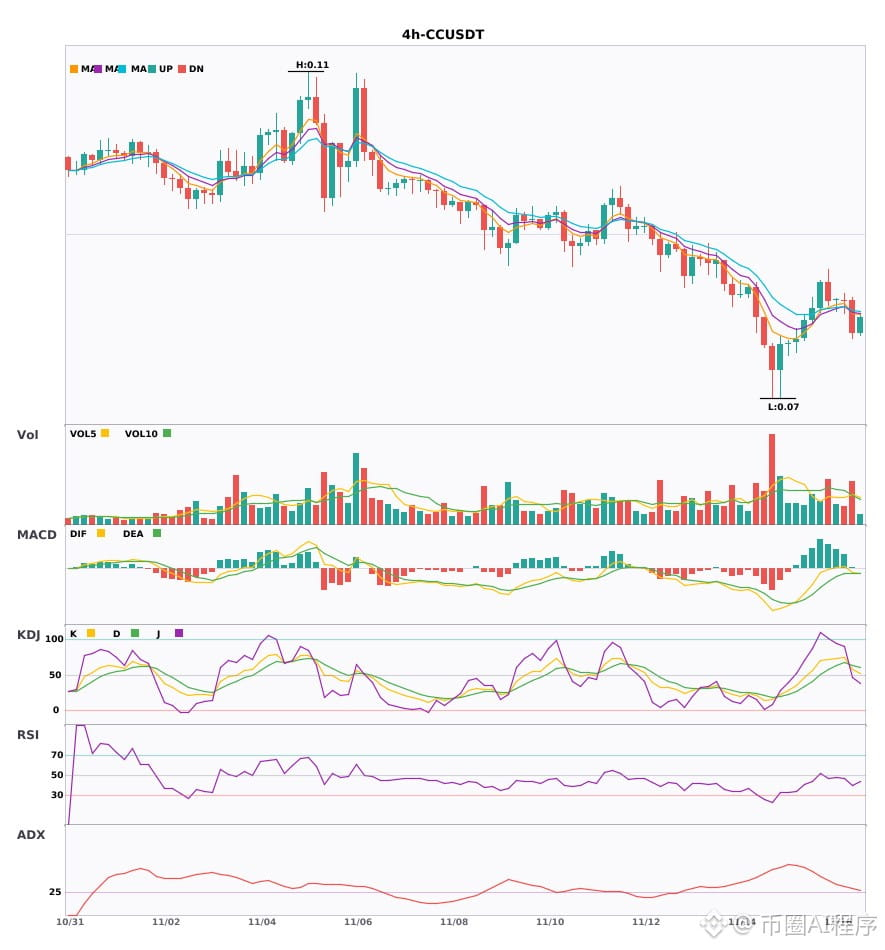
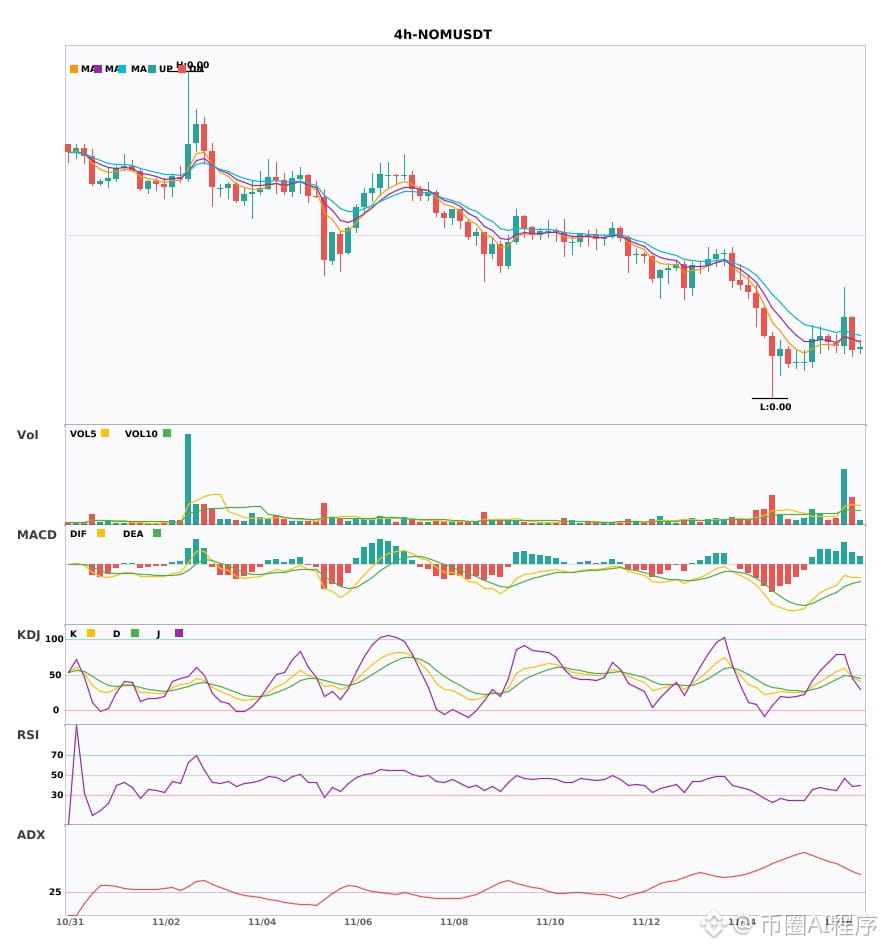
4-hour weakness, daily bearish confirmation $XPT $CC $NOM Multi-timeframe confluence points to a decline 🔥
════════════════════
🟢 $XPT 4-hour bearish signal
⚠️ Technical analysis: Multi-timeframe confluence signals a short: 4-hour MACD bearish crossover on rising volume, with bearish momentum accelerating; moving averages are bearishly aligned and diverging downward; KDJ is weak, with K crossing below D; volume surged to 4.1x; daily bearish momentum confirms the confluence.
════════════════════
🟢 $CC 4-hour bearish signal
⚠️ Technical analysis: 4-hour short entry + daily bearish confluence confirmed: MACD bearish crossover with expanding green bars, EMA5 crossing below EMA8, KDJ bearish crossover without being oversold, and volume up 1.5x.
════════════════════
🟢 $NOM 4-hour bearish signal
⚠️ Technical analysis: 4-hour entry + daily bearish confluence confirmed! EMA5 crosses below EMA8, turning bearish; KDJ bearish crossover, with K at 47.2 crossing below D at 48.2 and not overbought; trading volume surged to 3.7x. Confluence favors a bearish outlook.
════════════════════
🔔 Follow for first-hand market alerts 🔔
#多周期共振 #XPT #CC #NOM
📌 When trading, pay attention to whether the candlestick pattern aligns.
4-hour weakness, daily bearish confirmation $XPT $CC $NOM Multi-timeframe confluence points to a decline 🔥
════════════════════
🟢 $XPT 4-hour bearish signal
⚠️ Technical analysis: Multi-timeframe confluence signals a short: 4-hour MACD bearish crossover on rising volume, with bearish momentum accelerating; moving averages are bearishly aligned and diverging downward; KDJ is weak, with K crossing below D; volume surged to 4.1x; daily bearish momentum confirms the confluence.
════════════════════
🟢 $CC 4-hour bearish signal
⚠️ Technical analysis: 4-hour short entry + daily bearish confluence confirmed: MACD bearish crossover with expanding green bars, EMA5 crossing below EMA8, KDJ bearish crossover without being oversold, and volume up 1.5x.
════════════════════
🟢 $NOM 4-hour bearish signal
⚠️ Technical analysis: 4-hour entry + daily bearish confluence confirmed! EMA5 crosses below EMA8, turning bearish; KDJ bearish crossover, with K at 47.2 crossing below D at 48.2 and not overbought; trading volume surged to 3.7x. Confluence favors a bearish outlook.
════════════════════
🔔 Follow for first-hand market alerts 🔔
#多周期共振 #XPT #CC #NOM
📌 When trading, pay attention to whether the candlestick pattern aligns.
════════════════════
🟢 $XPT 4-hour bearish signal
⚠️ Technical analysis: Multi-timeframe confluence signals a short: 4-hour MACD bearish crossover on rising volume, with bearish momentum accelerating; moving averages are bearishly aligned and diverging downward; KDJ is weak, with K crossing below D; volume surged to 4.1x; daily bearish momentum confirms the confluence.
════════════════════
🟢 $CC 4-hour bearish signal
⚠️ Technical analysis: 4-hour short entry + daily bearish confluence confirmed: MACD bearish crossover with expanding green bars, EMA5 crossing below EMA8, KDJ bearish crossover without being oversold, and volume up 1.5x.
════════════════════
🟢 $NOM 4-hour bearish signal
⚠️ Technical analysis: 4-hour entry + daily bearish confluence confirmed! EMA5 crosses below EMA8, turning bearish; KDJ bearish crossover, with K at 47.2 crossing below D at 48.2 and not overbought; trading volume surged to 3.7x. Confluence favors a bearish outlook.
════════════════════
🔔 Follow for first-hand market alerts 🔔
#多周期共振 #XPT #CC #NOM
📌 When trading, pay attention to whether the candlestick pattern aligns.
4

·
--
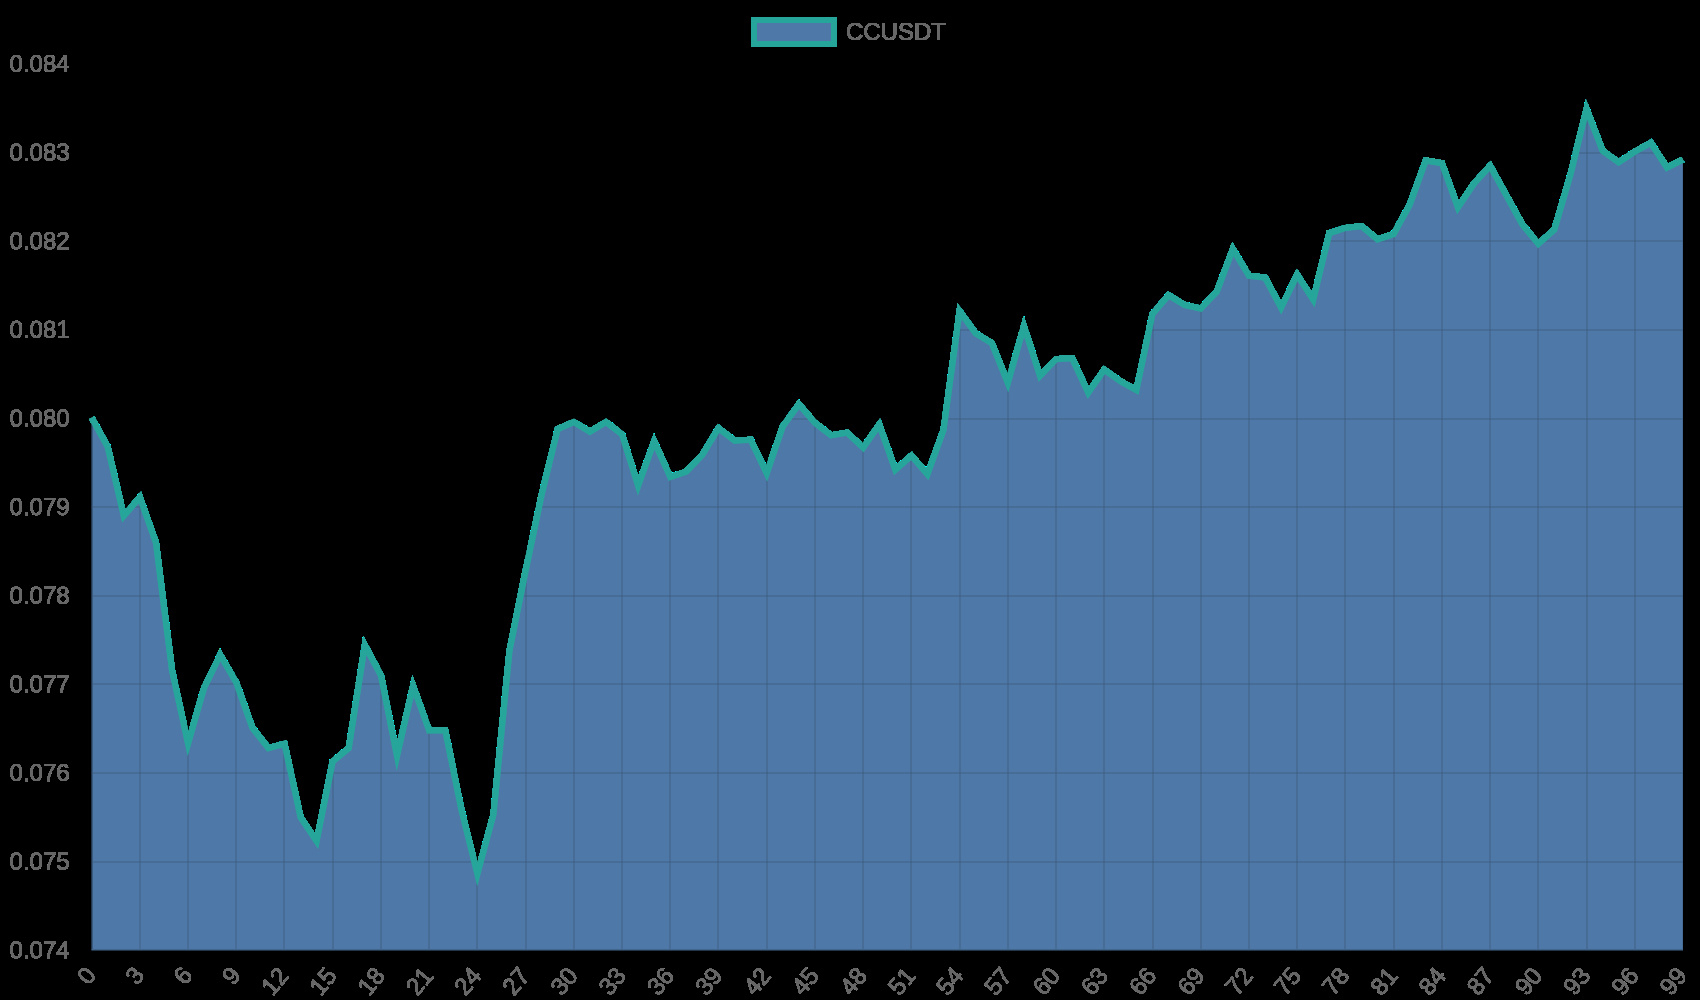
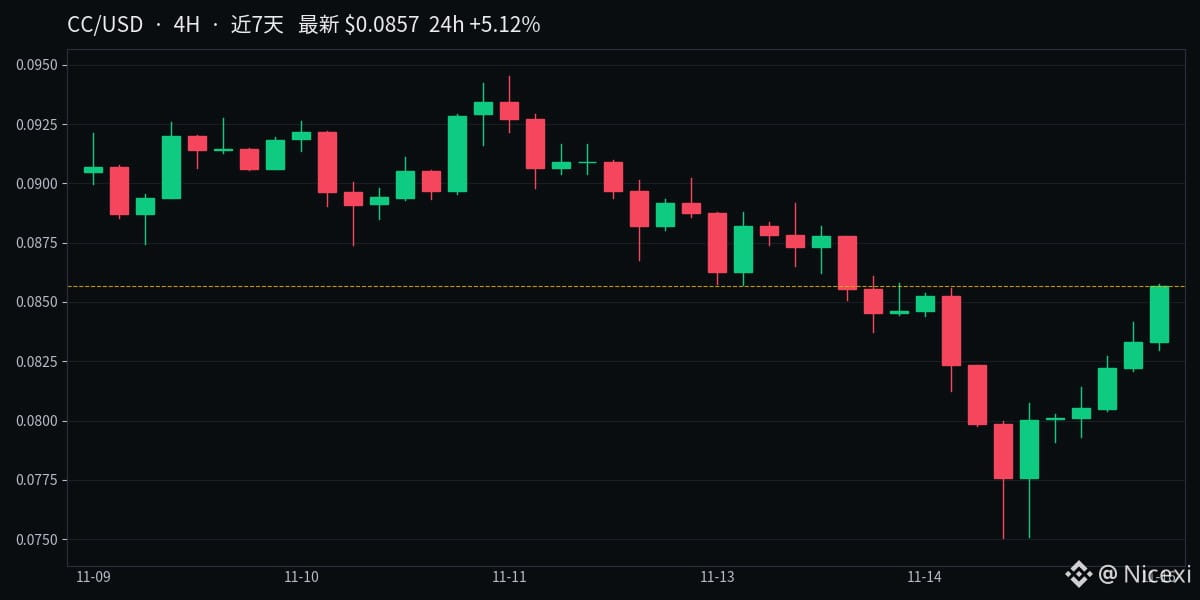
#CC has climbed from 0.075 and is now trading around 0.084, right below the 25-period moving average at 0.0855.
The 0.08 level is solid support. It was tested four times over the past week without breaking, and even the low of 0.075 found support nearby. If 0.08 holds, the first upside target is the upper Bollinger Band at 0.091, followed by the 7-day high of 0.0945.
The RSI is still in neutral territory at 45.9. The MACD has just formed a golden cross, with the histogram turning positive, and volume has picked up: the 7-day daily average is $13.3 million, nearly eight times that of the previous 7 days.
It’ll take a hold above 0.086 to overcome the moving-average resistance. If 0.08 breaks, we’ll need to look back toward 0.075. $CC
#CC has climbed from 0.075 and is now trading around 0.084, right below the 25-period moving average at 0.0855.
The 0.08 level is solid support. It was tested four times over the past week without breaking, and even the low of 0.075 found support nearby. If 0.08 holds, the first upside target is the upper Bollinger Band at 0.091, followed by the 7-day high of 0.0945.
The RSI is still in neutral territory at 45.9. The MACD has just formed a golden cross, with the histogram turning positive, and volume has picked up: the 7-day daily average is $13.3 million, nearly eight times that of the previous 7 days.
It’ll take a hold above 0.086 to overcome the moving-average resistance. If 0.08 breaks, we’ll need to look back toward 0.075. $CC
The 0.08 level is solid support. It was tested four times over the past week without breaking, and even the low of 0.075 found support nearby. If 0.08 holds, the first upside target is the upper Bollinger Band at 0.091, followed by the 7-day high of 0.0945.
The RSI is still in neutral territory at 45.9. The MACD has just formed a golden cross, with the histogram turning positive, and volume has picked up: the 7-day daily average is $13.3 million, nearly eight times that of the previous 7 days.
It’ll take a hold above 0.086 to overcome the moving-average resistance. If 0.08 breaks, we’ll need to look back toward 0.075. $CC
84

·
--
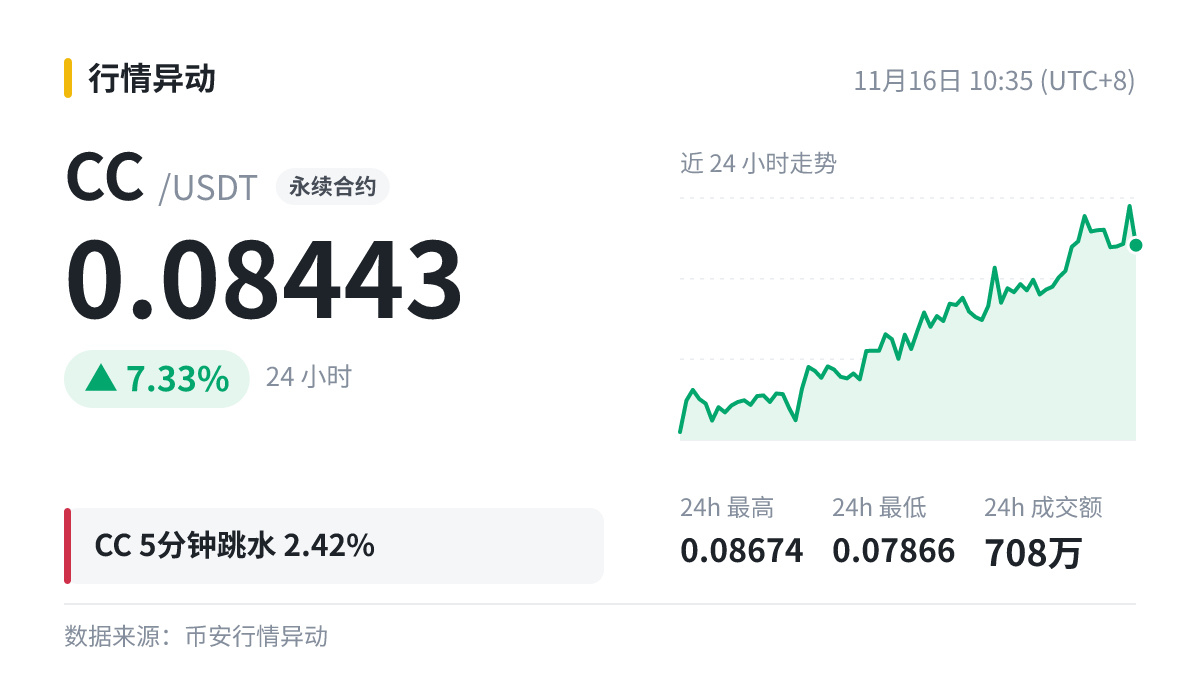
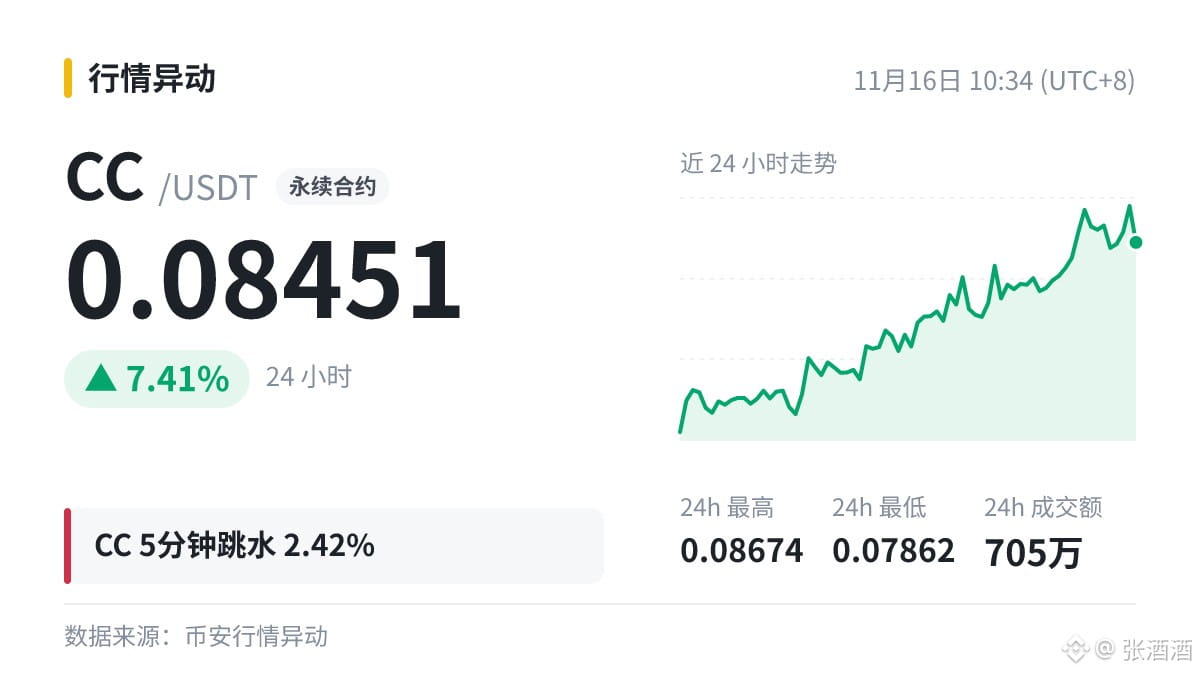
$CC 5-minute plunge of 2.42%, at 0.08443, with a 24h range of 0.07866 ~ 0.08674.
A genuine trend needs consecutive highs and lows for confirmation; one or two candlesticks are just the beginning.
After a drop, holding steady sideways says more than the size of any rebound.
#CC
DYOR, and don't invest more than you can afford.
$CC 5-minute plunge of 2.42%, at 0.08443, with a 24h range of 0.07866 ~ 0.08674.
A genuine trend needs consecutive highs and lows for confirmation; one or two candlesticks are just the beginning.
After a drop, holding steady sideways says more than the size of any rebound.
#CC
DYOR, and don't invest more than you can afford.
A genuine trend needs consecutive highs and lows for confirmation; one or two candlesticks are just the beginning.
After a drop, holding steady sideways says more than the size of any rebound.
#CC
DYOR, and don't invest more than you can afford.
48

·
--
Honestly, after seeing it plunge 2.42% in $CC 5 minutes, I’m guessing the comments are once again full of people calling the bottom.
My approach is: don’t try to catch the first knife in a sharp drop. Wait for the price to stabilize, then see whether there’s strong buying support. The level to watch right now is the 24-hour low of 0.07862.
When it comes to buying the dip, taking your time is often no bad thing. How do you usually handle this kind of situation?
#CC
Honestly, after seeing it plunge 2.42% in $CC 5 minutes, I’m guessing the comments are once again full of people calling the bottom.
My approach is: don’t try to catch the first knife in a sharp drop. Wait for the price to stabilize, then see whether there’s strong buying support. The level to watch right now is the 24-hour low of 0.07862.
When it comes to buying the dip, taking your time is often no bad thing. How do you usually handle this kind of situation?
#CC
My approach is: don’t try to catch the first knife in a sharp drop. Wait for the price to stabilize, then see whether there’s strong buying support. The level to watch right now is the 24-hour low of 0.07862.
When it comes to buying the dip, taking your time is often no bad thing. How do you usually handle this kind of situation?
#CC
44

·
--
🐋 For those watching the flow of funds, take a look:
$CC 5 minutes, down 2.42%, current price 0.08459, 24h trading volume $7.05 million.
How to read the capital flow:
· The decline was concentrated in just five minutes, indicating urgent aggressive selling
· 24h is still +7.43%, suggesting short-term investors are taking profits
· Next, watch whether large orders step in to support the lows. If they can't absorb the selling, a second dip is likely
What do you think?
#CC
🐋 For those watching the flow of funds, take a look:
$CC 5 minutes, down 2.42%, current price 0.08459, 24h trading volume $7.05 million.
How to read the capital flow:
· The decline was concentrated in just five minutes, indicating urgent aggressive selling
· 24h is still +7.43%, suggesting short-term investors are taking profits
· Next, watch whether large orders step in to support the lows. If they can't absorb the selling, a second dip is likely
What do you think?
#CC
$CC 5 minutes, down 2.42%, current price 0.08459, 24h trading volume $7.05 million.
How to read the capital flow:
· The decline was concentrated in just five minutes, indicating urgent aggressive selling
· 24h is still +7.43%, suggesting short-term investors are taking profits
· Next, watch whether large orders step in to support the lows. If they can't absorb the selling, a second dip is likely
What do you think?
#CC
45

·
--
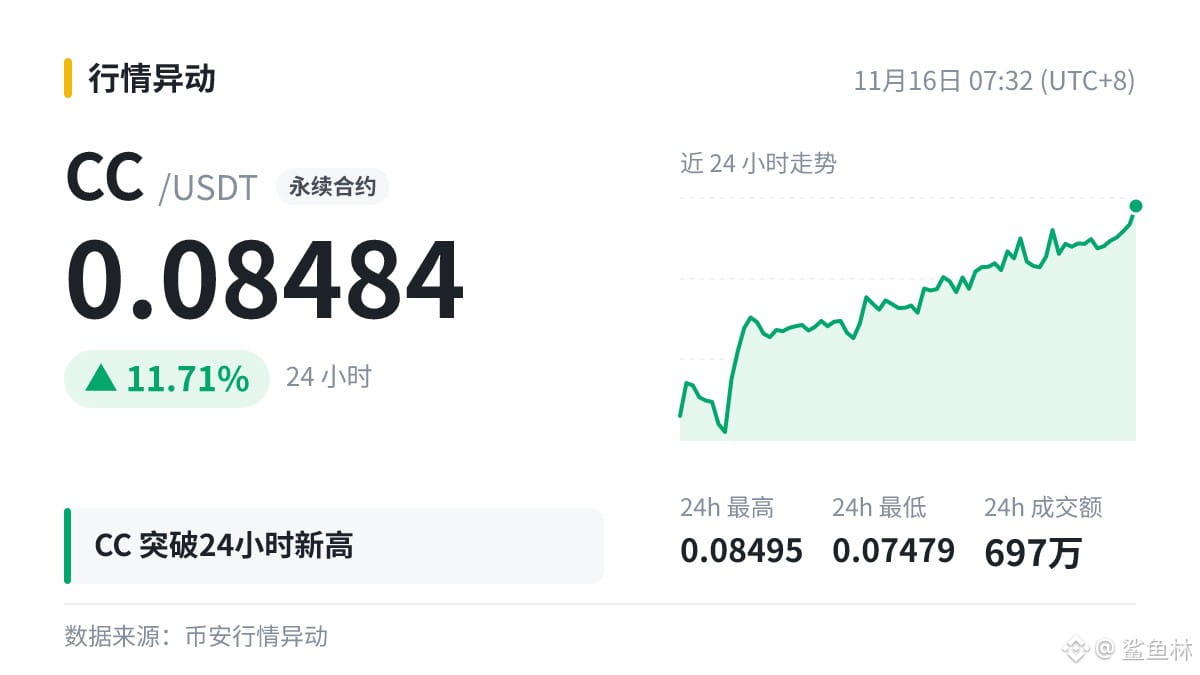
🐋 $CC hit a new 24-hour high, with buying activity quite strong.
Current price: 0.08484, above the previous high of 0.08415, with 24-hour trading volume of $6.97 million.
Short-position stop-losses tend to cluster near new highs. Holding above this level can trigger a short squeeze, but beware of a pullback after the spike.
#CC
🐋 $CC hit a new 24-hour high, with buying activity quite strong.
Current price: 0.08484, above the previous high of 0.08415, with 24-hour trading volume of $6.97 million.
Short-position stop-losses tend to cluster near new highs. Holding above this level can trigger a short squeeze, but beware of a pullback after the spike.
#CC
Current price: 0.08484, above the previous high of 0.08415, with 24-hour trading volume of $6.97 million.
Short-position stop-losses tend to cluster near new highs. Holding above this level can trigger a short squeeze, but beware of a pullback after the spike.
#CC
56

·
--
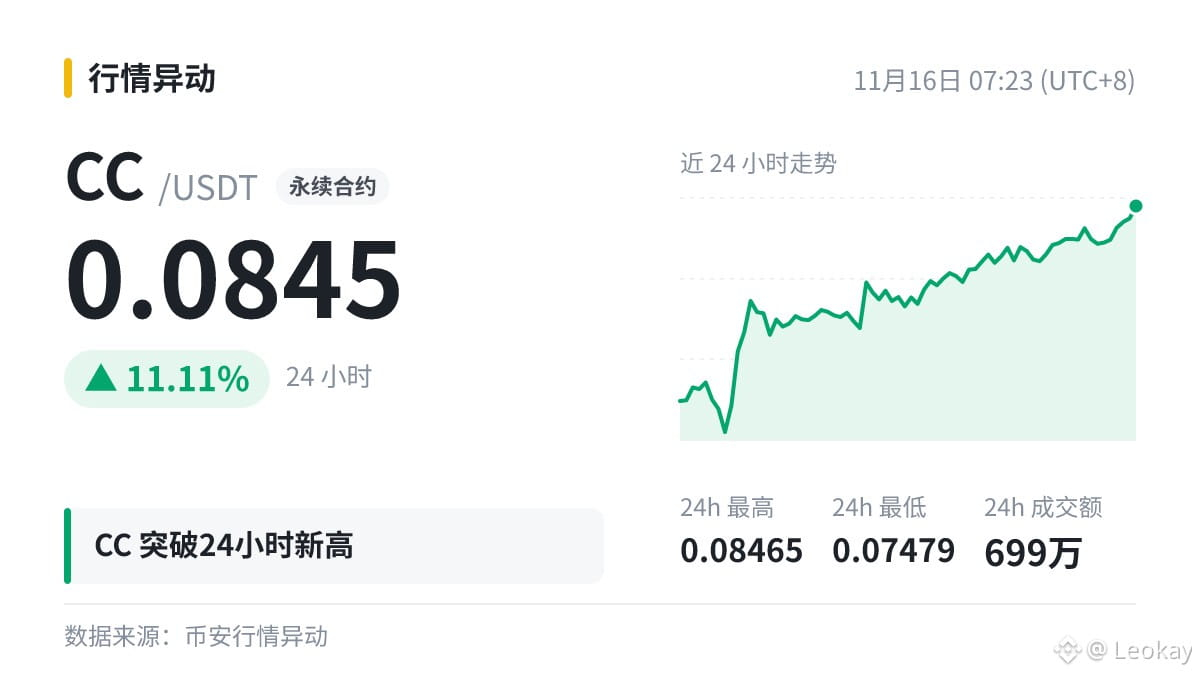
🎯 $CC sets a new 24-hour high at 0.0845, breaking above the previous high of 0.08415.
The market has suddenly come alive. The biggest risk during a rally is chasing highs with your entire position. How much further can it run? Share your thoughts in the comments.
#CC
🎯 $CC sets a new 24-hour high at 0.0845, breaking above the previous high of 0.08415.
The market has suddenly come alive. The biggest risk during a rally is chasing highs with your entire position. How much further can it run? Share your thoughts in the comments.
#CC
The market has suddenly come alive. The biggest risk during a rally is chasing highs with your entire position. How much further can it run? Share your thoughts in the comments.
#CC
3

·
--
What are the big players doing?
$CC 30 hit a new daily low: current price 0.08021, previous low 0.08096, down 7.72% in 24 hours.
There’s no clear support near the new low for now, and funds are still flowing out. Don’t rush to buy the dip.
What reasons do you each have for going long or short?
#CC
What are the big players doing?
$CC 30 hit a new daily low: current price 0.08021, previous low 0.08096, down 7.72% in 24 hours.
There’s no clear support near the new low for now, and funds are still flowing out. Don’t rush to buy the dip.
What reasons do you each have for going long or short?
#CC
$CC 30 hit a new daily low: current price 0.08021, previous low 0.08096, down 7.72% in 24 hours.
There’s no clear support near the new low for now, and funds are still flowing out. Don’t rush to buy the dip.
What reasons do you each have for going long or short?
#CC
1

·
--
Checking the market in the early hours, $CC hit a new 30-day low: 0.08024 (previous low: 0.08096).
I decided to go get a drink of water first, then come back and face it.
Don't average down on a wrong call.
#CC
Checking the market in the early hours, $CC hit a new 30-day low: 0.08024 (previous low: 0.08096).
I decided to go get a drink of water first, then come back and face it.
Don't average down on a wrong call.
#CC
I decided to go get a drink of water first, then come back and face it.
Don't average down on a wrong call.
#CC
3
Log in to explore more content
Join global crypto users on Binance Square
⚡️ Get latest and useful information about crypto.
💬 Trusted by the world’s largest crypto exchange.
👍 Discover real insights from verified creators.
Email / Phone number
Trending Topics
1
#CanBTCReboundAfterFallingBelow60K?
388,957 views
1,691 Discussing
2
#GlobalStocksFaceLongestLosingStreakSince2023
129,378 views
1,171 Discussing
3
#BlackRockIBITPostsRecord$541MSingleDayOutflow
1,028 views
32 Discussing
4
#AnthropicPlungesTowardIPOPriceonDay2
61,498 views
650 Discussing
5
#TwentyOneCapitalAdds172.25BTC
14,326 views
197 Discussing
6
#HKBillWouldExcludeTokenizedDepositsFromVirtualAssets
1,432 views
19 Discussing
7
#BNBDropsBelow540USDTWith8.46%DailyDecline
34,954 views
304 Discussing
8
#HKBillProposesHK$100KFineForUnauthorizedCryptoTitles
1,141 views
17 Discussing
9
#BitMineFaces$10.1BUnrealizedETHLoss
2,166 views
20 Discussing
10
#StrategyReports$35BNetReserves
2,128 views
18 Discussing