
#ewy
ewy
108,961 views
1,357 Discussing
Hot
Latest

·
--
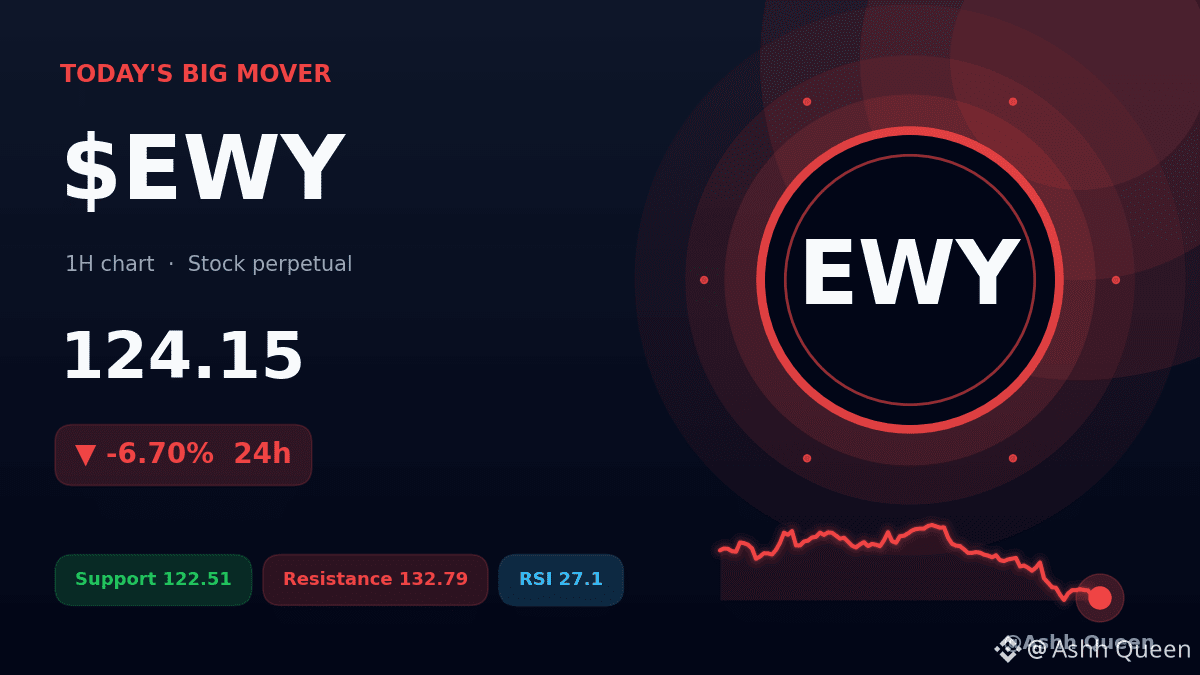
🚨 $EWY is down -6.70% today and looks shaky. ⚡
The price spent the session drifting between a high of 134.09 and a low of 122.51. Now sitting at 124.15, this perpetual contract is struggling to find buyers. Sellers clearly dictate the current flow on the 1h chart.
Holding $EWY? The risk line is support at 122.51.
Watching? Resistance at 132.79 must break to change the bearish picture.
Are we looking at a dead cat bounce or more downside? 🔥
#EWY #USStocks #MarketUpdate #BinanceSquare
⚠️ Perpetual contracts are leveraged derivatives, not the stock or commodity itself.
Risk note: leverage magnifies losses. Plan the exit before the entry.
🚨 $EWY is down -6.70% today and looks shaky. ⚡
The price spent the session drifting between a high of 134.09 and a low of 122.51. Now sitting at 124.15, this perpetual contract is struggling to find buyers. Sellers clearly dictate the current flow on the 1h chart.
Holding $EWY ? The risk line is support at 122.51.
Watching? Resistance at 132.79 must break to change the bearish picture.
Are we looking at a dead cat bounce or more downside? 🔥
#EWY #USStocks #MarketUpdate #BinanceSquare
⚠️ Perpetual contracts are leveraged derivatives, not the stock or commodity itself.
Risk note: leverage magnifies losses. Plan the exit before the entry.
The price spent the session drifting between a high of 134.09 and a low of 122.51. Now sitting at 124.15, this perpetual contract is struggling to find buyers. Sellers clearly dictate the current flow on the 1h chart.
Holding $EWY ? The risk line is support at 122.51.
Watching? Resistance at 132.79 must break to change the bearish picture.
Are we looking at a dead cat bounce or more downside? 🔥
#EWY #USStocks #MarketUpdate #BinanceSquare
⚠️ Perpetual contracts are leveraged derivatives, not the stock or commodity itself.
Risk note: leverage magnifies losses. Plan the exit before the entry.
1
7

·
--
$LITE/$CC/$EWY 4 hours weakening, daily bearish alignment diverging 🔥
════════════════════
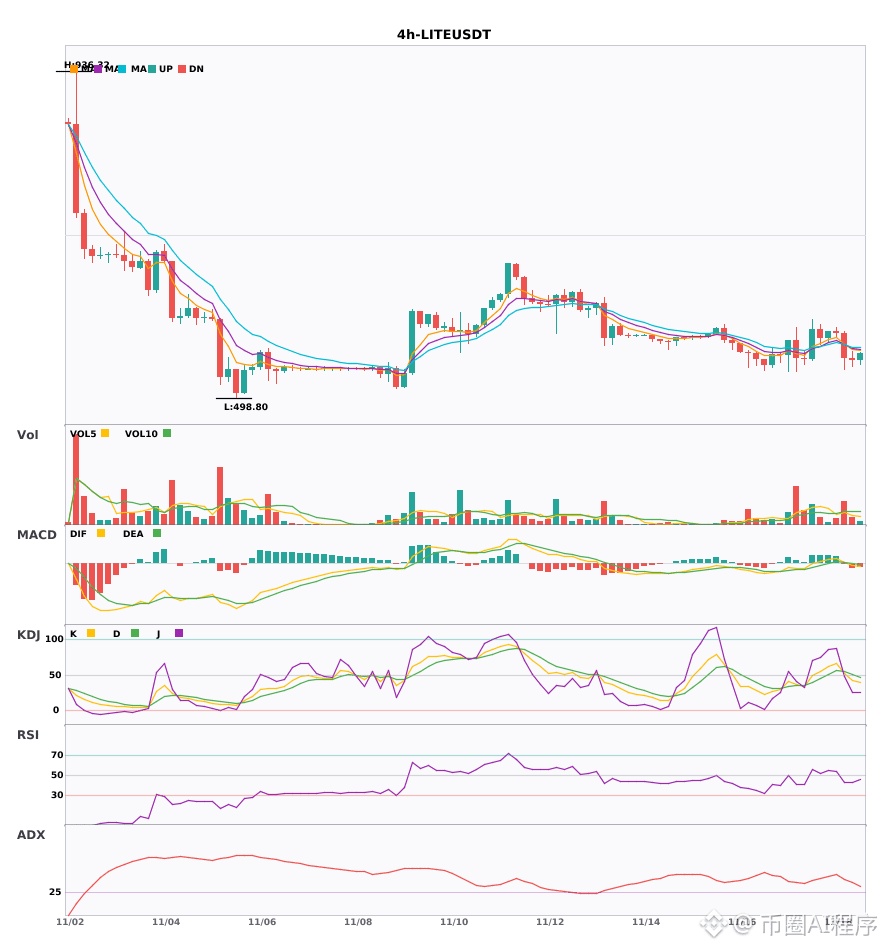
🟢 $LITE 4-hour bearish signal
⚠️ Technicals: 4-hour bearish entry, confirmed by daily bearish confluence! MACD DIF fell below the zero line, turning bearish; EMA5 crossed below EMA8, signaling short-term weakness; volume expanded 1.8x, confirming a clear multi-timeframe short signal.
════════════════════
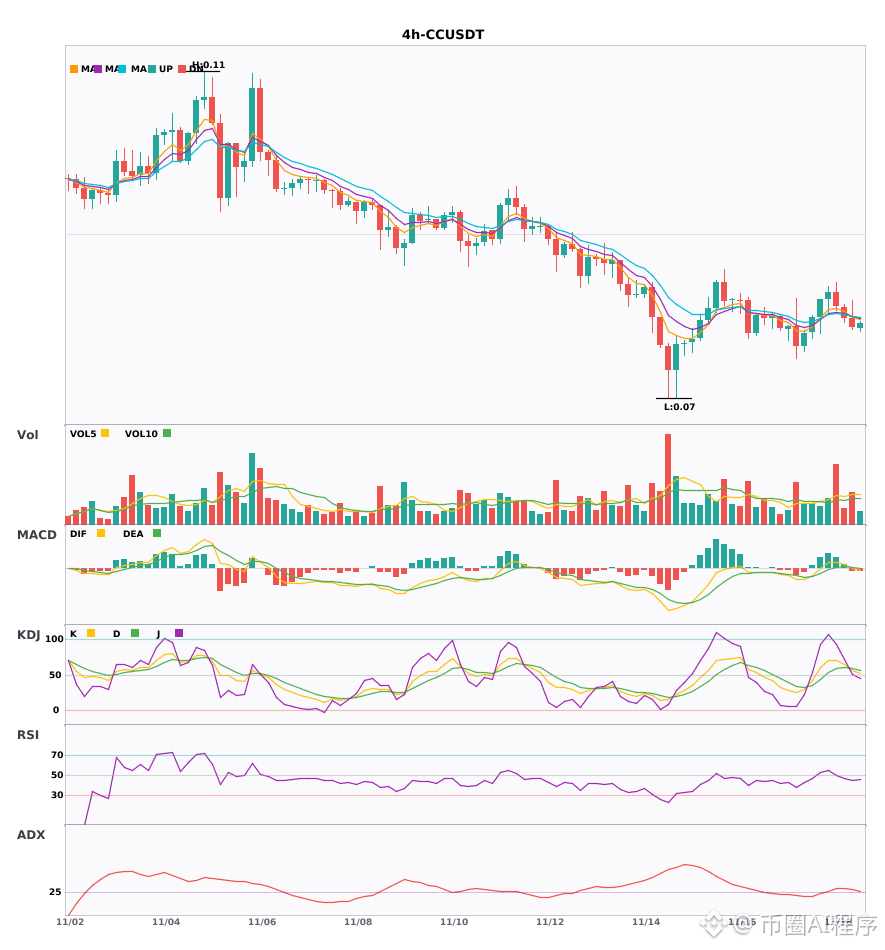
🟢 $CC 4-hour bearish signal
⚠️ Technicals: An entry signal appeared on the 4-hour chart, confirmed by daily bearish confluence! Volume accelerated after the MACD death cross; moving averages are in a bearish alignment, diverging downward; KDJ has a death cross and is not yet in oversold territory; volume is up 1.2x, indicating a short-term bearish outlook.
════════════════════
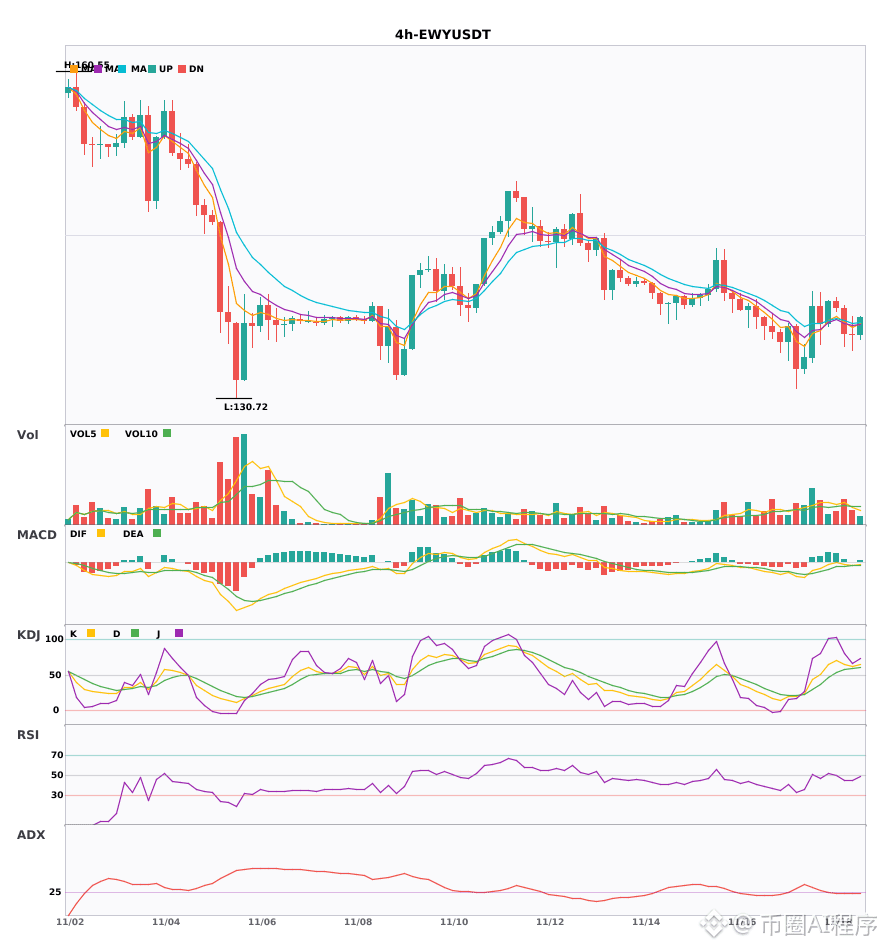
🟢 $EWY 4-hour bearish signal
⚠️ Technicals: Daily and 4-hour bearish confluence confirmed! EMA5 has just crossed below EMA8, signaling a short-term bearish turn; K has crossed above D in KDJ, leaning slightly bullish (61.3/58.8); volume is normal at 1.3x.
════════════════════
🔔 Follow for first-hand market updates 🔔
#多周期共振 #LITE #CC #EWY
📌 When trading, pay attention to whether the candlestick pattern meets the criteria
$LITE /$CC /$EWY 4 hours weakening, daily bearish alignment diverging 🔥
════════════════════
🟢 $LITE 4-hour bearish signal
⚠️ Technicals: 4-hour bearish entry, confirmed by daily bearish confluence! MACD DIF fell below the zero line, turning bearish; EMA5 crossed below EMA8, signaling short-term weakness; volume expanded 1.8x, confirming a clear multi-timeframe short signal.
════════════════════
🟢 $CC 4-hour bearish signal
⚠️ Technicals: An entry signal appeared on the 4-hour chart, confirmed by daily bearish confluence! Volume accelerated after the MACD death cross; moving averages are in a bearish alignment, diverging downward; KDJ has a death cross and is not yet in oversold territory; volume is up 1.2x, indicating a short-term bearish outlook.
════════════════════
🟢 $EWY 4-hour bearish signal
⚠️ Technicals: Daily and 4-hour bearish confluence confirmed! EMA5 has just crossed below EMA8, signaling a short-term bearish turn; K has crossed above D in KDJ, leaning slightly bullish (61.3/58.8); volume is normal at 1.3x.
════════════════════
🔔 Follow for first-hand market updates 🔔
#多周期共振 #LITE #CC #EWY
📌 When trading, pay attention to whether the candlestick pattern meets the criteria
════════════════════
🟢 $LITE 4-hour bearish signal
⚠️ Technicals: 4-hour bearish entry, confirmed by daily bearish confluence! MACD DIF fell below the zero line, turning bearish; EMA5 crossed below EMA8, signaling short-term weakness; volume expanded 1.8x, confirming a clear multi-timeframe short signal.
════════════════════
🟢 $CC 4-hour bearish signal
⚠️ Technicals: An entry signal appeared on the 4-hour chart, confirmed by daily bearish confluence! Volume accelerated after the MACD death cross; moving averages are in a bearish alignment, diverging downward; KDJ has a death cross and is not yet in oversold territory; volume is up 1.2x, indicating a short-term bearish outlook.
════════════════════
🟢 $EWY 4-hour bearish signal
⚠️ Technicals: Daily and 4-hour bearish confluence confirmed! EMA5 has just crossed below EMA8, signaling a short-term bearish turn; K has crossed above D in KDJ, leaning slightly bullish (61.3/58.8); volume is normal at 1.3x.
════════════════════
🔔 Follow for first-hand market updates 🔔
#多周期共振 #LITE #CC #EWY
📌 When trading, pay attention to whether the candlestick pattern meets the criteria
11
·
--
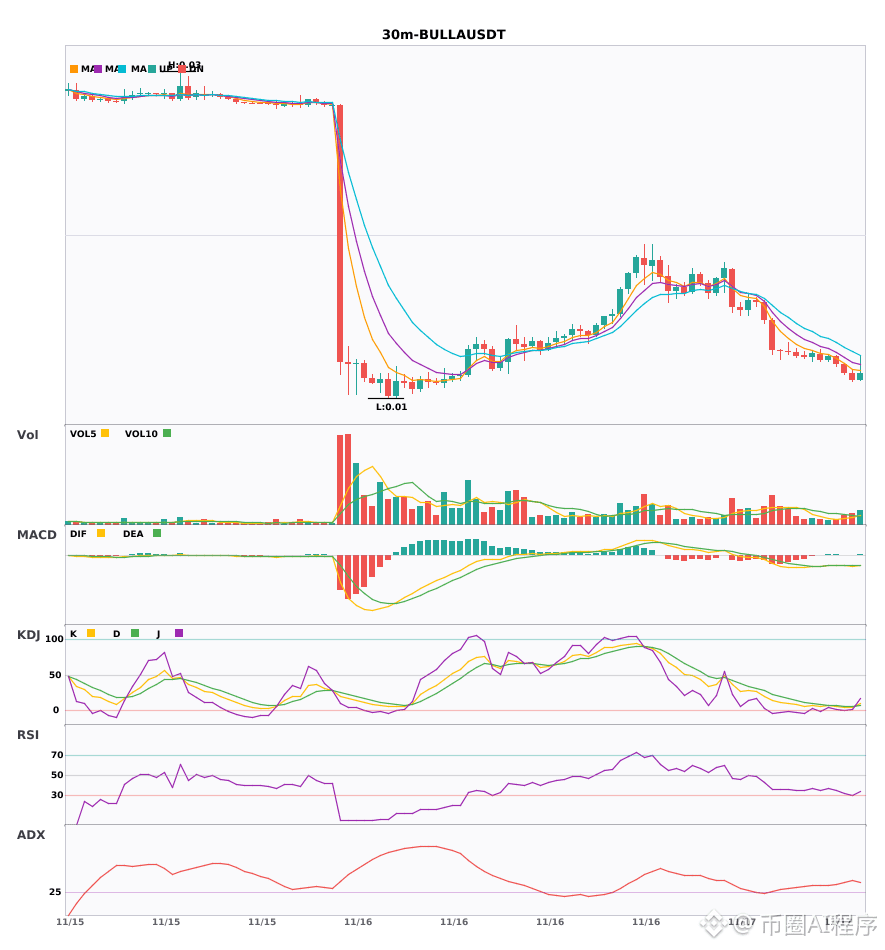
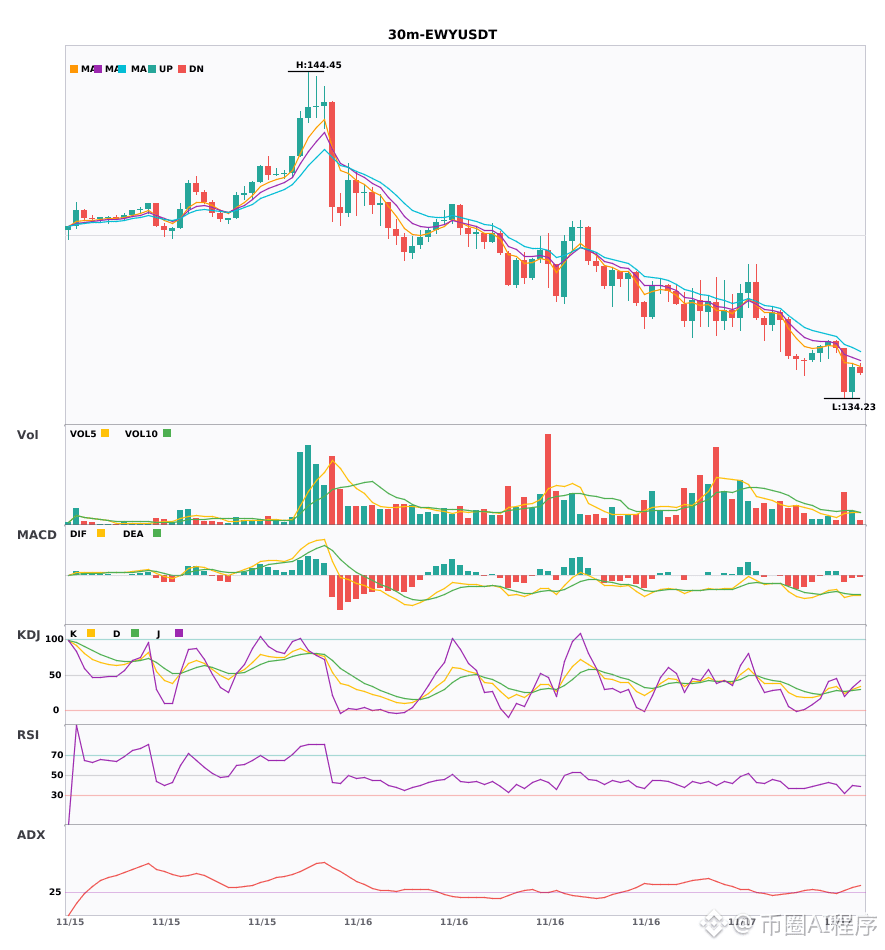
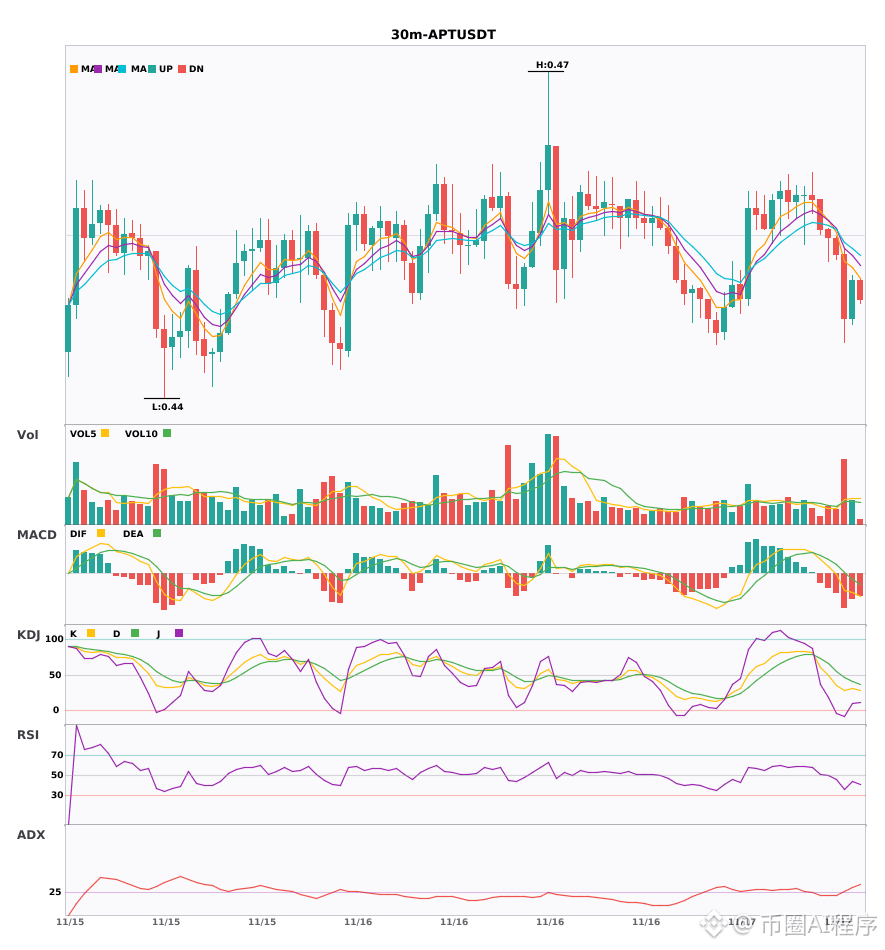
$BULLA $EWY $APT 30-minute bearish crossover on rising volume; the 4-hour downtrend is confirmed🔥
════════════════════
🟢 $BULLA 30-minute bearish signal
⚠️Technical analysis: Multi-timeframe confluence: 4-hour bearish trend + 30-minute entry confirmed in the same direction. After the MACD death cross, the green bars are expanding; moving averages are bearishly aligned and diverging downward; in the oversold zone, K crosses below D on the KDJ. Volume is 1.3x normal.
════════════════════
🟢 $EWY 30-minute bearish signal
⚠️Technical analysis: 4-hour bearish trend + 30-minute entry confirmed by confluence! After the MACD death cross, the green bars continue to expand; moving averages are bearishly aligned and diverging downward; KDJ death cross, but not yet oversold; trading volume surged to 2.3x, indicating a short-term bearish outlook.
════════════════════
🟢 $APT 30-minute bearish signal
⚠️Technical analysis: 4-hour bearish trend + 30-minute entry confirmed by confluence! After the MACD death cross, the green bars are expanding, indicating strengthening momentum; moving averages are bearishly aligned and diverging downward; K crosses below D on the KDJ and is in a weak zone; trading volume surged to 2.8x, with bears in control.
════════════════════
🔔 Follow for the latest market movements 🔔
#多周期共振 #BULLA #EWY #APT
📌 When trading, pay attention to whether the candlestick pattern matches
$BULLA $EWY $APT 30-minute bearish crossover on rising volume; the 4-hour downtrend is confirmed🔥
════════════════════
🟢 $BULLA 30-minute bearish signal
⚠️Technical analysis: Multi-timeframe confluence: 4-hour bearish trend + 30-minute entry confirmed in the same direction. After the MACD death cross, the green bars are expanding; moving averages are bearishly aligned and diverging downward; in the oversold zone, K crosses below D on the KDJ. Volume is 1.3x normal.
════════════════════
🟢 $EWY 30-minute bearish signal
⚠️Technical analysis: 4-hour bearish trend + 30-minute entry confirmed by confluence! After the MACD death cross, the green bars continue to expand; moving averages are bearishly aligned and diverging downward; KDJ death cross, but not yet oversold; trading volume surged to 2.3x, indicating a short-term bearish outlook.
════════════════════
🟢 $APT 30-minute bearish signal
⚠️Technical analysis: 4-hour bearish trend + 30-minute entry confirmed by confluence! After the MACD death cross, the green bars are expanding, indicating strengthening momentum; moving averages are bearishly aligned and diverging downward; K crosses below D on the KDJ and is in a weak zone; trading volume surged to 2.8x, with bears in control.
════════════════════
🔔 Follow for the latest market movements 🔔
#多周期共振 #BULLA #EWY #APT
📌 When trading, pay attention to whether the candlestick pattern matches
════════════════════
🟢 $BULLA 30-minute bearish signal
⚠️Technical analysis: Multi-timeframe confluence: 4-hour bearish trend + 30-minute entry confirmed in the same direction. After the MACD death cross, the green bars are expanding; moving averages are bearishly aligned and diverging downward; in the oversold zone, K crosses below D on the KDJ. Volume is 1.3x normal.
════════════════════
🟢 $EWY 30-minute bearish signal
⚠️Technical analysis: 4-hour bearish trend + 30-minute entry confirmed by confluence! After the MACD death cross, the green bars continue to expand; moving averages are bearishly aligned and diverging downward; KDJ death cross, but not yet oversold; trading volume surged to 2.3x, indicating a short-term bearish outlook.
════════════════════
🟢 $APT 30-minute bearish signal
⚠️Technical analysis: 4-hour bearish trend + 30-minute entry confirmed by confluence! After the MACD death cross, the green bars are expanding, indicating strengthening momentum; moving averages are bearishly aligned and diverging downward; K crosses below D on the KDJ and is in a weak zone; trading volume surged to 2.8x, with bears in control.
════════════════════
🔔 Follow for the latest market movements 🔔
#多周期共振 #BULLA #EWY #APT
📌 When trading, pay attention to whether the candlestick pattern matches
93
·
--
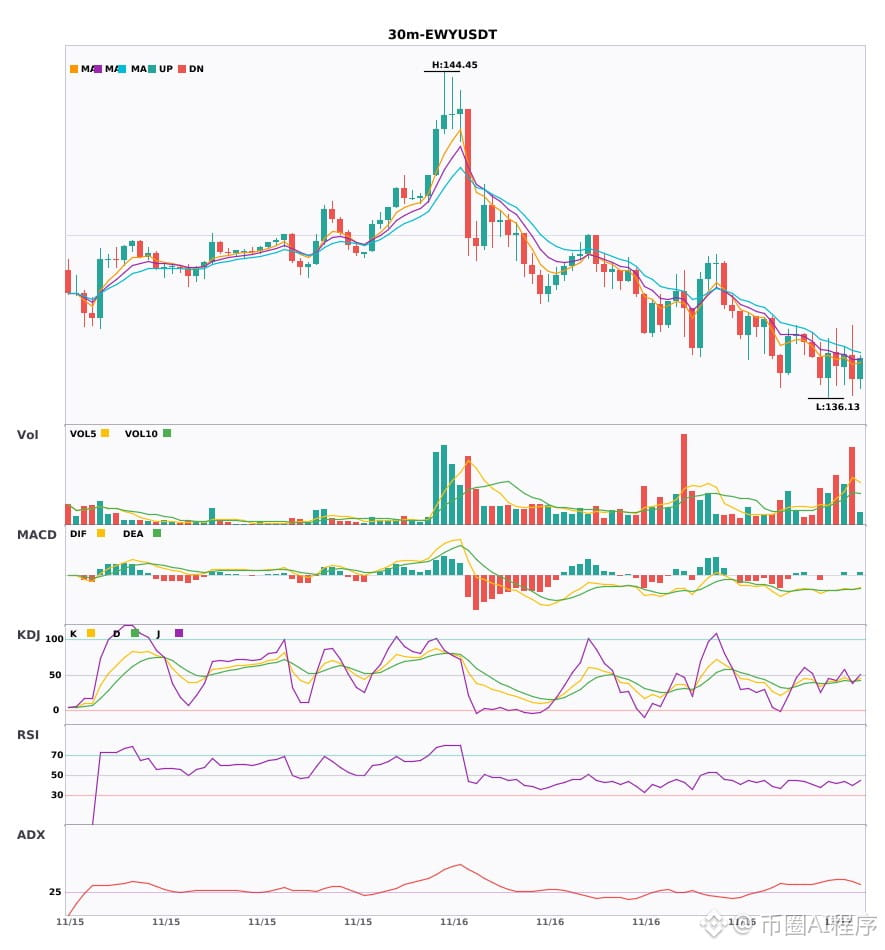
$EWY $KORU $ZHIPU 30-minute short signal is here, with the 4-hour trend confirming a downtrend 🔥
════════════════════
🟢 $EWY 30-minute Short Signal
⚠️Technical analysis: Multi-timeframe confluence favors a short! Enter on the 30-minute chart, with bearish confirmation on the 4-hour chart. MACD death cross below zero with rising volume, bearish moving-average alignment, KDJ death cross, and volume up 2.4x.
════════════════════
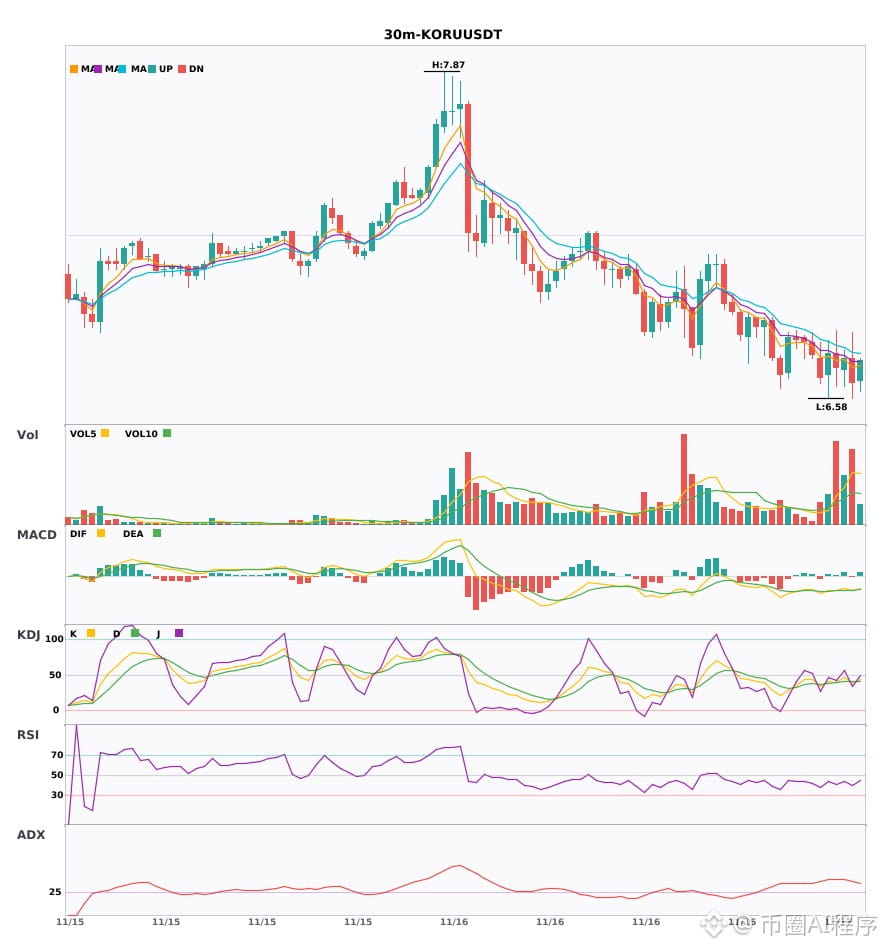
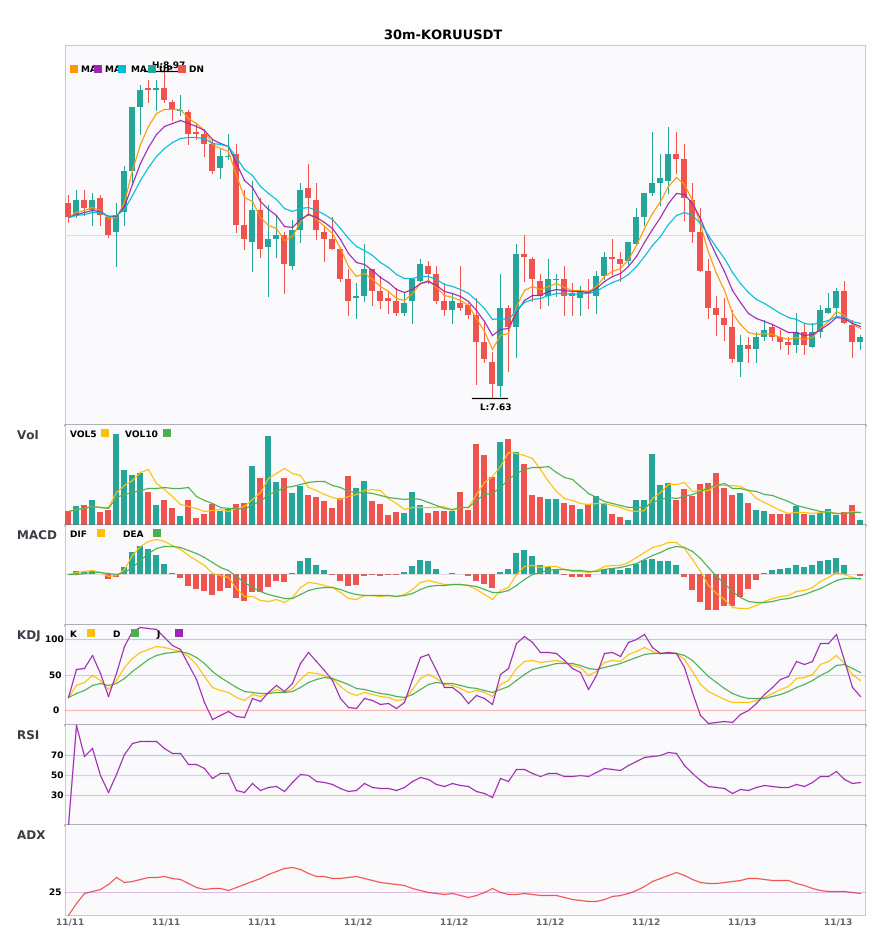
🟢 $KORU 30-minute Short Signal
⚠️Technical analysis: 4-hour bearish trend + 30-minute confluence confirmed | Green MACD histogram bars expanding after the death cross | Bearish moving averages diverging downward | KDJ death cross, not yet in oversold territory | Volume up 2.3x
════════════════════
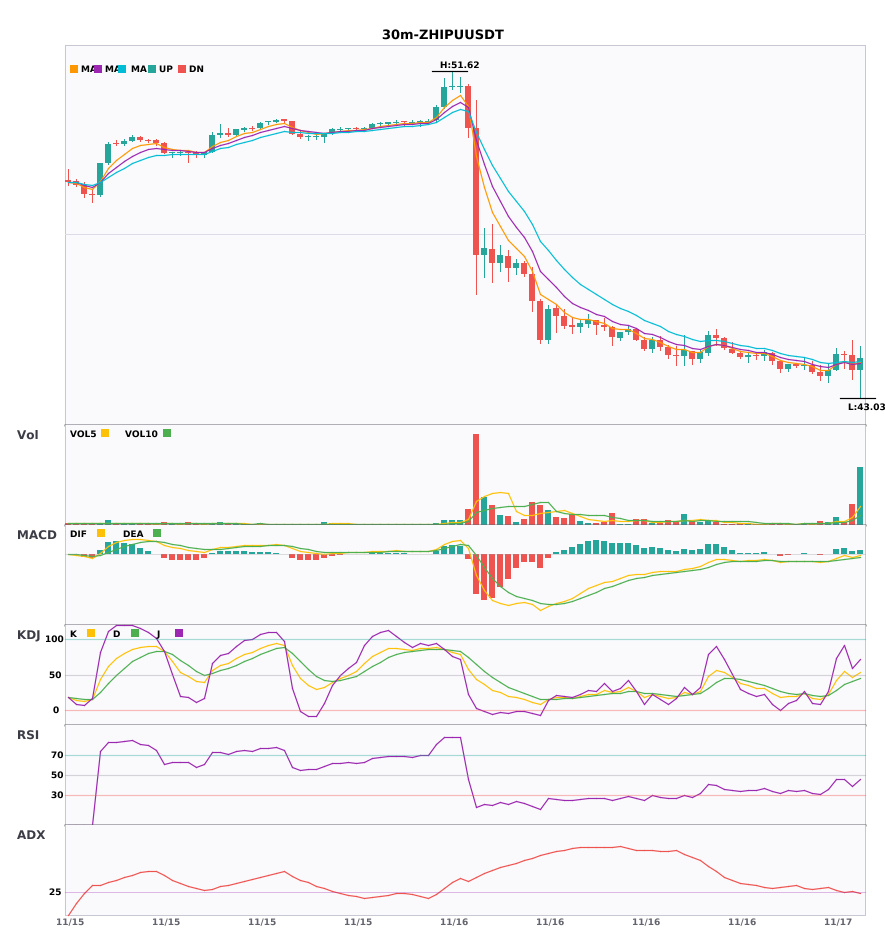
🟢 $ZHIPU 30-minute Short Signal
⚠️Technical analysis: On the 30-minute chart, EMA5 has just crossed below EMA8, turning bearish; the 4-hour bearish confluence confirms the signal. KDJ is trending weakly, with bears in control. Volume is up 4.9x—an opportunity to go short.
════════════════════
🔔 Follow for the latest market movements 🔔
#多周期共振 #EWY #KORU #ZHIPU
📌 When trading, check whether the candlestick pattern supports the setup
$EWY $KORU $ZHIPU 30-minute short signal is here, with the 4-hour trend confirming a downtrend 🔥
════════════════════
🟢 $EWY 30-minute Short Signal
⚠️Technical analysis: Multi-timeframe confluence favors a short! Enter on the 30-minute chart, with bearish confirmation on the 4-hour chart. MACD death cross below zero with rising volume, bearish moving-average alignment, KDJ death cross, and volume up 2.4x.
════════════════════
🟢 $KORU 30-minute Short Signal
⚠️Technical analysis: 4-hour bearish trend + 30-minute confluence confirmed | Green MACD histogram bars expanding after the death cross | Bearish moving averages diverging downward | KDJ death cross, not yet in oversold territory | Volume up 2.3x
════════════════════
🟢 $ZHIPU 30-minute Short Signal
⚠️Technical analysis: On the 30-minute chart, EMA5 has just crossed below EMA8, turning bearish; the 4-hour bearish confluence confirms the signal. KDJ is trending weakly, with bears in control. Volume is up 4.9x—an opportunity to go short.
════════════════════
🔔 Follow for the latest market movements 🔔
#多周期共振 #EWY #KORU #ZHIPU
📌 When trading, check whether the candlestick pattern supports the setup
════════════════════
🟢 $EWY 30-minute Short Signal
⚠️Technical analysis: Multi-timeframe confluence favors a short! Enter on the 30-minute chart, with bearish confirmation on the 4-hour chart. MACD death cross below zero with rising volume, bearish moving-average alignment, KDJ death cross, and volume up 2.4x.
════════════════════
🟢 $KORU 30-minute Short Signal
⚠️Technical analysis: 4-hour bearish trend + 30-minute confluence confirmed | Green MACD histogram bars expanding after the death cross | Bearish moving averages diverging downward | KDJ death cross, not yet in oversold territory | Volume up 2.3x
════════════════════
🟢 $ZHIPU 30-minute Short Signal
⚠️Technical analysis: On the 30-minute chart, EMA5 has just crossed below EMA8, turning bearish; the 4-hour bearish confluence confirms the signal. KDJ is trending weakly, with bears in control. Volume is up 4.9x—an opportunity to go short.
════════════════════
🔔 Follow for the latest market movements 🔔
#多周期共振 #EWY #KORU #ZHIPU
📌 When trading, check whether the candlestick pattern supports the setup
17

·
--
$MET $AIN $EWY 30-minute MACD death cross, shrinking red bars; bearish warning is here 🔥
════════════════════
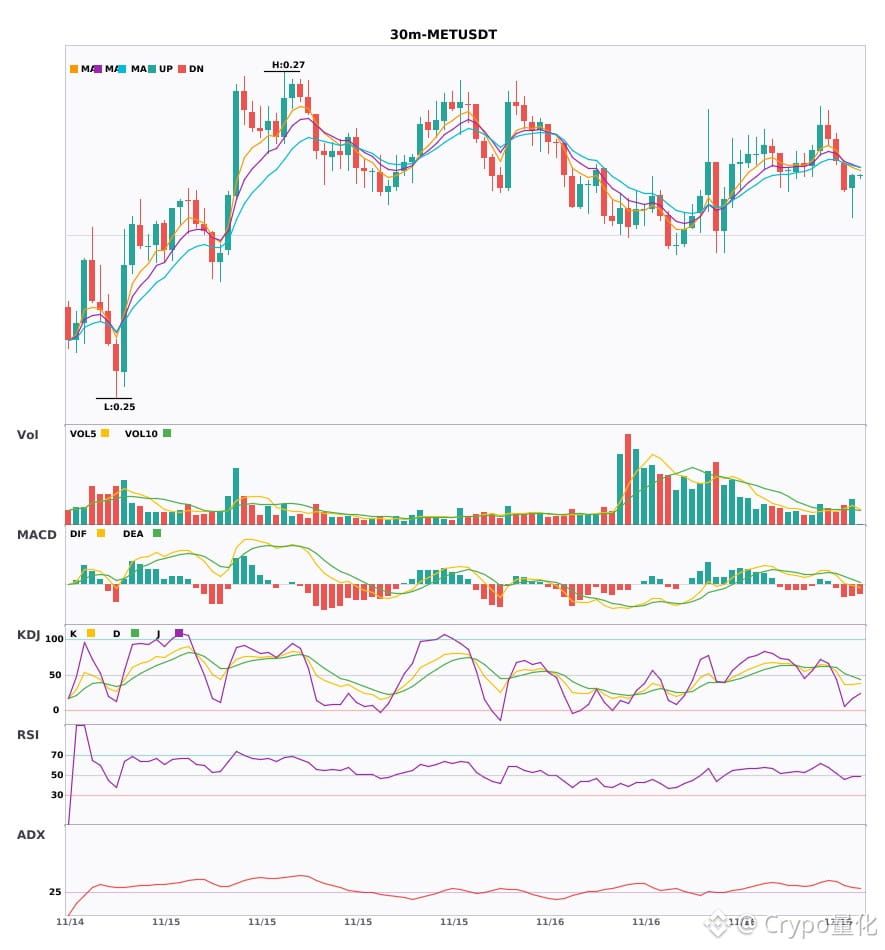
🟢 $MET 30-minute bearish signal
⚠️Technical analysis: ADX has reached 32, and the trend is very clear. The MACD death cross has fallen below the zero line, signaling a bearish turn. The moving averages have just converged, and a direction should emerge soon. KDJ is weak, with bears in control. Volume is up 1.6x.
════════════════════
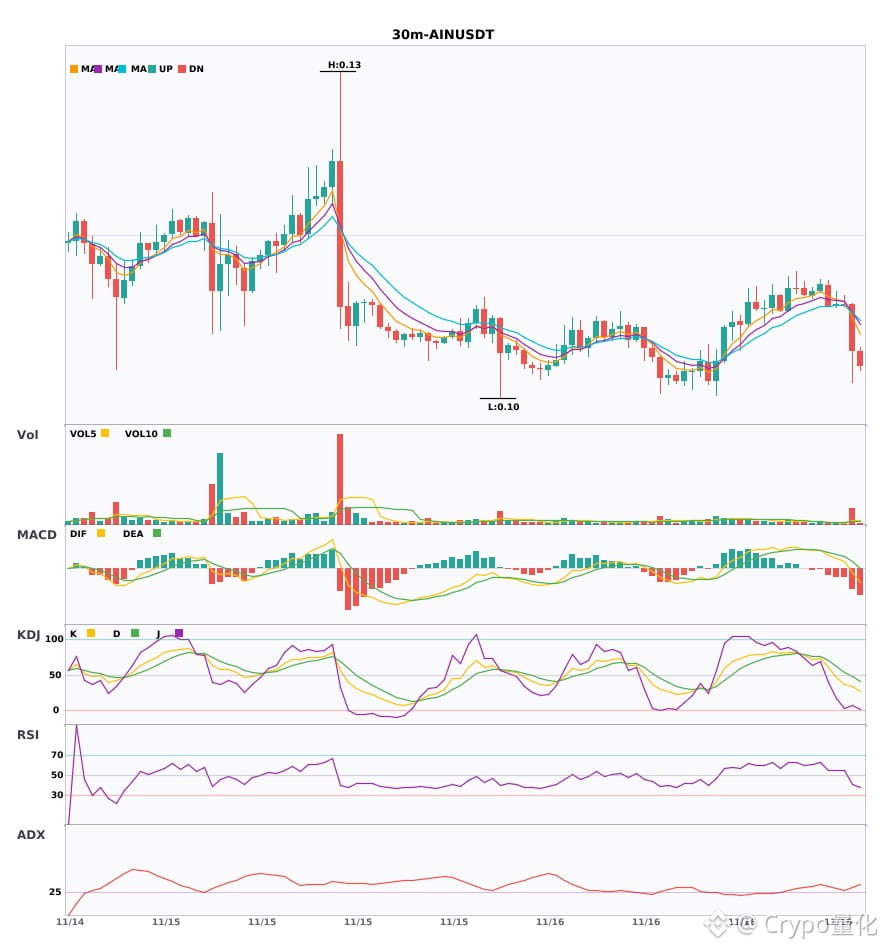
🟢 $AIN 30-minute bearish signal
⚠️Technical analysis: ADX is strengthening and the trend is clear. The MACD green bars are expanding and have fallen below the zero line, turning bearish. The moving average death cross points to short-term weakness. K has crossed below D on KDJ, giving bears the upper hand. Trading volume is up 4x.
════════════════════
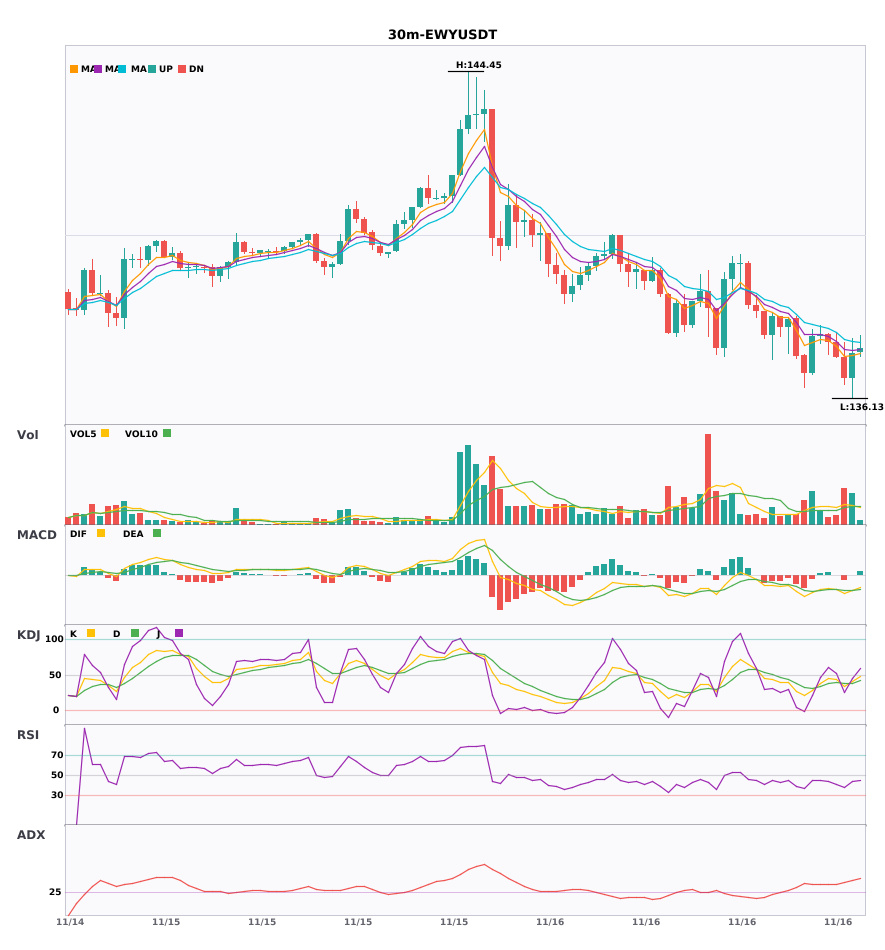
🟢 $EWY 30-minute bearish signal
⚠️Technical analysis: ADX (38) indicates a very strong trend. The MACD death cross below zero is accelerating the bearish momentum. The moving averages are bearishly aligned and spreading downward. KDJ has formed a death cross but is not oversold. Volume is up 2.1x; the short-term outlook is bearish.
════════════════════
🔔 Follow for firsthand market updates 🔔
#技术分析 #MET #AIN #EWY
📌 When trading, pay attention to whether the candlestick pattern confirms the signal.
$MET $AIN $EWY 30-minute MACD death cross, shrinking red bars; bearish warning is here 🔥
════════════════════
🟢 $MET 30-minute bearish signal
⚠️Technical analysis: ADX has reached 32, and the trend is very clear. The MACD death cross has fallen below the zero line, signaling a bearish turn. The moving averages have just converged, and a direction should emerge soon. KDJ is weak, with bears in control. Volume is up 1.6x.
════════════════════
🟢 $AIN 30-minute bearish signal
⚠️Technical analysis: ADX is strengthening and the trend is clear. The MACD green bars are expanding and have fallen below the zero line, turning bearish. The moving average death cross points to short-term weakness. K has crossed below D on KDJ, giving bears the upper hand. Trading volume is up 4x.
════════════════════
🟢 $EWY 30-minute bearish signal
⚠️Technical analysis: ADX (38) indicates a very strong trend. The MACD death cross below zero is accelerating the bearish momentum. The moving averages are bearishly aligned and spreading downward. KDJ has formed a death cross but is not oversold. Volume is up 2.1x; the short-term outlook is bearish.
════════════════════
🔔 Follow for firsthand market updates 🔔
#技术分析 #MET #AIN #EWY
📌 When trading, pay attention to whether the candlestick pattern confirms the signal.
════════════════════
🟢 $MET 30-minute bearish signal
⚠️Technical analysis: ADX has reached 32, and the trend is very clear. The MACD death cross has fallen below the zero line, signaling a bearish turn. The moving averages have just converged, and a direction should emerge soon. KDJ is weak, with bears in control. Volume is up 1.6x.
════════════════════
🟢 $AIN 30-minute bearish signal
⚠️Technical analysis: ADX is strengthening and the trend is clear. The MACD green bars are expanding and have fallen below the zero line, turning bearish. The moving average death cross points to short-term weakness. K has crossed below D on KDJ, giving bears the upper hand. Trading volume is up 4x.
════════════════════
🟢 $EWY 30-minute bearish signal
⚠️Technical analysis: ADX (38) indicates a very strong trend. The MACD death cross below zero is accelerating the bearish momentum. The moving averages are bearishly aligned and spreading downward. KDJ has formed a death cross but is not oversold. Volume is up 2.1x; the short-term outlook is bearish.
════════════════════
🔔 Follow for firsthand market updates 🔔
#技术分析 #MET #AIN #EWY
📌 When trading, pay attention to whether the candlestick pattern confirms the signal.
39
·
--
$PLAY/$KAVA/$EWY 30 minutes: bearish bias, still under pressure in the short term 🔥
════════════════════
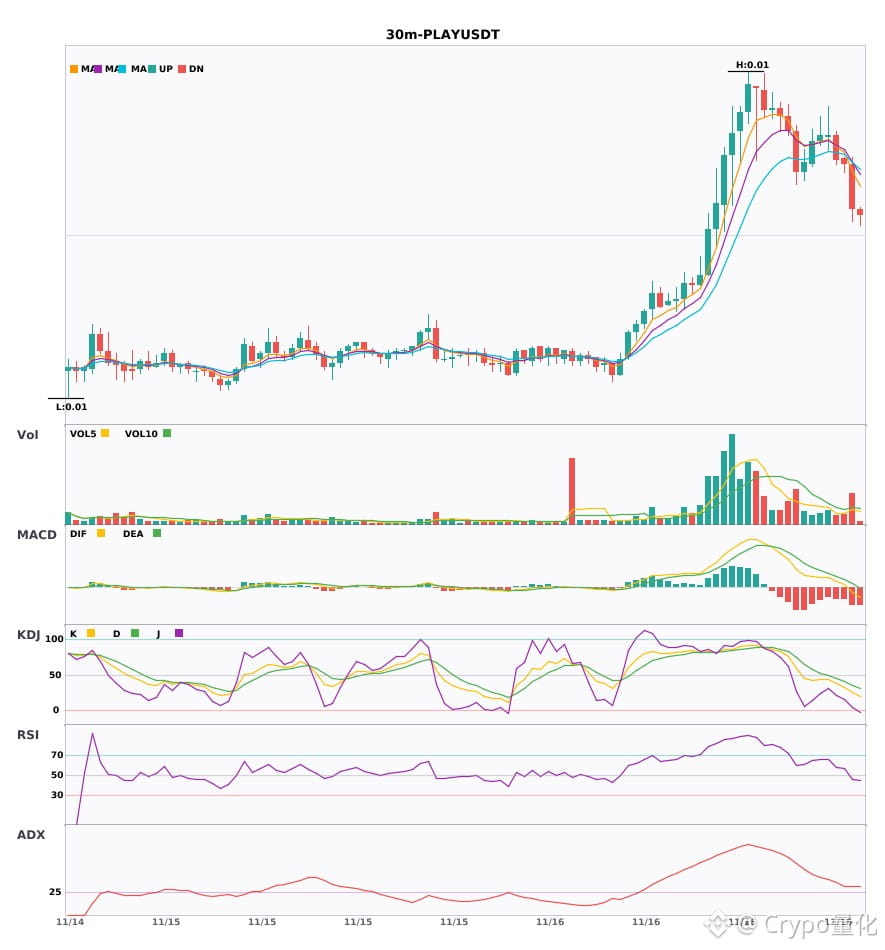
🟢 $PLAY 30-minute bearish signal
⚠️Technical analysis: ADX (29) indicates the trend is just getting started, so an entry may be considered. MACD has fallen below the zero line, turning bearish. Moving averages are bearishly aligned and diverging downward. KDJ is weak, with K below D. Volume is up 1.8x.
════════════════════
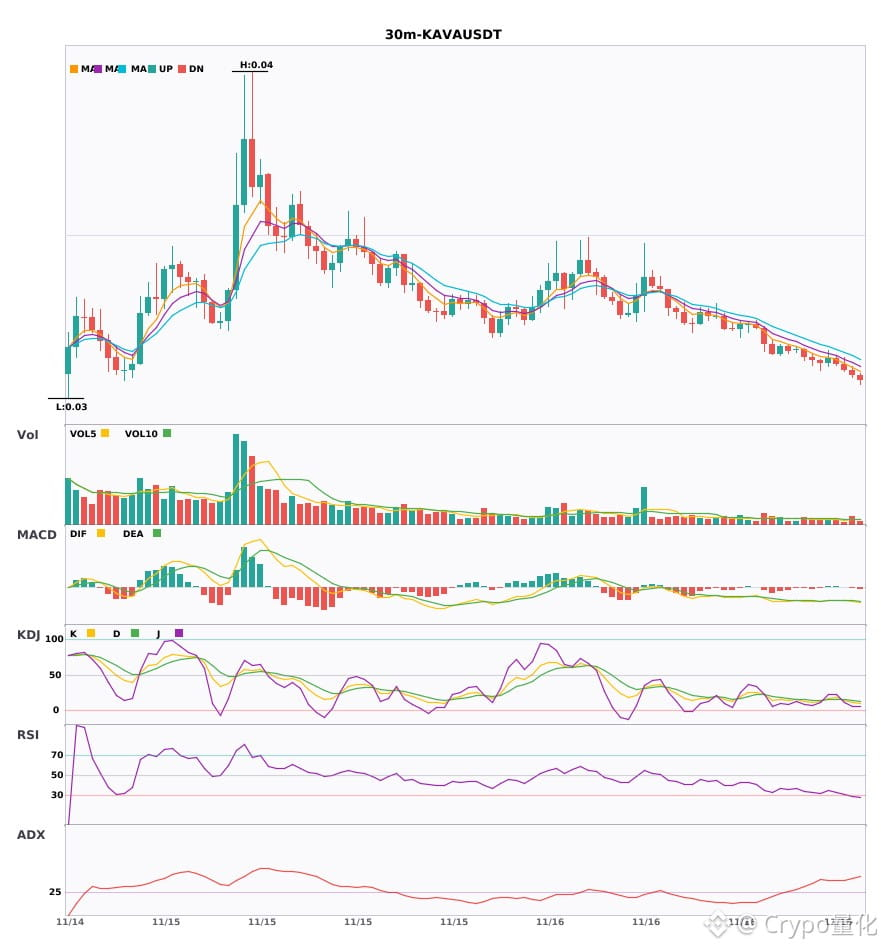
🟢 $KAVA 30-minute bearish signal
⚠️Technical analysis: Strong trend (ADX 45) | MACD bear cross, with expanding green bars indicating accelerating bearish momentum | Moving averages bearishly aligned and heading down | KDJ is in oversold territory; watch for a rebound (K 11.3, D 14) | Volume is up 1.5x
📢Market update: Kava shut down its lending platform after hackers stole nearly $4 million. A November 14 reconstruction showed that freezing the sale proceeds alone would not enable lenders to recover their deposits.
════════════════════
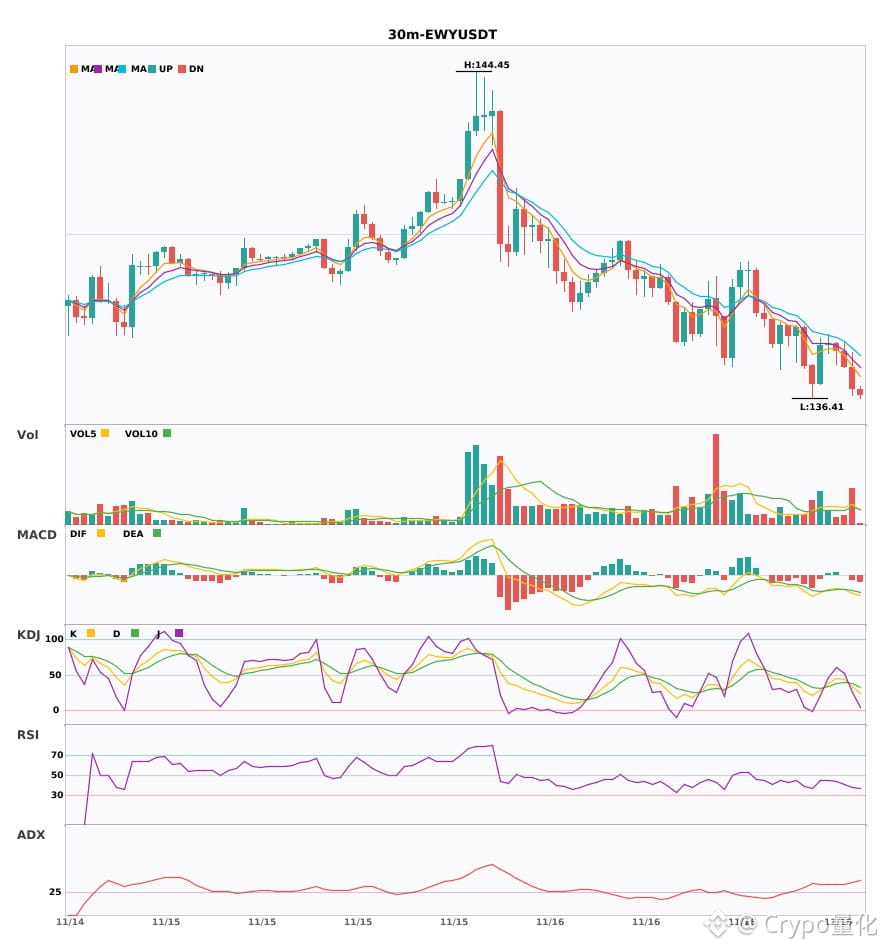
🟢 $EWY 30-minute bearish signal
⚠️Technical analysis: ADX is as high as 38, indicating a very strong trend. MACD has formed a bearish cross below zero, with bearish momentum accelerating. Moving averages are bearishly aligned and diverging downward. KDJ has formed a bear cross but is not yet oversold. Volume is up 2.1x; the short-term outlook remains bearish.
════════════════════
🔔 Follow for first-hand market moves 🔔
#技术分析 #PLAY #KAVA #EWY
📌 When trading, pay attention to whether the candlestick pattern confirms the setup
$PLAY /$KAVA /$EWY 30 minutes: bearish bias, still under pressure in the short term 🔥
════════════════════
🟢 $PLAY 30-minute bearish signal
⚠️Technical analysis: ADX (29) indicates the trend is just getting started, so an entry may be considered. MACD has fallen below the zero line, turning bearish. Moving averages are bearishly aligned and diverging downward. KDJ is weak, with K below D. Volume is up 1.8x.
════════════════════
🟢 $KAVA 30-minute bearish signal
⚠️Technical analysis: Strong trend (ADX 45) | MACD bear cross, with expanding green bars indicating accelerating bearish momentum | Moving averages bearishly aligned and heading down | KDJ is in oversold territory; watch for a rebound (K 11.3, D 14) | Volume is up 1.5x
📢Market update: Kava shut down its lending platform after hackers stole nearly $4 million. A November 14 reconstruction showed that freezing the sale proceeds alone would not enable lenders to recover their deposits.
════════════════════
🟢 $EWY 30-minute bearish signal
⚠️Technical analysis: ADX is as high as 38, indicating a very strong trend. MACD has formed a bearish cross below zero, with bearish momentum accelerating. Moving averages are bearishly aligned and diverging downward. KDJ has formed a bear cross but is not yet oversold. Volume is up 2.1x; the short-term outlook remains bearish.
════════════════════
🔔 Follow for first-hand market moves 🔔
#技术分析 #PLAY #KAVA #EWY
📌 When trading, pay attention to whether the candlestick pattern confirms the setup
════════════════════
🟢 $PLAY 30-minute bearish signal
⚠️Technical analysis: ADX (29) indicates the trend is just getting started, so an entry may be considered. MACD has fallen below the zero line, turning bearish. Moving averages are bearishly aligned and diverging downward. KDJ is weak, with K below D. Volume is up 1.8x.
════════════════════
🟢 $KAVA 30-minute bearish signal
⚠️Technical analysis: Strong trend (ADX 45) | MACD bear cross, with expanding green bars indicating accelerating bearish momentum | Moving averages bearishly aligned and heading down | KDJ is in oversold territory; watch for a rebound (K 11.3, D 14) | Volume is up 1.5x
📢Market update: Kava shut down its lending platform after hackers stole nearly $4 million. A November 14 reconstruction showed that freezing the sale proceeds alone would not enable lenders to recover their deposits.
════════════════════
🟢 $EWY 30-minute bearish signal
⚠️Technical analysis: ADX is as high as 38, indicating a very strong trend. MACD has formed a bearish cross below zero, with bearish momentum accelerating. Moving averages are bearishly aligned and diverging downward. KDJ has formed a bear cross but is not yet oversold. Volume is up 2.1x; the short-term outlook remains bearish.
════════════════════
🔔 Follow for first-hand market moves 🔔
#技术分析 #PLAY #KAVA #EWY
📌 When trading, pay attention to whether the candlestick pattern confirms the setup
16
·
--
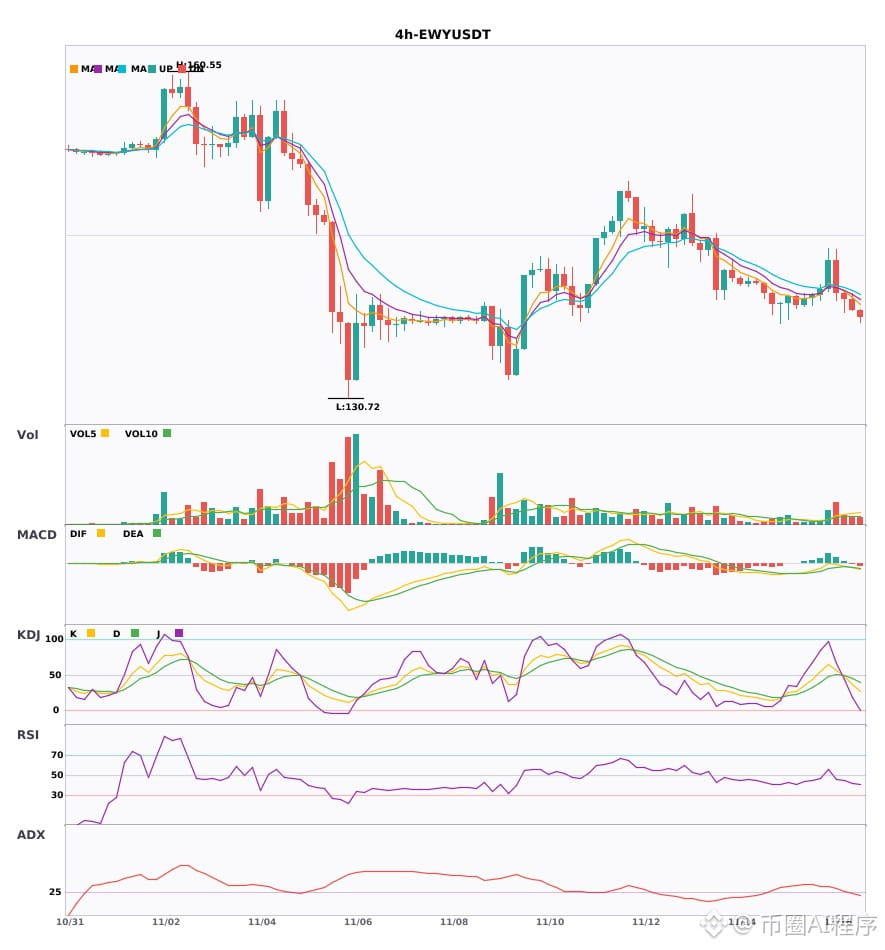
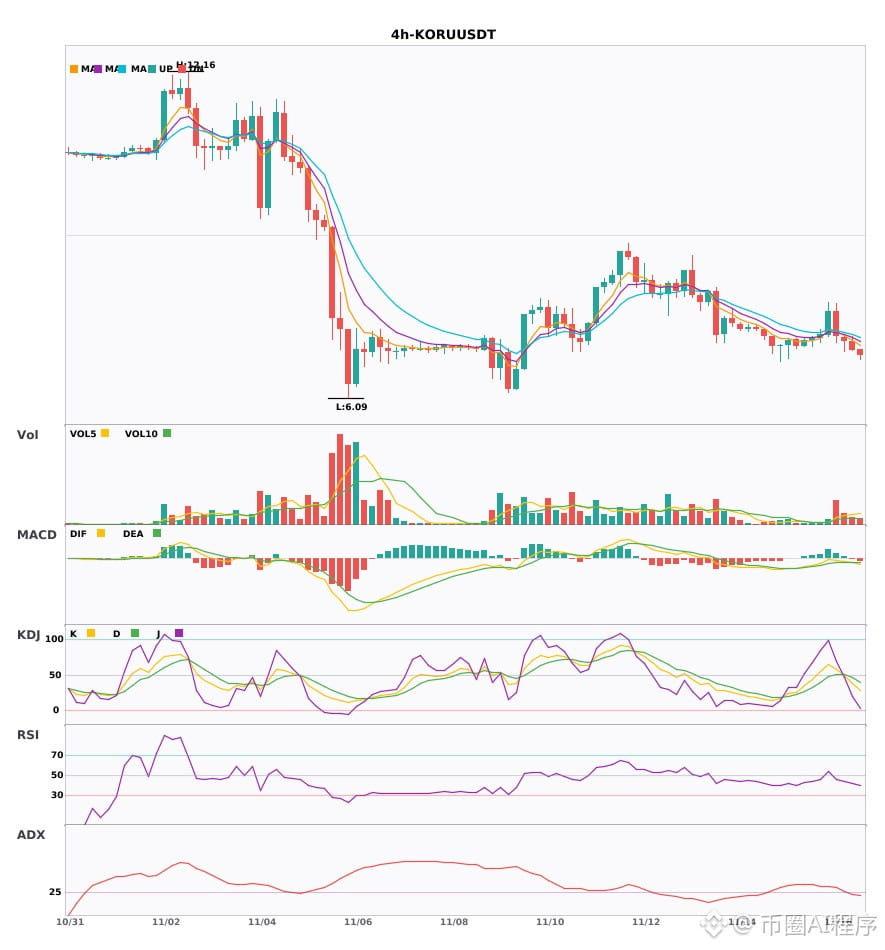
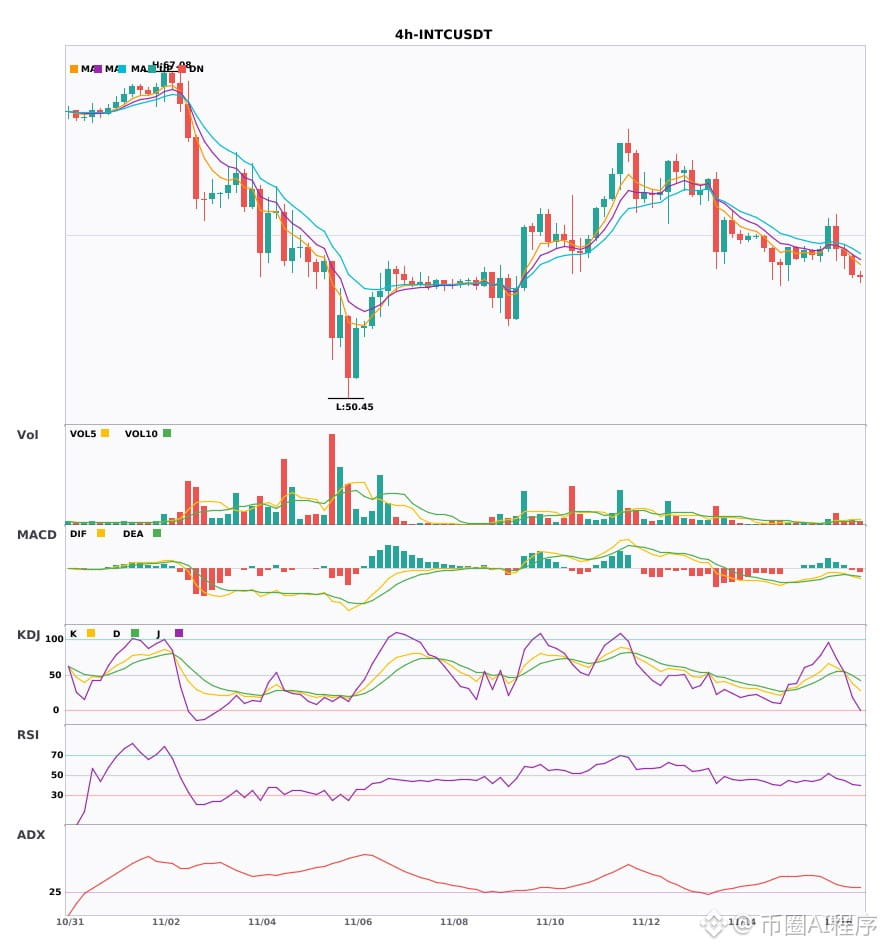
$EWY/$KORU/$INTC 4-hour short signal, daily chart bearish 🔥
════════════════════
🟢 $EWY 4-hour short signal
⚠️ Technical analysis: The 4-hour short signal is confirmed by daily-chart confluence! The MACD bearish crossover below zero is accelerating, moving averages are bearishly aligned and diverging downward, and the KDJ is weak but not oversold. Volume is rising moderately.
════════════════════
🟢 $KORU 4-hour short signal
⚠️ Technical analysis: Bearish confluence on the 4-hour and daily charts is confirmed. The MACD bearish crossover's green bars continue to expand, moving averages are bearishly aligned and diverging downward, and the weak KDJ shows K crossing below D without being oversold. Volume is up 1.9x. Bearish confluence favors a short position.
════════════════════
🟢 $INTC 4-hour short signal
⚠️ Technical analysis: Daily-chart bearish confluence is confirmed. 4-hour entry: the MACD bearish crossover below zero is accelerating, moving averages are bearishly aligned and trending downward, and the weak KDJ shows K at 38.7 crossing below D at 49.1 without being oversold. Volume is normal.
════════════════════
🔔 Follow for first-hand market updates 🔔
#多周期共振 #EWY #KORU #INTC
📌 When trading, pay attention to whether the candlestick pattern meets the criteria.
$EWY /$KORU /$INTC 4-hour short signal, daily chart bearish 🔥
════════════════════
🟢 $EWY 4-hour short signal
⚠️ Technical analysis: The 4-hour short signal is confirmed by daily-chart confluence! The MACD bearish crossover below zero is accelerating, moving averages are bearishly aligned and diverging downward, and the KDJ is weak but not oversold. Volume is rising moderately.
════════════════════
🟢 $KORU 4-hour short signal
⚠️ Technical analysis: Bearish confluence on the 4-hour and daily charts is confirmed. The MACD bearish crossover's green bars continue to expand, moving averages are bearishly aligned and diverging downward, and the weak KDJ shows K crossing below D without being oversold. Volume is up 1.9x. Bearish confluence favors a short position.
════════════════════
🟢 $INTC 4-hour short signal
⚠️ Technical analysis: Daily-chart bearish confluence is confirmed. 4-hour entry: the MACD bearish crossover below zero is accelerating, moving averages are bearishly aligned and trending downward, and the weak KDJ shows K at 38.7 crossing below D at 49.1 without being oversold. Volume is normal.
════════════════════
🔔 Follow for first-hand market updates 🔔
#多周期共振 #EWY #KORU #INTC
📌 When trading, pay attention to whether the candlestick pattern meets the criteria.
════════════════════
🟢 $EWY 4-hour short signal
⚠️ Technical analysis: The 4-hour short signal is confirmed by daily-chart confluence! The MACD bearish crossover below zero is accelerating, moving averages are bearishly aligned and diverging downward, and the KDJ is weak but not oversold. Volume is rising moderately.
════════════════════
🟢 $KORU 4-hour short signal
⚠️ Technical analysis: Bearish confluence on the 4-hour and daily charts is confirmed. The MACD bearish crossover's green bars continue to expand, moving averages are bearishly aligned and diverging downward, and the weak KDJ shows K crossing below D without being oversold. Volume is up 1.9x. Bearish confluence favors a short position.
════════════════════
🟢 $INTC 4-hour short signal
⚠️ Technical analysis: Daily-chart bearish confluence is confirmed. 4-hour entry: the MACD bearish crossover below zero is accelerating, moving averages are bearishly aligned and trending downward, and the weak KDJ shows K at 38.7 crossing below D at 49.1 without being oversold. Volume is normal.
════════════════════
🔔 Follow for first-hand market updates 🔔
#多周期共振 #EWY #KORU #INTC
📌 When trading, pay attention to whether the candlestick pattern meets the criteria.
12
·
--
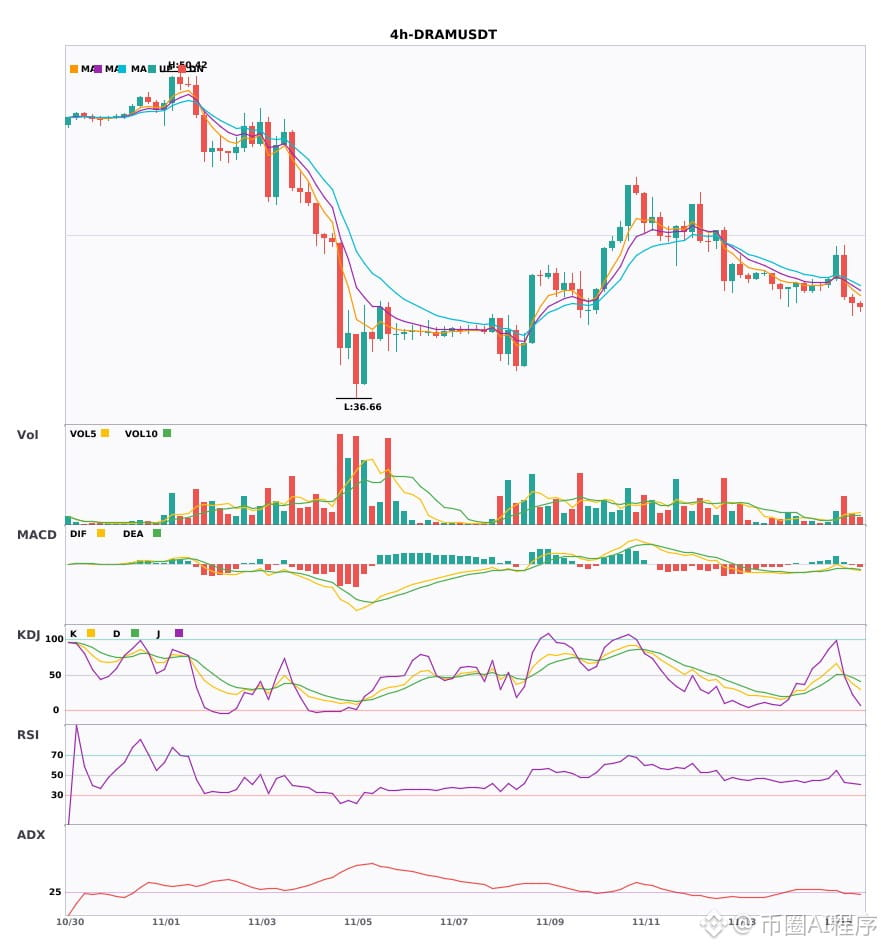
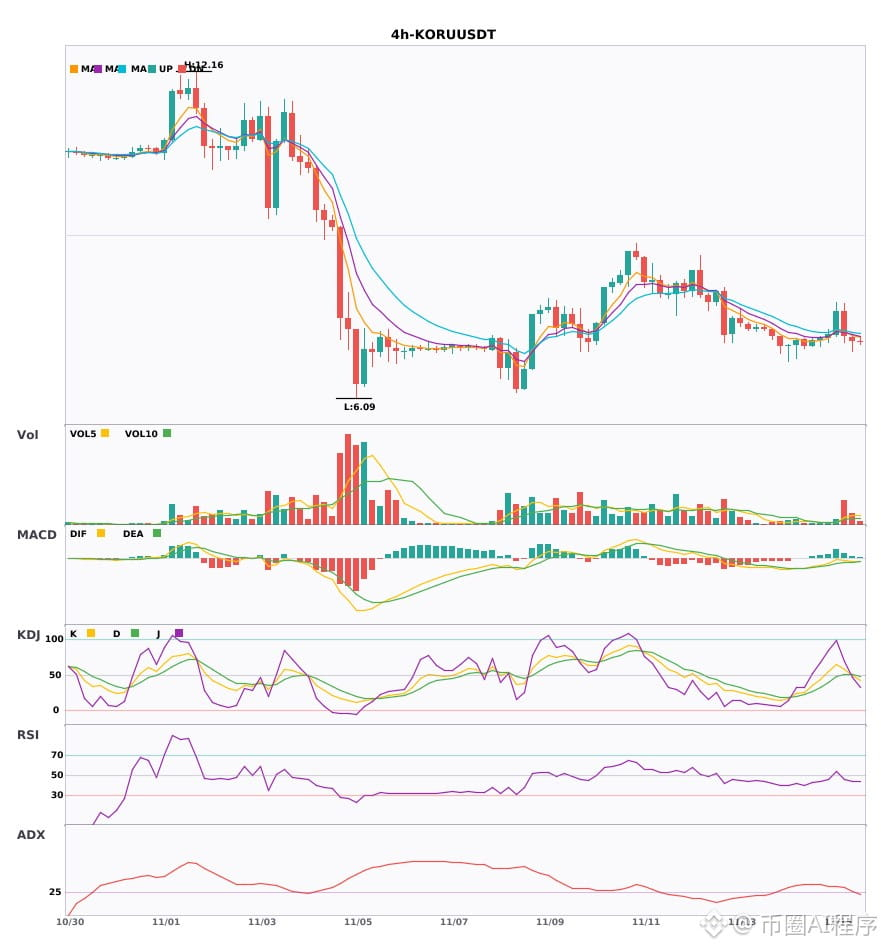
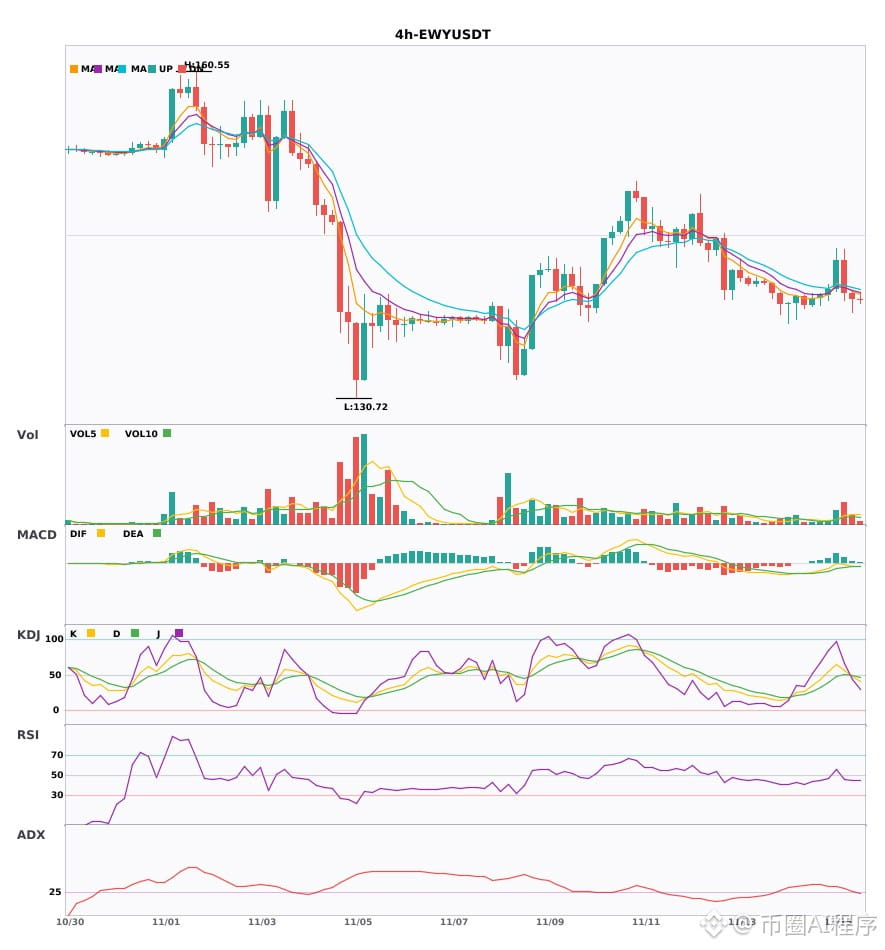
4-hour and daily charts are both weakening $DRAM $KORU $EWY Bearish confluence🔥
════════════════════
🟢 $DRAM 4-hour bearish signal
⚠️Technical analysis: 4-hour entry, confirmed by bearish confluence on the daily chart! MACD bearish crossover, with expanding green bars; moving averages in bearish alignment; KDJ trending weakly; volume up 3.3x.
📢Market update: A judge allowed a market manipulation lawsuit involving DRAM against Samsung, SK Hynix, and Micron to proceed. The case may intensify industry scrutiny, affecting the market landscape and investor confidence.
════════════════════
🟢 $KORU 4-hour bearish signal
⚠️Technical analysis: Multi-timeframe confluence for a short position! Bearish daily trend + 4-hour entry confirmed by confluence. On the 4-hour chart, EMA5 has just crossed below EMA8; KDJ has formed a bearish crossover, with K below D; volume is up 4.6x. Short-term outlook is bearish.
════════════════════
🟢 $EWY 4-hour bearish signal
⚠️Technical analysis: Bearish confluence confirmed on the daily and 4-hour charts! On the 4-hour chart, EMA5 has just crossed below EMA8; KDJ has formed a bearish crossover but is not oversold; volume has surged 3x.
════════════════════
🔔 Follow for first-hand market alerts 🔔
#多周期共振 #DRAM #KORU #EWY
📌 When trading, pay attention to whether the candlestick pattern meets the criteria
4-hour and daily charts are both weakening $DRAM $KORU $EWY Bearish confluence🔥
════════════════════
🟢 $DRAM 4-hour bearish signal
⚠️Technical analysis: 4-hour entry, confirmed by bearish confluence on the daily chart! MACD bearish crossover, with expanding green bars; moving averages in bearish alignment; KDJ trending weakly; volume up 3.3x.
📢Market update: A judge allowed a market manipulation lawsuit involving DRAM against Samsung, SK Hynix, and Micron to proceed. The case may intensify industry scrutiny, affecting the market landscape and investor confidence.
════════════════════
🟢 $KORU 4-hour bearish signal
⚠️Technical analysis: Multi-timeframe confluence for a short position! Bearish daily trend + 4-hour entry confirmed by confluence. On the 4-hour chart, EMA5 has just crossed below EMA8; KDJ has formed a bearish crossover, with K below D; volume is up 4.6x. Short-term outlook is bearish.
════════════════════
🟢 $EWY 4-hour bearish signal
⚠️Technical analysis: Bearish confluence confirmed on the daily and 4-hour charts! On the 4-hour chart, EMA5 has just crossed below EMA8; KDJ has formed a bearish crossover but is not oversold; volume has surged 3x.
════════════════════
🔔 Follow for first-hand market alerts 🔔
#多周期共振 #DRAM #KORU #EWY
📌 When trading, pay attention to whether the candlestick pattern meets the criteria
════════════════════
🟢 $DRAM 4-hour bearish signal
⚠️Technical analysis: 4-hour entry, confirmed by bearish confluence on the daily chart! MACD bearish crossover, with expanding green bars; moving averages in bearish alignment; KDJ trending weakly; volume up 3.3x.
📢Market update: A judge allowed a market manipulation lawsuit involving DRAM against Samsung, SK Hynix, and Micron to proceed. The case may intensify industry scrutiny, affecting the market landscape and investor confidence.
════════════════════
🟢 $KORU 4-hour bearish signal
⚠️Technical analysis: Multi-timeframe confluence for a short position! Bearish daily trend + 4-hour entry confirmed by confluence. On the 4-hour chart, EMA5 has just crossed below EMA8; KDJ has formed a bearish crossover, with K below D; volume is up 4.6x. Short-term outlook is bearish.
════════════════════
🟢 $EWY 4-hour bearish signal
⚠️Technical analysis: Bearish confluence confirmed on the daily and 4-hour charts! On the 4-hour chart, EMA5 has just crossed below EMA8; KDJ has formed a bearish crossover but is not oversold; volume has surged 3x.
════════════════════
🔔 Follow for first-hand market alerts 🔔
#多周期共振 #DRAM #KORU #EWY
📌 When trading, pay attention to whether the candlestick pattern meets the criteria
6
·
--
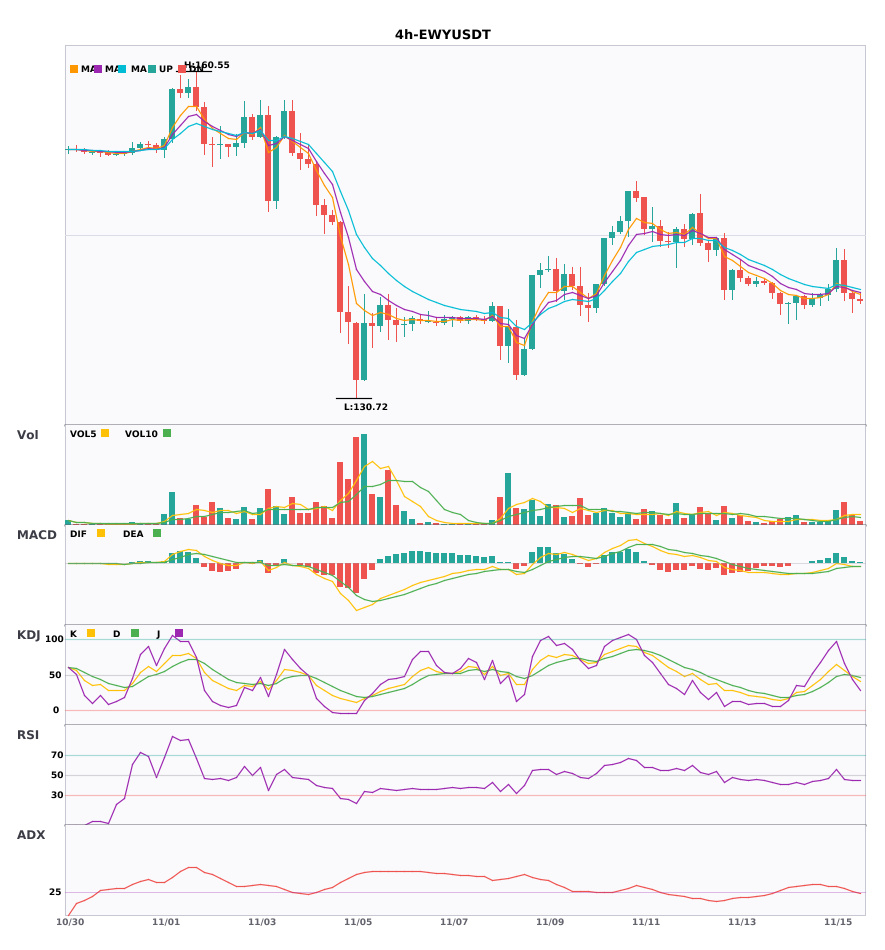
$EWY 4-hour and daily charts are moving in the same bearish direction. Multi-timeframe confluence favors shorting with the trend 🔥
════════════════════
🟢 $EWY 4-hour bearish signal
⚠️ Technical analysis: Daily bearish trend confirmed by 4-hour confluence! EMA5 crosses below EMA8, KDJ death cross (K47.8, D49.8), trading volume rises 3x—short-term outlook is bearish.
════════════════════
🔔 Follow for first-hand market updates 🔔
#多周期共振 #EWY
📌 When trading, pay attention to whether the candlestick pattern aligns
$EWY 4-hour and daily charts are moving in the same bearish direction. Multi-timeframe confluence favors shorting with the trend 🔥
════════════════════
🟢 $EWY 4-hour bearish signal
⚠️ Technical analysis: Daily bearish trend confirmed by 4-hour confluence! EMA5 crosses below EMA8, KDJ death cross (K47.8, D49.8), trading volume rises 3x—short-term outlook is bearish.
════════════════════
🔔 Follow for first-hand market updates 🔔
#多周期共振 #EWY
📌 When trading, pay attention to whether the candlestick pattern aligns
════════════════════
🟢 $EWY 4-hour bearish signal
⚠️ Technical analysis: Daily bearish trend confirmed by 4-hour confluence! EMA5 crosses below EMA8, KDJ death cross (K47.8, D49.8), trading volume rises 3x—short-term outlook is bearish.
════════════════════
🔔 Follow for first-hand market updates 🔔
#多周期共振 #EWY
📌 When trading, pay attention to whether the candlestick pattern aligns
2
·
--
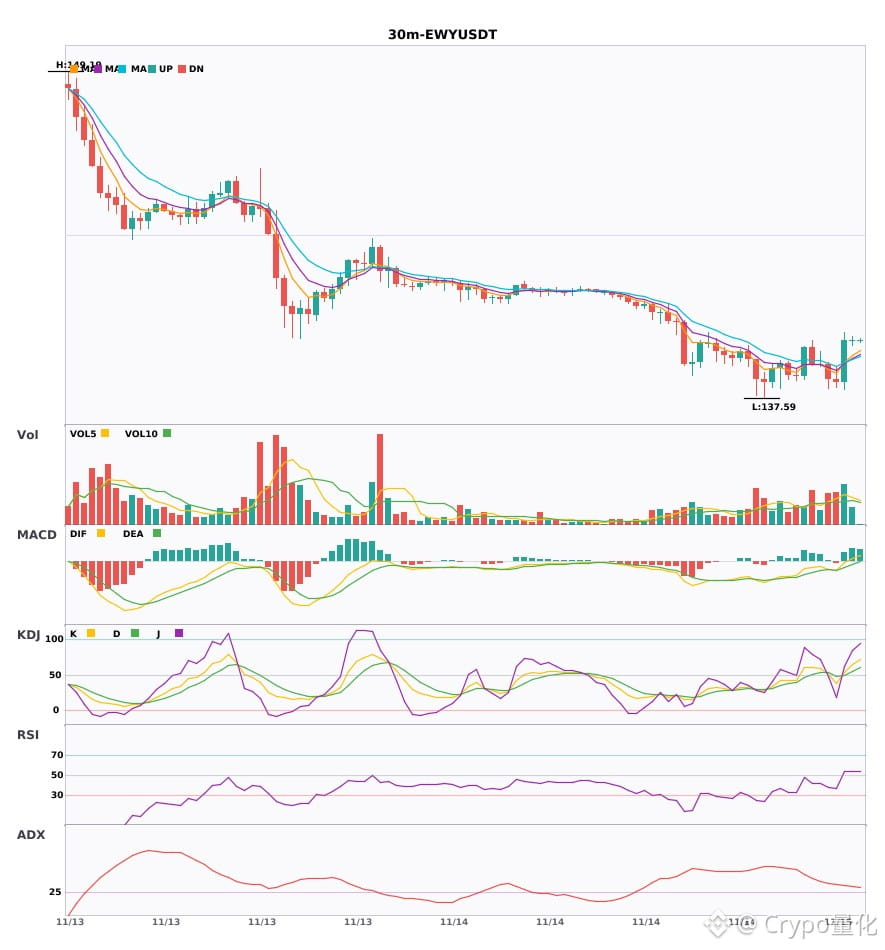
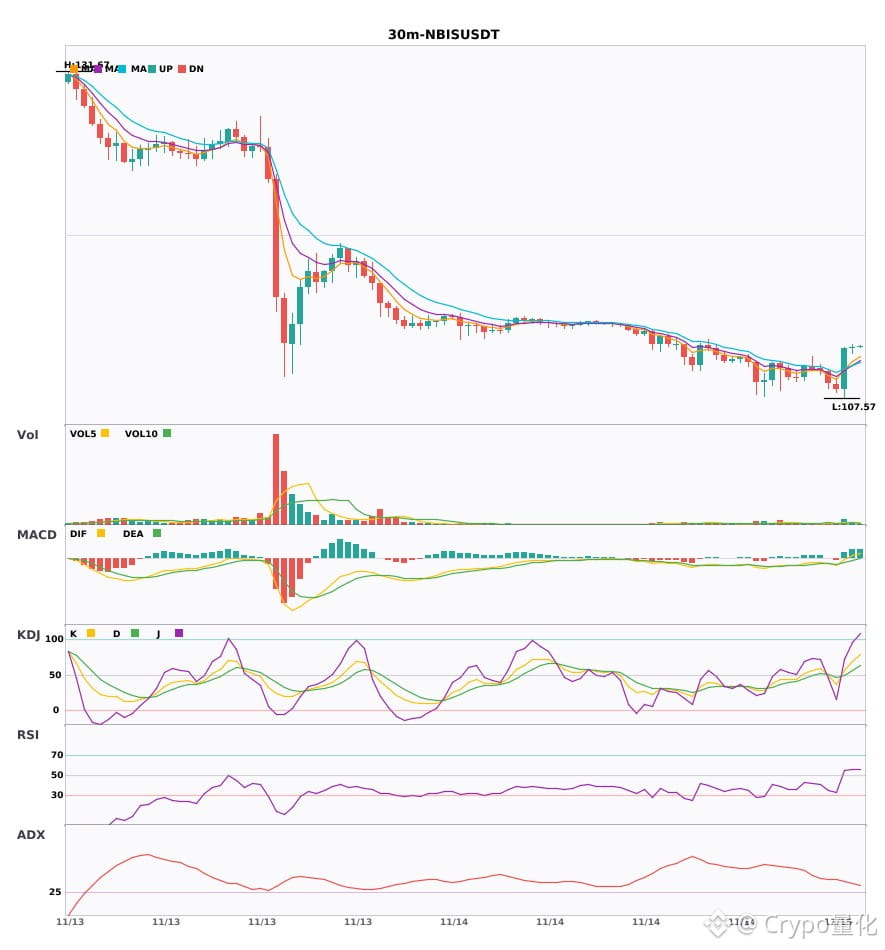
$EWY/$NBIS/$MOVR 30-minute golden-cross confluence—let’s all go long 🔥
════════════════════
🔴 $EWY 30-minute bullish signal
⚠️ Technical analysis: ADX is at 32, indicating a fairly clear trend. After the MACD golden cross, volume increased and DIF surged above the zero line, turning bullish. The moving averages have just formed a bullish alignment and are diverging upward. In KDJ, K crossed above D and hasn’t entered overbought territory yet (K64.7 D54.9). Volume has risen to 1.7x.
════════════════════
🔴 $NBIS 30-minute bullish signal
⚠️ Technical analysis: The trend is very clear. The MACD golden cross is above the zero line, the moving averages have just formed a bullish alignment and are diverging, and in KDJ, K crossed above D but isn’t overbought yet. Volume has increased 2.5x.
════════════════════
🔴 $MOVR 30-minute bullish signal
⚠️ Technical analysis: ADX at 38 indicates a clear trend. After the MACD golden cross, volume increased and it moved above the zero line. The moving averages are bullishly aligned and diverging upward. KDJ is strong but not overbought, and volume has increased 1.5x.
════════════════════
🔔 Follow for breaking market updates 🔔
#技术分析 #EWY #NBIS #MOVR
📌 When trading, pay attention to whether the candlestick pattern confirms the setup.
$EWY /$NBIS /$MOVR 30-minute golden-cross confluence—let’s all go long 🔥
════════════════════
🔴 $EWY 30-minute bullish signal
⚠️ Technical analysis: ADX is at 32, indicating a fairly clear trend. After the MACD golden cross, volume increased and DIF surged above the zero line, turning bullish. The moving averages have just formed a bullish alignment and are diverging upward. In KDJ, K crossed above D and hasn’t entered overbought territory yet (K64.7 D54.9). Volume has risen to 1.7x.
════════════════════
🔴 $NBIS 30-minute bullish signal
⚠️ Technical analysis: The trend is very clear. The MACD golden cross is above the zero line, the moving averages have just formed a bullish alignment and are diverging, and in KDJ, K crossed above D but isn’t overbought yet. Volume has increased 2.5x.
════════════════════
🔴 $MOVR 30-minute bullish signal
⚠️ Technical analysis: ADX at 38 indicates a clear trend. After the MACD golden cross, volume increased and it moved above the zero line. The moving averages are bullishly aligned and diverging upward. KDJ is strong but not overbought, and volume has increased 1.5x.
════════════════════
🔔 Follow for breaking market updates 🔔
#技术分析 #EWY #NBIS #MOVR
📌 When trading, pay attention to whether the candlestick pattern confirms the setup.
════════════════════
🔴 $EWY 30-minute bullish signal
⚠️ Technical analysis: ADX is at 32, indicating a fairly clear trend. After the MACD golden cross, volume increased and DIF surged above the zero line, turning bullish. The moving averages have just formed a bullish alignment and are diverging upward. In KDJ, K crossed above D and hasn’t entered overbought territory yet (K64.7 D54.9). Volume has risen to 1.7x.
════════════════════
🔴 $NBIS 30-minute bullish signal
⚠️ Technical analysis: The trend is very clear. The MACD golden cross is above the zero line, the moving averages have just formed a bullish alignment and are diverging, and in KDJ, K crossed above D but isn’t overbought yet. Volume has increased 2.5x.
════════════════════
🔴 $MOVR 30-minute bullish signal
⚠️ Technical analysis: ADX at 38 indicates a clear trend. After the MACD golden cross, volume increased and it moved above the zero line. The moving averages are bullishly aligned and diverging upward. KDJ is strong but not overbought, and volume has increased 1.5x.
════════════════════
🔔 Follow for breaking market updates 🔔
#技术分析 #EWY #NBIS #MOVR
📌 When trading, pay attention to whether the candlestick pattern confirms the setup.
13

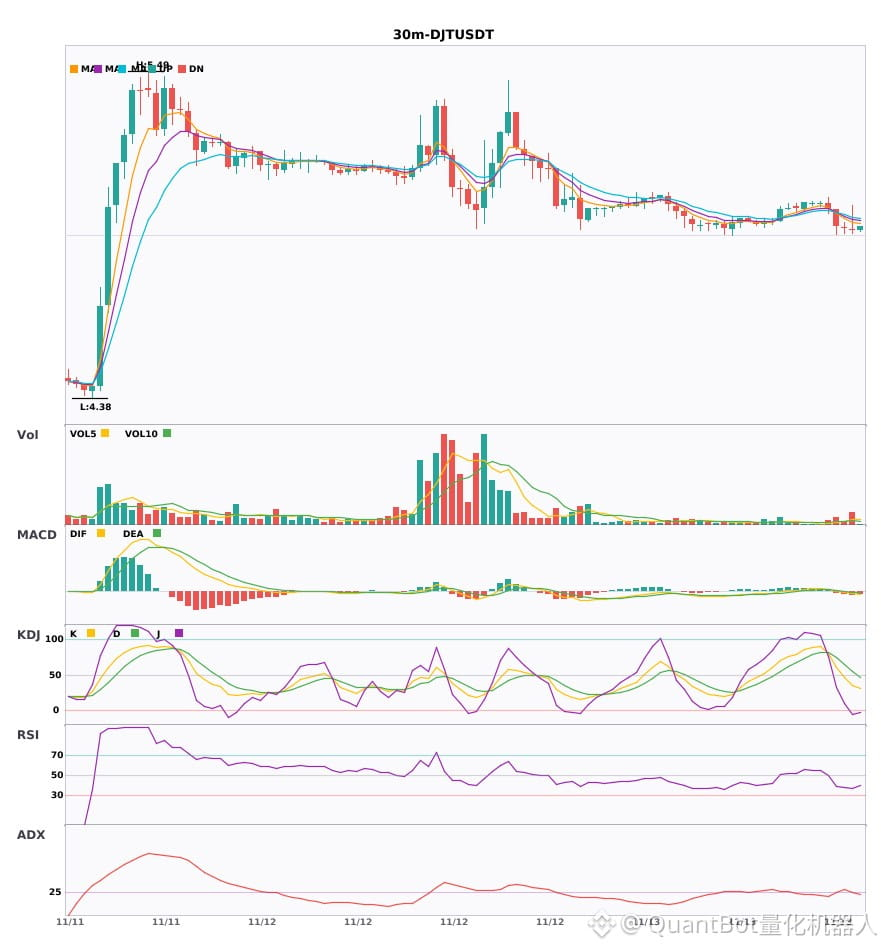
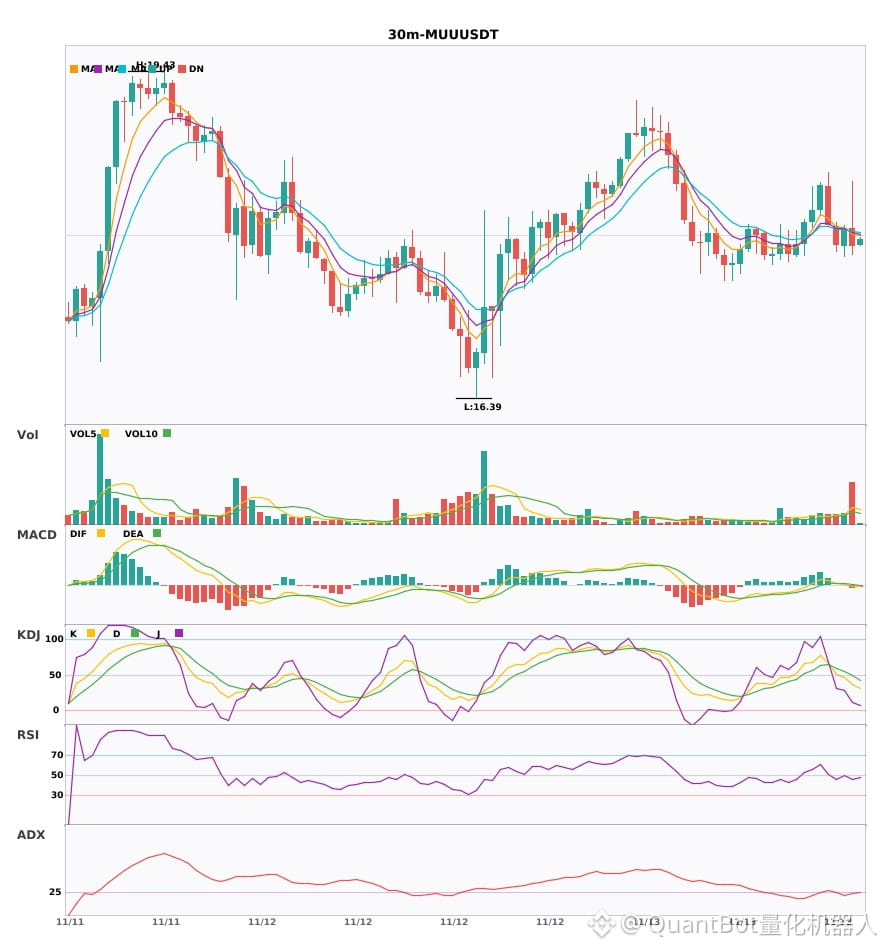
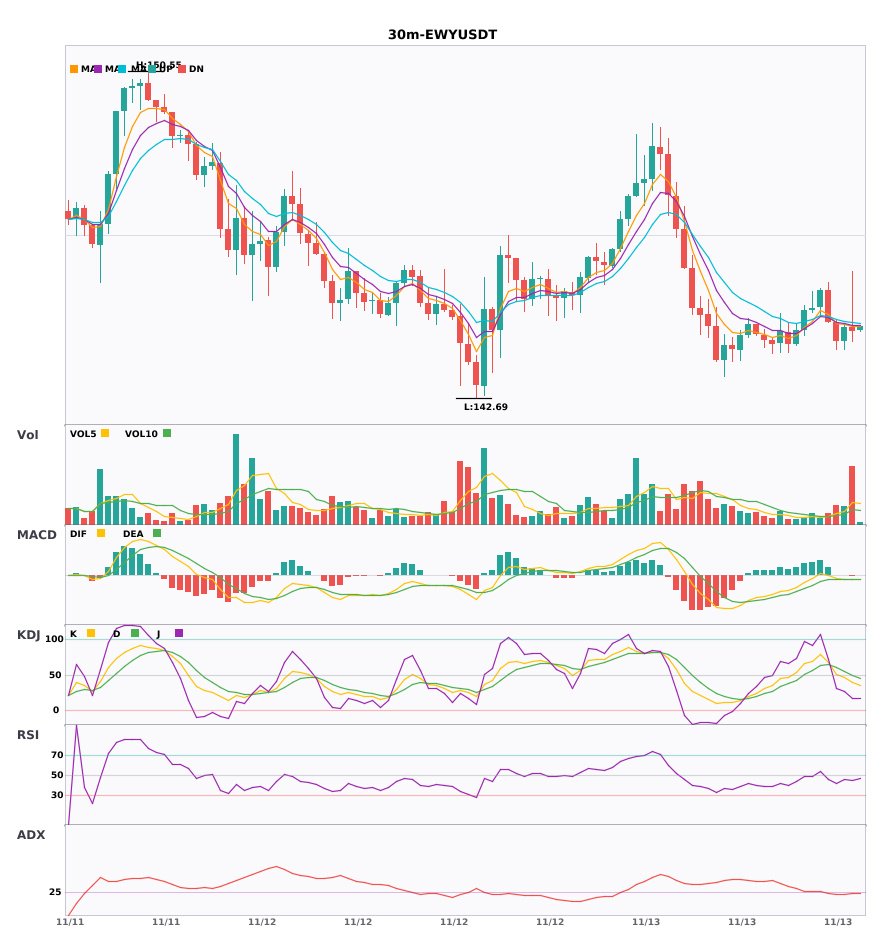
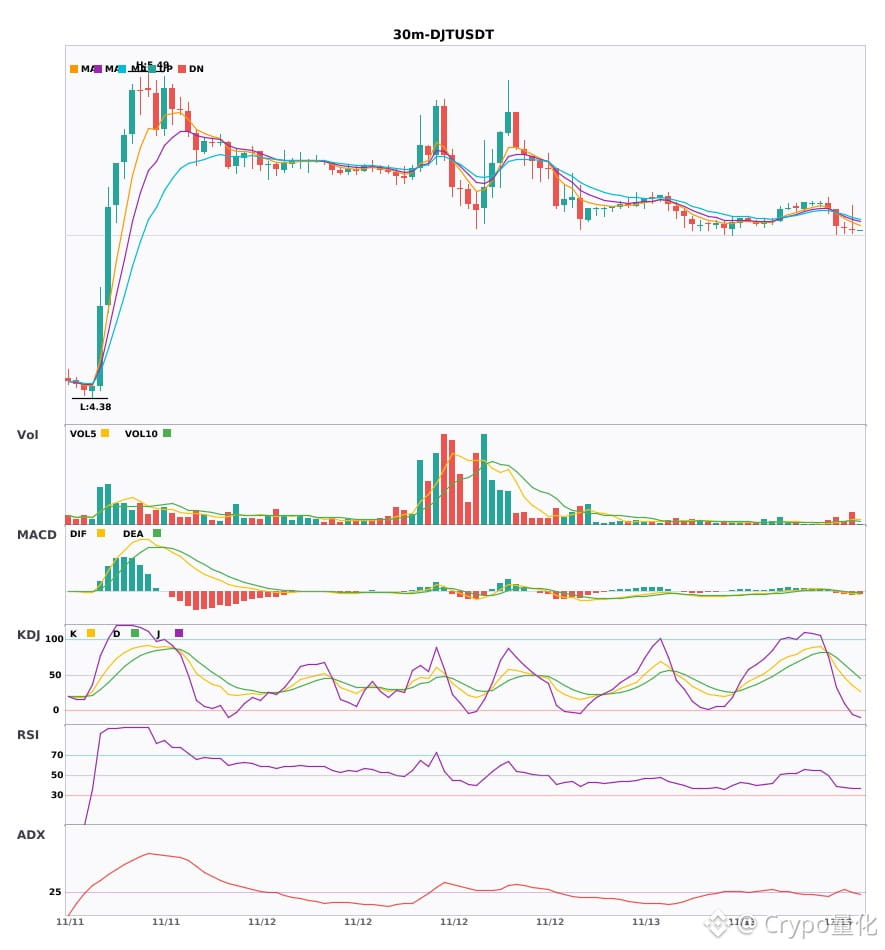
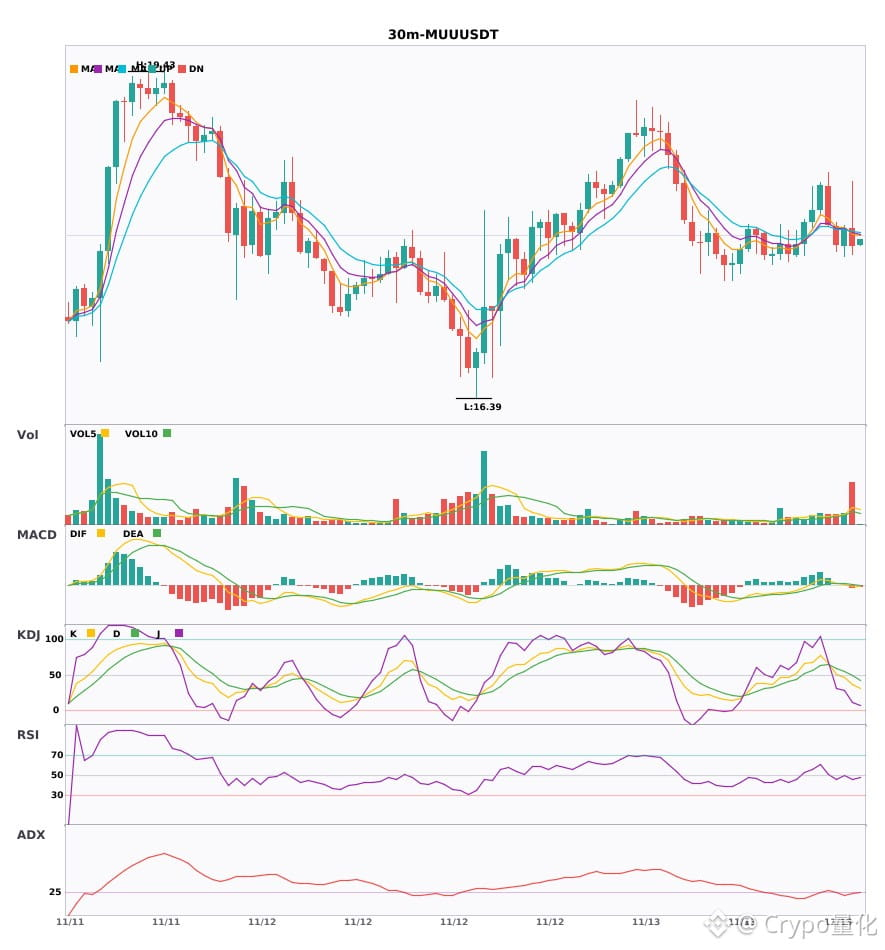
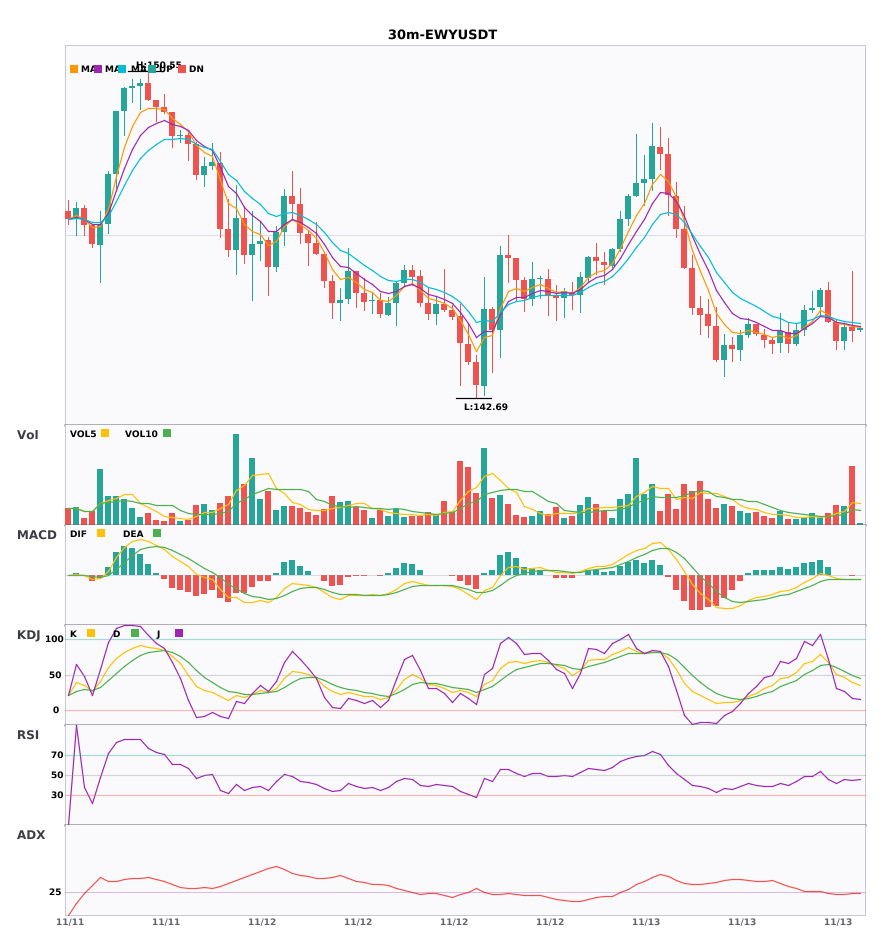
30-Minute Bearish Alert Signals: $DJT/$MUU/$EWY
📉 $DJT | 30-minute bearish signal
━━━━━━━━━━━━━━━━━━
Technical analysis: ADX(33) confirms a significant trend; MACD is bear-dominated, with strengthening momentum; EMA5<EMA8<EMA13 form a bearish alignment; volume has increased 2.4x.
Price change: -0.0400%
📉 $MUU | 30-minute bearish signal
━━━━━━━━━━━━━━━━━━
Technical analysis: ADX(26) confirms the trend; consider entering | MACD DIF breaks below the zero line, signaling a bearish reversal | EMA5 falls below EMA8, indicating a short-term bearish bias | KDJ is weak, with bears in control (K36.3/D48.8) | Volume has increased 3.2x
Price change: -0.9500%
📉 $EWY | 30-minute bearish signal
━━━━━━━━━━━━━━━━━━
Technical analysis: ADX(25) indicates the trend is taking shape and may be worth trading; MACD bearish crossover below zero accelerates the downward momentum; EMA5/8/13 form a bearish alignment; KDJ is weak (K39.1,D49.9); volume has increased 3.7x.
Price change: -0.0700%
━━━━━━━━━━━━━━━━━━
#技术分析 #DJT #MUU #EWY
📌 The above content is for reference only and does not constitute investment advice
30-Minute Bearish Alert Signals: $DJT /$MUU /$EWY
📉 $DJT | 30-minute bearish signal
━━━━━━━━━━━━━━━━━━
Technical analysis: ADX(33) confirms a significant trend; MACD is bear-dominated, with strengthening momentum; EMA5<EMA8<EMA13 form a bearish alignment; volume has increased 2.4x.
Price change: -0.0400%
📉 $MUU | 30-minute bearish signal
━━━━━━━━━━━━━━━━━━
Technical analysis: ADX(26) confirms the trend; consider entering | MACD DIF breaks below the zero line, signaling a bearish reversal | EMA5 falls below EMA8, indicating a short-term bearish bias | KDJ is weak, with bears in control (K36.3/D48.8) | Volume has increased 3.2x
Price change: -0.9500%
📉 $EWY | 30-minute bearish signal
━━━━━━━━━━━━━━━━━━
Technical analysis: ADX(25) indicates the trend is taking shape and may be worth trading; MACD bearish crossover below zero accelerates the downward momentum; EMA5/8/13 form a bearish alignment; KDJ is weak (K39.1,D49.9); volume has increased 3.7x.
Price change: -0.0700%
━━━━━━━━━━━━━━━━━━
#技术分析 #DJT #MUU #EWY
📌 The above content is for reference only and does not constitute investment advice
📉 $DJT | 30-minute bearish signal
━━━━━━━━━━━━━━━━━━
Technical analysis: ADX(33) confirms a significant trend; MACD is bear-dominated, with strengthening momentum; EMA5<EMA8<EMA13 form a bearish alignment; volume has increased 2.4x.
Price change: -0.0400%
📉 $MUU | 30-minute bearish signal
━━━━━━━━━━━━━━━━━━
Technical analysis: ADX(26) confirms the trend; consider entering | MACD DIF breaks below the zero line, signaling a bearish reversal | EMA5 falls below EMA8, indicating a short-term bearish bias | KDJ is weak, with bears in control (K36.3/D48.8) | Volume has increased 3.2x
Price change: -0.9500%
📉 $EWY | 30-minute bearish signal
━━━━━━━━━━━━━━━━━━
Technical analysis: ADX(25) indicates the trend is taking shape and may be worth trading; MACD bearish crossover below zero accelerates the downward momentum; EMA5/8/13 form a bearish alignment; KDJ is weak (K39.1,D49.9); volume has increased 3.7x.
Price change: -0.0700%
━━━━━━━━━━━━━━━━━━
#技术分析 #DJT #MUU #EWY
📌 The above content is for reference only and does not constitute investment advice
11
·
--
$DJT/$MUU/$EWY 30-minute signals have all turned bearish, with bearish signals emerging simultaneously 🔥
════════════════════
🟢 $DJT 30-minute bearish signal
⚠️Technical analysis: ADX is at 33, indicating a fairly clear trend, but MACD is bearish and the green bars are still growing. The moving averages have just formed a bearish alignment and are trending downward. Trading volume is up 2.4x; overall, the outlook is weak.
════════════════════
🟢 $MUU 30-minute bearish signal
⚠️Technical analysis: The ADX trend is just starting to develop, so it may be worth following. MACD has crossed below the zero line and turned bearish. The moving averages have formed a death cross, signaling short-term weakness. KDJ favors the bears and is not yet oversold. Trading volume is up 3.2x.
════════════════════
🟢 $EWY 30-minute bearish signal
⚠️Technical analysis: The ADX trend has just formed, so there may be an opportunity to participate. MACD has formed a death cross below zero, with bearish momentum accelerating. The bearish moving-average alignment is applying downward pressure. KDJ's K line is below its D line, signaling weakness and favoring the bears. Trading volume has surged to 3.7x.
════════════════════
🔔 Follow for the latest market moves 🔔
#技术分析 #DJT #MUU #EWY
📌 When trading, pay attention to whether the candlestick pattern confirms the signal
$DJT /$MUU /$EWY 30-minute signals have all turned bearish, with bearish signals emerging simultaneously 🔥
════════════════════
🟢 $DJT 30-minute bearish signal
⚠️Technical analysis: ADX is at 33, indicating a fairly clear trend, but MACD is bearish and the green bars are still growing. The moving averages have just formed a bearish alignment and are trending downward. Trading volume is up 2.4x; overall, the outlook is weak.
════════════════════
🟢 $MUU 30-minute bearish signal
⚠️Technical analysis: The ADX trend is just starting to develop, so it may be worth following. MACD has crossed below the zero line and turned bearish. The moving averages have formed a death cross, signaling short-term weakness. KDJ favors the bears and is not yet oversold. Trading volume is up 3.2x.
════════════════════
🟢 $EWY 30-minute bearish signal
⚠️Technical analysis: The ADX trend has just formed, so there may be an opportunity to participate. MACD has formed a death cross below zero, with bearish momentum accelerating. The bearish moving-average alignment is applying downward pressure. KDJ's K line is below its D line, signaling weakness and favoring the bears. Trading volume has surged to 3.7x.
════════════════════
🔔 Follow for the latest market moves 🔔
#技术分析 #DJT #MUU #EWY
📌 When trading, pay attention to whether the candlestick pattern confirms the signal
════════════════════
🟢 $DJT 30-minute bearish signal
⚠️Technical analysis: ADX is at 33, indicating a fairly clear trend, but MACD is bearish and the green bars are still growing. The moving averages have just formed a bearish alignment and are trending downward. Trading volume is up 2.4x; overall, the outlook is weak.
════════════════════
🟢 $MUU 30-minute bearish signal
⚠️Technical analysis: The ADX trend is just starting to develop, so it may be worth following. MACD has crossed below the zero line and turned bearish. The moving averages have formed a death cross, signaling short-term weakness. KDJ favors the bears and is not yet oversold. Trading volume is up 3.2x.
════════════════════
🟢 $EWY 30-minute bearish signal
⚠️Technical analysis: The ADX trend has just formed, so there may be an opportunity to participate. MACD has formed a death cross below zero, with bearish momentum accelerating. The bearish moving-average alignment is applying downward pressure. KDJ's K line is below its D line, signaling weakness and favoring the bears. Trading volume has surged to 3.7x.
════════════════════
🔔 Follow for the latest market moves 🔔
#技术分析 #DJT #MUU #EWY
📌 When trading, pay attention to whether the candlestick pattern confirms the signal
7
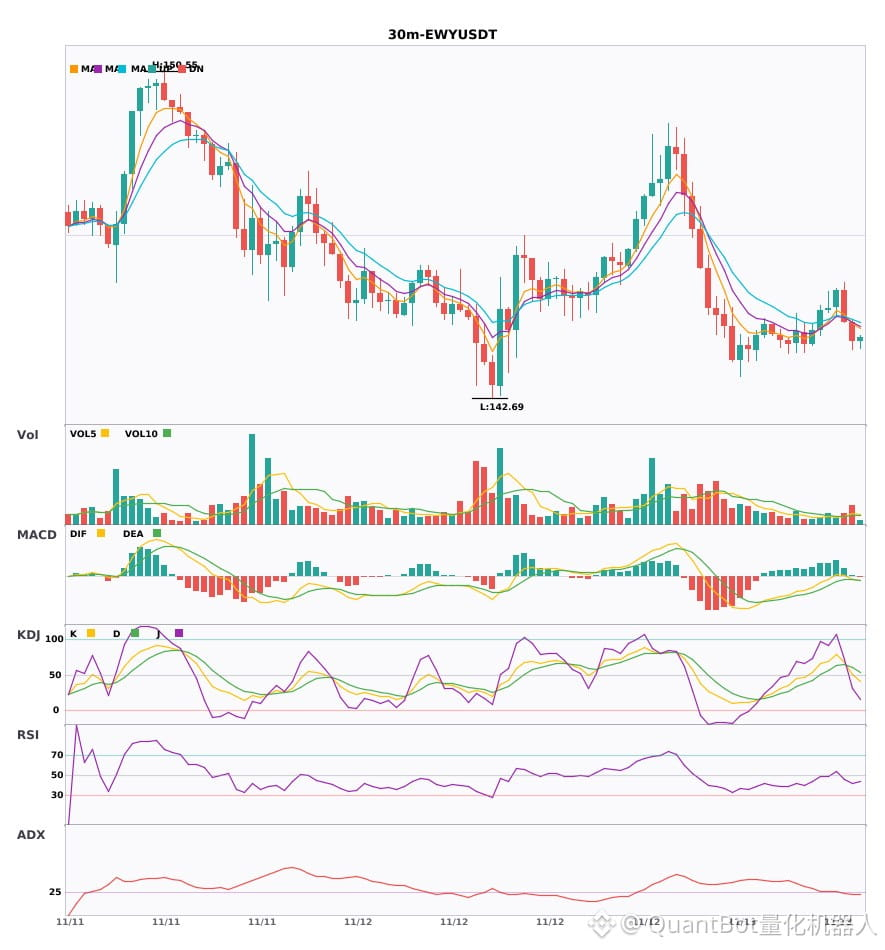
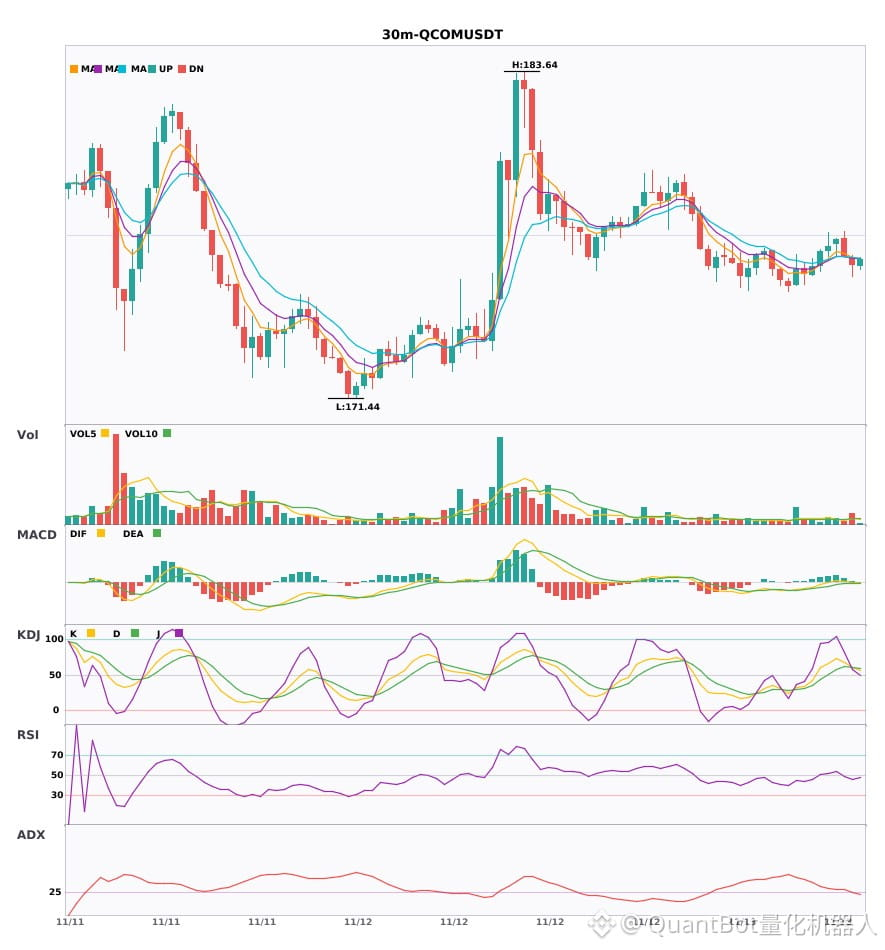
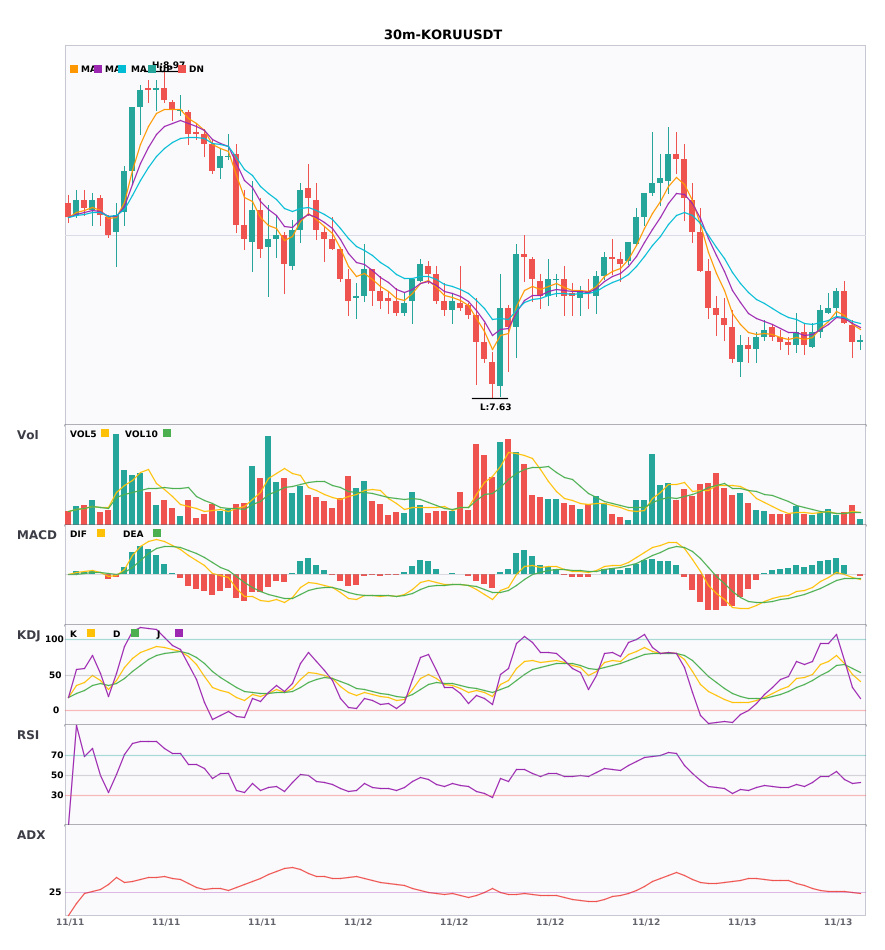
$EWY/$QCOM/$KORU 30-minute three-asset confluence bearish signal
📉 $EWY | 30-minute bearish signal
━━━━━━━━━━━━━━━━━━
Technical analysis: ADX(25) trend forming; MACD DIF<0; EMA5<EMA8; KDJ bearish crossover at 50.5/60.0; volume 2x, bearish bias
Price change: -0.3100%
📉 $QCOM | 30-minute bearish signal
━━━━━━━━━━━━━━━━━━
Technical analysis: ADX(27) trend forming, potential entry; MACD DIF crosses below zero, medium-term outlook turns bearish; moving averages converging, direction undetermined; KDJ bearish crossover (59.9/61.0), short-term bearish bias; volume up 1.8x.
Price change: -0.1800%
📉 $KORU | 30-minute bearish signal
━━━━━━━━━━━━━━━━━━
Technical analysis: ADX(27) indicates a forming trend with potential for entry; MACD DIF falls below zero, trend turns downward; EMA5 crosses below EMA8, bearish on the short timeframe; KDJ forms a bearish crossover (K50.6/D59.5), short-term bearish outlook; trading volume up 1.5x.
Price change: -1.0100%
━━━━━━━━━━━━━━━━━━
#技术分析 #EWY #QCOM #KORU
📌 The above content is for reference only and does not constitute investment advice
$EWY /$QCOM /$KORU 30-minute three-asset confluence bearish signal
📉 $EWY | 30-minute bearish signal
━━━━━━━━━━━━━━━━━━
Technical analysis: ADX(25) trend forming; MACD DIF<0; EMA5<EMA8; KDJ bearish crossover at 50.5/60.0; volume 2x, bearish bias
Price change: -0.3100%
📉 $QCOM | 30-minute bearish signal
━━━━━━━━━━━━━━━━━━
Technical analysis: ADX(27) trend forming, potential entry; MACD DIF crosses below zero, medium-term outlook turns bearish; moving averages converging, direction undetermined; KDJ bearish crossover (59.9/61.0), short-term bearish bias; volume up 1.8x.
Price change: -0.1800%
📉 $KORU | 30-minute bearish signal
━━━━━━━━━━━━━━━━━━
Technical analysis: ADX(27) indicates a forming trend with potential for entry; MACD DIF falls below zero, trend turns downward; EMA5 crosses below EMA8, bearish on the short timeframe; KDJ forms a bearish crossover (K50.6/D59.5), short-term bearish outlook; trading volume up 1.5x.
Price change: -1.0100%
━━━━━━━━━━━━━━━━━━
#技术分析 #EWY #QCOM #KORU
📌 The above content is for reference only and does not constitute investment advice
📉 $EWY | 30-minute bearish signal
━━━━━━━━━━━━━━━━━━
Technical analysis: ADX(25) trend forming; MACD DIF<0; EMA5<EMA8; KDJ bearish crossover at 50.5/60.0; volume 2x, bearish bias
Price change: -0.3100%
📉 $QCOM | 30-minute bearish signal
━━━━━━━━━━━━━━━━━━
Technical analysis: ADX(27) trend forming, potential entry; MACD DIF crosses below zero, medium-term outlook turns bearish; moving averages converging, direction undetermined; KDJ bearish crossover (59.9/61.0), short-term bearish bias; volume up 1.8x.
Price change: -0.1800%
📉 $KORU | 30-minute bearish signal
━━━━━━━━━━━━━━━━━━
Technical analysis: ADX(27) indicates a forming trend with potential for entry; MACD DIF falls below zero, trend turns downward; EMA5 crosses below EMA8, bearish on the short timeframe; KDJ forms a bearish crossover (K50.6/D59.5), short-term bearish outlook; trading volume up 1.5x.
Price change: -1.0100%
━━━━━━━━━━━━━━━━━━
#技术分析 #EWY #QCOM #KORU
📌 The above content is for reference only and does not constitute investment advice
35
·
--
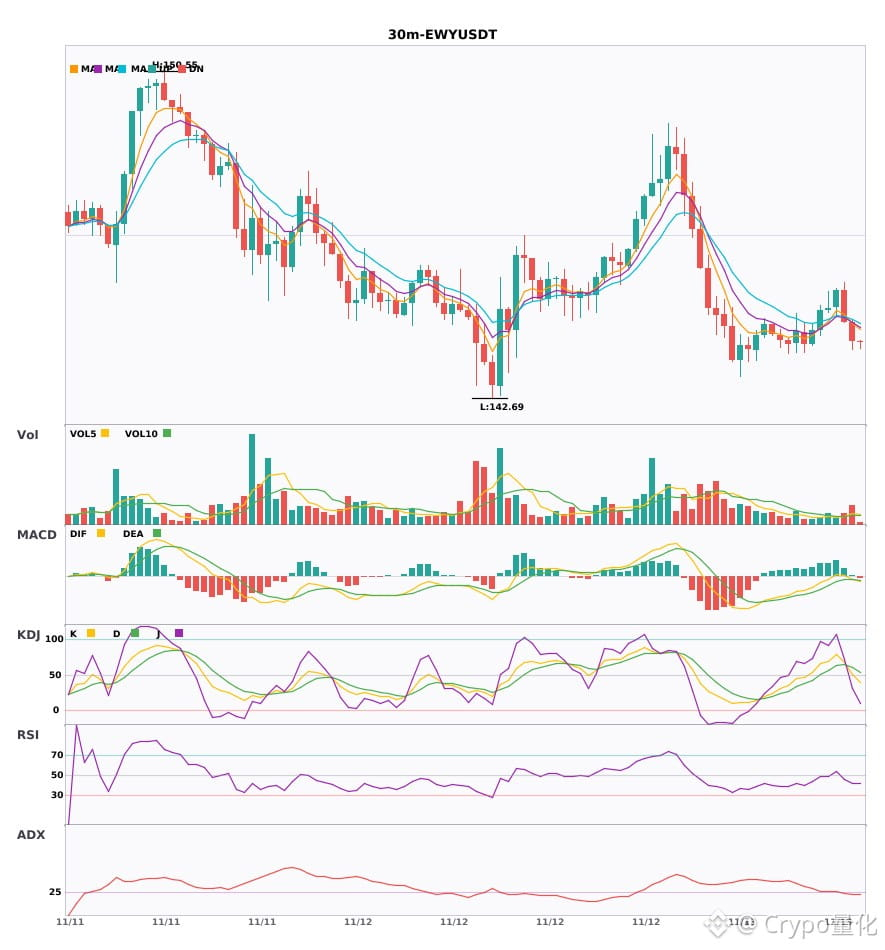
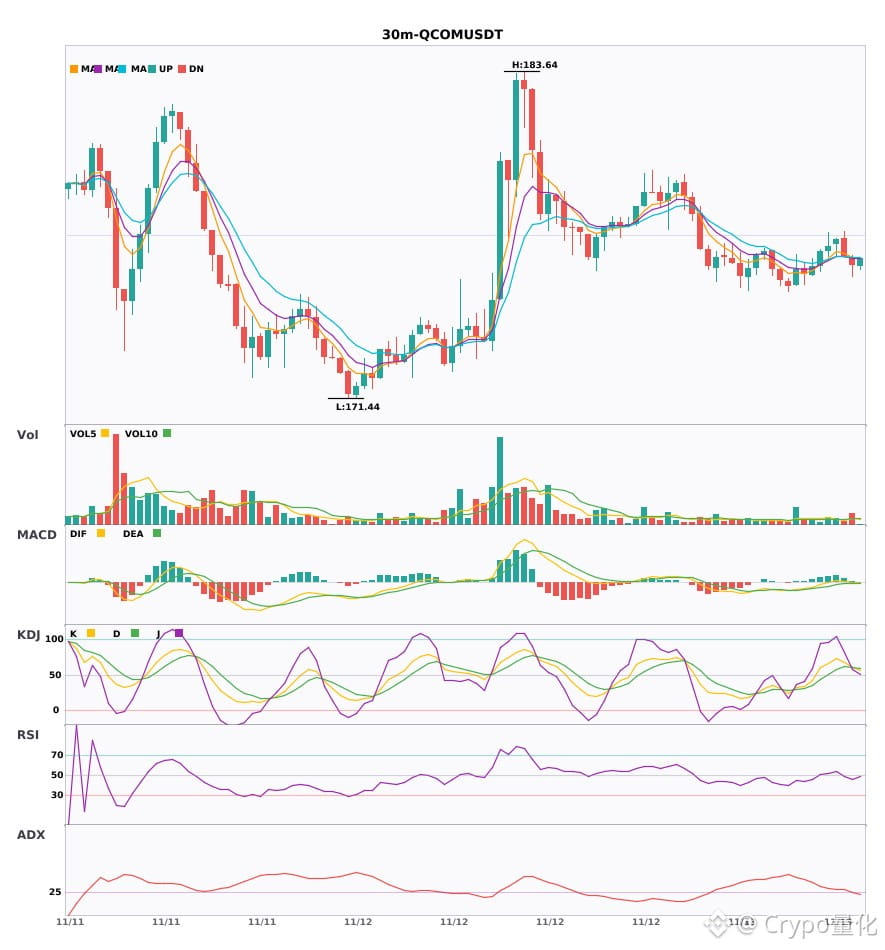
30-minute bearish alert $EWY $QCOM $KORU — pay attention! 🔥
════════════════════
🟢 $EWY 30-minute bearish signal
⚠️Technical analysis: ADX trend has just formed; can follow. MACD has fallen below the zero line, turning bearish. Moving averages have crossed downward. KDJ has crossed downward but isn't oversold; bearish outlook continues. Volume is up 2x.
════════════════════
🟢 $QCOM 30-minute bearish signal
⚠️Technical analysis: ADX 27, trend is just starting and can be followed. MACD has fallen below the zero line, turning bearish. Moving averages are converging, building up for a directional move. KDJ death cross suggests a short-term bearish bias (K59.9 D61.0). Volume is up 1.8x.
════════════════════
🟢 $KORU 30-minute bearish signal
⚠️Technical analysis: ADX 27, trend is just starting and can be followed | MACD has fallen below the zero line, turning bearish | Moving averages have crossed downward; short-term bearish | KDJ death cross, but not yet oversold; bearish outlook (K50.6 D59.5) | Volume is up 1.5x
════════════════════
🔔 Follow for first-hand market alerts 🔔
#技术分析 #EWY #QCOM #KORU
📌 When trading, pay attention to whether the candlestick pattern confirms the signal
30-minute bearish alert $EWY $QCOM $KORU — pay attention! 🔥
════════════════════
🟢 $EWY 30-minute bearish signal
⚠️Technical analysis: ADX trend has just formed; can follow. MACD has fallen below the zero line, turning bearish. Moving averages have crossed downward. KDJ has crossed downward but isn't oversold; bearish outlook continues. Volume is up 2x.
════════════════════
🟢 $QCOM 30-minute bearish signal
⚠️Technical analysis: ADX 27, trend is just starting and can be followed. MACD has fallen below the zero line, turning bearish. Moving averages are converging, building up for a directional move. KDJ death cross suggests a short-term bearish bias (K59.9 D61.0). Volume is up 1.8x.
════════════════════
🟢 $KORU 30-minute bearish signal
⚠️Technical analysis: ADX 27, trend is just starting and can be followed | MACD has fallen below the zero line, turning bearish | Moving averages have crossed downward; short-term bearish | KDJ death cross, but not yet oversold; bearish outlook (K50.6 D59.5) | Volume is up 1.5x
════════════════════
🔔 Follow for first-hand market alerts 🔔
#技术分析 #EWY #QCOM #KORU
📌 When trading, pay attention to whether the candlestick pattern confirms the signal
════════════════════
🟢 $EWY 30-minute bearish signal
⚠️Technical analysis: ADX trend has just formed; can follow. MACD has fallen below the zero line, turning bearish. Moving averages have crossed downward. KDJ has crossed downward but isn't oversold; bearish outlook continues. Volume is up 2x.
════════════════════
🟢 $QCOM 30-minute bearish signal
⚠️Technical analysis: ADX 27, trend is just starting and can be followed. MACD has fallen below the zero line, turning bearish. Moving averages are converging, building up for a directional move. KDJ death cross suggests a short-term bearish bias (K59.9 D61.0). Volume is up 1.8x.
════════════════════
🟢 $KORU 30-minute bearish signal
⚠️Technical analysis: ADX 27, trend is just starting and can be followed | MACD has fallen below the zero line, turning bearish | Moving averages have crossed downward; short-term bearish | KDJ death cross, but not yet oversold; bearish outlook (K50.6 D59.5) | Volume is up 1.5x
════════════════════
🔔 Follow for first-hand market alerts 🔔
#技术分析 #EWY #QCOM #KORU
📌 When trading, pay attention to whether the candlestick pattern confirms the signal
26

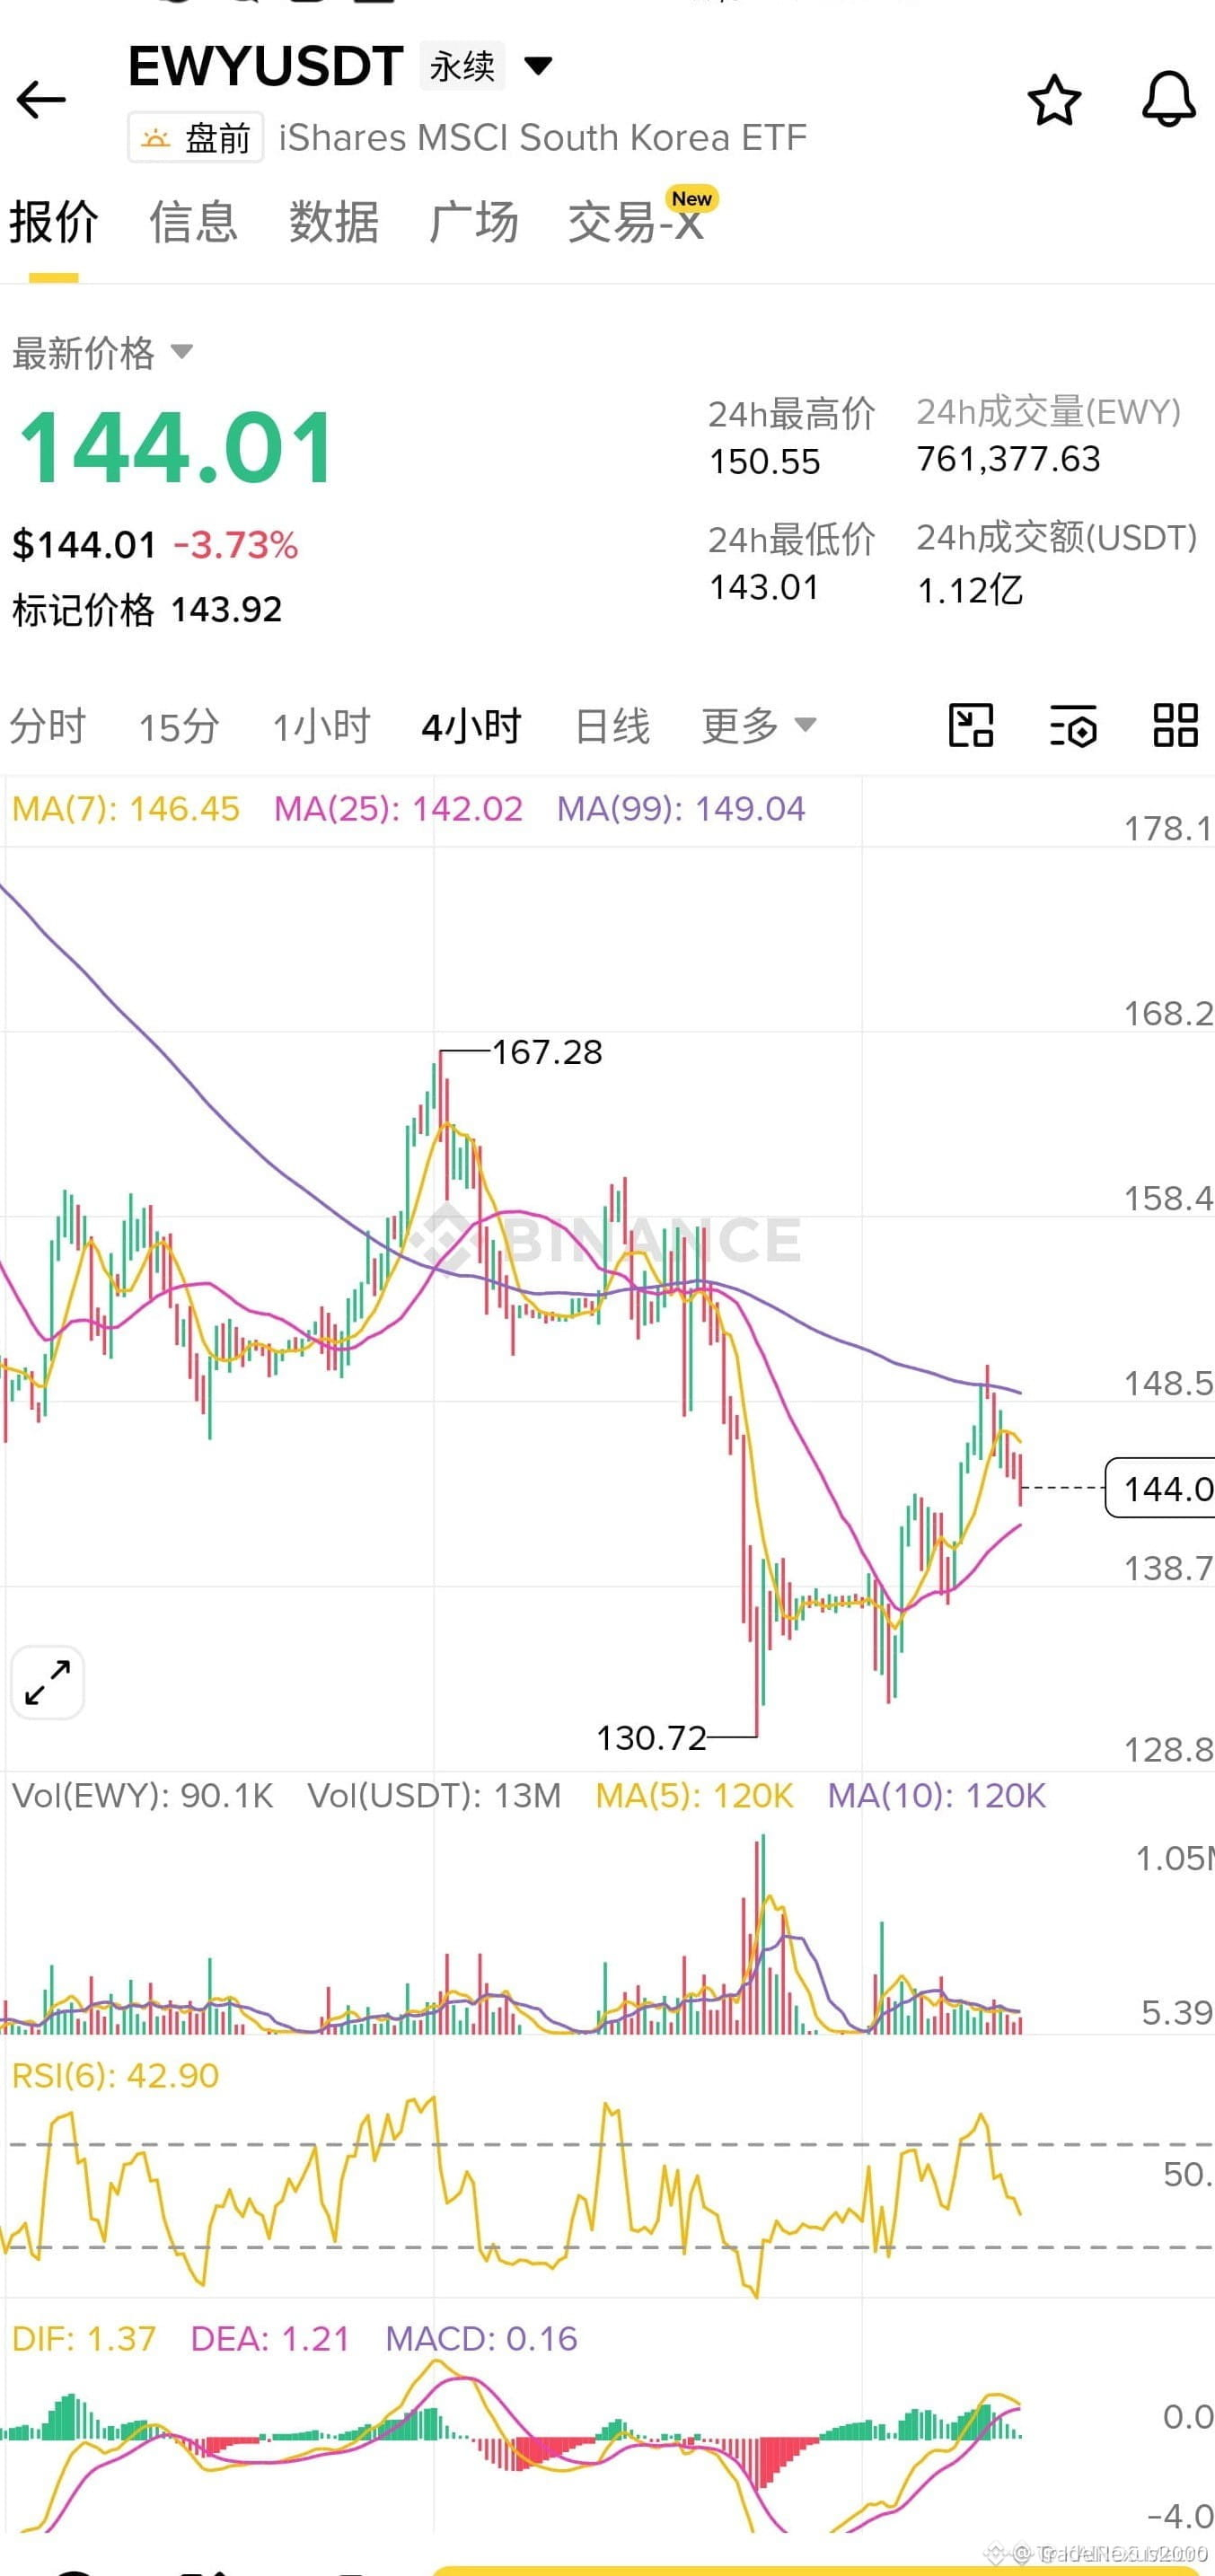
🚨 $EWY DEFENDING KEY SUPPORT AFTER A BRUTAL V-SHAPED LIQUIDITY SWEEP! 💥
Entry: 144.00 ⚡
Target: 150.00 🚀
Stop Loss: 142.00 ⚠️
📊 Price just printed a sharp V-shaped rejection off the 144.00 structural floor, absorbing aggressive sell pressure with institutional precision. ⚡ The order flow shows smart money defending this baseline while psychological tension grips the open market.
Managing risk here is non-negotiable as volatility tests every single conviction level across the board. 💬 Are you positioning for this continuation or waiting for a deeper retest? 👇
⚠️ Not financial advice. Always manage your risk. 🛡️
🏷️ #EWY #LongSetup #OrderBlock #MarketStructure #Crypto
🔥 💎
🚨 $EWY DEFENDING KEY SUPPORT AFTER A BRUTAL V-SHAPED LIQUIDITY SWEEP! 💥
Entry: 144.00 ⚡
Target: 150.00 🚀
Stop Loss: 142.00 ⚠️
📊 Price just printed a sharp V-shaped rejection off the 144.00 structural floor, absorbing aggressive sell pressure with institutional precision. ⚡ The order flow shows smart money defending this baseline while psychological tension grips the open market.
Managing risk here is non-negotiable as volatility tests every single conviction level across the board. 💬 Are you positioning for this continuation or waiting for a deeper retest? 👇
⚠️ Not financial advice. Always manage your risk. 🛡️
🏷️ #EWY #LongSetup #OrderBlock #MarketStructure #Crypto
🔥 💎
Entry: 144.00 ⚡
Target: 150.00 🚀
Stop Loss: 142.00 ⚠️
📊 Price just printed a sharp V-shaped rejection off the 144.00 structural floor, absorbing aggressive sell pressure with institutional precision. ⚡ The order flow shows smart money defending this baseline while psychological tension grips the open market.
Managing risk here is non-negotiable as volatility tests every single conviction level across the board. 💬 Are you positioning for this continuation or waiting for a deeper retest? 👇
⚠️ Not financial advice. Always manage your risk. 🛡️
🏷️ #EWY #LongSetup #OrderBlock #MarketStructure #Crypto
🔥 💎
15

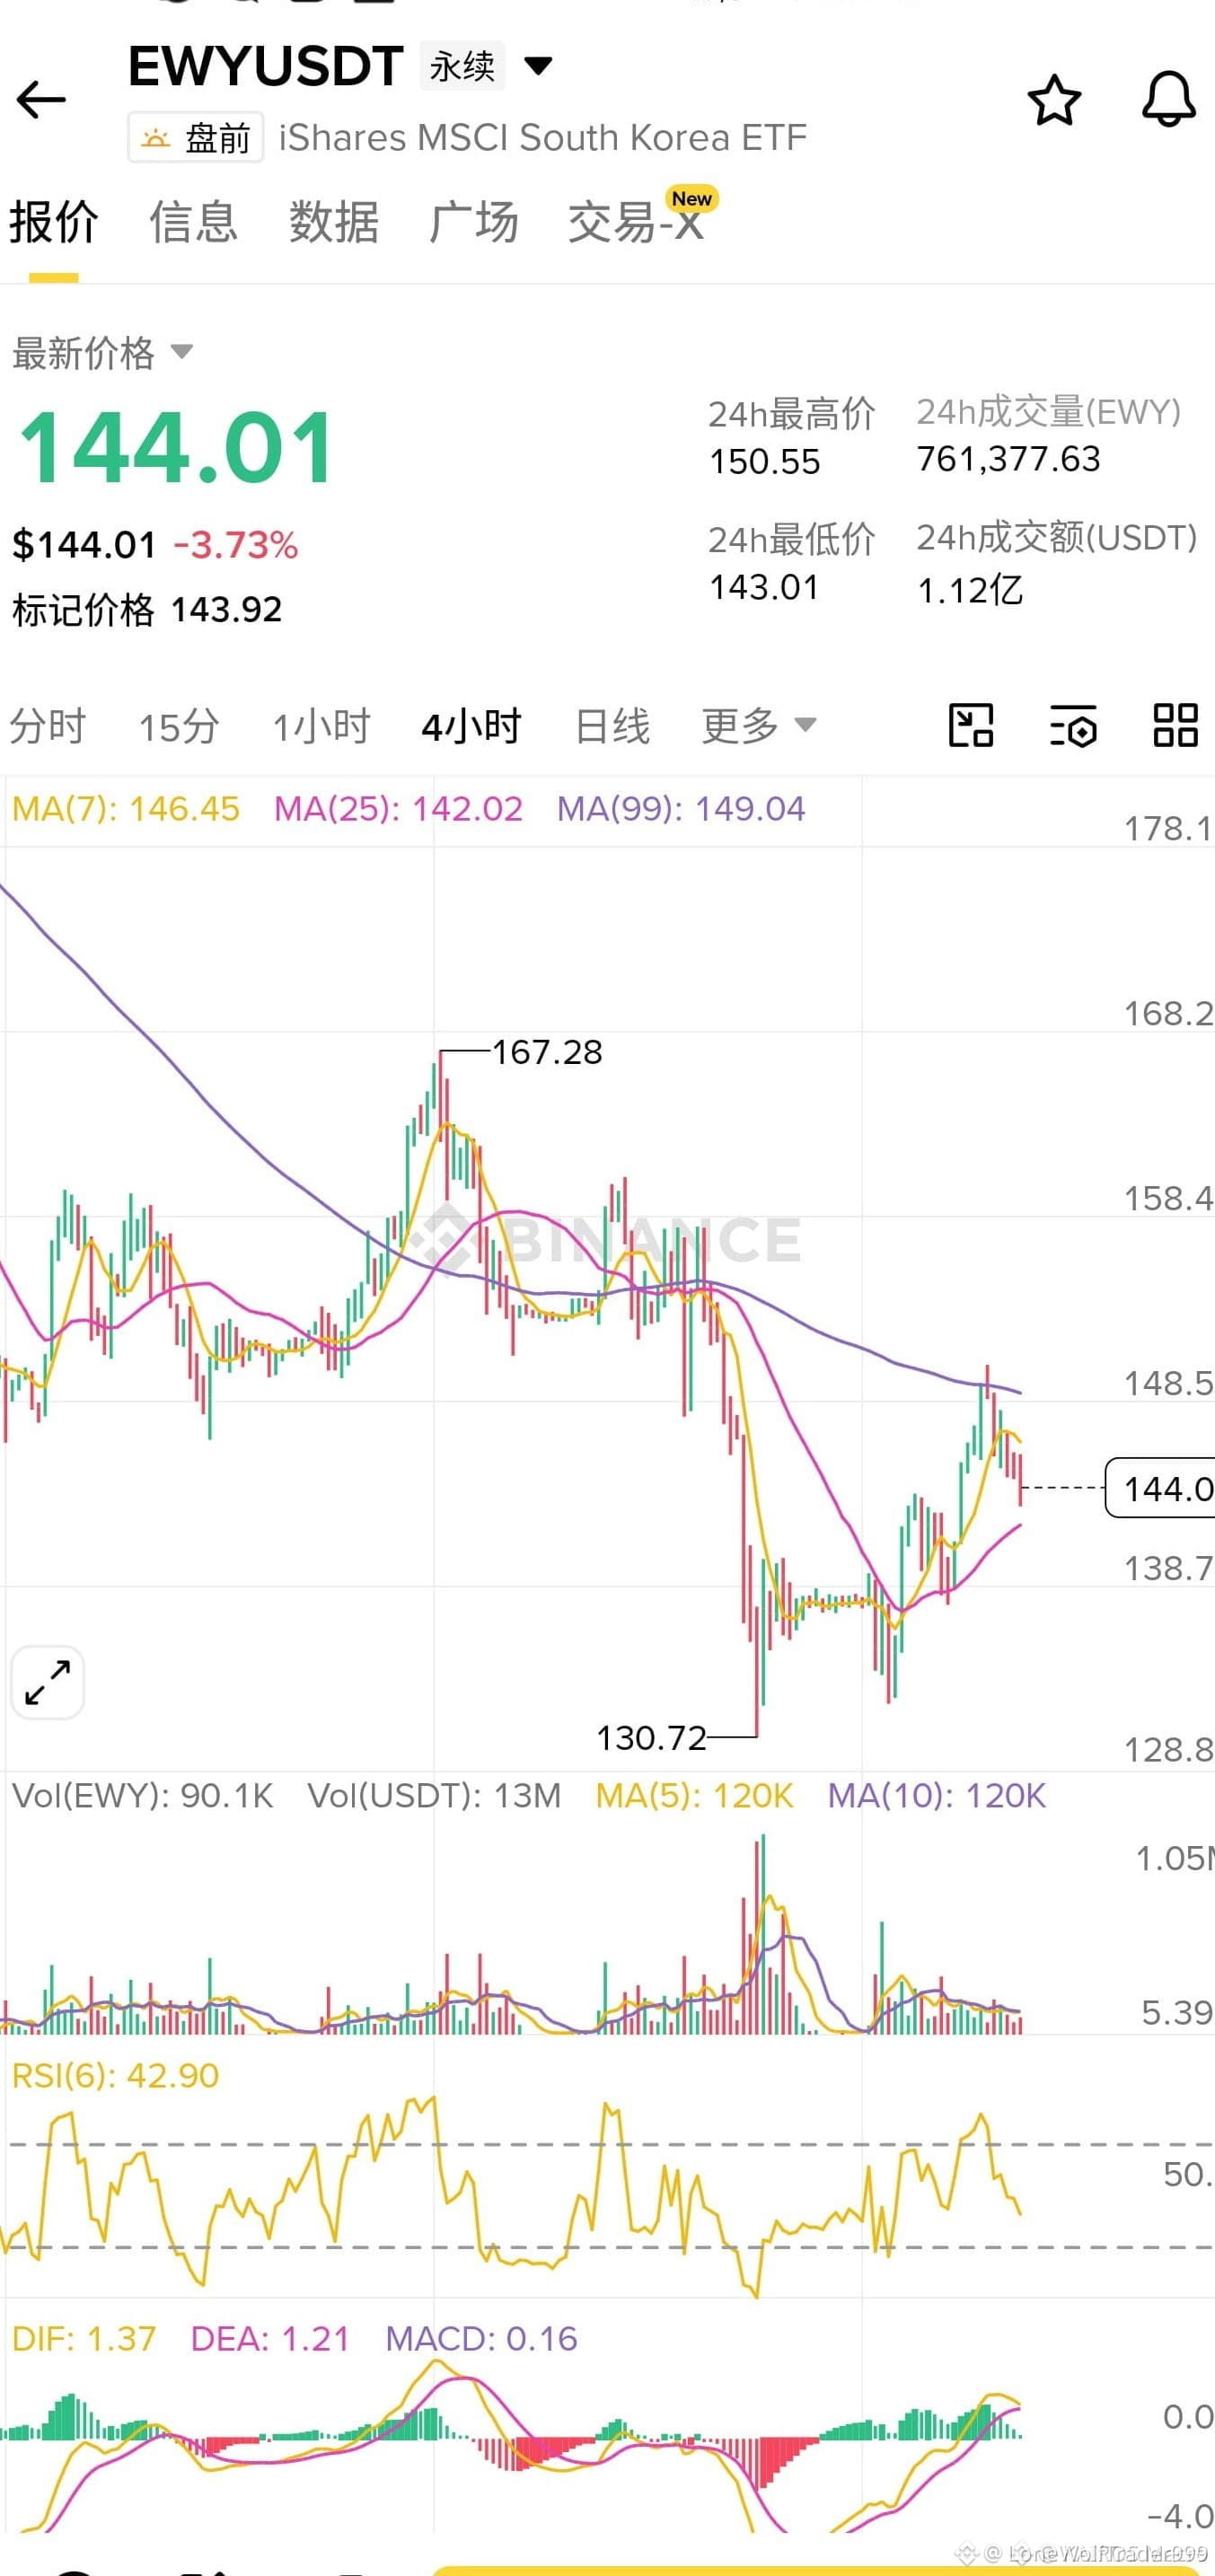
$EWY FORMING A SHARP RECOVERY WHILE SELLERS HAMMER SUPPORT! ⚡🔥
Entry: 144.00 ⚡
Target: 150.00 🚀
Stop Loss: 142.00 🛑
The order books are soaked in tension after that vicious liquidity sweep shook out weak hands. Price just carved a clean V-shape bounce and is now testing a rock-solid structural floor. 📊
Sellers are stacking heavy walls overhead, but aggressive buyers are refusing to let the bid crumble. This is a classic high-stakes battleground where patience separates the professionals from the tourists. ⚡
Are you holding your position through the chop or waiting for a confirmed breakout above resistance? 👇
⚠️ Not financial advice. Always manage your risk. 🛡️
🏷️ #EWY #LongSetup #Breakout #Trading #MarketMomentum
🔥 💎
$EWY FORMING A SHARP RECOVERY WHILE SELLERS HAMMER SUPPORT! ⚡🔥
Entry: 144.00 ⚡
Target: 150.00 🚀
Stop Loss: 142.00 🛑
The order books are soaked in tension after that vicious liquidity sweep shook out weak hands. Price just carved a clean V-shape bounce and is now testing a rock-solid structural floor. 📊
Sellers are stacking heavy walls overhead, but aggressive buyers are refusing to let the bid crumble. This is a classic high-stakes battleground where patience separates the professionals from the tourists. ⚡
Are you holding your position through the chop or waiting for a confirmed breakout above resistance? 👇
⚠️ Not financial advice. Always manage your risk. 🛡️
🏷️ #EWY #LongSetup #Breakout #Trading #MarketMomentum
🔥 💎
Entry: 144.00 ⚡
Target: 150.00 🚀
Stop Loss: 142.00 🛑
The order books are soaked in tension after that vicious liquidity sweep shook out weak hands. Price just carved a clean V-shape bounce and is now testing a rock-solid structural floor. 📊
Sellers are stacking heavy walls overhead, but aggressive buyers are refusing to let the bid crumble. This is a classic high-stakes battleground where patience separates the professionals from the tourists. ⚡
Are you holding your position through the chop or waiting for a confirmed breakout above resistance? 👇
⚠️ Not financial advice. Always manage your risk. 🛡️
🏷️ #EWY #LongSetup #Breakout #Trading #MarketMomentum
🔥 💎
·
--
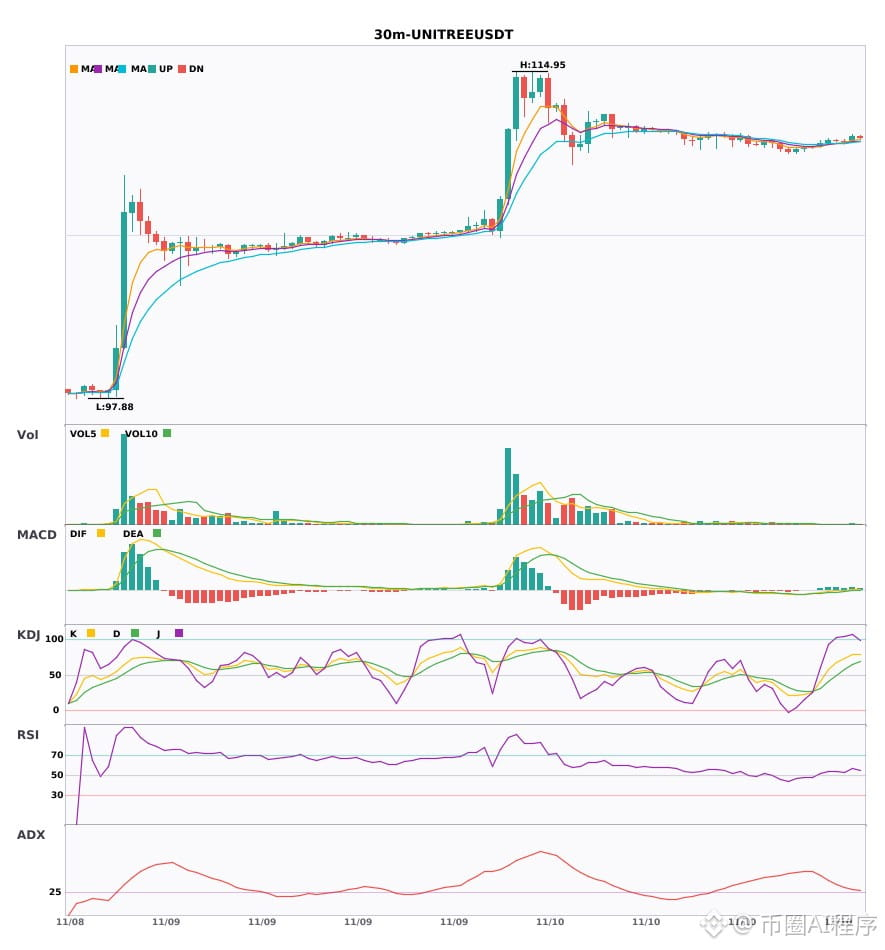
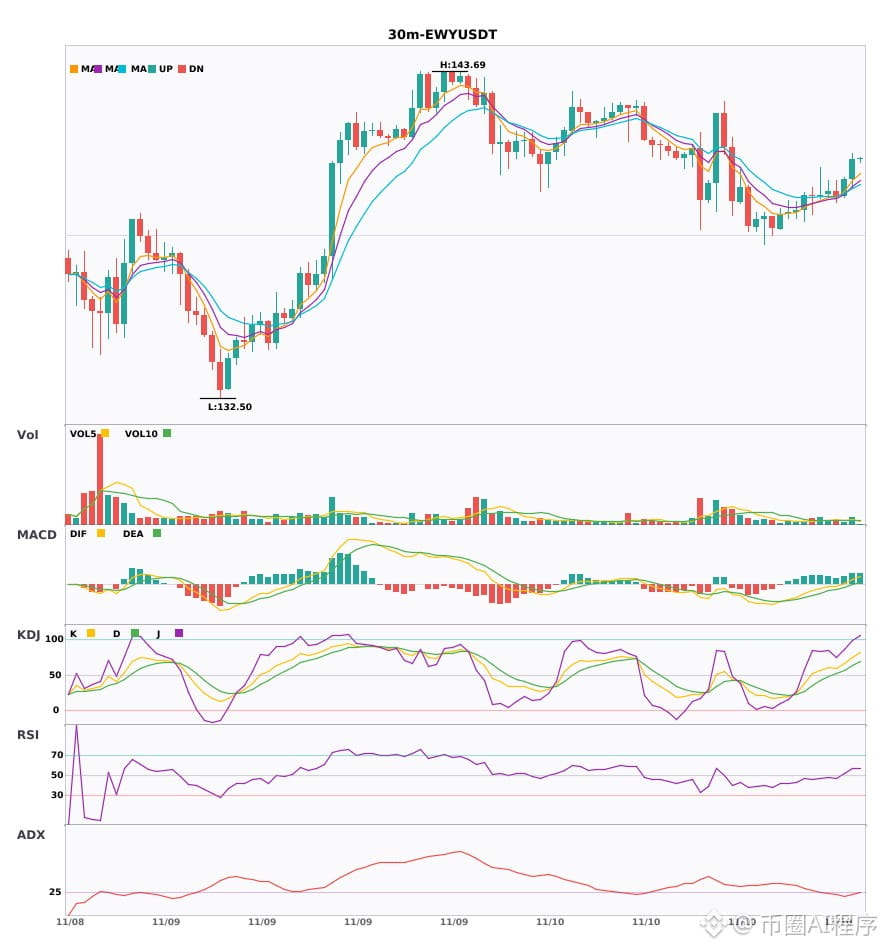
$ERA / $UNITREE / $EWY 30-minute bullish signals, 4-hour bullish trend confirmed🔥
════════════════════
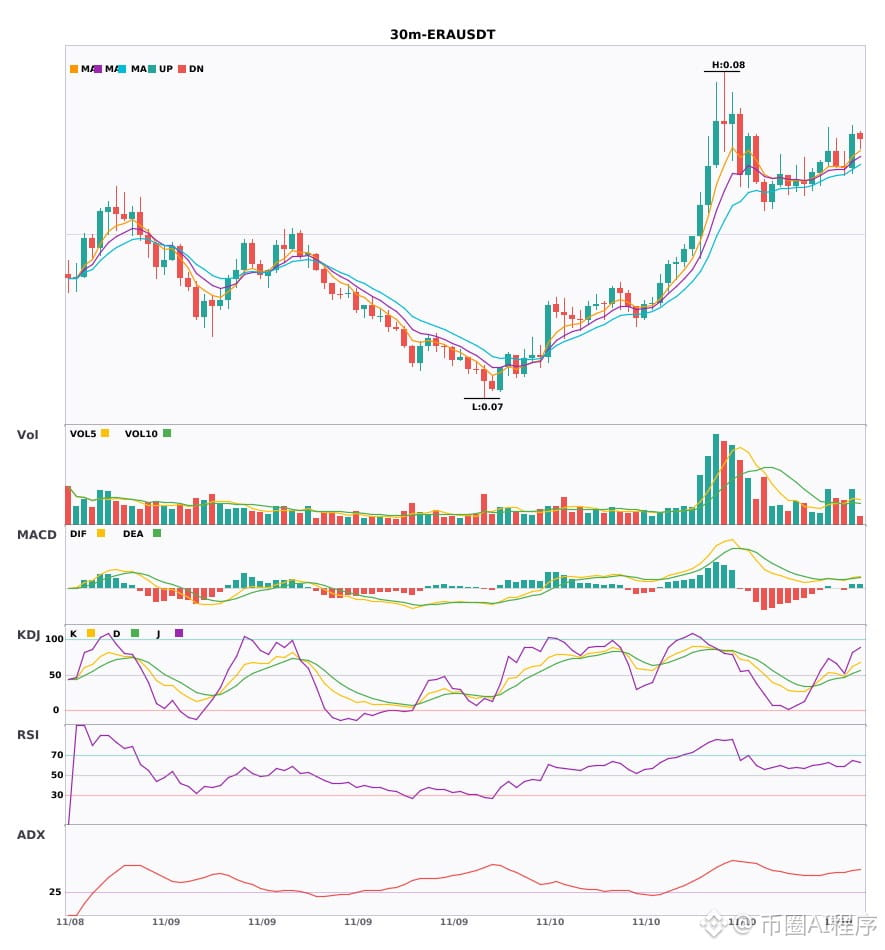
🔴 $ERA 30-minute bullish signal
⚠️Technical analysis: 4-hour bullish confluence confirmed | 30-minute entry: MACD golden cross above zero, bullish momentum released | EMA5 > EMA8 > EMA13, bullish alignment | KDJ running strong, bulls in control (K = 61.2, D = 51.4) | Volume increased (1.6x)
════════════════════
🔴 $UNITREE 30-minute bullish signal
⚠️Technical analysis: 4-hour bullish confluence confirmed | 30-minute entry: MACD running bullish, trend strong, momentum strengthening | EMA5 > EMA8 > EMA13, bullish alignment | KDJ running strong, bulls in control (K = 78.6, D = 64.3) | Volume increased (2.2x)
════════════════════
🔴 $EWY 30-minute bullish signal
⚠️Technical analysis: 4-hour bullish confluence confirmed | 30-minute entry: MACD running bullish, trend strong, momentum strengthening | EMA5 > EMA8 > EMA13, bullish alignment | KDJ running strong, bulls in control (K = 74.6, D = 62.8) | Volume increased (1.8x)
════════════════════
🔔 Follow for first-hand market alerts 🔔
#多周期共振 #ERA #UNITREE #EWY
📌 When trading, pay attention to whether the candlestick pattern matches
$ERA / $UNITREE / $EWY 30-minute bullish signals, 4-hour bullish trend confirmed🔥
════════════════════
🔴 $ERA 30-minute bullish signal
⚠️Technical analysis: 4-hour bullish confluence confirmed | 30-minute entry: MACD golden cross above zero, bullish momentum released | EMA5 > EMA8 > EMA13, bullish alignment | KDJ running strong, bulls in control (K = 61.2, D = 51.4) | Volume increased (1.6x)
════════════════════
🔴 $UNITREE 30-minute bullish signal
⚠️Technical analysis: 4-hour bullish confluence confirmed | 30-minute entry: MACD running bullish, trend strong, momentum strengthening | EMA5 > EMA8 > EMA13, bullish alignment | KDJ running strong, bulls in control (K = 78.6, D = 64.3) | Volume increased (2.2x)
════════════════════
🔴 $EWY 30-minute bullish signal
⚠️Technical analysis: 4-hour bullish confluence confirmed | 30-minute entry: MACD running bullish, trend strong, momentum strengthening | EMA5 > EMA8 > EMA13, bullish alignment | KDJ running strong, bulls in control (K = 74.6, D = 62.8) | Volume increased (1.8x)
════════════════════
🔔 Follow for first-hand market alerts 🔔
#多周期共振 #ERA #UNITREE #EWY
📌 When trading, pay attention to whether the candlestick pattern matches
════════════════════
🔴 $ERA 30-minute bullish signal
⚠️Technical analysis: 4-hour bullish confluence confirmed | 30-minute entry: MACD golden cross above zero, bullish momentum released | EMA5 > EMA8 > EMA13, bullish alignment | KDJ running strong, bulls in control (K = 61.2, D = 51.4) | Volume increased (1.6x)
════════════════════
🔴 $UNITREE 30-minute bullish signal
⚠️Technical analysis: 4-hour bullish confluence confirmed | 30-minute entry: MACD running bullish, trend strong, momentum strengthening | EMA5 > EMA8 > EMA13, bullish alignment | KDJ running strong, bulls in control (K = 78.6, D = 64.3) | Volume increased (2.2x)
════════════════════
🔴 $EWY 30-minute bullish signal
⚠️Technical analysis: 4-hour bullish confluence confirmed | 30-minute entry: MACD running bullish, trend strong, momentum strengthening | EMA5 > EMA8 > EMA13, bullish alignment | KDJ running strong, bulls in control (K = 74.6, D = 62.8) | Volume increased (1.8x)
════════════════════
🔔 Follow for first-hand market alerts 🔔
#多周期共振 #ERA #UNITREE #EWY
📌 When trading, pay attention to whether the candlestick pattern matches
3
·
--
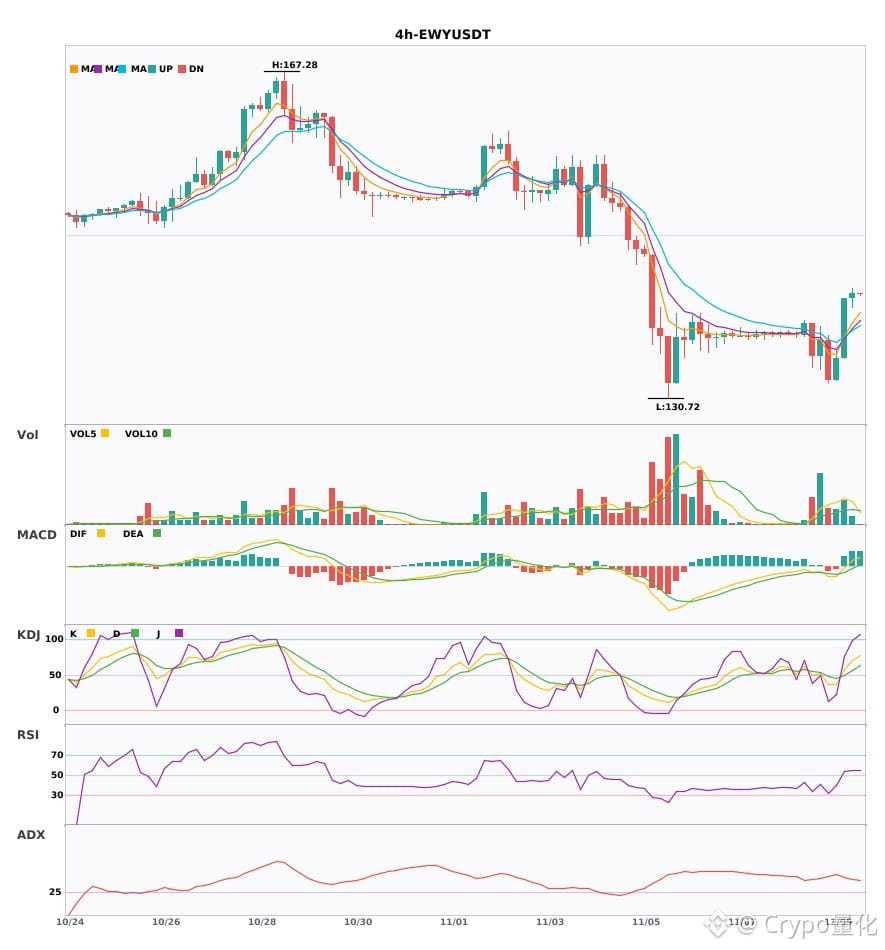
3 simultaneous 4-hour bullish signals: $EWY / $RAM / $CSOPSAMSUNG2L🔥
════════════════════
🔴 $EWY 4-hour bullish signal
⚠️Technical analysis: ADX(40) Strong trending market | MACD DIF breaks above zero, trend turns bullish | EMA5 > EMA8 > EMA13 bullish alignment | KDJ running strong, bulls in control (K: 70.1, D: 56.1) | Volume increases (1.7x)
════════════════════
🔴 $RAM 4-hour bullish signal
⚠️Technical analysis: ADX(37) Strong trending market | MACD bullish, trend leaning strong, momentum increasing | EMA5 > EMA8 > EMA13 bullish alignment | KDJ running strong, bulls in control (K: 70.1, D: 54.9) | Volume increases (1.7x)
════════════════════
🔴 $CSOPSAMSUNG2L 4-hour bullish signal
⚠️Technical analysis: ADX(32) Strong trending market | MACD DIF breaks above zero, trend turns bullish | EMA5 > EMA8 > EMA13 bullish alignment | KDJ running strong, bulls in control (K: 67.6, D: 53.2) | Volume increases (2.4x)
════════════════════
🔔 Follow for first-hand market alerts 🔔
#技术分析 #EWY #RAM #CSOPSAMSUNG2L
📌 When trading, check whether the candlestick pattern confirms the setup
3 simultaneous 4-hour bullish signals: $EWY / $RAM / $CSOPSAMSUNG2L 🔥
════════════════════
🔴 $EWY 4-hour bullish signal
⚠️Technical analysis: ADX(40) Strong trending market | MACD DIF breaks above zero, trend turns bullish | EMA5 > EMA8 > EMA13 bullish alignment | KDJ running strong, bulls in control (K: 70.1, D: 56.1) | Volume increases (1.7x)
════════════════════
🔴 $RAM 4-hour bullish signal
⚠️Technical analysis: ADX(37) Strong trending market | MACD bullish, trend leaning strong, momentum increasing | EMA5 > EMA8 > EMA13 bullish alignment | KDJ running strong, bulls in control (K: 70.1, D: 54.9) | Volume increases (1.7x)
════════════════════
🔴 $CSOPSAMSUNG2L 4-hour bullish signal
⚠️Technical analysis: ADX(32) Strong trending market | MACD DIF breaks above zero, trend turns bullish | EMA5 > EMA8 > EMA13 bullish alignment | KDJ running strong, bulls in control (K: 67.6, D: 53.2) | Volume increases (2.4x)
════════════════════
🔔 Follow for first-hand market alerts 🔔
#技术分析 #EWY #RAM #CSOPSAMSUNG2L
📌 When trading, check whether the candlestick pattern confirms the setup
════════════════════
🔴 $EWY 4-hour bullish signal
⚠️Technical analysis: ADX(40) Strong trending market | MACD DIF breaks above zero, trend turns bullish | EMA5 > EMA8 > EMA13 bullish alignment | KDJ running strong, bulls in control (K: 70.1, D: 56.1) | Volume increases (1.7x)
════════════════════
🔴 $RAM 4-hour bullish signal
⚠️Technical analysis: ADX(37) Strong trending market | MACD bullish, trend leaning strong, momentum increasing | EMA5 > EMA8 > EMA13 bullish alignment | KDJ running strong, bulls in control (K: 70.1, D: 54.9) | Volume increases (1.7x)
════════════════════
🔴 $CSOPSAMSUNG2L 4-hour bullish signal
⚠️Technical analysis: ADX(32) Strong trending market | MACD DIF breaks above zero, trend turns bullish | EMA5 > EMA8 > EMA13 bullish alignment | KDJ running strong, bulls in control (K: 67.6, D: 53.2) | Volume increases (2.4x)
════════════════════
🔔 Follow for first-hand market alerts 🔔
#技术分析 #EWY #RAM #CSOPSAMSUNG2L
📌 When trading, check whether the candlestick pattern confirms the setup
3
·
--
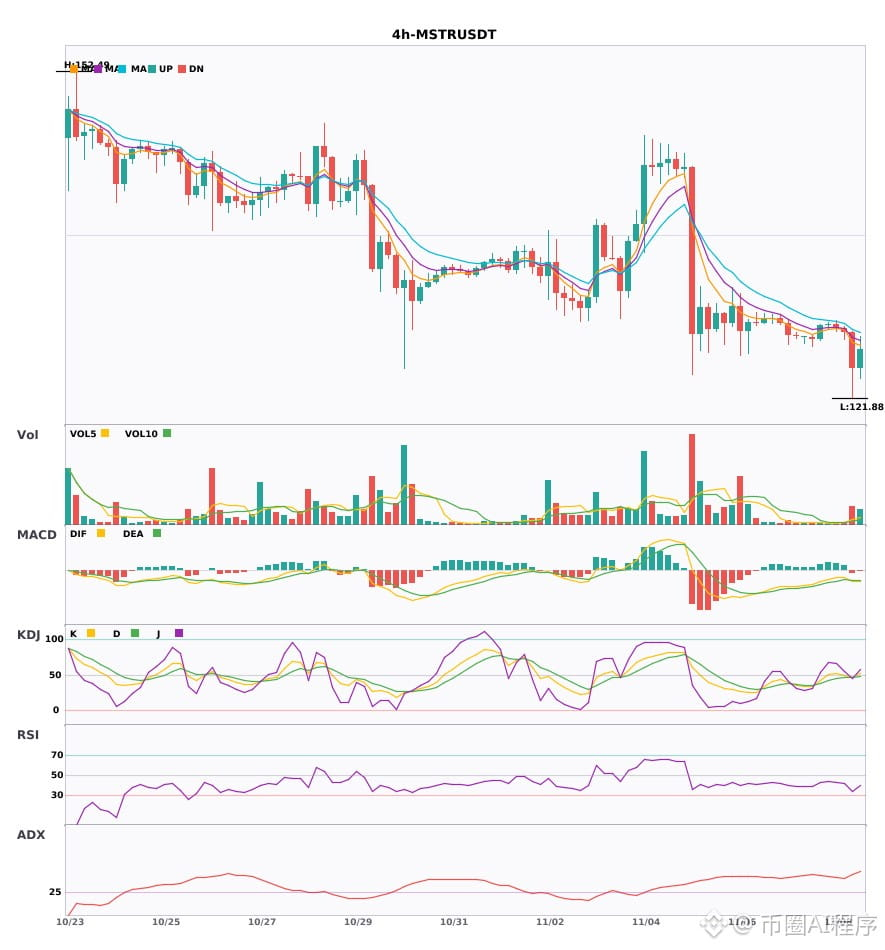
$MSTR / $EWY / $ADA 4-hour short signals, daily bearish trend confirmed🔥
════════════════════
🟢 $MSTR 4-hour short signal
⚠️Technical analysis: Daily bearish confluence confirmed | 4-hour entry: MACD bearish crossover below zero, bearish momentum accelerating | EMA5 < EMA8 < EMA13, bearish alignment | KDJ bearish crossover, short-term outlook bearish (K: 45.9, D: 46.4) | Volume surge (4.9x)
════════════════════
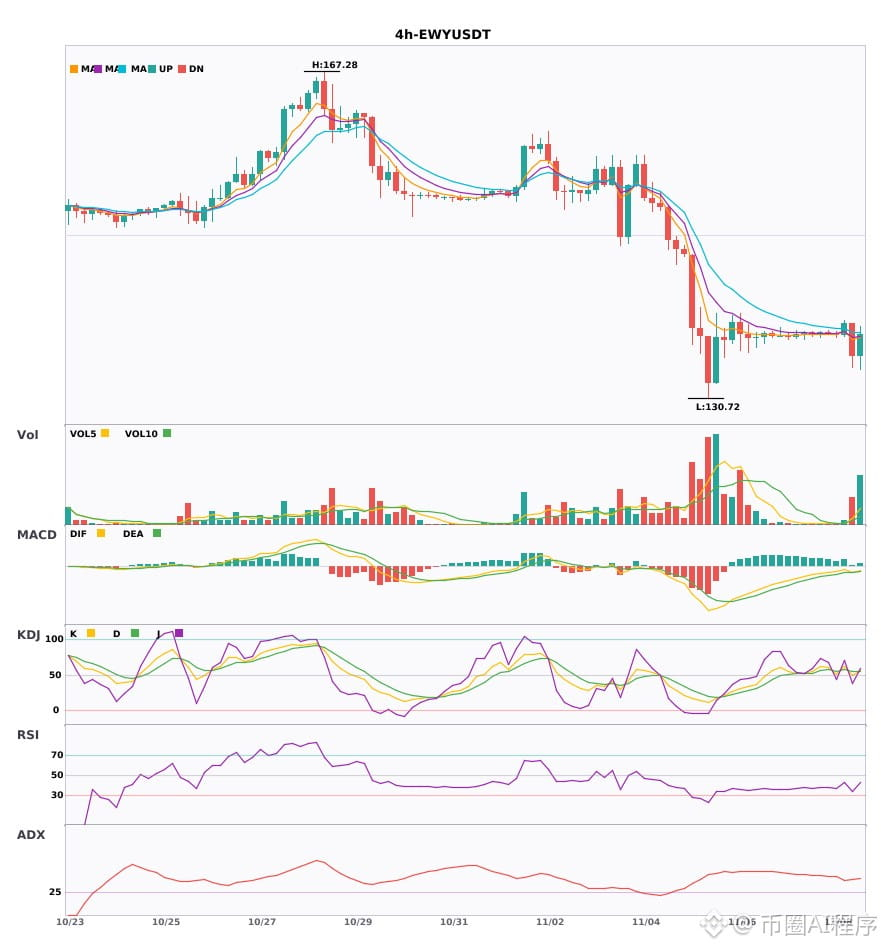
🟢 $EWY 4-hour short signal
⚠️Technical analysis: Daily bearish confluence confirmed | 4-hour entry: EMA5 crosses below EMA8, short-term outlook turns bearish | KDJ bearish crossover, short-term outlook bearish (K: 49.0, D: 54.7) | Volume surge (6.7x)
════════════════════
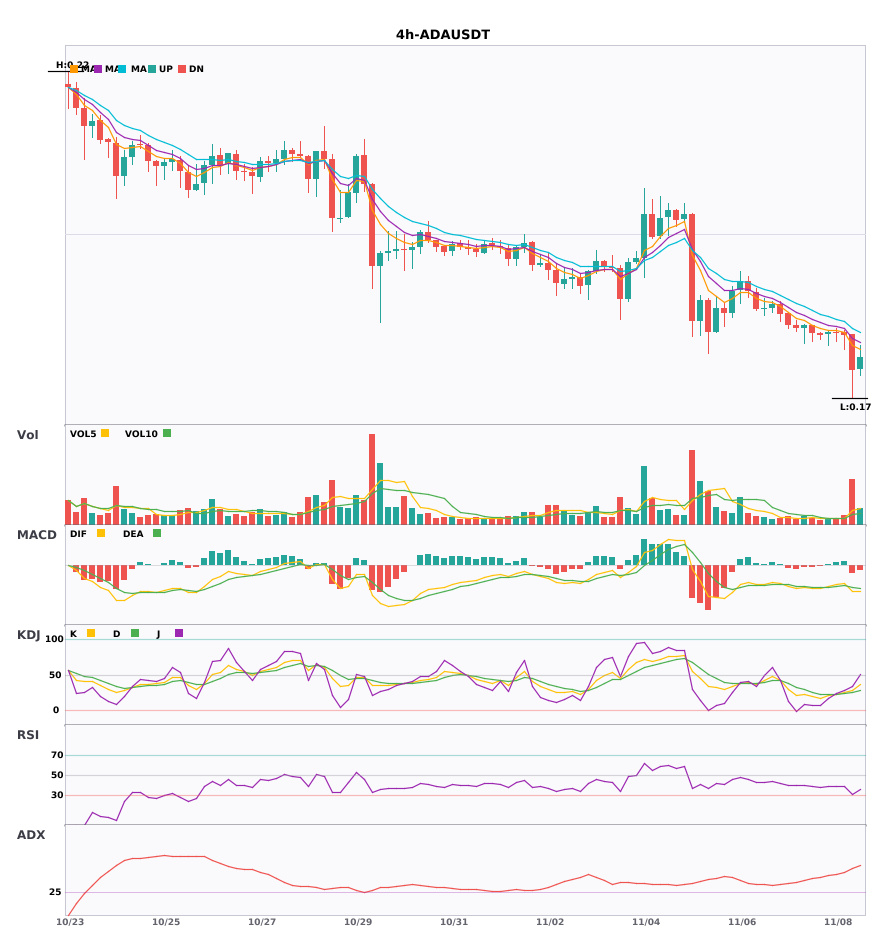
🟢 $ADA 4-hour short signal
⚠️Technical analysis: Daily bearish confluence confirmed | 4-hour entry: MACD bearish crossover below zero, bearish momentum accelerating | EMA5 < EMA8 < EMA13, bearish alignment | KDJ showing weakness, bears in control (K: 27.7, D: 24.9) | Volume surge (4.3x)
════════════════════
🔔 Follow for first-hand market alerts 🔔
#多周期共振 #MSTR #EWY #ADA
📌 When trading, pay attention to whether the candlestick pattern meets expectations
$MSTR / $EWY / $ADA 4-hour short signals, daily bearish trend confirmed🔥
════════════════════
🟢 $MSTR 4-hour short signal
⚠️Technical analysis: Daily bearish confluence confirmed | 4-hour entry: MACD bearish crossover below zero, bearish momentum accelerating | EMA5 < EMA8 < EMA13, bearish alignment | KDJ bearish crossover, short-term outlook bearish (K: 45.9, D: 46.4) | Volume surge (4.9x)
════════════════════
🟢 $EWY 4-hour short signal
⚠️Technical analysis: Daily bearish confluence confirmed | 4-hour entry: EMA5 crosses below EMA8, short-term outlook turns bearish | KDJ bearish crossover, short-term outlook bearish (K: 49.0, D: 54.7) | Volume surge (6.7x)
════════════════════
🟢 $ADA 4-hour short signal
⚠️Technical analysis: Daily bearish confluence confirmed | 4-hour entry: MACD bearish crossover below zero, bearish momentum accelerating | EMA5 < EMA8 < EMA13, bearish alignment | KDJ showing weakness, bears in control (K: 27.7, D: 24.9) | Volume surge (4.3x)
════════════════════
🔔 Follow for first-hand market alerts 🔔
#多周期共振 #MSTR #EWY #ADA
📌 When trading, pay attention to whether the candlestick pattern meets expectations
════════════════════
🟢 $MSTR 4-hour short signal
⚠️Technical analysis: Daily bearish confluence confirmed | 4-hour entry: MACD bearish crossover below zero, bearish momentum accelerating | EMA5 < EMA8 < EMA13, bearish alignment | KDJ bearish crossover, short-term outlook bearish (K: 45.9, D: 46.4) | Volume surge (4.9x)
════════════════════
🟢 $EWY 4-hour short signal
⚠️Technical analysis: Daily bearish confluence confirmed | 4-hour entry: EMA5 crosses below EMA8, short-term outlook turns bearish | KDJ bearish crossover, short-term outlook bearish (K: 49.0, D: 54.7) | Volume surge (6.7x)
════════════════════
🟢 $ADA 4-hour short signal
⚠️Technical analysis: Daily bearish confluence confirmed | 4-hour entry: MACD bearish crossover below zero, bearish momentum accelerating | EMA5 < EMA8 < EMA13, bearish alignment | KDJ showing weakness, bears in control (K: 27.7, D: 24.9) | Volume surge (4.3x)
════════════════════
🔔 Follow for first-hand market alerts 🔔
#多周期共振 #MSTR #EWY #ADA
📌 When trading, pay attention to whether the candlestick pattern meets expectations
19
·
--
$EWY 30-minute technicals are turning bullish—are short-term opportunities emerging? 🔥
════════════════════
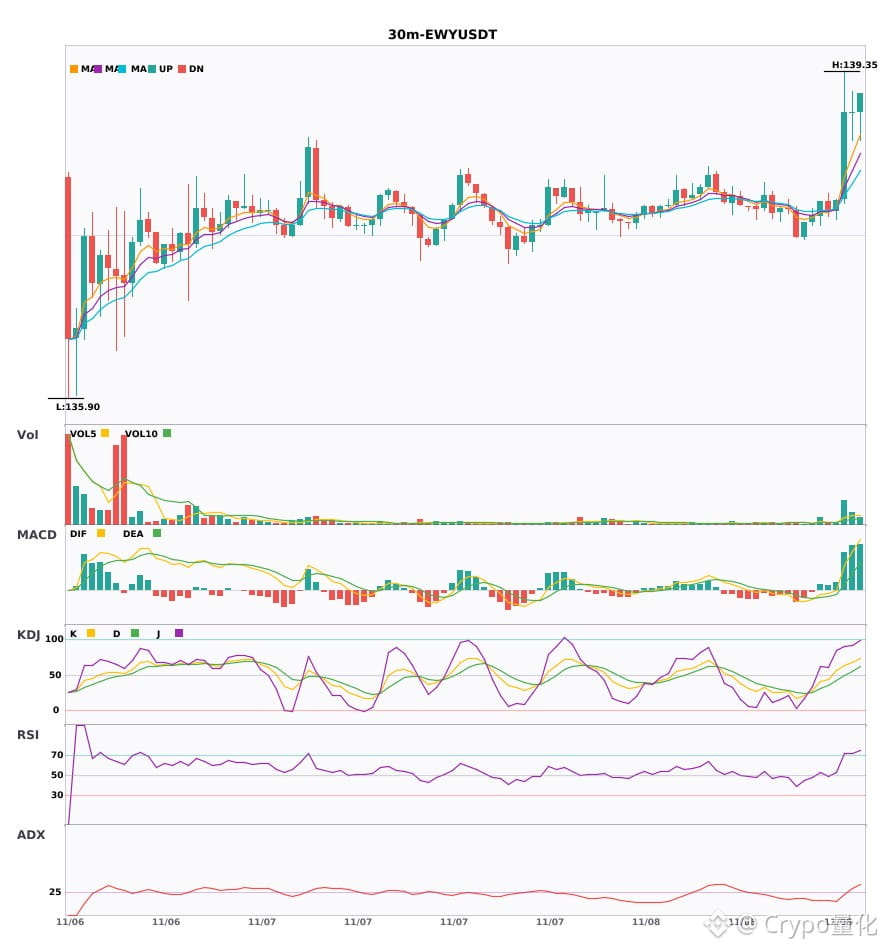
🔴 $EWY 30-minute bullish signal
⚠️ Technicals: ADX(25) Trend is forming; opportunity to participate | MACD is bullish, the trend is relatively strong, and momentum is increasing | EMA5 > EMA8 > EMA13 bullish alignment | Volume surge (5.2x)
════════════════════
🔔 Follow for firsthand market updates 🔔
#技术分析 #EWY
📌 When trading, pay attention to whether the candlestick pattern meets the criteria
$EWY 30-minute technicals are turning bullish—are short-term opportunities emerging? 🔥
════════════════════
🔴 $EWY 30-minute bullish signal
⚠️ Technicals: ADX(25) Trend is forming; opportunity to participate | MACD is bullish, the trend is relatively strong, and momentum is increasing | EMA5 > EMA8 > EMA13 bullish alignment | Volume surge (5.2x)
════════════════════
🔔 Follow for firsthand market updates 🔔
#技术分析 #EWY
📌 When trading, pay attention to whether the candlestick pattern meets the criteria
════════════════════
🔴 $EWY 30-minute bullish signal
⚠️ Technicals: ADX(25) Trend is forming; opportunity to participate | MACD is bullish, the trend is relatively strong, and momentum is increasing | EMA5 > EMA8 > EMA13 bullish alignment | Volume surge (5.2x)
════════════════════
🔔 Follow for firsthand market updates 🔔
#技术分析 #EWY
📌 When trading, pay attention to whether the candlestick pattern meets the criteria
1
Log in to explore more content
Join global crypto users on Binance Square
⚡️ Get latest and useful information about crypto.
💬 Trusted by the world’s largest crypto exchange.
👍 Discover real insights from verified creators.
Email / Phone number
Trending Topics
1
#BTCReboundsAbove$60KAmidWhaleDipBuying
2,679 views
37 Discussing
2
#NvidiaLoses$2.7TrillionInMonthAndAHalf
40,238 views
194 Discussing
3
#GlobalStocksFaceLongestLosingStreakSince2023
379,093 views
2,461 Discussing
4
#BlackRockIBITPostsRecord$541MSingleDayOutflow
54,129 views
136 Discussing
5
#AnthropicPlungesTowardIPOPriceonDay2
197,875 views
1,549 Discussing
6
#TwentyOneCapitalAdds172.25BTC
95,082 views
965 Discussing
7
#HKBillWouldExcludeTokenizedDepositsFromVirtualAssets
14,075 views
64 Discussing
8
#HKBillProposesHK$100KFineForUnauthorizedCryptoTitles
3,435 views
29 Discussing
9
#BitMineFaces$10.1BUnrealizedETHLoss
6,785 views
32 Discussing
10
#StrategyReports$35BNetReserves
3,626 views
20 Discussing