
#muu
muu
67,363 views
1,130 Discussing
Hot
Latest

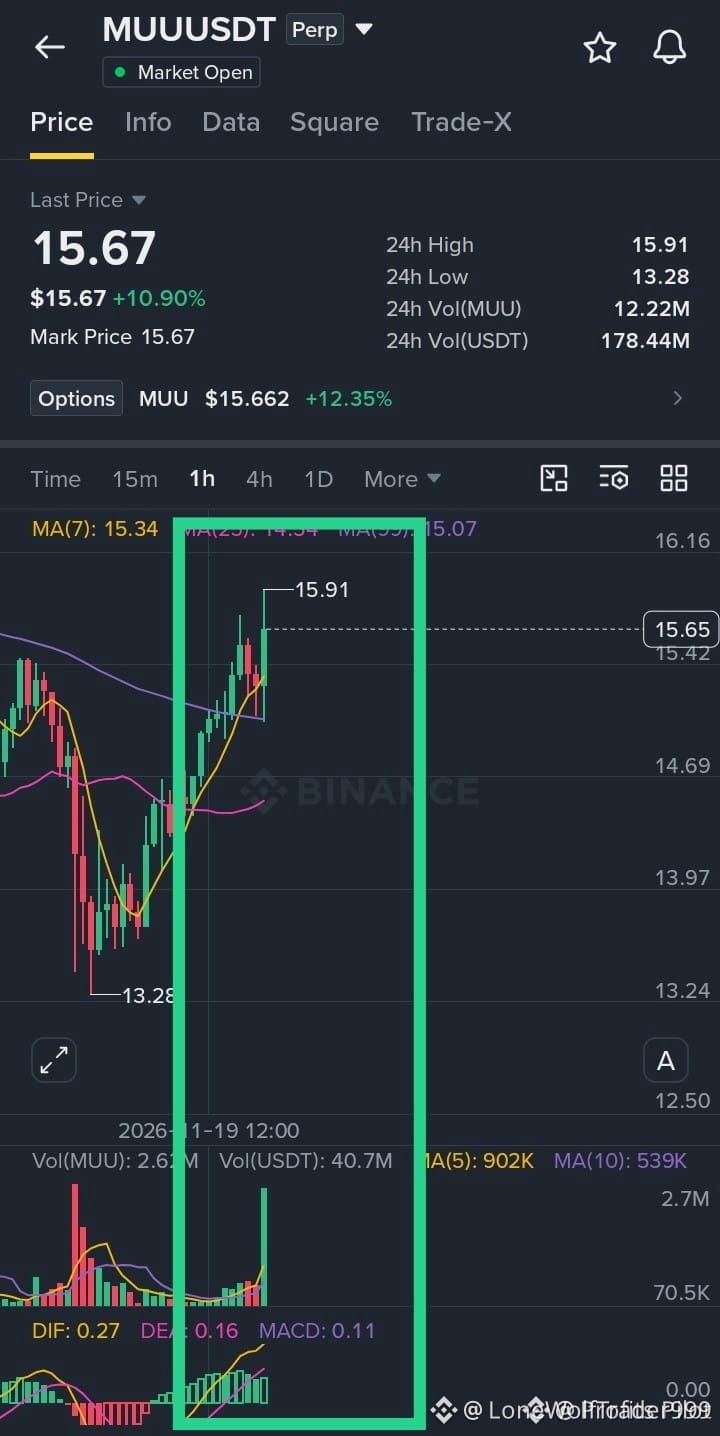
$MUU IS BLEEDING BACK INTO A CRITICAL DEMAND POCKET! 🦈
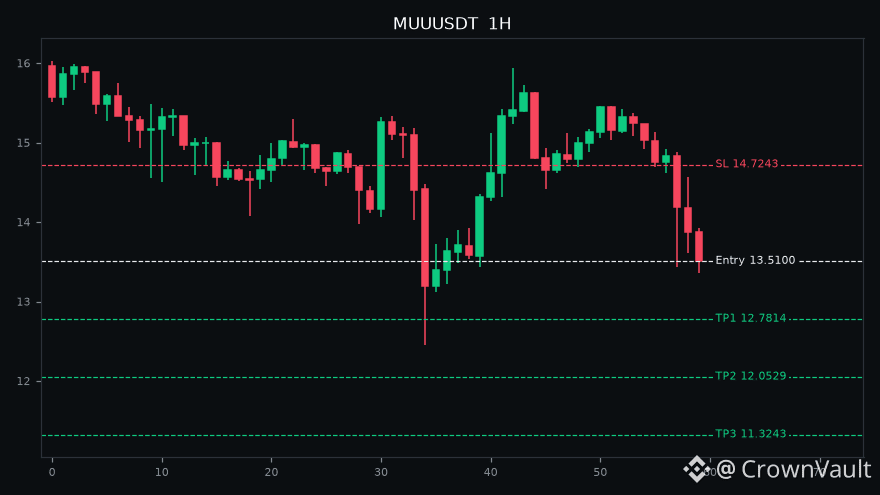
Entry: $15.50 ⚡
Target: $16.00 🚀
Stop Loss: $15.25 🛑
Sellers are leaning heavily on the order book as $MUU tests this crucial structural floor. 📊 We need to see aggressive buyers step in and absorb the selling pressure right at this pivot before momentum shifts entirely. ⚡
The risk-to-reward profile here favors patient execution with a tight invalidation level just underneath the wick. 💡 Are you placing limit bids at the support floor or waiting for confirmation candles? 👇
⚠️ Not financial advice. Always manage your risk. 🛡️
🏷️ #MUU #LongSetup #Crypto #PriceAction
🔥 💎
$MUU IS BLEEDING BACK INTO A CRITICAL DEMAND POCKET! 🦈
Entry: $15.50 ⚡
Target: $16.00 🚀
Stop Loss: $15.25 🛑
Sellers are leaning heavily on the order book as $MUU tests this crucial structural floor. 📊 We need to see aggressive buyers step in and absorb the selling pressure right at this pivot before momentum shifts entirely. ⚡
The risk-to-reward profile here favors patient execution with a tight invalidation level just underneath the wick. 💡 Are you placing limit bids at the support floor or waiting for confirmation candles? 👇
⚠️ Not financial advice. Always manage your risk. 🛡️
🏷️ #MUU #LongSetup #Crypto #PriceAction
🔥 💎
Entry: $15.50 ⚡
Target: $16.00 🚀
Stop Loss: $15.25 🛑
Sellers are leaning heavily on the order book as $MUU tests this crucial structural floor. 📊 We need to see aggressive buyers step in and absorb the selling pressure right at this pivot before momentum shifts entirely. ⚡
The risk-to-reward profile here favors patient execution with a tight invalidation level just underneath the wick. 💡 Are you placing limit bids at the support floor or waiting for confirmation candles? 👇
⚠️ Not financial advice. Always manage your risk. 🛡️
🏷️ #MUU #LongSetup #Crypto #PriceAction
🔥 💎
7

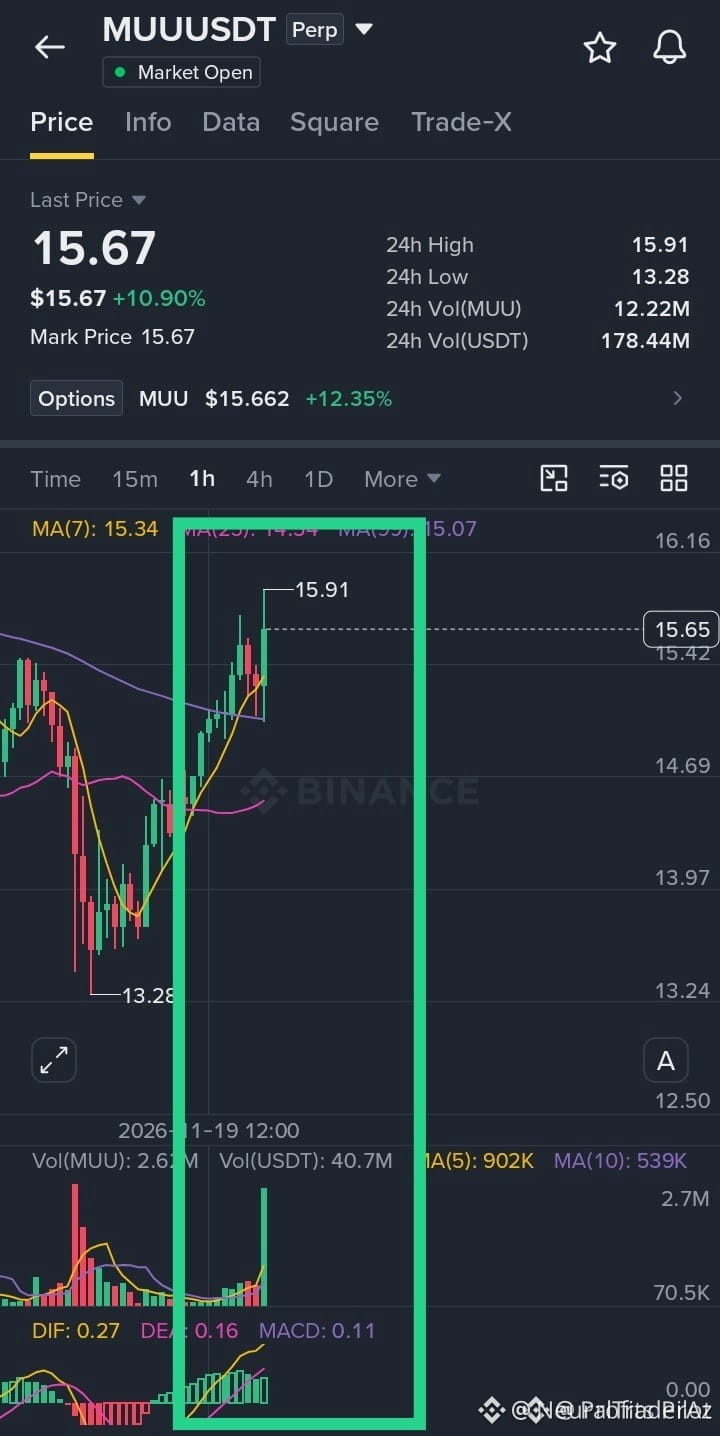
🦈 $MUU NEARING A CRITICAL LIQUIDITY TEST AS SMART MONEY DEFENDS SUPPORT! ⚡
Entry: 15.50 ⚡
Target: 16.00 🚀
Stop Loss: 15.25 ⚠️
Price action is compressing tightly toward the 15.50 demand zone, where institutional order flow previously absorbed aggressive selling pressure. 📊 This local mitigation block serves as our primary structural footprint for tracking a clean reaction. 💡
Order flow depth indicates passive buyers resting underneath to trap late shorts before any impulsive markup sequence initiates. 🌊
💬 Are you positioning ahead of this structural retest or waiting for confirmed volume acceptance? 👇
⚠️ Not financial advice. Always manage your risk. 🛡️
🏷️ #MUU #LongSetup #SmartMoney #OrderBlock #Crypto
🦈 ⚡
🦈 $MUU NEARING A CRITICAL LIQUIDITY TEST AS SMART MONEY DEFENDS SUPPORT! ⚡
Entry: 15.50 ⚡
Target: 16.00 🚀
Stop Loss: 15.25 ⚠️
Price action is compressing tightly toward the 15.50 demand zone, where institutional order flow previously absorbed aggressive selling pressure. 📊 This local mitigation block serves as our primary structural footprint for tracking a clean reaction. 💡
Order flow depth indicates passive buyers resting underneath to trap late shorts before any impulsive markup sequence initiates. 🌊
💬 Are you positioning ahead of this structural retest or waiting for confirmed volume acceptance? 👇
⚠️ Not financial advice. Always manage your risk. 🛡️
🏷️ #MUU #LongSetup #SmartMoney #OrderBlock #Crypto
🦈 ⚡
Entry: 15.50 ⚡
Target: 16.00 🚀
Stop Loss: 15.25 ⚠️
Price action is compressing tightly toward the 15.50 demand zone, where institutional order flow previously absorbed aggressive selling pressure. 📊 This local mitigation block serves as our primary structural footprint for tracking a clean reaction. 💡
Order flow depth indicates passive buyers resting underneath to trap late shorts before any impulsive markup sequence initiates. 🌊
💬 Are you positioning ahead of this structural retest or waiting for confirmed volume acceptance? 👇
⚠️ Not financial advice. Always manage your risk. 🛡️
🏷️ #MUU #LongSetup #SmartMoney #OrderBlock #Crypto
🦈 ⚡
1

·
--
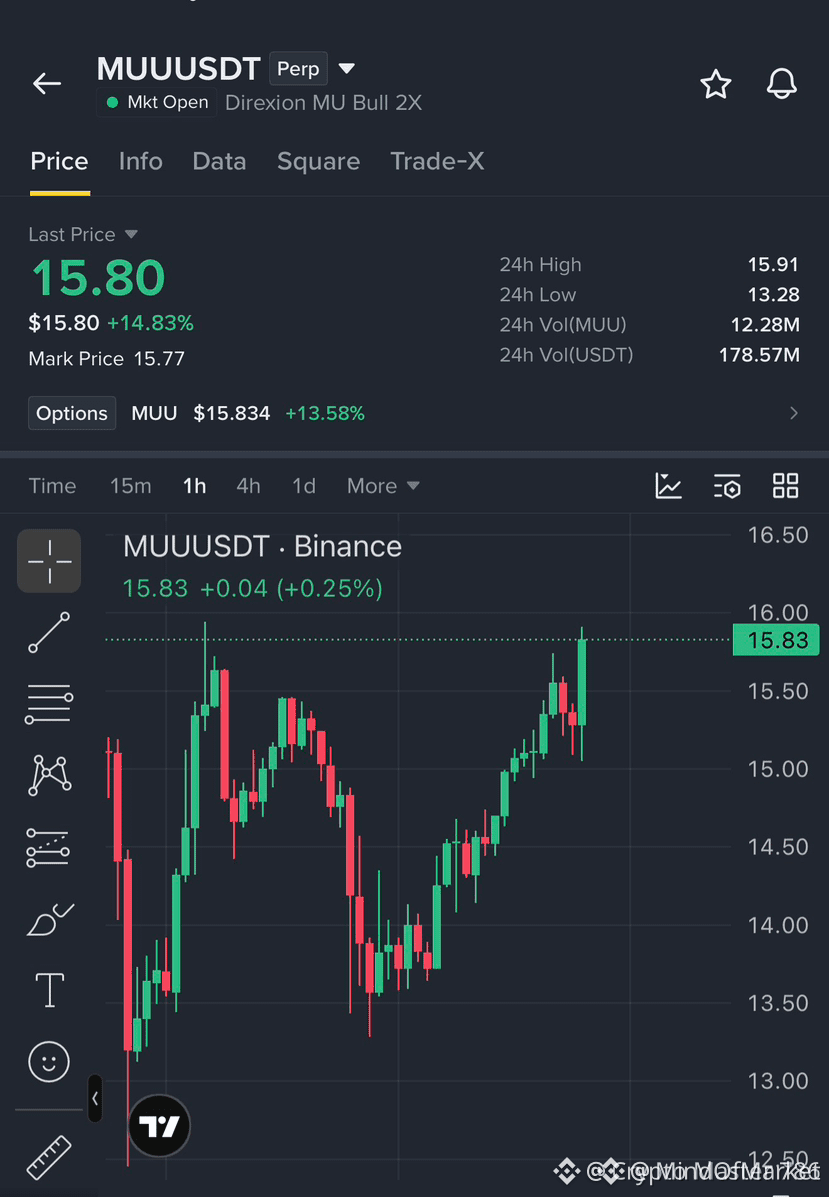
$MUU TESTING A CRITICAL LIQUIDITY ZONE TO SETUP A HIGH-PROBABILITY REBOUND ⚡ 📊
Entry: 15.50 ⚡
Target: 16.00 🚀
Stop Loss: 15.25 ⚠️
Price action on $MUU is testing a pristine discount array where institutional bid absorption typically occurs after a minor liquidity sweep. We are tracking a clean reaction off the 15.50 structural floor to confirm buyers are stepping back in with conviction. 📊
The inefficiency overhead leaves a clear path toward liquidity resting at higher targets while downside risk remains tightly defined below the recent swing low. 💡
Are you scaling in proactively on the initial touch or waiting for a lower timeframe confirmation candle? 🤔
⚠️ Not financial advice. Always manage your risk. 🛡️
🏷️ #MUU #SmartMoney #LongSetup #PriceAction
🔥 💎
$MUU TESTING A CRITICAL LIQUIDITY ZONE TO SETUP A HIGH-PROBABILITY REBOUND ⚡ 📊
Entry: 15.50 ⚡
Target: 16.00 🚀
Stop Loss: 15.25 ⚠️
Price action on $MUU is testing a pristine discount array where institutional bid absorption typically occurs after a minor liquidity sweep. We are tracking a clean reaction off the 15.50 structural floor to confirm buyers are stepping back in with conviction. 📊
The inefficiency overhead leaves a clear path toward liquidity resting at higher targets while downside risk remains tightly defined below the recent swing low. 💡
Are you scaling in proactively on the initial touch or waiting for a lower timeframe confirmation candle? 🤔
⚠️ Not financial advice. Always manage your risk. 🛡️
🏷️ #MUU #SmartMoney #LongSetup #PriceAction
🔥 💎
Entry: 15.50 ⚡
Target: 16.00 🚀
Stop Loss: 15.25 ⚠️
Price action on $MUU is testing a pristine discount array where institutional bid absorption typically occurs after a minor liquidity sweep. We are tracking a clean reaction off the 15.50 structural floor to confirm buyers are stepping back in with conviction. 📊
The inefficiency overhead leaves a clear path toward liquidity resting at higher targets while downside risk remains tightly defined below the recent swing low. 💡
Are you scaling in proactively on the initial touch or waiting for a lower timeframe confirmation candle? 🤔
⚠️ Not financial advice. Always manage your risk. 🛡️
🏷️ #MUU #SmartMoney #LongSetup #PriceAction
🔥 💎
1

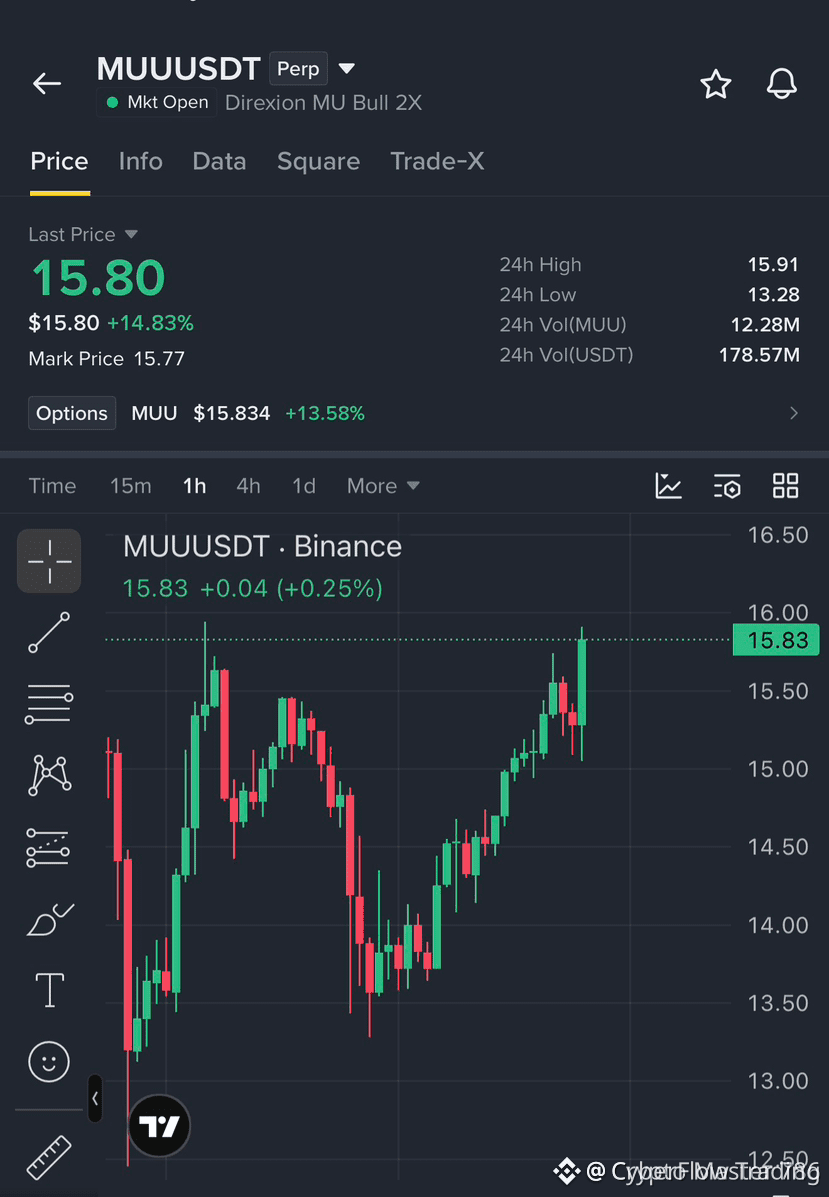
🦈 $MUU NEARING A CRITICAL LIQUIDITY ZONE FOR A HIGH-PROBABILITY BOUNCE! ⚡
Entry: 15.50 ⚡
Target: 16.00 🚀
Stop Loss: 15.25 ⚠️
Smart money is quietly watching how price reacts to this crucial demand pocket as sellers exhaust their remaining inventory. 📊 The structural pullback into this level sets up a clean asymmetric window for patient market participants. 💡
Volume profiles show steady accumulation beneath the surface while order books clear out retail friction. 🌊 Are you catching this dip or waiting for confirmation above resistance? 👇
⚠️ Not financial advice. Always manage your risk. 🛡️
🏷️ #MUU #LongSetup #PriceAction #Crypto
🔥 💎
🦈 $MUU NEARING A CRITICAL LIQUIDITY ZONE FOR A HIGH-PROBABILITY BOUNCE! ⚡
Entry: 15.50 ⚡
Target: 16.00 🚀
Stop Loss: 15.25 ⚠️
Smart money is quietly watching how price reacts to this crucial demand pocket as sellers exhaust their remaining inventory. 📊 The structural pullback into this level sets up a clean asymmetric window for patient market participants. 💡
Volume profiles show steady accumulation beneath the surface while order books clear out retail friction. 🌊 Are you catching this dip or waiting for confirmation above resistance? 👇
⚠️ Not financial advice. Always manage your risk. 🛡️
🏷️ #MUU #LongSetup #PriceAction #Crypto
🔥 💎
Entry: 15.50 ⚡
Target: 16.00 🚀
Stop Loss: 15.25 ⚠️
Smart money is quietly watching how price reacts to this crucial demand pocket as sellers exhaust their remaining inventory. 📊 The structural pullback into this level sets up a clean asymmetric window for patient market participants. 💡
Volume profiles show steady accumulation beneath the surface while order books clear out retail friction. 🌊 Are you catching this dip or waiting for confirmation above resistance? 👇
⚠️ Not financial advice. Always manage your risk. 🛡️
🏷️ #MUU #LongSetup #PriceAction #Crypto
🔥 💎
5

·
--
The split on MUU is clear: some are looking for a recovery, while others expect continued weakness.
Binance TradFi perpetuals (traditional finance assets; high risk of gaps outside trading hours) | MUU is down 23.11% over the past 24 hours. At 2026-11-21 13:40:10 Beijing time, the price was around 9.65 (30m indicators use the 13:30 closing candle), with 24h trading volume of approximately 249 million; the 30m volume ratio was just 0.2x, indicating weak participation. Fund flows: 65% of accounts are long; taker buy/sell ratio 0.92 (taker activity is nearly balanced); 30m open interest +0.8%; funding rate -0.3941%.
Reference indicators: 30m ATR trend band reference level 10.323052; the current price is below it, indicating a weak structure. 30m KDJ: 29.09/34.81/17.64.
Focus on just two levels: can the taker buy/sell ratio of 0.92 hold above 1.10; and can the price reclaim the ATR trend band reference level of 10.323052? Two paths lie ahead: a recovery after panic selling subsides, or a low-volume rebound followed by further weakness.
#MUU #AbnormalMovementAlert
The split on MUU is clear: some are looking for a recovery, while others expect continued weakness.
Binance TradFi perpetuals (traditional finance assets; high risk of gaps outside trading hours) | MUU is down 23.11% over the past 24 hours. At 2026-11-21 13:40:10 Beijing time, the price was around 9.65 (30m indicators use the 13:30 closing candle), with 24h trading volume of approximately 249 million; the 30m volume ratio was just 0.2x, indicating weak participation. Fund flows: 65% of accounts are long; taker buy/sell ratio 0.92 (taker activity is nearly balanced); 30m open interest +0.8%; funding rate -0.3941%.
Reference indicators: 30m ATR trend band reference level 10.323052; the current price is below it, indicating a weak structure. 30m KDJ: 29.09/34.81/17.64.
Focus on just two levels: can the taker buy/sell ratio of 0.92 hold above 1.10; and can the price reclaim the ATR trend band reference level of 10.323052? Two paths lie ahead: a recovery after panic selling subsides, or a low-volume rebound followed by further weakness.
#MUU #AbnormalMovementAlert
Binance TradFi perpetuals (traditional finance assets; high risk of gaps outside trading hours) | MUU is down 23.11% over the past 24 hours. At 2026-11-21 13:40:10 Beijing time, the price was around 9.65 (30m indicators use the 13:30 closing candle), with 24h trading volume of approximately 249 million; the 30m volume ratio was just 0.2x, indicating weak participation. Fund flows: 65% of accounts are long; taker buy/sell ratio 0.92 (taker activity is nearly balanced); 30m open interest +0.8%; funding rate -0.3941%.
Reference indicators: 30m ATR trend band reference level 10.323052; the current price is below it, indicating a weak structure. 30m KDJ: 29.09/34.81/17.64.
Focus on just two levels: can the taker buy/sell ratio of 0.92 hold above 1.10; and can the price reclaim the ATR trend band reference level of 10.323052? Two paths lie ahead: a recovery after panic selling subsides, or a low-volume rebound followed by further weakness.
#MUU #AbnormalMovementAlert
·
--
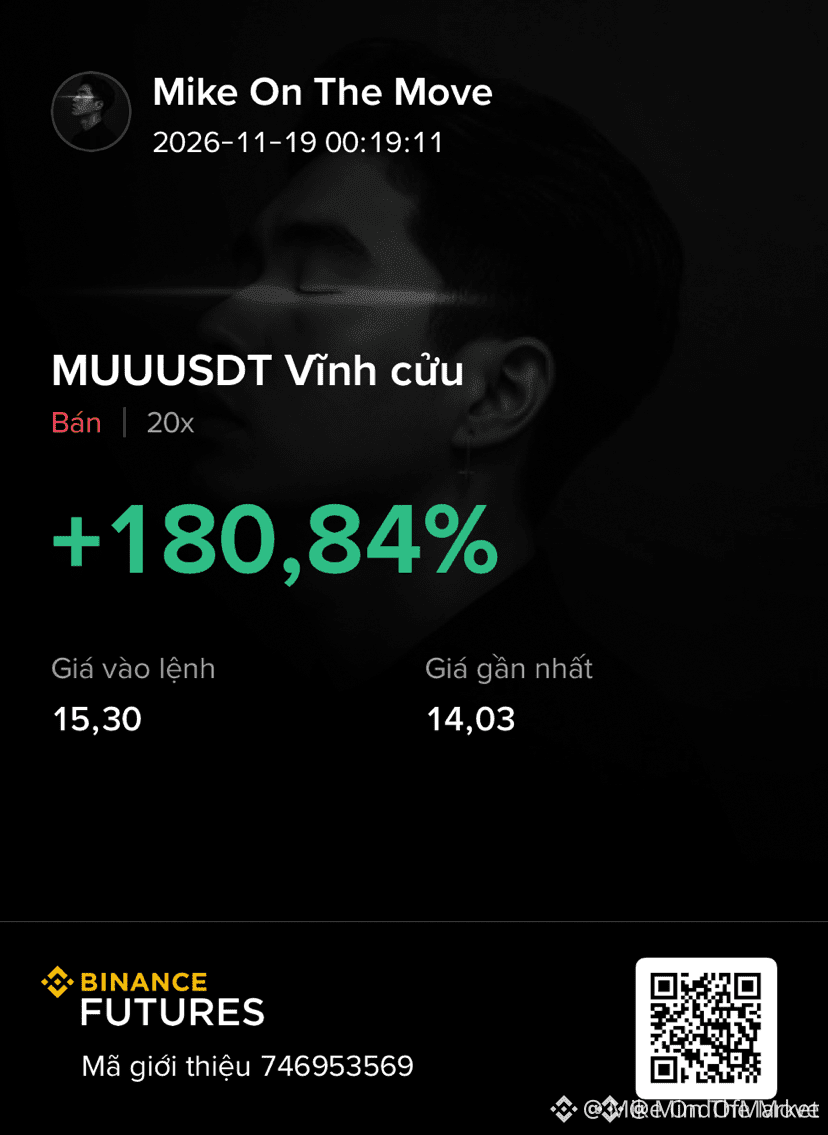
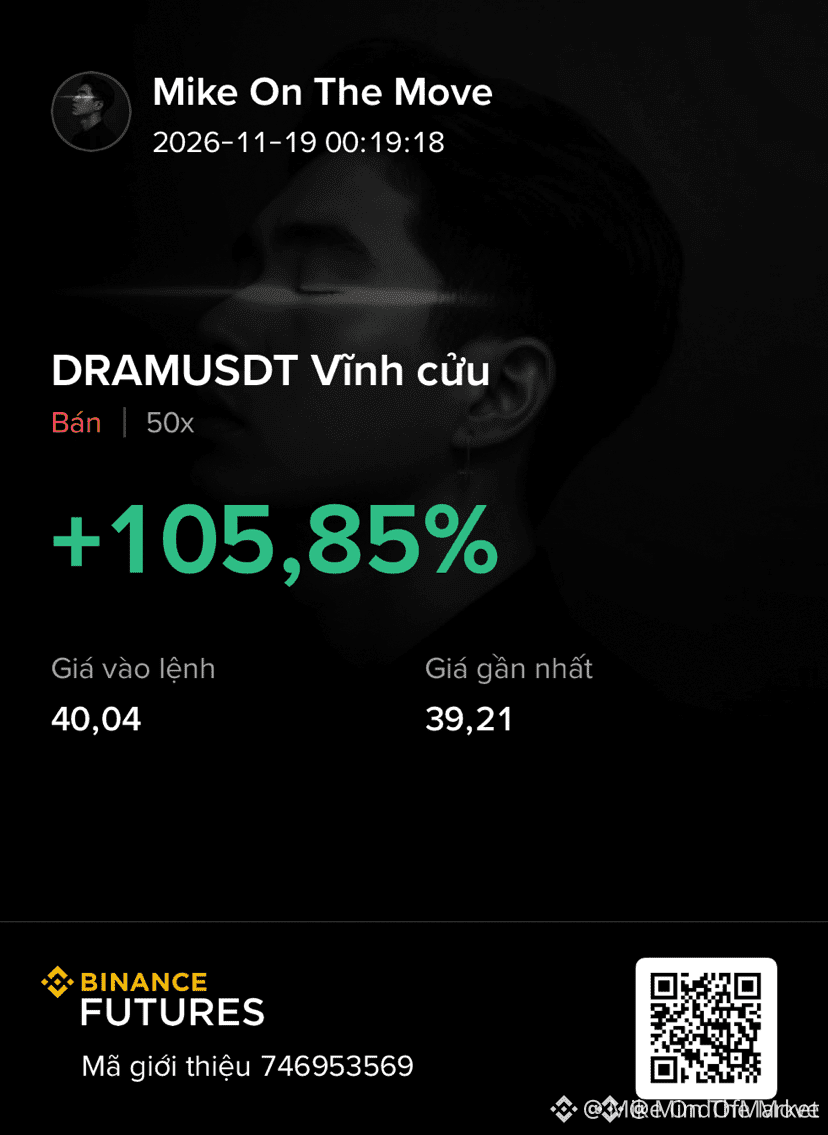
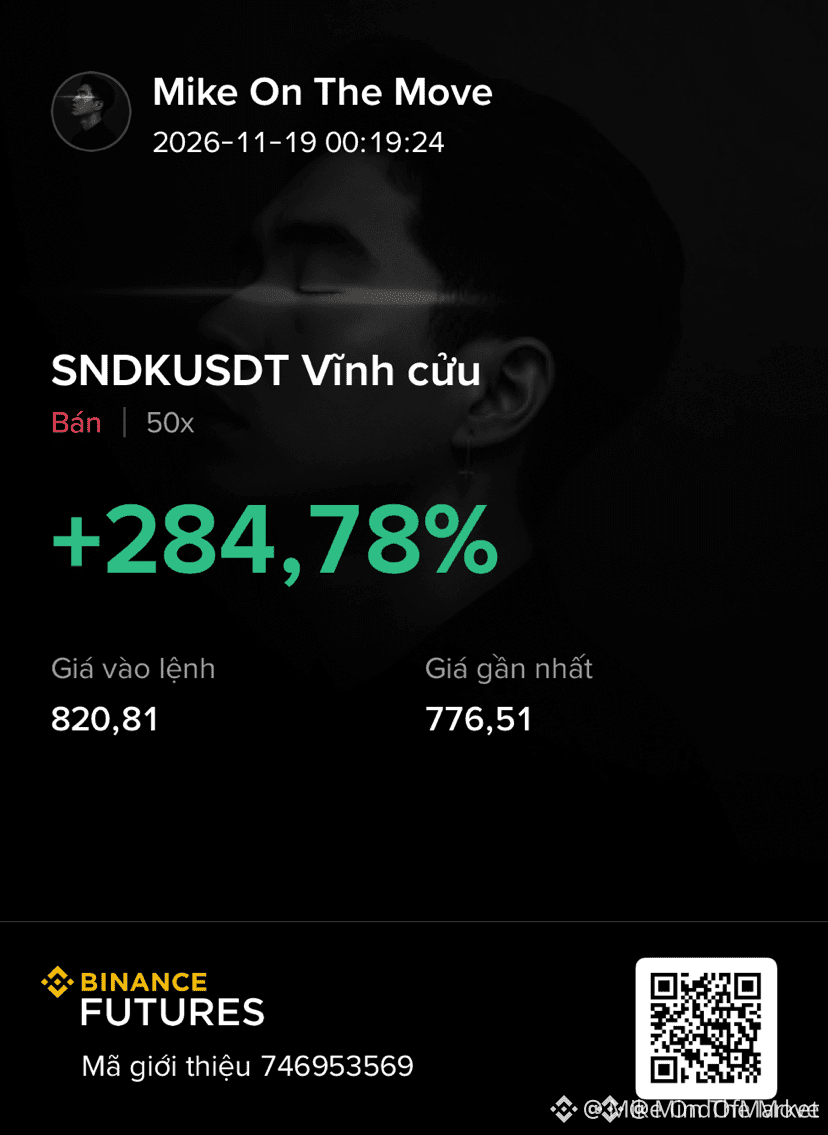
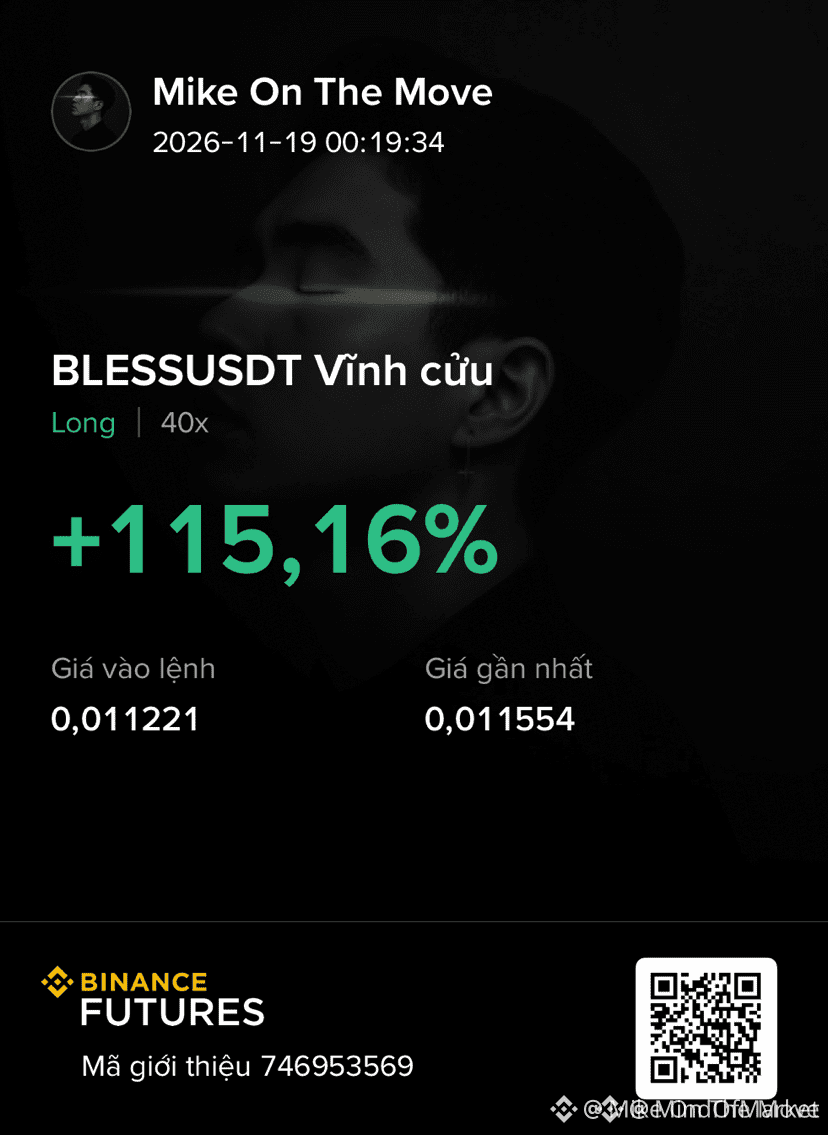
🦈 INSTITUTIONAL ORDER FLOW CAPTURES EXPANSIVE CONTINUATION ACROSS $MUU , $SNDK , AND $BLESS 📊
Execution precision proved paramount today as smart money engineered liquidity sweeps across both directional biases. Short positioning on $MUU and $SNDK cleanly absorbed retail resting orders into premium mitigation blocks, while the long allocation on $BLESS capitalized on institutional reaccumulation. ⚡
Order books indicate efficient absorption at key structural boundaries, validating the thesis behind these multi-directional distributions. 🔍 Securing realized profits here protects capital ahead of the next high-timeframe expansion phase. 💡
Are you locking in gains at current levels or holding positions for deeper structural targets? 👇
⚠️ Not financial advice. Always manage your risk. 🛡️
🏷️ #MUU #SmartMoney #OrderBlock #Crypto
🔥 💎
🦈 INSTITUTIONAL ORDER FLOW CAPTURES EXPANSIVE CONTINUATION ACROSS $MUU , $SNDK , AND $BLESS 📊
Execution precision proved paramount today as smart money engineered liquidity sweeps across both directional biases. Short positioning on $MUU and $SNDK cleanly absorbed retail resting orders into premium mitigation blocks, while the long allocation on $BLESS capitalized on institutional reaccumulation. ⚡
Order books indicate efficient absorption at key structural boundaries, validating the thesis behind these multi-directional distributions. 🔍 Securing realized profits here protects capital ahead of the next high-timeframe expansion phase. 💡
Are you locking in gains at current levels or holding positions for deeper structural targets? 👇
⚠️ Not financial advice. Always manage your risk. 🛡️
🏷️ #MUU #SmartMoney #OrderBlock #Crypto
🔥 💎
Execution precision proved paramount today as smart money engineered liquidity sweeps across both directional biases. Short positioning on $MUU and $SNDK cleanly absorbed retail resting orders into premium mitigation blocks, while the long allocation on $BLESS capitalized on institutional reaccumulation. ⚡
Order books indicate efficient absorption at key structural boundaries, validating the thesis behind these multi-directional distributions. 🔍 Securing realized profits here protects capital ahead of the next high-timeframe expansion phase. 💡
Are you locking in gains at current levels or holding positions for deeper structural targets? 👇
⚠️ Not financial advice. Always manage your risk. 🛡️
🏷️ #MUU #SmartMoney #OrderBlock #Crypto
🔥 💎
16

·
--
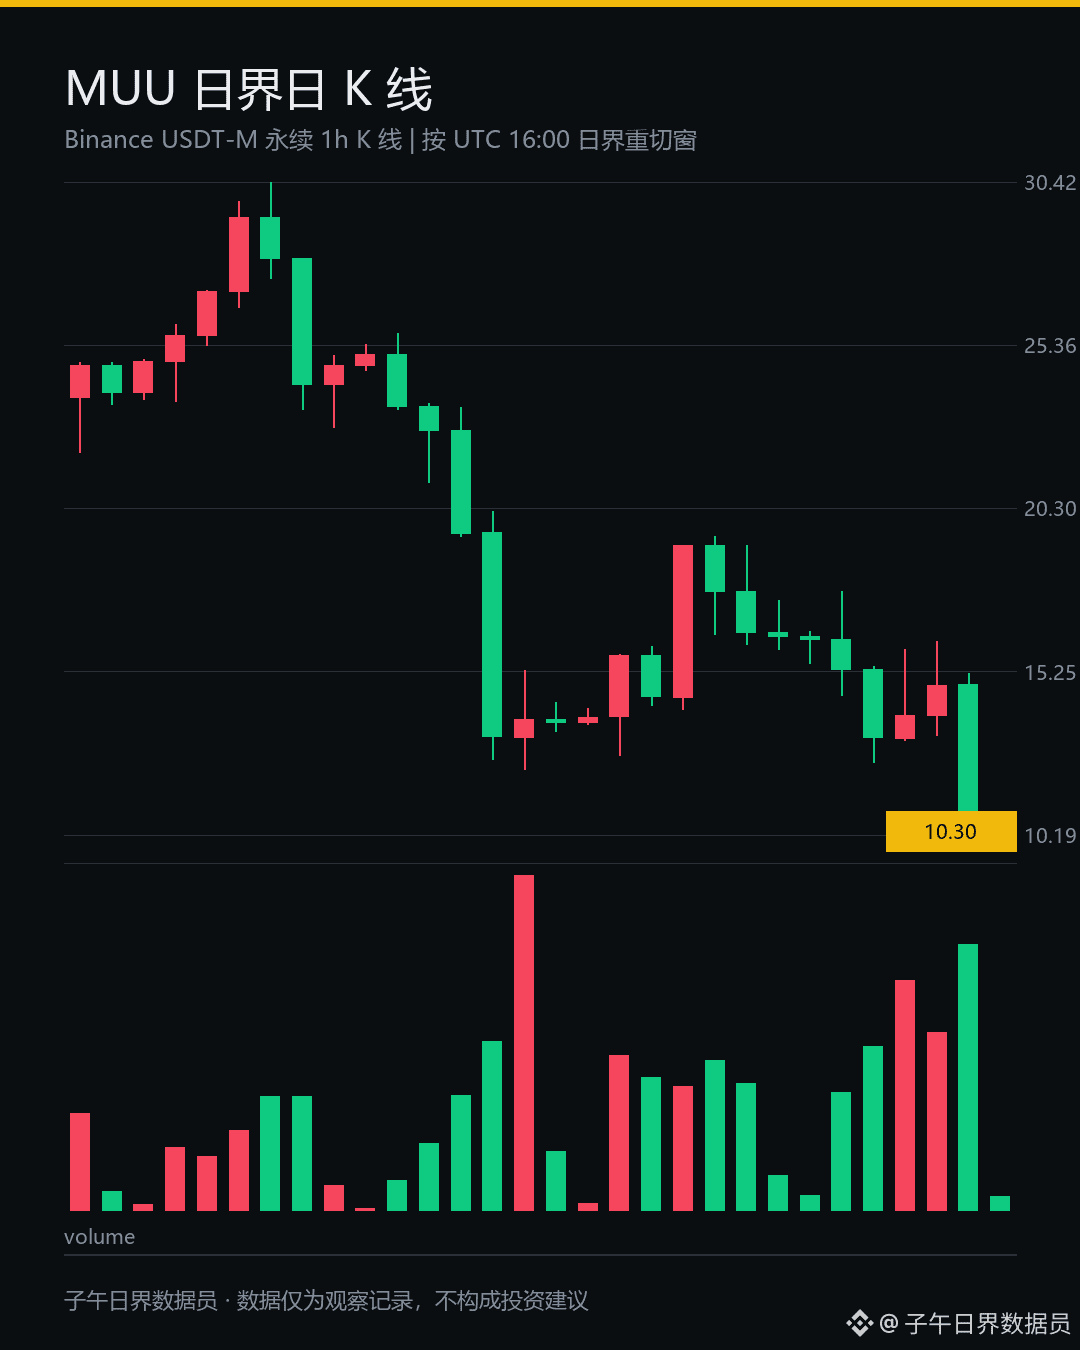
One day: -31.4%. Tonight, I’ve found the deepest cut.
When I first saw this number, I thought the decimal point had shifted.
$MUU is sitting at 10.25 right now. It had already broken through the 20-day low of 12.22.
There’s no reference point below.
With an asset that swings 25 points in a day, there are no steps on the way down.
I checked the open-interest figures twice before I believed them: the number of contracts fell by 15.6%, and the notional value dropped even more. Leverage really is pulling out.
It’s pulling out cleanly.
The funding rate is hovering near zero, and long accounts still make up 62.4%. The people haven’t left, but half the money has already pulled out.
It’s like a reservoir gate has been open all day, yet the water downstream still hasn’t reached its lowest level.
The price rolled all the way from 25.7 to just over 10, without a single decent rebound or any support line that could hold.
I don’t understand this kind of disagreement at these levels, and I’m not going to guess how many more layers lie below.
The bids on the order book are as thin as the last spoonful of soup at the bottom of a pot. Liquidity is shifting down layer by layer; whoever enters first gets hit first.
I’ll keep watching and wait for it to show its direction before saying more.
What do you make of this combination: open interest running first, while account holders keep stubbornly holding on?
$BTC $ETH
#MUU #比特币 #Cryptocurrency
The above is a record of my personal trading system and observations of the data; it does not constitute investment advice.
One day: -31.4%. Tonight, I’ve found the deepest cut.
When I first saw this number, I thought the decimal point had shifted.
$MUU is sitting at 10.25 right now. It had already broken through the 20-day low of 12.22.
There’s no reference point below.
With an asset that swings 25 points in a day, there are no steps on the way down.
I checked the open-interest figures twice before I believed them: the number of contracts fell by 15.6%, and the notional value dropped even more. Leverage really is pulling out.
It’s pulling out cleanly.
The funding rate is hovering near zero, and long accounts still make up 62.4%. The people haven’t left, but half the money has already pulled out.
It’s like a reservoir gate has been open all day, yet the water downstream still hasn’t reached its lowest level.
The price rolled all the way from 25.7 to just over 10, without a single decent rebound or any support line that could hold.
I don’t understand this kind of disagreement at these levels, and I’m not going to guess how many more layers lie below.
The bids on the order book are as thin as the last spoonful of soup at the bottom of a pot. Liquidity is shifting down layer by layer; whoever enters first gets hit first.
I’ll keep watching and wait for it to show its direction before saying more.
What do you make of this combination: open interest running first, while account holders keep stubbornly holding on?
$BTC $ETH
#MUU #比特币 #Cryptocurrency
The above is a record of my personal trading system and observations of the data; it does not constitute investment advice.
When I first saw this number, I thought the decimal point had shifted.
$MUU is sitting at 10.25 right now. It had already broken through the 20-day low of 12.22.
There’s no reference point below.
With an asset that swings 25 points in a day, there are no steps on the way down.
I checked the open-interest figures twice before I believed them: the number of contracts fell by 15.6%, and the notional value dropped even more. Leverage really is pulling out.
It’s pulling out cleanly.
The funding rate is hovering near zero, and long accounts still make up 62.4%. The people haven’t left, but half the money has already pulled out.
It’s like a reservoir gate has been open all day, yet the water downstream still hasn’t reached its lowest level.
The price rolled all the way from 25.7 to just over 10, without a single decent rebound or any support line that could hold.
I don’t understand this kind of disagreement at these levels, and I’m not going to guess how many more layers lie below.
The bids on the order book are as thin as the last spoonful of soup at the bottom of a pot. Liquidity is shifting down layer by layer; whoever enters first gets hit first.
I’ll keep watching and wait for it to show its direction before saying more.
What do you make of this combination: open interest running first, while account holders keep stubbornly holding on?
$BTC $ETH
#MUU #比特币 #Cryptocurrency
The above is a record of my personal trading system and observations of the data; it does not constitute investment advice.
407


·
--
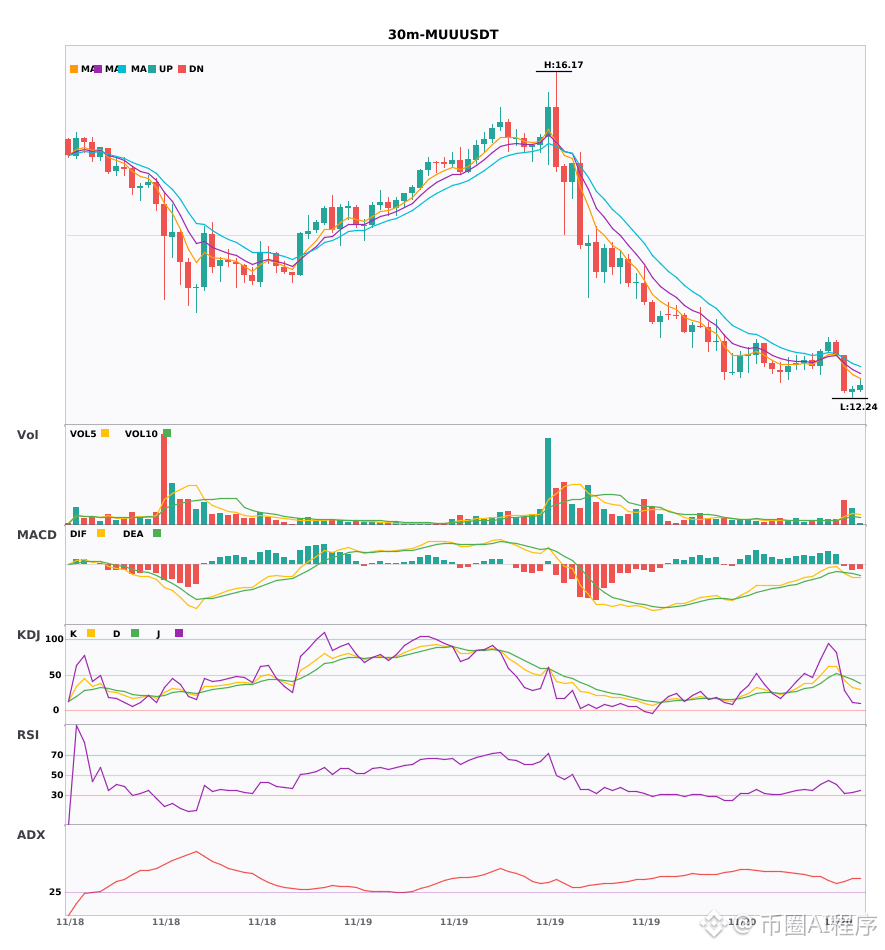
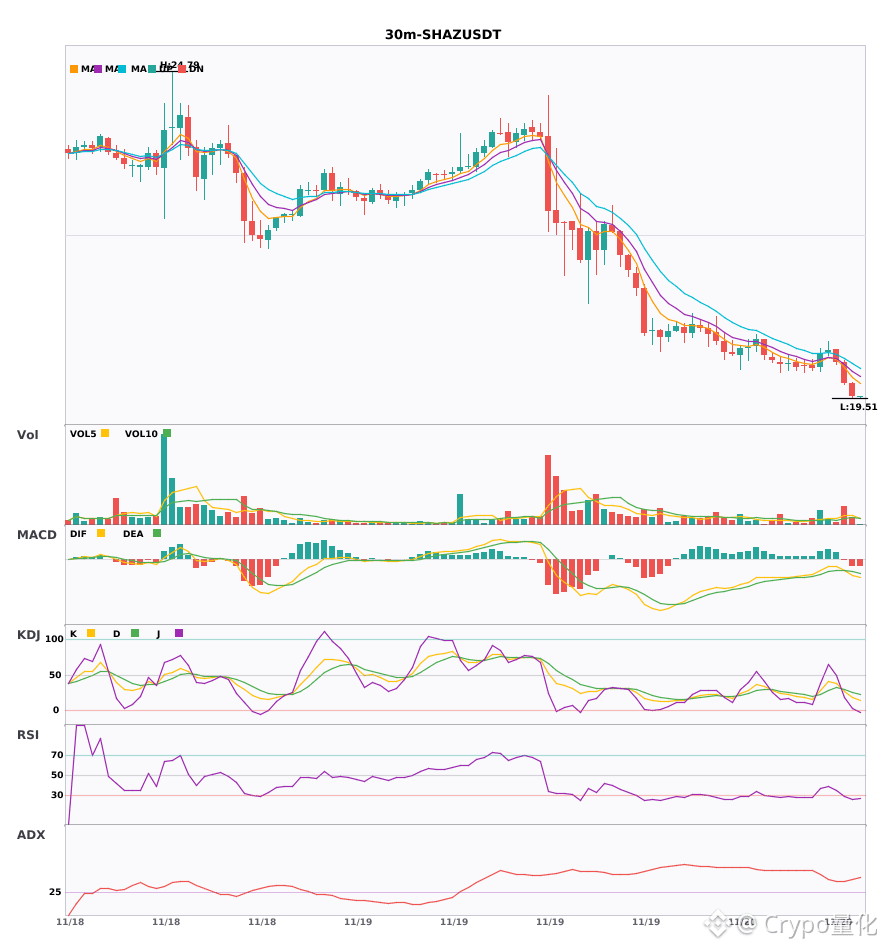
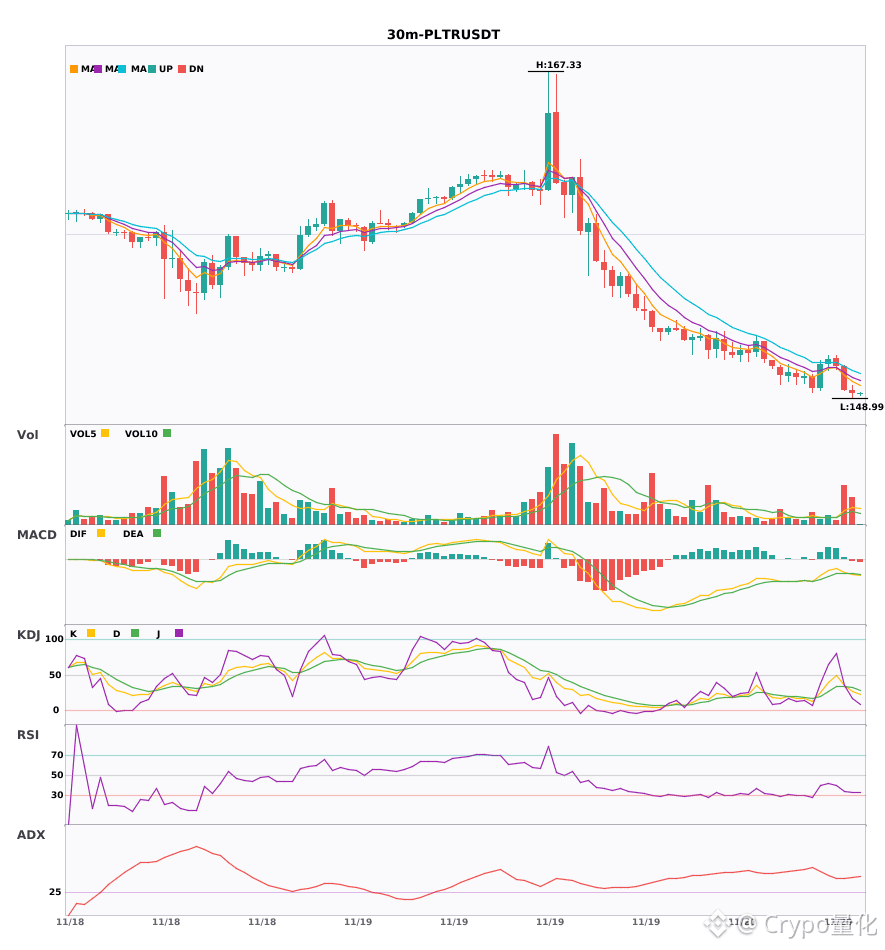
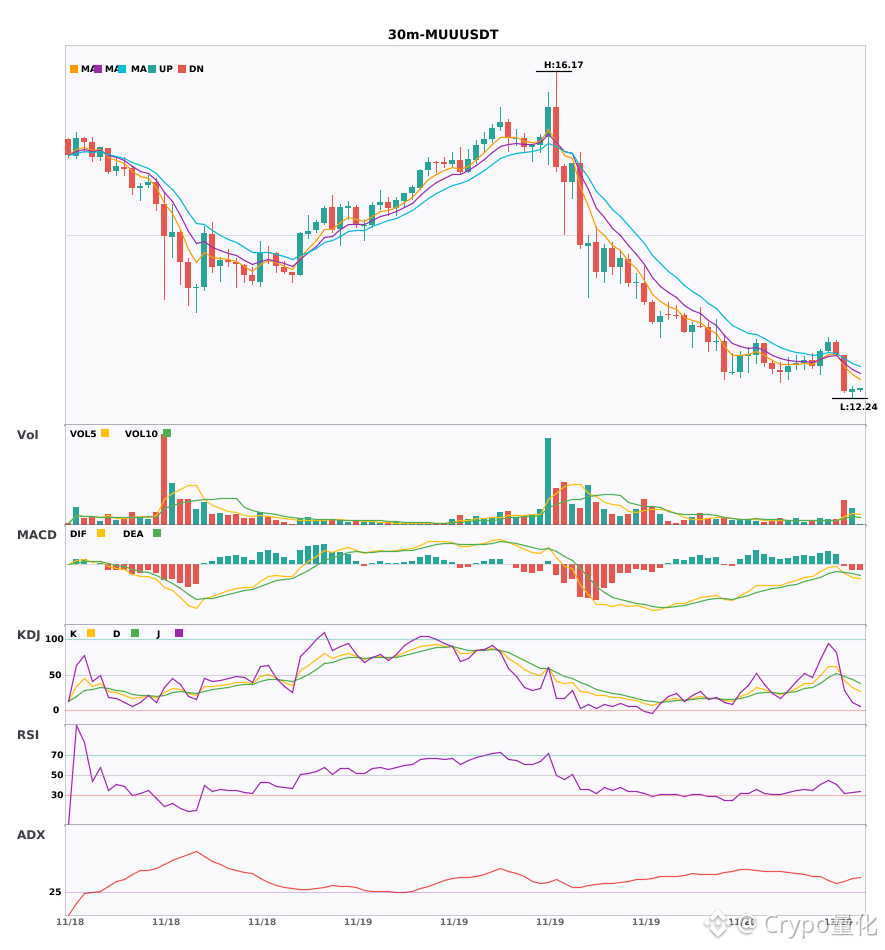
$SHAZ / $PLTR / $MUU 30-minute bearish signals emerge; the 4-hour bearish trend is confirmed 🔥
════════════════════
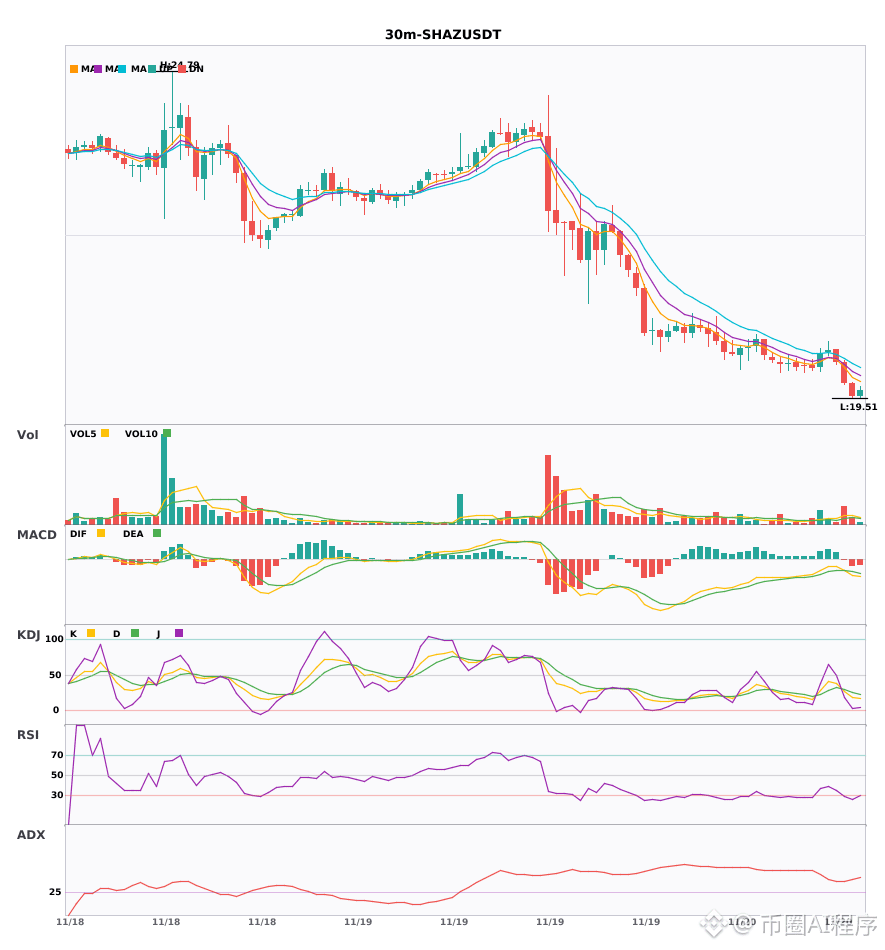
🟢 $SHAZ 30-minute bearish signal
⚠️Technical analysis: 4-hour bearish confluence confirmed. 30-minute entry: MACD bearish crossover below zero, with green histogram bars continuing to expand, indicating accelerating bearish momentum; moving averages are bearishly aligned and diverging downward; KDJ bearish crossover without being oversold; volume surges to 2.7 times the usual level. Multiple timeframes align bearish.
════════════════════
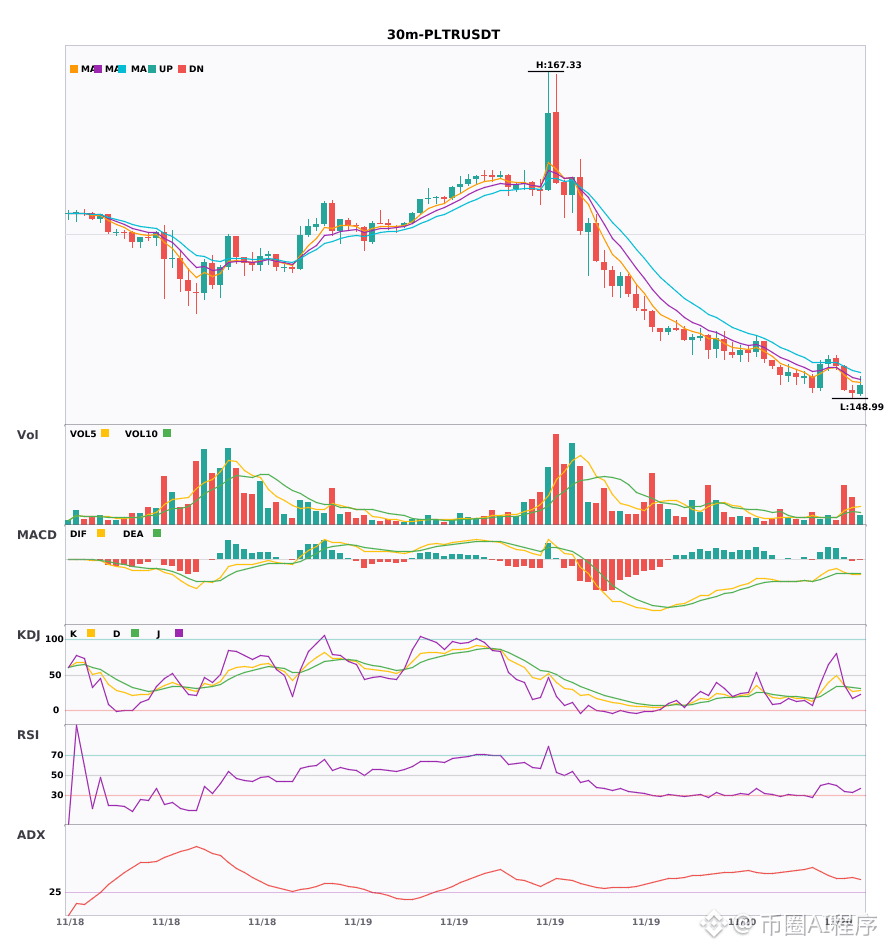
🟢 $PLTR 30-minute bearish signal
⚠️Technical analysis: 4-hour bearish confluence confirmed. 30-minute entry: MACD bearish crossover with green histogram bars; moving averages are bearishly aligned and diverging downward; KDJ bearish crossover without being oversold; volume increases 3.6 times.
════════════════════
🟢 $MUU 30-minute bearish signal
⚠️Technical analysis: 4-hour bearish momentum + 30-minute entry align across multiple timeframes! Green histogram bars expand after the MACD bearish crossover; moving averages have just turned downward; KDJ bearish crossover without being oversold; volume surges to 3.6 times the usual level.
════════════════════
🔔 Follow for first-hand market updates 🔔
#多周期共振 #SHAZ #PLTR #MUU
📌 When trading, pay attention to whether the candlestick pattern confirms the signal
$SHAZ / $PLTR / $MUU 30-minute bearish signals emerge; the 4-hour bearish trend is confirmed 🔥
════════════════════
🟢 $SHAZ 30-minute bearish signal
⚠️Technical analysis: 4-hour bearish confluence confirmed. 30-minute entry: MACD bearish crossover below zero, with green histogram bars continuing to expand, indicating accelerating bearish momentum; moving averages are bearishly aligned and diverging downward; KDJ bearish crossover without being oversold; volume surges to 2.7 times the usual level. Multiple timeframes align bearish.
════════════════════
🟢 $PLTR 30-minute bearish signal
⚠️Technical analysis: 4-hour bearish confluence confirmed. 30-minute entry: MACD bearish crossover with green histogram bars; moving averages are bearishly aligned and diverging downward; KDJ bearish crossover without being oversold; volume increases 3.6 times.
════════════════════
🟢 $MUU 30-minute bearish signal
⚠️Technical analysis: 4-hour bearish momentum + 30-minute entry align across multiple timeframes! Green histogram bars expand after the MACD bearish crossover; moving averages have just turned downward; KDJ bearish crossover without being oversold; volume surges to 3.6 times the usual level.
════════════════════
🔔 Follow for first-hand market updates 🔔
#多周期共振 #SHAZ #PLTR #MUU
📌 When trading, pay attention to whether the candlestick pattern confirms the signal
════════════════════
🟢 $SHAZ 30-minute bearish signal
⚠️Technical analysis: 4-hour bearish confluence confirmed. 30-minute entry: MACD bearish crossover below zero, with green histogram bars continuing to expand, indicating accelerating bearish momentum; moving averages are bearishly aligned and diverging downward; KDJ bearish crossover without being oversold; volume surges to 2.7 times the usual level. Multiple timeframes align bearish.
════════════════════
🟢 $PLTR 30-minute bearish signal
⚠️Technical analysis: 4-hour bearish confluence confirmed. 30-minute entry: MACD bearish crossover with green histogram bars; moving averages are bearishly aligned and diverging downward; KDJ bearish crossover without being oversold; volume increases 3.6 times.
════════════════════
🟢 $MUU 30-minute bearish signal
⚠️Technical analysis: 4-hour bearish momentum + 30-minute entry align across multiple timeframes! Green histogram bars expand after the MACD bearish crossover; moving averages have just turned downward; KDJ bearish crossover without being oversold; volume surges to 3.6 times the usual level.
════════════════════
🔔 Follow for first-hand market updates 🔔
#多周期共振 #SHAZ #PLTR #MUU
📌 When trading, pay attention to whether the candlestick pattern confirms the signal
6
·
--
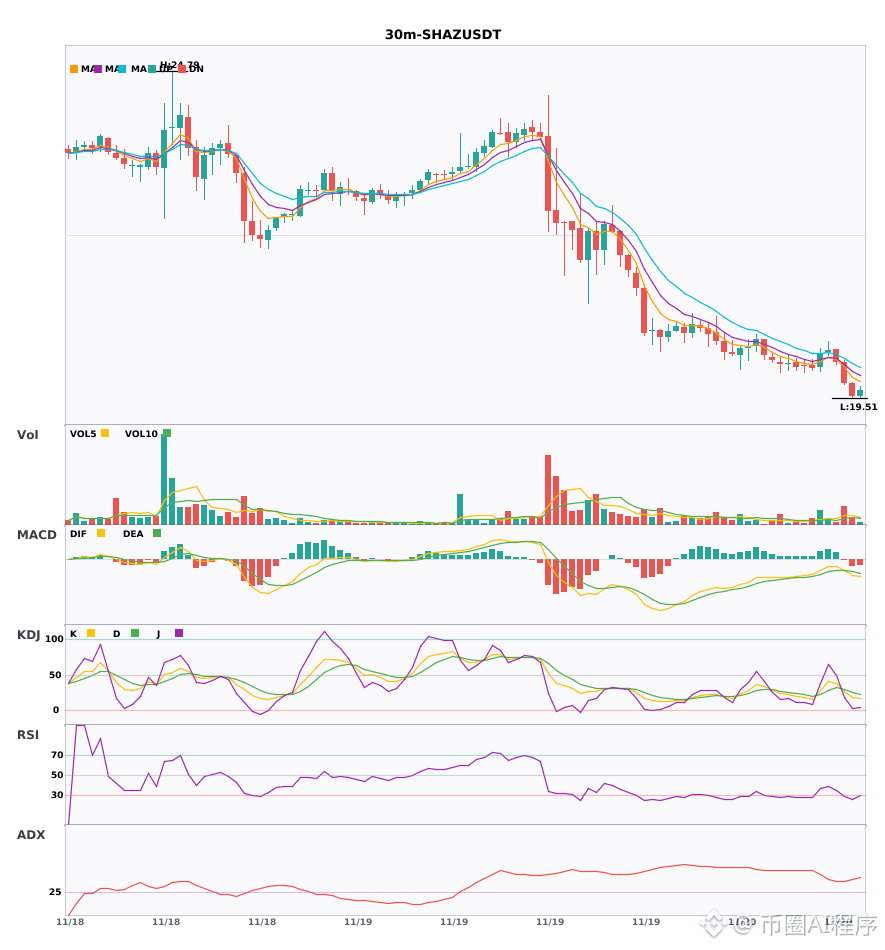
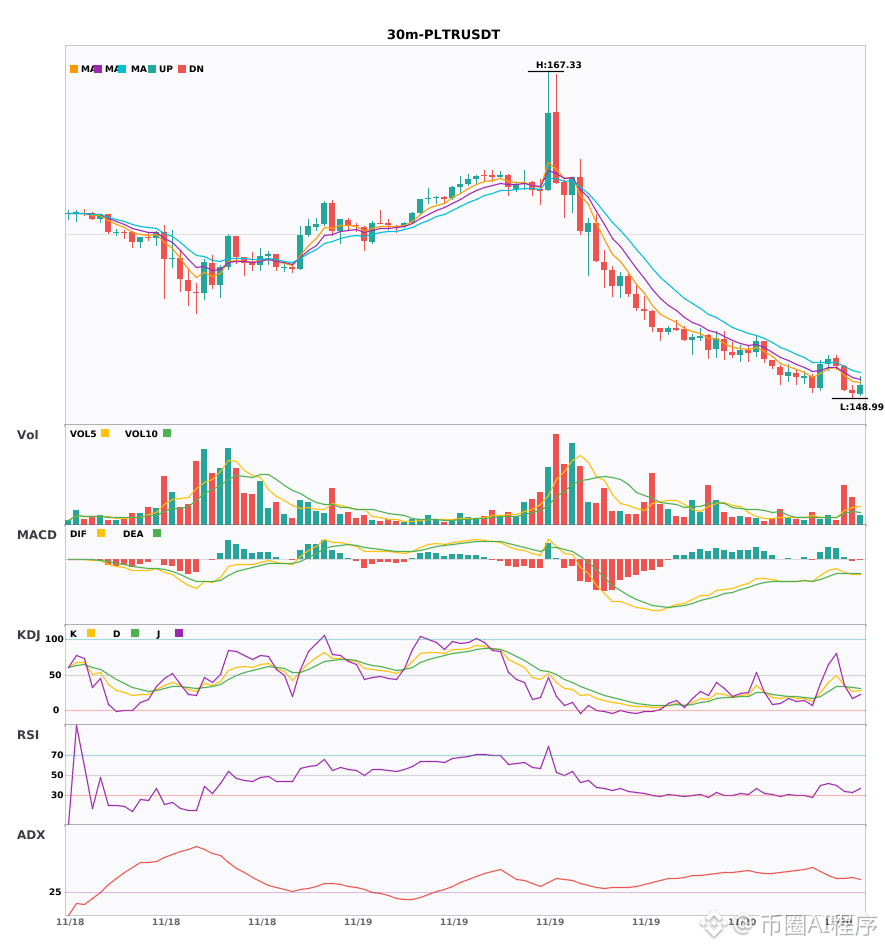
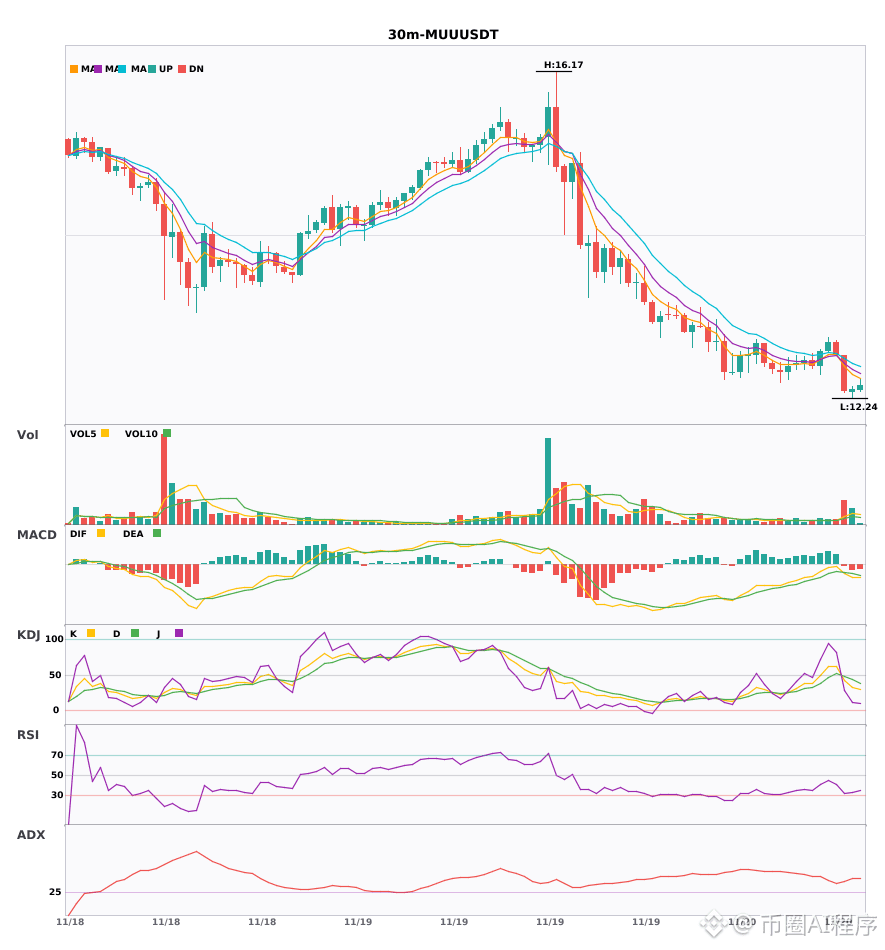
All 3 coins are bearish across multiple timeframes; the 30-minute and 4-hour charts confirm the downtrend 🔥
════════════════════
🟢 $SHAZ 30-minute bearish signal
⚠️ Technical analysis: 4-hour bearish confluence. 30-minute entry: MACD bearish crossover accelerating the downtrend, moving averages bearishly aligned and diverging, KDJ bearish crossover but not oversold, trading volume surging 2.7x. Short-term outlook is bearish.
════════════════════
🟢 $PLTR 30-minute bearish signal
⚠️ Technical analysis: 30-minute entry signal, confirmed by 4-hour bearish confluence. After the MACD bearish crossover, the green histogram bars continue to grow; moving averages are bearishly diverging downward; KDJ bearish crossover but not oversold; trading volume up 3.6x. Bearish with the trend.
════════════════════
🟢 $MUU 30-minute bearish signal
⚠️ Technical analysis: Confirmed 4-hour and 30-minute bearish confluence. Green histogram bars grow after the MACD bearish crossover; EMA5 crosses below EMA8, turning bearish; KDJ bearish crossover but not oversold; volume surges 3.6x. Bearish outlook.
════════════════════
🔔 Follow for first-hand market updates 🔔
#多周期共振 #SHAZ #PLTR #MUU
📌 When trading, pay attention to whether the candlestick pattern aligns
All 3 coins are bearish across multiple timeframes; the 30-minute and 4-hour charts confirm the downtrend 🔥
════════════════════
🟢 $SHAZ 30-minute bearish signal
⚠️ Technical analysis: 4-hour bearish confluence. 30-minute entry: MACD bearish crossover accelerating the downtrend, moving averages bearishly aligned and diverging, KDJ bearish crossover but not oversold, trading volume surging 2.7x. Short-term outlook is bearish.
════════════════════
🟢 $PLTR 30-minute bearish signal
⚠️ Technical analysis: 30-minute entry signal, confirmed by 4-hour bearish confluence. After the MACD bearish crossover, the green histogram bars continue to grow; moving averages are bearishly diverging downward; KDJ bearish crossover but not oversold; trading volume up 3.6x. Bearish with the trend.
════════════════════
🟢 $MUU 30-minute bearish signal
⚠️ Technical analysis: Confirmed 4-hour and 30-minute bearish confluence. Green histogram bars grow after the MACD bearish crossover; EMA5 crosses below EMA8, turning bearish; KDJ bearish crossover but not oversold; volume surges 3.6x. Bearish outlook.
════════════════════
🔔 Follow for first-hand market updates 🔔
#多周期共振 #SHAZ #PLTR #MUU
📌 When trading, pay attention to whether the candlestick pattern aligns
════════════════════
🟢 $SHAZ 30-minute bearish signal
⚠️ Technical analysis: 4-hour bearish confluence. 30-minute entry: MACD bearish crossover accelerating the downtrend, moving averages bearishly aligned and diverging, KDJ bearish crossover but not oversold, trading volume surging 2.7x. Short-term outlook is bearish.
════════════════════
🟢 $PLTR 30-minute bearish signal
⚠️ Technical analysis: 30-minute entry signal, confirmed by 4-hour bearish confluence. After the MACD bearish crossover, the green histogram bars continue to grow; moving averages are bearishly diverging downward; KDJ bearish crossover but not oversold; trading volume up 3.6x. Bearish with the trend.
════════════════════
🟢 $MUU 30-minute bearish signal
⚠️ Technical analysis: Confirmed 4-hour and 30-minute bearish confluence. Green histogram bars grow after the MACD bearish crossover; EMA5 crosses below EMA8, turning bearish; KDJ bearish crossover but not oversold; volume surges 3.6x. Bearish outlook.
════════════════════
🔔 Follow for first-hand market updates 🔔
#多周期共振 #SHAZ #PLTR #MUU
📌 When trading, pay attention to whether the candlestick pattern aligns
6

·
--
$SHAZ/$PLTR/$MUU 30 minutes turning bearish together, bears unite 🔥
════════════════════
🟢 $SHAZ 30-minute bearish signal
⚠️ Technicals: ADX 35 indicates a very strong trend; MACD below zero with a bearish crossover, accelerating downward; moving averages are bearishly aligned; KDJ bearish crossover signals a downtrend (K26/D30); volume is 2.7x higher.
════════════════════
🟢 $PLTR 30-minute bearish signal
⚠️ Technicals: ADX indicates a strong trend; MACD bearish crossover with expanding green bars; moving averages are bearishly aligned and diverging downward; KDJ bearish crossover and not oversold; volume surges to 3.6x, bearish short-term outlook.
════════════════════
🟢 $MUU 30-minute bearish signal
⚠️ Technicals: ADX is very high, indicating a clear trend. MACD bearish crossover accelerating downward; EMA5 crosses below EMA8, turning bearish; KDJ bearish crossover with K crossing below D, not oversold; volume surges to 3.6x, bearish near-term outlook.
════════════════════
🔔 Follow for the latest market-moving updates 🔔
#技术分析 #SHAZ #PLTR #MUU
📌 When trading, pay attention to whether the candlestick pattern confirms the setup
$SHAZ /$PLTR /$MUU 30 minutes turning bearish together, bears unite 🔥
════════════════════
🟢 $SHAZ 30-minute bearish signal
⚠️ Technicals: ADX 35 indicates a very strong trend; MACD below zero with a bearish crossover, accelerating downward; moving averages are bearishly aligned; KDJ bearish crossover signals a downtrend (K26/D30); volume is 2.7x higher.
════════════════════
🟢 $PLTR 30-minute bearish signal
⚠️ Technicals: ADX indicates a strong trend; MACD bearish crossover with expanding green bars; moving averages are bearishly aligned and diverging downward; KDJ bearish crossover and not oversold; volume surges to 3.6x, bearish short-term outlook.
════════════════════
🟢 $MUU 30-minute bearish signal
⚠️ Technicals: ADX is very high, indicating a clear trend. MACD bearish crossover accelerating downward; EMA5 crosses below EMA8, turning bearish; KDJ bearish crossover with K crossing below D, not oversold; volume surges to 3.6x, bearish near-term outlook.
════════════════════
🔔 Follow for the latest market-moving updates 🔔
#技术分析 #SHAZ #PLTR #MUU
📌 When trading, pay attention to whether the candlestick pattern confirms the setup
════════════════════
🟢 $SHAZ 30-minute bearish signal
⚠️ Technicals: ADX 35 indicates a very strong trend; MACD below zero with a bearish crossover, accelerating downward; moving averages are bearishly aligned; KDJ bearish crossover signals a downtrend (K26/D30); volume is 2.7x higher.
════════════════════
🟢 $PLTR 30-minute bearish signal
⚠️ Technicals: ADX indicates a strong trend; MACD bearish crossover with expanding green bars; moving averages are bearishly aligned and diverging downward; KDJ bearish crossover and not oversold; volume surges to 3.6x, bearish short-term outlook.
════════════════════
🟢 $MUU 30-minute bearish signal
⚠️ Technicals: ADX is very high, indicating a clear trend. MACD bearish crossover accelerating downward; EMA5 crosses below EMA8, turning bearish; KDJ bearish crossover with K crossing below D, not oversold; volume surges to 3.6x, bearish near-term outlook.
════════════════════
🔔 Follow for the latest market-moving updates 🔔
#技术分析 #SHAZ #PLTR #MUU
📌 When trading, pay attention to whether the candlestick pattern confirms the setup
2
·
--
Watching MUU’s order book, don’t let this one candle scare you just yet. What matters is whether selling pressure remains heavy in the next round.
Binance TradFi Perpetuals (traditional finance assets, with high gap risk outside trading hours) | MUU is down 10.59% over the past 24 hours. At 2026-11-20 11:15:06 Beijing time, the current price was approximately 12.67 (30m indicators use the 11:00 closing candle), with 24h trading volume of approximately 214 million; the 30m volume ratio was only 0.3x, indicating weak participation. Market positioning: 61% of accounts are long; the taker buy/sell ratio is 1.00 (taker activity is nearly balanced); 30m open interest is up 0.4%; funding rate is +0.0375%.
Reference indicators: 30m RSI at 24.4 is oversold; the 30m ATR trend-band reference level is 13.719936, and the current price is below it, indicating a weak structure.
The order book needs to provide two answers: can the taker buy/sell ratio of 1.00 hold above 1.10, and can the 30m RSI of 24.4 get back above 30? Only if both hold does it look like a recovery; if only one does, it’s still weak, range-bound trading.
#MUU #Abnormal Movement Alert
Watching MUU’s order book, don’t let this one candle scare you just yet. What matters is whether selling pressure remains heavy in the next round.
Binance TradFi Perpetuals (traditional finance assets, with high gap risk outside trading hours) | MUU is down 10.59% over the past 24 hours. At 2026-11-20 11:15:06 Beijing time, the current price was approximately 12.67 (30m indicators use the 11:00 closing candle), with 24h trading volume of approximately 214 million; the 30m volume ratio was only 0.3x, indicating weak participation. Market positioning: 61% of accounts are long; the taker buy/sell ratio is 1.00 (taker activity is nearly balanced); 30m open interest is up 0.4%; funding rate is +0.0375%.
Reference indicators: 30m RSI at 24.4 is oversold; the 30m ATR trend-band reference level is 13.719936, and the current price is below it, indicating a weak structure.
The order book needs to provide two answers: can the taker buy/sell ratio of 1.00 hold above 1.10, and can the 30m RSI of 24.4 get back above 30? Only if both hold does it look like a recovery; if only one does, it’s still weak, range-bound trading.
#MUU #Abnormal Movement Alert
Binance TradFi Perpetuals (traditional finance assets, with high gap risk outside trading hours) | MUU is down 10.59% over the past 24 hours. At 2026-11-20 11:15:06 Beijing time, the current price was approximately 12.67 (30m indicators use the 11:00 closing candle), with 24h trading volume of approximately 214 million; the 30m volume ratio was only 0.3x, indicating weak participation. Market positioning: 61% of accounts are long; the taker buy/sell ratio is 1.00 (taker activity is nearly balanced); 30m open interest is up 0.4%; funding rate is +0.0375%.
Reference indicators: 30m RSI at 24.4 is oversold; the 30m ATR trend-band reference level is 13.719936, and the current price is below it, indicating a weak structure.
The order book needs to provide two answers: can the taker buy/sell ratio of 1.00 hold above 1.10, and can the 30m RSI of 24.4 get back above 30? Only if both hold does it look like a recovery; if only one does, it’s still weak, range-bound trading.
#MUU #Abnormal Movement Alert
29

·
--
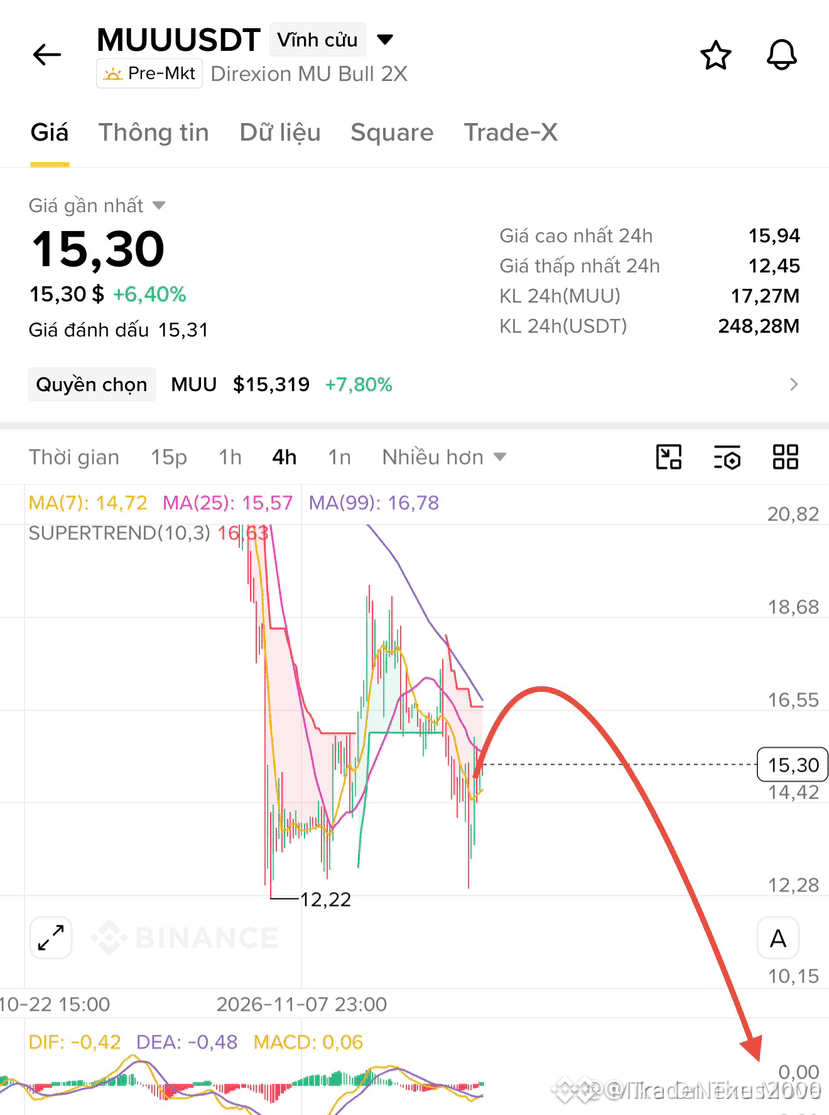
Bearish
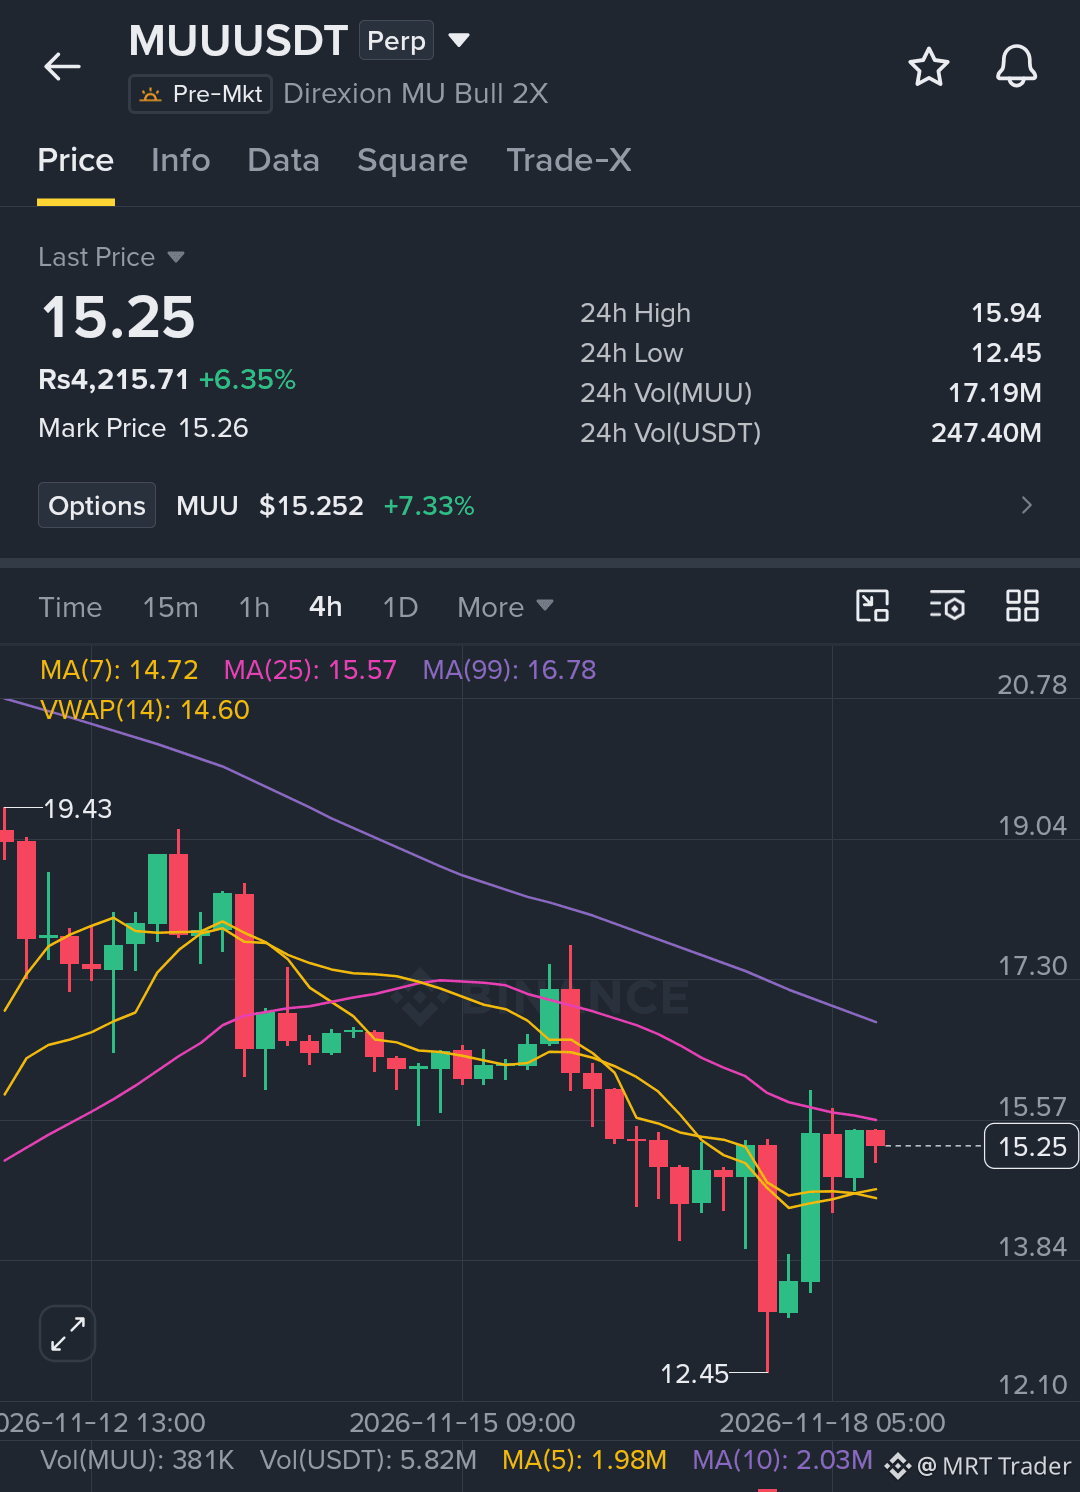
$MUU is stalling near resistance, with sellers starting to step in and weaken the structure.
Key Level
🔴 Bearish below 15.55
Trade Setup (Short)
🔴 Entry Zone: 15.18 – 15.48
🎯 Targets: 14.78 / 14.33 / 14.05
⛔ Stop Loss: 16.65
Hold the short while price stays under resistance, look to enter on pullbacks, and always manage your risk.
Click here to sell now 👉 $MUU
{future}(MUUUSDT)
#MUU #AnthropicClearedToListOnNasdaqAsANT
$MUU is stalling near resistance, with sellers starting to step in and weaken the structure.
Key Level
🔴 Bearish below 15.55
Trade Setup (Short)
🔴 Entry Zone: 15.18 – 15.48
🎯 Targets: 14.78 / 14.33 / 14.05
⛔ Stop Loss: 16.65
Hold the short while price stays under resistance, look to enter on pullbacks, and always manage your risk.
Click here to sell now 👉 $MUU
#MUU #AnthropicClearedToListOnNasdaqAsANT
Key Level
🔴 Bearish below 15.55
Trade Setup (Short)
🔴 Entry Zone: 15.18 – 15.48
🎯 Targets: 14.78 / 14.33 / 14.05
⛔ Stop Loss: 16.65
Hold the short while price stays under resistance, look to enter on pullbacks, and always manage your risk.
Click here to sell now 👉 $MUU
#MUU #AnthropicClearedToListOnNasdaqAsANT
3
37

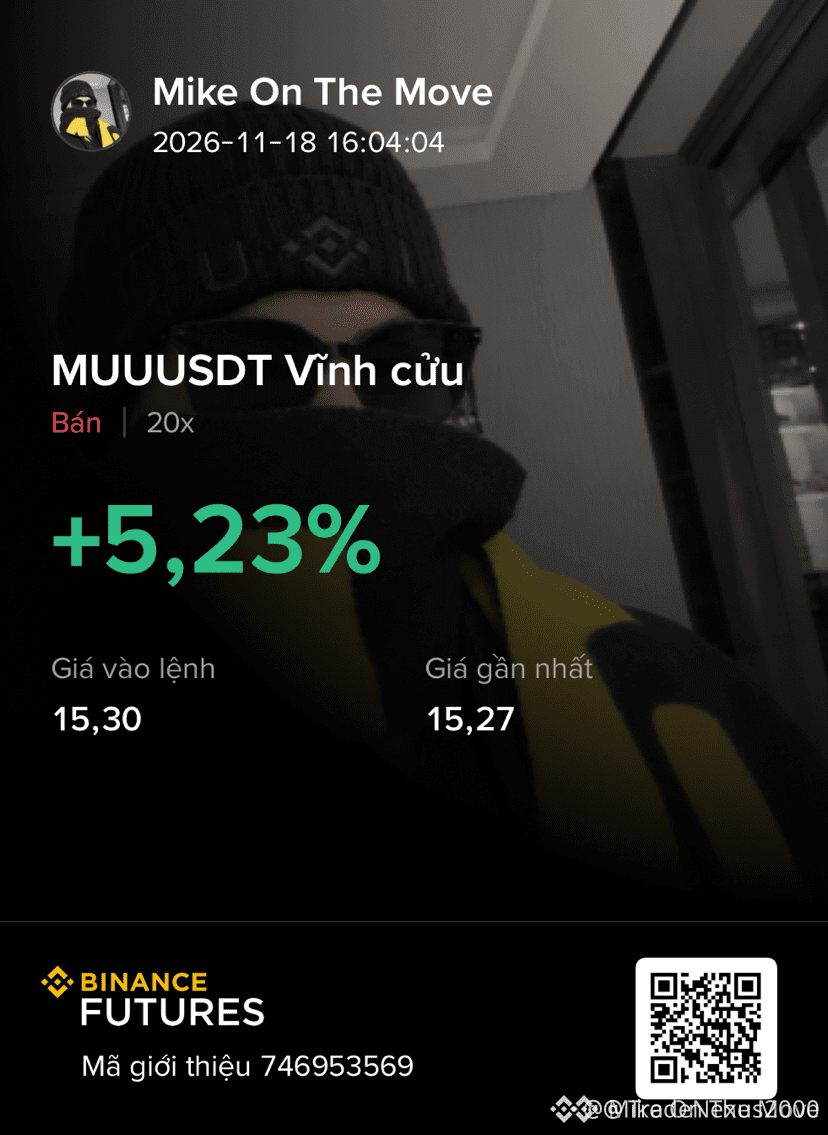
🚨 $MUU LOSING KEY STRUCTURAL SUPPORT AS SMART MONEY PRESSURES THE LOWS! 🐻
Entry: 15.15 - 15.45 ⚡
Target: 14.00 🚀
Stop Loss: 16.60 ⚠️
Institutional order flow is showing heavy distribution across the 15.15 to 15.45 zone, where institutional sellers previously absorbed late retail bids. 📊
Price action is carving out a clean liquidity sweep beneath local range lows, leaving major fair value gaps wide open for the taking. ⚡
Are you positioning short on this structural retest or waiting for a full session breakdown? 🤔
⚠️ Not financial advice. Always manage your risk. 🛡️
🏷️ #MUU #ShortSetup #SmartMoney #Crypto
🔥 💎
🚨 $MUU LOSING KEY STRUCTURAL SUPPORT AS SMART MONEY PRESSURES THE LOWS! 🐻
Entry: 15.15 - 15.45 ⚡
Target: 14.00 🚀
Stop Loss: 16.60 ⚠️
Institutional order flow is showing heavy distribution across the 15.15 to 15.45 zone, where institutional sellers previously absorbed late retail bids. 📊
Price action is carving out a clean liquidity sweep beneath local range lows, leaving major fair value gaps wide open for the taking. ⚡
Are you positioning short on this structural retest or waiting for a full session breakdown? 🤔
⚠️ Not financial advice. Always manage your risk. 🛡️
🏷️ #MUU #ShortSetup #SmartMoney #Crypto
🔥 💎
Entry: 15.15 - 15.45 ⚡
Target: 14.00 🚀
Stop Loss: 16.60 ⚠️
Institutional order flow is showing heavy distribution across the 15.15 to 15.45 zone, where institutional sellers previously absorbed late retail bids. 📊
Price action is carving out a clean liquidity sweep beneath local range lows, leaving major fair value gaps wide open for the taking. ⚡
Are you positioning short on this structural retest or waiting for a full session breakdown? 🤔
⚠️ Not financial advice. Always manage your risk. 🛡️
🏷️ #MUU #ShortSetup #SmartMoney #Crypto
🔥 💎
6

·
--
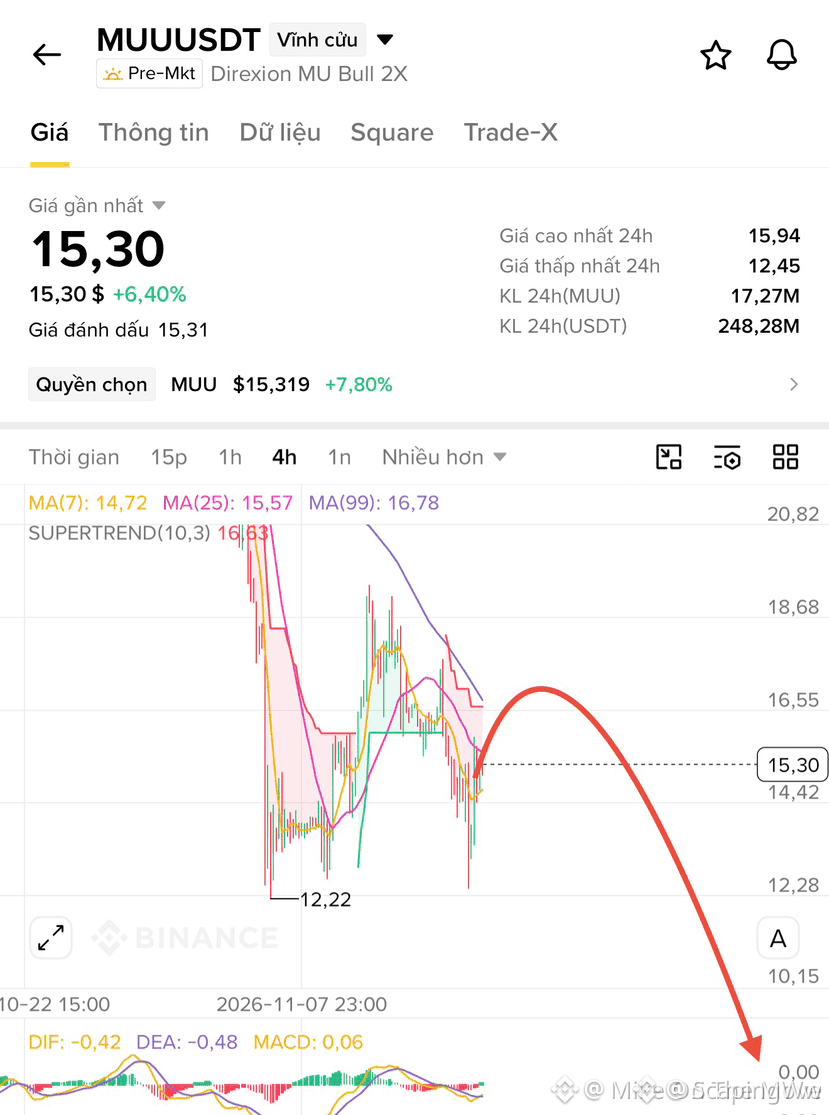
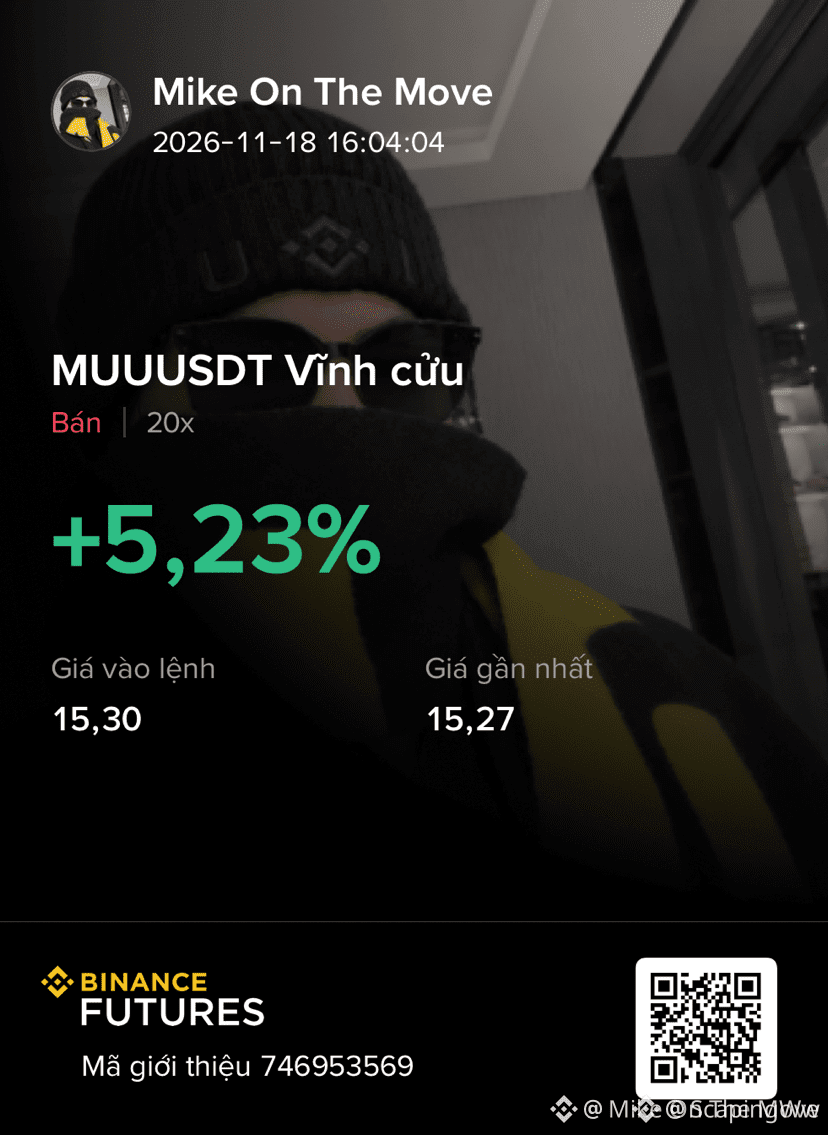
🔴 $MUU LOSING MOMENTUM AT RESISTANCE AS SELLERS MASSING FOR A BREAKDOWN! 📉
Entry: 15.15 - 15.45 ⚡
Target: 14.00 🎯
Stop Loss: 16.60 ⚠️
Bulls are completely exhausting their gas near the resistance ceiling, leaving a wide-open vacuum below current bids. 📊 Volume profiles show heavy distribution as sellers methodically swallow every relief bounce with zero hesitation.
This is a classic exhaustion pattern where trapped late-longs provide the exit liquidity for institutional short positioning. 🌊 Momentum indicators are tilting heavily downward on the lower timeframes, signaling a rapid cascade toward lower support zones.
💬 Are you positioning ahead of this flush or waiting for a confirmed break of local support? 👇
⚠️ Not financial advice. Always manage your risk. 🛡️
🏷️ #MUU #ShortSetup #Breakdown #Crypto #Trading
🔴 📉
🔴 $MUU LOSING MOMENTUM AT RESISTANCE AS SELLERS MASSING FOR A BREAKDOWN! 📉
Entry: 15.15 - 15.45 ⚡
Target: 14.00 🎯
Stop Loss: 16.60 ⚠️
Bulls are completely exhausting their gas near the resistance ceiling, leaving a wide-open vacuum below current bids. 📊 Volume profiles show heavy distribution as sellers methodically swallow every relief bounce with zero hesitation.
This is a classic exhaustion pattern where trapped late-longs provide the exit liquidity for institutional short positioning. 🌊 Momentum indicators are tilting heavily downward on the lower timeframes, signaling a rapid cascade toward lower support zones.
💬 Are you positioning ahead of this flush or waiting for a confirmed break of local support? 👇
⚠️ Not financial advice. Always manage your risk. 🛡️
🏷️ #MUU #ShortSetup #Breakdown #Crypto #Trading
🔴 📉
Entry: 15.15 - 15.45 ⚡
Target: 14.00 🎯
Stop Loss: 16.60 ⚠️
Bulls are completely exhausting their gas near the resistance ceiling, leaving a wide-open vacuum below current bids. 📊 Volume profiles show heavy distribution as sellers methodically swallow every relief bounce with zero hesitation.
This is a classic exhaustion pattern where trapped late-longs provide the exit liquidity for institutional short positioning. 🌊 Momentum indicators are tilting heavily downward on the lower timeframes, signaling a rapid cascade toward lower support zones.
💬 Are you positioning ahead of this flush or waiting for a confirmed break of local support? 👇
⚠️ Not financial advice. Always manage your risk. 🛡️
🏷️ #MUU #ShortSetup #Breakdown #Crypto #Trading
🔴 📉
16
·
--
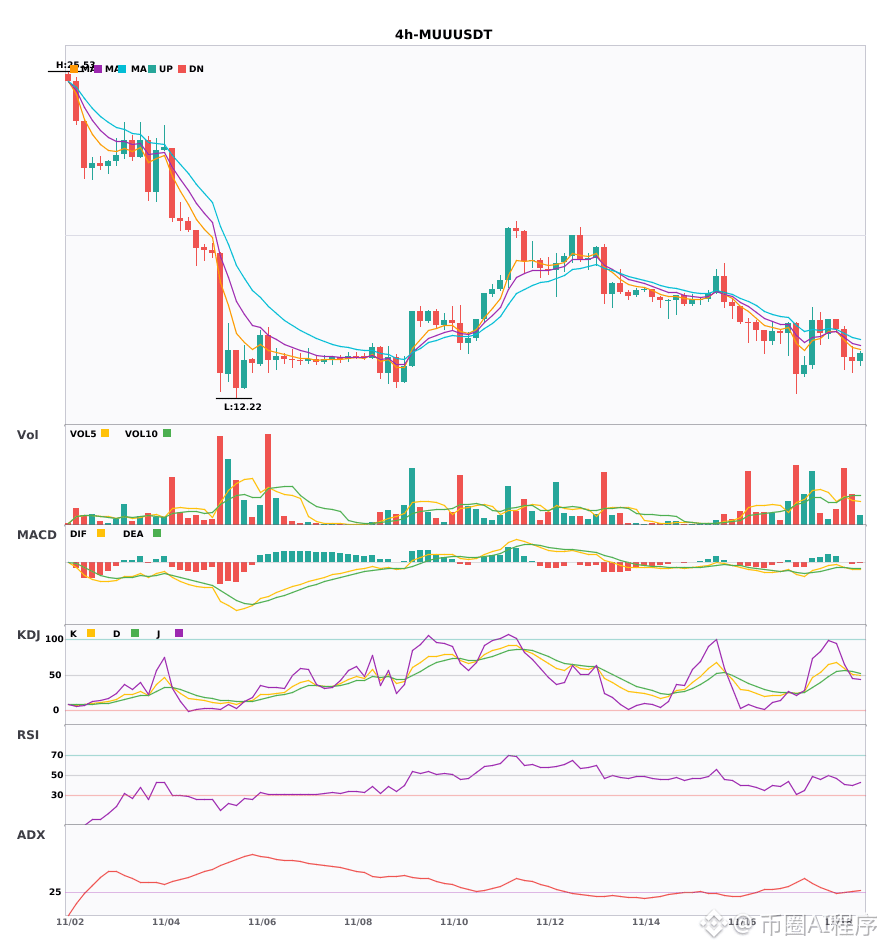
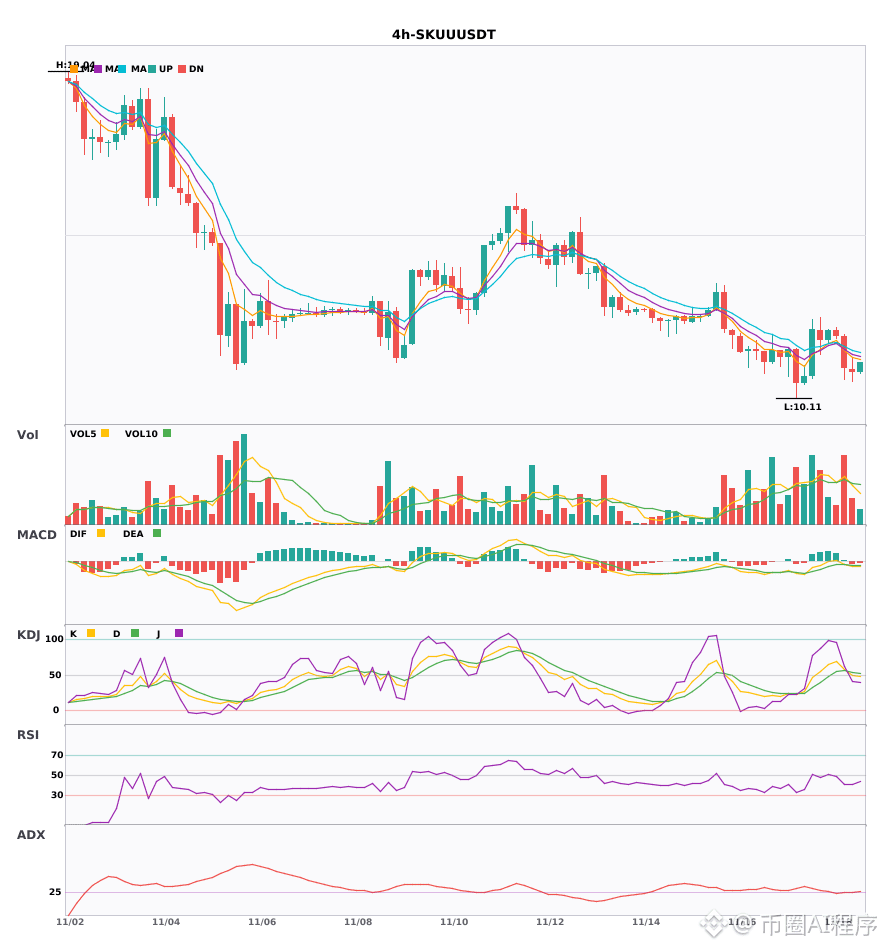
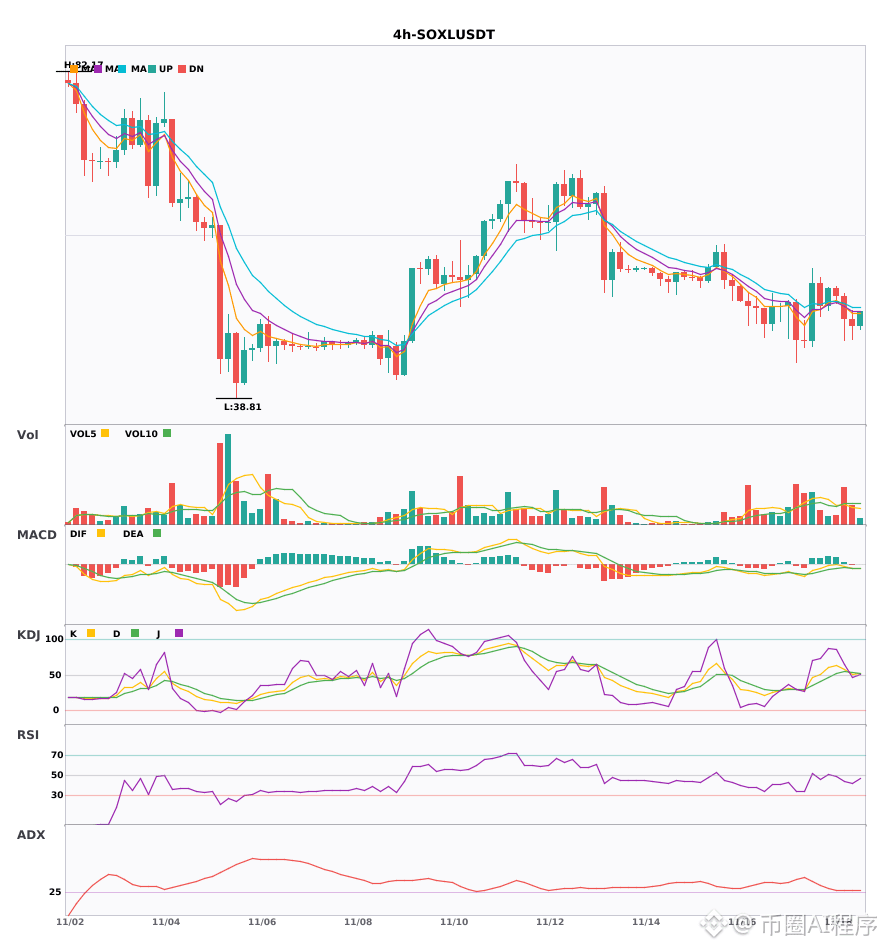
$MUU $SKUU $SOXL 4-hour daily line resonance bearish outlook🔥
════════════════════
🟢 $MUU 4-hour bearish signal
⚠️Technical: 4-hour bearish entry + daily bearish resonance confirmation, multiple timeframes aligned! MACD bearish crossover below zero, green histogram continues to expand, moving averages in bearish alignment and diverging downward, KDJ bearish crossover without entering oversold zone (K51.3/D54.3), trading volume expands 2.1x.
════════════════════
🟢 $SKUU 4-hour bearish signal
⚠️Technical: 4-hour MACD bearish crossover below zero with volume increase, bearish acceleration, moving averages in bearish alignment and diverging, KDJ bearish crossover with K crossing below D, volume expands 1.5x; daily bearish resonance confirmed, short-term bearish
════════════════════
🟢 $SOXL 4-hour bearish signal
⚠️Technical: Daily and 4-hour bearish resonance confirmed! MACD bearish crossover with volume increase, moving averages in bearish alignment and diverging downward, KDJ bearish crossover without entering oversold zone, volume expands 1.8x, bearish outlook
════════════════════
🔔 Follow for first-hand market moves 🔔
#多周期共振 #MUU #SKUU #SOXL
📌 When trading, pay attention to whether the candlestick pattern is in line with expectations
$MUU $SKUU $SOXL 4-hour daily line resonance bearish outlook🔥
════════════════════
🟢 $MUU 4-hour bearish signal
⚠️Technical: 4-hour bearish entry + daily bearish resonance confirmation, multiple timeframes aligned! MACD bearish crossover below zero, green histogram continues to expand, moving averages in bearish alignment and diverging downward, KDJ bearish crossover without entering oversold zone (K51.3/D54.3), trading volume expands 2.1x.
════════════════════
🟢 $SKUU 4-hour bearish signal
⚠️Technical: 4-hour MACD bearish crossover below zero with volume increase, bearish acceleration, moving averages in bearish alignment and diverging, KDJ bearish crossover with K crossing below D, volume expands 1.5x; daily bearish resonance confirmed, short-term bearish
════════════════════
🟢 $SOXL 4-hour bearish signal
⚠️Technical: Daily and 4-hour bearish resonance confirmed! MACD bearish crossover with volume increase, moving averages in bearish alignment and diverging downward, KDJ bearish crossover without entering oversold zone, volume expands 1.8x, bearish outlook
════════════════════
🔔 Follow for first-hand market moves 🔔
#多周期共振 #MUU #SKUU #SOXL
📌 When trading, pay attention to whether the candlestick pattern is in line with expectations
════════════════════
🟢 $MUU 4-hour bearish signal
⚠️Technical: 4-hour bearish entry + daily bearish resonance confirmation, multiple timeframes aligned! MACD bearish crossover below zero, green histogram continues to expand, moving averages in bearish alignment and diverging downward, KDJ bearish crossover without entering oversold zone (K51.3/D54.3), trading volume expands 2.1x.
════════════════════
🟢 $SKUU 4-hour bearish signal
⚠️Technical: 4-hour MACD bearish crossover below zero with volume increase, bearish acceleration, moving averages in bearish alignment and diverging, KDJ bearish crossover with K crossing below D, volume expands 1.5x; daily bearish resonance confirmed, short-term bearish
════════════════════
🟢 $SOXL 4-hour bearish signal
⚠️Technical: Daily and 4-hour bearish resonance confirmed! MACD bearish crossover with volume increase, moving averages in bearish alignment and diverging downward, KDJ bearish crossover without entering oversold zone, volume expands 1.8x, bearish outlook
════════════════════
🔔 Follow for first-hand market moves 🔔
#多周期共振 #MUU #SKUU #SOXL
📌 When trading, pay attention to whether the candlestick pattern is in line with expectations
32
·
--
The most counterintuitive part of MUU’s drop: the more panic there is, the more important it is to watch whether selling pressure is nearly exhausted.
Binance TradFi perpetuals (traditional finance; high risk of price gaps outside trading hours) | MUU is down 6.31% over the past 24 hours. At 2026-11-19 06:20:05 Beijing time, the price was around 13.8 (30m indicators use the 06:00 closing candle), with 24h trading volume of about 187 million; the 30m volume ratio was just 0.2x, indicating weak participation. Positioning: 61% of accounts are long; the active buy/sell ratio is 0.98 (aggressive trading is nearly balanced); 30m open interest is down 1.7%.
Reference indicators: the 30m ATR trend band reference level is 14.728795, and the price is below it, suggesting a weak structure; the current Bollinger Band range is roughly 13.240448–14.982552. A return to around the middle band would look more like sentiment moving back toward balance.
The disagreement here is very specific: some expect a further breakdown, while others expect a recovery from panic. What I’d rather watch is whether the active buy/sell ratio of 0.98 can hold above 1.10. If it can’t, even a sharp rebound could easily turn into a weak recovery.
#MUU #UnusualMoveAlert
The most counterintuitive part of MUU’s drop: the more panic there is, the more important it is to watch whether selling pressure is nearly exhausted.
Binance TradFi perpetuals (traditional finance; high risk of price gaps outside trading hours) | MUU is down 6.31% over the past 24 hours. At 2026-11-19 06:20:05 Beijing time, the price was around 13.8 (30m indicators use the 06:00 closing candle), with 24h trading volume of about 187 million; the 30m volume ratio was just 0.2x, indicating weak participation. Positioning: 61% of accounts are long; the active buy/sell ratio is 0.98 (aggressive trading is nearly balanced); 30m open interest is down 1.7%.
Reference indicators: the 30m ATR trend band reference level is 14.728795, and the price is below it, suggesting a weak structure; the current Bollinger Band range is roughly 13.240448–14.982552. A return to around the middle band would look more like sentiment moving back toward balance.
The disagreement here is very specific: some expect a further breakdown, while others expect a recovery from panic. What I’d rather watch is whether the active buy/sell ratio of 0.98 can hold above 1.10. If it can’t, even a sharp rebound could easily turn into a weak recovery.
#MUU #UnusualMoveAlert
Binance TradFi perpetuals (traditional finance; high risk of price gaps outside trading hours) | MUU is down 6.31% over the past 24 hours. At 2026-11-19 06:20:05 Beijing time, the price was around 13.8 (30m indicators use the 06:00 closing candle), with 24h trading volume of about 187 million; the 30m volume ratio was just 0.2x, indicating weak participation. Positioning: 61% of accounts are long; the active buy/sell ratio is 0.98 (aggressive trading is nearly balanced); 30m open interest is down 1.7%.
Reference indicators: the 30m ATR trend band reference level is 14.728795, and the price is below it, suggesting a weak structure; the current Bollinger Band range is roughly 13.240448–14.982552. A return to around the middle band would look more like sentiment moving back toward balance.
The disagreement here is very specific: some expect a further breakdown, while others expect a recovery from panic. What I’d rather watch is whether the active buy/sell ratio of 0.98 can hold above 1.10. If it can’t, even a sharp rebound could easily turn into a weak recovery.
#MUU #UnusualMoveAlert
1

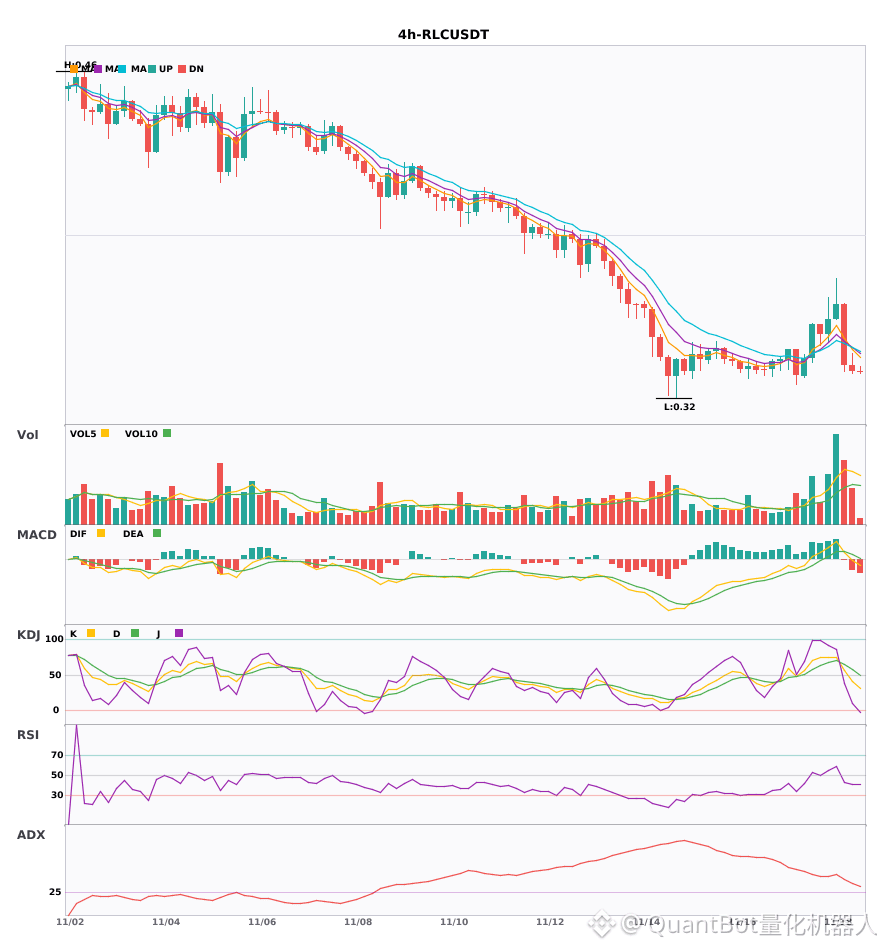
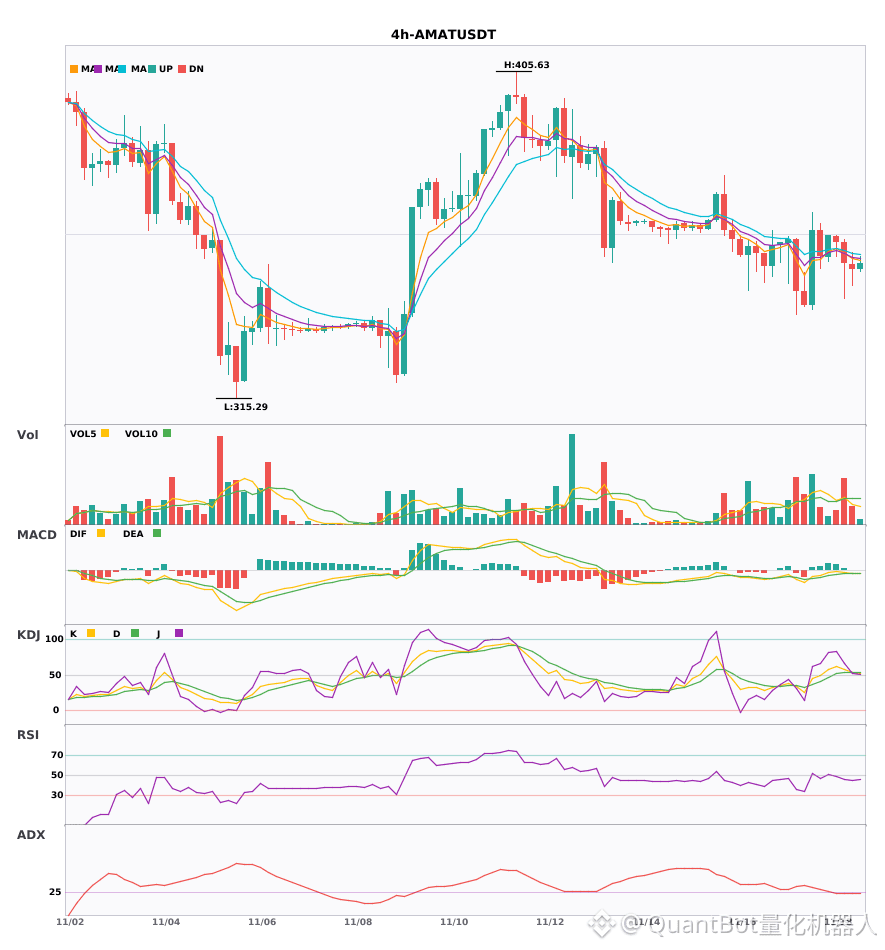
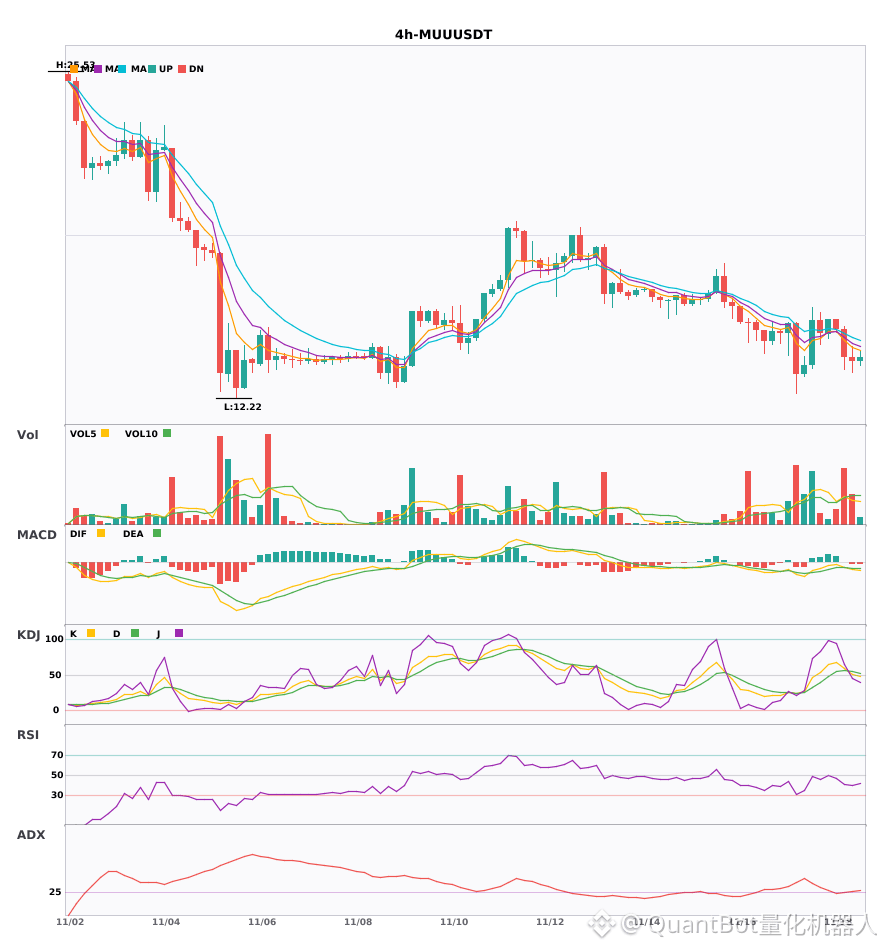
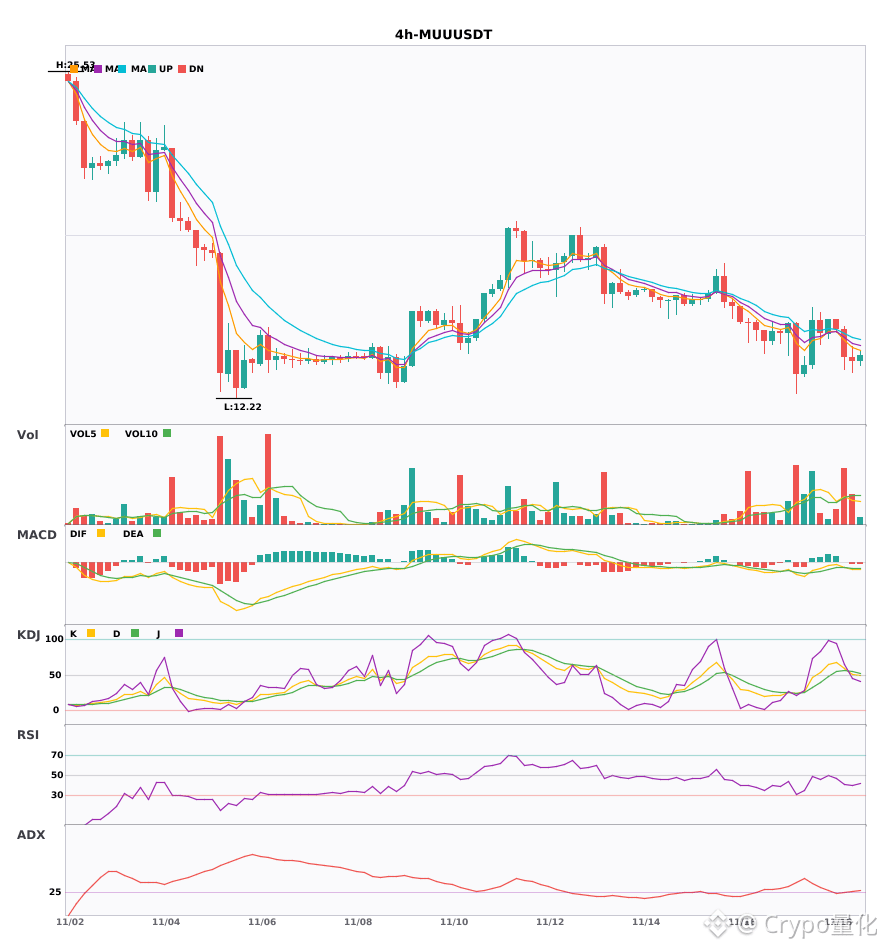
$RLC / $AMAT / $MUU 4H-level technical indicators are weakening in sync; beware of downside risks
📉 $RLC | 4-hour bearish signal
━━━━━━━━━━━━━━━━━━
Technical analysis: ADX(34) indicates a strong trend; MACD DIF crosses below zero, turning bearish; EMA5 crosses below EMA8, signaling short-term bearishness; volume expands 1.7x.
Price change: -0.7400%
📉 $AMAT | 4-hour bearish signal
━━━━━━━━━━━━━━━━━━
Technical analysis: ADX(26) shows the trend beginning to emerge; MACD bearish crossover below zero; EMA5/8/13 in bearish alignment; KDJ bearish crossover; volume expands 1.7x.
Price change: -0.4500%
📌 Market update: Binance will support cash dividend distributions for Microsoft (MSFT) and Applied Materials (AMAT) through bStocks.
📉 $MUU | 4-hour bearish signal
━━━━━━━━━━━━━━━━━━
Technical analysis: ADX(28) indicates an established trend, suitable for participation; MACD bearish crossover below zero; EMA5\u0026lt;8\u0026lt;13 in bearish alignment; KDJ bearish crossover; volume increases 2.1x
Price change: -1.1500%
━━━━━━━━━━━━━━━━━━
#技术分析 #RLC #AMAT #MUU
📌 The above content is for reference only and does not constitute investment advice
$RLC / $AMAT / $MUU 4H-level technical indicators are weakening in sync; beware of downside risks
📉 $RLC | 4-hour bearish signal
━━━━━━━━━━━━━━━━━━
Technical analysis: ADX(34) indicates a strong trend; MACD DIF crosses below zero, turning bearish; EMA5 crosses below EMA8, signaling short-term bearishness; volume expands 1.7x.
Price change: -0.7400%
📉 $AMAT | 4-hour bearish signal
━━━━━━━━━━━━━━━━━━
Technical analysis: ADX(26) shows the trend beginning to emerge; MACD bearish crossover below zero; EMA5/8/13 in bearish alignment; KDJ bearish crossover; volume expands 1.7x.
Price change: -0.4500%
📌 Market update: Binance will support cash dividend distributions for Microsoft (MSFT) and Applied Materials (AMAT) through bStocks.
📉 $MUU | 4-hour bearish signal
━━━━━━━━━━━━━━━━━━
Technical analysis: ADX(28) indicates an established trend, suitable for participation; MACD bearish crossover below zero; EMA5\u0026lt;8\u0026lt;13 in bearish alignment; KDJ bearish crossover; volume increases 2.1x
Price change: -1.1500%
━━━━━━━━━━━━━━━━━━
#技术分析 #RLC #AMAT #MUU
📌 The above content is for reference only and does not constitute investment advice
📉 $RLC | 4-hour bearish signal
━━━━━━━━━━━━━━━━━━
Technical analysis: ADX(34) indicates a strong trend; MACD DIF crosses below zero, turning bearish; EMA5 crosses below EMA8, signaling short-term bearishness; volume expands 1.7x.
Price change: -0.7400%
📉 $AMAT | 4-hour bearish signal
━━━━━━━━━━━━━━━━━━
Technical analysis: ADX(26) shows the trend beginning to emerge; MACD bearish crossover below zero; EMA5/8/13 in bearish alignment; KDJ bearish crossover; volume expands 1.7x.
Price change: -0.4500%
📌 Market update: Binance will support cash dividend distributions for Microsoft (MSFT) and Applied Materials (AMAT) through bStocks.
📉 $MUU | 4-hour bearish signal
━━━━━━━━━━━━━━━━━━
Technical analysis: ADX(28) indicates an established trend, suitable for participation; MACD bearish crossover below zero; EMA5\u0026lt;8\u0026lt;13 in bearish alignment; KDJ bearish crossover; volume increases 2.1x
Price change: -1.1500%
━━━━━━━━━━━━━━━━━━
#技术分析 #RLC #AMAT #MUU
📌 The above content is for reference only and does not constitute investment advice
12
·
--
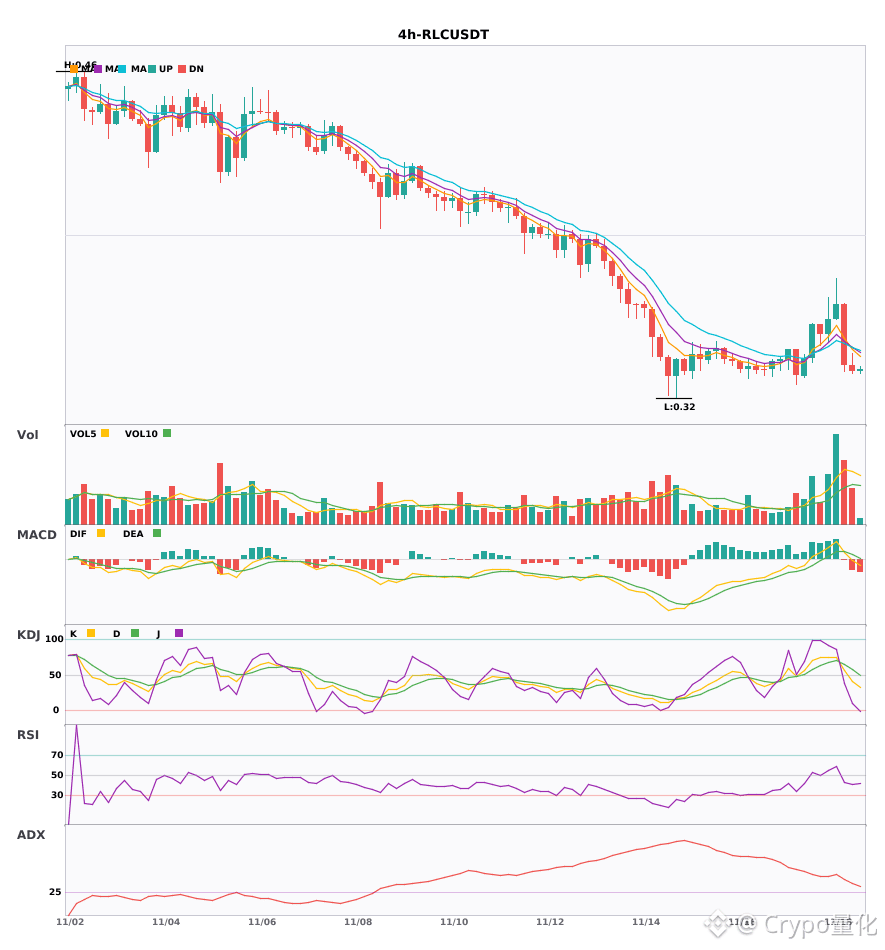
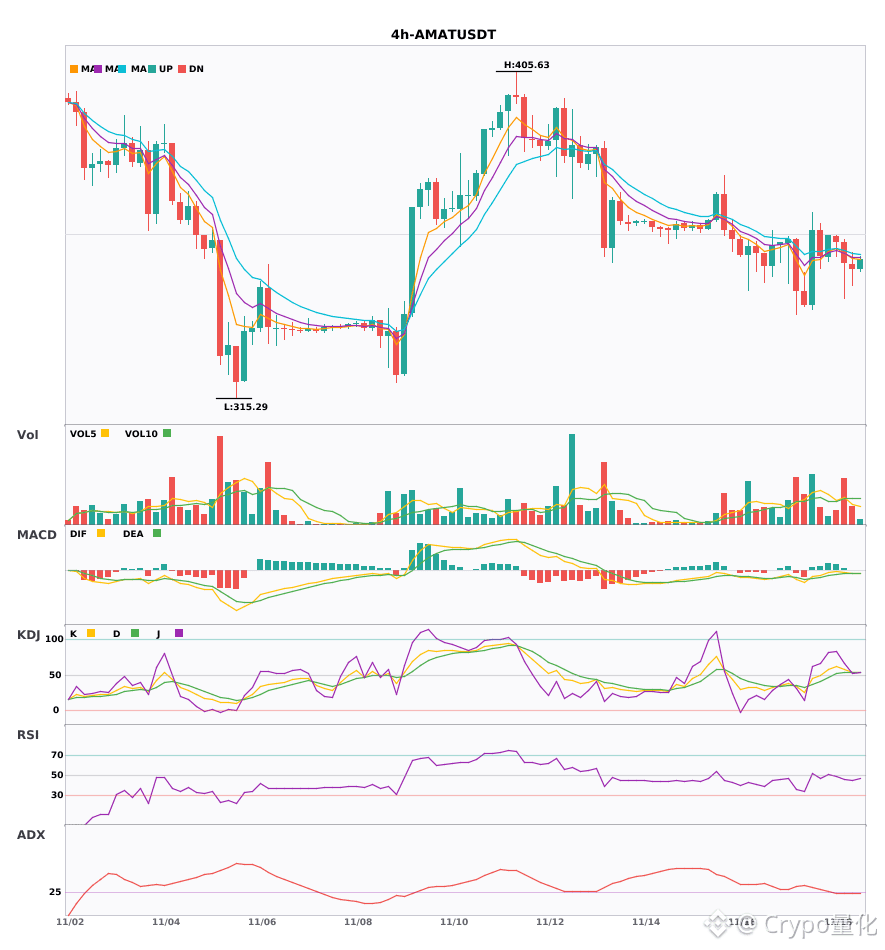
$RLC $AMAT $MUU 4-hour bearish alignment, under short-term pressure🔥
════════════════════
🟢 $RLC 4-hour bearish signal
⚠️Technical analysis: ADX(34) shows a fairly strong trend, but DIF has fallen below the zero line, turning bearish. EMA5 crossed below EMA8, signaling a short-term downtrend. Trading volume increased 1.7x.
════════════════════
🟢 $AMAT 4-hour bearish signal
⚠️Technical analysis: The ADX trend is just starting, so you can follow the bearish move. The MACD has formed a death cross, with expanding green bars. The moving averages are bearishly aligned and diverging downward. The KDJ death cross is bearish. Volume is up 1.7x.
📢Market update: Binance will support cash dividend distributions for Microsoft (MSFT) and Applied Materials (AMAT) through bStocks.
════════════════════
🟢 $MUU 4-hour bearish signal
⚠️Technical analysis: The ADX trend has just formed, so you can participate. The MACD death cross is accelerating on rising volume. The moving averages are bearishly aligned and diverging downward. The KDJ death cross has not yet reached oversold territory, so the short-term outlook is bearish. Trading volume increased 2.1x.
════════════════════
🔔 Follow for the latest market movements 🔔
#技术分析 #RLC #AMAT #MUU
📌 When trading, pay attention to whether the candlestick pattern confirms the signal
$RLC $AMAT $MUU 4-hour bearish alignment, under short-term pressure🔥
════════════════════
🟢 $RLC 4-hour bearish signal
⚠️Technical analysis: ADX(34) shows a fairly strong trend, but DIF has fallen below the zero line, turning bearish. EMA5 crossed below EMA8, signaling a short-term downtrend. Trading volume increased 1.7x.
════════════════════
🟢 $AMAT 4-hour bearish signal
⚠️Technical analysis: The ADX trend is just starting, so you can follow the bearish move. The MACD has formed a death cross, with expanding green bars. The moving averages are bearishly aligned and diverging downward. The KDJ death cross is bearish. Volume is up 1.7x.
📢Market update: Binance will support cash dividend distributions for Microsoft (MSFT) and Applied Materials (AMAT) through bStocks.
════════════════════
🟢 $MUU 4-hour bearish signal
⚠️Technical analysis: The ADX trend has just formed, so you can participate. The MACD death cross is accelerating on rising volume. The moving averages are bearishly aligned and diverging downward. The KDJ death cross has not yet reached oversold territory, so the short-term outlook is bearish. Trading volume increased 2.1x.
════════════════════
🔔 Follow for the latest market movements 🔔
#技术分析 #RLC #AMAT #MUU
📌 When trading, pay attention to whether the candlestick pattern confirms the signal
════════════════════
🟢 $RLC 4-hour bearish signal
⚠️Technical analysis: ADX(34) shows a fairly strong trend, but DIF has fallen below the zero line, turning bearish. EMA5 crossed below EMA8, signaling a short-term downtrend. Trading volume increased 1.7x.
════════════════════
🟢 $AMAT 4-hour bearish signal
⚠️Technical analysis: The ADX trend is just starting, so you can follow the bearish move. The MACD has formed a death cross, with expanding green bars. The moving averages are bearishly aligned and diverging downward. The KDJ death cross is bearish. Volume is up 1.7x.
📢Market update: Binance will support cash dividend distributions for Microsoft (MSFT) and Applied Materials (AMAT) through bStocks.
════════════════════
🟢 $MUU 4-hour bearish signal
⚠️Technical analysis: The ADX trend has just formed, so you can participate. The MACD death cross is accelerating on rising volume. The moving averages are bearishly aligned and diverging downward. The KDJ death cross has not yet reached oversold territory, so the short-term outlook is bearish. Trading volume increased 2.1x.
════════════════════
🔔 Follow for the latest market movements 🔔
#技术分析 #RLC #AMAT #MUU
📌 When trading, pay attention to whether the candlestick pattern confirms the signal
4
·
--
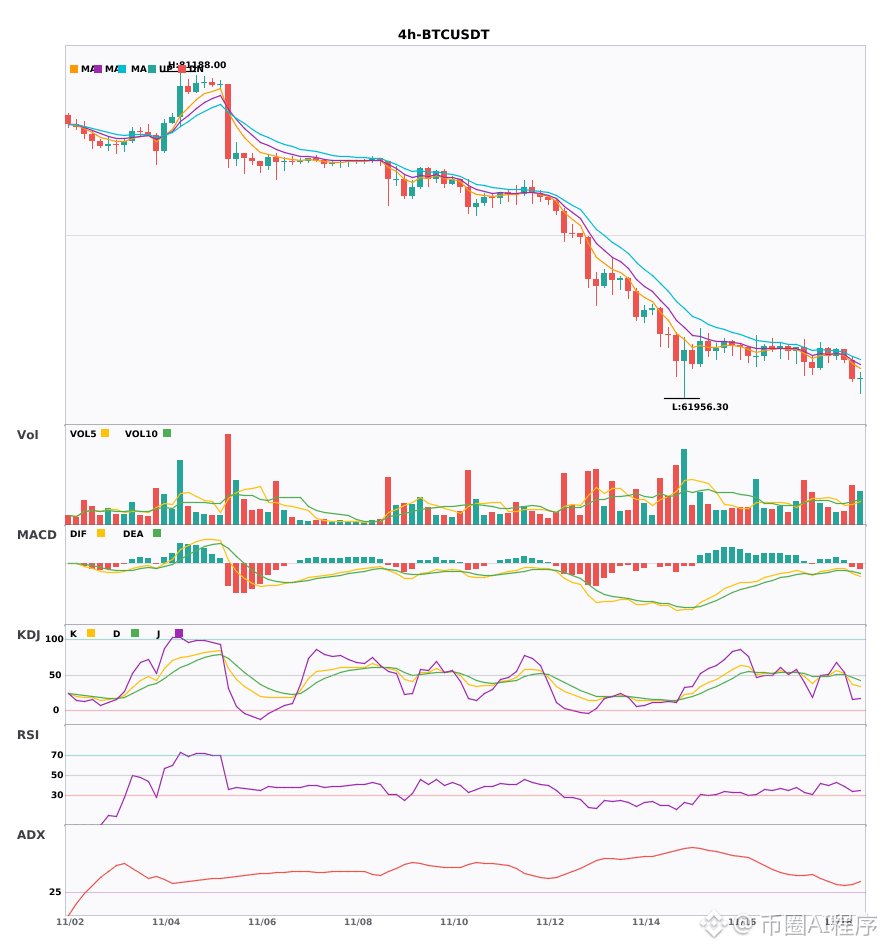
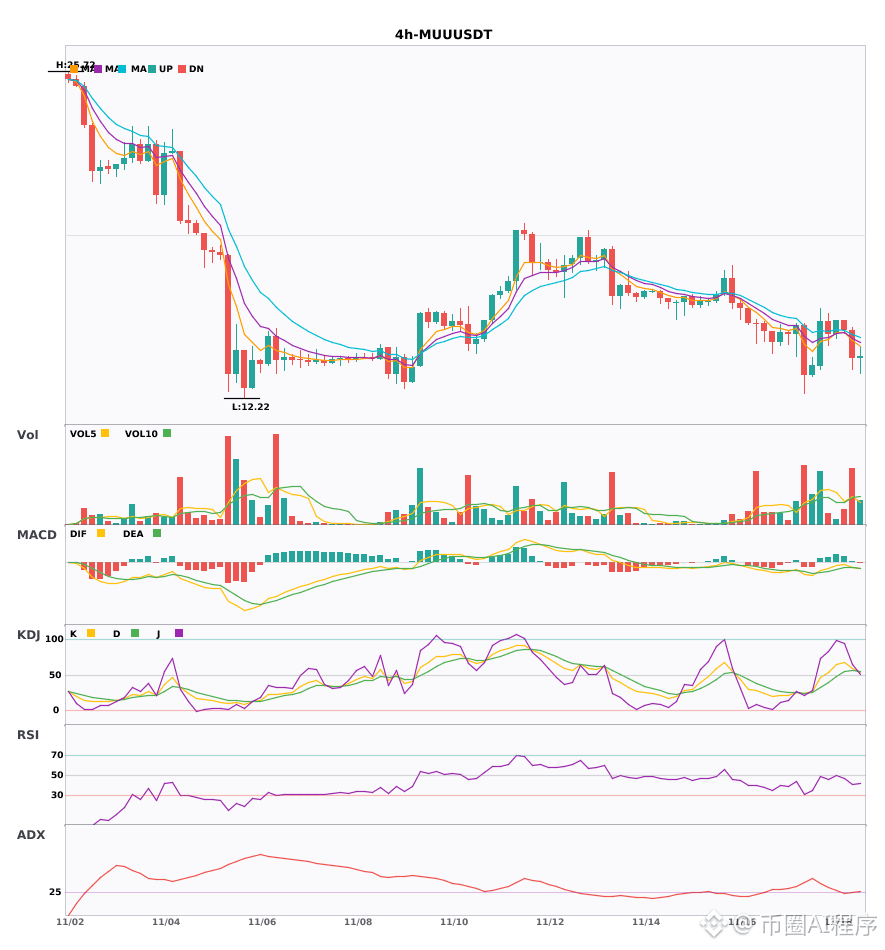
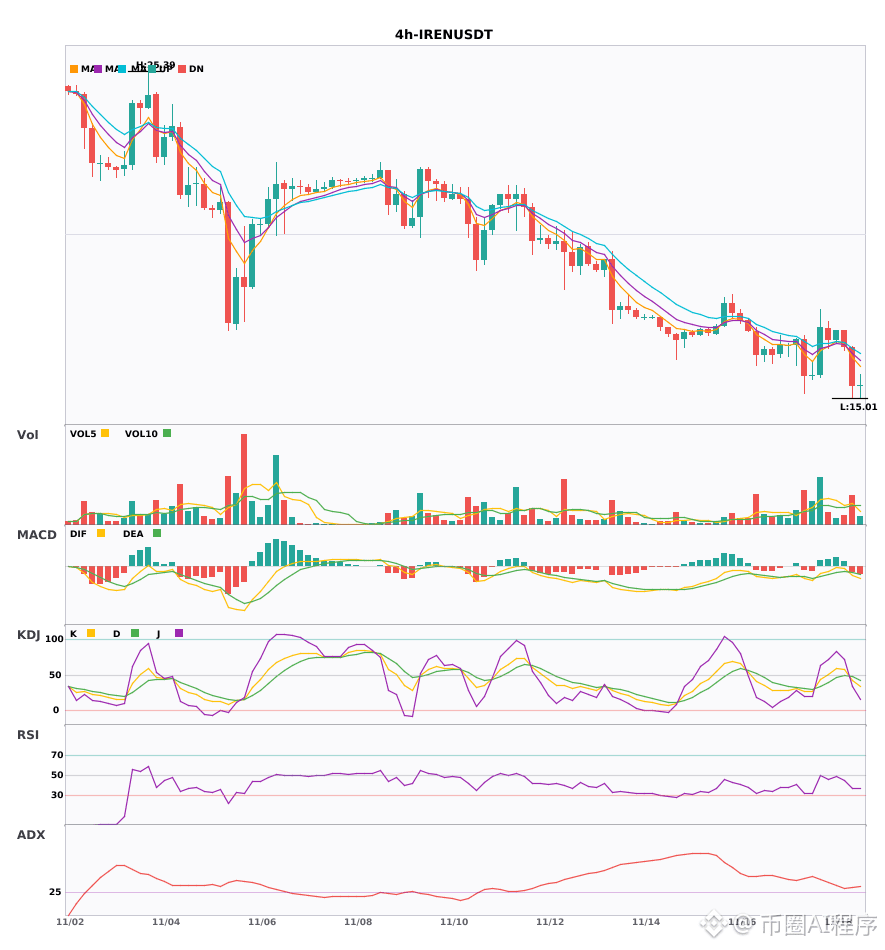
$BTC/$MUU/$IREN 4-hour weakness; daily bearish momentum diverging downward 🔥
════════════════════
🟢 $BTC 4-hour bearish signal
⚠️Technical analysis: The daily and 4-hour bearish trends are confirmed in confluence. After the MACD death cross, the green bars are growing; the moving averages are bearishly aligned and diverging downward. The KDJ death cross has not reached the oversold zone, and volume is up 1.7x—short-term outlook is bearish.
📢Market update: Bitcoin miners have found ways to profit without mining, but the advantage may not last. Luxor’s West Texas model shows mining can remain profitable even when electricity prices exceed mining revenue, while Riot’s quarterly report reveals the profit dynamics of power curtailment compensation.
════════════════════
🟢 $MUU 4-hour bearish signal
⚠️Technical analysis: The daily bearish trend and 4-hour short-selling signals are confirmed in multi-timeframe confluence! EMA5 crossed below EMA8, turning short-term bearish. KDJ K is above D (58.7/55.8), and volume is up 2.1x.
════════════════════
🟢 $IREN 4-hour bearish signal
⚠️Technical analysis: The 4-hour MACD has formed a death cross below zero, with the green bars continuing to grow. The EMAs are bearishly aligned and diverging; the KDJ death cross is not in oversold territory, and volume is up 1.5x. The daily bearish trend is confirmed in confluence—multiple timeframes point in the same bearish direction!
════════════════════
🔔 Follow for first-hand market alerts 🔔
#多周期共振 #BTC #MUU #IREN
📌 When trading, pay attention to whether the candlestick pattern aligns
$BTC /$MUU /$IREN 4-hour weakness; daily bearish momentum diverging downward 🔥
════════════════════
🟢 $BTC 4-hour bearish signal
⚠️Technical analysis: The daily and 4-hour bearish trends are confirmed in confluence. After the MACD death cross, the green bars are growing; the moving averages are bearishly aligned and diverging downward. The KDJ death cross has not reached the oversold zone, and volume is up 1.7x—short-term outlook is bearish.
📢Market update: Bitcoin miners have found ways to profit without mining, but the advantage may not last. Luxor’s West Texas model shows mining can remain profitable even when electricity prices exceed mining revenue, while Riot’s quarterly report reveals the profit dynamics of power curtailment compensation.
════════════════════
🟢 $MUU 4-hour bearish signal
⚠️Technical analysis: The daily bearish trend and 4-hour short-selling signals are confirmed in multi-timeframe confluence! EMA5 crossed below EMA8, turning short-term bearish. KDJ K is above D (58.7/55.8), and volume is up 2.1x.
════════════════════
🟢 $IREN 4-hour bearish signal
⚠️Technical analysis: The 4-hour MACD has formed a death cross below zero, with the green bars continuing to grow. The EMAs are bearishly aligned and diverging; the KDJ death cross is not in oversold territory, and volume is up 1.5x. The daily bearish trend is confirmed in confluence—multiple timeframes point in the same bearish direction!
════════════════════
🔔 Follow for first-hand market alerts 🔔
#多周期共振 #BTC #MUU #IREN
📌 When trading, pay attention to whether the candlestick pattern aligns
════════════════════
🟢 $BTC 4-hour bearish signal
⚠️Technical analysis: The daily and 4-hour bearish trends are confirmed in confluence. After the MACD death cross, the green bars are growing; the moving averages are bearishly aligned and diverging downward. The KDJ death cross has not reached the oversold zone, and volume is up 1.7x—short-term outlook is bearish.
📢Market update: Bitcoin miners have found ways to profit without mining, but the advantage may not last. Luxor’s West Texas model shows mining can remain profitable even when electricity prices exceed mining revenue, while Riot’s quarterly report reveals the profit dynamics of power curtailment compensation.
════════════════════
🟢 $MUU 4-hour bearish signal
⚠️Technical analysis: The daily bearish trend and 4-hour short-selling signals are confirmed in multi-timeframe confluence! EMA5 crossed below EMA8, turning short-term bearish. KDJ K is above D (58.7/55.8), and volume is up 2.1x.
════════════════════
🟢 $IREN 4-hour bearish signal
⚠️Technical analysis: The 4-hour MACD has formed a death cross below zero, with the green bars continuing to grow. The EMAs are bearishly aligned and diverging; the KDJ death cross is not in oversold territory, and volume is up 1.5x. The daily bearish trend is confirmed in confluence—multiple timeframes point in the same bearish direction!
════════════════════
🔔 Follow for first-hand market alerts 🔔
#多周期共振 #BTC #MUU #IREN
📌 When trading, pay attention to whether the candlestick pattern aligns
13
Log in to explore more content
Join global crypto users on Binance Square
⚡️ Get latest and useful information about crypto.
💬 Trusted by the world’s largest crypto exchange.
👍 Discover real insights from verified creators.
Email / Phone number
Trending Topics
1
#BTCReboundsAbove$60KAmidWhaleDipBuying
5 views
1 Discussing
2
#NvidiaLoses$2.7TrillionInMonthAndAHalf
32,719 views
170 Discussing
3
#GlobalStocksFaceLongestLosingStreakSince2023
343,101 views
2,213 Discussing
4
#BlackRockIBITPostsRecord$541MSingleDayOutflow
45,251 views
121 Discussing
5
#AnthropicPlungesTowardIPOPriceonDay2
177,646 views
1,356 Discussing
6
#TwentyOneCapitalAdds172.25BTC
82,479 views
793 Discussing
7
#HKBillWouldExcludeTokenizedDepositsFromVirtualAssets
12,248 views
57 Discussing
8
#BNBDropsBelow540USDTWith8.46%DailyDecline
92,484 views
749 Discussing
9
#HKBillProposesHK$100KFineForUnauthorizedCryptoTitles
3,223 views
29 Discussing
10
#BitMineFaces$10.1BUnrealizedETHLoss
6,455 views
32 Discussing